living standards, poverty and inequality in the uk: 2013 ·...
TRANSCRIPT

Living Standards, Poverty and Inequality in the UK: 2013
Jonathan Cribb Andrew Hood Robert Joyce David Phillips
IFS Report R81

Living Standards, Poverty and Inequalityin the UK: 2013
Jonathan Cribb
Andrew Hood
Robert Joyce
David Phillips
Institute for Fiscal Studies
Copy-edited by Judith Payne
Institute for Fiscal Studies
7 Ridgmount Street
London WC1E 7AE

PublishedbyTheInstituteforFiscalStudies7RidgmountStreetLondonWC1E7AETel:+44(0)20-72914800Fax:+44(0)20-73234780Email:[email protected]:http://www.ifs.org.ukinassociationwithLondonPublishingPartnershiphttp://www.londonpublishingpartnership.co.uk
©TheInstituteforFiscalStudies,June2013ISBN978-1-909463-09-7

Preface
TheJosephRowntreeFoundationhassupportedthisprojectaspartofitsprogrammeofresearchandinnovativedevelopmentprojects,whichithopeswillbeofvaluetopolicymakers,practitionersandserviceusers.Thefactspresentedandviewsexpressedinthisreportare,however,thoseoftheauthorsandnotnecessarilythoseoftheFoundation.Neitheraretheviewsexpressednecessarilythoseoftheotherindividualsorinstitutionsmentionedhere,includingtheInstituteforFiscalStudies,whichhasnocorporateview.Co-fundingfromtheESRC-fundedCentrefortheMicroeconomicAnalysisofPublicPolicyatIFS(grantnumberRES-544-28-0001)isalsoverygratefullyacknowledged.DatafromtheFamilyResourcesSurveyweremadeavailablebytheDepartmentforWorkandPensions,whichbearsnoresponsibilityfortheinterpretationofthedatainthisreport.TheauthorswouldliketothankPaulJohnsonandLukeSibietafortheirhelpfulcomments.Anyerrorsandallviewsexpressedarethoseoftheauthors.

Contents
ExecutiveSummary 11. Introduction 92. LivingStandards 102.1TheUKincomedistribution 112.2TrendsinUKlivingstandards 132.3Whydidlivingstandardsfall? 182.4Inflationandchangesinlivingstandards 232.5Prospectsforlivingstandards 262.6Conclusion 283. Inequality 293.1Incomechangesacrosstheincomedistribution 303.2Summarymeasuresofinequality 353.3Thedistributionofearningsandprivateincomes 403.4Prospectsforincomeinequality 483.5Conclusion 504. IncomePoverty 524.1Relativeincomepoverty 554.2Absoluteincomepoverty 734.3Prospectsforpoverty 764.4Conclusion 795. TheIncomeDistributionovertheLongRun 815.1Changesbyfamilytype 825.2Changesbyage 945.3Conclusion 1076. TheChangingFace(s)ofPoverty 1096.1Changesinrelativepovertybyindividualtypeandage 1106.2Explainingthelong-termfallinpensionerpoverty 1166.3Explainingthelong-termriseinpovertyamongworking-ageadults 1226.3withoutchildren6.4Theriseandfallinchildpoverty 1276.5Conclusion 134AppendixA.TheHouseholdsBelowAverageIncome(HBAI)methodology 136AppendixB.Benefitandtaxcreditincome:comparingHBAIand 140AppendixB.administrativedataAppendixC.ThedecompositionoftheGinicoefficient 142AppendixD.Materialdeprivation 144AppendixE.After-housing-costanalysis,supplementarytoChapter5 145AppendixF.Non-pensionerincomesinfamilieswithandwithoutchildren: 149AppendixF.quantileregressionanalysisReferences 151


1
© Institute for Fiscal Studies
Executive Summary
Howhavehouseholdincomesevolvedsincetheonsetofthefinancialcrisis?Howhasthegapbetweenrichandpoorchanged?Howmanypeopleareinpovertyandwhatgroupsaremostlikelytofacepoverty?Howhavelivingstandardschangedovertimefordifferentpartsofthepopulation?Eachyear,thegovernmentproducesstatisticsaboutthedistributionofincomeintheUK(‘HouseholdsBelowAverageIncomes’orHBAI)whichhelpanswerthesequestionsandmanymore.ThisreportisthetwelfthinanannualseriespublishedbytheInstituteforFiscalStudies(IFS)thatanalysesthesestatisticsanddigsdeepertoexplorethedrivingforcesbehindkeytrendsinlivingstandards,inequalityandpoverty.Ourfirstsuchreportin2002showedapictureofrobustyear-on-yeargrowthinlivingstandardsandfallinglevelsofpoverty,whileinequalitywascreepingup.Thislatestreportcoversdatauptoandincluding2011–12.Thepictureisstrikinglydifferent.Intheaftermathoftherecession,averageincomeshavefallenfortwoconsecutiveyears.Inequalityhasfallenbacktolevelslastseeninthemid-1990s.Andwhilstrelativepovertyheldsteadyinthelatestyearofdata,thiswasonlybecausethepovertylinefellasaverageincomesfell:onaverage,thepoorhavebecomeworseoffinabsoluteterms,justasotherincomegroupshave.Themainmeasureofincomeusedinouranalysisishouseholdnetincome,whichisthen‘equivalised’totakeaccountofdifferencesinhouseholdsizeandcomposition.Wemeasureeachhousehold’stotalincomefromallsources(includingearnings,self-employmentincome,pensions,benefitsandtaxcredits)minuscounciltaxandanydirecttaxespaidonthesesources.Wethenapply‘equivalencescales’toeachhousehold’sincome,accountingforthefactthat(forexample)anetincomeof£200perweekwillmeanahigherstandardoflivingforasingleindividualthanitwillforacouplewithfourchildren,allelseequal.Chapter 2 – Living StandardsAverageincomestendtogrowovertimeastheeconomyexpands.Sinceourconsistentdataseriesbeganmorethan50yearsagoin1961,meanhouseholdnetincomeshavegrownbyabout1.6%peryearininflation-adjustedterms.Analternativemeasureof‘averageincome’ismedianincome,whichistheincomeoftheindividualrightinthemiddleoftheincomedistribution.Medianhouseholdnetincomehasgrownbyanannualaverage1.4%since1961.However,incomegrowthhastendedtofluctuateovertime.Forinstance,therewasstronggrowthinthelate1990s,butweakgrowthbetween2002and2007,evenbeforethefinancialcrisishit.Keyfindingsonlivingstandardsfromthisyear’sreportinclude: AverageincomesintheUKfellin2011–12.Afteraccountingforinflation,officialHBAIstatisticsrecordedafallof2.8%inmedianhouseholdincome,from£440perweekto£427perweek(bothin2011–12prices),andafallof1.6%inmeanhouseholdincome,from£537to£528.Theselatestfallscameontopoflargefallsin
Living standards, poverty and inequality: 2013
2
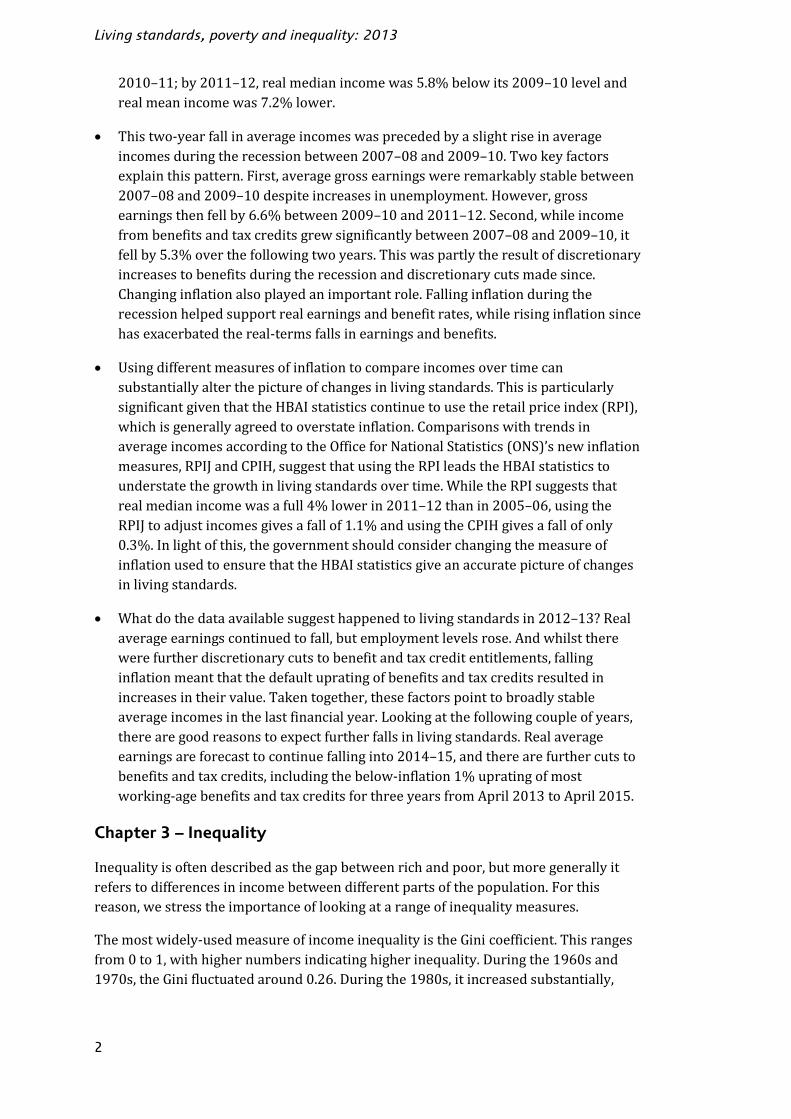
2010–11;by2011–12,realmedianincomewas5.8%belowits2009–10levelandrealmeanincomewas7.2%lower. Thistwo-yearfallinaverageincomeswasprecededbyaslightriseinaverageincomesduringtherecessionbetween2007–08and2009–10.Twokeyfactorsexplainthispattern.First,averagegrossearningswereremarkablystablebetween2007–08and2009–10despiteincreasesinunemployment.However,grossearningsthenfellby6.6%between2009–10and2011–12.Second,whileincomefrombenefitsandtaxcreditsgrewsignificantlybetween2007–08and2009–10,itfellby5.3%overthefollowingtwoyears.Thiswaspartlytheresultofdiscretionaryincreasestobenefitsduringtherecessionanddiscretionarycutsmadesince.Changinginflationalsoplayedanimportantrole.Fallinginflationduringtherecessionhelpedsupportrealearningsandbenefitrates,whilerisinginflationsincehasexacerbatedthereal-termsfallsinearningsandbenefits. Usingdifferentmeasuresofinflationtocompareincomesovertimecansubstantiallyalterthepictureofchangesinlivingstandards.ThisisparticularlysignificantgiventhattheHBAIstatisticscontinuetousetheretailpriceindex(RPI),whichisgenerallyagreedtooverstateinflation.ComparisonswithtrendsinaverageincomesaccordingtotheOfficeforNationalStatistics(ONS)’snewinflationmeasures,RPIJandCPIH,suggestthatusingtheRPIleadstheHBAIstatisticstounderstatethegrowthinlivingstandardsovertime.WhiletheRPIsuggeststhatrealmedianincomewasafull4%lowerin2011–12thanin2005–06,usingtheRPIJtoadjustincomesgivesafallof1.1%andusingtheCPIHgivesafallofonly0.3%.Inlightofthis,thegovernmentshouldconsiderchangingthemeasureofinflationusedtoensurethattheHBAIstatisticsgiveanaccuratepictureofchangesinlivingstandards. Whatdothedataavailablesuggesthappenedtolivingstandardsin2012–13?Realaverageearningscontinuedtofall,butemploymentlevelsrose.Andwhilsttherewerefurtherdiscretionarycutstobenefitandtaxcreditentitlements,fallinginflationmeantthatthedefaultupratingofbenefitsandtaxcreditsresultedinincreasesintheirvalue.Takentogether,thesefactorspointtobroadlystableaverageincomesinthelastfinancialyear.Lookingatthefollowingcoupleofyears,therearegoodreasonstoexpectfurtherfallsinlivingstandards.Realaverageearningsareforecasttocontinuefallinginto2014–15,andtherearefurthercutstobenefitsandtaxcredits,includingthebelow-inflation1%upratingofmostworking-agebenefitsandtaxcreditsforthreeyearsfromApril2013toApril2015.Chapter 3 – InequalityInequalityisoftendescribedasthegapbetweenrichandpoor,butmoregenerallyitreferstodifferencesinincomebetweendifferentpartsofthepopulation.Forthisreason,westresstheimportanceoflookingatarangeofinequalitymeasures.Themostwidely-usedmeasureofincomeinequalityistheGinicoefficient.Thisrangesfrom0to1,withhighernumbersindicatinghigherinequality.Duringthe1960sand1970s,theGinifluctuatedaround0.26.Duringthe1980s,itincreasedsubstantially,

Executive summary
3
reaching0.34by1990.ThiswasthelargestincreaseinincomeinequalityseeninrecentBritishhistoryandwaslargerthantherisethattookplaceinothercountriesatthesametime.AsmeasuredbytheGinicoefficient,inequalityreacheditshighestlevelsinceatleast1961between2007–08and2009–10,beforefallingbacksharplyin2010–11.Keyfindingsoninequalityfromthisyear’sreportinclude: IncomeinequalityintheUKwasbroadlyunchangedbetween2010–11and2011–12.Realincomesfellbysimilaramountsacrosstheincomedistribution–by2.5%atthe10thpercentile,2.8%atthemedianand2.6%atthe90thpercentile. Althoughinequalitywasunchangedin2011–12,itwassubstantiallylowerthanbeforetherecession.TheGinicoefficientstoodat0.34in2011–12,comparedwith0.36in2007–08.Thiswasaresultofincomechangesrightacrossthedistribution,notjustaconsequenceoffallingincomesattheverytopofthedistribution.Whereasincomeatthe10thpercentileroseby1.4%inrealtermsbetween2007–08and2011–12,thecumulativefallinincomeatthe90thpercentilewas5.9%.InequalityasmeasuredbytheGiniwaslowerthanatanypointduringthe2000s,butstillmuchhigherthanitwasbeforethedramaticwideningoftheincomedistributionthatoccurredinthe1980s. Thesefallsinincomeinequalitycamedespiteincreasesinearningsinequality.Realweeklyearningsfellforeveryonebetween2007–08and2011–12,andthepercentagefallswerelargestforthosewithmodestearnings,althoughthosewiththeverylowestweeklyearningsfaredalittlebetter.Householdincomesbeforetaxesandbenefitsthereforebecamemoreunequal,butthiswasoutweighedbytheeffectofthetaxandbenefitsystem,whichledtoreductionsininequalityofnetincomes. Thereweretwokeyreasonsforthefallininequalitybetween2007–08and2011–12.First,becauseearningsmakeupalargerfractionofoverallincomeatthetopoftheincomedistributionthanatthebottom,fallingrealearningshadabiggernegativeimpactonincomesforricherhouseholds,despitetheincreaseinearningsinequality.Second,realincreasesinincomefrombenefitsandtaxcreditssupportedhouseholdincomestowardsthebottomoftheincomedistribution. Lookingforward,areturntorealearningsgrowthandcutstobenefitandtaxcreditentitlementsimplyanupwardtrajectoryforincomeinequality.Thereductionininequalityasaresultoftherecessionislikelytoproveatemporaryratherthanpermanentphenomenon.Intheshortrun,however,year-on-yearmovementsininequalitywillbeaffectedbythefactthatongoingchangestothetaxationofvery-high-incomeindividualsinfluencewhentheychoosetorealisetheirincomes.Thisislikelytocontinueuntilatleast2013–14.Chapter 4 – Income PovertyThemostwidely-quotedmeasureofincomepovertyintheUKandtherestoftheEuropeanUnionistheproportionofindividualswithhouseholdincomeslessthan60%

Living standards, poverty and inequality: 2013
4
ofthecontemporarymedian.Itisameasureof‘relativepoverty’asthepovertylinemovesinlinewiththemedianfromyeartoyear.Ifmedianincomegoesup,thensodoestherelativepovertyline.Essentially,itmeasureswhetherpoorerhouseholdsarekeepingupwiththoseonmiddleincomes.Ofcourse,itisnottheonlymeasureofpovertynorisituniversallyacceptedasthebest.Somepreferameasureofabsolutepoverty,wherethepovertylineisfixedinrealterms,sothatpovertygoesdownwhen(andonlywhen)theabsolutemateriallivingstandardsofpoorerhouseholdsimprove.Whenincomesarefalling,useofarelativepovertymeasurewouldshowfallinglevelsofpovertyifthepoorseesmallerproportionatefallsinincomethanthoseonmiddleincomes,despiteeveryonebecomingworseoff.Ontheotherhand,itisdifficulttoimaginethatasociety’sviewofwhatisaminimumacceptablelivingstandardisindependentoftimeandplace–forexample,ithasprobablychangedsincethe19thcentury.Forthisreason,itissensibletoconsidertrendsinrelativepovertyaswellasinabsolutepoverty.Itisalsoimportanttoconsiderdifferentpovertythresholds,toensurethatfindingsarenotuniquetoonespecificthreshold,andtoconsiderdifferentdefinitionsofincome(forexample,beforeandafterhousingcosts).Relativepovertyhasfolloweddistincttrendsovertime.Thefractionofthepopulationinrelativepovertyincreasedsubstantiallyduringthe1980s,atthesametimeasinequalitymoregenerallywasincreasing.Basedonapovertylineof60%ofmedianincome,itrosefrom13.4%in1979toreach22.2%by1990onthebefore-housing-costsmeasure.Duringthe1990s,itfellslightlyanditstoodat19.6%onthismeasurein1997–98whenthelastgovernmentcametooffice.Fromthenon,relativepovertyfellasthegovernmentsubstantiallyincreasedtheleveloffiscalredistribution.Apartfromabriefrisebetween2004–05and2007–08,therewasanalmostcontinuousfallinrelativepovertyoverthisperiod,andithadfallento16.1%by2010–11.Keyfindingsrelatingtoincomepovertyfromthisyear’sreportinclude: Thenumberofindividualsinrelativepovertywasunchangedin2011–12,at13.0millionor21.1%ofthepopulationonanafter-housing-costs(AHC)basisand9.8millionor15.9%ofthepopulationonabefore-housing-costs(BHC)basis.MeasuringincomesAHC,thisputsrelativepovertyatalevelalittleabovethatin2004–05,butstatisticallysignificantlybelowitslevelin2007–08,justpriortotherecession.MeasuringincomesBHC,relativepovertyremainsatitslowestlevelsince1986. 2011–12followedthreeyearsduringwhichrelativepovertyfellsubstantially.Thismeansrelativepovertyin2011–12was0.4million(1.4percentagepoints)loweronanAHCbasisand1.2million(2.4percentagepoints)loweronaBHCbasisthanin2007–08,thelastyearpriortotherecentrecession. However,thetrendsinpovertysince2007–08havenotbeenthesamefordifferentpartsofthepopulation.Relativepensionerpovertyhasfallentoitslowestlevelsincerecordsbeganin1961,drivenbyrobustgrowthinincomefromstate

Executive summary
5
pensionsandbenefits.Indeed,pensionerpovertyhasfallenbyoveraquartersincebeforetherecession. Relativechildpovertyhasalsofallensubstantially,drivenbyfallingratesofpovertyamongloneparentsandcoupleswithchildrenwhohavenooneinworkoronlypart-timeworkers.Despitedifficultlabourmarketconditions,therehasbeenasmallfallinthenumberofchildrenlivinginworklesshouseholdsandanincreaseinthoselivingwithtwoworkingparents. Povertyamongworking-ageadultswithoutchildrenincreased,drivenlargelybyafallinemploymentamongsingleadultsandanincreaseintherateofpovertyamongone-earnercouples. Incontrasttothepictureforrelativepoverty,fallingrealincomesin2010–11and2011–12meanthatabsolutepovertywas1.5million(1.8percentagepoints)higherin2011–12thanin2007–08onanAHCbasis.Relativepovertyhasfallennotbecausetheincomesofpoorhouseholdshavegrownrelativelyfasterthanmedianincome,butbecausetheirincomeshavefallenrelativelyless.MeasuredBHC,absolutepovertyhasincreasedby0.3million,withfallsinabsolutepovertyamongchildren(0.2million)andpensioners(0.3million)justmorethanoffsetbyrisesamongworking-ageadults(0.8million). Themajorityofpoorworking-ageadultsandchildrenliveinfamiliescontainingatleastoneworker.Povertyishigheramongthoseworkinginsectorsandoccupationsassociatedwithlowhoursofworkandlowhourlypaythanamongthoseworkinginotherpartsoftheeconomy.Thisisparticularlythecasewheretheirearningsarethemainsourceofearningsfortheirhousehold.Analysissuggeststhatitislowhourlywagesratherthanlowhoursofworkthataremoststronglylinkedtobeinginpoverty,althoughunsurprisinglythoseworkingfewhoursforalowwagehavethehighestratesofpoverty. Lookingtothefuture,bothabsoluteandrelativepovertyamongchildrenandworking-ageadultslooksettoincrease,inlargepartduetocutsinbenefitsandtaxcreditsbeingimplementedaspartofthefiscalconsolidation.Thesupposedlybindingtargetof‘eradicating’childpovertyby2020willnotbeachieved. Pensioners,whoareprotectedfrommostofthebenefitcuts,arelikelytocontinuetofareratherbetterthanchildrenandtheworking-agepopulationinthecomingyears.Chapter 5 – The Income Distribution over the Long RunChangesintheeconomy,demographics,familystructure,savingsandemploymentbehaviouroverthelastfewdecadeshavehadimportanteffectsontheincomedistribution.Therearenowmoreelderlypeopleandmoresingleparents.Significantpolicyreformshavealteredthewaythatdifferentgroupsaretreatedbythetaxandbenefitsystem.Pensionersaremuchmorelikelytohavesavedthroughprivateoroccupationalpensionsduringtheirworkinglives,andentitlementstostatepensionshavealsoincreased.Thelabourmarkethaschangedradicallytoo:forexample,

Living standards, poverty and inequality: 2013
6
earningsinequalityincreasedrapidlyduringthe1980s;loneparentsaremuchmorelikelytobeemployedthantheywere20yearsago;andtheemploymentratesofyoungadultshaverecentlybeenfallingrapidly.Overtime,thesekindsofchangeshavedramaticallyalteredthetypesofpeoplewhoarerelativelyrichandrelativelypoor,andthelevelsofinequalitywithindifferentpartsofthepopulation.Keyfindingsinthisyear’sreportthatrelatetolong-runchangesinthedistributionofincomeinclude: Income(measuredbeforehousingcostshavebeendeducted,BHC)isdistributedmuchmoreevenlyacrossthemajorfamilytypesthanindecadespast.Pensionersremainthelowest-incomegroup,andworking-ageadultswithoutdependentchildrenremainthehighest-incomegroup,onaverage.Butthegapshaveclosedverysignificantlysincethelate1970s. Theproportionofpensionerswithincomesinthelowestincomequintilehasfallenfrom47%inthelate1970sto21%in2011–12.Overthesameperiod,theproportionwithincomesinthehighesttwoincomequintileshasrisenfrom18%to31%.Thisstrongimprovementintherelativepositionofpensionershasbeendrivenmostlybyhigherprivatepensionincomesforyoungercohortsofpensioners,andbyhigherbenefitreceiptsduetoincreasesinbenefitratesandincreasesinthenumbersentitledtostatepensions.Meanwhile,therelativepositionofworking-ageadultswithoutdependentchildrenhasworsenedsignificantlysincethelate1970s,atboththetopandbottomofthedistribution. Theexperienceforparentsandchildrenhasbeenmoremixed:alargeincreaseininequalitywithinthegroupmeansthattheyarebothmorelikelytobeinthelowestincomequintileandmorelikelytobeinthehighestincomequintilethaninthelate1970s.Theirriskoffallingintothelowestquintilehas,however,fallensince1996–97. Althoughdifferencesinincomebetweenthemajorfamilytypeshavenarrowedsincethelate1970s,therehavebeenlargerisesininequalitywithinthesefamilytypes.Therearenowmuchlargergapsbetweentherichestandpoorestindividualsinfamilieswithchildren,andbetweentherichestandpoorestworking-ageadultswithoutchildren.Themainfactorbehindthisisanincreaseinearningsinequality.Thepoorestpensionershavealsofallenfurtherbehindmiddle-incomepensioners,althoughinequalitywithinmostofthetophalfofthepensionerincomedistributionhaschangedlittle.Since1996–97,inequalitywithineachofthesefamilytypeshasgenerallystoppedrising,exceptthatapproximatelythehighest-income5%ofeachgrouphavecontinuedto‘raceaway’. Incomeinequalityisnowclearlyloweramongpensionersthanamongotheradultsaged30andabove.Thisisabigtransformation.Inthelate1970s,incomeinequalitywasalmostconstantacrosstheadultagedistribution;andwhenourconsistenttimeseriesbeganintheearly1960s,incomesweremoreunevenlydistributedamongpensionersthanamonganyotheragegroup.

Executive summary
7
Incomenowtendstovarylesswithage.Thisislargelybecauseincomenowdipslessatolderagesthanitusedto.Medianincomegrowthamongpensionershasaveragedaround2%peryearsincethelate1970s.Medianincomegrowthhasbeenrelativelyuniformacrosstherestoftheadultagespectrumoverthesameperiod,atanaverageofjustover1%peryear. Recently,theincomesofyoungadultshavestartedtofallbehindthoseoftherestofthepopulation.Intheimmediatepre-recessionyearsbetween2001–02and2007–08,medianincomeamongadultsintheir20sdidnotgrowatall.Between2007–08and2011–12,medianincomeamongthegroupfellbyanannualaverageofabout3%peryear–morethanforanyothergroup.Thisisnotsurprisinggiventheirfallingemploymentratesduringandsincetherecession,atatimewhenemploymentamongolderagegroupshasbeenremarkablyrobust.Chapter 6 – The Changing Face(s) of PovertyChangesintherelativeincomesofdifferentagegroupsoverthelast50yearshavealsoaffectedthepatternofpovertyacrossthepopulation.Keyfindingsinthisyear’sreportthatrelatetothechangingfaceofpovertyinclude: Therehavebeensignificantchangesinthepatternofpovertyacrossthepopulationduringthelast50orsoyears.Inthe1960sand1970s,povertyratesweremuchhigherforpensionersthanfortherestofthepopulation:aroundsixtoeighttimesashighasforworking-ageadultswithoutchildren,forinstance.However,substantialandsustainedfallsinpensionerpovertysincethelate1980s,andincreasesinpovertyratesamongtherestofthepopulation,meanthatpensionersnowhaveasimilarriskofpovertytotherestofthepopulationonaBHCbasis,andasubstantiallylowerriskonanAHCbasis.Thefaceofpovertyhasbecomesubstantiallyyoungerduringrecentdecades. Thelargefallsinpensionerpovertyhavebeendrivenbyasubstantialincreaseinincomefromstatepensionsandbenefits,aswellasprivatepensions.Thishasledtoabroad-basedimprovementintherelativepositionoflower-incomepensionerscomparedwiththerestofthepopulation.OnereasonwhypensionerpovertyhasfallenparticularlyfaronanAHCbasisisthatlower-incomepensionersincreasinglyowntheirhomesoutright,whichmeanstheirhousingcostshavefallensubstantiallyrelativetotherestofthepopulation. Risingpovertyamongworking-ageadultswithoutchildrenpartlyreflectssubstantialincreasesinthenumberlivinginworklessfamiliesandadeclineintherelativevalueofout-of-workbenefits.Moreimportantly,povertyamongthoselivinginfamiliescontainingatleastoneworkerhasincreased.Duringtheperiod1978–1980to1996–97,thisreflectedanincreaseinhourlyandweeklyearningsinequality.Post1996–97,itreflectsthefactthatearningsgrowthwasgenerallyweakforthisgrouprightacrosstheincomedistribution.

Living standards, poverty and inequality: 2013
8
Theincreaseinin-workpovertymeansthatalmosthalfofallpoorworking-ageadultswithoutchildrenworkorhaveapartnerwhoworks,comparedwithjust30%in1978–1980. Thestoryforchildrenwassimilartothatforworking-ageadultswithoutchildrenbetween1978–1980and1996–97.However,since1996–97,relativechildpovertyhasfallen.Therewassomeincreaseinparentalemploymentrates.Butoverwhelminglythisfallwasdrivenbysubstantialincreasesinthegenerosityofmeans-testedbenefitsforlow-andmiddle-incomefamilieswithchildren. Substantialreductionsinout-of-workpovertymeanthatby2011–12apoorchildwasalmosttwiceaslikelytobefromaworkingfamilyasfromaworklessone(whereasinboth1978–1980and1996–97theyweresubstantiallylesslikelytobefromaworkingfamilythanfromaworklessone).However,theriskofrelativepovertyforchildrenofworklessfamiliesdoesremainsubstantiallyhigher(40%onaBHCbasis)thanforchildrenofworkingones(14%).

9
© Institute for Fiscal Studies
1. Introduction
Inthisreport,weexaminethedistributionofhouseholdincomeintheUK.Weassessthechangestoaverageincomes,incomeinequalityandincomepovertythatoccurredinthelatestyearofdata(2011–12),andputtheseinhistoricalcontextusingcomparabledataspanningthelastfiftyyears.TheanalysisdrawsuponthelatestfiguresfromtheDepartmentforWorkandPensions(DWP)’sHouseholdsBelowAverageIncome(HBAI)series,publishedon13June2013.TheHBAIseriesisderivedfromtheFamilyResourcesSurvey(FRS),asurveyofmorethan20,000householdsintheUKthatasksdetailedquestionsaboutincomefromarangeofsources.FurtherdetailsregardingthemethodologyofHBAIcanbefoundinAppendixA,butafewkeypointsareworthsummarisinghere: Itusesahouseholdmeasureofincome,i.e.thetotalincomeofallindividualslivinginthesamehousehold.Ahouseholdisnotthesameasafamily;forinstance,youngadultslivingtogether(otherthanasacouple)areinthesamehouseholdbutnotthesamefamily,whichwedefinehereasasingleadultorcoupleandtheirdependentchildren. Incomeisrescaled(‘equivalised’)totakeintoaccountthefactthathouseholdsofdifferentsizesandcompositionshavedifferentneeds. Incomeismeasuredafterincometax,employeeandself-employedNationalInsurancecontributionsandcounciltax. Incomeismeasuredbothbeforehousingcostshavebeendeducted(BHC)andaftertheyhavebeendeducted(AHC).OuranalysisofthelatestHBAIdatabeginsinChapter2withalookataveragelivingstandardsin2011–12,andhowtheyhavechangedovertime.Chapter3analysesthetrendsinincomeinequality,withaparticularfocusonearningsandincomesbeforetaxesandbenefits.Chapter4containsanalysisoftrendsinpoverty,lookingatbothabsoluteandrelativemeasuresofpoverty.Chapter5takesalong-runperspectiveonthedistributionofincome,highlightingdramaticchangesinthetypesofpeoplewhoarerelativelyrich,relativelypoorandrelativelyunequal.Finally,Chapter6documentsthechangingfaceofpovertyoverthelastfiftyyears.

10
© Institute for Fiscal Studies
2. Living Standards
Key findings
Average incomes in the UK fell in 2011–12. After accounting for inflation, officialHBAI statistics recorded a fall of 2.8% in median household income, from £440 perweek to £427 per week (both in 2011–12 prices), and a fall of 1.6% in meanhousehold income, from £537 to £528. These latest falls came on top of large fallsin 2010–11; by 2011–12, real median income was 5.8% below its 2009–10 leveland real mean income was 7.2% lower.
This two-year fall in average incomes was preceded by a slight rise in averageincomes during the recession between 2007–08 and 2009–10. Two key factorsexplain this pattern. First, average gross earnings were remarkably stable between2007–08 and 2009–10 despite increases in unemployment. However, grossearnings then fell by 6.6% between 2009–10 and 2011–12. Second, while incomefrom benefits and tax credits grew significantly between 2007–08 and 2009–10, itfell by 5.3% over the following two years. This was partly the result ofdiscretionary increases to benefits during the recession and discretionary cutsmade since. Changing inflation also played an important role. Falling inflationduring the recession helped support real earnings and benefit rates, while risinginflation since has exacerbated the real-terms falls in earnings and benefits.
Using different measures of inflation to compare incomes over time cansubstantially alter the picture of changes in living standards. This is particularlysignificant given that the HBAI statistics continue to use the retail price index(RPI), which is generally agreed to overstate inflation. Comparisons with trends inaverage incomes according to the Office for National Statistics (ONS)’s newinflation measures, RPIJ and CPIH, suggest that using the RPI leads the HBAIstatistics to understate the growth in living standards over time. While the RPIsuggests that real median income was a full 4% lower in 2011–12 than in 2005–06, using the RPIJ to adjust incomes gives a fall of 1.1% and using the CPIH gives afall of only 0.3%. In light of this, the government should consider changing themeasure of inflation used to ensure that the HBAI statistics give an accuratepicture of changes in living standards.
What do the data available suggest happened to living standards in 2012–13? Realaverage earnings continued to fall, but employment levels rose. And whilst therewere further discretionary cuts to benefit and tax credit entitlements, fallinginflation meant that the default uprating of benefits and tax credits resulted inincreases in their value. Taken together, these factors point to broadly stableaverage incomes in the last financial year. Looking at the following couple ofyears, there are good reasons to expect further falls in living standards. Realaverage earnings are forecast to continue falling into 2014–15, and there arefurther cuts to benefits and tax credits, including the below-inflation 1% upratingof most working-age benefits and tax credits for three years from April 2013 toApril 2015.

Living standards
11
Inthischapter,wefocusonaverageincomesasmeasuredinthelatestyearofHouseholdsBelowAverageIncome(HBAI)data1for2011–12andplacetheseinthecontextofchangesinaverageincomesovertime.Beforedescribingthesechanges,itisworthwhilesettingoutsomekeyinformationonhowourfiguresarecalculatedandpresented.Allmonetaryvaluesinthischapterareexpressedinaverage2011–12prices,andsoallthedifferenceswerefertoareafterinflationasmeasuredbyaseriesbasedontheretailpriceindex(RPI)hasbeenaccountedfor.2Section2.4providesadiscussionoftheeffectofusingdifferentmeasuresofinflationonreportedchangesinlivingstandardsinlightoftheproblemswiththeRPIasameasureofinflation.Sinceallincomeshavebeen‘equivalised’toadjustforhouseholdsizeandcomposition(seeAppendixA),allincomeamountsareexpressedastheequivalentincomeforacouplewithoutchildren.Inthischapter,incomeisalwaysmeasurednetoftaxesandbenefitsbutbeforehousingcostshavebeendeducted(BHC)unlessotherwisestated.Throughoutthisreport,somestatisticswillbepresentedonaUKbasis,whilesomewillbepresentedonaGreatBritain(GB)basis(mainlythoselookingatlonger-termtrends).ThisisbecauseNorthernIrelandwasonlyintroducedtotheHBAIseriesin2002–03.Thischapterproceedsasfollows.InSection2.1,wedescribetheUKincomedistributionin2011–12.Section2.2examineschangesinaverageincomes,focusingonthelargefallsin2010–11and2011–12,andputtingtheseinhistoricalandeconomiccontext,whileSection2.3examinesthereasonsforthesetrendsbyanalysingchangesinthedifferentsourcesofincome.InSection2.4,weillustratetheeffectofusingdifferentmeasuresofinflationwhencomparingincomesovertime.Section2.5discussestheprospectsforlivingstandardsandSection2.6concludes.2.1 The UK income distributionFigure2.1presentstheUKincomedistributionin2011–12.Itshowsthenumberofpeoplelivinginhouseholdswithdifferentincomelevels,groupedinto£10weeklyincomebands.Theheightofthebarsrepresentsthenumberofpeopleineachincomeband.Incomehasbeenequivalisedtothelevelforacouplewithoutchildrenandiscalculatednet(afteralltaxeshavebeendeductedandbenefitsandtaxcreditsadded).31 The HBAI data series is based on the Family Resources Survey (FRS) with supplementary informationfrom the Survey of Personal Incomes (SPI). The SPI is an administrative data set of income tax recordscollated by HM Revenue and Customs, which is likely to give a significantly more accurate picture of veryhigh incomes than a household survey such as the FRS. The incomes of the richest individuals in the FRSdata are therefore replaced by the mean value of income among the richest individuals in the SPI.
2 The inflation rate used to deflate before-housing-costs (BHC) incomes is equivalent to the RPI excludingcouncil tax.
3 For a detailed definition of HBAI incomes, see Department for Work and Pensions (2013).

Living standards, poverty and inequality: 2013
12
Figure 2.1. The UK income distribution in 2011–12
Note: Incomes have been measured before housing costs have been deducted. The right-most barrepresents incomes of over £1,500 per week.Source: Authors’ calculations using the Family Resources Survey 2011–12.AccordingtotheHBAIdata,meanequivalisedincomeintheUKin2011–12was£528perweekandmedianincomewas£427perweek.Figure2.1alsodividesthepopulationinto10equally-sizedgroups,calleddecilegroups.Thefirstdecilegroupcontainsthepoorest10%ofthepopulation,theseconddecilegroupcontainsthenextpoorest10%,andsoon.Thealternately-shadedsectionsrepresentthesedifferentdecilegroups.Ascanbeseen,thedistributionishighlyskewed,witharound65%ofindividualslivinginhouseholdswithincomebelowthenationalmean.Furthermore,thefinalbarofthegraphshowsthatjustover1.4millionindividuals(2.3%)haveequivalisedhouseholdincomesabove£1,500perweek.Thefigurealsoshowsthattherearearound400,000individualswhoseequivalisedhouseholdincomeisbetweenzeroand£10aweek(intheHBAIdata,negativeBHCincomesaresettozero).Thesezeroornegativeincomescouldbeduetofactorssuchaslargeself-employmentlossesorbecauseofvariousoutgoings(suchascounciltax,studentloanrepaymentsormaintenancepayments)thataredeductedwhencalculatingnetincome.4Previousresearch5hasshownthathouseholdswiththelowestrecordedincomesonaveragetendtohavehigherlivingstandardsthanisindicatedbytheirhouseholdincome(wherelivingstandardsaremeasuredbyexpenditure,consumptionand/ormaterialdeprivation).4 See Brewer, Phillips and Sibieta (2010) for further details on the types of payments and deductions thatlead to zero or negative incomes.
5 See Attanasio, Battistin and Ichimura (2005) and Brewer, O’Dea, Paull and Sibieta (2009).
0.0
0.5
1.0
1.5
Num
berofindividu
als(m
illion)
Net equivalised household income (£ per week, 2011–12 prices)
Mean £528
Median £427
Living standards
13
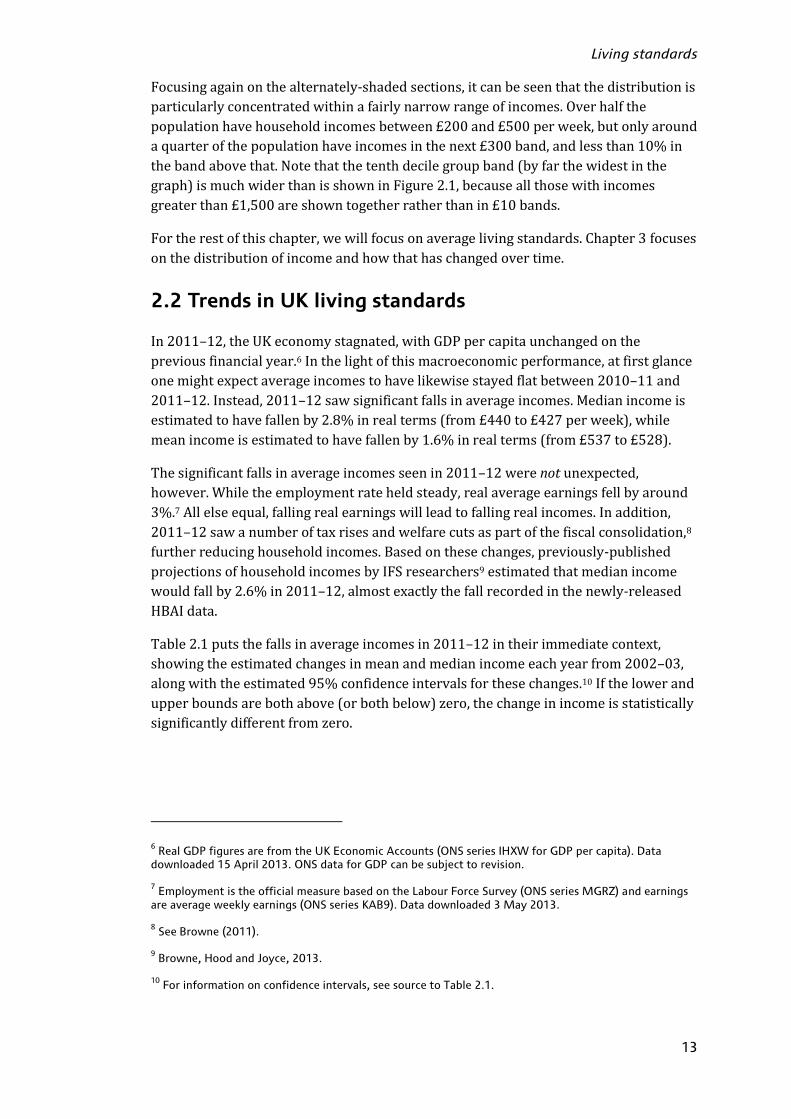
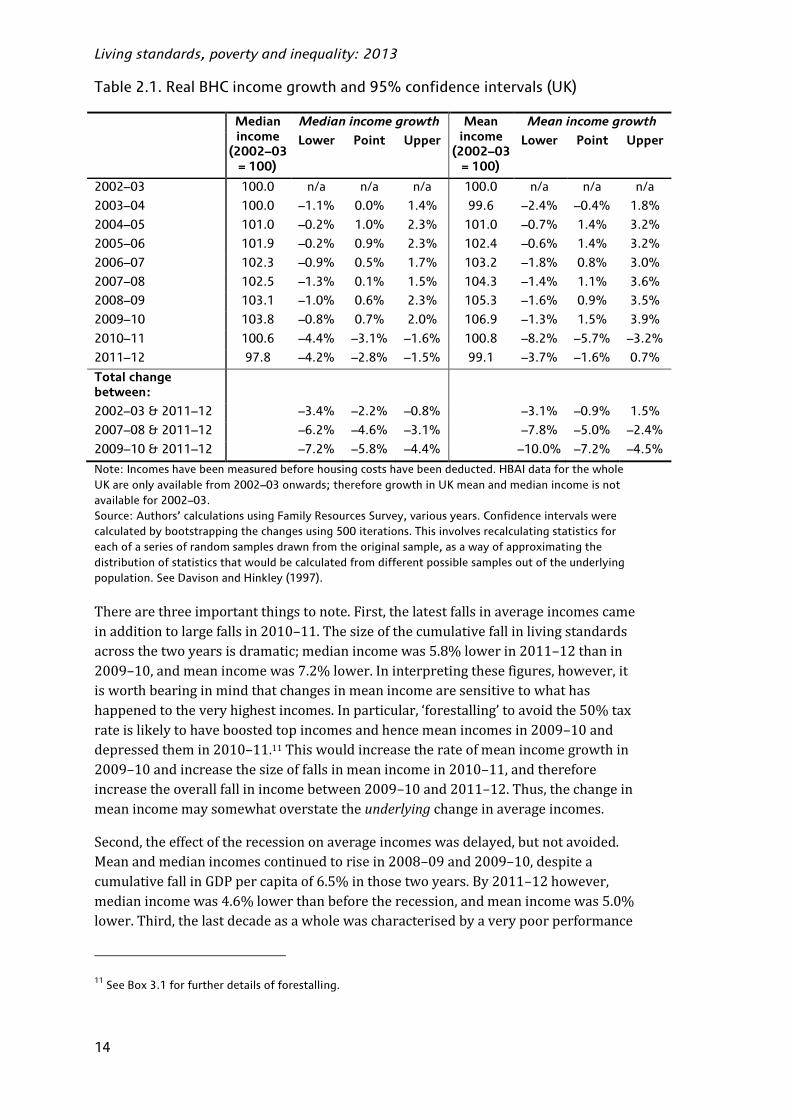
Focusingagainonthealternately-shadedsections,itcanbeseenthatthedistributionisparticularlyconcentratedwithinafairlynarrowrangeofincomes.Overhalfthepopulationhavehouseholdincomesbetween£200and£500perweek,butonlyaroundaquarterofthepopulationhaveincomesinthenext£300band,andlessthan10%inthebandabovethat.Notethatthetenthdecilegroupband(byfarthewidestinthegraph)ismuchwiderthanisshowninFigure2.1,becauseallthosewithincomesgreaterthan£1,500areshowntogetherratherthanin£10bands.Fortherestofthischapter,wewillfocusonaveragelivingstandards.Chapter3focusesonthedistributionofincomeandhowthathaschangedovertime.2.2 Trends in UK living standardsIn2011–12,theUKeconomystagnated,withGDPpercapitaunchangedonthepreviousfinancialyear.6Inthelightofthismacroeconomicperformance,atfirstglanceonemightexpectaverageincomestohavelikewisestayedflatbetween2010–11and2011–12.Instead,2011–12sawsignificantfallsinaverageincomes.Medianincomeisestimatedtohavefallenby2.8%inrealterms(from£440to£427perweek),whilemeanincomeisestimatedtohavefallenby1.6%inrealterms(from£537to£528).Thesignificantfallsinaverageincomesseenin2011–12werenotunexpected,however.Whiletheemploymentrateheldsteady,realaverageearningsfellbyaround3%.7Allelseequal,fallingrealearningswillleadtofallingrealincomes.Inaddition,2011–12sawanumberoftaxrisesandwelfarecutsaspartofthefiscalconsolidation,8furtherreducinghouseholdincomes.Basedonthesechanges,previously-publishedprojectionsofhouseholdincomesbyIFSresearchers9estimatedthatmedianincomewouldfallby2.6%in2011–12,almostexactlythefallrecordedinthenewly-releasedHBAIdata.Table2.1putsthefallsinaverageincomesin2011–12intheirimmediatecontext,showingtheestimatedchangesinmeanandmedianincomeeachyearfrom2002–03,alongwiththeestimated95%confidenceintervalsforthesechanges.10Ifthelowerandupperboundsarebothabove(orbothbelow)zero,thechangeinincomeisstatisticallysignificantlydifferentfromzero.
6 Real GDP figures are from the UK Economic Accounts (ONS series IHXW for GDP per capita). Datadownloaded 15 April 2013. ONS data for GDP can be subject to revision.
7 Employment is the official measure based on the Labour Force Survey (ONS series MGRZ) and earningsare average weekly earnings (ONS series KAB9). Data downloaded 3 May 2013.
8 See Browne (2011).
9 Browne, Hood and Joyce, 2013.
10 For information on confidence intervals, see source to Table 2.1.
Living standards, poverty and inequality: 2013
14
Table 2.1. Real BHC income growth and 95% confidence intervals (UK)
Medianincome
(2002–03= 100)
Median income growth Meanincome
(2002–03= 100)
Mean income growth
Lower Point Upper Lower Point Upper
2002–03 100.0 n/a n/a n/a 100.0 n/a n/a n/a
2003–04 100.0 –1.1% 0.0% 1.4% 99.6 –2.4% –0.4% 1.8%
2004–05 101.0 –0.2% 1.0% 2.3% 101.0 –0.7% 1.4% 3.2%
2005–06 101.9 –0.2% 0.9% 2.3% 102.4 –0.6% 1.4% 3.2%
2006–07 102.3 –0.9% 0.5% 1.7% 103.2 –1.8% 0.8% 3.0%
2007–08 102.5 –1.3% 0.1% 1.5% 104.3 –1.4% 1.1% 3.6%
2008–09 103.1 –1.0% 0.6% 2.3% 105.3 –1.6% 0.9% 3.5%
2009–10 103.8 –0.8% 0.7% 2.0% 106.9 –1.3% 1.5% 3.9%
2010–11 100.6 –4.4% –3.1% –1.6% 100.8 –8.2% –5.7% –3.2%
2011–12 97.8 –4.2% –2.8% –1.5% 99.1 –3.7% –1.6% 0.7%
Total changebetween:
2002–03 & 2011–12 –3.4% –2.2% –0.8% –3.1% –0.9% 1.5%
2007–08 & 2011–12 –6.2% –4.6% –3.1% –7.8% –5.0% –2.4%
2009–10 & 2011–12 –7.2% –5.8% –4.4% –10.0% –7.2% –4.5%
Note: Incomes have been measured before housing costs have been deducted. HBAI data for the wholeUK are only available from 2002–03 onwards; therefore growth in UK mean and median income is notavailable for 2002–03.Source: Authors’ calculations using Family Resources Survey, various years. Confidence intervals werecalculated by bootstrapping the changes using 500 iterations. This involves recalculating statistics foreach of a series of random samples drawn from the original sample, as a way of approximating thedistribution of statistics that would be calculated from different possible samples out of the underlyingpopulation. See Davison and Hinkley (1997).Therearethreeimportantthingstonote.First,thelatestfallsinaverageincomescameinadditiontolargefallsin2010–11.Thesizeofthecumulativefallinlivingstandardsacrossthetwoyearsisdramatic;medianincomewas5.8%lowerin2011–12thanin2009–10,andmeanincomewas7.2%lower.Ininterpretingthesefigures,however,itisworthbearinginmindthatchangesinmeanincomearesensitivetowhathashappenedtotheveryhighestincomes.Inparticular,‘forestalling’toavoidthe50%taxrateislikelytohaveboostedtopincomesandhencemeanincomesin2009–10anddepressedthemin2010–11.11Thiswouldincreasetherateofmeanincomegrowthin2009–10andincreasethesizeoffallsinmeanincomein2010–11,andthereforeincreasetheoverallfallinincomebetween2009–10and2011–12.Thus,thechangeinmeanincomemaysomewhatoverstatetheunderlyingchangeinaverageincomes.Second,theeffectoftherecessiononaverageincomeswasdelayed,butnotavoided.Meanandmedianincomescontinuedtorisein2008–09and2009–10,despiteacumulativefallinGDPpercapitaof6.5%inthosetwoyears.By2011–12however,medianincomewas4.6%lowerthanbeforetherecession,andmeanincomewas5.0%lower.Third,thelastdecadeasawholewascharacterisedbyaverypoorperformance11 See Box 3.1 for further details of forestalling.

Living standards
15
foraverageincomes.Between2002–03and2009–10,nosingleyearsawanincreaseinmedianincomeofmorethan1.0%oranincreaseinmeanincomeofmorethan1.5%.Inneithercasewasanysingleyear-on-yearchangestatisticallysignificant.Thelargefallsbetween2009–10and2011–12reversedalloftheseyearsofsluggishgrowth,leavingaverageincomeslowerin2011–12thanin2002–03(withmedianincomestatisticallysignificantlylower).Togetaclearerpictureoftheimportanceofthefallinlivingstandardssince2009–10,wecancomparethecumulativefallsinaverageincomeswiththoseseeninpreviousperiodsoffallingincomes.Inordertodothis,weusedataonGreatBritaininsteadoftheUKtoallowconsistentcomparisonsoverlongerperiodsoftime(NorthernIrelandwasfirstincludedintheHBAIdatain2002–03).TheeffectonaverageincomesofexcludingNorthernIrelandisminimal,sinceNorthernIrelandissmallrelativetotherestoftheUKandtrendsinincomesinNorthernIrelandareverysimilartothoseinGreatBritain.Figure 2.2. Average household incomes since 1961 (GB)
Note: Incomes have been measured before housing costs have been deducted, and are expressed in 2011–12 prices. All incomes have been equivalised using the modified OECD equivalence scale and areexpressed in terms of equivalent amounts for a childless couple. Years refer to calendar years up to andincluding 1992 and to financial years from 1993–94 onwards.Source: Authors’ calculations using the Family Resources Survey and Family Expenditure Survey, variousyears.Figure2.2plotstheevolutionofaverageincomessince1961,atboththemeanandthemedian.Wecanseethattherehavebeenfourperiodsoffallingincomes:themid-1970s,theearly1980s,theearly1990sandthelasttwoyearsofdata.Table2.2comparesthecumulativefallinincomeineachoftheseperiods,alongsideincomegrowthinthefirstyearofeachrecovery.Wecanseethatthefallsinlivingstandardsthataccompaniedtherecessionoftheearly1990swerenotonthesamescaleasthoseseeninrecentyears.Infact,thecumulativefallinaverageincomesoverthelasttwoyearsofdataisthelargestsincethemid-1970s,whenmeanandmedianincomebothfellforthreeconsecutiveyears.Itisimportanttobearinmindwhenmakingthesecomparisonsthatwearecomparing‘peak-to-trough’changesinpreviousperiodsof
200
250
300
350
400
450
500
550
600
1961
1963
1965
1967
1969
1971
1973
1975
1977
1979
1981
1983
1985
1987
1989
1991
1993
1995
1997
1999
2001
2003
2005
2007
2009
2011
Rea
lhouseh
old
inco
me
(£pe
rwee
k,2011–1
2prices)
Mean household income Median household income

Living standards, poverty and inequality: 2013
16
fallingincomeswiththecumulativefallfrom2009–10sofar;averageincomesmaycontinuetofallinto2012–13andbeyond.Figure2.2alsoshowsthatcumulativefallsinincomeofthemagnitudeseenbetween2009–10and2011–12havepreviouslyonlyoccurredinthecontextofmuchgreatervolatilityinaverageincomes.Thelargefallsinaverageincomesseeninthemid-1970sandearly1980sfollowedevenlargerincreasesintheyearsbeforehand,incontrasttothesluggishgrowthinaverageincomesthroughoutthe2000s.Forinstance,whilethecumulativefallinbothmeanandmedianincomesbetween1973and1977waslargerinpercentagetermsthanoverthelasttwoyearsofdata,incomesin1977werestillhigherthanin1971;fouryearsoffallingincomesfailedtoundoallofthegrowthinjustthetwoyearsprecedingthem.Thereversalofnearlyadecadeofgrowthinaverageincomesisunprecedentedinrecenthistory.Table 2.2. Cumulative change in household income during periods of fallingincome (GB)
Cumulative fall in income Growth in incomein first year of recovery
Mean Median Mean Median
1973 to 1977 –8.6% –7.3% 7.8% 9.5%
1980 to 1982 –3.4% –5.7% 4.2% 3.7%
1990 to 1993–94 0.0% –1.2% 0.7% 0.7%
2009–10 to 2011–12a –7.1% –5.8% n/aa n/aa
a 2011–12 is the latest year of data. Growth in average income has not restarted, so growth in the firstyear of the recovery is unknown. Income may or may not continue to fall in 2012–13.Note: ‘Period of falling income’ defined as two or more consecutive years in which either mean or medianincome fell.Source: Authors’ calculations using the Family Expenditure Survey and Family Resources Survey, variousyears.Thedifferenteconomiccontextinwhichpreviousfallsofasimilarmagnitudeoccurredisalsomadeapparentbytheincomegrowthinthefirstyearofpreviousrecoveries.In1978,medianincomegrewby9.5%,morethanreversingthecumulativefallacrossthepreviousfouryears.In1983,medianincomegrewby3.7%,reversingmostofthefallinthepreviousthreeyears.Asimilarlyrapidrecoveryfromthecurrentfallsinaverageincomes,ontheotherhand,seemshighlyunlikely.Instead,therecoveryinlivingstandards,whenitcomes,lookssettobeveryweak.(Section2.5examinestheprospectsforlivingstandardsinmoredetail.)Inadditiontoplacingrecentexperienceinahistoricalperspective,itisinformativetocomparethefiguresforaveragehouseholdincomesfromHBAIwithothermeasuresofrealincomes,togainafullerpictureoftrendsinlivingstandards.Table2.3comparessixmeasuresofgrowthinaveragelivingstandards.TwoarederivedfromtheNationalAccounts:realgrossdomesticproduct(GDP)percapitaandrealhouseholddisposableincomepercapita(RHDI).TheremainingfouraremeanandmedianincomefromtheHBAIdata,bothbeforeandafterhousingcosts.RealGDPperheadisawidely-usedmeasureofeconomicwell-being,showingtheestimatedmarket

Living standards
17
valueofallfinalgoodsandservicesproducedintheUKeconomy,dividedbythetotalnumberofpeopleintheUK.Realhouseholddisposableincomefocusesonthehouseholdsector,12andsoexcludestheincomesofcompaniesandthegovernment.RHDIdoesnotdeductrentalpayments,butitismeasuredaftermortgagecosts,makingitneitherapurelyBHCnorapurelyAHCmeasureofincome.Sincetheonsetofthefinancialcrisis,allthemeasuresofhouseholdincomeshavedisplayedabroadlysimilarpattern.AlthoughGDPpercapitafellsubstantiallybetween2007–08and2009–10,theothermeasuresallshowhouseholdincomescontinuingtorise,oronlyfallingveryslightly,overthatperiod,beforefallingin2010–11and2011–12.However,thecumulativefallinrealhouseholddisposableincomeissignificantlysmallerthaninalltheHBAImeasures.MorethanhalfofthisdifferenceisaccountedforbythefactthatthemeasureofinflationusedtocompareRHDIacrossyearswaslowerthantheinflationmeasuresusedfortheHBAIseriesinthoseyears,leadingtosmalleryear-on-yearfallsinrealterms.13Theremaininggapislikelytobeexplained,inpart,bythefactthatself-employmentincomeisalaggedmeasureinHBAI,butnotinRHDI;14anyrecoveryinself-employmentincomein2011–12wouldhavebeencapturedinRHDI,butnotinHBAIincomes.Asameanmeasure,RHDIisaffectedbychangesinincomesattheverytopofthedistributionandsoyear-on-yearchangesaresubjecttohighlevelsofvolatility,particularlybecauseoftheimpactofthe50%taxrateonthetimingofincomes.15Table 2.3. Annualised changes in living standards according to NationalAccounts and HBAI measures
Grossdomesticproductper head(UK)
Realhouseholddisposableincome per
head(UK)
MeanHBAIincome
(GB, BHC)
MedianHBAIincome
(GB, BHC)
MeanHBAIincome
(GB, AHC)
MedianHBAIincome
(GB, AHC)
1970s 2.4% 2.8% 1.4% 1.4% 1.3% 1.2%
1980s 2.5% 2.5% 2.8% 2.2% 2.7% 2.2%
1990s 2.3% 3.2% 1.6% 1.1% 1.8% 1.3%
2000s 1.4% 1.7% 1.7% 1.4% 1.4% 1.3%
2007–08 to 2009–10 –3.3% 0.7% 1.2% 0.6% 0.2% –0.4%
2009–10 to 2010–11 1.1% –1.4% –5.7% –3.1% –6.4% –3.8%
2010–11 to 2011–12 0.0% –1.0% –1.5% –2.8% –2.2% –3.4%
Note: The annualised growth in each decade is calculated by comparing the last year in the given decadewith the last year of the previous decade.Source: Authors’ calculations using ONS series IHXW and IHXZ, and HBAI data.
12 Though the household sector used for this measure also includes charities and universities.
13 See Section 2.4 for a detailed discussion of the effect of using different measures of inflation to adjustincomes.
14 This is one of a number of differences between the definitions of the two measures.
15 This issue is discussed in detail in Box 3.1.

Living standards, poverty and inequality: 2013
18
Takingalonger-runperspective,itisnoticeablethatthe1980ssawthefastestgrowthinlivingstandardsaccordingtomostofthemeasuresinTable2.3.Meanincomegrewsignificantlyfasterthanmedianincomeacrossthedecade(bothbeforeandafterhousingcosts),hintingthatincomegrowthinthe1980swasparticularlystrongamongthoseonhigherincomes(whoareweightedmoreheavilyinthecalculationofmeanincomebutareirrelevantforthecalculationofmedianincome)–apointthatweshallconfirminChapter3.Incontrast,the2000ssawgrowthinlivingstandardsoflessthan2%ayearaccordingtoallthemeasures.Ifanything,RHDIsuggestsagreaterslowinginthegrowthoflivingstandardsinthepastdecadethanwehavedocumentedusingHBAIaverageincomes.Allthemeasuresofhouseholdincomesshowthesamebroadpattern–slowgrowththroughoutthe2000s,evenbeforethesignificantfallsinincomein2010–11and2011–12.2.3 Why did living standards fall?Itisimportanttoidentifythekeyreasonswhyaverageincomesfellbetween2009–10and2011–12,havingcontinuedtoriseduringtherecessionitself.Ahelpfulwaytodothisistoconsiderchangesinthevariouscomponentsofincomeandtoidentifytheircontributiontotheoverallchange.Tothisend,Table2.4showsthechangeinthemeanamountofeachcomponentofincomeandhowthiscontributestothechangeinoverallmeanincomesincetherecessionbegan.16Welookateachofthesourcesofprivateincome(suchasgrossearnings),aswellastaxesandbenefits.Sincetheprivateincomecomponentsplusbenefitsminustaxeswillsumtonetincome,thetotaloftheincomecomponentsbeforetaxesaredeductedwillbegreaterthan100%.ThefirstrowofTable2.4showsthefractionoftotalnetincomeattributabletoeachindividualcomponent.Grossearningscontributeanamountequalto87%ofmeannetincome,whilstbenefitsandtaxcreditscontribute20%ofmeannetincome.Offsettingthisaretaxesandotherpayments(suchasstudentloanrepayments),whichtogetherreducehouseholdincomesbyanamountequivalentto34%ofmeanincome.Lookingacrossallthedifferentsourcesofincome,itisinstructivetocontrastchangesoverthetwoyearsoffallingincomes(2009–10to2011–12)withthoseduringthetwoyearsofrecession(2007–08to2009–10),whenincomesactuallygrew.Twocleardifferencesareapparent.First,grossearningswereverysimilarin2007–08and2009–10,butthenfellsignificantlybetween2009–10and2011–12.Thisdelayedfallwasthekeyreasonfordeclininglivingstandardsacrossthosetwoyears.Infact,the6.6%fallingrossearningsalonewouldhaveledaverageincomestofallby5.7%(comparedwiththe7.5%fallobserved).Note,however,thatthetaxsystemautomaticallycounteractstheeffectof16 It is worth noting that this breakdown excludes those households that report negative incomes. This isbecause, under HBAI methodology, such households have their total net income set to zero, and hencetheir components of income do not sum to their assigned total income. The exclusion of these householdsexplains the small difference in the latest year between the fall in mean net income as calculated bysumming the components (1.7%) and the fall in mean net income for the entire distribution (1.6%).
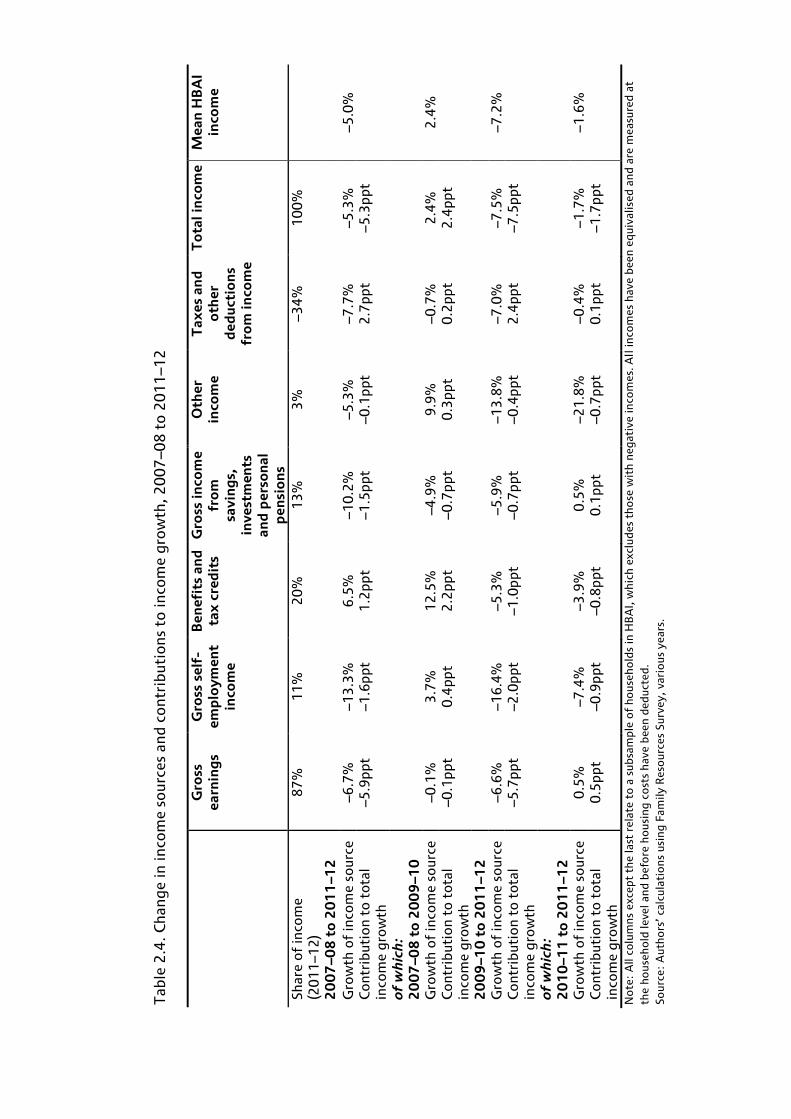
Table2.4.C
hang
ein
incomesourcesan
dcontribu
tion
sto
incomegrowth,2
007
–08to
201
1–1
2
Note:Allcolumns
except
thelast
relate
toasubsam
pleofho
useh
oldsin
HBAI,which
exclud
esthose
withne
gative
inco
mes.A
llinco
mes
have
been
equivalised
andaremea
suredat
theho
useh
old
levela
ndbe
fore
housingco
stsha
vebe
ende
ducted
.So
urce:Autho
rs’calculations
usingFamily
ResourcesSu
rvey,various
years.
Gross
earnings
Gross
self-
employm
ent
inco
me
Ben
efitsan
dtaxcred
its
Gross
inco
me
from
saving
s,investmen
tsan
dpersona
lpen
sions
Other
inco
me
Tax
esan
dother
ded
uctions
from
inco
me
Totalinco
me
Mea
nHBAI
inco
me
Shareof
income
(201
1–12)
87%
11%
20%
13%
3%–3
4%10
0%
2007–0
8to
2011–1
2Growth
ofinco
mesource
–6.7%
–13.3%
6.5%
–10.2%
–5.3%
–7.7%
–5.3%
–5.0%
Con
tributionto
total
inco
megrow
th–5
.9pp
t–1
.6pp
t1.2p
pt–1
.5pp
t–0
.1pp
t2.7p
pt–5
.3pp
t
ofwhich:
2007–0
8to
2009–1
0Growth
ofinco
mesource
–0.1%
3.7%
12.5%
–4.9%
9.9%
–0.7%
2.4%
2.4%
Con
tributionto
total
inco
megrow
th–0
.1pp
t0.4p
pt2.2p
pt–0
.7pp
t0.3p
pt0.2p
pt2.4p
pt
2009–1
0to
2011–1
2Growth
ofinco
mesource
–6.6%
–16.4%
–5.3%
–5.9%
–13.8%
–7.0%
–7.5%
–7.2%
Con
tributionto
total
inco
megrow
th–5
.7pp
t–2
.0pp
t–1
.0pp
t–0
.7pp
t–0
.4pp
t2.4p
pt–7
.5pp
t
ofwhich:
2010–1
1to
2011–1
2Growth
ofinco
mesource
0.5%
–7.4%
–3.9%
0.5%
–21.8%
–0.4%
–1.7%
–1.6%
Con
tributionto
total
inco
megrow
th0.5pp
t–0
.9pp
t–0
.8pp
t0.1p
pt–0
.7pp
t0.1p
pt–1
.7pp
t

Living standards, poverty and inequality: 2013
20
fallinggrossearningsonincomes.Thefallsingrossearningsin2010–11and2011–12willhavereducedhouseholdtaxbills,explainingmuchofthe7%fallintheincomelostthroughtaxesandotherdeductionsinthosetwoyears.This7%fallitselfactedtoincreasehouseholdincomesby2.4%,mitigatingtheeffectoffallinggrossearnings.Ofcourse,changesinaveragegrossearningsmayreflectbothchangesintheearningsofthoseinworkandchangesinthelevelofemployment.Infact,thefractionofindividualsinworklesshouseholdswas0.7%lowerin2011–12thanin2009–10,sothelargefallsinearnedincomeweredrivenbyfallingrealearningsamongthoseemployed.Ontheotherhand,averageearningsheldupreasonablywellduringtherecessionitself,despitefallsinemployment,becausetherealearningsofthoseinworkincreasedonaverage.17Second,theeffectofthebenefitsystemonaverageincomeswasverydifferentduringtherecessionandinitsaftermath.AsdescribedinJinetal.(2011),growthinincomefrombenefitsandtaxcreditswasakeyreasonfortheincreasesinaverageincomesin2008–09and2009–10,atatimewhenemploymentwasfalling.Between2007–08and2009–10,incomefrombenefitsandtaxcreditsgrewby12.5%,contributing2.2percentagepointsofthe2.4%increaseinmeanincomeacrossthatperiod.Incontrast,thecumulativefallinincomefrombenefitsandtaxcreditsbetween2009–10and2011–12was5.3%,contributing1percentagepointofthefallinmeanincomeacrossthatperiod.Itisstrikingthat,despitethisfall,benefitincomeremained6.5%higherin2011–12thanitwasin2007–08.18Lookingatthemostrecentyearofdata,weseethatgrossearningsactuallyroseby0.5%inrealtermsin2011–12.Toasignificantextent,thiswasdrivenbyanunwindingof‘forestalling’amongtheveryhighestpaidinresponsetothe50pincometaxrate.19Thatexplainswhytheincreaseinthemeanwasaccompaniedbyafallinmediangrosshouseholdearningsof2.6%,20almostexactlythesameasthefallinoverallmedianincome.Theyear2011–12alsosawfallsinmeangrossself-employmentincome(7.4%)andmeanincomefrombenefitsandtaxcredits(3.9%).21Itisimportantnottoreadtoomuchintoasingleyear’sdata,especiallyforself-employmentincome:itmakesupa17 Note that changes in mean earnings are sensitive to changes in earned income among the very wellpaid. Forestalling to avoid the 50% tax rate will have boosted top incomes in 2009–10 and depressedthem in 2010–11. (See Box 3.1 for further details of forestalling.) As we shall see, the patterns for mediangross employment income differ somewhat. In Section 3.3, we look in detail at how earnings havechanged across the distribution since the recession began, and analyse the effect these changes have hadon household incomes.
18 For working-age households, benefit income was 8.7% higher in 2011–12 than in 2007–08, comparedwith a 4.4% increase for households with at least one pensioner. This reflects increased entitlement tobenefits and tax credits among the working-age population, as a result of higher unemployment etc.
19 See Box 3.1 for further details of forestalling.
20 This is the change in real median household earnings (including households with no earnings). Realmedian household earnings among those with earnings have fallen by 4.9%.
21 Note that the fall in benefit income according to the HBAI data was substantially larger than the fallrecorded in administrative data (see Appendix B).

Living standards
21
smallfractionofoverallincomeandchangesareoftenvolatilefromyeartoyear.22However,thisyear’sfallcomesontopofasimilarlylargefallin2010–11,withacumulativefallof16.4%since2009–10.Onepossibleexplanationforthispatternisthatreportedgrossself-employmentincomeisonlymeasuredwithalag:the2011–12dataarebasedonself-employmentearningsin2010–11or,insomecases,2009–10.Themostrecentdatamaywellthereforestillbecapturingtheeffectoftherecession.The3.9%fallinincomefrombenefitsandtaxcreditsin2011–12contributedhalf(0.8percentagepointsof1.7%)ofthefallinmeanincome,andcontinuedanimportanttrend;havingrisenverysubstantiallyduringtherecession,incomesfromthissourcefellinboth2010–11and2011–12.Below,weinvestigateindetailthepossibleexplanationsforthesechangesinbenefitandtaxcreditreceipt.Income from benefits and tax creditsAsignificantfactorinthelargeincreasesinbenefitincomeseenduringtherecessionislikelytohavebeenashrinkingeconomy.Asemploymentfalls,morepeoplebecomeeligibleformeans-testedbenefits,leadingtoanincreaseinoverallbenefitandtaxcreditreceipt.Onemightthereforeseektoexplainthefallinbenefitincomeoverthelasttwoyearsasthereversalofthiseffect–astheeconomyrecovers,wewouldexpecttheobservedfallsinbenefitincome.Theproblemwiththatexplanationisthatalthoughthelabourmarkethasperformedmuchbetterthanexpected(andthaninpreviousrecessions),theemploymentratewasstillfallinginthefirsthalfof2011–12,beforerecoveringslightlyinthesecondhalf.Asaresult,theaverageemploymentratewaslowerin2011–12thanin2008–09,2009–10or2010–11.23Giventhispatterninemployment,itishardtoseehowtheweakeconomicrecoverycanexplainthefallinbenefitincomein2011–12.Inpreviousyears,animportantfactorinchangestobenefitincomehasbeentheeffectofdefaultupratingontherealchangestobenefitandtaxcreditrates.Intheabsenceofdiscretionarychangestobenefits,mostbenefitandtaxcreditratesareincreasedinAprilofeachyearinlinewithalaggedmeasureofinflation(therateofannualinflationtothepreviousSeptember).Therefore,differencesbetweentheinflationfigureusedforupratingandannualinflationinthefollowingfinancialyearcanhaveanimportanteffectontherealchangestobenefitandtaxcreditratesfromoneyeartothenext.Comparingyear-on-yearinflationrateswithinflationratestothepreviousSeptemberallowsustoseewhetherthedefaultupratingofbenefitsincreasedordecreasedtheirrealvalueinanygivenyear.Table2.5presentsyear-on-yearRPIinflationalongsideRPI,CPIandRossiinflationtothepreviousSeptember.Before2011–12,thedefaultwasformeans-testedbenefitstobeupratedinlinewiththeRossiindex,withnon-means-testedbenefitsupratedinlinewiththeRPI.From2011–12onwards,thedefaultisforallbenefits(withtheexception22 In addition, self-employment losses are a common source of negative household income (householdswith negative income are excluded from this analysis).
23 Employment is the official measure based on the Labour Force Survey (ONS series MGRZ). Datadownloaded 3 May 2013.

Living standards, poverty and inequality: 2013
22
ofthestatepensionandpensioncredit)tobeupratedinlinewiththeconsumerpriceindex(CPI).Thetableillustratesthreekeythings.First,thedifferencebetweenlaggedRPIandRossiinflationandyear-on-yearRPIinflationisanimportantexplanationforwhybenefitincomegrewsoquicklyduringtherecession,andthenfellin2010–11.Thefallingrateofinflationin2009–10meantdefaultupratinginthatyearledtolargereal-termsincreasesinbenefits.Thereverseoccurredin2010–11,asrisinginflationledtorealfallsinbenefitandtaxcreditrates.Ingeneral,theseyear-on-yearchangeswillevenoutovertime;theaverageratesofannualRPIandRPItothepreviousSeptembershowninthetablearesimilar.Second,thedefaultupratingofbenefitsin2011–12ledtoa1.7%real-termsfallinbenefitandtaxcreditratesin2011–12,justunderhalftheoverallfallinbenefitincomerecorded.Itisimportanttonotethatthisreal-termsfallwasalmostentirelyaresultofthegovernment’sdecisiontomovetoupratingbenefitsandtaxcreditsinlinewithCPIinflation.IfthegovernmenthadupratedbenefitsinlinewithRPIinflationtothepreviousSeptember,benefitandtaxcreditrateswouldonlyhavefallenby0.2%inrealtermsin2011–12.Third,thegovernment’sdecisiontomovetousingtheCPItoupratebenefitandtaxcreditsislikelytomeanthatdefaultupratingwillhaveasystematiceffectonbenefitincomeasmeasuredinHBAI.Asoutlinedatthebeginningofthischapter,theHBAIseriesusesameasureofinflationbasedontheRPItoaccountforpricechangeswhencomparingincomesacrossyears.AsTable2.5shows,inflationisalmostalwaysloweraccordingtotheCPIthanaccordingtotheRPI.Asaresult,upratingbenefitsandtaxcreditsinlinewiththeCPIislikelytoresultintheirrealvaluefallingyearafteryearaccordingtoHBAI.Table 2.5. Annual RPI inflation compared with RPI, CPI and Rossia inflation tothe previous September
Annual RPI RPI to previousSeptember
CPI to previousSeptember
Rossi to previousSeptember
2002–03 2.1% 1.7% 1.3% 1.7%
2003–04 2.8% 1.7% 1.0% 1.3%
2004–05 3.1% 2.8% 1.4% 1.8%
2005–06 2.6% 3.1% 1.1% 1.0%
2006–07 3.7% 2.7% 2.5% 2.2%
2007–08 4.1% 3.6% 2.4% 3.0%
2008–09 3.0% 3.9% 1.8% 2.3%
2009–10 0.5% 5.0% 5.2% 6.3%
2010–11 5.0% –1.4%b 1.1% 1.8%
2011–12 4.8% 4.6% 3.1% 4.8%
Average 3.2% 2.8% 2.1% 2.6%a The Rossi index is calculated as the RPI excluding some housing costs.b Those benefits usually uprated using the RPI were increased by 1.5% in nominal terms.Source: Authors’ calculations using ONS series CHAW, D7BT and GUMF.
Living standards
23
Ofcourse,Table2.5onlyprovidesapartialexplanationofchangestobenefitandtaxcreditlevelsovertime.Discretionarychangestobenefitandtaxcreditentitlementsalsohaveanimportanteffectonchangestobenefitincome.2011–12sawanumberofdiscretionarychangestotaxcredits,housingbenefitandpensioncredit.Combinedwiththechangeinindexation,thetotalnettakeawayin2011–12was£2billion(anaverageof£80fromeachhousehold)–£4billionofcutswerepartiallyoffsetby£2billionofgiveaways.24Thesecutsinentitlementwillhavecontributedtothefallinbenefitincome,andfurthercutscominginoverthenextfewyearsarelikelytoleadtofurtherreductionsinincomefromthissource.2.4 Inflation and changes in living standardsWhencomparinglivingstandardsacrosstime,weneedtotakeaccountofpricechangesinordertocapturerealchangestolivingstandards.Forthisreason,weadjustincomesinyearspriorto2011–12soastoexpresspastincomesintoday’sprices.Thepictureofchangesinreallivingstandardsovertimethereforedependsonwhatmeasureofinflationoneusestoadjustpastincomes.Ahighermeasureofinflationwillimplylowergrowthinlivingstandards,aspastincomesareincreasedbyagreaterproportionwhenexpressedintoday’sprices.Atpresent,officialHBAIincomes(measuredbeforehousingcosts25)areadjustedusingaseriesbasedontheretailpriceindex–namely,RPIexcludingcounciltax.Whiledifferentindicesarelikelytoreflecttheinflationexperiencesofdifferentdemographicgroupswithvaryingaccuracy,26theOfficeforNationalStatistics(2013)acknowledgesthat,duetotheformulaused,theRPItendstooverstateinflation.ThereisthereforeaconcernthattheofficialHBAIincomestatisticsunderstatethegrowthinlivingstandardsovertime,becausetheyuseameasureofinflationthatoverstatestheincreaseinpricesovertime,andsooverstatepastincomesinrealterms.Therestofthissectionexaminestheeffectthatusingdifferentmeasuresofinflationtodeflatepastincomeshasontheimpressiononegetsofchangesinlivingstandardsovertime.AlthoughtheconsumerpriceindexistheothermainmeasureofconsumerpriceinflationintheUK,itexcludesthemortgageinterestpaymentsmadebyowner-occupiers,whichareasubstantialpartoftheiroverallcostofliving.Forthisreason,theCPIisnotagoodmeasureofinflationtousewhenadjustingpastincomesforpricechangesovertime.Weinsteadfocusontwonewmeasuresofinflation–theRPIJ(describedinBox2.1)andtheCPIH,whichisavariantoftheCPIthatincludesowner-occupiedhousingcosts.
24 HM Government, 2011b.
25 Incomes measured after housing costs are deflated using the Rossi index, which is RPI excludinghousing costs.
26 See Levell and Oldfield (2011).

Living standards, poverty and inequality: 2013
24
Box 2.1. The problems with the retail price index
The UK has two main measures of consumer price inflation – the retail price index(RPI) and the consumer price index (CPI). Historically, inflation as reported by the RPIhas been somewhat higher than inflation indicated by the CPI. One reason for this isthat the RPI and CPI use different mathematical formulae to work out how averageprices are changing; even if they were fed the same individual prices, they wouldreport different inflation rates. The size of this ‘formula effect’ nearly doubled (fromroughly 0.5% to 1%) in 2010, after a seemingly minor change in the way clothingprices are sampled.a This prompted the Office for National Statistics (ONS) to consulton whether to change the formulae used in the RPI to match those used in the CPI.b
The consultation concluded that, for reasons of historical continuity, the formulaeused in the RPI should remain unchanged. However, since March 2013, the ONS hasalso reported a new inflation index, the RPIJ. This is identical to the RPI except that ituses (nearly) the same mathematical formulae as the CPI. The RPIJ can therefore beroughly thought of as the RPI minus the ‘formula effect’.
Looking forward, the difference between the RPI and the CPI is expected to increasefurther.c In its latest forecasts, the Office for Budget Responsibility (OBR) predicts thatRPI inflation will remain stable at 4% in the long run, compared with its forecast of2% for the CPI.d Of this difference, at least 1 percentage point can be attributed to the‘formula effect’.
a Levell, 2012a.b For further details on the formulae used in the RPI and the CPI, see Diewert (2012) and Levell (2012b).c See Miller (2011).d Office for Budget Responsibility, 2013.Figure2.3showsthegrowthofmedianincomesfrom1997–98to2011–12whenpastincomesaredeflatedbytheRPI(minuscounciltax)andtheRPIJ.Unfortunately,theRPIJisonlyavailablebackto1997andsoalonger-runcomparisonisnotpossible.Itisapparentthattheformulaeffectisincreasingovertime,withverylittledifferenceinmedianincomegrowthbetween1997–98and2003–04accordingtothetwoinflationindices.Wecanalsoseethatthepatternofrecentchangesinmedianincomeisthesameaccordingtobothinflationmeasures:incomescontinuedtoriseduringtherecessionbeforefallingin2010–11and2011–12.However,theformulaeffectintheRPIhashadasignificanteffectontheimpressionofficialstatisticshavegivenofchangesinlivingstandardsacrosstheperiod.Whileofficialstatisticswouldsuggestthatmedianincomesin2011–12were13%higherthanin1997–98inrealterms,usingtheRPIJsuggestsrealmedianincomeisinfact18%higher.Figure2.4showsthegrowthinmedianincomessince2005–06accordingtotheRPIminuscounciltax,theRPIJandtheCPIH(theCPIHisonlyavailablebackto2005).Medianincomewaslowerin2011–12thanin2005–06accordingtoallthreeinflationmeasures,butbysignificantlydifferentamounts.WhiletheRPIsuggeststhatrealmedianincomewasafull4%lower,usingtheRPIJtodeflategivesafallof1.1%andusingtheCPIHgivesafallofonly0.3%.

Living standards
25
Figure 2.3. Median incomes according to the RPIa and the RPIJ (GB)
a Excluding council tax.Note: HBAI incomes have been measured before housing costs have been deducted.Source: Authors’ calculations using the Family Resources Survey, various years.
Figure 2.4. Median incomes according to the RPI,a the RPIJ and the CPIH (UK)
a Excluding council tax.Note: HBAI incomes have been measured before housing costs have been deducted.Source: Authors’ calculations using the Family Resources Survey, various years.ButthewatersaremuddiedfurtherbythequitedifferentpatternofchangesovertimesuggestedbyRPIJandCPIH.Incomesappeartohavebeengrowingmuchfasterupto2007–08usingtheCPIHmeasurethanusingRPIJ(inotherwords,CPIHitselfwasgrowingmoreslowly).Thatsituationreversesafter2007–08:realincomesstartfalling
100
105
110
115
120
125
Rea
lmed
ianho
useh
old
inco
me
(1997–9
8=100)
RPI RPIJ
94
96
98
100
102
104
106
2005–06 2006–07 2007–08 2008–09 2009–10 2010–11 2011–12
Rea
lmed
ianho
useh
old
inco
me
(2005–0
6=100)
RPI RPIJ CPIH

Living standards, poverty and inequality: 2013
26
ontheCPIHmeasurebutcontinuerisingontheRPIJmeasure,beforeshowingasharpfallonthelattermeasure.ThisdifferenceisverylikelytobetheresultofthedifferencebetweentheCPIHandtheRPI-basedmeasuresinthecalculationofowner-occupiedhousingcosts.TheRPIandRPIJusechangesinmortgageratestocalculatechangestoowner-occupiedhousingcosts.TheCPIH,however,usesimputedrents;thecostofowner-occupiedhousingiscalculatedasthepriceonewouldpaytorentit.ThereductionoftheBankofEnglandbaseratefrom4.5%to0.5%betweenOctober2008andMarch2009ledtoalargefallinmortgagerates,cuttinghousingcostsasmeasuredbytheRPIandRPIJ.Sincerentsdidnotfallasdramaticallyatthattime,theRPIandRPIJweresubstantiallylowerthantheCPIH.Asaresult,nominalmedianincomerosefasterthaninflationaccordingtotheRPIandtheRPIJ,butmoreslowlythaninflationaccordingtotheCPIH.Medianincomeonlycontinuedtoriseinrealtermsduringtherecessionbecauseofthefallingpriceofowner-occupiedhousing,asmeasuredbymortgagerates.Aswouldperhapsbeexpected,theincomemeasuresdeflatedbytheRPIJandtheCPIHconvergeoveraslightlylongerperiod,andremaindivergentfromtheRPI-deflatedmeasure.AsFigures2.3and2.4demonstrate,themeasureofinflationusedwhencomparingaverageincomesovertimehasanimportanteffectonourperceptionofchangesinlivingstandards,particularlyinthelongerrun.AccordingtotheCPIH,medianincomein2011–12waslowerthanin2005–06.AccordingtotheRPI,itwaslowerthanin2002–03.TotheextentthattheRPIoverstatesinflation,andthattheproblemisworseningovertime,theuseofaninflationmeasurebasedontheRPItodeflatepastincomesisproblematic.Indeed,thegovernmenthastakentheviewthattheCPIistheappropriatemeasureofinflationtousewhenupratingmostpartsofthetaxandbenefitsystem.NowthattheONSconsultationontheRPIhasbeenconcluded,itseemsagoodtimeforthegovernmenttoreconsiderthemeasureofinflationusedtocompareincomesovertime,toensurethatofficialstatisticsgiveasaccurateapictureaspossibleofchangesinlivingstandardsacrosstime.WerecommendmovingtousingtheRPIJtoadjustpastincomes.ThiswouldrepresentanunambiguousimprovementontheRPI,sincetheonlydifferencebetweenthetwoistheunwantedformulaeffect.InthecontextoftheHBAIdata,theRPIJisalsopreferabletotheCPIHformeasuringshort-termchangesinlivingstandards,sinceitcaptureschangesintheactualmonetaryoutgoingsofowner-occupiersfortheirhousing(whereasCPIHcapturestheimplicitrentalincometheyforgobynotrentingtheirhouseout).2.5 Prospects for living standardsHBAIfiguresareproducedwithalag.Whatdothedataavailablesuggesthappenedtolivingstandardsin2012–13?Ononehand,theeconomicrecoverycontinuedtostall,withrealGDPlargelyflat(and,becauseofpopulationgrowth,GDPpercapitaislikelyto
Living standards
27
havefallen).27Averageearningsrosebylessthan1.5%in2012–13,wellbelowtheyear-on-yearRPIinflationrateof3.1%(RPIJinflationroseby2.5%).28Ontheotherhand,2012–13sawarecoveryinemployment.Averagedacrosstheyear,theemploymentratewas0.8percentagepointshigherthanin2011–12,andbytheendofthefinancialyear,totalemploymentwasaboveitspre-recessionpeak.29Inaddition,ratesofbenefitsandtaxcreditsmostlyincreasedinrealterms,duetoaspikeininflationinSeptember2011.Defaultupratingwas5.2%,comparedwithannualRPIinflationof3.1%.However,continuingdiscretionarycutstoentitlementwillhavereducedincomefrombenefitsandtaxcredits.RecentIFSresearchprojectedlittlechange(a0.1%fall)inmedianincomein2012–13,reflectingthecounteractingeffectsdescribedabove.30Lookingbeyond2012–13,therearegoodreasonstoexpectfurtherfallsinlivingstandards.AccordingtotheOBR’sforecast,31realaverageearningswillcontinuetofallthroughout2013–14,beforebeginningtogrowagain(slowly)atsomepointin2014–15.Importantly,thegovernment’sdecisiontoupratemostworking-agebenefitsby1%incashtermsforthethreeyearsfromApril2013willseetheratesofbenefitsandtaxcreditsfallinrealtermsineachof2013–14,2014–15and2015–16.Andthereareothercutstobenefitsandtaxcreditstakingeffectfrom2013–14(suchasreductionsincounciltaxbenefit,housingbenefitanddisabilitybenefits).Thesamerecentresearchprojectsthat,asaresultofthesefactors,medianincomewillfallinboth2013–14and2014–15,beforerecoveringslightlyin2015–16.However,itisimportanttostresstheuncertaintythatsurroundsmacroeconomicforecasts,uponwhichtheseprojectionsarebased.Lookingfurtherahead,prospectsforreal-termschangesinmedianincomesareextremelysensitivetothemeasureofinflationusedtodeflatepastincomes.Browne,HoodandJoyce(2013)projectthatrealmedianincomeaccordingtotheCPIwillgrowineachyearfrom2015–16,asonewouldexpect.32However,theOBR’slong-runassumptionsaboutRPIinflation,averageearningsgrowthandCPIinflation(whichdeterminesbenefitratesandtaxthresholds)actuallyimplythatrealmedianincomesaccordingtotheRPIwillcontinuetofallindefinitely.Sinceitseemsimplausiblethatlivingstandardswillactuallyfallindefinitely,thismustcastadditionaldoubtonthecontinueduseoftheRPItodeflateincomes.27 Real GDP figures are from the UK Economic Accounts (ONS series YBEZ). Data downloaded 10 May2013. ONS data for GDP can be subject to revision.
28 Earnings are average weekly earnings (ONS series KAB9). Data downloaded 3 May 2013.
29 Employment is the official measure based on the Labour Force Survey (ONS series MGRZ). Datadownloaded 3 May 2013.
30 See Browne, Hood and Joyce (2013).
31 Office for Budget Responsibility, 2013.
32 It is not possible to project changes in median income according to the RPIJ or CPIH, since forecasts forthese indices are not available.

Living standards, poverty and inequality: 2013
28
2.6 ConclusionHeadlinefiguresfromthelasttwoyearsofHBAIdata,2010–11and2011–12,suggestalargedropinlivingstandards,withcumulativefallsof5.8%inmedianincomeand7.2%inmeanincome.Onthismeasure,real-termslivingstandardsin2011–12werelowerthanin2002–03.Whilewesawlargefallsinaverageincomesoversomeyearsinthe1970sand1980s,thesefollowed(andwerefollowedby)evenlargerincreases.Thelatestfallscameafternearlyadecadeofonlyverysluggishgrowthinlivingstandards,whichiswhyweareintheunprecedentedpositionofhavingofficialfiguressuggestingadecadewithnogrowthinlivingstandards.Thereisanimportantridertothisconclusion,though.Tocomparelivingstandardsovertime,oneneedstoadjustincomesforchangesinprices.TheofficialHBAIfiguresdothisusingtheRPI.ButtheRPIappearsincreasinglytooverstate‘real’consumerpriceinflation.Sotheofficialfiguresareprobablyunderstatingrealincomegrowth(overstatingrecentfalls).Inlightoftheseconcerns,werecommendmovingtotheRPIJ–anunambiguousimprovementontheRPIthatwouldgiveamoreaccuratepictureofchanginglivingstandards.Usingthismeasure,thingsdonotlooksobleak:medianincomesinGreatBritainin2011–12arebacktotheirlevelin2004–05(asopposedto2001–02usingRPIinflation).Returningtotherecentfallsinlivingstandards,lowerrealearningsandlowerbenefitincomeswerethetwokeyfactorsdrivingthefallsinaverageincomesbetween2009–10and2011–12.Realearningsareforecasttocontinuefallinginto2014–15,andtherearefurthercutstowelfarespendingscheduledthroughto2015–16.Prospectsforlivingstandardsarethereforebleak–furtherfallsarelikelytobefollowedbyaweakrecovery,leavingaverageincomegrowthevenlowerinthe2010sthaninthe2000s.

29
© Institute for Fiscal Studies
3. Inequality
Key findings
Income inequality in the UK was broadly unchanged between 2010–11 and 2011–12. Real incomes fell by similar amounts across the income distribution – by 2.5%at the 10th percentile, 2.8% at the median and 2.6% at the 90th percentile.
Although inequality was unchanged in 2011–12, it was substantially lower thanbefore the recession. The Gini coefficient stood at 0.34 in 2011–12, comparedwith 0.36 in 2007–08. This was a result of income changes right across thedistribution, not just a consequence of falling incomes at the very top of thedistribution. Whereas income at the 10th percentile rose by 1.4% in real termsbetween 2007–08 and 2011–12, the cumulative fall in income at the 90th
percentile was 5.9%. Inequality as measured by the Gini was lower than at anypoint during the 2000s, but still much higher than it was before the dramaticwidening of the income distribution that occurred in the 1980s.
These falls in income inequality came despite increases in earnings inequality. Realweekly earnings fell for everyone between 2007–08 and 2011–12, and thepercentage falls were largest for those with modest earnings, although those withthe very lowest weekly earnings fared a little better. Household incomes beforetaxes and benefits therefore became more unequal, but this was outweighed bythe effect of the tax and benefit system, which led to reductions in inequality ofnet incomes.
There were two key reasons for the fall in inequality between 2007–08 and 2011–12. First, because earnings make up a larger fraction of overall income at the topof the income distribution than at the bottom, falling real earnings had a biggernegative impact on incomes for richer households, despite the increase in earningsinequality. Second, real increases in income from benefits and tax creditssupported household incomes towards the bottom of the income distribution.
Looking forward, a return to real earnings growth and cuts to benefit and taxcredit entitlements imply an upward trajectory for income inequality. Thereduction in inequality as a result of the recession is likely to prove a temporaryrather than permanent phenomenon. In the short run, however, year-on-yearmovements in inequality will be affected by the fact that ongoing changes to thetaxation of very-high-income individuals influence when they choose to realisetheir incomes. This is likely to continue until at least 2013–14.Inthischapter,weexaminehowincomeinequalityintheUKhaschangedovertime.Inordertodothis,welookathowincomegrowthhasvariedacrosstheincomedistribution,focusinginparticularonthechangesinthelatestyearofdata(2011–12)andovertheperiodsincetherecession.Inourdiscussionsofinequality,weadoptarelativenotionofinequality.Thismeansthat,ifallincomeschangedbythesameproportionalamount,wewouldconcludethatincomeinequalityhadremainedthesame.However,werecognisethat,evenusinga

Living standards, poverty and inequality: 2013
30
Figure 3.1. Household income at each percentile point in 2011–12 (UK)
Note: Incomes have been measured net of taxes and benefits but before housing costs have beendeducted, and are expressed in 2011–12 prices. All incomes have been equivalised using the modifiedOECD equivalence scale and are expressed in terms of equivalent amounts for a childless couple.Source: Authors’ calculations using the Family Resources Survey 2011–12.relativenotionofinequality,therearemanydifferentmeasuresofinequalitywhichgivedifferentweighttodifferentpartsofthedistribution.Forthisreason,wepresentchangesinincomeacrossthedistributionaswellassummarymeasuresofinequality,suchastheGinicoefficient.Thechapterproceedsasfollows.Section3.1looksathowchangesinincomeshavedifferedacrosstheincomedistribution,whileSection3.2focusesonsummarymeasuresofinequality.Section3.3examineshowchangesinearningsandprivateincomeshavedifferedacrossthedistributioninrecentyears,andcomparesthesechangeswiththoseseeninincomesnetoftaxesandbenefits.Section3.4summariseswhatweknowaboutprospectsforfutureinequalityandSection3.5concludes.Inordertoillustratethecurrentlevelofincomeinequality,Figure3.1showstheaverageequivalisedhouseholdincomeateachpercentilepointoftheincomedistribution.Individualsatthemedianhavejustundertwicethehouseholdincomeofthoseatthe10thpercentile,whilethoseatthe90thpercentilehavejustovertwicethehouseholdincomeofthoseatthemedian.Importantly,thereisgreaterinequalitytowardsthetopofthedistribution.Thedifferenceinincomesbetweenthe90thand97thpercentiles(around£490)isgreaterthanthatbetweenthe90thpercentileandthemedian(around£440).Atthe99thpercentile,incomesaremorethan£1,300aweekgreaterthanincomesatthe90thpercentile.3.1 Income changes across the income distributionTheclearestwaytoseehowandwhyincomeinequalityischangingistocomparechangesinincomesatdifferentpointsinthedistribution.Onewaytodothisisto
0
500
1,000
1,500
2,000
2,500
10 20 30 40 50 60 70 80 90
Rea
lhouseh
old
inco
me
(£pe
rwee
k,2011–1
2prices)
Percentile
10th percentile:£221
50th percentile:£427
90th percentile:£865

Inequality
31
consideraveragerealincomegrowthatthe10th,30th,50th,70thand90thpercentilesofthedistribution.33Figure3.2showstheincomegrowthin2011–12ateachofthesepercentiles.Wecanseethatincomesfellacrossthedistributionin2011–12.Indeed,thefallsinincomewerealmostexactlythesame,withtheexceptionofaslightlysmallerfallatthe70thpercentile.Sincefallsinincomewereevenlydistributed,inequalityremainedroughlythesame.Figure 3.2. Real income growth at the 10th, 30th, 50th, 70th and 90th percentiles,2010–11 to 2011–12 (UK)
Note: Incomes have been measured before housing costs have been deducted.Source: Authors’ calculations using Family Resources Survey, 2010–11 and 2011–12.
Figure 3.3. Real income growth by percentile point, 2010–11 to 2011–12 (UK)
Note: Incomes have been measured before housing costs have been deducted. Percentiles 1–4 and 99 areexcluded because of large statistical uncertainty.Source: Authors’ calculations using the Family Resources Survey, 2010–11 and 2011–12.
33 Income growth at these percentiles is described by the Department for Work and Pensions (DWP) asincome growth by quintile group. For instance, income growth at the 10th percentile is described asincome growth for the first quintile group.
-2.5%-2.8% -2.8%
-1.9%
-2.6%
-3.5%
-3.0%
-2.5%
-2.0%
-1.5%
-1.0%
-0.5%
0.0%
1 2 3 4 5
Inco
mega
in
Percentile
-8%
-6%
-4%
-2%
0%
2%
4%
6%
8%
5 10 15 20 25 30 35 40 45 50 55 60 65 70 75 80 85 90 95
Inco
mega
in
Percentile
50th 70th 90th30th10th
Living standards, poverty and inequality: 2013
32
WhileFigure3.2providesastraightforwardsummaryofhowincomeshavebeenchangingacrossthedistribution,itmaskschangeswithineachquintileandattheextremes.InFigure3.3,weshowhowincomesintheUKchangedbetween2010–11and2011–12rightacrossthedistribution,notjustatfiveparticularpercentilepoints.Alsopresentedare95%confidenceintervals(thedottedlines)forourestimatesofincomegrowth.Acrossmuchoftheincomedistribution,thisfiguretellsasimilarstorytoFigure3.2–incomesfellbyverysimilaramountsbetweenthe20thand60thpercentiles.Itisalsonoticeablethatevenoverthisone-yearperiod,theincomefallsin2011–12werestatisticallysignificantatallpointsbetweenthe10thand73rdpercentiles.Therewereslightlysmallerfallsinincomeatbothtailsofthedistribution.Attheverybottom,thisislikelytobebecausemosthouseholdshavenoincomefromprivatesources,andsodidnotexperiencefallsinearnedincome,incontrasttothosehouseholdsfurtherupthedistribution.Attheverytop,thesmallerfallsinincomereflecta‘bounceback’intopincomesafterthelargefallsseenin2010–11.Thesewerethemselveslargelytheresultoftheunwindingof‘forestalling’–high-incomeindividualsbringingincomeforwardfrom2010–11andsubsequentyearsinto2009–10toavoidthe50%taxrate.34Asthateffectweakens,wewouldexpecttopincomestorecover.However,asFigure3.3shows,estimatesofchangesinincomestowardsthetopoftheincomedistributionaresubjecttomuchgreaterstatisticaluncertainty.Althoughthefallsinincomein2011–12leftinequalityalmostunchanged,theoverallchangesinincomesincetherecessionhavehadasubstantialeffectoninequality.Figure3.4againshowsrealincomegrowthatthe10th,30th,50th,70thand90thpercentiles,butthistimewecomparethecumulativechangeinincomesbetween2007–08and2011–12.Overall,thepatternofchangesinincomeacrosstherecessionhasreducedinequality.Strikingly,incomeatthe10thpercentileremainedhigherin2011–12thanithadbeenin2007–08,whileincomeatthe90thpercentilewasalmost6%lowerinrealterms.Indeed,thefallsinincomebecomeprogressivelylargerasonemovesuptheincomedistribution.Itisinterestingtocomparethepatternsofchangesinincomesacrossthedistributionintheperiodsofrisingaverageincomes(2007–08to2009–10)andfallingaverageincomes(2009–10to2011–12).Figure3.5doesthis,showingthecumulativechangeinincomebypercentilepointinbothofthosetwo-yearperiods,aswellasinthefouryearsasawhole.Lookingfirstattheperiodbetween2007–08and2009–10,wecanseethatpatternsofincomegrowthduringtherecessionitselfservedtoreduceinequality.Whileincomesincreasedatallpointsofthedistribution,thereweremuchlargerincreasestowardsthebottom,chieflyasaresultofrealincreasesinincomefrombenefitsandtaxcredits.35Lookingatchangessince2009–10,asimilarpatternemerges.Whileincomeshavefallenacrossthedistribution,thesmallestfallshavebeenatthebottomoftheincomedistributionandthelargestfallsatthetop.Thereductionin34 See Box 3.1 for further details.
35 See Cribb, Joyce and Phillips (2012).
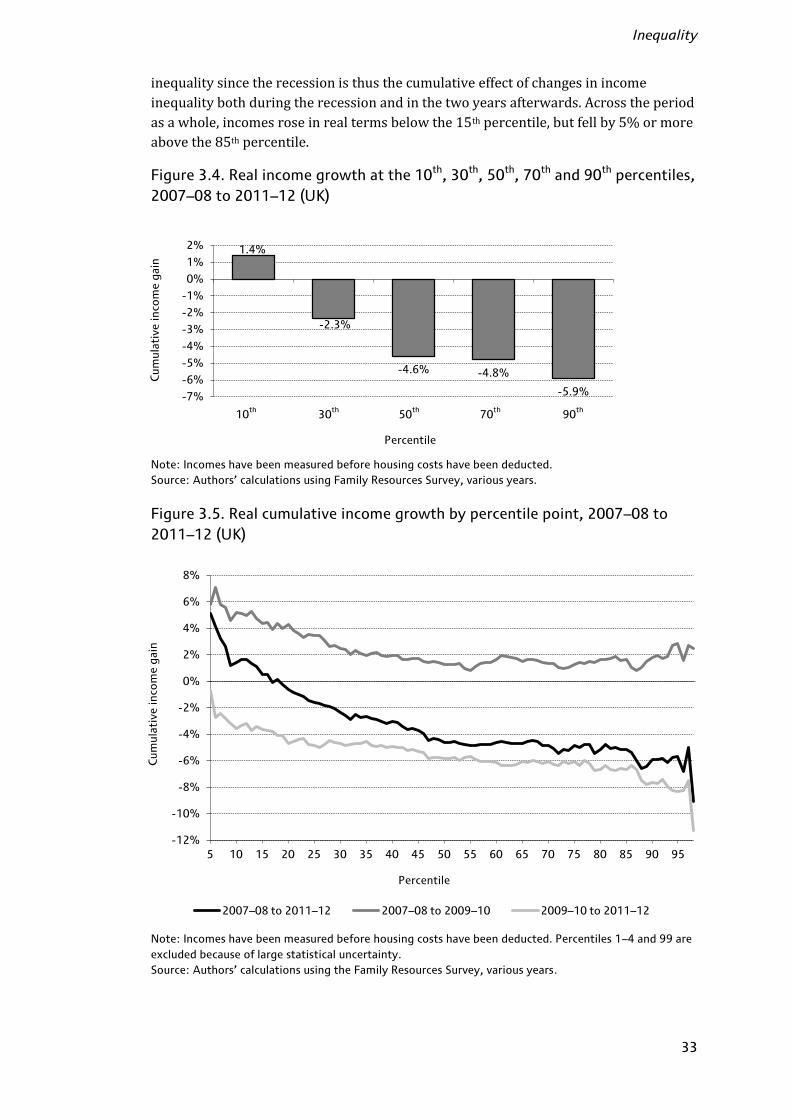
Inequality
33
inequalitysincetherecessionisthusthecumulativeeffectofchangesinincomeinequalitybothduringtherecessionandinthetwoyearsafterwards.Acrosstheperiodasawhole,incomesroseinrealtermsbelowthe15thpercentile,butfellby5%ormoreabovethe85thpercentile.Figure 3.4. Real income growth at the 10th, 30th, 50th, 70th and 90th percentiles,2007–08 to 2011–12 (UK)
Note: Incomes have been measured before housing costs have been deducted.Source: Authors’ calculations using Family Resources Survey, various years.
Figure 3.5. Real cumulative income growth by percentile point, 2007–08 to2011–12 (UK)
Note: Incomes have been measured before housing costs have been deducted. Percentiles 1–4 and 99 areexcluded because of large statistical uncertainty.Source: Authors’ calculations using the Family Resources Survey, various years.
1.4%
-2.3%
-4.6% -4.8%
-5.9%-7%
-6%
-5%
-4%
-3%
-2%
-1%
0%
1%
2%
1 2 3 4 5
Cum
ulativeinco
mega
in
Percentile
-12%
-10%
-8%
-6%
-4%
-2%
0%
2%
4%
6%
8%
5 10 15 20 25 30 35 40 45 50 55 60 65 70 75 80 85 90 95
Cum
ulativeinco
mega
in
Percentile
2007–08 to 2011–12 2007–08 to 2009–10 2009–10 to 2011–12
10th 30th 50th 70th 90th

Living standards, poverty and inequality: 2013
34
Figure 3.6. Real average annualised income growth by percentile point (GB)
Note: Incomes have been measured before housing costs have been deducted. Percentiles 1–4 and 99 areexcluded because of large statistical uncertainty.Source: Authors’ calculations using the Family Resources Survey and Family Expenditure Survey, variousyears.Toputthepatternofincomegrowthsincetherecessionincontext,itisworthwhilelookingatthelong-runtrendsinincomegrowthatdifferentpointsoftheincomedistribution.Todothis,wemustlookatincomesinGreatBritain(GB)only(NorthernIrelandwasonlyincludedinthedatafrom2002–03onwards).36Figure3.6comparesaverageannualisedincomegrowthateachpercentilepointoftheincomedistributioninthe1970s,1980s,1990sand2000s.Italsoshowsaverageannualisedincomegrowthsince2000,allowingtheeffectofthetwoyearsoffallingincomes(2010–11and2011–12)tobeseenclearly.Itisobviousfromthefigurehowdifferentthe1980swerefromthedecadesthatcamebeforeandafter.Annualisedincomegrowthwasslowerthaninanyotherdecadeinthebottomthirdofthedistributionandfasterthaninanyotherdecadeforalmosteveryoneelse.Thispatternofincomegrowthledtolargeincreasesininequality,withincomesatthemediangrowingnearlyfivetimesasfastasthoseatthe10thpercentile,andincomesatthe90thpercentilegrowingone-and-a-halftimesasfastagain.Onecanalsoseethatthosewiththeveryhighestincomesbegantoenjoymuchstrongerincomegrowththantherestofthepopulation.Incomesatthe98thpercentileincreasedbyan36 The fact that Northern Ireland represents only a small fraction of the UK population (around 3.0%) andthe similarity in economic trends between Northern Ireland and Great Britain mean that the differencebetween GB and UK-wide figures is likely to be small.
0.0%
0.5%
1.0%
1.5%
2.0%
2.5%
3.0%
3.5%
4.0%
4.5%
5 10 15 20 25 30 35 40 45 50 55 60 65 70 75 80 85 90 95
Average
annu
alinco
mega
in
Percentile
1970s 1980s 1990s 2000s Since 2000

Inequality
35
averageofover4%ayearthroughthe1980s,withincomesatthe99thpercentileincreasingbynearly7%ayearonaverage.37Incomparison,thepatternsofincomegrowthinthe1970s,1990sand2000sweresimilartoeachother.Thereare,however,twodifferencesworthnoting.First,incomegrowthacrossmostofthebottomhalfoftheincomedistributionwasstrongerinthe2000sthanineitherthe1970sorthe1990s.ThisislikelytoreflecttheconcertedeffortoftheLabourgovernmenttoreducechildandpensionerpovertythroughincreasingthegenerosityofbenefitsandtaxcredits.38Second,thetrendtowardsfasterincomegrowthamongthosewiththehighestincomesseeninthe1980scontinuedinthesubsequentdecades,particularlythe2000s.Thiscontrastswiththe1970s,whenincomesattheverytopactuallygrewmoreslowlythanthoseatthemedian.Itisstrikinghowmuchofanimpactthelargefallsinincomein2010–11and2011–12makeonincomegrowthsince2000.Inthebottomhalfofthedistribution,thetwoyearsoffallingincomeshavecancelledoutthestrongergrowthinincomesthroughthe2000sdiscussedinthepreviousparagraph–incomegrowthsince2000looksnobetterthanthatinthe1990sorthe1970s.Towardsthetopofthedistribution,theeffectisevenmoremarked:althoughaverageannualincomegrowthinthe2000swassimilartothatinthe1970sandthe1990s,incomegrowthsince2000isaroundapercentagepointlower.Twoimportantpointsabouttherecentpatternofincomegrowthemerge.First,the2000sdonotlooklikeadecadeofhistoricallylowincomegrowthforthoseinthemiddleorlowermiddleoftheincomedistribution.Priortotheimpactoftherecession,incomegrowthforthisgrouplookssimilarto,ifnotalittlebetterthan,thatinmostrecentdecades.Addingintheimmediateeffectsofadeeprecessionunsurprisinglychangesthispattern,thougheventhen,since2000,thebottomthirdhavedoneratherbetterthaninthe1980s,noworsethaninthe1970sandbarelyworsethaninthe1990s.Second,thereisnoevidenceinFigure3.6ofaparticularly‘squeezedmiddle’overthelastdecadeormore:incomegrowthwasrelativelysimilaracrossthedistribution,withtheexceptionofincomesattheverytop.3.2 Summary measures of inequalityInordertounderstandhowthepatternsofincomegrowthseeninSection3.1haveaffectedinequalityovertime,itisusefultoconstructsummarymeasuresofinequality.Inthissection,wediscusstrendsinincomeinequalityaccordingtoratiomeasuresofinequalityandtheGinicoefficient.
37 Note that the change in income at the 99th percentile is subject to a higher level of statisticaluncertainty, and so is not shown in Figure 3.6.
38 See Brewer, Browne, Joyce and Sibieta (2010).
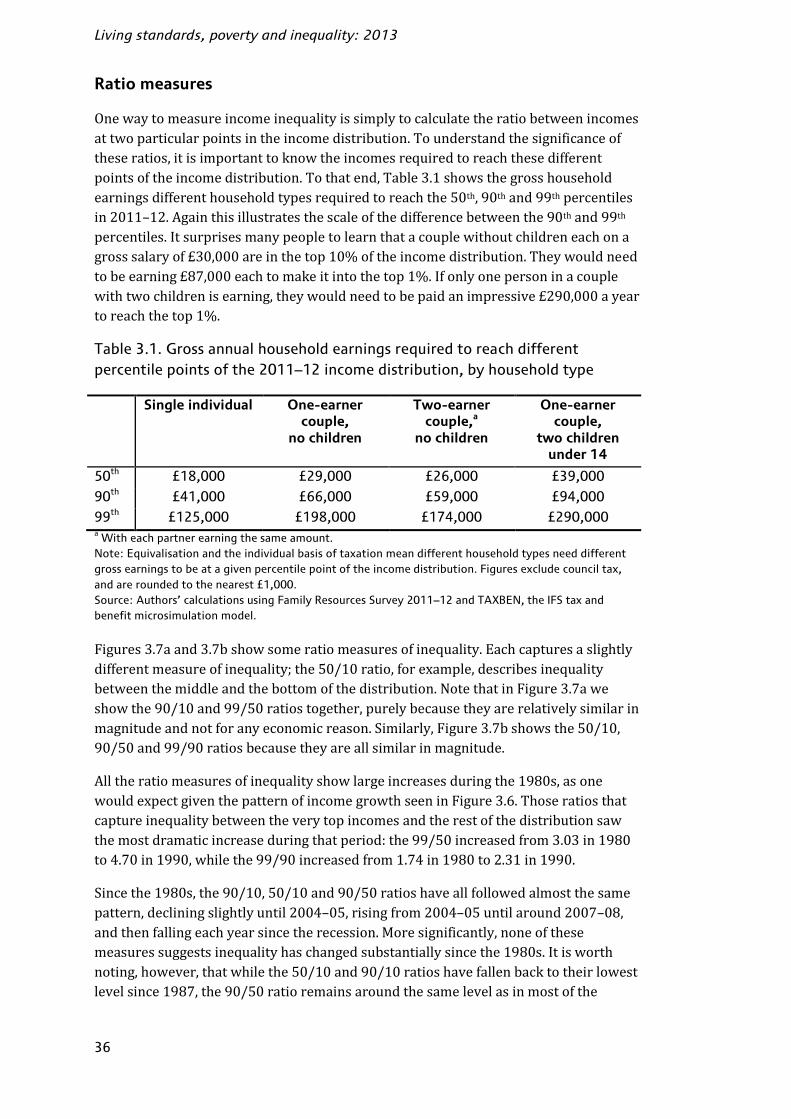
Living standards, poverty and inequality: 2013
36
Ratio measuresOnewaytomeasureincomeinequalityissimplytocalculatetheratiobetweenincomesattwoparticularpointsintheincomedistribution.Tounderstandthesignificanceoftheseratios,itisimportanttoknowtheincomesrequiredtoreachthesedifferentpointsoftheincomedistribution.Tothatend,Table3.1showsthegrosshouseholdearningsdifferenthouseholdtypesrequiredtoreachthe50th,90thand99thpercentilesin2011–12.Againthisillustratesthescaleofthedifferencebetweenthe90thand99thpercentiles.Itsurprisesmanypeopletolearnthatacouplewithoutchildreneachonagrosssalaryof£30,000areinthetop10%oftheincomedistribution.Theywouldneedtobeearning£87,000eachtomakeitintothetop1%.Ifonlyonepersoninacouplewithtwochildrenisearning,theywouldneedtobepaidanimpressive£290,000ayeartoreachthetop1%.Table 3.1. Gross annual household earnings required to reach differentpercentile points of the 2011–12 income distribution, by household type
Single individual One-earnercouple,
no children
Two-earnercouple,a
no children
One-earnercouple,
two childrenunder 14
50th £18,000 £29,000 £26,000 £39,000
90th £41,000 £66,000 £59,000 £94,000
99th £125,000 £198,000 £174,000 £290,000a With each partner earning the same amount.Note: Equivalisation and the individual basis of taxation mean different household types need differentgross earnings to be at a given percentile point of the income distribution. Figures exclude council tax,and are rounded to the nearest £1,000.Source: Authors’ calculations using Family Resources Survey 2011–12 and TAXBEN, the IFS tax andbenefit microsimulation model.Figures3.7aand3.7bshowsomeratiomeasuresofinequality.Eachcapturesaslightlydifferentmeasureofinequality;the50/10ratio,forexample,describesinequalitybetweenthemiddleandthebottomofthedistribution.NotethatinFigure3.7aweshowthe90/10and99/50ratiostogether,purelybecausetheyarerelativelysimilarinmagnitudeandnotforanyeconomicreason.Similarly,Figure3.7bshowsthe50/10,90/50and99/90ratiosbecausetheyareallsimilarinmagnitude.Alltheratiomeasuresofinequalityshowlargeincreasesduringthe1980s,asonewouldexpectgiventhepatternofincomegrowthseeninFigure3.6.Thoseratiosthatcaptureinequalitybetweentheverytopincomesandtherestofthedistributionsawthemostdramaticincreaseduringthatperiod:the99/50increasedfrom3.03in1980to4.70in1990,whilethe99/90increasedfrom1.74in1980to2.31in1990.Sincethe1980s,the90/10,50/10and90/50ratioshaveallfollowedalmostthesamepattern,decliningslightlyuntil2004–05,risingfrom2004–05untilaround2007–08,andthenfallingeachyearsincetherecession.Moresignificantly,noneofthesemeasuressuggestsinequalityhaschangedsubstantiallysincethe1980s.Itisworthnoting,however,thatwhilethe50/10and90/10ratioshavefallenbacktotheirlowestlevelsince1987,the90/50ratioremainsaroundthesamelevelasinmostofthe

Inequality
37
2000s.Thissuggestsincomesatthebottomofthedistributionhavecaughtupsomewhatwiththoseinthemiddleinrecentyears,whilemiddleincomeshavenotcaughtupwiththoseatthetopinthesameway.Itisattheverytop,the99thpercentile,whereincomeshavecontinuedtorisemuchmorequicklythanacrosstherestofthedistribution,withboththe99/50andthe99/90ratioscontinuingtoincreaseacrossthepasttwodecades.This‘racingaway’oftopincomeshasbeendocumentedfrequently,bothintheUKandinmanyothercountries.39Figure 3.7a. Measures of inequality: 90/10 and 99/50 ratios
Figure 3.7b. Measures of inequality: 50/10, 90/50 and 99/90 ratios
Note: Income has been measured before housing costs have been deducted. Years refer to calendar yearsup to and including 1992 and to financial years from 1993–94 onwards.Source: Authors’ calculations using Family Resources Survey and Family Expenditure Survey, variousyears.
39 See Brewer, Sibieta and Wren-Lewis (2008) for the UK and Atkinson, Piketty and Saez (2011) for othercountries.
2.5
3.0
3.5
4.0
4.5
5.0
5.5
6.0
Ratio
90/10 99/50
1.5
1.7
1.9
2.1
2.3
2.5
2.7
2.9
Ratio
50/10 90/50 99/90

Living standards, poverty and inequality: 2013
38
The Gini coefficientThebiggestlimitationoftheratiomeasuresofinequalityisthattheycanonlycapturedifferencesinincomesbetweenparticularpointsinthedistribution,ratherthanacrossthedistributionasawhole.TheGinicoefficient,ontheotherhand,condensestheentireincomedistributionintoasinglenumberbetween0and1;thehigherthenumber,thegreaterthedegreeofincomeinequality.Avalueof0correspondstotheabsenceofinequality,sothat,havingadjustedforhouseholdsizeandcomposition,allindividualshavethesamehouseholdincome.Incontrast,avalueof1correspondstoinequalityinitsmostextremeform,withasingleindividualhavingalltheincomeintheeconomy.TogetasenseofthelevelofinequalitytowhichagivenvalueoftheGinicorresponds,itisusefultocompareGinicoefficientsacrosscountries.In2008(themostrecentyearforwhichinternationaldataareavailable),theGinicoefficientsforFrance,GermanyandtheUnitedStateswere0.29,0.30and0.38respectively,40comparedwith0.36intheUK(in2008–09).TheGinicoefficientsuggestsincomeinequalityisgreaterintheUKthaninFranceorGermany,butalittlelowerthanintheUS.Figure3.8showstheevolutionoftheGinicoefficientforGreatBritainsince1961.AswasthecasewiththeratiomeasuresofinequalityinFigure3.7,the1980ssawalargeincreaseininequality.Fromaround0.25in1979,theGinicoefficientrosetojustover0.34by1991.Fromtheearly1990sonwards,changesintheGinicoefficientweremuchlessdramaticuntil2010–11,whichsawthelargestsingle-yearfallintheGiniFigure 3.8. The Gini coefficient (GB)
Note: Income has been measured before housing costs have been deducted. Years refer to calendar yearsup to and including 1992 and to financial years from 1993–94 onwards.Source: Authors’ calculations using Family Resources Survey and Family Expenditure Survey, variousyears.
40 International Gini coefficients are from the OECD statistics library: http://stats.oecd.org. All figures forcalendar year 2008. Data downloaded 13 May 2013.
0.15
0.20
0.25
0.30
0.35
0.40
Ginicoefficien
t

Inequality
39
Box 3.1. The effect of the additional rates of income tax on top incomes
Over recent years, an important factor in the changes to top incomes has been theimpact of the introduction of the 50% rate of income tax in April 2010.a This had a‘permanent’ effect on top incomes, both through its direct impact on net incomes (fora given level of pre-tax income) and because of likely behavioural responses, such asreduced effort, increased tax avoidance and emigrating from the UK. It has also had atemporary effect on top incomes, by incentivising individuals to change when theydraw incomes (or when they report drawing incomes) in order to minimise their taxliability. Income that would otherwise have been reported after April 2010 wasbrought forward into 2009–10 to avoid paying the new higher rate of tax on thatincome, a process known as ‘forestalling’. In 2010–11, this ‘forestalling’ was partiallyunwound, leading to large reductions in top incomes. According to the Office forBudget Responsibility (OBR), this unwinding will have continued into 2011–12 and2012–13.b In 2012–13, top incomes were also affected by what has been called‘reverse forestalling’: individuals are expected to have delayed reporting income until2013–14, in order to pay income tax at the reduced rate of 45% (introduced in April2013). Top incomes are then likely to increase again in 2013–14. This means it willcontinue to be somewhat difficult to ascertain underlying trends in summary measuresof inequality that are sensitive to top incomes for the next few years.
a See Cribb, Joyce and Phillips (2012) for a more comprehensive discussion.b Office for Budget Responsibility, 2012, p. 109.coefficientsincetheconsistentseriesbegan,from0.36to0.34.TheGiniroseslightlyin2011–12,butthechangewasnotstatisticallysignificant.41TheGinicoefficient,sinceitcapturesinequalityacrossthewholeincomedistribution,isaffectedbychangesinincomesattheverytopofthedistribution.ItisimportanttotakeaccountofthiswhenassessingthesignificanceofthefallintheGinicoefficientinrecentyears;since2008–09,thetax-inducedshiftingofincomebetweenyearshasaffectedyear-on-yearchangesintopincomes,makingitdifficulttoisolatetheunderlyingtrends(formoredetailsoftheincomeshifting,seeBox3.1).OnewaytogaugethesensitivityoftheGinicoefficienttochangesintopincomesistodecomposeitintothesumofthreecomponents–incomeinequalitywithinthebottom99%,withinthetop1%,andbetweenthebottom99%andthetop1%.42OfthefallintheGinibetween2009–10and2010–11,two-thirdswasduetochangesinincomeinequalitybetweenthetop1%andthebottom99%,withonlyathirdofthefallduetochangingincomeinequalityamongthe99%.(Thecontributionofchanginginequalityamongthetop1%wasminuscule.43)Inotherwords,mostofthedramaticfallintheGinicoefficientinthatyearcanbeattributedtothereportedfallintheincomesofthe41 Standard errors were calculated using the bootstrap methodology. See source to Table 2.1 for moredetail.
42 See Appendix C and Lambert and Aronson (1993) for technical details.
43 This partly reflects the failure of the HBAI data to fully capture inequality among the richest individualsas a result of the SPI adjustment (see Appendix A).

Living standards, poverty and inequality: 2013
40
top1%,whichwaslargelytheresultof‘forestalling’.ThesensitivityoftheGinitochangesintopincomesmakesitunwisetoputtoomuchemphasisonyear-on-yearchanges,particularlyinthecurrentcontext.Note,however,thattheratiomeasuresdoshowincomeinequalityfallingacrossthedistributionin2010–11.Lookingattheperiodsincetherecession,thisbreakdownofchangesintheGinicoefficientrevealsadifferentstory.OfthefallintheGinicoefficientbetween2007–08and2011–12,two-thirdswasduetofallingincomeinequalitywithinthebottom99%,withtheremainingthirdaccountedforbyfallinginequalitybetweenthebottom99%andthetop1%.Unlikethesingle-yearfallin2010–11,thechangeintheGinicoefficientsincetherecessionchieflyreflectsdeclininginequalityacrossthedistribution,ratherthansimplythefallsintopincomes.Togetasenseofthedifferencethe‘racingaway’oftopincomesoverthelongrunhasmadetochangesintheGinicoefficient,wecancalculatetheGinijustforthebottom99%,excludingtheeffectofincreasinginequalitybetweenthetop1%andthebottom99%(andchangesininequalitywithinthetop1%).Overthepasttwodecades,incomeinequalityamongthewholepopulationhasremainedunchanged:theGinicoefficientin2011–12wasnotstatisticallysignificantlydifferentfromits1991value.However,inequalityamongthebottom99%hasfallen:theGinicoefficientforthebottom99%was5%lowerin2011–12,at0.30,thanin1991,whenitwas0.314(andthedifferencewasstatisticallysignificant).3.3 The distribution of earnings and private incomesInthissection,weturnourattentiontothedistributionofearningsandprivateincomes,andhowthosedistributionshavebeenaffectedbytherecession.First,weexaminethelabourmarketoutcomesofindividuals–howthegrossearningsofthoseinworkhavechangedovertime.Second,welookathowthesechangesinindividualearningshaveplayedoutatthehouseholdlevel,byconsideringchangesintheprivatehouseholdincomedistribution.44Furthermore,bycomparingthechangesinprivateandnethouseholdincomes,weareabletogainsomeinsightsintotheroleofstateredistributioninreducinginequality.The earnings distributionWhilechangesinthehouseholdincomedistributiondependpartlyonhouseholdcompositionandstateredistribution,perhapsthesinglemostimportantdeterminantofincomeinequalityisthevariationintheearningsofdifferentindividuals,ascapturedbytheadultearningsdistribution.Whenpresentingearningsdistributions,weexcludethoseindividualswithnoearnedincome.Thisallowsustoexaminechangingearningsinequalityamongtheworkingpopulationbyshowingyear-on-yearchangesinearningsateachpercentile.44 Gross earnings are the main component of private incomes, with other components including self-employment income, private pensions and income from investments.

Inequality
41
Figure 3.9. Real earnings growth by percentile point, 2010–11 to 2011–12 (UK)
Note: Percentiles 1–4 and 99 are excluded because of large statistical uncertainty.Source: Authors’ calculations using the Family Resources Survey, 2010–11 and 2011–12.Figure3.9showsthechangeinrealweeklyearningsin2011–12ateachpointoftheadultearningsdistribution,alongwiththe95%confidenceintervals(thedottedlines).Therearetwothingsworthnoting.First,realearningsfellsubstantiallyacrossmostoftheearningsdistribution.Indeed,theyear-on-yearfallwasstatisticallysignificantbetweenaroundthe25thand90thpercentiles.Second,fallsinearningsacrossthebottomhalfoftheearningsdistributionwereinequality-reducing,withmuchsmallerfallsatthebottomoftheearningsdistributionthanatthemedian.Whileitisimportantnottoreadtoomuchintoasingleyearofdata,thesechangesareinlinewiththetrendtowardslowerearningsinequalityamongthebottomhalfofearnersseenintheyearsbeforethestartoftherecentrecession.45InSection2.3,wesawthataveragegrosshouseholdearningswereflatbetween2007–08and2009–10,butthenfellsubstantiallybetween2009–10and2011–12.46Figure3.10showschangesinthedistributionofindividualearningsineachofthoseperiods,aswellasacrossthefouryearsasawhole.Thekeyfindingfortheperiodasawholeisthatrealweeklyearningsfellmoretowardsthebottommiddleofthedistributionthanatthetop.Earningsatthe20thand50thpercentilesfellbyaround10%,comparedwithafallofonly4%atthe90thpercentile.Asaresult,earningsinequalityroseacrossmostofthedistribution.However,earningsfellsomewhatlessattheverybottomofthedistribution;someprotectionwasperhapsofferedbytheminimumwage.45 See Machin and Van Reenen (2007) and Blundell and Etheridge (2010), who show falling inequalitybetween the bottom and the middle of the hourly earnings distribution. See also Section 6.3 of thisreport, which considers changes in real weekly earnings for the bottom half of the earnings distributionfor working-age non-parents.
46 Note that these average changes include those households with zero gross earnings, while here wefocus only on individuals with positive earnings.
-12%
-10%
-8%
-6%
-4%
-2%
0%
2%
4%
6%
8%
5 10 15 20 25 30 35 40 45 50 55 60 65 70 75 80 85 90 95
Cha
ngein
realea
rnings
Percentile

Living standards, poverty and inequality: 2013
42
Figure 3.10. Real weekly earnings growth by percentile point, 2007–08 to2011–12 (UK)
Note: Percentiles 1–4 and 99 are excluded because of large statistical uncertainty.Source: Authors’ calculations using the Family Resources Survey, various years.Thispatternwasdrivenbyasignificantincreaseinearningsinequalityduringtherecession.Between2007–08and2009–10,earningsatthe20thpercentilesawacumulativefallofaround4%inrealterms,whileearningsatthe50thsawacumulativefallof1.2%andthe90thpercentilesawrealgrowthofover2%.However,itisimportanttonotethatwhileweeklyearningsfellinrealtermsacrossthelowermiddleofthedistribution,hourlyearningswereunchanged.Thissuggeststhatthefallsinweeklyearningsfortherelativelylow-paidduringtherecessionwerelargelytheresultofareductioninworkinghours(suchasgreaterpart-timeworking),ratherthanfallinghourlyearnings.Theperiodfollowingtherecession,from2009–10to2011–12,sawverylargefallsinrealearnings,butthosefallsweredistributedmoreevenlyacrossthedistribution.Weeklyearningsfellby8%atthe20thpercentile,comparedwith9%atthemedianand6%atthe90thpercentile.TheLabourForceSurvey(LFS),ratherthantheHBAIdata,isthemainsourceoflabourmarketstatisticsintheUK.Figure3.11thereforecomparescumulativerealearningsgrowthateachpercentilepointoftheweeklyearningsdistributionbetween2007–08and2011–12accordingtoHBAIandtheLFS.47
47 The LFS does not include data on self-employment income, and so individuals with any such income aredropped from the HBAI data to make the two sources directly comparable.
-12%
-10%
-8%
-6%
-4%
-2%
0%
2%
4%
6%
5 10 15 20 25 30 35 40 45 50 55 60 65 70 75 80 85 90 95
Cum
ulativechan
gein
real
earnings
Percentile
2007–08 to 2009–10 2009–10 to 2011–12 2007–08 to 2011–12

Inequality
43
Figure 3.11. Real weekly earnings growth by percentile point according toHBAI and the Labour Force Survey, 2007–08 to 2011–12 (UK)
Note: Percentiles 1–4 and 99 are excluded because of large statistical uncertainty.Source: Authors’ calculations using the Family Resources Survey and Labour Force Survey, various years.TheLFSandHBAIprovidesimilarpicturesofthecumulativechangeinearningsbetween2007–08and2011–12.Accordingtobothsources,earningsfellacrossthedistribution,butthosetowardsthebottom–butnotattheverybottom–oftheearningsdistributionsawlargerfallsinpercentagetermsthanthoseinthemiddleandtopoftheearningsdistribution.Inotherwords,theconclusionthatweeklyearningsinequalityhasincreasedsubstantiallysincetheonsetofthefinancialcrisisisrobusttodifferentsourcesofearningsdata.ThefallsinearningsinthemiddleofthedistributiondolooksomewhatsmallerintheLFSthanintheHBAIdata,butthedifferencesarenotgenerallystatisticallysignificant.48Aswellasbeingofinterestinitself,thedistributionoffallsinrealearningssince2007–08providesanimportantexplanationofchangesinthedistributionofnethouseholdincomesoverthatperiod.Inordertoassessthecontributionofchangesinearningstotheincomedistribution,wefirstneedtoknowhowthetwodistributionsrelate.ThisrelationshipisillustratedinFigure3.12.Theindividualswithpositiveearningsaredividedintoquintilegroupsonthebasisoftheirpositionintheearningsdistribution.Thefigurethenshowswhatproportionofeachearningsquintilegroupcanbefoundineachquintileofthehouseholdincomedistribution(afterequivalisation).Forexample,anindividualwhoworksparttimebuthasahigh-earningspousemightbeinthebottomquintileoftheearningsdistribution,buthaveahouseholdincomethatplacestheminthetopquintileofthehouseholdincomedistribution.48 Standard errors were calculated using the bootstrap methodology. See source to Table 2.1 for moredetails.
-12%
-10%
-8%
-6%
-4%
-2%
0%
5 10 15 20 25 30 35 40 45 50 55 60 65 70 75 80 85 90 95
Cum
ulativechan
gein
real
earnings
Percentile
2007–08 to 2011–12 (HBAI) 2007-08 to 2011-12 (LFS)

Living standards, poverty and inequality: 2013
44
Figure 3.12. Quintiles of the earnings and income distributions (UK)
Source: Authors’ calculations using the Family Resources Survey 2011–12.Thefarright-handbarshowsthatmostindividualsatthetopoftheearningsdistributionarealsoatthetopofthehouseholdincomedistribution:ofthetopquintileofearners,around75%arealsointhetopquintileofthehouseholdincomedistribution.However,thesamerelationshipdoesnotholdatthebottomofthetwodistributions:ofthebottomquintileofearners,onlyaround25%arealsointhebottomquintileofthehouseholdincomedistribution.Therearetwomainreasonsforthis.First,lowearnersmightnotbetheonlyearnerinagivenhousehold,asintheexampleofthespouseofahigh-earningindividualwhoworksparttime.Second,morethanhalfoftheindividualsinthebottomquintilearepensionersorworklessadults,andsodonotappearintheearningsdistribution.Withthisinmind,whatcanwesayabouttheimplicationofthechangestotheearningsdistributionforthehouseholdincomedistribution?Inshort,changestoearningshelpexplainthepatternatthetopoftheincomedistributionbutnotatthebottom.Fallsinrealearningsatthetopoftheearningsdistributionexplainfallsinhouseholdincomesatthetopoftheincomedistribution.Butthelargerfallsinrealearningstowardsthebottomofthedistributionarenotreflectedinlargerfallsinhouseholdincomesinthelowermiddleofthedistribution,wheremostoftheindividualsaffectedarefound.Instead,incomesfellbylesstowardsthebottomofthedistribution.Inthenextsubsection,weexaminethewholeprivateincomedistributionandanalysetheimpactofstateredistributioninreducinginequality.The private income distributionPrivateincomeisincomereceivedbeforedirecttaxesaredeductedandbeforebenefitsarereceivedbythehousehold.49Earningsarethemaincomponentofprivateincomes,49 The private income distribution should not be thought of as what the income distribution would be inthe absence of taxes and benefits. The tax and benefit system creates incentives, which individualsrespond to by changing their decisions, such as how much to work and save.
0%
20%
40%
60%
80%
100%
1 2 3 4 5Earnings quintile
Bottom income quintile 2nd income quintile 3rd income quintile
4th income quintile Top income quintile

Inequality
45
withothercomponentsincludingself-employmentincome,privatepensionsandincomefrominvestments.Bycomparingchangesintheprivateincomedistributionwiththoseinthenetincomedistribution,wecangetasenseoftheeffectofstateredistributionduringandaftertherecession.InFigure3.13,weshowprivateandnethouseholdincomeateachpercentilepointoftheirrespectivedistributionsin2011–12.Asonemightexpect,inequalityissignificantlyhigherforprivateincomesthanfornetincomes.Whileincomeatthe90thpercentileofthenetincomedistributionisalmostexactlytwicetheincomeatthemedian,incomeatthe90thpercentileoftheprivateincomedistributionismorethantwo-and-a-halftimesthatatthemedian.Moststrikingly,aroundoneintenindividualslivesinahouseholdwithnoprivatesourceofincome.Transfersfromthegovernmentensurethatmostoftheseindividualshavepositivenetincomes,whiletaxesbringthenetincomesofthosetowardsthetopofthedistributionsubstantiallybelowtheirprivateincomes.Figure 3.13. Private and net household income at each percentile point in2011–12 (UK)
Note: Incomes have been measured before housing costs have been deducted, and are expressed in 2011–12 prices. All incomes have been equivalised using the modified OECD equivalence scale and areexpressed in terms of equivalent amounts for a childless couple.Source: Authors’ calculations using the Family Resources Survey 2011–12.Theremainderofthissubsectionexamineschangesintheprivateincomedistributionsincetherecession,alongsidethechangesseeninthenetincomedistribution.Itisimportanttonotethatthedifferenceinthesechangesatagivenpercentilepointcannotbestraightforwardlyinterpretedastheeffectofchangestothetaxandbenefitsystem,sincetaxandbenefitchangesarealsolikelytoshiftindividualswithinthenetincomedistribution(inotherwords,thoseindividualsat,forexample,the25thpercentileoftheprivateincomedistributionarenotnecessarilythesameindividualsasatthe25thpercentileofthenetincomedistribution).Throughout,weexcludethebottom25%of
0
500
1,000
1,500
2,000
2,500
3,000
3,500
10 20 30 40 50 60 70 80 90
Rea
lhouseh
old
inco
me
(£pe
rwee
k,2011–1
2prices)
Percentile
Private income Net income
10th percentile: £0
50th percentile: £442
90th percentile: £1,173
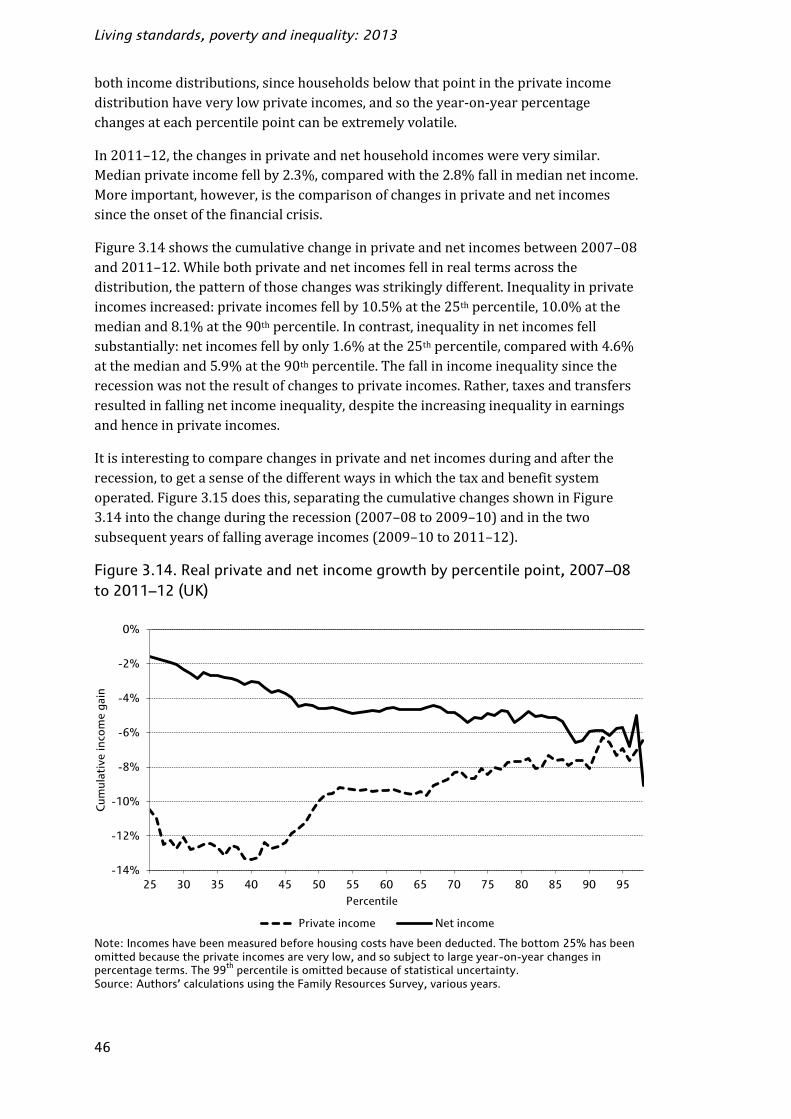
Living standards, poverty and inequality: 2013
46
bothincomedistributions,sincehouseholdsbelowthatpointintheprivateincomedistributionhaveverylowprivateincomes,andsotheyear-on-yearpercentagechangesateachpercentilepointcanbeextremelyvolatile.In2011–12,thechangesinprivateandnethouseholdincomeswereverysimilar.Medianprivateincomefellby2.3%,comparedwiththe2.8%fallinmediannetincome.Moreimportant,however,isthecomparisonofchangesinprivateandnetincomessincetheonsetofthefinancialcrisis.Figure3.14showsthecumulativechangeinprivateandnetincomesbetween2007–08and2011–12.Whilebothprivateandnetincomesfellinrealtermsacrossthedistribution,thepatternofthosechangeswasstrikinglydifferent.Inequalityinprivateincomesincreased:privateincomesfellby10.5%atthe25thpercentile,10.0%atthemedianand8.1%atthe90thpercentile.Incontrast,inequalityinnetincomesfellsubstantially:netincomesfellbyonly1.6%atthe25thpercentile,comparedwith4.6%atthemedianand5.9%atthe90thpercentile.Thefallinincomeinequalitysincetherecessionwasnottheresultofchangestoprivateincomes.Rather,taxesandtransfersresultedinfallingnetincomeinequality,despitetheincreasinginequalityinearningsandhenceinprivateincomes.Itisinterestingtocomparechangesinprivateandnetincomesduringandaftertherecession,togetasenseofthedifferentwaysinwhichthetaxandbenefitsystemoperated.Figure3.15doesthis,separatingthecumulativechangesshowninFigure3.14intothechangeduringtherecession(2007–08to2009–10)andinthetwosubsequentyearsoffallingaverageincomes(2009–10to2011–12).Figure 3.14. Real private and net income growth by percentile point, 2007–08to 2011–12 (UK)
Note: Incomes have been measured before housing costs have been deducted. The bottom 25% has beenomitted because the private incomes are very low, and so subject to large year-on-year changes inpercentage terms. The 99th percentile is omitted because of statistical uncertainty.Source: Authors’ calculations using the Family Resources Survey, various years.
-14%
-12%
-10%
-8%
-6%
-4%
-2%
0%
25 30 35 40 45 50 55 60 65 70 75 80 85 90 95
Cum
ulativeinco
mega
in
Percentile
Private income Net income

Inequality
47
Figure 3.15. Real private and net income growth by percentile point, 2007–08to 2009–10 and 2009–10 to 2011–12 (UK)
Note: Incomes have been measured before housing costs have been deducted. The bottom 25% has beenomitted because the private incomes are very low, and so subject to large year-on-year changes inpercentage terms. The 99th percentile is omitted because of statistical uncertainty.Source: Authors’ calculations using the Family Resources Survey, various years.Lookingfirstatthechangesbetween2007–08and2009–10,therearetwoimportantthingstonote.First,whilenetincomesroseacrossthedistribution,privateincomesfellatallpointsbelowthe90thpercentile.Thisillustratesclearlythatwithoutthe‘automaticstabilisers’oflowertaxbillsandhigherbenefitandtaxcreditpayments,incomeswouldhavefallenduringthisperiod.Second,thedirectimpactofthetaxandbenefitsystemonincomeswastoreversetheeffectoftherecessiononinequality.Inequalityinprivateincomesincreasedsignificantlybetween2007–08and2009–10:whileprivateincomeatthe90thpercentileremainedunchanged,privateincomesfellby3.9%atthemedianand9.2%atthe25thpercentile.Incontrast,inequalityactuallyfellamongthebottomhalfofthenetincomedistribution:netincomesrosebyaround3.5%atthe25thpercentile,comparedwith1.3%atthemedian(thefigureforthe75thpercentilewasalso1.3%).Incontrast,changesinprivateandnetincomesbetween2009–10and2011–12werebroadlysimilar.Thecumulativefallinmedianprivateincomewas6.3%,comparedwiththe5.8%fallinmediannetincome.Meanprivateincomefellby7.4%,comparedwiththe7.2%fallinmeannetincome.Inbothcases,thefallsinincomeweresomewhatlargertowardsthetopofthedistributionthanatthebottom;atthe90thpercentile,privateincomesfellby8.1%andnetincomesby7.6%,whilstatthe30thpercentile,privateincomesfellby5.3%andnetincomesby4.7%.
-12%
-10%
-8%
-6%
-4%
-2%
0%
2%
4%
25 30 35 40 45 50 55 60 65 70 75 80 85 90 95
Cum
ulativeinco
mega
in
Percentile
2007–08 to 2009–10, net income 2007–08 to 2009–10, private income
2009–10 to 2011–12, net income 2009–10 to 2011–12, private income

Living standards, poverty and inequality: 2013
48
3.4 Prospects for income inequalityFallsinincomeinequalitysincetherecessioncanbelargelyexplainedbytwofactors–fallingrealwagesandincreasedincomesfrombenefitsandtaxcredits.Astheeconomyrecovers,realearningsgrowthwillreturn.Asthegovernmentcontinuestoreducewelfarespending,incomesfrombenefitsandtaxcreditswillfall.Thereductioninincomeinequalityasaresultoftherecessionisthereforelikelytobeatemporaryratherthanpermanentphenomenon.QuitehowtemporarythefallinincomeinequalityislikelytobeisillustratedinFigure3.16,takenfromBrewer,Browne,Hood,JoyceandSibieta(2013).Theysimulatechangesinincomeacrossthedistributionupto2015–16basedonmacroeconomicforecastsfromtheOBRandtakingintoaccountplannedchangestothedirecttaxandbenefitsystem.Strikingly,theprojectedchangesinincomebetween2007–08and2015–16aresimilaracrossthedistribution.Thisimpliesthatinequalitywillbeatalmostthesamelevelin2015–16asitwasin2007–08;inotherwords,thatmostofthefallininequalityseeninthelastfouryearswillbereversedinthenextfouryears.Indeed,thefigureshowsapatternofincomegrowthbetween2011–12and2015–16thatwouldbestronglyinequality-increasing:incomesareprojectedtofallby4.5%atthe10thpercentileandbyonly1.1%atthemedian,andtoriseby0.9%atthe90thpercentile.Whatisdrivingthisprojectedincreaseinincomeinequalitybetween2011–12and2015–16?Partoftheexplanationischangesinearnings.ThelatestforecastsfromtheOBRsuggestearningswillcontinuetofallinrealtermsthroughout2012–13and2013–Figure 3.16. Projected real net income growth by percentile point, 2007–08 to2015–16 (UK)
Note: Income growth at the top and bottom five percentile points is not shown due to uncertainty fromsampling and measurement error.Source: Brewer, Browne, Hood, Joyce and Sibieta, 2013.
-8%
-6%
-4%
-2%
0%
2%
5 10 15 20 25 30 35 40 45 50 55 60 65 70 75 80 85 90 95
Cum
ulativeinco
mega
in
Percentile
2007–08 to 2011–12 2011–12 to 2015–16 2007–08 to 2015–16
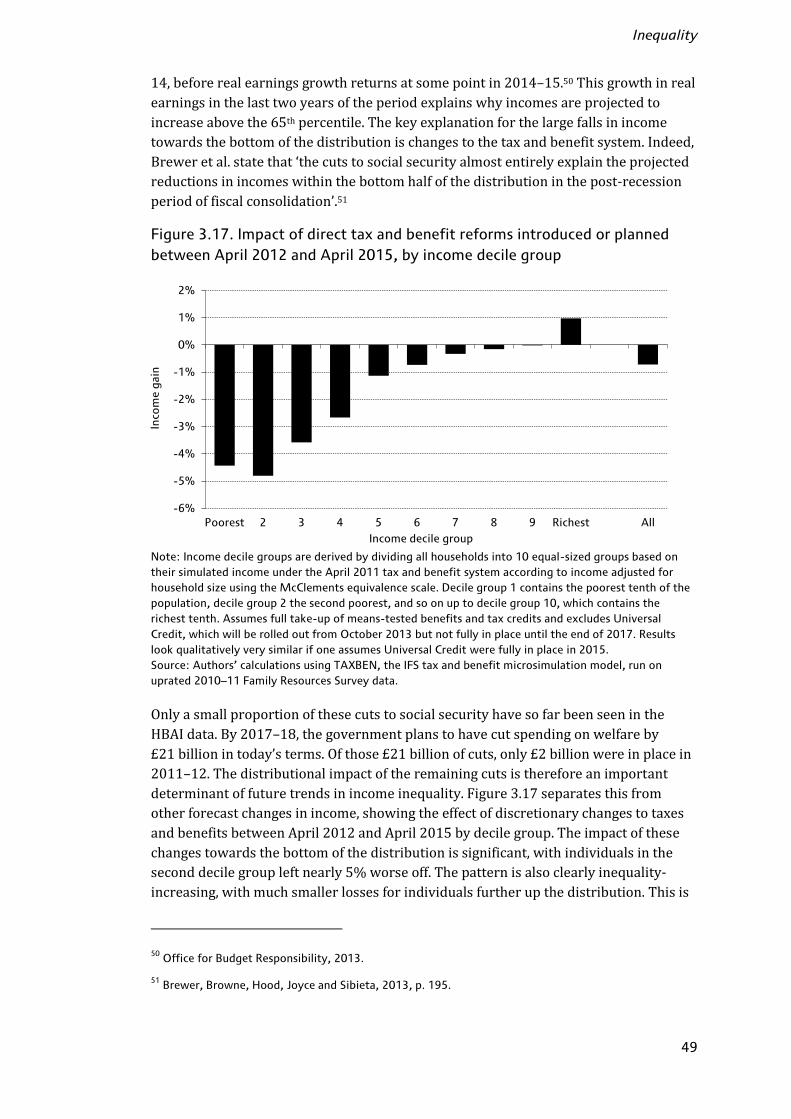
Inequality
49
14,beforerealearningsgrowthreturnsatsomepointin2014–15.50Thisgrowthinrealearningsinthelasttwoyearsoftheperiodexplainswhyincomesareprojectedtoincreaseabovethe65thpercentile.Thekeyexplanationforthelargefallsinincometowardsthebottomofthedistributionischangestothetaxandbenefitsystem.Indeed,Breweretal.statethat‘thecutstosocialsecurityalmostentirelyexplaintheprojectedreductionsinincomeswithinthebottomhalfofthedistributioninthepost-recessionperiodoffiscalconsolidation’.51Figure 3.17. Impact of direct tax and benefit reforms introduced or plannedbetween April 2012 and April 2015, by income decile group
Note: Income decile groups are derived by dividing all households into 10 equal-sized groups based ontheir simulated income under the April 2011 tax and benefit system according to income adjusted forhousehold size using the McClements equivalence scale. Decile group 1 contains the poorest tenth of thepopulation, decile group 2 the second poorest, and so on up to decile group 10, which contains therichest tenth. Assumes full take-up of means-tested benefits and tax credits and excludes UniversalCredit, which will be rolled out from October 2013 but not fully in place until the end of 2017. Resultslook qualitatively very similar if one assumes Universal Credit were fully in place in 2015.Source: Authors’ calculations using TAXBEN, the IFS tax and benefit microsimulation model, run onuprated 2010–11 Family Resources Survey data.OnlyasmallproportionofthesecutstosocialsecurityhavesofarbeenseenintheHBAIdata.By2017–18,thegovernmentplanstohavecutspendingonwelfareby£21billionintoday’sterms.Ofthose£21billionofcuts,only£2billionwereinplacein2011–12.Thedistributionalimpactoftheremainingcutsisthereforeanimportantdeterminantoffuturetrendsinincomeinequality.Figure3.17separatesthisfromotherforecastchangesinincome,showingtheeffectofdiscretionarychangestotaxesandbenefitsbetweenApril2012andApril2015bydecilegroup.Theimpactofthesechangestowardsthebottomofthedistributionissignificant,withindividualsintheseconddecilegroupleftnearly5%worseoff.Thepatternisalsoclearlyinequality-increasing,withmuchsmallerlossesforindividualsfurtherupthedistribution.Thisis50 Office for Budget Responsibility, 2013.
51 Brewer, Browne, Hood, Joyce and Sibieta, 2013, p. 195.
-6%
-5%
-4%
-3%
-2%
-1%
0%
1%
2%
Poorest 2 3 4 5 6 7 8 9 Richest All
Inco
mega
in
Income decile group

Living standards, poverty and inequality: 2013
50
unsurprisinggiventhemagnitudeofwelfarecuts,andthefactthathouseholdstowardsthebottomofthedistributionrelyonbenefitsandtaxcreditsforalargerproportionoftheirincome.Atthetopoftheincomedistribution,thereductionintheadditionalrateofincometaxfrom50%to45%inApril2013actstoincreaseincomesinthetopdecilegroup.ItisimportanttonotethatFigure3.17capturestheimpactonhouseholdincomes,notgovernmentrevenues–evenifthelowerrateoftaxraisesthesameamountofrevenuebecauseindividualsrespondandworkharderorengageinlessavoidanceandevasion,thehouseholdsaffectedwillbebetteroff.AsdiscussedinSection3.2,theimpactofchangestothetoprateofincometaxonthetimingofincomerealisationamongpeoplewithhighincomesoverthenextfewyearsmakesitparticularlydifficulttopredictfuturetrendsinmeasuresofincomeinequalitythataresensitivetochangesattheextremesoftheincomedistribution.However,thecombinationofstrongergrowthinrealwages(albeitstillnegativein2012–13and2013–14)andthefallsinincomefrombenefitsandtaxcreditsresultingfromthefiscalconsolidationisverylikelytoresultinrisingunderlyingincomeinequalityoverthenextfewyears.Itisentirelypossiblethatby2015–16incomeinequalitywillhavereturnedtoitspre-recessionlevel.3.5 ConclusionThelargefallsinincomesin2011–12wererelativelyevenlyspreadacrossthedistribution,leavingsummarymeasuresofinequalitybroadlyunchanged.However,thecumulativechangestoincomessincetherecessionhaveservedtoreduceinequality;in2011–12,realincomeatthe10thpercentilewashigherthanin2007–08,whilerealincomeatthe90thpercentilewassubstantiallylower.Inequalityhasfallenrightacrosstheincomedistribution,notjustasaresultofthelargefallsinincomesattheverytop.OnlyathirdofthefallintheGinicoefficientsince2007–08canbeexplainedbythefallingincomesofthetop1%–theremainingtwo-thirdsisdowntolowerinequalityamongthe99%.Investigatingthecausesofthesefallsinincomeinequalityuncoversamorecomplexpictureofchangesininequalityinrecentyears.Earningsinequalityactuallyincreasedbetween2007–08and2011–12;realearningsfellforeveryone,butlowearnerssawtheirpayfallbymore(inpercentageterms).Unlikethelargerisesinincomeinequalityseeninthe1980s,therecentfallsdonotreflectchangesintheindividualearningsdistribution.Instead,theyaretheproductoftwokeyfactors.First,fallingrealearningsreducedtheincomesofhouseholdstowardsthetopoftheincomedistribution.Thesefallsinrealearningshavebeensubstantialandwidespread,withearningsfrozenincashtermsfrom2009–10to2011–12acrossthemiddleoftheearningsdistribution.Second,largeincreasesinincomefrombenefitsandtaxcreditsbetween2007–08and2009–10supportedtheincomesofhouseholdstowardsthebottomofthedistribution.Giventhatitwastheserecession-specificfactorswhichdrovetherecentfallsinincomeinequality,thosefallsarelikelytoprovetemporary.The£21billionofwelfarecutsplannedaspartofthefiscalconsolidationwillreduceincomestowardsthebottomofthedistribution,wherebenefitsandtaxcreditsmakeupalargershareofhouseholdincomes.Thereturntorealearningsgrowthshouldleadtostrongerincomegrowth

Inequality
51
towardsthetopofthedistribution,althoughchangesattheverytopwillcontinuetoreflectthetax-inducedshiftingofincomebetweenyearsuntilatleast2013–14.Asaresult,itseemslikelythatthenextfewyearswillseeincomeinequalityreturntopre-recessionlevels.

52
© Institute for Fiscal Studies
4. Income Poverty
Key findings
The number of individuals in relative poverty was unchanged in 2011–12, at13.0 million or 21.1% of the population on an after-housing-costs (AHC) basis and9.8 million or 15.9% of the population on a before-housing-costs (BHC) basis.Measuring incomes AHC, this puts relative poverty at a level a little above that in2004–05, but statistically significantly below its level in 2007–08, just prior to therecession. Measuring incomes BHC, relative poverty remains at its lowest levelsince 1986.
2011–12 followed three years during which relative poverty fell substantially. Thismeans relative poverty in 2011–12 was 0.4 million (1.4 percentage points) loweron an AHC basis and 1.2 million (2.4 percentage points) lower on a BHC basis thanin 2007–08, the last year prior to the recent recession.
However, the trends in poverty since 2007–08 have not been the same fordifferent parts of the population. Relative pensioner poverty has fallen to itslowest level since records began in 1961, driven by robust growth in income fromstate pensions and benefits. Indeed, pensioner poverty has fallen by over a quartersince before the recession.
Relative child poverty has also fallen substantially, driven by falling rates ofpoverty among lone parents and couples with children who have no one in work oronly part-time workers. Despite difficult labour market conditions, there has beena small fall in the number of children living in workless households and an increasein those living with two working parents.
Poverty among working-age adults without children increased, driven largely by afall in employment among single adults and an increase in the rate of povertyamong one-earner couples.
In contrast to the picture for relative poverty, falling real incomes in 2010–11 and2011–12 mean that absolute poverty was 1.5 million (1.8 percentage points)higher in 2011–12 than in 2007–08 on an AHC basis. Relative poverty has fallennot because the incomes of poor households have grown relatively faster thanmedian income, but because their incomes have fallen relatively less. MeasuredBHC, absolute poverty has increased by 0.3 million, with falls in absolute povertyamong children (0.2 million) and pensioners (0.3 million) just more than offset byrises among working-age adults (0.8 million).
The majority of poor working-age adults and children live in families containing atleast one worker. Poverty is higher among those working in sectors andoccupations associated with low hours of work and low hourly pay than amongthose working in other parts of the economy. This is particularly the case wheretheir earnings are the main source of earnings for their household. Analysissuggests that it is low hourly wages rather than low hours of work that are moststrongly linked to being in poverty, although unsurprisingly those working fewhours for a low wage have the highest rates of poverty.
Income poverty
53
Looking to the future, both absolute and relative poverty among children andworking-age adults look set to increase, in large part due to cuts in benefits andtax credits being implemented as part of the fiscal consolidation. The supposedlybinding target of ‘eradicating’ child poverty by 2020 will not be achieved.
Pensioners, who are protected from most of the benefit cuts, are likely to continueto fare rather better than children and the working-age population in the comingyears.Inthischapter,wesummariserecenttrendsinincomepoverty.InChapter6,weplacethesechangesinthecontextoflonger-runchangesinthepatternsofpovertyacrossthepopulation.Webeginwithabriefdiscussionoftheapproachtomeasuringpoverty.InSection4.1,weanalyserecentchangesinrelativeincomepovertybothforthepopulationasawholeandforseparatesubgroupsofthepopulation(pensioners,working-ageadultswithoutchildren,andchildren),whileSection4.2examineswhathashappenedtoabsoluteincomepoverty.Section4.3lookstothefutureandbrieflyoutlinestheprospectsforincomepovertyinthenextfewyears.Section4.4concludes.Throughoutthischapter,wefocusalmostentirelyonindicatorsofincome-basedpoverty.Householdincomeisclearlyinstrumentalindeterminingthemateriallivingstandardsthatcanbeenjoyedbydifferentmembersofsociety.TheHBAIdataareuniqueinbeingabletoprovideadetailedpictureoftheincomesavailabletodifferentindividualsovertheUK,andcandosooveralongtimeframe.However,snapshotmeasuresofincomehavelimitationsasaproxyformateriallivingstandards,andthereareotherindicatorsandwidernotionsofhardshipthatonecouldconsider.Theseincludematerialdeprivation52(AppendixDdiscussesrecentchangesinmaterialdeprivationandcomparesthemwithchangesinincomepoverty)andadequacy.53AbroaderconceptofdeprivationhasbecomemoreprominentastheChildPovertyStrategyhasintroducedadditionalmeasurescoveringareassuchashealth,education,crimeandemployment.Anumberofmeta-analysesalsoperiodicallymonitorawiderviewofwell-beingbycombiningtheHBAIstatisticswithotheraspectsoflowincomeanddeprivation.54Nevertheless,thenumberofindividualswithlowincomesisstilllikelytobeagoodmeasureoftheprevalenceofmaterialhardship.Butdefining‘lowincome’isnottrivial,andthereiscertainlynosinglerightanswer.Themainmeasureofpovertythatwediscussinthischaptercountsthenumberofindividualswhosehouseholdincomeisbelow60%ofthatofthemedianindividual(thepersoninthemiddleofthehouseholdincomedistribution).Thishasbeenthemostwidely-usedmeasureofpovertyintheUKandisoneoftheindicatorsthatisusedtomeasureprogressagainstthegovernment’s
52 See Gordon et al. (2000), Berthoud, Bryan and Bardasi (2004), McKay (2004) and Brewer, O’Dea, Paulland Sibieta (2009).
53 See Bradshaw et al. (2008) and Davis et al. (2012).
54 See Aldridge et al. (2012).

Living standards, poverty and inequality: 2013
54
commitmentsto‘eradicate’childpovertyby2020–21underthe2010ChildPovertyAct.Thisindicatorisa‘relative’measureofpoverty,becausethepovertylinemoveswithmedianincomeeachyear.ThisdefinitionofpovertyasarelativeconceptisincommonwiththoseusedinmostoftherestofEuropebutcontrastswith,forexample,theofficialmeasureofpovertyusedbytheUSCensusBureau,whichwasinitiallybasedontheincomerequiredtopurchaseafixedbasketoffooditemsandhassincebeenupratedinlinewithpricechanges.Thelatterrepresentsan‘absolute’measureofpoverty–notbecauseitnecessarilymeasuresamoreseverestateofpovertythanrelativepoverty,butbecausethepovertylineremainsfixedinrealtermsanddoesnotmovewhentherearechangesinaverageincomes.Todocumenttrendsinabsolutepoverty,wealsoreportthenumberofpeoplelivinginhouseholdswithincomebelow60%ofthemedianindividual’sincomeasfixed(inrealterms)in2010–11,whichisusedasthedefinitionofabsolutepovertyinthegovernment’sChildPovertyStrategy.FiguresinthischapterarepresentedforGreatBritainonlyuptoandincluding2001–02andforthewholeUKfrom2002–03(i.e.largelythesamewayastheyarepresentedinDWP’sHBAIpublication).55Duetothisbreakintheseries,andbecausethesizeofpopulationscanchangeovertime,whenlookingatlonger-runpovertytrendswewillfocusonthefractionofindividualswhoareinpovertyratherthanthenumberofindividuals.Nevertheless,mostofthefollowingtablespresentboththenumberofpeoplewhoarepoorandthepercentageoftherelevantpopulationthatthisnumberrepresents.Wealsoreportestimatesofwhetherchangesinpovertyarestatisticallysignificant.Povertyratescanbemeasuredusingincomesmeasuredbeforehousingcosts(BHC)orafterhousingcosts(AHC),56andwepresentboth.Thegovernmentreportsthenumberofindividualsroundedtothenearest100,000,andlikewiseroundschangesinthenumbertothenearest100,000.Forconsistencyandeaseofcomparison,wealsousethisconvention.57Thegovernmentreportspovertyratesroundedtothenearestfullpercentagepoint.Herewedepartfromitsmethodologyandroundpercentagestothenearesttenth(0.1)ofapercent.Thisallowsustobemorepreciseandtoreportsmallerchangesintheproportionofpeopleinpovertythanthegovernment,althoughverysmallchangesareusuallynotstatisticallysignificant.55 The size of the discontinuity caused by the inclusion of Northern Ireland is small: using a UK-widepoverty line, the risk of poverty (BHC) in 2011–12 in the UK was 15.9% measuring incomes BHC, thesame as in Great Britain. Northern Ireland makes only a small difference to poverty rates primarilybecause only 3.0% of individuals in the UK live in Northern Ireland. Some headline indicators arepresented on a UK basis in HBAI back to 1998–99, with data imputed for Northern Ireland between 1998–99 and 2001–02 inclusive.
56 See Appendix A.
57 This can sometimes lead to numbers that can be confusing and difficult to interpret. For example, usingthe unrounded numbers, there were 10,796,453 people in poverty measured BHC in 1998–99 and10,748,780 in 1999–2000. Rounded to the nearest 100,000, these would be 10.8 million and 10.7million, respectively. Rounded to the nearest 100,000, the change in the number of people in povertymeasured BHC between the two years (47,673) is zero, however. The level of poverty has fallen but thechange in poverty was zero. To avoid confusion, we highlight other such examples as they arise.

Income poverty
55
4.1 Relative income povertyIntheUKin2011–12,therewere9.8millionindividuals(15.9%ofthepopulation)inrelativepovertymeasuringincomesbeforehousingcostsand13.0million(21.1%)measuringthemafterhousingcosts,usingapovertylineequalto60%ofmedianincome.Between2010–11and2011–12,povertywasunchangedintermsofabsolutenumbersonbothaBHCandAHCbasis.Asapercentageofthepopulation,AHCpovertywas0.1percentagepointslower,andBHCpoverty0.2percentagepointslower,thanin2010–11,althoughneitherchangewasstatisticallysignificant.Thisfollowsonfromthreeyearsoffallingrelativepovertylevelssincetheonsetofthefinancialcrisisin2007.Asaresult,relativeincomepoverty(BHC)hasfallenfrom18.3%to15.9%between2007–08and2011–12,afallof1.2millionpeople.MeasuringincomesAHC,thefallissmaller,from22.5%to21.1%or0.4millionpeople.SorelativepovertyintheUKhasfallensignificantlyduringtheyearsofthe‘GreatRecession’anditsimmediateaftermath.Toputthisinhistoricalcontext,Figure4.1showsrelativepovertyratesinGreatBritain(GB)between1979and2001–02andintheUKfrom2002–03onwards,measuringincomesAHC(Figure4.1a)andBHC(Figure4.1b)andusingarangeofpovertylines.(Notethattherestofthischapterwillfocusmostlyonrelativepovertylinesdefinedas60%ofmedianincome.)OnecanseefromthesegraphsthatpovertyratesmeasuredAHCtendtobehigherthanthosemeasuredBHC,becausethoseonlowincomestendtospendagreaterproportionoftheirincomeonhousingthanthoseonhigherincomes.Povertyratesincreaseddramaticallyduringthemid-tolate1980s,beforestabilisingandthenfallingduringthe1990sandearly2000s.ThelastLabourgovernmenthadhigh-profiletargetstoreducechildpovertyandalsoincreasedstatesupportforpensionersinanefforttoreducepensionerpoverty.Intheperiodbetween1996–97(justbeforeLabourcametopower)and2004–05,thepovertyratefellbyatotalof4.7percentagepoints(AHC)andby2.4percentagepoints(BHC).Theperiodsince2004–05firstsawrelativeincomepovertyincreaseforthreeconsecutiveyears,thendecreaseforthreeconsecutiveyearsastheincomesofpoorerhouseholdsheldupbetterthanmedianincomeduringtherecessionofthelate2000sanditsaftermath.Withrelativeincomepovertyholdingsteadyin2011–12,measuredBHC,relativepovertyin2011–12wasatitslowestlevelsince1986;measuredAHC,however,itremainedaboveitslevelof2004–05(thoughthatyearalsorepresentedthelowestratesince1986).Overallrelativepovertyisnowatsimilarlevelstothoselastseeninthemid-1980s.Figures4.1aand4.1balsoallowustoseewhethertheselargefallsinpovertyoccurredusingalternativepovertylines.MeasuringpovertyBHCandAHCusingapovertylineof50%or70%ofmedianincome,theconclusionsarebroadlysimilar:althoughthefallsinrelativepovertysince2007–08havebeensmallerthanforthe60%-of-medianpovertyline,theyalsoreducerelativepovertytoalevellastseeninthemid-1980s.

Living standards, poverty and inequality: 2013
56
Figure 4.1a. Relative poverty: percentage of individuals in households withincomes below various fractions of median income (AHC)
Figure 4.1b. Relative poverty: percentage of individuals in households withincomes below various fractions of median income (BHC)
Note: Figures are presented for GB up until 2001–02 and then for the whole of the UK from 2002–03onwards. Years refer to calendar years up to and including 1992, and financial years thereafter.Source: Authors’ calculations based on Family Expenditure Survey and Family Resources Survey, variousyears.Measuringpovertyasthefractionofindividualswithincomeslessthan40%ofthemedianshowsadifferentpattern:povertyremainsnearitshistorichigh(especiallyonanAHCbasis)andatsimilarlevelstothelast20years.However,thepeoplewiththelowestincomesarenotnecessarilythosewiththelowestlivingstandards,andthe40%-of-medianpovertylineisunlikelytobeagoodwayofmeasuring‘severepoverty’,duetosomecombinationofmeasurementerrorinthelowestrecordedincomesand
0%
5%
10%
15%
20%
25%
30%
35%
70% of AHC median 60% of AHC median
50% of AHC median 40% of AHC median
0%
5%
10%
15%
20%
25%
30%
35%
70% of BHC median 60% of BHC median
50% of BHC median 40% of BHC median

Income poverty
57
thefactthatsomeindividualshaveverylowincomesonlytemporarily.58Forexample,childrenwhosehouseholdincomeislessthan40%ofthemedianareonaveragelessmateriallydeprivedthanthosewhosehouseholdincomeisbetween40%and60%ofthemedian.Thegovernmenthasnomeasureof‘severepoverty’forthepopulationasawholebuthasstatedthatchildrenwillbeconsideredtobeseverelypooriftheyliveinahouseholdwithincomelessthan50%ofthemedianandaremateriallydeprived.59Wenowturntoexaminehowpovertyhaschangedfordifferentsubgroupsofthepopulationinrecentyears.Relative income poverty among different groupsThissubsectionexaminespovertyamongstpensioners,childrenandworking-ageadultswithoutchildren.Therearegoodreasonstoexpectdifferentialtrendsinpovertyamongstthesegroupsintherecentpast,andinthefuture.PensionersweregenerallybeneficiariesoftaxandbenefitreformsunderthelastLabourgovernmentandhavebeenrelativelyprotectedfrombenefitcutsunderthecoalitiongovernment.Low-incomefamilieswithchildrenweregenerallybeneficiariesoftaxandbenefitreformsunderthelastLabourgovernmentbuthavebeen–orwillbe–hitrelativelyhardbybenefitcutsunderthecoalitiongovernment.Working-ageadultswithoutdependentchildrenwerenotfavouredbybenefitandtaxcreditreformsundereitherthelastLabourgovernmentorthecurrentcoalitiongovernment.60Tables4.1and4.2containdetailedinformationonrelativepoverty,usinga60%-of-medianpovertyline,since1996–97forthepopulationasawhole(thelastpairofcolumns)andforvarioussubgroups(theothercolumns).LookingatthelatestfiguresindetailandusingincomesmeasuredAHC,thenumberofpensionersinpovertyfellby100,000(0.7percentagepoints)andthenumberofworking-ageparentsinpovertyalsofell100,000(downby0.8percentagepoints)in2011–12.Thenumberofchildreninpovertywasunchanged(butdown0.2percentagepoints).Thesechangesarenotstatisticallysignificant.Ontheotherhand,relativepovertyamongworking-ageadultswithoutchildrenincreasedby200,000(0.6percentagepoints)toreach4.7million(20.2%),which,althoughnotastatisticallysignificantchange,bringspovertyforthispartofthepopulationtoitshighestlevelsinceconsistentdatabeganin1961.UsingincomesmeasuredBHC,theconclusionsreachedaresimilar.Again,thereweresmallmeasuredfallsinpovertyforpensionersandworking-ageparentsin2011–12,butthechangeswerenotstatisticallysignificant.Theincreaseinpovertyamongworking-ageadultswithoutchildren(200,000,or0.6percentagepoints)was58 For a more detailed consideration of these issues, see Brewer, Phillips and Sibieta (2010).
59 HM Government, 2011a.
60 We use the shorthand ‘working-age adults without children’ or ‘working-age non-parents’ to refer to‘working-age adults without dependent children’.

Living standards, poverty and inequality: 2013
58
Table 4.1. Relative poverty: percentage and number of individuals inhouseholds with incomes below 60% of median AHC income
Children Pensioners Working-ageparents
Working-agenon-parents
All
% Million % Million % Million % Million % Million
1996–97 (GB) 34.1 4.3 29.1 2.9 26.6 3.3 17.2 3.5 25.3 14.0
1997–98 (GB) 33.2 4.2 29.1 2.9 25.9 3.2 15.9 3.3 24.4 13.6
1998–99 (GB) 33.9 4.3 28.6 2.9 26.3 3.2 15.5 3.2 24.4 13.6
1999–00 (GB) 32.7 4.2 27.6 2.8 25.5 3.1 16.2 3.4 24.0 13.5
2000–01 (GB) 31.1 3.9 25.9 2.6 24.7 3.0 16.2 3.4 23.1 13.0
2001–02 (GB) 30.8 3.9 25.6 2.6 24.5 3.0 15.6 3.4 22.7 12.8
2002–03 (UK) 29.8 3.9 24.2 2.5 24.1 3.0 16.5 3.7 22.4 13.1
2003–04 (UK) 28.7 3.7 20.6 2.2 23.5 2.9 16.6 3.7 21.5 12.6
2004–05 (UK) 28.4 3.6 17.6 1.9 23.0 2.9 16.1 3.6 20.5 12.1
2005–06 (UK) 29.8 3.8 17.0 1.8 24.9 3.1 17.6 4.0 21.7 12.8
2006–07 (UK) 30.5 3.9 18.9 2.1 25.2 3.2 17.6 4.0 22.2 13.2
2007–08 (UK) 31.1 4.0 18.1 2.0 25.6 3.3 18.1 4.2 22.5 13.5
2008–09 (UK) 30.3 3.9 15.9 1.8 25.7 3.4 19.2 4.4 22.3 13.5
2009–10 (UK) 29.1 3.8 15.4 1.8 25.4 3.4 19.9 4.5 22.2 13.5
2010–11 (UK) 27.3 3.6 14.2 1.7 24.3 3.3 19.7 4.5 21.3 13.0
2011–12 (UK) 27.0 3.5 13.5 1.6 23.5 3.2 20.2 4.7 21.1 13.0
Changes1996–97 to 2004–05 –5.7 –11.5 –3.5 –1.1 –4.72004–05 to 2007–08 2.7 0.3 (0.5) (0.1) 2.6 0.4 2.0 0.5 2.0 1.42007–08 to 2011–12 –4.0 –0.4 –4.6 –0.4 –2.1 (–0.1) 2.1 0.5 –1.4 –0.42010–11 to 2011–12 (–0.2) (–0.0) (–0.7) (–0.1) (–0.8) (–0.1) (0.6) (0.2) (–0.1) (0.0)Note: Reported changes may not equal the differences between the corresponding numbers due torounding. Changes in parentheses are not significantly different from zero at the 5% level. Because of thediscontinuity in the series due to the inclusion of Northern Ireland from 2002–03, changes in the numberof people in poverty since before 2002–03 are not available. However, due to Northern Ireland’s smallpopulation and similar poverty rates, the changes in poverty rates reported should be accurate. All figuresare presented using DWP’s AHC variant of the modified OECD equivalence scale.Source: Authors’ calculations based on Family Resources Survey, various years.statisticallysignificantintermsofnumbers,andbroughtpovertyforthispartofthepopulationtoitshighestlevelsinceconsistentdatabeganin1961.Therefore,onbothanAHCandaBHCbasis,acrossthepopulationasawhole,relativepovertywaslargelystablein2011–12:fallsinpovertyamongstpensionersandworking-ageadultswithchildrenin2011–12werelargelyoffsetbyrisesinpovertyamongstworking-ageadultswithoutchildren.Tables4.1and4.2alsoshowthattherehavebeenthreedistinctperiodsintermsofchangesinpovertysince1996–97.From1996–97to2004–05,thepovertyratefellby4.7percentagepointsmeasuredAHCor2.4percentagepointsmeasuredBHC,withstrongfallsinchildandpensionerpoverty.Povertyamongstworking-ageadultswithoutdependentchildrendidnotfallinthesameway;therewasasmallfall

Income poverty
59
Table 4.2. Relative poverty: percentage and number of individuals inhouseholds with incomes below 60% of median BHC income
Children Pensioners Working-ageparents
Working-agenon-parents
All
% Million % Million % Million % Million % Million
1996–97 (GB) 26.7 3.4 24.6 2.4 20.2 2.5 12.0 2.5 19.4 10.8
1997–98 (GB) 26.9 3.4 25.3 2.5 20.4 2.5 11.9 2.5 19.6 10.9
1998–99 (GB) 26.0 3.3 26.8 2.7 19.6 2.4 11.5 2.4 19.3 10.8
1999–00 (GB) 25.6 3.3 25.1 2.5 19.8 2.4 12.1 2.6 19.2 10.7
2000–01 (GB) 23.3 3.0 24.8 2.5 18.1 2.2 12.8 2.7 18.4 10.4
2001–02 (GB) 23.1 2.9 25.1 2.5 18.3 2.2 12.5 2.7 18.4 10.4
2002–03 (UK) 22.6 2.9 24.4 2.5 18.0 2.2 12.7 2.8 18.1 10.6
2003–04 (UK) 22.1 2.9 22.9 2.4 17.9 2.2 12.8 2.9 17.8 10.4
2004–05 (UK) 21.3 2.7 21.3 2.3 16.9 2.1 12.6 2.9 17.0 10.0
2005–06 (UK) 22.0 2.8 20.8 2.2 18.2 2.3 13.4 3.1 17.6 10.4
2006–07 (UK) 22.3 2.9 23.2 2.5 17.9 2.3 13.2 3.0 18.0 10.7
2007–08 (UK) 22.5 2.9 22.7 2.5 18.1 2.3 14.0 3.2 18.3 11.0
2008–09 (UK) 21.8 2.8 20.1 2.3 18.2 2.4 14.7 3.4 18.0 10.8
2009–10 (UK) 19.7 2.6 18.1 2.1 17.1 2.3 15.0 3.4 17.0 10.3
2010–11 (UK) 17.5 2.3 17.5 2.0 16.0 2.2 14.6 3.3 16.1 9.8
2011–12 (UK) 17.4 2.3 16.4 1.9 15.3 2.1 15.2 3.5 15.9 9.8
Changes1996–97 to 2004–05 –5.4 –3.4 –3.2 (0.6) –2.42004–05 to 2007–08 (1.2) (0.2) 1.4 0.2 (1.2) 0.2 1.4 0.4 1.3 1.02007–08 to 2011–12 –5.1 –0.6 –6.3 –0.6 –2.9 (–0.2) 1.2 0.3 –2.4 –1.22010–11 to 2011–12 (–0.1) (–0.0) (–1.1) (–0.1) (–0.7) (–0.1) (0.6) 0.2 (–0.2) (–0.0)
Note: Reported changes may not equal the differences between the corresponding numbers due torounding. Changes in parentheses are not significantly different from zero at the 5% level. Because of thediscontinuity in the series due to the inclusion of Northern Ireland from 2002–03, changes in the numberof people in poverty since before 2002–03 are not available. However, due to Northern Ireland’s smallpopulation and similar poverty rates, the changes in poverty rates reported should be accurate. All figuresare presented using the modified OECD equivalence scale.Source: Authors’ calculations based on Family Resources Survey, various years.measuredAHCandactuallyasmallrisemeasuredBHC.Thesecondperiodwasfrom2004–05to2007–08,whentherewererisesinpovertyforallgroups,withtheoverallpovertyraterisingby1.4million(2.0percentagepoints)measuredAHCand1.0million(1.3percentagepoints)measuredBHC.Thethirddistinctperiodisfrom2007–08uptoandincluding2011–12,themostrecentyearofdataavailable.Povertyamongstpensionersfellfrom18.1%to13.5%onanAHCbasis(or22.7%to16.4%onaBHCbasis),thelowestlevelssinceconsistentdatabeganin1961.Althoughchildpovertywasstablein2011–12,thiscameontopoflargefallsduringthepreviousthreeyears,suchthatchildpovertyfellfrom31.1%to27.0%onanAHCbasis(22.5%to17.4%onaBHCbasis).However,povertyamongstworking-ageadultswithoutchildrenincreasedfrom18.1%to20.2%onanAHCbasis(14.0%to15.2%onaBHCbasis)toreachthehighestlevelsinceourdatabeginin1961.

Living standards, poverty and inequality: 2013
60
However,inthetwomostrecentyearsofdata(2010–11and2011–12),theincomesofthepoorhavefalleninabsoluteterms(seeChapter3ofthisreport).Thefallsinrelativepovertyinthesetwoyearsaredrivenbythefactthatlow-incomehouseholdssawtheirincomesfallbylessthanmedianincome.Weshallreturntothisissuewhenexaminingabsolutepovertyinthenextsection.Beforelookingatrelativepovertyamongsteachofthegroupsinmoredetail,weexaminehowchangesinbenefitratesmayhaveimpacteduponpovertyinrecentyears.61Table4.3showsyear-on-yeargrowthratesincash-termsentitlementstobenefitsandtaxcreditsforsomekeyfamilytypeslikelytobeinorclosetopoverty.Forexample,asinglepensionerwithsufficientNationalInsurance(NI)creditscouldclaim£97.65perweekinbasicstatepensionin2010–11and£102.15perweekin2011–12.62Thisisanannualincreaseof£4.50perweekor4.6%,asshownintherelevantcellinTable4.3.Thetablealsocompareschangesinnominalentitlementswiththeyear-on-yearchangesintherelativepovertyline(incashterms)andinprices.Numbersinboldmarkinstanceswhereentitlementstobenefitsandtaxcreditsgrewbymorethaninflation(asmeasuredbytheRPI–whichisapproximatelyequaltothepriceindexusedtodeflateBHCincomesandtoupratetheBHCabsolutepovertylineintheHBAIseries63–andtheRossiindex,whichisusedtodeflateAHCincomesandtoupratetheAHCabsolutepovertylineintheHBAIseries).64ShadedcellsmarkinstanceswhereNoteandsourcetoTable4.3Note: The table shows annual changes in maximum entitlements to benefits for various family types withno private income (except the working lone parent, who is assumed to earn an amount that is below thepersonal income tax allowance and the primary threshold for National Insurance contributions) ignoringhousing benefit and council tax benefit and the value of free school meals for families with children. ‘RPI’and ‘Rossi’ measure changes since the previous year (or over the relevant period for the last two rows) inthe annual averages of the RPI all-items and the Rossi indices respectively. For 2013–14, these inflationmeasures are forecasts from the supplementary economic tables in Office for Budget Responsibility(2013). Values in bold are greater than both the change in RPI and the change in the Rossi index over thesame period; shaded cells are greater than the change in both the BHC and AHC relative poverty lines. RPIand Rossi are very similar, but not identical, to the measures of inflation used to adjust BHC and AHCincomes, respectively, when comparing HBAI incomes across years.Source: Authors’ calculations.
61 It should be noted that the family types shown are only examples and therefore are just illustrative ofthe changes in benefit incomes at the bottom of the income distribution.
62 In order to claim the full amount of basic state pension, a single pensioner needs to have paid sufficientamounts of NI contributions or to have received enough NI credits; or his/her late spouse/partner needsto have had an NI contribution record that satisfied these conditions. The pensioner may also get pensioncredit from the state if his/her income and savings are low enough.
63 The only difference between RPI inflation and the inflation rate used to deflate income BHC in HBAI isthat council tax payments are not included in the basket of goods used to construct the index used inHBAI, as they are deducted in HBAI.
64 Note that we use the RPI and the Rossi index here only because they are currently used to adjustincomes over time in the HBAI data. As discussed in Section 2.4 of this report, problems with the RPI andRossi formulae mean that there are good reasons to use different measures of inflation, such as the RPIJ,when assessing real-terms changes in incomes over time.

Table4.3.G
rowth
inno
minal
entitlem
ents
tostatesupp
ortforcertainfamily
type
s(%
)
Coup
le,
3child
ren,
nowork
Lone
paren
t,1child
,nowork
Lone
paren
t,1child
,part-time
work
Single
personon
jobseek
er’s
allowan
ce
Basicstate
pen
sion
(single)
Single
pen
sioner
entitled
tomea
ns-
tested
ben
efits
Coup
lepen
sioner
entitled
tomea
ns-
tested
ben
efits
Relative
pove
rty
line
(BHC)
Relative
pove
rty
line
(AHC)
RPI
Rossi
199
7–98
2.6
2.1
2.0
2.6
2.1
4.0
3.5
5.0
3.8
3.3
2.4
1998
–99
2.4
–3.8
–5.5
2.4
3.6
2.4
2.4
3.8
4.3
3.1
2.1
1999
–00
9.3
8.6
9.3
2.1
3.2
7.7
7.4
5.0
5.5
1.6
1.7
2000
–01
13.4
8.8
12.7
1.6
1.1
7.0
6.1
5.9
5.8
3.0
1.4
2001
–02
9.1
6.4
6.8
1.6
7.4
16.6
14.8
6.3
7.5
1.5
1.7
2002
–03
4.1
3.2
7.0
1.7
4.1
6.3
6.4
3.7
4.8
2.1
1.5
2003
–04
8.6
6.6
10.1
1.3
2.6
3.9
3.9
2.4
2.4
2.8
1.7
2004
–05
6.0
4.5
5.0
1.8
2.8
3.2
3.2
4.0
2.6
3.1
1.4
2005
–06
2.5
2.0
3.1
1.0
3.1
3.7
3.7
3.5
3.2
2.6
1.9
2006
–07
3.1
2.7
3.0
2.2
2.7
4.1
4.1
4.1
3.7
3.7
3.1
2007
–08
3.6
3.3
3.7
3.0
3.6
4.2
4.3
4.3
3.3
4.1
2.8
2008
–09
7.0
5.4
6.2
2.3
3.9
4.8
4.6
3.5
3.1
3.0
4.5
2009
–10
6.4
6.1
5.5
6.3
5.0
4.6
4.7
1.3
3.6
0.5
3.2
2010
–11
2.2
2.0
1.9
1.8
2.5
1.9
1.9
1.8
1.4
5.0
5.4
2011
–12
6.1
5.0
4.1
3.1
4.6
2.8
3.1
2.0
2.2
4.8
5.7
2012
–13
4.3
4.1
1.7
5.2
5.2
3.8
3.8
n/a
n/a
3.1
3.3
2013
–14
0.8
0.9
0.6
1.0
2.5
1.8
1.9
n/a
n/a
3.1
2.8
1996
–97to
2011
–12
130.1
84.0
105.0
40.9
67.0
110.6
105.1
74.1
74.9
54.4
49.1
2011
–12to
2013
–14
5.2
5.0
2.3
6.2
7.8
5.7
5.8
n/a
n/a
6.3
6.2

Living standards, poverty and inequality: 2013
62
entitlementstobenefitsandtaxcreditsgrewfasterthanboththeBHCandAHCpovertylines;consideredinisolation,thiswouldsuggestdecliningrelativepovertyratesforthatfamilytypeinthatyear.65Inconsideringthelivingstandardsofthepooresthouseholdsandthechangesinrelativepovertydiscussedabove,twokeypointsareworthnoting: GiventhattheBHCandAHCpovertylinesgrewbyjust2.0%and2.2%,respectively,incashtermsin2011–12,entitlementstobenefitsandtaxcreditsforalltheexamplefamiliesshownincreasedbymorethantherelativepovertylinesin2011–12. Ofthefamilytypesshown,onlythenon-workingcouplewiththreechildrensawtherealvalueoftheirentitlementstobenefitsandtaxcreditsincreasein2011–12(duetoabove-inflationincreasesinthechildelementofthechildtaxcredit).Therefore,themainincomesourceforpoorerhouseholds(benefitsandtaxcredits)fellinrealtermsin2011–12,butbylessthantherelativepovertyline(inotherwords,bylessthanmedianincome).Thisislikelytobeakeyreasonwhy,aswediscussinSection4.2,absolutepovertyrosein2011–12whereasrelativepovertydidnot.Indeed,onthebasisofchangesinmaximumbenefitentitlementsrelativetomedianincomes,itmayseemsurprisingthatrelativeincomepovertydidnotfallin2011–12,especiallyamongchildren(familieswithchildrensawsomeofthelargestincreasesinmaximumbenefitentitlement,duetoincreasesinthechildelementofthechildtaxcredit).Thisemphasisesthatchangesinpovertyaredrivenbythingsotherthanjustchangesinmaximumbenefitentitlements:otherchangestobenefitsmayplayarole,asmaychangesinearningsandotherprivateincome,andhouseholdstructures.Butchangesinmaximumbenefitentitlementshavestillbeenanimportantdriverofchangesinincomepovertyrates.Forinstance,lookingatalongertimeperiod,wenote: Pensionerswithlittleornoprivateincomeareentitledtopensioncredit.Since2000–01,thegrowthinentitlementstobenefitsforpensionerfamilieswithnoprivateincomehasexceededthegrowthintheAHCpovertylineineachyear(andineachyearexcept2004–05and2007–08fortheBHCpovertyline).Between2003–04and2010–11,thiswasbecauseentitlementstopensioncreditincreasedeachyearinlinewithaverageearnings,growthinwhichhastendedtobeabovethegrowthinmedianincome.Since2011–12,theguaranteecreditelementofpensioncredithasbeenincreasedbythesamecashamountasthestatepension,whichmeansithascontinuedtooutpacechangesinthepovertyline.Overall,entitlementsin2011–12wereup110.6%incashtermsforsinglepensionersand105.1%incashtermsforpensionercouplessince1996–97,comparedwithincreasesinpricesof65 Some of these benefits are designed only to cover non-housing costs, and so it might be moreappropriate to compare them with changes in the Rossi index or growth in the AHC poverty line. Forexample, growth in the rate of jobseeker’s allowance for a single adult exceeded the change in the RPI inonly four years between 1997–98 and 2012–13, but it exceeded the change in the Rossi index in nine ofthose years.

Income poverty
63
54.4%asmeasuredbytheRPIand49.1%asmeasuredbytheRossiindex,andincreasesinthepovertylineofaround75%.Thebasicstatepensionoutpacedinflationovertheperiod1996–97to2011–12butdidnotkeeppacewiththerelativeincomepovertyline. Benefitratesfortheexamplefamilieswithchildrengenerallyincreasedbymorethaninflationandthegrowthoftherelativeincomepovertylinesintheperiodbetween1998–99and2004–05,beforegenerallylaggingbothinflationandthepovertylinebetween2004–05and2007–08.AsshowninTables4.1and4.2,thiscorrespondscloselytotwodistinctperiodswhenchildpovertyfell,andthenrosealittle.Benefitratesagainincreasedfasterthantherelativeincomepovertylineintheyearsafter2007–08,aperiodduringwhichrelativechildpovertyhasagainfallenfairlysubstantially(althoughthisfallcametoahaltinthelatestyearofdata). Between1996–97and2008–09,cashincreasesinbenefitsforworklesssinglepeoplewithoutchildrenonjobseeker’sallowancewere,onaverage,belowbothinflationandincreasesinthepovertyline.Since2008–09,increasesinbenefitshavebeenaboveincreasesinthepovertyline,but,withtheexceptionof2009–10,havebeenbelowinflation.Table4.3alsohelpsustoexaminelikelyfuturetrendsinpovertyforsomegroups: Thecommitmentbythegovernmenttoraisethebasicstatepensionbythehighestof2.5%,CPIinflationandaverageearningsgrowthfromApril2012meansmaximumbenefitentitlementsforpensionerslooksettooutpaceincreasesinthepovertylinein2012–13,andgoingforwards.ChangesthatcameintoeffectinApril2010havealsomadetheconditionsforentitlementtoafullbasicstatepensionlessstringentfornewpensioners.Thiswill,overtime,significantlyboostthenumberofpeople(particularlywomen)eligibletoreceivethefullbasicstatepension,66directlyboostingpensionerincomes.Thereformswillalsoincreasetheamountreceivedbythosewhostilldonothaveenoughcontributionstobeeligibleforafullbasicstatepension. Forothergroups,whilstmaximumbenefitentitlementsincreasedbymorethaninflationin2012–13(withtheexceptionoftheworkingloneparent,facingfreezestoworkingtaxcredit),entitlementsareexpectedtoincreasebylessthaninflationforallgroupsin2013–14asbenefitsareincreasedbyjust1%inthatyearandthetwosubsequentyears.Allelseequal,thiswouldsuggest2013–14willseemeasuredincomepovertyrise.BeforemovingontoadiscussionofabsoluteincomepovertyinSection4.2,wedelvealittledeeperintotrendsinpovertyamongpensioners,working-ageadultswithoutchildren,andchildreninrecentyears.
66 See Bozio, Crawford and Tetlow (2010) for more details.
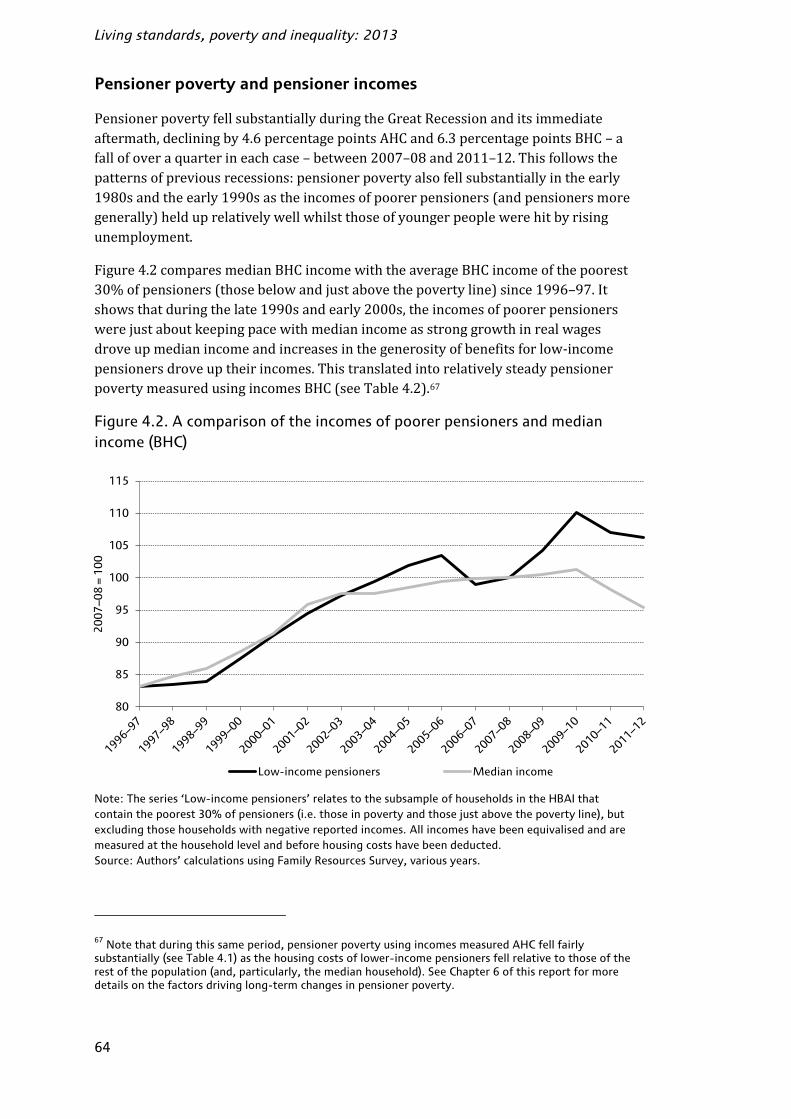
Living standards, poverty and inequality: 2013
64
Pensioner poverty and pensioner incomesPensionerpovertyfellsubstantiallyduringtheGreatRecessionanditsimmediateaftermath,decliningby4.6percentagepointsAHCand6.3percentagepointsBHC–afallofoveraquarterineachcase–between2007–08and2011–12.Thisfollowsthepatternsofpreviousrecessions:pensionerpovertyalsofellsubstantiallyintheearly1980sandtheearly1990sastheincomesofpoorerpensioners(andpensionersmoregenerally)helduprelativelywellwhilstthoseofyoungerpeoplewerehitbyrisingunemployment.Figure4.2comparesmedianBHCincomewiththeaverageBHCincomeofthepoorest30%ofpensioners(thosebelowandjustabovethepovertyline)since1996–97.Itshowsthatduringthelate1990sandearly2000s,theincomesofpoorerpensionerswerejustaboutkeepingpacewithmedianincomeasstronggrowthinrealwagesdroveupmedianincomeandincreasesinthegenerosityofbenefitsforlow-incomepensionersdroveuptheirincomes.ThistranslatedintorelativelysteadypensionerpovertymeasuredusingincomesBHC(seeTable4.2).67Figure 4.2. A comparison of the incomes of poorer pensioners and medianincome (BHC)
Note: The series ‘Low-income pensioners’ relates to the subsample of households in the HBAI thatcontain the poorest 30% of pensioners (i.e. those in poverty and those just above the poverty line), butexcluding those households with negative reported incomes. All incomes have been equivalised and aremeasured at the household level and before housing costs have been deducted.Source: Authors’ calculations using Family Resources Survey, various years.
67 Note that during this same period, pensioner poverty using incomes measured AHC fell fairlysubstantially (see Table 4.1) as the housing costs of lower-income pensioners fell relative to those of therest of the population (and, particularly, the median household). See Chapter 6 of this report for moredetails on the factors driving long-term changes in pensioner poverty.
80
85
90
95
100
105
110
115
2007–0
8=100
Low-income pensioners Median income

Income poverty
65
Table 4.4. Sources of net income growth for poorest 30% of pensioners (UK)
Source of income
Earningsand self-
employmentincome
Benefitsand taxcredits
Occupationalpensions
Income fromsavings,
investmentsand personalpensions
Otherincome
Deductionsfrom income(incl. council
tax)
Totalincome(BHC)
Share of total incomein 2011–12
3% 88% 13% 5% 1% –11% 100%
Change in income2007–08 to 2011–12
21.0% 6.2% 10.5% –24.3% –1.3% –5.3% 6.2%
Contribution to growth2007–08 to 2011–12
0.6ppt 5.4ppt 1.3ppt –1.8ppt 0.0ppt 0.6ppt 6.2ppt
Post-recession
Cumulative change2009–10 to 2011–12
–1.6% –4.3% 1.7% –8.6% –17.4% –6.9% –3.6%
Contribution to overallgrowth2009–10 to 2011–12
–0.1ppt –3.8ppt 0.2ppt –0.5ppt –0.2ppt 0.8ppt –3.6ppt
During late 2000srecession
Cumulative change2007–08 to 2009–10
23.0% 10.9% 8.7% –17.2% 19.4% 1.7% 10.2%
Contribution to overallgrowth2007–08 to 2009–10
0.7ppt 9.6ppt 1.1ppt –1.2ppt 0.2ppt –0.2ppt 10.2ppt
Note: The table relates to the subsample of households in the HBAI that contain the poorest 30% ofpensioners (i.e. those in poverty and those just above the poverty line), but excluding those householdswith negative reported incomes. All incomes have been equivalised and are measured at the householdlevel and before housing costs have been deducted. The percentage change between 2007–08 and 2011–12 is not a simple sum of the percentage changes during the two subperiods because of changes in thedenominator used to calculate percentage change between 2007–08 and 2009–10.Source: Authors’ calculations using Family Resources Survey, various years.From2007–08,though,thetrendsdivergesignificantly.Theincomesofpoorerpensionersgrewby5.0%peryearinrealtermsin2008–09and2009–10,onaverage,comparedwith0.6%peryearfortheoverallmedian.After2009–10,low-incomepensionerssawtheirincomesfall,butbylessthanmedianincomefell(fallingby1.8%peryearinrealterms,onaverage,between2009–10and2011–12,comparedwithafallof3.0%peryearformedianhouseholdincome).Since2007–08,thepoorest30%ofpensionershaveseentheirincomesincreaseby6.2%inrealterms,onaverage,whilstmedianincomeamongthepopulationasawholehasfallenby4.6%;itisthereforeunsurprisingthattherelativepositionofsuchpensionershasimprovedsubstantially.Table4.4focusesparticularlyontheperiodsince2007–08andexamineswhathashappenedtotheincomesourcesofthepoorest30%ofpensioners.ThiscanbecomparedwithTable2.4,whichshowshowvariousincomesourceshavechangedsince2007–08forthepopulationasawhole.ThefirstrowofTable4.4showsthefractionoftotalincomecontributedbyeachsource,withincomefrombenefitsandtaxcredits(includingthestatepension)clearly

Living standards, poverty and inequality: 2013
66
thelargestsource.Thenexttworowsshowthegrowthrateandthecontributiontooverallgrowth(inpercentagepoints)foreachsourcefortheperiod2007–08to2011–12.Takingthefouryearstogether,theincomesofthepoorest30%ofpensionershavegrownby6.2%onaverage.Incomesfromearningsandself-employmentandfromoccupationalpensionshaveincreasedbymorethanthis.Ontheotherhand,incomefromsavings,investmentsandpersonalpensionshasfallenbynearlyaquarter,reflectinglowerinterestrates.However,theoverwhelmingimportanceofbenefitsandtaxcreditsfortheincomesofpoorerpensionersmeansthatchangesinthistypeofincomehavehadthebiggestimpactontheiroverallincomes:growthof6.2%forthissourcehascontributed5.4percentagepointsoftheoverall6.2%growthintheirincomes.Therelativelysmallsizeofearningsandsavingsincomemeansthatlargechangesinthesetranslateintosmallchangesinoverallincomes.Examiningtheperiods2007–08to2009–10and2009–10to2011–12separatelyshowsthatitwasincreasesinincomefrombenefitsandtaxcreditsthatdrovevirtuallyalltheincreaseinincomesduringthefirstperiod,andthatfallsinbenefitsandtaxcreditsdrovevirtuallyallthefallinincomesduringthesecondperiod.Materialdeprivationamongpensionershasalsofallen,althoughthefallshavenotbeenstatisticallysignificant:whilst9.4%ofpensionersaged65oroverweremateriallydeprivedin2009–10(thefirstyearforwhichfiguresareavailable),in2011–12just7.9%were.68AppendixDprovidesmoredetail.Poverty among working-age adults without childrenWhilstrelativeincomepovertyamongpensionersandchildrenhasdeclinedsubstantiallyinrecentyears,relativeincomepovertyamongworking-ageadultswithoutchildrenhascontinuedtorise.Table4.5showsthattheincreaseinrelativeincomepovertyamongworking-ageadultswithoutchildrensince2007–08hasbeenlargelydrivenbycompositionalchanges–particularlyanincreaseinthenumberofsinglepeoplewhoareworkless.Overall,suchcompositionalchangesexplainaroundthree-quartersoftheincreaseinpoverty.Therewere,however,increasesintheratesofpovertyforsingleadultsworkingfulltimeandcoupleswithonlyoneworkerwhoworksfulltime,perhapsreflectingfallsinrealearnings.Together,theseincidenceeffects(partiallyoffsetbysmallfallsintheratesofpovertyamongothergroupsofworking-ageadultswithoutchildren)accountedforone-quarteroftheoverallincreaseinpovertyamongworking-ageadultswithoutchildren.Thispatterndiffersfromwhatwasseenbetween1996–97and2007–08,whenemploymentamongworking-ageadultswithoutchildrenincreasedsomewhatandthe(small)riseinoverallpovertywasdrivenbyincreasedpovertyamongsingleadultsworkingfulltimeandone-earnercouples.69Thus,increasedpovertyamongstworking-ageadultswithoutchildrenseemstohavebeendrivenbyanincreasingincidenceofpovertyconditionaluponfamilytypeandworkstatusupto2007–08,withfallsin68 Pensioners aged 60–64 were not asked the pensioner material deprivation questions in 2009–10 and2010–11.
69 The analysis underlying this is available from the authors on request.

Income poverty
67
Table 4.5. Decomposition of the rise in relative poverty amongst working-agenon-parents (AHC), 2007–08 to 2011–12, by family type and work status
Poverty rate Percentage ofworking-agenon-parentpopulation
Compositionaleffect
Incidenceeffect
Totalchange
inpoverty
2007–08 2011–12 2007–08 2011–12
Single individuals
Full-time 10% 11% 26% 24% 0.2% 0.3% 0.5%
Part-time 29% 30% 6% 6% 0.1% 0.1% 0.1%
Workless 53% 52% 14% 17% 1.0% –0.1% 0.9%
Couples,no children
Self-employed 17% 17% 8% 7% 0.0% 0.0% 0.0%
Two full-time earners 3% 2% 22% 21% 0.2% –0.1% 0.1%
One full-time,one part-time
6% 6% 8% 8% 0.0% 0.0% 0.0%
One full-time,one not working
14% 21% 8% 8% 0.0% 0.5% 0.5%
One or two part-time 28% 28% 3% 4% 0.0% 0.0% 0.0%
Workless 44% 42% 5% 5% 0.0% –0.1% –0.1%
All working-agenon-parents
18.1% 20.2% 100% 100% 1.6% 0.5% 2.1%
Note: Poverty rates are measured as the percentage of the group with AHC income below 60% of thecontemporaneous population-wide AHC median income.Source: Authors’ calculations based on Family Resources Survey, 2007–08 and 2011–12.worklessnesspartlyoffsettingthis.Sincethen,increasinglevelsofworklessnesshavebeenthemaindrivers.Child povertySincetheonsetoftherecession,childpovertyhasfallensubstantially.Hereweexaminehowchangesinthecompositionoffamilieswithchildrenandtheincidenceofpovertyacrossfamilytypessince2007–08(i.e.thelastyearpriortotherecession)havecontributedtothisoverallfall.OurdecompositionisforincomesBHCinordertobeconsistentwithpreviousanalysis70andbecauseaBHCmeasureofchildpovertyisusedinthetargetscontainedinthe2010ChildPovertyAct.However,resultsareverysimilarusingincomesmeasuredAHC.Table4.6showsthatbetween2007–08and2011–12,itwasmainlyreductionsintheincidenceofpovertyconditionaluponfamilyandworkstatusthatdrovereductionsintheoverallchildpovertyrate.Inparticular,povertyfellsubstantiallyamongchildrenlivingwithparentswhoworkonlyparttimeornotatall.Thiscontinuesatrendobservedsincethelate1990s.71Compositionalchanges,includingafallinthenumber70 Cribb, Joyce and Phillips, 2012.
71 See Jin et al. (2011) and Cribb, Joyce and Phillips (2012).

Living standards, poverty and inequality: 2013
68
Table 4.6. Decomposition of the fall in relative child poverty (BHC),2007–08 to 2011–12, by family type and work status
Poverty rate Percentage ofchild population
Compositionaleffect
Incidenceeffect
Totalchange
inpoverty
2007–08 2011–12 2007–08 2011–12
Lone parents
Full-time 11% 8% 6% 6% 0.0% –0.2% –0.2%
Part-time 25% 17% 6% 6% 0.0% –0.5% –0.5%
Workless 56% 34% 11% 10% –0.3% –2.4% –2.7%
All/Total 36.1% 22.5% 23.8% 22.7% –0.3% –3.0% –3.3%
Coupleswith children
Self-employed 24% 23% 13% 12% –0.1% –0.1% –0.2%
Two full-time earners 4% 4% 15% 17% –0.4% 0.0% –0.4%
One full-time,one part-time
4% 6% 22% 23% 0.0% 0.4% 0.4%
One full-time,one not working
21% 20% 17% 16% 0.0% –0.2% –0.2%
One or two part-time 57% 39% 3% 5% 0.5% –0.7% –0.2%
Workless 70% 54% 6% 5% –0.5% –0.7% –1.2%
All/Total 18.3% 16.0% 76.2% 77.3% 0.0% –1.6% –1.6%
All children 22.5% 17.4% 100% 100% –1.0% –4.3% –5.3%
Note: Poverty rates are measured as the percentage of the group with BHC income below 60% of thecontemporaneous population-wide BHC median income.Source: Authors’ calculations based on Family Resources Survey, 2007–08 and 2011–12.ofchildrenlivinginworklessfamiliesandanincreaseinthenumberlivingincoupleswherebothparentsworkfulltime,havealsoactedtoreducechildpovertyalittle.Inthecontextofageneralweakeningofthelabourmarketandloweremploymentrates,thisisperhapsasurprisingfinding.Thetablealsoshowsthatthedeclinesinchildpovertyweremuchlargeramongchildrenlivingwithloneparents(from36.1%to22.5%)thanamongthoselivingwithcouples(18.3%to16.0%),whichmeansthatthefractionofpoorchildrenwhoarelivingwithloneparentsfellfrom38.2%to29.3%duringthisperiod.Thisreflectsthefactthatthefallsinpovertyweresubstantiallylargerforchildrenwhoseparentsdidnotworkoronlyworkedparttime:thesegroupsmakeupthemajorityofthechildrenofloneparents,butonlyasmallminorityofthechildrenlivingwithtwoparents.Thiscontinuesatrendgoingbacktoatleast1996–97,whenthechildpovertyratewas48.7%amongchildrenlivingwithloneparentsand20.7%forchildrenofcouples.72The 2020 child poverty targetsTheChildPovertyAct(2010)commitsthegovernmenttothe‘eradication’ofchildpovertyby2020,withfourindicatorsbeingtargeted:arelativeincomepoverty72 The analysis underlying this is available from the authors on request.

Income poverty
69
measurebasedon60%ofcontemporaneousmedianBHCincome;anabsoluteincomepovertymeasurebasedon60%ofmedianBHCincomein2010–11;acombinedrelativelowincomeandmaterialdeprivationindicator;andanindicatorofpersistentrelativeincomepoverty(achildisclassifiedasbeinginpersistentpovertyifhe/sheisinrelativeincomepovertyforatleastthreeoutoffourconsecutivecalendaryears).Reducingmeasuredincomepovertyamongstchildrentozeroisprobablyinfeasible,foratleastthreereasons:incomesarevolatileintheshortrun,sotherewillalwaysbesomepeoplewithverylowincomesatanypointintime–forexample,duetoself-employmentlossesortransitionbetweenjobs(clearlythisreasonapplieslesstothepersistentpovertytarget);surveydataarealwayssubjecttomisreportingandtheFamilyResourcesSurveyunder-recordsbenefitandtaxcreditreceipt;73andtake-upratesformeans-testedbenefitsandtaxcreditsareunlikelyevertobe100%.Thus,theActtargetsarateofrelativeincomechildpovertyof10%,withtherationalethatitwouldbealevelcomparabletothelowestinEurope(itwouldalsobelowerthanthatachievedintheUKatanytimesinceatleast1961).Thetargetratesfortheabsolutepovertyandcombinedrelativelowincomeandmaterialdeprivationindicatorare5%(theabsolutelowincomelineistoberebasedsothatitisequalto60%ofthe2010–11medianinrealterms).Thetargetrateofpersistentpovertyhasyettobeset,andindeed,followingthereplacementoftheBritishHouseholdPanelSurveywiththeUnderstandingSocietysurvey,thisindicatoriscurrentlynotbeingtracked.Table4.7showsthattherewaspracticallynoimprovementbetween2010–11and2011–12intherelativepovertymeasure,andincreasesinabsolutepovertymadereachingthe2020targetsevenharder.Lookingahead,asdiscussedinSection4.3,thenextfewyearslookhighlylikelytoseechildpovertyrisefurtherratherthanfall.Theonlyindicatoronwhichtherewas(alittle)progresswasthecombinedlowincomeandmaterialdeprivationmeasure(althoughthefallwasnotstatisticallysignificant).AppendixDdiscussesmaterialdeprivationinalittlemoredetail.TheChildPovertyActalsorequiresthegovernmenttosetout(andsubsequentlyupdate)astrategytomeetthetargets.InApril2011,thegovernmentpublisheditsfirstChildPovertyStrategy,74coveringtheperiodbetween2011and2014.Thisincludedthedefinitionofanew(partly)income-basedmeasureofseverepoverty,alongsideasuiteofancillaryindicatorsrangingfrommeasuresofeducationalparticipationandachievementtobirthweighttothenumberofteenagepregnancies.Thisbroadrangeofnewindicatorsreflectedthegovernment’sargumentthatpovertyis‘aboutfarmorethanincome’anditsconcernthatafocusonthe‘symptoms’asopposedto‘causes’ofpovertyhadledtopoorpolicymakingandpooroutcomes.Aswearguedin2011,75thisbroaderassessmentofthelivesandprospectsofchildrenshouldbeseenasagoodthing,althoughitwasunclearthattheparticularpoliciestrumpetedwouldmateriallyimprovethings,especiallybyassoonas2020.73 See Appendix B of this report and appendix C of Brewer, Muriel, Phillips and Sibieta (2008).
74 HM Government, 2011a.
75 Jin et al., 2011.

Living standards, poverty and inequality: 2013
70
Table 4.7. Child poverty relative to 2020–21 targets
Relativelow income
Absolutelow income
Material deprivationand relativelow income
% Million % Million % Million
2010–11 17.5 2.3 17.5 2.3 12.7 1.7
2011–12 17.4 2.3 19.5 2.6 11.9 1.6
2020–21 target 10% n/a 5% n/a 5% n/aSource: Authors’ calculations based on Family Resources Survey, 2010–11 and 2011–12.AtthetimeofthereleaseofthelastsetofHBAIstatisticsinJune2012,thegovernmentalsoannouncedaconsultationonintroducinganewmultidimensionalmeasureofpovertythatincludedindicatorsofmateriallivingstandards,othercurrentcircumstances,thecausesofchildpovertyandthefuturelifechancesofchildren.Thisconsultationclosedinearly2013,andthegovernmentisexpectedtohaveannounceditsresponsebythetimethisreportispublished(or,ifnot,soonafter).ThedetailedresponseofIFSresearcherstothisconsultationisavailableonline.76Ourkeyrecommendationwasthatthegovernmentdefinedistinctsetsofindicatorstocovereachofthevariousphenomenonitwishestotrack.Itwouldbedifficultorimpossibletobuildasingleindexthatcombinedthemultipleindicatorsinawaythatcouldbeunderstoodandachieveconsensus–twoofthestatedaimsofthenewmeasure.Indeed,theparticulardimensionssuggestedcoverdistinctconcepts(forinstance,thecausesoflowincomesandtheconsequencesoflowincomes),providingvaluablebutdifferentkindsofinformation;aggregatingthemwouldresultinsomethinglessinformativethanhavingandtrackingmultipleindicators.Work and relative povertyIncreasesinin-workpovertymeanthatin2011–12,almosttwo-thirdsofpoorchildrenandalmostone-halfofpoorworking-ageadultswithoutchildrenlivedinfamilieswheresomeoneworked.Withthisgrowinggroupof‘workingpoor’familiesinmind,thissubsectionbrieflyexaminestherelationshipbetweendifferentemploymentcharacteristics(specificallysector,occupationalgroup,hoursofworkandhourlywage)andpovertyinthetwomostrecentyearsofHBAIdata.77Thefirstthingworthnotingisthattherateofpovertyamongadultswhoareself-employedissubstantiallyhigherthanthatamongthosewhoareemployed:7817.2%comparedwith5.8%onaBHCbasisand20.6%comparedwith9.6%onanAHCbasis.Thisreflectsthefactthat,atleastinpartbecauseofthevolatilityofself-employmentincome,therearesubstantiallymoreself-employedindividualsreportinglowlevelsof76 Browne et al., 2013.
77 Two years of data have been used to increase sample sizes.
78 In this subsection, we define being ‘self-employed’ as listing a form of self-employment as the main joband recording a profit or loss from that self-employment. The ‘employed’ are those who report that theirmain job is a form of employment and who record positive earnings from that employment.

Income poverty
71
earnings(butalsomorereportingearningsofmorethanabout£900aweek).However,previousanalysishasshownthathigherlevelsofrelativeincomepovertyamongtheself-employeddonottranslateintohigherlevelsofmaterialdeprivationorlowerlevelsofexpenditure,atleastamongfamilieswithchildren.79Second,amongthosewhoareemployed(ratherthanself-employed),unsurprisinglypovertyishigherforthosewhoareworkinginlow-paysectorssuchasretail,hospitalityandcatering,residentialcarehomes,andotherpersonalservices.Forinstance,workersinthesesectorshadapovertyrateof17.1%(AHC)or9.9%(BHC)comparedwith7.9%(AHC)or4.9%(BHC)amongallotheremployeesin2010–11and2011–12.However,becausethoseworkinginthelow-paidsectorsmadeuplessthanone-fifthofallemployeesin2010–11and2011–12,despiteasubstantiallyhigherrateofpovertyamongthoseinlow-paidsectors,onlyaroundthreeoutoftenpooremployedadultsworkedinthosesectors:theremaining70%wereemployedinothersectors.Figure4.3showsthat,measuredAHC,povertywasparticularlyhighforthoseworkinginhospitalityandcatering(thisresult,andothersdiscussedbelow,holdsqualitativelyusingincomesmeasuredBHCtoo).Figure 4.3. AHC poverty rates by sector and occupation group
Source: Authors’ calculations based on Family Resources Survey, 2010–11 and 2011–12.Figure4.3alsoshowsAHCpovertyratesforanumberofoccupationgroups.Povertyishighestforthoseemployeesworkinginelementary(20.5%)andsales(16.3%)occupations,followedbycaring(13.5%),process(9.8%)andadministrative(7.9%)occupations.TheAHCpovertyrateamongallotheroccupationswas5.8%.Together,theseoccupationsaccountforjustunderhalfofallemployedadultsbutaround70%ofallpooremployedadults.Thoseworkinginelementary,salesorcaringjobs,whilst79 See Brewer, O’Dea, Paull and Sibieta (2009).
0% 5% 10% 15% 20% 25% 30% 35%
All other sectors
Residential care
Retail
Other personal services
Hospitality & catering
All other occupations
Administrative
Process
Caring
Sales
Elementary
All

Living standards, poverty and inequality: 2013
72
accountingforjustunderthreeoutoftenemployees,accountforjustoverfiveoutoftenpooremployees.Ofcourse,manyhouseholdshavemorethanoneworker,andthoseworkinginlow-paidsectorsoroccupationsareoftennotthemainearnerinahousehold:earningsofotherhouseholdmembersweakenthelinkbetweenworkinginalow-paidsectororoccupationandbeinginpoverty.AsshowninFigure4.4,povertyratesaresubstantiallyhigheramongthoseworkinginthelower-paidsectorsandoccupationsiftheyarethemainearnerintheirhousehold.Forinstance,amongemployeeswhoareworkinginelementaryorsalesjobswhoaretheirhousehold’smainearner,therateofpovertyisaround27%(comparedwitharound21%ofallthoseworkinginelementaryoccupationsand16%ofallthoseworkinginsalesoccupations).Unsurprisingly,onceonecontrolsforhoursofworkandhourlywages,differencesinpovertyratesbetweenpeopleindifferentoccupationgroupsandindustrialsectorslookverymuchsmaller.80Butisitlowwagesorlowhoursofworkthatareabetterpredictorofwhethersomeoneisinpoverty?Table4.8showstheresultsofastatisticalregressionthatexaminesAHCpovertyratesamongthosewithlowwagesorlowhours,bothlowwagesandhours,orneither.Thefirstrowshowsthatfull-timeemployeeswhosehourlywageisinthetop75%oftheFigure 4.4. AHC poverty rates by sector and occupation group (main earnersonly)
Source: Authors’ calculations based on Family Resources Survey, 2010–11 and 2011–12.
80 This was investigated by a regression of an indicator for being in AHC poverty upon occupation orindustrial sector classifications, and indicators for region, sex and age, as well as hours and wages.Differences in other sources of income, notably those of their partners and other household members,and from benefits and tax credits, explain any remaining differences in poverty rates.
0% 5% 10% 15% 20% 25% 30% 35%
All other sectors
Residential care
Retail
Other personal services
Hospitality & catering
All other occupations
Administrative
Process
Caring
Sales
Elementary
All

Income poverty
73
Table 4.8. AHC poverty rates by wage and hours
Employee group AHCpovertyrate
Top 75% of hourly wage distribution, working 30 or more hours a week 4.3%
Top 75% of hourly wage distribution, working 16–29 hours a week 10.5%
Top 75% of hourly wage distribution, working under 16 hours a week 16.7%
Lowest 25% of hourly wage distribution, working 30 or more hours a week 21.0%
Lowest 25% of hourly wage distribution, working 16–29 hours a week 27.7%
Lowest 25% of hourly wage distribution, working under 16 hours a week 28.1%Source: Authors’ calculations based on Family Resources Survey, 2010–11 and 2011–12.wagedistributionhavearateofAHCpovertyof4.3%.Therateofpovertyincreasesto10.5%forthoseworking16–29hoursaweekandto16.7%forthoseworkingunder16hoursaweek.Clearly,lowhoursofworkareassociatedwithbeinginAHCincomepoverty.Thefourthrowshowsthatfull-timeemployeeswhosewageisinthebottom25%ofthewagedistributionhavearateofAHCpovertyof21.0%,whichrisesto27.7%amonglow-wageworkersworking16–29hoursaweekandto28.1%amongthoseworkingunder16hoursaweek.Theevidenceisclearthathavingalowhourlywageisastrongerpredictorofbeinginpovertythanisworkingparttime(somethingwhichisconfirmedbystatisticaltests).Ofcourse,combiningpart-timeworkwithalowhourlywageproducesthehighestratesofpoverty.4.2 Absolute income povertyWhilerelativepovertydefinespovertyagainstanever-changingpovertylinebasedonthecurrentyear’smedianincome,absolutepovertyisdefinedagainstapovertylinefixedinrealterms.Withfallsinrealincomesacrossmostoftheincomedistributionin2011–12(seeChapter3),changesinabsolutepovertywilldifferfromchangesinrelativepoverty.Changesinabsolutepovertyin2011–12willbeabettermeasureofthechangesofmateriallivingstandardsofpoorhouseholds.Tables4.9and4.10setoutestimatesofthenumberofindividualsinabsolutepovertymeasuringincomesAHCandBHCrespectively.Inthisinstance,wedefinetheabsolutepovertylinetobe60%ofmedianincomein2010–11,adjustedforinflation.81,82Thechoiceofbaseyearis81 The HBAI publication presents a measure of absolute low-income poverty which also uses the 2010–11median to define the absolute poverty line. This is the basis of the absolute child poverty targets set outin the 2010 Child Poverty Act.
82 Note that, as with calculating real income changes over time, changes in absolute poverty are sensitiveto the choice of inflation measure used to adjust incomes to account for the changing cost of living overtime. The figures in this section use the measures of inflation used in the official HBAI publication – theRPI and the Rossi index – which, as discussed in Section 2.4 of this report, are likely to overstate the rateof inflation due to problems with the formulae on which they are based. This means that levels ofabsolute poverty in years prior to 2010–11 are likely to have been a little higher than reported, and thelevel in 2011–12 is likely to be a little lower than reported. Thus, increases in absolute poverty in the lastfew years recorded in the HBAI data are likely to overstate the true increases in absolute poverty.

Living standards, poverty and inequality: 2013
74
Table 4.9. Absolute poverty: percentage and number of individuals inhouseholds with incomes below 60% of 2010–11 median AHC income
Children Pensioners Working-ageparents
Working-agenon-parents
All
% Million % Million % Million % Million % Million
1996–97 (GB) 44.1 5.6 42.4 4.2 36.0 4.5 22.4 4.6 34.0 18.91997–98 (GB) 42.6 5.4 40.8 4.1 34.5 4.2 20.5 4.3 32.3 18.01998–99 (GB) 41.9 5.3 39.0 3.9 33.6 4.1 19.8 4.1 31.3 17.51999–00 (GB) 39.5 5.0 35.9 3.6 31.5 3.8 19.5 4.1 29.6 16.62000–01 (GB) 35.8 4.5 31.7 3.2 28.6 3.5 18.5 3.9 27.0 15.22001–02 (GB) 32.7 4.1 28.5 2.9 25.9 3.1 16.2 3.5 24.2 13.7
2002–03 (UK) 29.8 3.9 24.1 2.5 24.1 3.0 16.4 3.7 22.4 13.12003–04 (UK) 28.4 3.7 19.8 2.1 23.2 2.9 16.4 3.7 21.1 12.42004–05 (UK) 27.4 3.5 15.9 1.7 22.2 2.8 15.5 3.5 19.6 11.52005–06 (UK) 27.6 3.5 14.6 1.6 23.2 2.9 16.7 3.8 20.1 11.92006–07 (UK) 27.8 3.6 16.3 1.8 23.0 2.9 16.5 3.8 20.3 12.12007–08 (UK) 28.7 3.7 15.3 1.7 23.8 3.1 17.1 3.9 20.7 12.42008–09 (UK) 27.7 3.5 13.9 1.6 23.7 3.1 18.3 4.2 20.6 12.42009–10 (UK) 26.9 3.5 13.4 1.5 23.6 3.2 18.8 4.3 20.5 12.52010–11 (UK) 27.3 3.6 14.2 1.7 24.3 3.3 19.7 4.5 21.3 13.02011–12 (UK) 29.2 3.8 15.4 1.8 25.0 3.4 21.0 4.9 22.6 13.9
Changes1996–97 to 2004–05 –16.8 –26.5 –13.8 –6.9 –14.42004–05 to 2007–08 (1.4) (0.2) (–0.6) (0.0) 1.6 0.3 1.6 0.4 1.1 0.92007–08 to 2011–12 (0.4) (0.1) (0.1) (0.1) (1.2) 0.4 3.9 0.9 1.8 1.52010–11 to 2011–12 1.9 (0.3) 1.2 0.1 (0.7) (0.1) 1.3 0.4 1.3 0.9Note: Reported changes may not equal differences between the corresponding numbers due to rounding.Changes in parentheses are not significantly different from zero at the 5% level. Because of thediscontinuity in the series due to the inclusion of Northern Ireland from 2002–03, changes in the numberof people in poverty since before 2002–03 are not available. However, due to Northern Ireland’s smallpopulation and similar poverty rates, the changes in poverty rates reported should be accurate. All figuresare presented using DWP’s AHC variant of the modified OECD equivalence scale.Source: Authors’ calculations based on Family Resources Survey, various years.essentiallyarbitrary.Thispovertylineisroughly3%higherthantherelativepovertylinein2011–12,reflectingthesubstantialfallinmedianincomebetween2010–11and2011–12.(Theabsolutepovertylinein2010–11was£264perweekBHC–intermsoftheequivalentincomeforatwo-adulthouseholdwithoutchildren–versus£256perweekfortherelativepovertyline.)In2011–12,therewere13.9millionindividuals(22.6%oftheUKpopulation)livinginabsolutepovertymeasuringincomesAHC,ariseof900,000since2010–11.MeasuringincomesBHC,therewere10.8millionindividuals(17.5%)inabsolutepoverty,also900,000morethanin2010–11.Bothofthesechangesarestatisticallysignificant,andonanAHCbasisabsolutepovertyin2011–12wasatitshighestlevelsince2001–02,whilstonaBHCbasisabsolutepovertywasatitshighestlevelsince2003–04.Thisreflectsthefallsinrealhouseholdnetincomesamongpoorerhouseholdsin2010–11
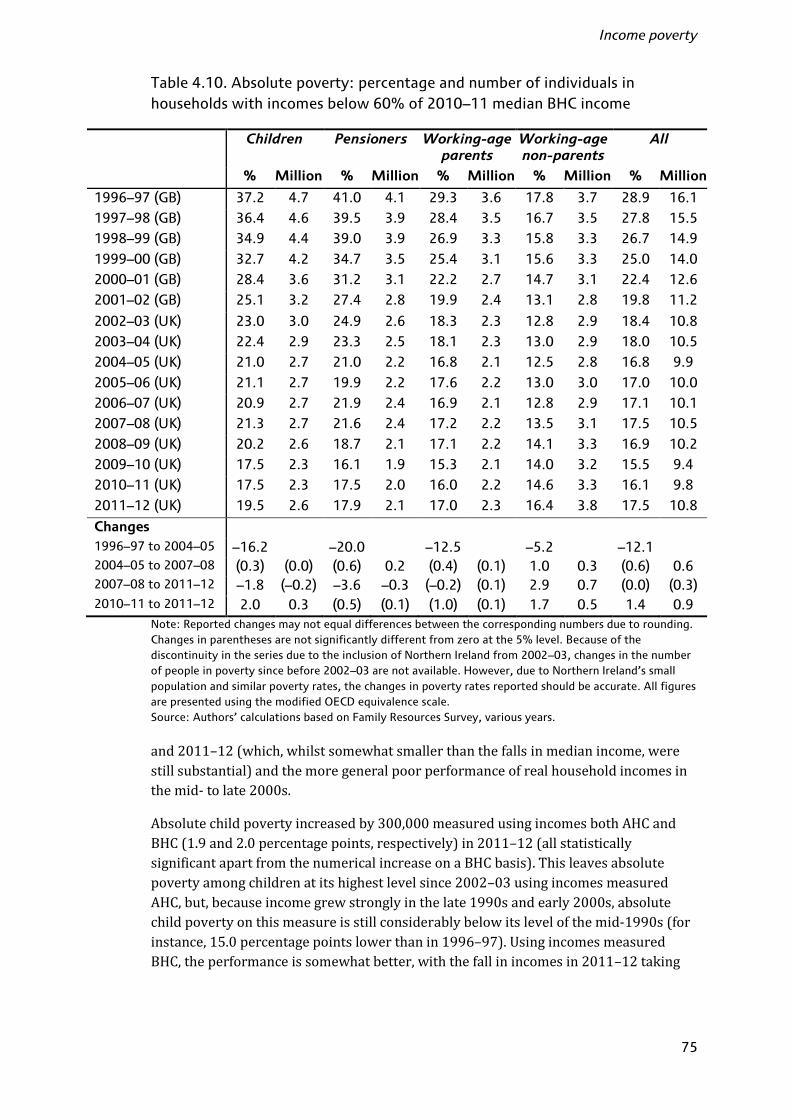
Income poverty
75
Table 4.10. Absolute poverty: percentage and number of individuals inhouseholds with incomes below 60% of 2010–11 median BHC income
Children Pensioners Working-ageparents
Working-agenon-parents
All
% Million % Million % Million % Million % Million
1996–97 (GB) 37.2 4.7 41.0 4.1 29.3 3.6 17.8 3.7 28.9 16.1
1997–98 (GB) 36.4 4.6 39.5 3.9 28.4 3.5 16.7 3.5 27.8 15.5
1998–99 (GB) 34.9 4.4 39.0 3.9 26.9 3.3 15.8 3.3 26.7 14.9
1999–00 (GB) 32.7 4.2 34.7 3.5 25.4 3.1 15.6 3.3 25.0 14.0
2000–01 (GB) 28.4 3.6 31.2 3.1 22.2 2.7 14.7 3.1 22.4 12.6
2001–02 (GB) 25.1 3.2 27.4 2.8 19.9 2.4 13.1 2.8 19.8 11.2
2002–03 (UK) 23.0 3.0 24.9 2.6 18.3 2.3 12.8 2.9 18.4 10.8
2003–04 (UK) 22.4 2.9 23.3 2.5 18.1 2.3 13.0 2.9 18.0 10.5
2004–05 (UK) 21.0 2.7 21.0 2.2 16.8 2.1 12.5 2.8 16.8 9.9
2005–06 (UK) 21.1 2.7 19.9 2.2 17.6 2.2 13.0 3.0 17.0 10.0
2006–07 (UK) 20.9 2.7 21.9 2.4 16.9 2.1 12.8 2.9 17.1 10.1
2007–08 (UK) 21.3 2.7 21.6 2.4 17.2 2.2 13.5 3.1 17.5 10.5
2008–09 (UK) 20.2 2.6 18.7 2.1 17.1 2.2 14.1 3.3 16.9 10.2
2009–10 (UK) 17.5 2.3 16.1 1.9 15.3 2.1 14.0 3.2 15.5 9.4
2010–11 (UK) 17.5 2.3 17.5 2.0 16.0 2.2 14.6 3.3 16.1 9.8
2011–12 (UK) 19.5 2.6 17.9 2.1 17.0 2.3 16.4 3.8 17.5 10.8
Changes1996–97 to 2004–05 –16.2 –20.0 –12.5 –5.2 –12.12004–05 to 2007–08 (0.3) (0.0) (0.6) 0.2 (0.4) (0.1) 1.0 0.3 (0.6) 0.62007–08 to 2011–12 –1.8 (–0.2) –3.6 –0.3 (–0.2) (0.1) 2.9 0.7 (0.0) (0.3)2010–11 to 2011–12 2.0 0.3 (0.5) (0.1) (1.0) (0.1) 1.7 0.5 1.4 0.9
Note: Reported changes may not equal differences between the corresponding numbers due to rounding.Changes in parentheses are not significantly different from zero at the 5% level. Because of thediscontinuity in the series due to the inclusion of Northern Ireland from 2002–03, changes in the numberof people in poverty since before 2002–03 are not available. However, due to Northern Ireland’s smallpopulation and similar poverty rates, the changes in poverty rates reported should be accurate. All figuresare presented using the modified OECD equivalence scale.Source: Authors’ calculations based on Family Resources Survey, various years.and2011–12(which,whilstsomewhatsmallerthanthefallsinmedianincome,werestillsubstantial)andthemoregeneralpoorperformanceofrealhouseholdincomesinthemid-tolate2000s.Absolutechildpovertyincreasedby300,000measuredusingincomesbothAHCandBHC(1.9and2.0percentagepoints,respectively)in2011–12(allstatisticallysignificantapartfromthenumericalincreaseonaBHCbasis).Thisleavesabsolutepovertyamongchildrenatitshighestlevelsince2002–03usingincomesmeasuredAHC,but,becauseincomegrewstronglyinthelate1990sandearly2000s,absolutechildpovertyonthismeasureisstillconsiderablybelowitslevelofthemid-1990s(forinstance,15.0percentagepointslowerthanin1996–97).UsingincomesmeasuredBHC,theperformanceissomewhatbetter,withthefallinincomesin2011–12taking

Living standards, poverty and inequality: 2013
76
absolutechildpovertyonthismeasuretojustbelowits2008–09leveland17.6percentagepointsbelowits1996–97level.Absolutepensionerpovertyincreasedbyastatisticallysignificant100,000(1.2percentagepoints)onanAHCbasis(theincreaseusingincomesBHCwasalso100,000,or0.5percentagepoints,butthiswasnotstatisticallysignificant).MeasuredAHC,pensionershavebyfarthelowestrateofabsolutepovertyofanygroup,at15.4%,whichisasubstantialchangesince1996–97,whentheyhadthesecond-highestrate,at42.4%.UsingincomesmeasuredBHC,pensionersstillhavethesecond-highestrateofpoverty,at17.9%,butthisagainrepresentsthelargestfall(23.0percentagepoints)since1996–97.Aswithchildren,mostofthisfalltookplaceinthelate1990sandearly2000swhenincomegrowthwasstrong.Thetablesalsoshowthattherewasasubstantialandstatisticallysignificantincreaseinabsolutepovertyamongworking-ageadultswithoutchildren:400,000(1.3percentagepoints)usingincomesAHCand500,000(1.7percentagepoints)usingincomesBHC.Absolutepovertyamongworking-ageadultswithoutchildrenisnowhigherthanitwasin1997–98(AHC)or1998–99(BHC).Indeed,asweshallseeinChapter6,usingincomesmeasuredAHC,absolutepovertyamongthisgroupisnowatlevelslittlechangedsincethe1970s.Insummary,thetrendsinabsolutepovertyin2011–12wereverydifferentfromthetrendsinrelativepoverty,duetothelargereductioninmedianincomeandhenceintherelative(butnottheabsolute)povertyline.Absolutepovertyrosein2011–12,reflectingthefactthatpoorerhouseholdstendedtoseetheirincomesrisebylessthaninflation.Thesedifferingtrendsinabsoluteandrelativepovertyillustratetheimportanceofconsideringbothtypesofmeasuretounderstandtrendsinthemateriallivingstandardsofpoorerhouseholds,especiallyinthepresenteconomicenvironment.4.3 Prospects for povertyResearchersatIFShaverecentlyproducedprojectionsofpovertyamongworking-ageadultsandchildren(seeTable4.11).83Thesepredictedthatabsoluteincomepovertyamongbothgroupswouldincreasebetween2011–12and2015–16:by600,000(4.0percentagepoints)forchildrenand800,000(1.6percentagepoints)forworking-ageadultsusingincomesAHCandby700,000(4.5percentagepoints)forchildrenand800,000(1.8percentagepoints)forworking-ageadultsusingincomesBHC.Thisreflectsfurtherpredictedfallsinrealincomestowardsthebottomoftheincomedistributioninthelastandcurrentfinancialyears.Indeed,absolutepovertyispredictedtocontinuerisingto2020asincomesfailtokeeppacewithRPIandRossiinflation.8483 Browne, Hood and Joyce, 2013.
84 These are the measures of inflation used to adjust BHC and AHC incomes, respectively. Note that mostbenefits and personal taxes are now indexed instead to CPI inflation. See the discussion in Section 2.4 forhow the choice of inflation index matters when assessing long-term changes in living standards (and thuspoverty).

Income poverty
77
Table 4.11. Projections for child and working-age poverty (UK)
AHC poverty BHC povertyChildren Working-age
adultsChildren Working-age
adultsMillion % Million % Million % Million %
Relativeincomepoverty2011–12 3.5 27.1 7.9 21.5 2.3 17.5 5.7 15.5
2015–16 4.1 30.6 8.5 22.6 2.9 21.4 6.4 16.9
Absoluteincomepoverty2011–12 3.9 29.6 8.4 22.9 2.5 19.3 6.1 16.5
2015–16 4.5 33.6 9.2 24.5 3.2 23.8 6.9 18.3Note: Relative poverty line is 60% of contemporary median income. Absolute poverty line is 60% ofmedian income in 2010–11. Forecast poverty rates in 2011–12 were close to those revealed in the actual2011–12 data but were not exact (for instance, absolute BHC child poverty was 2.6 million as opposed to2.5 million).Source: Browne, Hood and Joyce (2013), based on Family Resources Survey, 2010–11.Relativeincomepovertyisalsopredictedtoincreasebetween2011–12and2015–16:by600,000(3.5percentagepoints)forchildrenand600,000(1.1percentagepoints)forworking-ageadultsusingincomesAHCandby600,000(3.9percentagepoints)forchildrenand800,000(1.4percentagepoints)forworking-ageadultsusingincomesBHC.Relativeincomepovertyisexpectedtocontinuetoriseintheyearsuntil2020asbenefitratesareindexedtoCPIinflation,whichislikelytobelowerthanthegrowthinmedianincome.Ofcourse,thechangestobenefitindexationannouncedinBudget2010arejustoneelementoflarge-scalecutstobenefitsannouncedandintheprocessofbeingimplementedaspartofthecoalitiongovernment’sfiscalconsolidation.Figure4.5showsthedistributionalimpactoftaxandbenefitchangestakingeffectfrom2012–13excludingtheintroductionofuniversalcredit.85Itshowsthatthechangestendtohitlow-incomehouseholdswithchildrenthemostasaproportionofincome,whichisakeyreasonwhychildpovertyisforecasttorisemostquickly.Indeed,working-agefamilieswithoutchildrentowardsthetopoftheincomedistributionareexpectedtogainfromthereforms,astheyarehitrelativelylittlebycutstobenefitsandtaxcredits,butdogainfromincreasesinthepersonalallowanceand,attheverytop,thecutinthe50%rateofincometaxto45%.
85 If one assumes that universal credit were fully rolled out by 2015–16, the picture looks marginally lessregressive among families with children, but the basic picture is unchanged. Note that universal credit willonly be partly rolled out by this time and will not be fully in place until the end of 2017.

Living standards, poverty and inequality: 2013
78
Figure 4.5. Impact of direct tax and benefit reforms introduced or plannedbetween April 2012 and April 2015 (excluding Universal Credit), by incomedecile group and household type
Note: Income decile groups are derived by dividing all households into 10 equal-sized groups based ontheir simulated income under the April 2011 tax and benefit system according to income adjusted forhousehold size using the McClements equivalence scale. Decile group 1 contains the poorest tenth of thepopulation, decile group 2 the second poorest, and so on up to decile group 10, which contains therichest tenth. Assumes full take-up of means-tested benefits and tax credits.Source: Authors’ calculations using TAXBEN, the IFS tax and benefit microsimulation model, run onuprated 2010–11 Family Resources Survey data. Analysis ignores the introduction of universal credit,which begins in October 2013 but is not due to be complete until the end of 2017.IFSresearchershavenotattemptedtoprojectfuturelevelsofpensionerpoverty,onthebasisthatthemethodsusedarelessappropriateforthattask.Figure4.5suggeststhatthedirectimpactsoftaxandbenefitreformstendtoincreasetheincomesoflow-incomepensionerhouseholds.Thisreflectsthefactsthatmostoftheplannedwelfarecutsby2015–16arecutstoworking-agebenefitsandtaxcredits(andpensionershavebeenprotectedfromcutstocounciltaxbenefitinEnglandandtheoverallhouseholdbenefitscapintroducedinApril2013,whichwouldotherwisehaveaffectedbothpensionersandnon-pensioners),andthatincreasesinthebasicstatepensionandpensioncredithavebeenlargerthanunderthepolicyinheritedbythecoalitiongovernment.86Consideredinisolation,thiswouldsuggestthattheoutlookforpensionerpovertyisbetterthanthatforothergroups,butthiswillalsodependveryimportantlyonhowtheprivateincomesourcesofpensionersevolve.
86 Pensioners higher up the income distribution see small falls in their incomes, on average, due to thefreezes in the age-related income tax allowance.
-12%
-10%
-8%
-6%
-4%
-2%
0%
2%
4%
Poorest 2 3 4 5 6 7 8 9 Richest All
Inco
mega
in
Whole-population income decile group (under April 2011 system)
Pensioner households
Households with children
Working-age households without children

Income poverty
79
4.4 ConclusionRelativeincomepovertywasbroadlyunchangedin2011–12,butfollowingthreeconsecutiveyearsofquitesubstantialfalls,itremainedaround0.4million(1.4percentagepoints)loweronanAHCbasisand1.2million(2.4percentagepoints)loweronaBHCbasisthanin2007–08,justpriortotherecentrecession.Thiswastheresultofsubstantialfallsinrelativepovertyamongpensionersandfamilieswithchildren,partlyoffsetbyincreasesamongworking-ageadultswithoutchildren.However,havingstartedfallingin2010–11,theincomesofpoorerhouseholdswere,in2011–12,loweronaverageinrealtermsthanin2007–08.Inotherwords,relativepovertywaslowerin2011–12thanin2007–08,notbecausetheincomesofpoorhouseholdshadgrown,butbecausetheyhadfallenbylessthanmedianincome.Absoluteincomepovertyin2011–12wasaround1.5million(1.8percentagepoints)higheronanAHCbasisand0.3million(0.0percentagepoints)higheronaBHCbasisthanin2007–08,drivenbyincreasesin2010–11and2011–12.Theideathatpovertycanfallduringaperiodinwhichthepoorhaveseentheirincomesfallseemsstrangeandhasledtosomecriticismofrelativemeasuresofpoverty.Inperiodsoffallingincome,absolutemeasures,whichcapturechangesinthenumberswithincomesbelowafixedpoint,clearlydoaccordmorecloselywithourintuitionsaboutwhatconstitutespoverty.However,inthelongerrun,itislikelythatwecarenotonlyabouttheabsolutelivingstandardsofthepoor,butalsoaboutwhethertheyarekeepingupwithorfallingbehindtherestofsociety.Itisthereforeimportanttokeepbothabsoluteandrelativemeasuresofpovertyinmind–bothcontainimportantandusefulinformation.Thestorythatemergesfromthischapterandthelastisthatwhilst2010–11and2011–12weredifficultyearsforpoorerhouseholds,theydidnotwitnessquiteaslargeadropinlivingstandardsasmiddle-orhigher-incomehouseholds.TherehavealsobeendifferencesintheexperiencesofdifferentdemographicgroupsintheyearssincetheGreatRecessionhit.Fallsinrelativepensionerpovertysince2007–08havebeendrivenbystrongreal-termsgrowthintheirincomefromstatebenefitsandpensionsbetween2007–08and2009–10,andarelativelysmallreal-termsfallinthisincomesourcethereafter.Fallsinchildpovertyhavebeenconcentratedamongfamilieswithnooneinworkoronlypart-timeworkers,againsuggestinganimportantrolehasbeenplayedbybenefitsandtaxcredits.Ontheotherhand,risinglevelsofworklessnessand,toalesserextent,fallsinrealearningshavecontributedtoanincreaseinpovertyamongworking-ageadultswithoutchildren.Fallingratesofpovertyamongworklessfamilies,andrisingratesamongworkingfamilies,meanthatalmosttwo-thirdsofchildreninpovertyandalmostone-halfofpoorworking-ageadultswithoutchildrenwerelivinginafamilywithatleastoneworkerin2011–12.Analysissuggests,unsurprisingly,thatpovertyisconcentratedamongthoseworkinginlow-paysectorssuchasretail,hospitality,andresidentialcare,andthatitislowhourlywagesratherthanlowhoursofworkthataremoreassociatedwithpoverty.

Living standards, poverty and inequality: 2013
80
Thegrowingimportanceofthe‘workingpoor’,togetherwithreducedresourcesavailableforfiscalredistribution,willmeanreducingpovertyinthecomingyearswillrequireadifferentapproachfromwhatwasusedinthe2000storeducechildpoverty.Indeed,oncurrentforecasts,bothabsoluteandrelativeincomepovertyareexpectedtoincreasesubstantiallyamongchildrenandworking-ageadultsintheyearsahead,inlargepartduetocutstobenefitsandtaxcreditsenactedaspartofthegovernment’sfiscalconsolidation.Pensioners,whohavebeenrelativelyprotectedfromthechanges,arelikelytofareratherbetter.Thismeansthelong-runimprovementintherelativelivingstandardsofpensionerslookssettocontinue,whilsttherelativepositionofworking-ageadultswillcontinuetodecline.Chapters5and6examineindetailthechangesinlivingstandards,inequalityandpovertyfordifferentageanddemographicgroupsthathavetakenplacesincethe1960s,puttingmorerecentchangesandthenextfewyearsintheirproperhistoricalcontext.
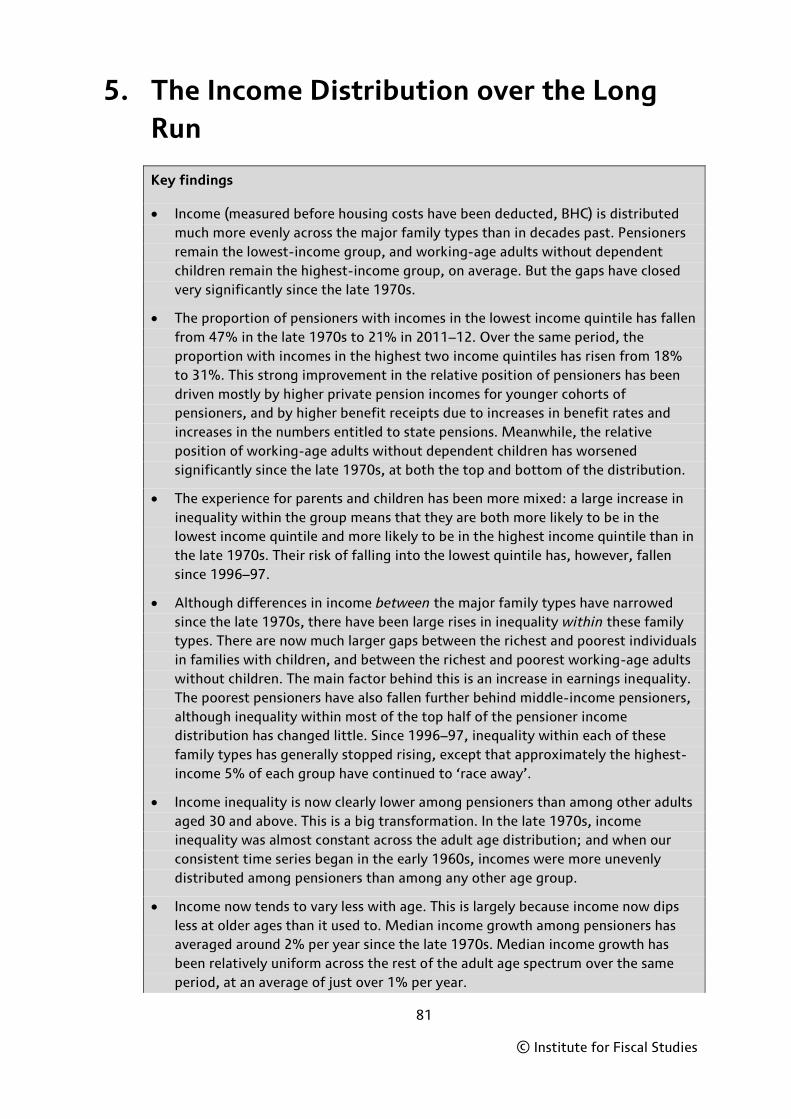
81
© Institute for Fiscal Studies
5. The Income Distribution over the LongRun
Key findings
Income (measured before housing costs have been deducted, BHC) is distributedmuch more evenly across the major family types than in decades past. Pensionersremain the lowest-income group, and working-age adults without dependentchildren remain the highest-income group, on average. But the gaps have closedvery significantly since the late 1970s.
The proportion of pensioners with incomes in the lowest income quintile has fallenfrom 47% in the late 1970s to 21% in 2011–12. Over the same period, theproportion with incomes in the highest two income quintiles has risen from 18%to 31%. This strong improvement in the relative position of pensioners has beendriven mostly by higher private pension incomes for younger cohorts ofpensioners, and by higher benefit receipts due to increases in benefit rates andincreases in the numbers entitled to state pensions. Meanwhile, the relativeposition of working-age adults without dependent children has worsenedsignificantly since the late 1970s, at both the top and bottom of the distribution.
The experience for parents and children has been more mixed: a large increase ininequality within the group means that they are both more likely to be in thelowest income quintile and more likely to be in the highest income quintile than inthe late 1970s. Their risk of falling into the lowest quintile has, however, fallensince 1996–97.
Although differences in income between the major family types have narrowedsince the late 1970s, there have been large rises in inequality within these familytypes. There are now much larger gaps between the richest and poorest individualsin families with children, and between the richest and poorest working-age adultswithout children. The main factor behind this is an increase in earnings inequality.The poorest pensioners have also fallen further behind middle-income pensioners,although inequality within most of the top half of the pensioner incomedistribution has changed little. Since 1996–97, inequality within each of thesefamily types has generally stopped rising, except that approximately the highest-income 5% of each group have continued to ‘race away’.
Income inequality is now clearly lower among pensioners than among other adultsaged 30 and above. This is a big transformation. In the late 1970s, incomeinequality was almost constant across the adult age distribution; and when ourconsistent time series began in the early 1960s, incomes were more unevenlydistributed among pensioners than among any other age group.
Income now tends to vary less with age. This is largely because income now dipsless at older ages than it used to. Median income growth among pensioners hasaveraged around 2% per year since the late 1970s. Median income growth hasbeen relatively uniform across the rest of the adult age spectrum over the sameperiod, at an average of just over 1% per year.
Living standards, poverty and inequality: 2013
82
Recently, the incomes of young adults have started to fall behind those of the restof the population. In the immediate pre-recession years between 2001–02 and2007–08, median income among adults in their 20s did not grow at all. Between2007–08 and 2011–12, median income among the group fell by an annual averageof about 3% per year – more than for any other group. This is not surprising giventheir falling employment rates during and since the recession, at a time whenemployment among older age groups has been remarkably robust.Themainfocusofthepreviouschaptershasbeenonrecenttrendsinincomes,includingthenewlyreleaseddatafor2011–12.Thischaptertakesalonger-termview.Weutilisethelongtimeseriesofconsistentincomedataavailableinordertoanalysesomeofthemajorchangestothewaythatincomesaredistributed,andtoplacemorerecenttrendsintheirhistoricalcontext.Inthelastfewdecades,therehavebeenmajorchangesintheeconomyandinsociety,andmanyoftheseaffectthedistributionoflivingstandards.Thedemographicstructureofthepopulationhaschanged.Forexample,therearenowmoreelderlypeopleandmoresingleparents.Bigpolicyreformshavealteredthewaythatsomeofthesegroupsaretreatedbyoursystemoftaxesandbenefits.Forexample,thebenefitssystemisfarmoregeneroustolow-incomepensionersandlow-incomefamilieswithchildrenthanitwas20yearsago.Wehaveseenchangesinthewaythatpeopleplanforretirement,suchastheriseofprivatepensions.Andthelabourmarkethaschangedradically.Loneparentsarenowmuchmorelikelytobeemployedthantheywere20yearsago.Theemploymentratesofyoungadultshaverecentlybeenfallingrapidly.Therewasalarge,well-documentedincreaseinearningsinequalityduringthe1980s,bothbetweenoccupationandeducationgroupsandwithinthosegroups.Lower-paidworkershavedonesomewhatbettermorerecently,dueatleastinparttotheintroductionofthenationalminimumwage.Butallthewhile,agroupofindividualsattheverytopoftheincomedistributionhavebeenpullingfurtherawayfromtherest.Weexploretheimplicationsofthesekindsofchangesforthelong-runevolutionoftheincomedistribution.Therearetwomainpartstothechapter:Section5.1focusesonlong-runchangesbyfamilytypeandSection5.2focusesonlong-runchangesbyage.Section5.3summarisesandconcludes.Thenextchapterexploresindetailtheimplicationsoflong-runchangesspecificallytowardsthebottomoftheincomedistribution,lookingatthechangingfaceofpoverty.
5.1 Changes by family typeWebeginwithananalysisofthemajorfamilytypes.Figure5.1splitsthepopulationintothreegroups–parentsandchildren,pensioners,andworking-ageadultswithoutdependentchildren.Itshowstheproportionsofthesegroupswithhouseholdincomesineachquintileoftheoverall(BHC)incomedistribution,in1978to1980,1996–97and2011–12(forbrevity,denotedinthefigureas‘1979’,87‘1996’and‘2011’respectively).87
Here and throughout the chapter, when analysing data before 1994, three years of data are pooled, to ensuresufficient sample sizes for the analysis to be robust. This is necessary because the pre-1994 data are from the FamilyExpenditure Survey, which contained a much smaller sample than the Family Resources Survey.
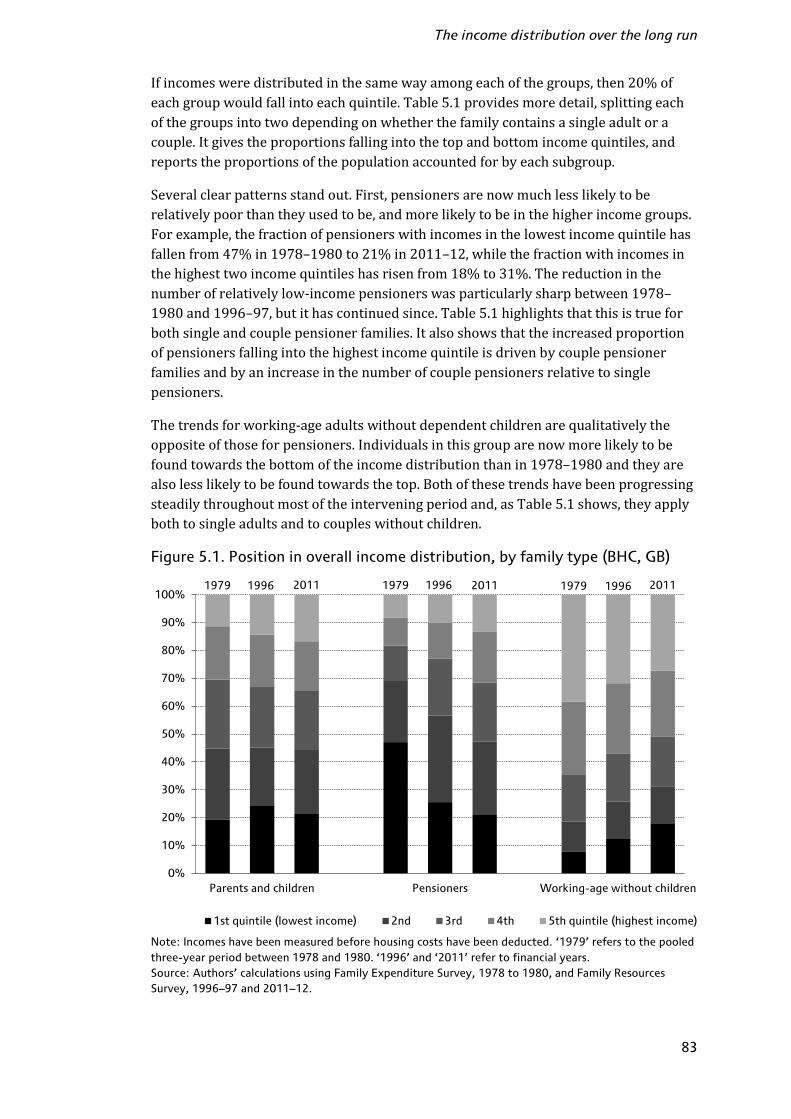
The income distribution over the long run
83
Ifincomesweredistributedinthesamewayamongeachofthegroups,then20%ofeachgroupwouldfallintoeachquintile.Table5.1providesmoredetail,splittingeachofthegroupsintotwodependingonwhetherthefamilycontainsasingleadultoracouple.Itgivestheproportionsfallingintothetopandbottomincomequintiles,andreportstheproportionsofthepopulationaccountedforbyeachsubgroup.Severalclearpatternsstandout.First,pensionersarenowmuchlesslikelytoberelativelypoorthantheyusedtobe,andmorelikelytobeinthehigherincomegroups.Forexample,thefractionofpensionerswithincomesinthelowestincomequintilehasfallenfrom47%in1978–1980to21%in2011–12,whilethefractionwithincomesinthehighesttwoincomequintileshasrisenfrom18%to31%.Thereductioninthenumberofrelativelylow-incomepensionerswasparticularlysharpbetween1978–1980and1996–97,butithascontinuedsince.Table5.1highlightsthatthisistrueforbothsingleandcouplepensionerfamilies.Italsoshowsthattheincreasedproportionofpensionersfallingintothehighestincomequintileisdrivenbycouplepensionerfamiliesandbyanincreaseinthenumberofcouplepensionersrelativetosinglepensioners.Thetrendsforworking-ageadultswithoutdependentchildrenarequalitativelytheoppositeofthoseforpensioners.Individualsinthisgrouparenowmorelikelytobefoundtowardsthebottomoftheincomedistributionthanin1978–1980andtheyarealsolesslikelytobefoundtowardsthetop.Bothofthesetrendshavebeenprogressingsteadilythroughoutmostoftheinterveningperiodand,asTable5.1shows,theyapplybothtosingleadultsandtocoupleswithoutchildren.Figure 5.1. Position in overall income distribution, by family type (BHC, GB)
Note: Incomes have been measured before housing costs have been deducted. ‘1979’ refers to the pooledthree-year period between 1978 and 1980. ‘1996’ and ‘2011’ refer to financial years.Source: Authors’ calculations using Family Expenditure Survey, 1978 to 1980, and Family ResourcesSurvey, 1996–97 and 2011–12.
1979 1996 2011 1979 1996 2011 1979 1996 2011
0%
10%
20%
30%
40%
50%
60%
70%
80%
90%
100%
Parents and children Pensioners Working-age without children
1st quintile (lowest income) 2nd 3rd 4th 5th quintile (highest income)

Living standards, poverty and inequality: 2013
84
Table 5.1. Position in overall income distribution, by detailed family type (BHC,GB)
Single,no
children
Couple,no
children
Singleparents
Coupleswith
children
Singlepensioners
Couplepensioners
1978–1980% of population 15% 19% 4% 45% 8% 9%
Lowest-income fifth 10% 6% 47% 17% 55% 41%
Highest-income fifth 31% 45% 4% 12% 7% 9%
1996–97% of population 16% 21% 8% 37% 8% 10%
Lowest-income fifth 16% 9% 48% 19% 31% 22%
Highest-income fifth 24% 38% 3% 17% 6% 13%
2011–12% of population 18% 20% 8% 35% 7% 12%
Lowest-income fifth 24% 13% 31% 19% 26% 18%
Highest-income fifth 20% 34% 3% 20% 7% 17%Note: Incomes have been measured before housing costs have been deducted.Source: Authors’ calculations using Family Expenditure Survey, 1978 to 1980, and Family ResourcesSurvey, 1996–97 and 2011–12.Thestoryismoremixedforindividualsinfamilieswithchildren.Thisgroupisnowsomewhatmoreconcentratedinthebottomincomequintileandinthetopincomequintilethanin1978–1980.Theirincreasedprominenceatbothendsofthedistributionreflectsawideningofincomeinequalitywithinthegroup(shownexplicitlylater,inFigure5.2).Thebarfor1996–97alsoshowsthattrendsatthebottomendhavenotbeenuniform.Thesmalloverallincreaseinthegroup’slikelihoodoflowincomeovertheperiodisduetoamoresubstantialriseduringthe1980spartlyoffsetbyafallduringthelate1990sand2000s.Table5.1highlightsariseintheincidenceofloneparenthood,andacorrespondingdeclineinthenumberofcoupleswithchildren,between1978–1980and1996–97–ademographicchangethatcontributedtotheincreasedlikelihoodoflowincomeinfamilieswithchildrenovertheperiod.Theproportionofindividualsinlone-parentfamilieshasstabilisedsince1996–97,andtheriskoffallingintothelowestincomequintileinthatgrouphasfallensubstantially,from48%to31%(thegroupremainveryunlikelytobeinthehighestincomequintile).Individualsincouplefamilieswithchildren,meanwhile,arenowmuchmorelikelytobeinthehighestincomequintilethanin1978–1980,butnolesslikelytobeinthelowestincomequintile.Insummary,thissuggeststhattheoverallincreaseininequalityamongindividualsinfamilieswithchildrenisdrivenbygreaterinequalityamongstcoupleswithchildrenandbyanincreaseinthenumberoflone-parentfamilies(asmallandpoorergroup);inequalitybetweenthoseinlone-parentfamiliesandthoseincouple-parentfamilieshasactuallydecreased.

The income distribution over the long run
85
Figure 5.2. Real income growth by percentile point for different family types(BHC, GB)
1978–1980 to 2011–12
1978–1980 to 1996–97
1996–97 to 2011–12
Note: The changes in income at the 1st, 2nd and 99th percentiles are not shown on this graph due to high levels ofstatistical uncertainty. Incomes have been measured before housing costs have been deducted. Since the distributionsof household income in different family types are different, the same percentile points of each distribution do notcorrespond to the same absolute income levels.Source: Authors’ calculations using Family Expenditure Survey, 1978 to 1980, and Family Resources Survey, 1996–97and 2011–12.
-1%
0%
1%
2%
3%
4%
10 20 30 40 50 60 70 80 90
Ann
ualincomechan
geParents and children Pensioners Working-age without children
Percentile point
-1%
0%
1%
2%
3%
4%
10 20 30 40 50 60 70 80 90
Ann
ualincomechan
ge
Percentile point
-1%
0%
1%
2%
3%
4%
10 20 30 40 50 60 70 80 90
Ann
ualincomechan
ge
Percentile point

Living standards, poverty and inequality: 2013
86
Aconsequenceofthesecombinedchangesisthattheincomesofthemajorfamilytypesnowlookmuchmoresimilarthanusedtobethecase.Ofthethreegroups,thehighest-incomeone–theworking-agechildless–isnowlessover-representedatthetopofthedistributionthanitusedtobe;andthelowest-incomegroup–pensioners–ismuchlessover-representedatthebottom.Infact,theriskoflowincome(measuredBHC)isnowsimilarforallthreegroups.Thisisabigtransformation:inthelate1970s,theprobabilitythatapensionerwasinthelowestincomequintilewasmorethandoublethatforanindividualinafamilywithchildren,whichwasitselfdoublethatforaworking-ageindividualwithoutchildren.88Wenowexamineindetailtheabsolutechangesinincomethatunderlietheseshiftingpositionsofthefamilytypesintheoverallincomedistribution.Figure5.2showsrealincomechangesateachpercentilepointofthedistributionsforparentsandchildren,pensioners,andtheworking-agechildlessforthewholeperiodbetween1978–1980and2011–12(toppanel),andalsosplitsbetweentheperiodsbeforeandsince1996–97(middleandbottompanelsrespectively).89OneofthemoststrikingfeaturesofFigure5.2isthecomparativeincomegrowthacrossfamilytypes.Figure5.1suggestedthatpensionershaveseenhigherproportionateincomegrowththanparentsandchildren,whointurnhaveseenhighergrowththanworking-ageadultswithoutchildren.Figure5.2makesclearthatthisistrueacrossalmosttheentiredistribution,i.e.whencomparingthepoorestpensionerswiththepoorestworking-ageadultswithoutchildren,comparingthemedianpensionertothemedianchildlessworking-ageadult,andsoon.Thelargestdifferencesareinthemiddleofthedistributions–wherepensionershavehigherincomegrowththanotherfamilytypes–andatthebottom,whereworking-ageadultswithoutchildrenhaveseenlowerincomegrowththanothers.Infact,incomesforthebottom10%oftheworking-agechildlesshavebarelychangedatallsince1978–1980.Therehavetendedtobesmallerdifferencesinincomegrowthbetweenfamilytypestowardsthetopofthedistribution,however.Thehighest-income5%withineachfamilytypehaveallseensimilar,andstrong,incomegrowthofabout2%peryearormoresince1978–1980.90Since1978–1980,incomeswithineachofthegroupshavegenerallybecomemoreunequallydistributed.Thisismoststrikingfornon-pensioners,forwhomincomegrowthhasbeenunambiguouslyinequality-increasingovertheperiod–thatis,growthhasbeenhigherathigherpointsinthedistribution,regardlessoftheregionofthedistribution.Thiswasmostlyduetothelargeincreaseininequalityduringthe1980s,asevidencedbythemiddleandlowerpanels.Previousworkhasshownthatakeyfactorbehindthiswasariseinearningsinequalitiesbetweenhighandloweducationgroups,andbetweenhigher-andlower-paidoccupations,aswellasrisingearnings88
This has clear implications for the long-run changes in patterns of income poverty, which are explored in detail inChapter 6.
89Note that, since the distributions of household income in different family types are different, the same percentile
points of each distribution do not correspond to the same absolute income levels.
90Brewer, Sibieta and Wren-Lewis (2008) analyse in detail trends at the very top of the income distribution (up to
2004–05).
The income distribution over the long run
87
inequalitieswithinthesegroups.91Risesinincomeinequalityhavetendedtoslowdownorstopaltogethersince1996–97,exceptthatapproximatelythehighest-income5%ofeachfamilytypehavecontinuedto‘raceaway’.Inequalitywithinthemiddle80%ofindividualsinfamilieswithchildrenhasactuallynarrowedsince1996–97,butthishasonlypartiallyoffsettheearlierrisesininequalityamongthegroup.Forpensioners,thepatternofincomechangeshasalsobeeninequality-increasingwithinthebottomhalf–again,mostlyduetochangesbetween1978–1980and1996–97.And,aswithnon-pensioners,thehighest-income5%havecontinuedtopullfurtheraway(bothbeforeandafter1996–97).However,incomegrowthhasbeenuniformorslightlyinequality-reducingwithinthefifthtoninthdecilegroupsofthepensionerincomedistribution.Akeyimplicationoftheanalysispresentedsofaristhatthesubstantialriseinincomeinequalitysincethelate1970s(seeChapter3)hasbeendrivenbyrisesininequalitywithin–ratherthanbetween–themajorfamilytypes.Theincomedistributionsofthesefamilytypesactuallylookmorealikethantheyusedto.ThistallieswithanalysisinBrewer,MurielandWren-Lewis(2008).Onthebasisofresultsfromadecompositionanalysisofchangesininequalitysince1968,thoseauthorsconcludedthat‘changesinincomeinequalityarelargelyaccountedforbywithin-family-typeinequalitychanges’(p.33).Theyalsonotedthat‘...loneparentsandpensionerhouseholds...haveseentheiraverageincomesincreaseoverthecourseofthe1990sand2000s,whichhasactedtoreducebetween-groupinequality’(p.33).Qualitatively,thesametrendsdiscussedsofarareevidentwhenusinganafter-housing-costs(AHC)measureofincome.(Figures5.1and5.2arereproducedonanAHCbasisasFiguresE.1andE.2inAppendixE.)ThemostnoticeableeffectofusinganAHCmeasuretolookatwherefamilytypesfitintotheincomedistributionistolowertheriskoflowincomeforpensioners,andparticularlysoinmorerecentyears(i.e.itexaggeratesfurtherthetrendsseenforBHCincomediscussedabove).Inotherwords,low-incomepensionerstendtohavelowerhousingcoststhanthelow-incomeworking-agepopulation,andthisdifferentialhaswidenedasincreasingnumbersoflow-incomepensionershavecometoowntheirhomesoutrightandthereforefacenomortgageinterestpaymentsorrent(seeSection6.2).AshighlightedinChapter4,onanAHCbasistheriskoflowincomeisnowlowerforpensionersthanfortheworking-agechildlessandforparentsandchildren.BrewerandO’Dea(2012)constructameasureof‘broadincome’,whichaddstoBHCincomethedifferencebetweentheestimatedflowofconsumptionfromhousingservicesandthehousingcostsfaced,andthissimilarlyimprovestheapparentrelativepositionofpensioners.Theflipsideofthisisthatlow-incomeworking-ageadultswithoutchildrenhavedoneevenworsesince1978–1980onanAHCbasisthanonaBHCbasis:realAHCincomeshavefallenorstayedthesameforthelowest-income20%oftheworking-agechildlesssince1978–1980.Incomeamonglow-incomeindividualsinfamilieswithchildrenalsoperformedlesswellonanAHCbasisthanaBHCbasisbetween1978–1980and2011–12(drivenlargelybyapoorerperformanceinthe1980sandearly1990s).91
Brewer, Muriel and Wren-Lewis, 2008.

Living standards, poverty and inequality: 2013
88
Insummary,theanalysispresentedsofarhasshownthatincomesaredistributedmuchmoreevenlyacrossthemajorfamilytypesthanindecadespast.Pensionersremainthelowest-incomegroup,andworking-ageadultswithoutdependentchildrenremainthehighest-incomegroup,onaverage.Butthegapshaveclosedverysignificantlysincethelate1970s.Giventhewell-documentedriseinoverallincomeinequalityovertheperiod,thismaycomeasasurprise.Thesefactsarereconciledbecauseinequalitieswithinfamilytypeshavegenerallyincreased,particularlyamongnon-pensioners.Thegrowthininequalitybetweentheveryhighest-incomemembersofeachfamilytype(approximatelythetop5%)andtheresthasbeenparticularlysharp.Thefollowingsubsectionsinvestigatethereasonsforthedifferencesinincomegrowthbetweenfamilytypessince1978–1980.Welookfirstinmoredetailatthereasonsfortherapidgrowthinpensionerincomesacrossthedistributionsince1978–1980,andthenatthereasonsforthehigherincomegrowthamongfamilieswithchildrenthanamongtheworking-agechildlesssince1996–97.Drivers of growth in pensioner incomes since 1978–1980Figure5.3showstheaverageamountofincomecomingfromdifferentsourcesineachquintileofthepensionerincomedistribution,inboth1978–1980and2011–12.Itshowsthatthestronggrowthinpensionerincomesoverthisperiodisprimarilyduetogrowthinstatebenefitsandinprivatepensionincomes.Figure 5.3. Pensioner income sources by pensioner income quintile (BHC, GB)
Note: All monetary amounts have been equivalised using the modified OECD equivalence scale and areexpressed in terms of equivalent amounts for a childless couple. The highest-income 1% of pensioners ineach period have been dropped from the analysis, as the net income components of the very richest arenot available on a consistent basis back to 1978. Those whose income components sum to a negativenumber are also excluded, as their measured income in the HBAI series would be set to zero (i.e. it wouldnot equal the sum of their income components).Source: Authors’ calculations using Family Expenditure Survey, 1978 to 1980, and Family ResourcesSurvey 2011–12.
2011–121978–1980
-100
0
100
200
300
400
500
600
700
800
900
1,000
1 2 3 4 5 All 1 2 3 4 5 AllContribu
tionto
inco
me(2011–1
2,£
perwee
k)
Pensioner income quintile
State pension and benefits Private pensions
Savings and investments Earnings and self-employment income
Other Deductions
The income distribution over the long run
89
Benefitsincomeisbyfarthelargestincomesourceforlower-incomepensioners.Itthereforeexplainsalargemajorityoftheoverallgrowthintheirincomessince1978–1980.Anditexplainsarelativelysmallfractionofthegrowthinincomestowardsthetopofthepensionerincomedistribution.Nevertheless,thefigureshowsthatincreasesinpensionerbenefitshaveactuallybeenspreadwidelythroughoutthedistribution.Infact,realbenefitincomehasincreasedmoreatthetopofthepensionerincomedistribution(bothincashtermsandproportionately)thanatthebottom.Forexample,benefitsgoingtothehighest-income40%ofpensionershavedoubledsince1978–1980.Thislikelyreflectstherelativelysmallroleofmeans-testinginthepensionerbenefitssystemandhencelackoftargetingonthoseonlowincomesrelativetotheworking-agewelfaresystem.92Inparticular,youngercohortsofpensionershavebeenretiringwithhigherentitlementsto(non-means-tested)statepensionsthantheirpredecessors.ThefirstindividualswithfullentitlementstotheStateEarnings-RelatedPensionScheme(SERPS)retiredin1998,andspendingonadditionalstatepensions(i.e.beyondthebasicstatepension)trebledbetween1997–98and2010–11.93Notethatthechangesmadetopensionerbenefitrateshavehadasomewhatdifferentdistributionalimpact,particularlyundertheperiodofLabourgovernment,whentheinceptionandexpansionofpensioncreditweremuchmorefocusedonlower-incomepensionersthanthepatternofbenefitincreasesshowninFigure5.3(seeFigure5.4later).Privatepensionsarethesecondincomesourcethathasgrowndramaticallyforpensionerssince1978–1980.Theyhavebeenbyfarthebiggestcontributortogrowthinincomesatthetopofthepensionerincomedistribution.Incomefromthissourcehasincreasedmorethanfourfoldforthehighest-income20%ofpensionersovertheperiod,andhasdoubledasashareoftheirtotalnetincome,from18%to36%.Incomefromearningsandself-employmenthasbeenthemainincomesourcetocorrespondinglydeclineinrelativeimportanceforhigh-incomepensioners,fallingasashareofincomeforthetoppensionerquintilefrom48%to26%.Privatepensionincomeremainsarelativelylowshareoftotalincomeforthelowest-incomepensioners,soisfarlessimportantthanbenefitsincomeinexplainingincomegrowthatthebottomofthepensionerincomedistribution.Nevertheless,proportionategrowthinprivatepensionincomehasbeenhighforlow-incomegroupstoo:ithasincreasedalmostsixfold,andhasgrownfrom4%to15%asashareoftotalincome,withinthebottomtwopensionerincomequintilessince1978–1980.Itisthusnotsurprisingthatprivatepensionsappeartohaveplayedanimportantroleinreducingpensionerpoverty(seeSection6.2).Non-pensioners in families with and without children since 1996–97Figure5.2showedthatincomegrowthforindividualsinfamilieswithchildrenhasbeenhigherthanthatforworking-ageadultswithoutchildrensince1996–97.Thispatternwasnotevidentthroughoutmostofthedistributionintheearlierperiod92
See also Browne, Hood and Johnson (2013).
93Browne, Hood and Johnson, 2013.

Living standards, poverty and inequality: 2013
90
between1978–1980and1996–97.Wenowinvestigatethereasonsforthisdivergenceoverthelast15years.Weshowthatthekeyfactorsseemtobebenefitandtaxcreditincreases,andsomedifferencesinearningsgrowthamongworkingparentsrelativetoworkingnon-parents.Whentryingtoexplainchangesoveranumberofyears,oneimportantfactortoconsideristheroleofbasicdemographicchange.Forexample,familieswithchildrenin2011–12tendtohavefewerchildrenthanfamilieswithchildrenhadin1996–97.TheproportionoffamilieswithchildreninGreatBritainwhohaveonechildhasrisenfrom42%to50%,whiletheproportionwhohaveatleastthreechildrenhasfallenfrom17%to12%.94Becausefamilieswithmorechildrentendtohavelower(equivalised)householdincomes,themechanicaleffectofthisdemographicchangeistoraisetheincomesoffamilieswithchildren,allelseequal–bothinabsolutetermsandrelativetofamilieswithoutchildren.However,thischangedoesnotaccountforthesubstantialdifferencesbetweentheincomegrowthseeninfamilieswithandwithoutchildrensince1996–97.Thisisevidentfromcomparingnon-pensionersinfamilieswithoutchildrenandindividualsinfamilieswithagivennumberofchildren(sothatchangesinthenumberofchildrenthatfamiliesarehavingcannotplayarole).Whenthisisdone,oneobtainsthesameresultasimpliedbyFigure5.2:havingagivennumberofchildrenisnowassociatedwithasubstantiallysmallerreductioninincome–relativetohavingnochildren–thanitwasin1996–97.QuantileregressionestimatespresentedinAppendixFshowthatthisistrueatthe20thpercentile,atthemedianandatthe80thpercentile.Theanalysisalsoshowsthatthisstillappliesifparents’agesarecontrolledfor;inotherwords,changestotheagesatwhichpeoplehavechildrensince1996–97donotaccountforthefasterincomegrowthinfamilieswithchildrenovertheperiodeither.Sowhatcanaccountforthedifferences?Focusingfirstonthebottomoftheincomedistribution,Figure5.4highlightsthatlow-incomehouseholdswithchildren(andpensionerhouseholds)benefitedfarmorefromdirecttaxandbenefitchangesbetween1996–97and2011–12thanlow-incomeworking-agehouseholdswithoutchildren.ThisisduetolargeincreasesinstatesupportaimedprimarilyatthisgroupunderLabour–inparticular,thegrowthofthetaxcreditsystem.Overall,governmentspent£18billionmoreonbenefitsandtaxcreditsaimedatfamilieswithchildrenin2010–11thanitwouldhavedoneifithadjustupratedthesysteminlinewiththedefaultsinheritedin1997.95Asubstantialriseinthelone-parentemploymentratealsoplayedaroleinboostingincomesforsomelower-incomefamilieswithchildren,particularlyinthelate1990sandearly2000s.Butthishasbeenshowntoaccountformuchlessofthegroup’sincomegrowthovertheperiodthanbenefitincreases.9694
Source: authors’ calculations using Family Resources Survey, 1996–97 and 2011–12.
95Browne and Phillips, 2010. The increases in entitlements started to be unwound in April 2011 as part of the fiscal
tightening but, even by the end of the parliament, they will have been unwound only partially (Browne, Hood andJohnson, 2013).
96Joyce and Sibieta, 2013.
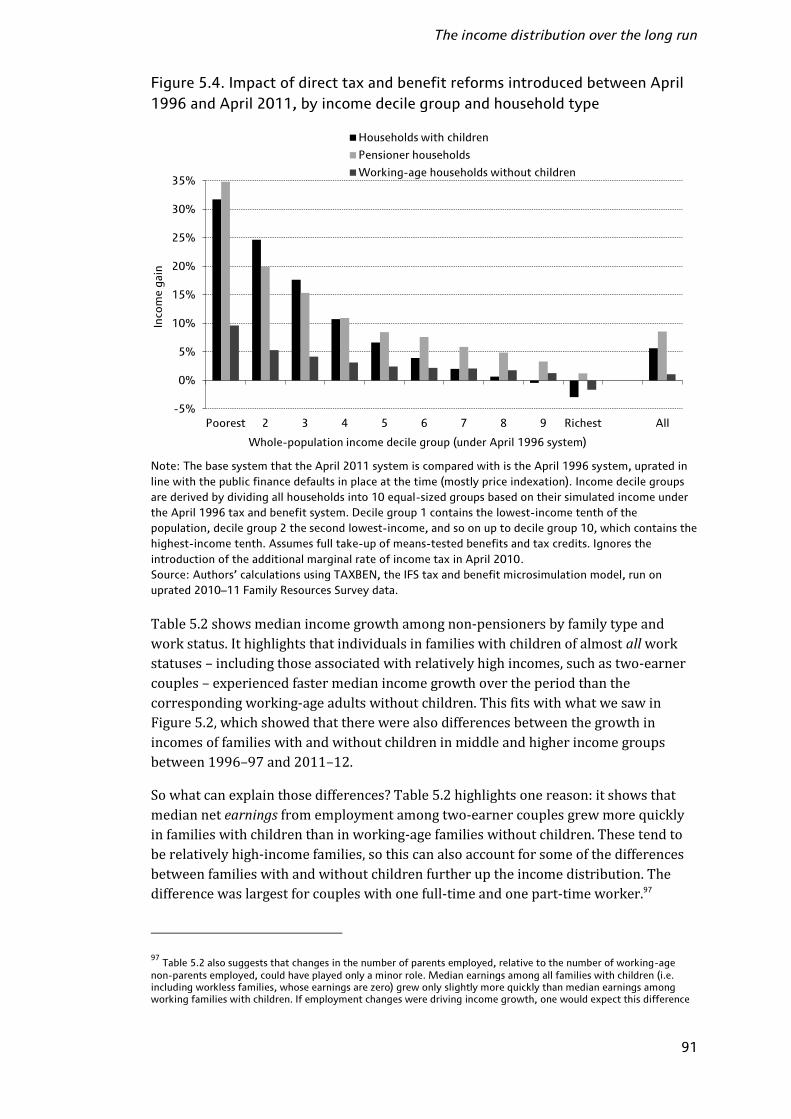
The income distribution over the long run
91
Figure 5.4. Impact of direct tax and benefit reforms introduced between April1996 and April 2011, by income decile group and household type
Note: The base system that the April 2011 system is compared with is the April 1996 system, uprated inline with the public finance defaults in place at the time (mostly price indexation). Income decile groupsare derived by dividing all households into 10 equal-sized groups based on their simulated income underthe April 1996 tax and benefit system. Decile group 1 contains the lowest-income tenth of thepopulation, decile group 2 the second lowest-income, and so on up to decile group 10, which contains thehighest-income tenth. Assumes full take-up of means-tested benefits and tax credits. Ignores theintroduction of the additional marginal rate of income tax in April 2010.Source: Authors’ calculations using TAXBEN, the IFS tax and benefit microsimulation model, run onuprated 2010–11 Family Resources Survey data.Table5.2showsmedianincomegrowthamongnon-pensionersbyfamilytypeandworkstatus.Ithighlightsthatindividualsinfamilieswithchildrenofalmostallworkstatuses–includingthoseassociatedwithrelativelyhighincomes,suchastwo-earnercouples–experiencedfastermedianincomegrowthovertheperiodthanthecorrespondingworking-ageadultswithoutchildren.ThisfitswithwhatwesawinFigure5.2,whichshowedthattherewerealsodifferencesbetweenthegrowthinincomesoffamilieswithandwithoutchildreninmiddleandhigherincomegroupsbetween1996–97and2011–12.Sowhatcanexplainthosedifferences?Table5.2highlightsonereason:itshowsthatmediannetearningsfromemploymentamongtwo-earnercouplesgrewmorequicklyinfamilieswithchildrenthaninworking-agefamilieswithoutchildren.Thesetendtoberelativelyhigh-incomefamilies,sothiscanalsoaccountforsomeofthedifferencesbetweenfamilieswithandwithoutchildrenfurtheruptheincomedistribution.Thedifferencewaslargestforcoupleswithonefull-timeandonepart-timeworker.9797
Table 5.2 also suggests that changes in the number of parents employed, relative to the number of working-agenon-parents employed, could have played only a minor role. Median earnings among all families with children (i.e.including workless families, whose earnings are zero) grew only slightly more quickly than median earnings amongworking families with children. If employment changes were driving income growth, one would expect this difference
-5%
0%
5%
10%
15%
20%
25%
30%
35%
Poorest 2 3 4 5 6 7 8 9 Richest All
Inco
mega
in
Whole-population income decile group (under April 1996 system)
Households with children
Pensioner households
Working-age households without children

Living standards, poverty and inequality: 2013
92
Table 5.2. Changes in median income and earnings among non-pensionersbetween 1996–97 and 2011–12, by family type and work status (BHC, GB)
Average annual medianincome growth
Average annual medianearnings growth
Withchildren
Withoutchildren
Withchildren
Withoutchildren
SinglesFull-time 0.7% 0.4% –0.1% 0.5%
Part-time 2.0% 0.6% 1.8% 1.1%
Out of work 2.0% 1.0% n/a n/a
CouplesSelf-employed 0.4% 0.7% –0.1% 0.7%
2 full-time 0.6% 0.3% 0.6% 0.4%
1 full-time, 1 part-time 0.9% 0.4% 0.9% 0.1%
1 full-time 0.5% –0.1% –0.3% 0.2%
1 or 2 part-time 2.1% 0.1% 1.7% 1.5%
Out of work 1.9% 0.7% n/a n/a
All in working families 0.7% 0.4% 0.3% 0.4%All 1.1% 0.3% 0.5% 0.4%Note: Incomes have been measured before housing costs have been deducted.Source: Authors’ calculations using Family Resources Survey, 1996–97 and 2011–12.Second,evenfurtheruptheincomedistribution,familieswithchildrentendedtobenefitmorefromtaxandbenefitchangesthantheworking-agechildless.Table5.3showsthecontributionstoincomegrowthofdifferentsourcesofincomewithineachincomequintile,separatelyfornon-pensionersinfamilieswithandwithoutchildren.Ithighlightsthatgrowthinbenefitandtaxcreditincomeexplainsmuchofthedifferencebetweenfamilieswithandwithoutchildrenasfarupasthefourthincomequintile.Itaccountedfor0.8and0.4percentagepointsofaverageannualincomegrowthinthethirdandfourthquintilesofindividualsinfamilieswithchildrenovertheperiod.Thecorrespondingnumbersforworking-ageadultswithoutchildrenarejust0.1and0.0percentagepoints.Thedistributionalimpactofreformstodirecttaxesandbenefitsovertheperiod,aswasshowninFigure5.4,alsosuggeststhathouseholdswithchildrengainedmorefromthesethanworking-agehouseholdswithoutchildrenevenasfarupasthesixthwhole-populationdecilegroup.(Notealsothathouseholdswithchildreninthesixthwhole-populationdecilegroupwilltendtobeevenfurtherupthedistributionofhouseholdswithchildren.)Contributingfactorsincludethefamilyelementofthechildtaxcredit,98andasubstantialincreasein(non-means-tested)childbenefitin1999.to be substantial. In addition, much of the increase in parental employment that did occur over the period was amonglone parents (Joyce and Sibieta, 2013), and working lone parents are still unlikely to be high up the incomedistribution.
98This is worth £545 per year and, until April 2011, families were entitled to it in full until their incomes reached
£50,000. This threshold was reduced to £40,000 in April 2011, and in April 2012 the family element started to bewithdrawn as soon as other tax credit entitlements are exhausted.

The income distribution over the long run
93
Table 5.3. Percentage point (ppt) contributions to average annual incomegrowth among non-pensioners between 1996–97 and 2011–12, by incomequintile (BHC, GB)
Within-groupincome quintile
Earnings andself-employment
income
Benefitsand taxcredits
Deductions Otherincomesources
All
Families withchildren1st (lowest income) 1.3ppts 0.2ppts –0.2ppts 0.1ppts 1.4ppts
2nd 1.2ppts 0.7ppts –0.1ppts 0.0ppts 1.8ppts
3rd 0.5ppts 0.8ppts –0.1ppts 0.0ppts 1.2ppts
4th 0.8ppts 0.4ppts –0.1ppts 0.1ppts 1.2ppts
5th (highest income) 1.9ppts 0.1ppts –0.1ppts 0.1ppts 1.9ppts
All 1.2ppts 0.4ppts –0.1ppts 0.1ppts 1.6ppts
Families withoutchildren1st (lowest income) 0.9ppts –0.4ppts –0.2ppts –0.1ppts 0.2ppts
2nd 0.5ppts 0.1ppts –0.1ppts 0.0ppts 0.6ppts
3rd 0.3ppts 0.1ppts –0.1ppts 0.1ppts 0.5ppts
4th 0.4ppts 0.0ppts –0.1ppts 0.1ppts 0.5ppts
5th (highest income) 0.9ppts 0.0ppts –0.1ppts 0.0ppts 0.8ppts
All 0.6ppts 0.0ppts –0.1ppts 0.1ppts 0.6pptsNote: The highest-income 1% of each family type in each period have been dropped from the analysis, asthe net income components of the very richest are not available on a consistent basis back to 1996–97.Those whose income components sum to a negative number are also excluded, as their measured incomein the HBAI series would be set to zero (i.e. it would not equal the sum of their income components).Source: Authors’ calculations using Family Resources Survey, 1996–97 and 2011–12.Table5.3alsohighlightsthat,inadditiontomorerapidgrowthinentitlementstobenefitsandtaxcredits,low-incomefamilieswithchildrensawsubstantiallygreatergrowthinearnedincomeasparentalemploymentratesincreased.Itisworthbearinginmindthatthisincreaseinprivateincomeactstoreduceentitlementstomeans-testedbenefits.ThishelpstoexplaintherelativelysmallroleofbenefitandtaxcreditincomeinaccountingforincomegrowthwithinthelowestincomequintileoffamilieswithchildrenintheHBAIdata,despitethegenerosityofpolicychangesthatincreasedbenefitratesforthegroup(asshowninFigure5.4).99Insummary,thelargestdifferencesbetweentheincomegrowthofnon-pensionersinfamilieswithandwithoutchildrensince1996–97havebeentowardsthebottomoftheincomedistribution.Themajordriverofthosedifferenceshasbeenthefactthatbenefitandtaxcreditincreasesovertheperiodhavebeenparticularlygeneroustofamilieswithchildren.Forhigherincomegroups,thesmallerdifferencesinincomegrowth99
Note also that Figure 5.4 assumes full take-up of benefits, whereas many of those with the lowest incomes are thosenot taking up their entitlements in full; and low-income individuals who receive very large increases in benefitentitlements may move out of the bottom quintile as a result, and hence that additional benefit income would beattributed to the second quintile group.

Living standards, poverty and inequality: 2013
94
betweennon-pensionersinfamilieswithandwithoutchildrenareduetoacombinationofbenefitchangesandpatternsofearningsgrowth.5.2 Changes by ageWehaveseenthatpensionersnowtendtohavemuchhigherincomesrelativetonon-pensionersthanusedtobethecase.Contrastingly,therehasbeenconcernrecentlyabouttheeconomicplightofyoungadultsduetothefallinemploymentamongthegroupsincetherecession.Thissectionlooksattrendsinincomesbyage.Webeginbysettingoutwhatincomeslooklikeforindividualsofdifferentagesandhowthishaschanged.Wethenlookinmoredetailatwhathasbeenhappeningateachendoftheadultagespectrum.Asintherestofthisreport,thefocusisonhouseholdequivalisedincomesunlessotherwisestated.Therefore,aperson’sincomecanincludetheindividualincomeofsomeoneofadifferentage,iftheyliveinthesamehousehold.Thisismostobviousandimportantforchildren,whousuallydonothaveincomeoftheirownbutwhoseparentstypicallydo.Italsotendstoberelativelyimportantforyoungadults.Towardstheendofthesection,weexplicitlylookattheroleofotherhouseholdmembers(forexample,parents)indeterminingthehouseholdincomesofyoungadultsandweseparatethisfromtheimpactsoftrendsintheindividualincomesofyoungadultsandtheirpartners.Asalways,equivalisationisalsoanimportantprocesswhenattemptingtoconstructameasureofhouseholdincomesthatreflectsthemateriallivingstandardsofhouseholdsofdifferentsizesandstructures.Aswepointoutbelow,equivalisationhasanimportantimpactonthepatternofincomesbyage,becauseadultstendtohavedependentchildrenatparticularstagesinthelifecycle.Median income by ageFigure5.5showsmedianBHCincomeacrosstheagedistributionforanumberofyearssincethe1960s,groupingindividualsintofive-yearagebands.Throughouttheperiod,incomeshavebeenrelativelyhighforthoseintheir20sandthoseintheirearly50s.Thisisapproximatelywhatwewouldexpect.Youngeradultsarelesslikelytohavechildrenthanthoseintheir30sand40s.Havingchildrenbothreducesmateriallivingstandardsatagivenlevelofincome(whichisaccountedforherethroughequivalisation)andisassociatedwithloweremploymentrates(andfull-timeemploymentrates).Thesecondpeakinindividuals’early50salsomakessensegiventhatthisisaroundthetimedependentchildrentypicallystarttoleavethefamilyhomeandgiventhatworkingindividualsaregenerallyabletocommandhigherwagesastheyageduetoreturnstoexperience.Onanunequivalisedbasis,incomestendtopeakbetweenthemid-30sandmid-50s,whichhighlightstheimportanceofchangingfamilystructureoverthelifecycle.Childrenandtheelderlyhavethelowest(equivalised)householdincomes–theformerforthereasonsjustdiscussedandthelatterbecausetheyarelesslikelytohavelabourmarketincome.

The income distribution over the long run
95
Figure 5.5. Median income by age (BHC, GB)
Note: All monetary amounts have been equivalised using the modified OECD equivalence scale and areexpressed in terms of equivalent amounts for a childless couple. Incomes have been measured beforehousing costs have been deducted.Source: Authors’ calculations using Family Expenditure Survey and Family Resources Survey, variousyears.Theshapesoftheage–incomeprofileshavechangedovertime.Incomenowvarieslesswithadultagethaninthepast,andinparticularitclearlydeclineslessrapidlyatolderages.In1978–1980,medianBHCincomeamong65-to69-year-oldswasatleastone-thirdlowerthaninanyofthefive-yearagebandsbetween25–29and40–44.In2011–12,thedifferenceisnogreaterthan13%.Asindicatedbytheanalysisintheprevioussection,the‘catchingup’ofincomesatolderageshashappenedpartlyoverthepastdecade.Infact,Figure5.5showsthatover-60saretheonlyadultagegroupsforwhichmedianincomeisanyhigherthanitwasforindividualsofthesameagein2001–02.100Thefigurealsosuggeststhattheincomesofpeopleintheir20shavebeguntofallbehindmuchoftherestofthepopulationsince2001–02.Thetreatmentofhousingcostsisparticularlyimportantwhenlookingatincomedifferencesbyage.Pensionersaremorelikelythanworking-ageindividualstoownhomesoutright,whichimpliesnotneedingtospendanyoftheirBHCincomeonmortgagepaymentsorrents.Anddifferentialsinhousingcostsacrosstheagedistributionhavechangedovertime.Thepriceofrentalaccommodation,which100
Note, however, that incomes at older ages had been catching up proportionately before 2001–02 as well. This isbrought out more clearly later in Figure 5.7, which looks at percentage growth in incomes rather than cash amounts.
100
150
200
250
300
350
400
450
500
550
600Med
ianinco
me(£
perwee
k)
1961–1963 1978–1980 2001–02 2007–08 2011–12
Age

Living standards, poverty and inequality: 2013
96
working-ageindividualsarerelativelylikelytoinhabit,hasrisenrapidlyrelativetoowner-occupiedhousingcosts,whichtendtobemoreimportantforpensioners.101Therefore,theincreaseinpensionermedianincomesrelativetotherestofthepopulationinrecentdecadesthatwasshowninFigure5.5isevengreateronanAHCbasis.Contrastingly,theincomesofyoungadultshavegrownlesssince1978–1980onanAHCbasis(likelyduetorapidrisesinrents).(TheAHCanalogueofFigure5.5isincludedasFigureE.3inAppendixE.)TheresultisanevensmallerdeclineinincomesatolderagesnowonanAHCbasisthanonaBHCbasis.Figure5.6highlightsthis,comparingmedianincomesbyagein2011–12beforeandafterdeductinghousingcosts.Infact,medianAHCincomesforpeopleintheirearlyandlate60sarenowatleastashighasthoseforindividualsintheirlate30sandearly40srespectively.TheverticaldistancebetweentheBHCandAHClinesinthegraphalsoclearlyindicatesthesubstantiallylowerhousingcostsfacedbypensionersrelativetotherestofthepopulation.Tolookmorecomprehensivelyatchangesinincomesbyage,Figure5.7showsaverageannualrealgrowthinmedianBHCincomeacrosstheagedistributionoveranumberofperiods.Itshowsthatmedianincomeforindividualsintheir60sand70shasclearlytendedtogrowbymore(proportionately)thanthatforpeopleatyoungerages,andFigure 5.6. Median income by age in 2011–12 (BHC and AHC, GB)
Note: All monetary amounts have been equivalised using the modified OECD equivalence scale and theDWP AHC variant of this, and are expressed in terms of equivalent amounts for a childless couple.Source: Authors’ calculations using Family Resources Survey 2011–12.
101See Chapter 6 for more on this in relation to poverty.
100
150
200
250
300
350
400
450
500
550
600
Med
ianinco
me(£
perwee
k)
Before housing costs After housing costs
Age

The income distribution over the long run
97
Figure 5.7. Average annual growth in median income by age since 1978–1980(BHC, GB)
Note: Incomes have been measured before housing costs have been deducted.Source: Authors’ calculations using Family Expenditure Survey and Family Resources Survey, variousyears.thatthishasbeenquiteaconsistenttrendsince1978–1980.Ithasgrownparticularlyquicklyforolderpensioners(i.e.thoseintheir70s).102Oneexceptionwas1996–97to2001–02–aperiodwhenyoungadultsdidrelativelywell(seebelow).Thefigurealsoshowsthatthehouseholdincomesofchildrenfellbehindthoseofmostadultagegroupsbetween1978–1980and1996–97,butgrewrelativelystronglybetween1996–97and2001–02,andhavefallenlessthanforworking-ageadultssince2007–08.Overall,childrenandworking-ageadultshaveseensimilarlevelsofincomegrowthsince1978–1980,andbothhaveseenweakergrowththanpensioners.Figure5.7reiteratesthatmedianincomeamongyoungadultshasperformedrelativelypoorlyrecently,particularlyduetotrendssincethefinancialcrisishit.Havingbarelychangedinthepre-recessionyearsbetween2001–02and2007–08,medianincomeamongthoseintheir20shasfallenbyanaverageof3%peryearsince2007–08.Thenetresultisthat,afteradjustingforRPIinflation,medianhouseholdincomeforthegroupfellbyabout13%inthedecadefrom2001–02to2011–12(from£511to£447perweek).Takingalonger-runperspective,thedashedlineonFigure5.7showsthattherehasbeenlittlechangeinrelativeincomesbyageacrosstheworking-agepopulation.102
We do not look beyond age 79 in this analysis, because the effects of substantial changes in life expectancies overlong periods of time, and the link between life expectancy and income, make interpreting the results difficult.
-4%
-3%
-2%
-1%
0%
1%
2%
3%
4%
0s 10s 20s 30s 40s 50s 60s 70s
Average
annu
algrowth
inmed
ianinco
me
1978–1980 to 1996–97 1996–97 to 2001–02 2001–02 to 2007–08
2007–08 to 2011–12 1978–1980 to 2011–12
Age

Living standards, poverty and inequality: 2013
98
Overall,medianincomegrowthhasaveragedabout1%peryearsince1978–1980acrosstheworking-ageadultagespectrum.Areasonforthisisthat,justbeforetheincomesoftheyoungstalledin2001–02,theyhadexperiencedaperiodofrapidgrowth:between1996–97and2001–02,medianincomeamongindividualsintheir20srosebyalmost4%peryearaccordingtotheHBAIdata.103However,theclearestpatternonceagainisthatpensionerincomeshavegrownmorequicklythanincomesatotheragesbyasubstantialmarginsincethelate1970s,withaverageannualmedianincomegrowthofabout2%forthoseintheir60sand70s.Income inequality by ageFigure5.8highlightshowthepatternofincomeinequalityacrosstheagedistributionhaschanged.Itshows90/10ratios–incomeatthe90thpercentiledividedbyincomeatthe10thpercentile–withineachofthesamefive-yearagebandsasinFigure5.5.Thismeasureofincomeinequalityincreaseswithagethroughoutthe20sandearly30s,andisquitestablebetweenthelate30sandearly50s.Itthenpeaksinthelate50sbeforedroppingsharplyatpensionerages.Thispeakjustbeforepensioneragesislikelypartlyduetotheeffectsofearlyretirementanddisability–adultsstarttoretireorleaveworkduetodisabilityinsignificantnumbersatthisstageandhenceloseFigure 5.8. 90/10 ratios by age (BHC, GB)
Note: Incomes have been measured before housing costs have been deducted. Data points show the ratiobetween incomes at the 90th and 10th percentiles.Source: Authors’ calculations using Family Expenditure Survey and Family Resources Survey, variousyears.
103Later, we show that the HBAI data record a larger rise in employment among young adults over this period than
Labour Force Survey data – a reason to be cautious about interpreting the precise magnitude of the income growthrecorded among young adults at this time in HBAI.
2.0
2.5
3.0
3.5
4.0
4.5
5.0
5.5
6.0
90/10ratio
1961–1963 1978–1980 2001–02 2007–08 2011–12
Age

The income distribution over the long run
99
labourmarketincome,whileasubstantialpartoftheircohortremaininemployment,increasingincomeinequalitywithinthegroup.OneofthemoststrikingfeaturesofFigure5.8isthefallinincomeinequalityatpensionerages,andhowthiscontrastswithdecadespast.Inequalityisnowloweramongpensionersthanitisamongallotheragegroupsover30.Thefigurerevealsthatthispatternisheavilydrivenbychangesthathaveoccurredsince1978–1980,whenincomeinequalitywasmuchmoreuniformacrosstheagedistribution.Sincethen,theriseininequalityamongworking-ageadultshasbeenlessmarkedforthoseaged30andbelow,andmostmarkedforthoseintheirlate30s,early40sandlate50s;andinequalityhasgenerallyrisenmuchlessrapidlyamongpensionersthanamongworking-ageadults(asshowninFigure5.2).Figure5.8alsoshowsthatincomeinequalityamongpensionersisactuallylowerthanitwaswhenourconsistenttimeseriesfirstbeganin1961–1963.NotethatthesetrendsareaccentuatedevenfurtheronanAHCbasis(showninFigureE.4inAppendixE).MeasuredAHC,pensionerinequalityisnowclearlylowerthaninequalityforallotheragegroups.Thisreflectsthefactthat,whereashousingcostseatupalargefractionofpoorerworking-agehouseholds’incomes,draggingdowntheirAHCincomesandtherebyboostinginequalityinAHCincomes,mostpoorerpensionersowntheirhomesoutrightandthereforehavelowhousingcosts.Afinalpointofinterestrelatestothechangesininequalitybyagesincethestartoftherecentrecession(i.e.since2007–08).Weknowthatincomeinequalityinthewholepopulationhasgenerallyfallenoverthisperiod(seeChapter3).Figure5.8highlightsthat,lookingwithinagegroups,fallsininequalityareevidentprimarilyamongnon-pensioners(includingchildren,assuggestedbythelargefallinrelativechildpovertysince2007–08–seeChapter4).Thisisconsistentwiththefactthatthefallsininequalitybetween2007–08and2011–12occurredlargelybecausegrowthinbenefitsoutpacedearningsgrowth(seeChapter3).Amongtheworking-agepopulation(andtheirchildren),thistendstoreducethegapbetweenthosemorereliantonbenefitincomeandthosemorereliantonlabourmarketincome.Inequalitiesbetweenpensionerswouldtendtobelessaffectedbyrelativitiesbetweenbenefitsandearnings,becausefewpensionershavemuchearnedincome.104Wehaveseenthatpatternsofincomebyagehavechangedsignificantlyinrecentdecades.Incomelevelsnowtendtovarylesswithage,largelybecauseincomedipslessatolderages.Andoverthelastdecade–particularlysince2007–08–theincomesofyoungadultshavebeenfallingbehindthoseoftherestoftheworking-agepopulation.Therehasalsobeenatransformationinthepatternofincomeinequalitybyage.Whenourconsistenttimeseriesbeganintheearly1960s,incomesweremoreunevenlydistributedamongpensionersthanamonganyotheragegroup.Inthelate1970s,incomeinequalitywasalmostconstantacrosstheadultagedistribution.Now,inequalityisloweramongpensionersthanamongotheradultsaged30andabove.104
Note that the level of inequality in the whole population also depends on inequalities between pensioners and non-pensioners. Because pensioners remain poorer on average than non-pensioners, the fact that their incomes havecontinued to grow since 2007–08, whilst the incomes of non-pensioners have fallen, will also have acted to reduceoverall inequality.

Living standards, poverty and inequality: 2013
100
Withtheseimportantchangesinmind,wenowlookinmoredetailatthecontrastingincometrendsateachageoftheadultagespectrum.The changing fortunes of young adultsEarlierwesawthatmedianincomeamongtheyounggrewrapidlybetween1996–97and2001–02.Theintroductionofthenationalminimumwagein1999likelyplayedsomeroleinboostingtheincomesofyoungadultsoverthisperiod.Itactedtoincreaseearningsforthoseclosetothebottomofthehourlypaydistribution,105whichincludesadisproportionatenumberofyoungadults.106Thiswasalsoaperiodofrisingemployment,includingamongyoungadults,asshownbyFigure5.9.However,itcanalsobeseenfromthefigurethattheHBAIdatashowalargerriseinemploymentamongthe20–24agegroupoverthisperiodthantheLabourForceSurvey(LFS)(5.0and1.7percentagepointsrespectively),whichistheprimarysourceoflabourmarketstatisticsintheUK.ThisisareasontobecautiousabouttheexactmagnitudeofincomegrowthrecordedamongthegroupoverthisperiodbytheHBAIdata.Figure5.7showedthatmedianincomeamongadultsintheir20sbarelychangedintheimmediatepre-recessionyears–anexperienceevenworsethantheslowgrowthseenacrossmostoftheworking-agespectrum–andhasclearlyfallenmorethanforotheragegroupssince2007–08.Therelativelylargedeclinesinmedianincomeinthe20–29agegroupsince2007–08mirrorthefallintheiremploymentrates,atatimewhenemploymentratesatotherageshavebeenunusuallyrobust(forarecession).Figure5.9confirmsthattheHBAIdatarevealessentiallythesamepatternsofemploymentbyageastheLFSdataduringthisrecessionandpost-recessionperiod.Thedisproportionateincidenceoffallsinemploymentontheyoungsincethefinancialcrisishithasbeenanexperiencesharedbyotherdevelopedcountries.107Whenanalysingtheeconomicexperiencesofyoungadults,itisimportanttopayattentiontotwoparticularissues.First,changesinratesofparticipationineducationcanaffectchangesintheincomesofyoungadultsovertime.Thelong-termriseinhighereducationparticipationwillhaveactedtoreducetheincomesofsomeyoungadults,aslittleornothingtendstobeearnedwhilstinfull-timeeducation.Butthereturnstoeducationmaymeanthat,veryshortlyafterwards,theincomesofthesameadultsarehigherthantheywouldotherwisehavebeen.Soweneedtothinkabouttheeffectsofhighereducationparticipationontheincomesofyoungadultsverydifferentlyfromtheeffectsof(forexample)higherunemploymentamongthegroup.Howimportantiseducationinexplainingthetrendsjustoutlinedinyoungadults’incomesoverthepastdecade?Itcanhaveplayedonlyasmallroleinexplainingthelackofmedianincomegrowthamongadultsintheir20sinthepre-recessionyears,between2001–02and2007–08.Theproportionofsuchadultsineducationroseby0.8105
See Chapter 3 of this report and Lindley and Machin (2013).
106Brewer, May and Phillips, 2009.
107Bell and Blanchflower, 2011.

The income distribution over the long run
101
percentagepointsoverthosesixyearsintheHBAIdata.Thisisverysimilartothe0.7percentagepointriserecordedbytheLFS.Whatabouttheperiodsincetherecessionhit,between2007–08and2011–12,whentheemploymentratesandincomesofyoungFigure 5.9. Individual employment rates by age (GB)
HBAI data
Labour Force Survey data
Note: Years refer to financial years.Source: Authors’ calculations using Family Resources Survey and Labour Force Survey, various years.
30%
40%
50%
60%
70%
80%
90%
100%
1996 1997 1998 1999 2000 2001 2002 2003 2004 2005 2006 2007 2008 2009 2010 2011
20–24 25–29 30–39
40–49 50–59 60–64
30%
40%
50%
60%
70%
80%
90%
100%
1996 1997 1998 1999 2000 2001 2002 2003 2004 2005 2006 2007 2008 2009 2010 2011
20–24 25–29 30–39
40–49 50–59 60–64

Living standards, poverty and inequality: 2013
102
adultsfellbymorethanthoseofothergroups?RisesineducationparticipationdonotaccountforthesetrendsintheHBAIdata,accordingtowhichtheproportionofadultsintheir20sineducationessentiallystayedthesame.However,thisissomewhatdifferentfromthetrendrecordedintheLFS,whichshowsa1.7percentagepointriseintherateofeducationparticipationamongthegroup.IftheLFSiscorrect,currentincomesamongtheyoungmayhavefallenbyevenmorethantheHBAIdatasuggestsince2007–08(sincetherewouldhavebeenalargerriseinthenumberineducationwithlittleornocurrentincome).Asdiscussed,however,theimplicationsofthatfortheeconomicprospectsofyoungadultsarenotnecessarilynegative.Muchdependsontheeconomicreturnsthattheygetfromtheireducationlaterinlife.Asecondpertinentfactorfortheeconomicexperiencesofyoungadultsisthecompositionoftheirhouseholds.Aboutfourintenadultsagedunder30livewithparents,andafurther15%livewithotherindividualsbesidestheirpartners.Giventhatolderindividuals’labourmarketoutcomeshavebeenonabettertrajectorythanthoseofyoungeradultssince2007–08,wemightexpectthattherecentshocktohouseholdincomehasbeensmoothedsomewhatforthoseindividualswholivewithparents(orperhapswithothers).Itcouldalsobethatyoungpeopleusethepossibilityoflivingwithparentsasaninsurancemechanism,becomingmorelikelytodothiswhentheysuffershockstotheirownincomes.EvidencefromtheUSindicatesthatthishappenswheneconomicconditionsdeteriorate,atleastamongthelow-skilled.108Table5.4shedssomelightontheseissues.Itsplitsadultsagedunder30intothreegroups:thosewholiveontheirownorwithapartneronly;thosewholivewithparents;andthosewholivewithothers(forexample,friends).Itthendocumentschangesinmedianhouseholdincome,changesinmedian‘benefitunit’incomeandchangesintherelativesizeofeachgroup.(Weusetheterm‘benefitunit’incometomeanthecombinedincomeofanindividualand(whereapplicable)theirpartner.)Thetablecomparestheimmediatepre-recessionperiod(2006–07and2007–08)withthemostrecentperiodofdata(2010–11and2011–12).Twoyearsofdataarepooledineachcasetoensuresufficientsamplesizes.Table 5.4. Income changes for adults aged under 30 between 2006–07 to2007–08 and 2010–11 to 2011–12, by household type (BHC, GB)
Living on ownor with
partner only
Livingwith
parents
Livingwithothers
Change in median household income –10.8% –5.7% –14.7%
Change in median benefit unit income –10.8% –16.8% –16.9%
% of all adults <30, 2006–07 and 2007–08 44% 39% 16%
% of all adults <30, 2010–11 and 2011–12 47% 38% 15%Note: Incomes have been measured before housing costs have been deducted. ‘Parents’ here includebiological parents, step-parents, foster parents and parents-in-law. The final two rows may not sumacross to 100% due to rounding.Source: Authors’ calculations using Family Resources Survey, various years.
108Kaplan, 2012.

The income distribution over the long run
103
Forthosewholiveontheirownorwithapartneronly,reductionsinbothmeasuresofincomearebydefinitionidentical,atabout11%overthefouryears.Forthosewholivewithparents,thereisevidencethatthiscohabitationhasindeedactedtomoderatethefallinhouseholdincome,relativetowhatwouldhavehappenediftheseyoungadultslivedaloneorwiththeirpartnersonly.Medianhouseholdincomeamongthegrouphasfallenbyabout6%overthefouryears,whereasthemedianbenefitunitincomeofthegrouphasfallenbyabout17%.Thedifferencebetweenthereductionsinthesetwomeasuresofincomeforthegroupisstatisticallysignificant.Thosewholivewithotheradults(notparents)havealsoseenafallofabout17%inmedianbenefitunitincomeovertheperiod;buttheotheradultsinthosehouseholdshaveplayedamuchsmallerroleinmediatingtheultimateeffectonhouseholdincome.Itisnoteworthythatindividualslivingwithparents(andothers)haveseenlargerfallsintheincomesofthemselvesandtheirpartnerssincetherecessionthanindividualswholiveontheirownorwithapartneronly(andthisdifferenceisstatisticallysignificant).Itispossiblethatthisispartlybecausethosewhosufferednegativeincomeshocksrespondedbylivingwithparents,whentheywouldotherwisehaveleft(orremainedawayfrom)thefamilyhome.However,theaggregatefiguresgivenbytheFRSdataandshowninTable5.4donotshowasignificantchangeintheproportionofyoungadultslivingwithparentssincethebeginningoftherecession.109 Itwillbeinterestingtofollowthistrendwhenfurtheryearsofdatabecomeavailable,whichwillalsoprovidesufficientsamplesizestolookforeffectsonparticularsubgroupsofyoungadults(forexample,thelow-educated).Insummary,thehouseholdincomesofadultsintheir20shavebeenfallingfasterthanthoseofanyotheragegroupsince2007–08.Thisfitswithasubstantialdeclineintheiremploymentrates.Thereisevidencethatthegroup’shouseholdincomeswouldhavefallenbyevenmore,wereitnotforthefactthatabout40%ofthemlivewithparents,whoseindividualincomestendtohavefallenbyless.Inthelongrun,acrucialissueishowcurrentcohortsofyoungadultsareaffectedbythesepoorinitialoutcomesastheyage.Manystudieshavehighlightedapparentdetrimentaleffectsofperiodsofunemploymentonfutureearnings110andemploymentprobabilities.111Arelatedliteraturehaslookedat‘scarring’effectsoncohortswhostartworking-agelifeduringrecessions.Detectableimpactsonearningsandemploymentcanpersistforuptoadecadeforthesecohorts.112Theextenttowhichcurrentcohortsofyoungadultscanavoidsuchpersistentscarringeffectsofpoorearlyoutcomeswillbecrucialfortheirlifetimeincomes,andhencetheirlivingstandards.109
The same is true over the past decade as a whole: the proportion of young adults in the FRS living with theirparents in 2001–02 was 38%, just as in 2011–12.
110For example, Arulampalam (2001) and Gregory and Jukes (2001).
111For example, Heckman and Borjas (1980).
112For example, Burgess et al. (2003), Kahn (2010) and Oreopoulos, vonWachter and Heisz (2012).
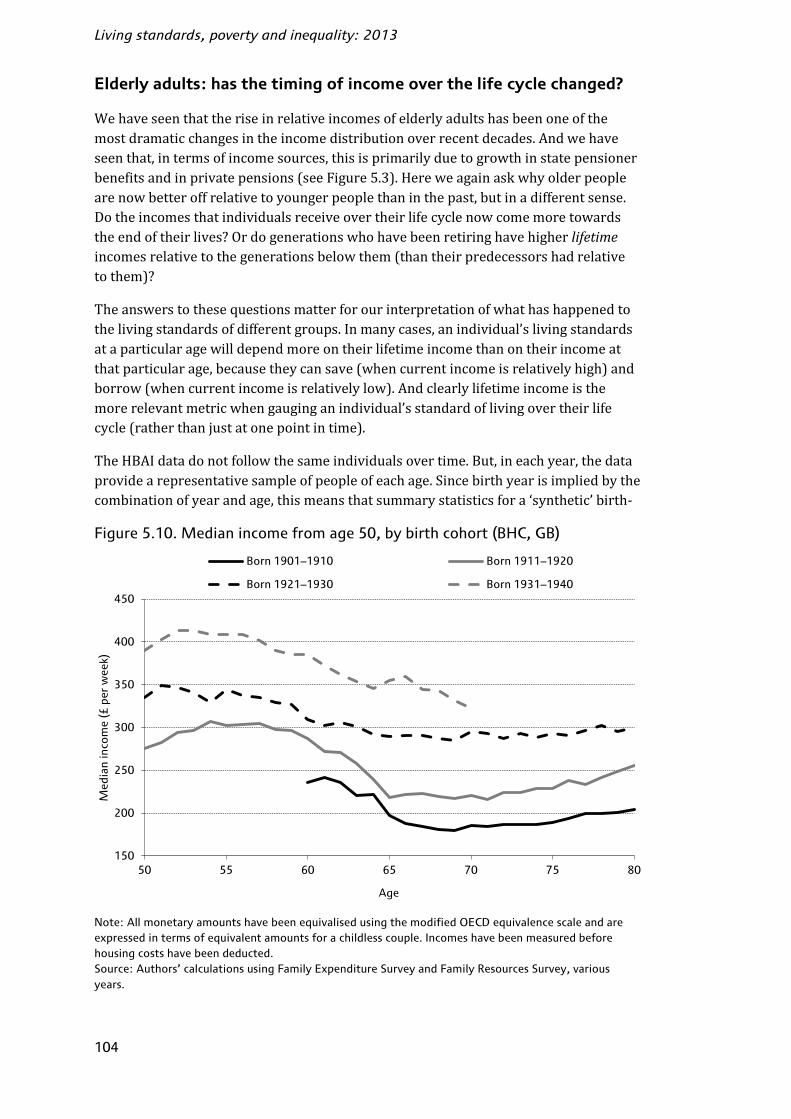
Living standards, poverty and inequality: 2013
104
Elderly adults: has the timing of income over the life cycle changed?Wehaveseenthattheriseinrelativeincomesofelderlyadultshasbeenoneofthemostdramaticchangesintheincomedistributionoverrecentdecades.Andwehaveseenthat,intermsofincomesources,thisisprimarilyduetogrowthinstatepensionerbenefitsandinprivatepensions(seeFigure5.3).Hereweagainaskwhyolderpeoplearenowbetteroffrelativetoyoungerpeoplethaninthepast,butinadifferentsense.Dotheincomesthatindividualsreceiveovertheirlifecyclenowcomemoretowardstheendoftheirlives?Ordogenerationswhohavebeenretiringhavehigherlifetimeincomesrelativetothegenerationsbelowthem(thantheirpredecessorshadrelativetothem)?Theanswerstothesequestionsmatterforourinterpretationofwhathashappenedtothelivingstandardsofdifferentgroups.Inmanycases,anindividual’slivingstandardsataparticularagewilldependmoreontheirlifetimeincomethanontheirincomeatthatparticularage,becausetheycansave(whencurrentincomeisrelativelyhigh)andborrow(whencurrentincomeisrelativelylow).Andclearlylifetimeincomeisthemorerelevantmetricwhengauginganindividual’sstandardoflivingovertheirlifecycle(ratherthanjustatonepointintime).TheHBAIdatadonotfollowthesameindividualsovertime.But,ineachyear,thedataprovidearepresentativesampleofpeopleofeachage.Sincebirthyearisimpliedbythecombinationofyearandage,thismeansthatsummarystatisticsfora‘synthetic’birth-Figure 5.10. Median income from age 50, by birth cohort (BHC, GB)
Note: All monetary amounts have been equivalised using the modified OECD equivalence scale and areexpressed in terms of equivalent amounts for a childless couple. Incomes have been measured beforehousing costs have been deducted.Source: Authors’ calculations using Family Expenditure Survey and Family Resources Survey, variousyears.
150
200
250
300
350
400
450
50 55 60 65 70 75 80
Med
ianinco
me(£
perwee
k)
Born 1901–1910 Born 1911–1920
Born 1921–1930 Born 1931–1940
Age

The income distribution over the long run
105
yearcohortcanbetrackedovertimeusingonlyrepeatedcross-sectionsofdata.Figure5.10exploitsthisfactandplotstheageprofilesofmedianincomeforfourbirthcohortsastheyapproachedpensionerage.Birthcohortsaregroupedinto10-yearbandsinordertoensuresufficientsamplesizes.Thefigureshows,unsurprisingly,thatsuccessivecohortstendtohavehighermedianincomesateachagethanpreviouscohortshadatthatage.Thisreflectsthesustainedgrowthinlivingstandardsthathasoccurredoverthepost-warperiod.Theshapesoftheage–incomeprofilesalsochangeacrosscohorts.Theprofilesforthe1901–1910and1911–1920cohortsbetweenages60and80areapproximatelyparallel.Inotherwords,theyoungercohorthadhighermedianincomeatgivenagesthantheoldercohort,butthechangesinmedianincomebetweenages60and80weresimilarforthetwocohorts.Butthepathsofmedianincomeforthe1911–1920and1921–1930cohortsatolderageslookquitedifferent.Byage65,thegapbetweenthecohortsismuchlargerthanitwasbetweenages50and60.Thisisbecausethe1921–1930cohortexperiencedasmallerdropinmedianincomewhentheyreachedpensionage.Thiscohortpassedage65between1986and1995,sothisdoesaccountforatleastsomeoftheimprovementintherelativepositionofpensionersduringthe1980sand1990s.Banks,BlundellandTanner(1998)documentedasimilarchangeincohorts’age–incomeprofilesaroundretirement,comparingthe1911–1914and1923–1926cohorts.113Wecanalsoaddamorerecentcohorttoinvestigatewhetherthischangeinage–incomeprofileslookspersistent.Ifitweresimplyastepchangebetweencohorts,thentheage–incomeprofilesforthe1921–1930cohortandtheyounger1931–1940cohortshouldberoughlyparalleltoeachother.Thiswasindeedthecaseuptoage65.Bythisage,medianincomeshaddippedsharplyforthetwooldercohortsbutnotforthetwoyoungerones,whichissuggestivethattherehasbeenapersistentchangeintheextenttowhichmedianincomesdipwhencohortsreachpensionerage.Butmedianincomeforthe1931–1940cohorthasdippeddownintheirlate60s(duringthe2000s),whilstmedianincomeforthe1921–1930cohortstayedflatatthatage.Thismayjustreflecttheeconomiccycle,however,andinparticulartherecentrecession.Atthisstage,wecannotthereforeestablishbeyonddoubthowpersistentthechangeintheshapeofage–incomeprofilesatolderageswillbe.Wewillknowmorewhenwehaveseenwhathappenstoincomesamongthesecohortsastheyagefurther.Weseethesamechangesbetweencohortsintheageprofilesofmedianincomeonanafter-housing-costsbasis,asshowninFigureE.5inAppendixE.MedianAHCincomesgenerallydeclinelessrapidlythanBHCincomesascohortsage.Thisagainreflectsthelowerhousingcoststhattendtobefacedbyolderindividuals,whoaremorelikelytoowntheirhomesoutrightandhencemakenomortgagepayments.Forexample,medianBHCincomewas18%loweratage70thanatage50forthe1931–1940cohort,whereasmedianAHCincomefellbyonly10%forthatcohortbetweenthoseages.113
Those authors looked at the mean of the logarithm of income, rather than median income.

Living standards, poverty and inequality: 2013
106
Figure 5.11. Income at the 20th percentile from age 50, by birth cohort (BHC,GB)
Note: All monetary amounts have been equivalised using the modified OECD equivalence scale and areexpressed in terms of equivalent amounts for a childless couple. Incomes have been measured beforehousing costs have been deducted.Source: Authors’ calculations using Family Expenditure Survey and Family Resources Survey, variousyears.WeknowfromtheanalysispresentedinChapter6andinSection5.1thatpensionerincomeshavenotonlyincreasedrapidlyataroundthemedian:therehavebeensubstantialreductionsintheriskoflowincomeforpensionersaswell.Figure5.11presentsananalysisofage–incomeprofilesataroundretirementbycohort,analogoustoFigure5.10exceptthatitshowsincomesatthe20thpercentileratherthanatthemedian.Thishighlightstwofurtherimportantpoints.First,incomestowardsthebottomofthepensionerdistributiondroppedlessinretirementforthe1921–1930cohortthanforthe1911–1920cohort,justaswasthecaseatthemedian.Second,weseeafurtherchangeintheshapeoftheage–incomeprofilewhencomparingthe1921–1930cohortwiththe1931–1940cohort:thegapbetweenthesecohortsinincomesatthe20thpercentileclearlygrowsfromage60onwards,andhasstayedatitsnewhigherleveluptoage70.Infact,althoughincomeatthe20thpercentiledeclinedforthe1931–1940cohortduringtheirlate50s,therewasnosuchdeclineastheypassedpensionerage:instead,incomesatthe20thpercentileactuallyflattenedoutatage60(thepensionerageforwomen)andincreasedslightlyatage65(thepensionerageformen).Byage70,incomeatthe20thpercentileforthiscohortwas£243perweek,just2%lowerthanithadbeenatage50.FigureE.6inAppendixEshowsthatthesamepatternsholdonanAHCbasis,andifanythingareevenmorepronounced:incomeatthe20thpercentileforthe1931–1940cohortwas2%higheratage70thanatage50.
100
120
140
160
180
200
220
240
260
280
300
50 55 60 65 70 75 80
20thpe
rcen
tile
(£pe
rwee
k)
Born 1901–1910 Born 1911–1920
Born 1921–1930 Born 1931–1940
Age
The income distribution over the long run
107
The1931–1940cohortreachedpensioneragebetween1991and2000(forwomen)and1996and2005(formen).Thissuggeststhatachangeinthetimingofincomeoverthelifecyclehasbeenimportantinexplainingincreasesinincomestowardsthebottomofthepensionerincomedistributioninthe1990sandearly2000s.Theintroductionin1999oftheminimumincomeguarantee(MIG)forlow-incomepensioners–whichsubsequentlybecamepensioncredit(PC)–islikelytohaveplayedarolehere.Notealsothatthisshiftintheage–incomeprofilearoundretirementformorerecentcohortswasnotevidentwhenlookingattheirmedianincomelevels(i.e.incomesuponretirementseemtodroplessatthe20thpercentileforthemostrecentcohortthanforthecohortbeforethem,whereasincomesatthemedianseemtohaveevolvedsimilarlyforthetwocohorts).Thisindicatesthatachangeintheageprofileofincomeinequalityamongpensioners(atleastinthebottomhalfofthedistribution)hascontributedtothedeclineinpensionerinequalityrelativetoworking-ageinequalityinthe1990sandearly2000s.Insummary,therehavebeenimportantchangestothetimingofincomeoverthelifecycleinrecentdecades.Thesehaveunderpinnedatleastsomeoftheriseinpensionerincomesrelativetothoseoftherestofthepopulationoverthatperiod.Inparticular,medianincomenowdropslessataroundretirementagesthanusedtobethecase.Thisexplainsatleastsomeoftheimprovementintherelativepositionofmiddle-incomepensionersduringthe1980sand1990s.Andincomeslowerdownthedistributionalsoseemtodroplessataroundretirementthaninthepast.Thisexplainsatleastsomeoftheimprovementintherelativepositionoflow-incomepensionersinthe2000s,aswellasinthe1980sand1990s.5.3 ConclusionThischapterhastakenalong-runperspectiveonthedistributionofincome.Ithashighlighteddramaticchangestothetypesofpeoplewhoarerelativelyrich,relativelypoorandrelativelyunequal.Itiswellknownthatoneofthemostdramaticchangestothedistributionofincomeinrecenthistorywasthelargeandrapidriseininequalityduringthe1980s.Itmightthereforecomeasasurprisethatincomesarenowdistributedmuchmoresimilarlyacrosstheagespectrum,andacrossthemajorfamilytypes,thanusedtobethecase.Incomeswithinthesedifferentgroupshave,forthemostpart,grownandbecomemoreunequal–butatdifferentspeeds.Theresulthasbeenasignificantconvergencebetweentheincomedistributionsforoldandyoung,andfamilieswithandwithoutchildren.Trendsbyageareperhapsthemoststriking,andthemosttopical,giventhepoorrecentperformanceofyoungadultsinthelabourmarket.Whenourconsistentseriesbeganin1961–1963,pensionershadthelowestincomes,andthemostunequalincomes,ofanyagegroup.Bythelate1970s,pensionersstillhadthelowestincomes,andinequalitywasquiteuniformacrosstheagedistribution.By2011–12,duemainlytoarapidriseininequalityamongtheworking-agepopulationinthe1980s,pensionershadlowerlevelsofinequalitythanalmostanyotheradultagegrouponaBHCbasis,andthelowestofallagegroupsonanAHCbasis.Theirincomesstilltendto

Living standards, poverty and inequality: 2013
108
belowerthanthoseofworking-ageadults,butthegaphasclosedconsiderably(particularlywhenmeasuredAHC).And,aswasshowninthischapterandthelast,theirriskoflowincomeisnowalmostthesameasthatforotherswhenmeasuredBHC,andlowerthanforotherswhenmeasuredAHC.Lookingtothefuture,anaturalquestioniswhetherthetrendswillcontinue.Willthisultimatelylooklikeconvergencebetweengroups?Orwillitbejustthestart,withthosegroupsthatusedtohavethebettereconomicoutcomes–suchastheyoung,andtheworking-agechildless–simplybeingovertakenandfallingfurtherbehindovertime?Intheshortrun,thereseemslittlereasontoexpectthetrendsbyagetoreverseinfuturereleasesofHBAIdata.Theemploymentratesofyoungadultscontinuetoperformpoorlyintherecession’saftermath.Theearningsofthosewhoareinworkaregenerallystrugglingtokeeppacewithinflation.Thoseofworkingagewhoareoutofworkareexperiencingrealbenefitcutsaspartofthepost-recessionfiscaltightening.Andpensionersaretheonemajordemographicgroupwhohavebeenrelativelyprotectedfromthosecuts.Longer-rundevelopmentsare,asever,muchmoredifficulttopredict.Onecentralissuewillbetheextenttowhichcurrentcohortsofyoungadultsare‘scarred’persistentlybytheirearlyeconomicexperiencesastheyage.Giventhefallintheiremploymentratessincetherecession,itisnosurprisetoseethatthehouseholdincomesofadultsintheir20shavebeenfallingfasterthanthoseofanyotheragegroupsince2007–08.Thisisdespitethefactthatabout40%ofthegrouplivewiththeirparents,andthatthishastendedtocushiontheimpactsontheirhouseholdincomes.Butthatisunlikelytobealong-termsolutionformany.Akeypolicyquestionishowthesecohortscanbepreventedfrombecomingdetachedfromthelabourmarket,sothattheirfutureemploymentandearningsprospectsaredamagedaslittleaspossible.

109
© Institute for Fiscal Studies
6. The Changing Face(s) of Poverty
Key findings
There have been significant changes in the pattern of poverty across thepopulation during the last 50 or so years. In the 1960s and 1970s, poverty rateswere much higher for pensioners than for the rest of the population: around six toeight times as high as for working-age adults without children, for instance.However, substantial and sustained falls in pensioner poverty since the late 1980s,and increases in poverty rates among the rest of the population, mean thatpensioners now have a similar risk of poverty to the rest of the population on aBHC basis, and a substantially lower risk on an AHC basis. The face of poverty hasbecome substantially younger during recent decades.
The large falls in pensioner poverty have been driven by a substantial increase inincome from state pensions and benefits, as well as private pensions. This has ledto a broad-based improvement in the relative position of lower-income pensionerscompared with the rest of the population. One reason why pensioner poverty hasfallen particularly far on an AHC basis is that lower-income pensioners increasinglyown their homes outright, which means their housing costs have fallensubstantially relative to the rest of the population.
Rising poverty among working-age adults without children partly reflectssubstantial increases in the number living in workless families and a decline in therelative value of out-of-work benefits. More importantly, poverty among thoseliving in families containing at least one worker has increased. During the period1978–1980 to 1996–97, this reflected an increase in hourly and weekly earningsinequality. Post 1996–97, it reflects the fact that earnings growth was generallyweak for this group right across the income distribution.
The increase in in-work poverty means that almost half of all poor working-ageadults without children work or have a partner who works, compared with just30% in 1978–1980.
The story for children was similar to that for working-age adults without childrenbetween 1978–1980 and 1996–97. However, since 1996–97, relative child povertyhas fallen. There was some increase in parental employment rates. Butoverwhelmingly this fall was driven by substantial increases in the generosity ofmeans-tested benefits for low- and middle-income families with children.
Substantial reductions in out-of-work poverty mean that by 2011–12 a poor childwas almost twice as likely to be from a working family as from a workless one(whereas in both 1978–1980 and 1996–97 they were substantially less likely to befrom a working family than from a workless one). However, the risk of relativepoverty for children of workless families does remain substantially higher (40% ona BHC basis) than for children of working ones (14%).Chapter4ofthisreportexaminedtrendsinrelativeandabsolutepovertyfordifferentpartsofthepopulationduringthe15yearsfrom1996–97to2011–12,focusinginparticular,ontheyearssincethefinancialcrisisofthelate2000sanditsassociated

Living standards, poverty and inequality: 2013
110
recession.Akeyfindingofthisanalysiswassignificantfallsinthefractionofchildrenandpensionerswhoarepoorinrelativeterms,butanincreaseinthefractionofworking-ageadultswithoutchildrenwhoarerelativelypoor.Inthischapter,wetakealonger-runperspectiveandshowhowpovertyhaschangedfordifferentpartsofthepopulationoverthepastfewdecades(from1961or1979),andhowthishaschangedthecompositionofthepoorpopulation.Indoingthis,itisimportanttobearinmindtheanalysisofChapter5.Changesintherelativeincomesofdifferenttypesofindividualintheincomedistribution(suchastheimprovementintherelativepositionofpensioners)arelikelytohaveimplicationsforpatternsofpoverty.Andthesamebroadsocio-economicchangesthathaveplayedapartintrendsinaverageincomesandincomeinequalitywillalsohavebeenimportantindrivingchangesinrelativeincomepoverty.Asweshallsee,increasesinworklessness,growingearningsinequalityduringthe1980s,asubstantialincreaseinthenumberofloneparents,changestobenefits,andincreasesinaccruedpensionrightsandhomeownershipamongpensioners,haveallplayedaroleinexplainingthesubstantialchangesinpatternsofpovertyintheUK.Therestofthischapterproceedsasfollows.InSection6.1,weexaminehowpovertyhaschangedfordifferentpartsofthepopulationandwedelvedeepertoseeiftherehavebeenparticularchangesformorepreciseagegroups.Sections6.2,6.3and6.4thenexaminethechangesinpovertyexperiencedbypensioners,working-ageadultswithoutchildren,andchildren,respectively,withafocusonthefactorsthatunderliethechangesinpovertyratesforeachgroup.Section6.5concludes.6.1 Changes in relative poverty by individual type andageFigures6.1aand6.1bshowtheratesofrelativeincomepovertyamongpensioners,working-ageadultswithandwithoutchildren,andchildrenusingincomesmeasuredAHCandBHCrespectively.Thetrendsinpovertyamongthedifferentpartsofthepopulationareclearlyverydifferent: Relativeincomepovertywasmuchhigheramongpensionersthanintherestofthepopulationduringthe1960sand1970s.Pensionerpovertythenfellduringperiodsofrecession(suchasthemid-1970s,early1980sandearly1990s)androseduringperiodsofrapideconomicgrowth,particularlyinthemid-tolate1980s.Therelativepositionofpensionersimprovedduringrecessionsastheywerelittleaffectedbyhigherunemploymentandfallsinwages,whiletheirrelativepositiondeterioratedduringboomsas,similarly,theygainedlittlefromthestronggrowthinemploymentandwages.Finally,fromtheearly1990s,therehasbeenasubstantialandsustainedfallinpensionerpoverty,especiallyonanAHCbasis. Relativeincomepovertyamongfamilieswithchildrenwasfairlysteadyduringthe1960sand1970s.Theratesofpovertythenrosesubstantiallyduringthe1980s,risingbycloseto15percentagepoints(AHC)and10percentagepoints(BHC).After

The changing face(s) of poverty
111
stabilisingorfallingabitintheearly1990s,povertybeganfallingonaconsistentbasisinthelate1990sandearly2000s,especiallyonaBHCbasis.Afteramodestreversal,ithasfallenagainintheperiodsince2007–08.Thefall,however,hasbeenlargerforchildrenthanforparents,reflectingthefactthatpovertyfellmoreforloneparentsthanforcouplesandmoreamongstfamilieswithatleastthreechildrenthanamongstsmallerfamilies. Relativeincomepovertyamongworking-ageadultswithoutchildrenroseduringthe1980sandagainduringthelate2000s,leavingitaroundthreeorfourtimesitslevelsofthe1960sand1970s(ofaround5%)by2011–12.Figure 6.1a. Relative poverty for different groups of the population (AHC)
Figure 6.1b. Relative poverty for different groups of the population (BHC)
Note: Figures are presented for GB up until 2001–02 and for the whole of the UK from 2002–03 onwards.Years refer to calendar years up to and including 1992, and financial years thereafter.Source: Authors’ calculations based on Family Expenditure Survey and Family Resources Survey, variousyears.
0%
5%
10%
15%
20%
25%
30%
35%
40%
45%
Pensioners Working-age without children
Working-age with children Children
0%
5%
10%
15%
20%
25%
30%
35%
40%
45%
Pensioners Working-age without children
Working-age with children Children
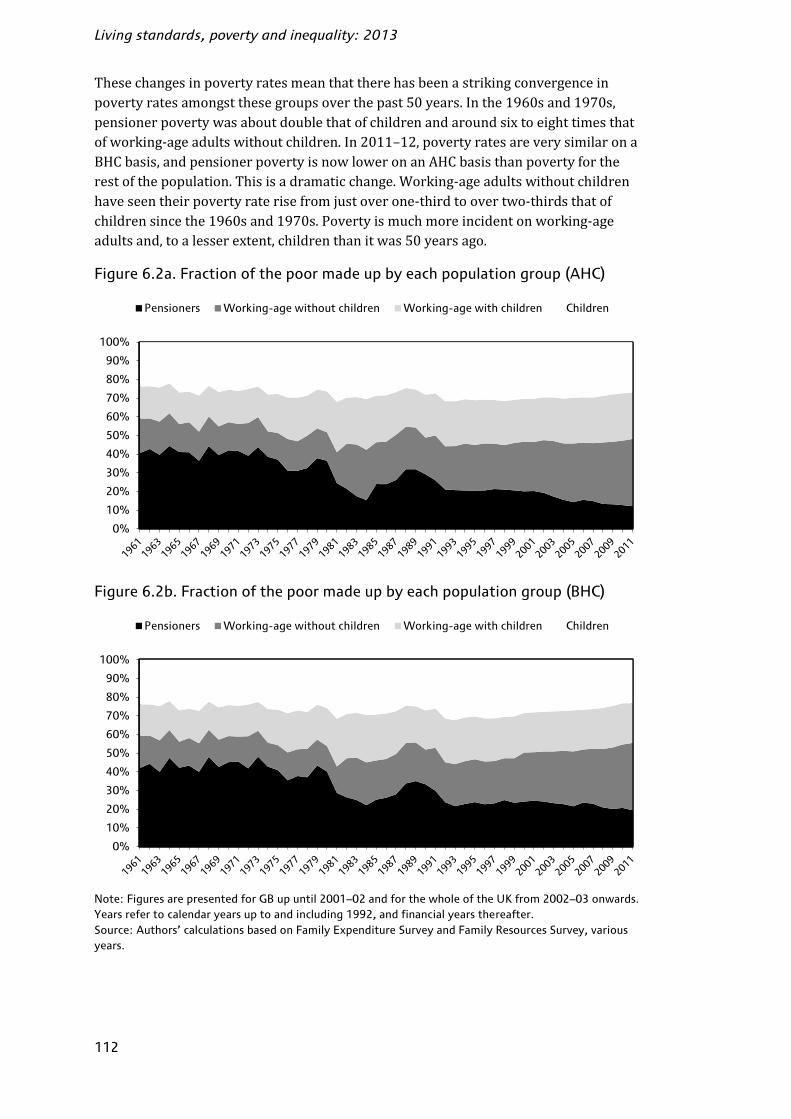
Living standards, poverty and inequality: 2013
112
Thesechangesinpovertyratesmeanthattherehasbeenastrikingconvergenceinpovertyratesamongstthesegroupsoverthepast50years.Inthe1960sand1970s,pensionerpovertywasaboutdoublethatofchildrenandaroundsixtoeighttimesthatofworking-ageadultswithoutchildren.In2011–12,povertyratesareverysimilaronaBHCbasis,andpensionerpovertyisnowloweronanAHCbasisthanpovertyfortherestofthepopulation.Thisisadramaticchange.Working-ageadultswithoutchildrenhaveseentheirpovertyraterisefromjustoverone-thirdtoovertwo-thirdsthatofchildrensincethe1960sand1970s.Povertyismuchmoreincidentonworking-ageadultsand,toalesserextent,childrenthanitwas50yearsago.Figure 6.2a. Fraction of the poor made up by each population group (AHC)
Figure 6.2b. Fraction of the poor made up by each population group (BHC)
Note: Figures are presented for GB up until 2001–02 and for the whole of the UK from 2002–03 onwards.Years refer to calendar years up to and including 1992, and financial years thereafter.Source: Authors’ calculations based on Family Expenditure Survey and Family Resources Survey, variousyears.
0%
10%
20%
30%
40%
50%
60%
70%
80%
90%
100%
Pensioners Working-age without children Working-age with children Children
0%
10%
20%
30%
40%
50%
60%
70%
80%
90%
100%
Pensioners Working-age without children Working-age with children Children
The changing face(s) of poverty
113
ThisisshownevenmoreclearlyinFigures6.2a(AHC)and6.2b(BHC),whichplotthefractionofpeopleinpovertywhoarepensioners,working-agewithorwithoutchildren,andchildren.Inthe1960sandearly1970s,pensionersmadeuparound40%ofpeopleinrelativeincomepoverty,despiterepresentingonlyaround15%ofthepopulation.By2011–12,whenpensionersmadeup19%ofthepopulation,theyaccountedforjust12%ofpoorpeopleonanAHCbasisand19%onaBHCbasis.Bywayofcontrast,working-ageadultswithoutchildrenaccountedfor36%ofthepopulationinthe1960sandearly1970sbutjust16%(AHC)or15%(BHC)ofthepoor.By2011–12,theyrepresentedaslightlylargershareofthepopulation(38%)butamuchlargershareofthepoor(36%,bothAHCandBHC).Indeed,injustthelastfouryearsfrom2007–08to2011–12(correspondingtotherecessionofthelate2000sanditsaftermath),thefractionofthepoorwhowereworking-ageadultswithoutchildrenincreasedbyaround5percentagepoints(AHC)or7percentagepoints(BHC)astheirrateofpovertyclimbedwhilstthatamongpensionersandchildrenfell.Thisisaverydramaticshiftinthecompositionofthepooroverashortperiodoftime.Ofcourse,thegroupsanalysedsofararequitediverse.Forinstance,working-ageadultswithoutchildrenincludebothyoungadults(whomaystillbelivingathomewiththeirparents,andthoseintheir50s.Figures6.3aand6.3bshowpovertyratesforfive-yearagegroupsinselectedyears:1961–1963,1978–1980,1996–97and2011–12.Intheearly1960s,povertyrateswerebroadlyflatacrossworkingagesfrom16throughtoadultsintheirlate50s.Therewasthenasharpriseinpovertyatolderages.Pensionersaged75to79hadthehighestratesofpovertyatover50%.By2011–12,thepatternhasshifteddramatically.PovertyratesarenowlargelyflatacrossagegroupsmeasuringincomesBHC,andactuallydeclinewithagemeasuringincomesAHC.Lookingattheyearsinbetween,bythelate1970stherehadbeenlittlechangeformostofthepopulationunderstatepensionage,butpovertyratesfellsignificantlyforpensioners,particularlyonanAHCbasis(wherethefallwasaround15percentagepointsforthoseaged75to79).Overthe1980sandearly1990s,povertyratesthenrosesubstantiallyforthoseagedunder59.OnanAHCbasis,theincreaseswerelargestinpercentagepointsforchildren(around18–20percentagepoints)butrepresentedmorethanadoublingfornearlyallagegroupsfrom0to59(andamorethantreblingforthoseaged15to19).IncreasesweresomewhatsmalleronaBHCbasis,suggestingthathousingcostshadincreasedforlower-incomehouseholdsrelativetothemedianhousehold.Ontheotherhand,povertyratesamongpensionerswerelower.Between1996–97and2011–12,povertyfurtherdeclinedamongpensioners,especiallyonanAHCbasisandamongthoseintheir70sand80s.Childpovertyalsofell.OnaBHCbasis,thisreversedvirtuallyalltheincreaseinpovertyduringthe1980sandearly1990sforchildrenagedunder15,thoughonanAHCbasispovertyfortheunder-15sremainedsubstantiallyhigherthaninthelate1970s.Theworking-agepopulationdidnotshareinthefallsinpovertyexperiencedbytheyoungandoldduringthe15yearsfrom1996–97to2011–12.Indeed,povertyincreasedslightlyforthoseaged15to24and40to54.Lookingatjustthosewithout

Living standards, poverty and inequality: 2013
114
dependentchildren,relativepovertyincreasedforallagegroupsbetween15and55between1996–97and2011–12.114By2011–12,therefore,onanAHCbasis,povertywashighestforchildrenaged0to4andthoseaged15to24,andthengenerallydeclinedwithage(tickingupalittlefortheoldestpensioners).OnaBHCbasis,theratevariedremarkablylittlebetweenages25and79,thoughpovertywassomewhathigherforchildrenandtheveryoldestadults.Thisisasignificantchangefrom1996–97,whenpovertywasclearlyhighestamongFigure 6.3a. Poverty rates by age (AHC)
Figure 6.3b. Poverty rates by age (BHC)
Note: Figures are presented for GB up until 2001–02 and for the whole of the UK from 2002–03 onwards.Years refer to calendar years up to and including 1992, and financial years thereafter.Source: Authors’ calculations based on Family Expenditure Survey and Family Resources Survey, variousyears.
114 The analysis underlying this claim is available from the authors on request.
0%
10%
20%
30%
40%
50%
60%
Age
1961–1963 1978–1980 1996–97 2011–12
0%
10%
20%
30%
40%
50%
60%
Age
1961–1963 1978–1980 1996–97 2011–12

The changing face(s) of poverty
115
olderpensionersandyoungchildren,andfromthe1960sand1970s,whenpovertywasmuchhigherforpensionersthanforeveryoneelse.Changes in persistent povertyThedeprivationassociatedwithhavingarelativelylowincomeislikelytobeworsethelongeronehasalowincome.Thishasledthegovernmentandotherstomeasureandmonitorthelevelofpersistent(orlong-term)poverty,inadditiontotheoverallnumbersinincomepovertyinagivenyear.Unfortunately,figuresforpersistentpoverty(definedasbeinginpovertyinatleastthreeoutofthelastfouryears)areavailablecoveringtheperiodbetween1991–1994and2005–2008only.Table6.1showsthepercentageofpensioners,children,working-ageadultsandthepopulationasawholewhowereestimatedtobeinpersistentpovertyforselectedyearsduringthe1990sand2000s.Table 6.1. Persistent poverty rates (%) (AHC and BHC)
1991–1994 1995–1998 2001–2004 2005–2008
AHCPensioners 21 23 17 8
Working-age adults 10 9 8 8
Children 25 23 17 17
All 15 15 12 10
BHC
Pensioners 19 20 18 14
Working-age adults 8 7 6 6
Children 19 17 12 12
All 12 11 10 9Source: British Household Panel Survey 1991–2008, taken from Department for Work and Pensions(2012).Unsurprisingly,thelevelsofpersistentpovertyaresubstantiallylowerthanthelevelsofoverallpoverty:volatilityinincomesmeansthatmanyhouseholdsthathaveincomeslowenoughtobedeemedpoorinoneyeardonothavesuchincomesinthefollowingyear.Forinstance,whereas10%ofthepopulationwereinpersistentpovertyonanAHCbasisintheperiod2005–2008,theaverageoverallAHCpovertyrateforthesameperiodwasaround22%.Thetrendsinpersistentpoverty,though,mirrorthoseforoverallpoverty,withanotablefallbetweenthemid-tolate1990sandthemid-tolate2000s,especiallyonanAHCbasis.Persistentpovertyamongchildrenandworking-ageadultsfellduringthe10-yearperiodbetween1991–1994and2001–2004,andthenheldsteadyto2005–08.Inthecaseofchildren,thismirrorsthechangestooverallpoverty,withfallsinthelate1990sandearly2000s,andsmallincreasesbetween2004–05and2007–08.Amongworking-ageadults,overallpovertydidnotdeclineduringthe1990sand2000s,suggestingthatfallsinpersistentpovertywereoffsetbyincreasesinshort-termor‘transitory’poverty.Atleastinpart,thisislikelytobeexplainedbythefactthatpovertyfellamongworking-ageadultswithchildren(whoaremorelikelytobeinpersistentpoverty)and

Living standards, poverty and inequality: 2013
116
roseamongworking-ageadultswithoutchildren(whoaremorelikelytobeonlytemporarilypoor).OnbothanAHCandaBHCbasis,persistentpensionerpovertyroseslightlyduringtheearlytomid-1990s,beforefallingsubstantiallyinthedecadebetween1995–98and2005–08(especiallyonanAHCbasis).Ifanything,thefallsinpersistentpovertyarelargerthanthefallsinoverallpoverty.Thegapbetweentherateofpersistentpovertyandoverallpovertyissmallerforpensionersthanfortherestofthepopulation,reflectingthegreaterstabilityofpensioners’incomes(mostofwhichcomesfromprivateorstatepensions).ThismeansthatpensionershadasimilarrateofpersistentAHCpovertytoworking-ageadults(asopposedtolowerforoverallpoverty)in2005–08,andahigherrateofpersistentBHCpovertythanchildren(asopposedtolowerforoverallpoverty).Thismeansthefaceofpersistentpovertyismorelikelytobeoldthanthatofoverallpoverty,althoughdeclinesinpersistentpensionerpovertymeanthatthiswaslesstruein2005–08thaninthe1990s.ThistrendislikelytocontinuewhenupdatedfiguresusingthenewUnderstandingSocietysurveybecomeavailable.6.2 Explaining the long-term fall in pensioner povertyInordertobetterunderstandthesubstantialandsustainedfallsinpensionerpovertythattookplaceduringthe1990sand2000s,thissectionexploresthechangestothebenefitentitlements,privateincomesandhousingcostsofpensioners.However,first,itisworthexaminingwhetherthefallsinpovertyreflectacomprehensiveupwardsshiftintheincomedistributionforpensioners,oramovementofmanypensionersfromjustbelowtojustabovethepovertyline.Todothis,Figures6.4a(AHC)and6.4b(BHC)examinethedistributionsofpensionerincomesbetween0%and150%ofmedianincome(incomesareshownasapercentageofmedianincome)forvariousyearsbetweenthelate1970sand2011–12.Theheightofthelinesrepresentsthepercentageofpensionersthatcanbefoundineachpercentileoftheoverallincomedistributionineachofthevariousyears.Forinstance,Figure6.4ashowsthatthedensestpartoftheAHCincomedistributionforpensionersin1978–1980wasjustbelow60%ofmedianincome,witharound2.5%ofpensionershavinganincomeofbetween59%and60%ofmedianincome.Thekeymessageofthegraphsistoconfirmthatpensionerpovertyhasnotfallenbecauselargenumbershavemovedfromjustbelowtojustabovethepovertyline.Whilstitusedtobethecasethatlargenumbersofpensionerswereveryclosetotherelativepovertylineandhencethemeasurednumbersinpovertywereveryvolatile,thisisnolongerthecase.Rather,asshowninFigure5.1inthelastchapterandFigureE.1inAppendixE,thewholepensionerincomedistributionhasshifted,withsubstantiallymorepensionershavingincomesfarabovethepovertyline(and,indeed,abovemedianincome).Thefallinpovertyisrealandrobust,andreflectsabroad-basedincreaseinpensioners’relative(andabsolute)livingstandards.AsTable4.4inChapter4showed,byfarthelargestcomponentsofoverallincomeforpoorerpensionersarestatepensionsandotherbenefits(suchaspensioncredit).Soonemightexpectchangesinbenefitandstatepensionratestoplayamajorroleinexplainingchangesinpensionerpoverty.Figure6.5showsmeans-testedbenefitrates

The changing face(s) of poverty
117
(excludinghousingandcounciltaxbenefits)forbothasinglepensionerandapensionercouple,alongwiththebasicstatepensionforasingleadult,115measuredasapercentageoftheAHCpovertyline.Figure 6.4a. Distribution of pensioners’ household incomes in 1978–1980,1996–97, 2007–08 and 2011–12 (AHC)
Figure 6.4b. Distribution of pensioners’ household incomes in 1978–1980,1996–97, 2007–08 and 2011–12 (BHC)
Note: Figures are presented for GB up until 2001–02 and for the whole of the UK from 2002–03 onwards.Years refer to calendar years up to and including 1992, and financial years thereafter.Source: Authors’ calculations based on Family Expenditure Survey and Family Resources Survey, variousyears.
115 Significant non-take-up of means-tested benefits and a reduction in the amount payable to those withsignificant amounts of savings (for instance, entitlement to pension credit is reduced by £1 per week forevery £500 of savings above £10,000) mean that a small but significant number of pensioners may havean income equal to or even less than the basic state pension.
0.0
0.5
1.0
1.5
2.0
2.5
3.0
0 10 20 30 40 50 60 70 80 90 100 110 120 130 140 150 160
Den
sity
(%)
Percentage of median income
1978–1980 1996–97 2007–08 2011–12
0.0
0.5
1.0
1.5
2.0
2.5
3.0
0 10 20 30 40 50 60 70 80 90 100 110 120 130 140 150 160
Den
sity
(%)
Percentage of median income
1978–1980 1996–97 2007–08 2011–12

Living standards, poverty and inequality: 2013
118
Figure 6.5. Benefit rates for pensioners as a percentage of poverty line (AHC)
Note: Excludes any entitlement to housing or council tax benefits.Source: Authors’ calculations based on published benefit rates and various years of the FamilyExpenditure Survey and Family Resources Survey.Between1979and1989,benefitentitlementsforpensionersfellrelativetothepovertyline(althoughtheyincreasedinrealterms):means-testedbenefitsforasinglepensionerfellfrom101%to92%ofthepovertyline,thoseforacouplefellfrom91%to84%ofthepovertyline,andthebasicstatepensionforasinglepensionerfellfrom95%to87%ofthepovertyline.Thisinlargepartreflectstheshifttoinflation-indexingofpensioners’benefitsfrom1984duringaperiodofstronggrowthinrealincomesandislikelyafactorunderlyingthesubstantialincreaseinpensionerpovertyinthemid-tolate1980s.Between1989and1996–97,therewasafurtherfallinthebasicstatepensionrelativetothepovertyline(to84%),whilstmeans-testedbenefitsroughlykeptpacewiththepovertyline.Thusthesubstantialfallinpensionerpovertyby1996–97doesnotseemtobeduetoincreasesinbenefitratesforpensioners.However,asweseeshortly,thisdoesnotmeanthatchangesinbenefitincomedidnotplayarole.Real-termsincreasestomeans-testedbenefitratesmeanttheythengrewbroadlywiththepovertylinebetween1996–97and2000–01,beforeincreasingsharplyin2001–02duetoasubstantialincreaseinthepensioners’minimumincomeguarantee(MIG,theforerunneroftheguaranteeelementofpensioncredit).Inthecaseofasinglepensioner,benefitrateswentbacktoalevelabovetheAHCpovertyline.Interestingly,neitherAHCnorBHCpensionerpovertyfellparticularlysubstantiallyinthatyearbuttheydidsoin2002–03,2003–04and2004–05.Inadditiontofurtherincreasesinbenefitrates,thefallsin2003–04and2004–05mayreflect,atleastinpart,thereplacementoftheMIGbypensioncredit,which,althoughnotincreasingmaximumentitlementstoalargedegree,didtaperentitlementsawaylessaggressively,andboostentitlementsforthosewithsavingsandmodestamountsofotherincome.Means-testedbenefitrateshavecontinuedtoincreaserelativetothepovertylinesince2004–05,duringwhichtime(exceptin2006–07)pensionerpovertyhascontinuedtofall.
60%
70%
80%
90%
100%
110%
120%
Couple pensioner Single pensioner Single pensioner, state pension only

The changing face(s) of poverty
119
Figure 6.6. Pensioner income sources for the two poorest pensioner incomequintiles (BHC, GB)
Note: All monetary amounts have been equivalised using the modified OECD equivalence scale and areexpressed in terms of equivalent amounts for a childless couple. Those whose income components sum toa negative number are excluded, as their measured income in the HBAI series would be set to zero (i.e. itwould not equal the sum of their income components).Source: Authors’ calculations using Family Expenditure Survey, 1978 to 1980, and Family ResourcesSurvey, 1996–97 and 2011–12.Thuswhilstitseemshighlylikelythatmoregenerousbenefitsforpensionershavebeenafactorinfallingpensionerpoverty,changesinbenefitratesalonecannotbethewholestory:pensionerpovertyfellbetweenthelate1970sandmid-1990sevenwhilebenefitratesforpensionersfellrelativetothepovertyline.However,itisnotonlychangesinbenefitratesthatmayhaveaffectedtheamountofincomepensionersreceivefrombenefits;otherchangestothebenefitsystem,ordifferingeligibilityforbenefitsamongnewcohortsofpensioners,mayalsohavebeenafactorinincreasingincomes.Figure6.6thereforeexaminestheamountofincomethepooresttwo-fifthsofpensionersreceivedfromthestatepensionandprivateincomesin1978–1980,1996–97and2011–12.116Itshowsthatbetween1978–1980and1996–97,incomefromstatepensionsandotherbenefitsgrewinrealtermsby18%forthepoorestfifthofpensionersand28%forthesecond-poorestfifth.Inthelattercase,thissignificantlyexceedstheincreaseinmeans-testedbenefitrates(18%)orthebasicstatepension(15%).Thisgrowthreflectsincreasingentitlementstothestatepension(inpartduetotheincreasingimpactof116 Figure 6.6 replicates part of Figure 5.3 in Chapter 5.
2011–121978–1980 1996–97
-100
0
100
200
300
400
1 2 1 2 1 2
Contribu
tionto
inco
me(2011–1
2£pe
rwee
k)
Pensioner income quintile
State pensions and benefits Occupational pensions Savings and investments
Earnings and self-employment Other income Deductions

Living standards, poverty and inequality: 2013
120
earnings-relatedstatepensionschemesandinpartduetolatercohortsofwomenhavinglongeremploymenthistories),aswellasincreasingamountsreceivedindisabilitybenefitsandhousingbenefits.Increasesinbenefitsincomeexplainpartofthefallinpensionerpovertythattookplacebetween1978–1980and1996–97evenwhileheadlineratesfellrelativetothepovertyline.Ontheotherhand,between1996–97and2011–12,incomefrombenefitsincreasedbyless(21%and23%forthepoorestandsecond-poorestfifthofpensionersrespectively)thanmeans-testedbenefitrates(uparound40%).Thissuggeststhattheincreaseinstatetransferstolowincomepensionershasnotbeenasgreatinrecentyearsastheheadlinebenefitratessuggest,likelyreflectinganumberoffactors.First,manypensionersdonotclaimthemeans-testedbenefitstowhichtheyareentitled,andnon-means-testedbenefitssuchasthestatepensionhaveincreasedmuchlessinrealterms(13%).Second,itmayreflectthefactthatincreasinghomeownershipmeansfewerpensionersarenowinreceiptofhousingbenefit(wediscussthechanginghousingtenureofpensionersinmoredetailbelow).Thirdisthefactthat‘low-incomepensioners’didnothavesuchlowprivateincomesin2011–12astheydidin1996–97or1978–1980,andthereforefewerwereentitledtomaximummeans-testedbenefitentitlements.117Althoughincomefromstatepensionsandbenefitsstillmakesupalargemajorityoftheincomeofthepooresttwo-fifthsofpensioners,theirincomesfromoccupationalpensions,savingsandinvestments,and,inthelastfewyears,employmentandself-employmenthavebeenincreasingmorerapidly,thoughfromaverylowbase.Forinstance,between1978–1980and1996–97,incomefromoccupationalpensionsmorethantrebled(increasingitssharefrom3%to9%ofincomeamongthepoorestfifthandfrom5%to14%amongthenext-poorestfifth).Itthenincreasedbymorethanhalfagainby2011–12(to11%and17%ofoverallincome,respectively).Increasesinprivateincomesarethereforelikelytohavebeenakeydriveroflowerpensionerpoverty.AsshowninFigures6.3aand6.3b,anotablefeatureofthefallinpensionerpovertyisthatthefallhasbeenconsiderablygreaterforolderpensionersthanforyoungerpensioners.However,thisdoesnotappeartobeduetomorerapidgrowthinincomeatolderagesamongpoorerpensioners.Theaverageincomesofthepoorest40%ofpensionersintheir60shavegrownmorerapidlysince1978–1980(by76%inrealterms)thantheincomesofthepoorest40%ofpensionersintheir80s(by66%).Thissuggeststhatthemuchlargerdeclinesinpensionerpovertyatolderagesreflectthefactthatthereusedtobeaparticularconcentrationofelderlypensionersjustbelowthepovertyline(whocouldthenbepushedabovethepovertyline).Olderpensionershaveenjoyedparticularlylargeincreasesintheirnon-benefitsincomes(increasingovertenfoldsince1978–1980fortheover-80s,comparedwitharoundfourfoldforpensionersintheir60s),suggestingthatincreasesinprivatepensionincomes–for117 Furthermore, the FRS, the survey underlying the HBAI data, has become less good at picking upbenefit incomes over time, and now significantly understates the total amount of benefits received. Forinstance, in 2011–12, it picked up only around 89% of all spending on the state pension and 52% ofspending on pension credit. See Appendix B for further details.
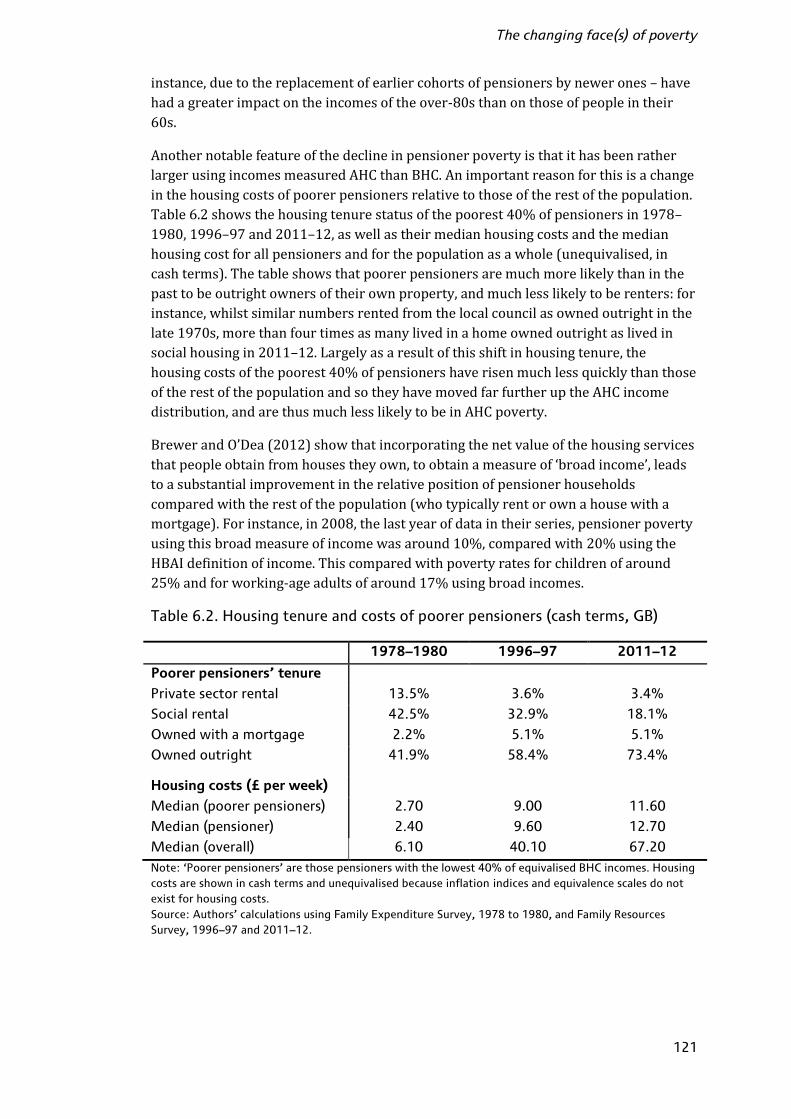
The changing face(s) of poverty
121
instance,duetothereplacementofearliercohortsofpensionersbynewerones–havehadagreaterimpactontheincomesoftheover-80sthanonthoseofpeopleintheir60s.AnothernotablefeatureofthedeclineinpensionerpovertyisthatithasbeenratherlargerusingincomesmeasuredAHCthanBHC.Animportantreasonforthisisachangeinthehousingcostsofpoorerpensionersrelativetothoseoftherestofthepopulation.Table6.2showsthehousingtenurestatusofthepoorest40%ofpensionersin1978–1980,1996–97and2011–12,aswellastheirmedianhousingcostsandthemedianhousingcostforallpensionersandforthepopulationasawhole(unequivalised,incashterms).Thetableshowsthatpoorerpensionersaremuchmorelikelythaninthepasttobeoutrightownersoftheirownproperty,andmuchlesslikelytoberenters:forinstance,whilstsimilarnumbersrentedfromthelocalcouncilasownedoutrightinthelate1970s,morethanfourtimesasmanylivedinahomeownedoutrightaslivedinsocialhousingin2011–12.Largelyasaresultofthisshiftinhousingtenure,thehousingcostsofthepoorest40%ofpensionershaverisenmuchlessquicklythanthoseoftherestofthepopulationandsotheyhavemovedfarfurtheruptheAHCincomedistribution,andarethusmuchlesslikelytobeinAHCpoverty.BrewerandO’Dea(2012)showthatincorporatingthenetvalueofthehousingservicesthatpeopleobtainfromhousestheyown,toobtainameasureof‘broadincome’,leadstoasubstantialimprovementintherelativepositionofpensionerhouseholdscomparedwiththerestofthepopulation(whotypicallyrentorownahousewithamortgage).Forinstance,in2008,thelastyearofdataintheirseries,pensionerpovertyusingthisbroadmeasureofincomewasaround10%,comparedwith20%usingtheHBAIdefinitionofincome.Thiscomparedwithpovertyratesforchildrenofaround25%andforworking-ageadultsofaround17%usingbroadincomes.Table 6.2. Housing tenure and costs of poorer pensioners (cash terms, GB)
1978–1980 1996–97 2011–12
Poorer pensioners’ tenurePrivate sector rental 13.5% 3.6% 3.4%
Social rental 42.5% 32.9% 18.1%
Owned with a mortgage 2.2% 5.1% 5.1%
Owned outright 41.9% 58.4% 73.4%
Housing costs (£ per week)Median (poorer pensioners) 2.70 9.00 11.60
Median (pensioner) 2.40 9.60 12.70
Median (overall) 6.10 40.10 67.20Note: ‘Poorer pensioners’ are those pensioners with the lowest 40% of equivalised BHC incomes. Housingcosts are shown in cash terms and unequivalised because inflation indices and equivalence scales do notexist for housing costs.Source: Authors’ calculations using Family Expenditure Survey, 1978 to 1980, and Family ResourcesSurvey, 1996–97 and 2011–12.

Living standards, poverty and inequality: 2013
122
Insummary,increasesinincomesfromstatepensionsandbenefits,anincreaseinprivatepensionincomeandareductioninrelativehousingcostsunderliethebroad-basedreductioninpensionerpovertyduringrecentdecades.6.3 Explaining the long-term rise in poverty amongworking-age adults without childrenIncontrasttopensioners,working-ageadultswithoutchildrenhaveseentheirpovertyratesincreasesubstantiallysincethelate1970s,withparticularlyrapidincreasesinthe1980sandmid-tolate2000s.Thismayreflect,inpart,thedeclineintherelativegenerosityofbenefitratesforthisgroup.Forinstance,asshowninFigure6.7,unemploymentbenefit/jobseeker’sallowancefellfromaround80%oftheAHCpovertylinein1979to70%by1989,around60%by2000–01,andalowof51%in2008–09(sincewhenithasincreasedveryslightly,reflectingtheeconomicdownturn).Thisreflectstheinflation-indexationofsuchbenefitsduringaperiodofsubstantialgrowthinrealincomes.Despitethisinflation-indexationofbenefitrates,theaverageincomefromstatebenefitsandtaxcreditsoflow-incomeworking-ageadultswithoutchildrenhasincreasedsubstantiallyinrealtermssince1978–1980.Table6.3showstheamountofincomeobtainedfromdifferentsourcesforanumberofyearssince1978–1980,andthecontributionofthesetotheoverallchangeinincome,forthepoorest20%ofworking-ageadultswithoutchildren(i.e.roughlythosenowinpovertyandjustabovethepovertyline).Thecashfigureshavebeenadjustedforhouseholdsize(aprocessFigure 6.7. Benefit rates for working-age adults as a percentage of poverty line(AHC)
Source: Authors’ calculations using various years of the Family Expenditure Survey and Family ResourcesSurvey and published historical benefit rates.
40%
50%
60%
70%
80%
90%
100%
110%
Single jobseeker Single, incapacity benefit

The changing face(s) of poverty
123
Table 6.3. Sources of net income for the poorest 20% of working-age adultswithout children (GB), equivalised £ per week (2011–12 prices, GB)
Source of incomeEarningsand self-
employment
Benefits andtax credits
Otherincome
(includingsavings,
investmentsand privatepensions)
Deductionsfrom income(incl. council
tax)
Totalincome(BHC)
Amount of incomein 1978–1980 119 67 20 –10 197
in 1996–97 70 113 34 –19 199
in 2007–08 109 105 39 –31 222
in 2011–12 98 101 33 –24 207
1978–1980 to 2011–12Average annual change1978–1980 to 2011–12
–0.6% 1.3% 1.6% 2.9% 0.2%
Contribution to overallannual growth1978–1980 to 2011–12
–0.3ppt 0.5ppt 0.2ppt –0.2ppt 0.2ppt
2007–08 to 2011–12Average annual change2007–08 to 2011–12
–2.5% –1.1% –4.6% –5.9% –1.8%
Contribution to overallannual growth2007–08 to 2011–12
–1.2ppt –0.5ppt –0.8ppt 0.8ppt –1.8ppt
Note: The table relates to the subsample of households in the HBAI that contain the poorest 20% ofworking-age adults without children (i.e. those in poverty and those just above the poverty line), butexcluding those households with negative reported incomes. All incomes have been equivalised using themodified OECD equivalence scale and are expressed in terms of equivalent amounts for a childless couple.Incomes are measured at the household level and before housing costs have been deducted.Source: Authors’ calculations using Family Expenditure Survey and Family Resources Survey, variousyears.termedequivalisation)andareexpressedastheequivalentamountforacouplewithoutchildren.118Thetableshowsthat,afteradjustingforinflation,incomefromstatebenefitsrosefromanaverageof£67aweekin1978–1980to£113aweekin1996–97(anincreaseofaroundtwo-thirds).Thisreflects,inlargepart,anincreaseinworklessness(duetodisabilityandunemployment):theaverageincomeobtainedfromemploymentandself-employmentfellfrom£119aweekto£70aweekduringthesameperiod(in118 It is important to equivalise incomes because there have been substantial changes in household sizesince the 1970s: we wish to examine the underlying changes in living standards, rather than changes inaverage incomes driven just by the fact that households have fewer or more members than they used to.Appendix A provides more detail on equivalisation.

Living standards, poverty and inequality: 2013
124
additiontochangesindisabilityandunemployment,thismayalsoreflectthegrowthofhighereducationparticipationamongyoungadults).Thus,thebenefitssystemcushionedtheincomesofworking-ageadultswithoutchildreninthefaceofsubstantialfallsintheirprivateincomes,which,ontheirown,wouldhavedrivenrelativepovertyevenhigherforthisgroup.Arecoveryinemploymentrates(seeFigure5.9inthelastchapter)andrelativelystrongwagegrowthduringthelate1990sandearly2000sthenledtoanincreaseinemploymentincometo£109aweekin2007–08,whichwasonlypartlyoffsetbyasmallfallinbenefitsincomeandanincreaseindeductionsfromincome(mostnotably,counciltaxandstudentloanrepayments).Thatbenefitsincomedidnotfallbackfurtherasearningsincreasedreflectsacombinationoffactors:anincreaseinrentsdrivinguphousingbenefitentitlements;furtherincreasesinthenumbersofpeopleentitledtodisabilitybenefits;andtheintroductionoftheworkingtaxcredit.Finally,theperiodsince2007–08hasseenfallsinallsourcesofincome,partlyoffsetbyadeclineindeductionsfromincome.Overall,theincomesofthepoorest20%ofworking-ageadultsincreasedbyanaverageofjust0.2%peryearbetween1978–1980and2011–12,whichiswellbelowthechangeinmedianincomeforthewholepopulation(1.3%peryear).Onitsown,theaverageannualfallinearningsandself-employmentincomeof0.6%wouldhaveledtooverallincomefallingby0.3%peryear.Itwasincreasesinincomefrombenefitsandtaxcreditsandothersources,suchasprivatepensions,thatallowedeventhetepidincomegrowthseen.Table6.4showsthefractionoftheworking-agepopulationwithoutchildrenlivinginfamilieswithdifferentnumbersofworkers(andthepovertyratesforeachofthesesubgroups)in1978–1980,1996–97and2011–12.Itconfirmstheincreaseinworklessness,butshowsthatthiscanonlyexplainpartoftheincreaseinpovertyamongworking-ageadultswithoutchildren.Thefractionlivinginworklessfamiliesincreasedfromjustunder14%in1978–1980tojustover22%inboth1996–97and2011–12,drivenlargelybyanincreaseinworklessnessamongsingleworking-ageadultswithoutchildren.Becausepovertyratesaresignificantlyhigheramongthoselivinginworklessfamilies(forinstance,52%and42%forsinglesandcouplesrespectivelyin2011–12)thanamongthoseinworkingfamilies(12%),thiscompositionalchangewillhavesubstantiallyincreasedtheoverallpovertyrateforworking-agechildlessadults.However,theriskofpovertyforworking-ageadultswithoutchildrenconditionaluponfamilyworkstatushasalsoincreasedsubstantially.Theincreaseamongsingleworklessadults,fromaround30%in1978–1980to52%in2011–12,islikelytoreflect,atleastinpart,thedeclineintherelativevalueofout-of-workbenefitsforthisgroup.However,themoststrikingincreasesinpovertyrateshavetakenplaceamongthoselivinginworkingfamilies.Forinstance,theriskofpovertyforsingleadultsincreasedbyoverfivefoldforfull-timersandthreefoldforpart-timersbetween1978–1980and2011–12.Amongcoupleswhereonepartnerworksfull-timeandtheothernotatall,theriskofpovertyincreasedfrom4%in1978–1980to10%in1996–97and21%in2011–12.

The changing face(s) of poverty
125
Table 6.4. Poverty (AHC) among working-age adults without children, byfamily and employment status
% of the working-age childlesspopulation
Poverty rate
1978–1980
1996–97 2011–12 1978–1980
1996–97 2011–12
Single individualsFull-time 34% 25% 24% 2% 7% 11%
Part-time 2% 4% 6% 10% 28% 30%
Workless 10% 15% 17% 30% 56% 52%
Couples, no childrenSelf-employed 4% 8% 7% 8% 15% 17%
Two full-time earners 20% 19% 21% 0% 0% 2%
One full-time,one part-time
10% 9% 8% 0% 2% 6%
One full-time,one not working
14% 9% 8% 4% 10% 21%
One or two part-time 2% 4% 4% 15% 21% 28%
Workless 4% 8% 5% 43% 39% 42%
All 100% 100% 100% 6.8% 17.2% 20.2%Note: Figures are presented for GB up until 2001–02 and for the whole of the UK from 2002–03 onwards.Years refer to calendar years up to and including 1992, and financial years thereafter. There were somechanges to the variables used to classify the employment status of families between the FES and FRS,which likely mean that employment in 1978–1980 is a little lower than it would be if a comparabledefinition were used.Source: Authors’ calculations using Family Expenditure Survey, 1978 to 1980, and Family ResourcesSurvey, 1996–97 and 2011–12.Overall,theriskofpovertyamongworkingfamilieswithoutchildrenincreasedfourfoldfromjustunder2%tojustover7%between1978–1980and2011–12,withroughlyhalfthisincreasetakingplacebefore1996–97androughlyhalfsince.Indeed,withworklessnessandpovertyratesamongtheworklessfamilieslittlechangedbetween1996–97and2011–12,practicallyalltheincreaseinpovertyamongworking-ageadultswithoutchildrenwasaresultofhigher‘workingpoverty’.Despiteariseinworklessness,almosthalfofworking-ageadultsinpovertyin2011–12werelivinginfamilieswithsomekindofpaidwork,comparedwith30%in1978–1980and35%in1996–97.Theseincreasesinworkingpovertyreflectasubstantialincreaseininequalityinweeklyearnings,largelyduringthe1980s.119Todemonstratethis,Figure6.8showstheaverageannualpercentagechangeinrealweeklyhouseholdearningsbetween1978–1980and1996–97andbetween1996–97and2011–12forthe5thtothe50th119 In part, this reflects a shift towards part-time work and self-employment (where incomes are morevolatile), but it is largely due to an increase in inequality in hourly wages.

Living standards, poverty and inequality: 2013
126
percentilesoftheweeklyhouseholdearningsdistributionforworking-ageadultswithoutchildren.Between1978–1980and1996–97,therewasaclearpatternofincreasinginequality,witheachconsecutivepercentilerecordingstrongergrowth;weeklyearningsamongstthebottom15%actuallyfellinrealterms.Thedashedblacklineshowstheaverageannualchangeinmedianhouseholdincomebetween1978–1980and1996–97,whichwas1.6%peryearandgreaterthangrowthatallpointsoftheearningsdistributionuptothe44thpercentile.Thus,itiseasytoseehowthepatternofearningsgrowthincreasedinequalityduringtheperiod.Thestorybetween1996–97and2011–12ismorecomplex.Realweeklyearningsgrowthwasactuallystrongesttowardsthebottomofthedistribution.Thisislikelytoreflect,atleastinpart,theintroductionofthenationalminimumwagein1999,andsubsequentsubstantialincreasesinitslevelin2001,2003and2006.However,thechangeinweeklyearningswasactuallylowerthanthechangeinmedianincome(0.9%peryear,onaverage),andthusthepovertyline,forallpointsabovethe12thpercentileoftheearningsdistribution,whichequatestoearningsof£203aweek.Thisamountisbelowthepovertylineforacouple(andmaybebelowitforasingleadultiftheyhavesubstantialhousingcostsorotherdeductionsfromincome).Thusweakweeklyearningsgrowth,ratherthanincreasesinweeklyearningsinequality,lookstobethedriveroftheincreasesinworkingpovertyamongworking-ageadultswithoutchildrensince1996–97.Figure 6.8. Earnings growth by percentile point of the weekly earningsdistribution, working-age adults without children (GB)
Note: The dashed black line shows the average annual change in median household income between1978–1980 and 1996–97. The dashed grey line shows the average annual change in median householdincome between 1996–97 and 2011–12.Source: Authors’ calculations using Family Expenditure Survey, 1978 to 1980, and Family ResourcesSurvey, 1996–97 and 2011–12.
-4%
-3%
-2%
-1%
0%
1%
2%
3%
4%
5 10 15 20 25 30 35 40 45 50
Ann
ualaverage
chan
gein
real
earnings
Percentile of weekly earnings distribution
1978–1980 to 1996–97 1996–97 to 2011–12

The changing face(s) of poverty
127
Insummary,thefactorsdrivingincreasesinpovertyamongworking-ageadultswithoutchildrenhavechangedsomewhatovertime.Duringthe1980sandearly1990s,increasinglevelsofworklessnessandgrowinginequalityinweeklyearningsplayedanimportantrole.Increasessince1996–97,ontheotherhand,appearmorerelatedtogenerallyweakgrowthinweeklyearnings.Furthermore,whilstthebenefitandtaxcreditsystemhasprovidedsupportforthosewhohaveseentheirprivateincomesfall,thefallintherelativevalueofbenefitsforworking-ageadultswithoutchildrenwillalsohavecontributedtorisingpoverty.1206.4 The rise and fall in child povertyLikepovertyamongworking-ageadultswithoutchildren,povertyamongchildrenincreasedconsiderablyduringthe1980s.However,sincethelate1990s,trendshavedifferedconsiderably,withpovertycontinuingtoincreaseamongworking-ageadultswithoutchildrenbutfallingsubstantiallyforchildren(andthereforetheirparentsorguardians).Indeed,asshowninFigure6.3b,usingincomesmeasuredBHC,thefallinpovertybetween1996–97and2011–12hasundonevirtuallyalltheincreaseinrelativepovertyduringthe1980sforchildrenagedunder15(butnotthoseaged15to19,oronanAHCbasis).Thissectionthereforeseekstoanswerwhychildpovertyfirstroseandthenfellback.Beforedoingthis,however,itisworthwhileexaminingwhetherthechangesinpovertysince1978–1980reflectmovementsofchildrenfromjustbelowtojustabovethepovertyline(orviceversa)or,likepensioners,broader-basedchangesinthepositionofhouseholdscontainingchildrenwithintheincomedistribution.Figures6.9aand6.9bthereforeshowtheproportionofchildrenlivinginhouseholdswithincomeineach1%bandbetween0%and150%ofmedianhouseholdincome.Thefirstthingtonoteisthatthesubstantialriseinchildpovertybetween1978–1980and1996–97wasnotsimplyamatterofchildrenmovingfromjustabovetojustbelowthepovertyline.Instead,therewasaverybroad-basedreductionintherelativepositionoffamilieswithchildrenintheincomedistribution.By1996–97,therewerebothsubstantiallymorechildrenjustbelowthepovertylinethan17yearsearlierandmanymorewithincomesfarbelowthepovertyline.121Ontheotherhand,therewerefewerchildrenlivinginhouseholdswithincomesbetween70%and130%ofmedianincome.Second,thefallinpovertybetween1996–97and2011–12didnotsimplyreflectashiftinchildrenfromjustbelowtojustabovethepovertyline.Thefallinpovertywasdrivenbyasubstantialdeclineinthenumberofchildrenwithincomesalittlebelowthe120 Note that this group did not gain from a relative fall in their housing costs in the way that poorerpensioners did. Indeed, these costs rose and poverty increased somewhat more on an AHC basis than on aBHC basis.
121 Although it should be noted that evidence suggests that those families with children with the lowestmeasured incomes do not seem to be the ‘poorest’ in terms of their levels of consumption and materialdeprivation. See Brewer, O’Dea, Paull and Sibieta (2009).
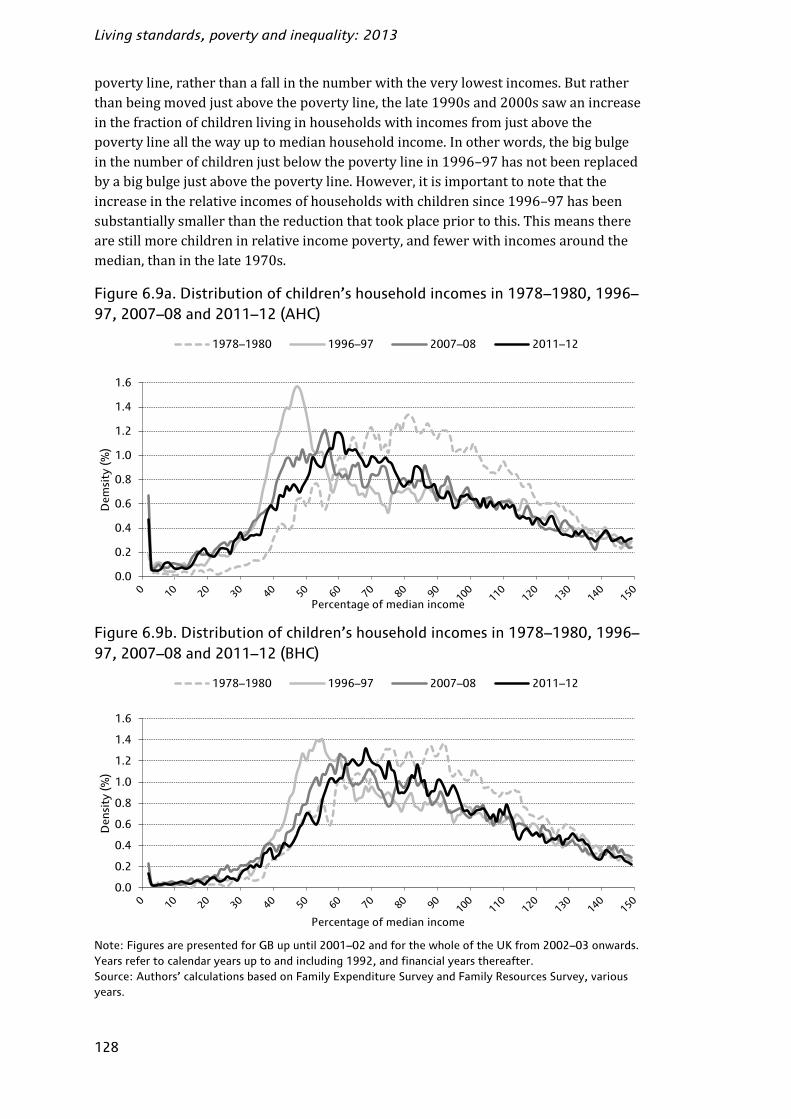
Living standards, poverty and inequality: 2013
128
povertyline,ratherthanafallinthenumberwiththeverylowestincomes.Butratherthanbeingmovedjustabovethepovertyline,thelate1990sand2000ssawanincreaseinthefractionofchildrenlivinginhouseholdswithincomesfromjustabovethepovertylineallthewayuptomedianhouseholdincome.Inotherwords,thebigbulgeinthenumberofchildrenjustbelowthepovertylinein1996–97hasnotbeenreplacedbyabigbulgejustabovethepovertyline.However,itisimportanttonotethattheincreaseintherelativeincomesofhouseholdswithchildrensince1996–97hasbeensubstantiallysmallerthanthereductionthattookplacepriortothis.Thismeanstherearestillmorechildreninrelativeincomepoverty,andfewerwithincomesaroundthemedian,thaninthelate1970s.Figure 6.9a. Distribution of children’s household incomes in 1978–1980, 1996–97, 2007–08 and 2011–12 (AHC)
Figure 6.9b. Distribution of children’s household incomes in 1978–1980, 1996–97, 2007–08 and 2011–12 (BHC)
Note: Figures are presented for GB up until 2001–02 and for the whole of the UK from 2002–03 onwards.Years refer to calendar years up to and including 1992, and financial years thereafter.Source: Authors’ calculations based on Family Expenditure Survey and Family Resources Survey, variousyears.
0.0
0.2
0.4
0.6
0.8
1.0
1.2
1.4
1.6
Dem
sity
(%)
Percentage of median income
1978–1980 1996–97 2007–08 2011–12
0.0
0.2
0.4
0.6
0.8
1.0
1.2
1.4
1.6
Den
sity
(%)
Percentage of median income
1978–1980 1996–97 2007–08 2011–12

The changing face(s) of poverty
129
Figure 6.10. Benefit rates for families with children as a percentage of povertyline (AHC)
Note: Lone parent is assumed to earn the national minimum wage (NMW) or, in years prior to itsintroduction, a wage equal to the 1999 NMW after adjusting for RPI inflation.Source: Authors’ calculations using various years of the Family Expenditure Survey and Family ResourcesSurvey and published historical benefit rates.AsshowninFigure6.10,basicout-of-workbenefitentitlementsforfamilieswithchildrenhavebeenbelowthepovertylinethroughouttheperiod.Theyfellsomewhatrelativetothepovertylineuntiltheearly2000sbeforerecovering.Althoughthebenefitlevelsarebelowthepovertyline,manypeoplereceivingthebenefitscouldhavetotalincomesabovetheline–forexample,asaresultofreceivingincomefromothersourcessuchasdisabilitybenefits,freeschoolmeals(whichcountasincomeinHBAI),theearningsofotherhouseholdmembers,and,inthecaseofloneparents,spousalandchildmaintenance.Thedeclineintherelativevalueofout-of-workbenefitsbetween1979and1996–97willcertainlyhaveplayedaroleinincreasingpoverty,whilethesubsequentincreaseintheirrelativevaluewillhavebeenakeyfactorinreducingit(aswilltheincreasinggenerosityofin-worksupportforlow-incomefamilies).Ofcourse,whilstreductionsintherelativegenerosityofbenefitswillhaveincreasedpovertyupto1998,theexistenceofthebenefitsystemamelioratedthepoverty-increasingimpactofreductionsinemployment.ThisisseenclearlyinTable6.5,whichshowstheamountofincomeobtainedfromdifferentsourcesforanumberofyearssince1978–1980,andthecontributionofthesetotheoverallchangeinincome,forthehouseholdscontainingthepoorest30%ofchildren(i.e.roughlythosenowinpovertyandjustabovethepovertyline).Thecashfigureshavebeenadjustedforhouseholdsize(aprocesstermedequivalisation)andareexpressedastheequivalentamountforacouplewithoutchildren.Thisisdonebecausetherehavebeensubstantialchangesinhouseholdsizesincethe1970s:wewishtoexaminetheunderlyingchangesinlivingstandards,ratherthanchangesinaverageincomesdrivenjustbythefactthathouseholdshavefewerormoremembersthantheyusedto.Itdoesmean,however,
60%
80%
100%
120%
140%
160%
Couple, three children
Lone parent, one child
Lone parent, 16 hours' work, one child

Living standards, poverty and inequality: 2013
130
Table 6.5. Sources of net income for the households containing the poorest30% of children (GB), equivalised £ per week (2011–12 prices, GB)
Source of incomeEarningsand self-
employment
Benefits andtax credits
Otherincome
(includingsavings,
investmentsand privatepensions)
Deductionsfrom income(incl. council
tax)
Totalincome(BHC)
Amount of incomein 1978–1980 97 70 7 –9 165
in 1996–97 55 129 10 –12 182
in 2007–08 84 147 12 –17 225
in 2011–12 96 143 11 –16 233
1978–1980 to 1996–97Average annual change1978–1980 to 1996–97
–3.3% 3.6% 2.6% 2.1% 0.6%
Contribution to overallannual growth1978–1980 to 1996–97
–1.5ppt 2.1ppt 0.1ppt –0.1ppt 0.6ppt
1996–97 to 2011–12Average annual change1996–97 to 2011–12
3.7% 0.7% 0.3% 2.0% 1.7%
Contribution to overallannual growth1996–97 to 2011–12
1.3ppt 0.5ppt 0.0ppt –0.2ppt 1.7ppt
Note: The table relates to the subsample of households in the HBAI that contain the poorest 30% ofchildren (i.e. those in poverty and those just above the poverty line), but excluding those households withnegative reported incomes. All incomes have been equivalised using the modified OECD equivalence scaleand are expressed in terms of equivalent amounts for a childless couple. Incomes are measured at thehousehold level and before housing costs have been deducted.Source: Authors’ calculations using Family Expenditure Survey and Family Resources Survey, variousyears.thattheactualaveragecashamountreceivedfromeachsourcebyhouseholdswithchildrenwillbesomewhathigherthanreportedinthetable.122Thetableshowsthattheaverageincomeobtainedfromemploymentandself-employmentfellinrealtermsfrom£97aweekto£55aweekduringthe1980sandearly1990s,orby43%(equivalentto3.3%peryear,onaverage).Atthesametime,incomefromstatebenefitsrosefromanaverageof£70aweekin1978–1980to£129aweekin1996–97(anincreaseofmorethan80%).Thus,thebenefitssystemcushionedtheincomesofhouseholdswithchildreninthefaceofsubstantialfallsintheirprivateincomes.Indeed,growthinincomefrombenefitsandtaxcreditswasvitalforthe0.6%122 For instance, in 2011–12, the average ‘unequivalised’ household income of the poorest 30% ofchildren was £351, of which £149 was earnings, £209 was benefits and tax credits, and £17 came fromother sources, from which £24 was deducted. Appendix A provides more detail on equivalisation.
The changing face(s) of poverty
131
averageannualgrowthintheincomesofthepooresthouseholdswithchildrenduringthisperiod.Anincreaseinparentalemploymentratesandrelativelystrongwagegrowthduringthelate1990sandearly2000sthenledtoanincreaseinemploymentincometo£84aweekin2007–08.Increasesinthegenerosityofbenefitsandtaxcreditsmeantthatbenefitincomesalsocontinuedtoincrease.Bothincreasesinemploymentincomeandincreasesinthegenerosityofbenefitsandtaxcreditslooktohaveplayedanimportantroleinthefallinchildpovertybetween1996–97and2011–12.Theincreaseinearningsandreductioninbenefitsincomebetween2007–08and2011–12forthehouseholdscontainingthepoorest30%ofchildrenatfirstseemsdifficulttosquarewiththereductionsinemployment,fallsinrealwages,andincreasesintherelativevalueofbenefitsthatoccurredoverthatperiod(seeFigure6.10).However,reductionsinemploymentandrealearningsandincreasesinbenefitratesmayhaveledtosomere-rankingofhouseholdswithchildrenintheincomedistribution:thosemoredependentonincomefrombenefitsmayhavemovedupthedistributionandsomemaynolongerbeinthebottom30%,whilstthosemoredependentonearningsmayhavefallendownthedistribution.Indeed,perhapsreflecting,inpart,re-ranking,thenext-poorest20%ofchildrensawa12%real-termsincreaseinincomefrombenefitsandan8%reductioninincomefromearnings(althoughincreasesintherealbenefitsandtaxcreditrates,andgenuinefallsinrealwages,willalsohaveplayedarolehere).Furthermore,asshowninTable4.6inChapter4,despiteafallinemploymentratesamongthepopulationasawhole,HBAIdatarecordanincreaseinemploymentforfamilieswithchildren,especiallyamongloneparents,whichislikelytohaveledtoincreasesinearnedincomeamongpoorerhouseholdswithchildren.TheroleofchangingemploymentpatternssuggestedbyexaminingincomesourcesisinvestigatedfurtherinTable6.6.Thisshowsthefractionofthechildpopulationlivinginfamilieswithdifferentnumbersofparentsanddifferentworkstatuses,andthepovertyratesamongthesesubgroupsofthechildpopulation,in1978–1980,1996–97and2011–12.Between1978–1980and1996–97,therewasasubstantialincreaseinthefractionofchildrenlivinginworklessfamilies(from13%to23%),largelydrivenbyadramaticincreaseinthenumberofloneparents.Astherateofpovertyamongchildreninnon-workingfamilies(67%in1978–1980)wassubstantiallyhigherthanthatamongchildrenlivinginworkingfamilies(7%),thisexplainsafairpartoftheriseinchildpoverty.However,itisnotthewholestory:whilstpovertyrateschangedlittleforchildrenlivinginout-of-workfamilies(despitethedeclineinbenefitratesrelativetothepovertyline),therewasasubstantialincreaseinpovertyratesamongchildrenlivingwithworkingparents.Forinstance,thepovertyrateincreasedfrom4%to11%amongthoselivingwithasingleparentemployedfull-time,andfrom9%to22%amongthoselivingwithacouplewhereonlyoneparentworked(full-time).Hence,whereasthepovertyrate

Living standards, poverty and inequality: 2013
132
Table 6.6. Poverty (BHC) among children, by family and employment status
% of the child population Poverty rate1978–1980
1996–97 2011–12 1978–1980
1996–97 2011–12
Lone parentsFull-time 3% 3% 6% 4% 11% 8%
Part-time 2% 4% 6% 22% 27% 17%
Workless 6% 14% 10% 61% 64% 34%
Couple parentsSelf-employed 8% 13% 12% 17% 22% 23%
Two full-time earners 11% 12% 17% 0% 1% 4%
One full-time,one part-time
26% 23% 23% 1% 4% 6%
One full-time,one not working
34% 19% 16% 9% 22% 20%
One or two part-time 3% 4% 5% 26% 53% 39%
Workless 7% 9% 5% 72% 71% 54%
All 100% 100% 100% 14.6% 26.7% 17.4%Note: Figures are presented for GB up until 2001–02 and for the whole of the UK from 2002–03 onwards.Years refer to calendar years up to and including 1992, and financial years thereafter. There were somechanges to the variables used to classify the employment status of families between the FES and FRS,which likely mean that employment in 1978–1980 is a little lower than it would be if a comparabledefinition were used.Source: Authors’ calculations using Family Expenditure Survey, 1978 to 1980, and Family ResourcesSurvey, 1996–97 and 2011–12.amongthechildrenofworklessfamilieswaslittlechangedfrom17yearsearlier,thepovertyrateamongchildreninworkingfamilieshadmorethandoubledto15%by1996–97.Thisagainpointstowardsamajorrolefortheincreaseinweekly(andultimatelyhourly)earningsinequalityinexplainingtheincreaseinchildpovertyduringthe1980sandearlytomid-1990s.Italsomeansthatdespitethesharpincreaseinworklessness,thefractionofpoorchildrenlivinginworkingfamilies(justovertwo-fifths)barelychanged.Some,butnotall,ofthesetrendswentintoreversebetween1996–97and2011–12.First,thefractionofchildrenlivinginworklessfamiliesfellfrom23%to15%,andthenumberlivingincoupleswherebothparentsworkedfull-timeincreasedfairlysubstantially(from12%to17%).Iftheriskofpovertyconditionaluponfamilytypeandworkstatushadremainedsteady,thesechangesintheworkstatusoftheirparentswouldhaveledtoarounda3.9percentagepointfallinchildpovertysince1996–97.Second,therewerealsofallsintheratesofpovertyformostsubgroups,withthesebeingparticularlylargeforthechildrenofworklessfamiliesandforchildrenwhoseparentsworkpart-time.Thisreflectstheimportanceofincreasesinthegenerosityofbenefitsandtaxcreditsforfamilieswithchildreninreducingchildpoverty:theincreasesweretargetedatout-of-workfamiliesandthosewithlowearnings.Thelargerfallsinpovertyseenforyoungerthanolderchildren(seeFigure6.3)arealsolikelyto

The changing face(s) of poverty
133
beduetobenefitsreform:benefitratesforyoungerchildrenwereincreasedtoalignthemwiththoseforolderchildren.Indeed,previousresearchsuggeststhatalthoughincreasesinemploymentcontributedtothefallinchildpoverty,withouttheincreasesingenerosityofbenefitsandtaxcreditsmadeduringthelate1990sand2000s,childpovertywouldhaveactuallyrisenratherthanfallen.123Thisisbecause,intheabsenceofreforms,benefitswouldhavebeenincreasedinlinewithinflation,meaningfamiliesonbenefitswouldhavefallenfurtherbehindthosewithearnings(whichincreasedinrealterms).Fallsintherelativevalueofbenefitswouldhaveincreasedpoverty,whichwouldhaveoffsetthefallsdrivenbyincreasesinparentalemployment.124Ontheotherhand,povertyratesactuallyincreasedforthechildrenofself-employedandtwo-earnercouples(thoughstillatverylowlevelsinthelattercase),likelyduetothefactthatsuchfamilieshavenotbenefitedsomuchfromtheincreaseinmeans-testedbenefitsandtaxcredits.Togetherwithfallsinworklessnessanddeclinesinpovertyamongworklessfamilies,thishasledtoanincreaseinthefractionofpoorchildrenwhoarelivinginworkingfamiliesfromjustover40%toalmosttwo-thirds.Inotherwords,therehasbeenasubstantialshifttowardschildpovertybeingaphenomenonofworkingfamiliessince1996–97(althoughthechildrenofworklessfamiliesdoremainatmuchhigherriskofpoverty).Anothernotablefeatureofthedeclineinchildpovertyhasbeenthatithasbeenmuchgreateramongchildrenlivingwithloneparentsthanamongthoselivingwithcouples.Thisreflectsacombinationofgreateremploymentlevelsamongloneparentsinrecentyears,andthefactthatloneparentshavebenefitedmorefromincreasesinbenefitsandtaxcredits.Thismeansthatthefractionofpoorchildrenlivingwithloneparentsfellfrom39%to29%between1996–97and2011–12,bywhichpointitwasonlyalittlebitabovethefractionin1978–1980(28%),despiteadoublingoftheproportionofchildrenlivingwithloneparents.Table6.7showsthefractionsofchildrenlivinginfamilieswithdifferentnumbersofdependentchildrenandthepovertyratesforeachofthesesubgroupsofchildren.125Therewasrelativelylittlechangeinthefractionofchildrenineachgroupbetween1978–1980and1996–97,despiteasubstantialreductionintheoverallnumberofchildren.Thisindicatesareductionintheproportionoffamiliesthatcontaineddependentchildrenratherthanareductioninthenumberofchildrenconditionaluponhavingchildrenatall.However,between1996–97and2011–12,therewasanotableshifttofamiliescontainingfewerchildren,whichwillhavecontributedalittletothereductioninchildpoverty,giventhelowerratesofpovertyamongsmallerfamilies.123 See Brewer, Browne, Joyce and Sibieta (2010) and Dickens (2011).
124 Chapter 5 of Cribb, Joyce and Phillips (2012) provided a more detailed discussion of this and the otherfactors underlying the fall in child poverty between 1998–99 and 2010–11 (the period covered by the lastgovernment’s child poverty target).
125 Note that the numbers refer to the number of dependent children in the family at the time of thesurvey, and not the total number of children that a family has.

Living standards, poverty and inequality: 2013
134
Table 6.7. Child poverty by number of children (BHC)
% of the child population Poverty rate1978–1980
1996–97 2011–12 1978–1980
1996–97 2011–12
Number of childrenOne 22% 23% 30% 10% 18% 15%
Two 46% 45% 45% 10% 20% 15%
Three 21% 21% 17% 19% 34% 23%
Four or more 11% 11% 8% 34% 57% 29%
All 100% 100% 100% 14.6% 26.7% 17.4%Note: Figures are presented for GB up until 2001–02 and for the whole of the UK from 2002–03 onwards.Years refer to calendar years up to and including 1992, and financial years thereafter.Source: Authors’ calculations using Family Expenditure Survey, 1978 to 1980, and Family ResourcesSurvey, 1996–97 and 2011–12.Thetablealsoshowsthataftersubstantialincreasesintherateofchildpovertyforeachgroupbetween1978–1980and1996–97,thefallinchildpovertysince1996–97hasbeengreaterforlargerfamilies.Thismeansthatwhereas53%ofpoorchildrenlivedinfamiliesofthreeormorechildrenin1978–1980and50%didin1996–97(comparedwith32%ofallchildrenlivinginsuchfamilies),by2011–12only36%did(comparedwith25%ofallchildren).Inotherwords,today’spoorchildissubstantiallylesslikelytobefromalargefamilythaninthemid-1990sorlate1970s.However,povertyratesforlargerfamiliesdoremainhigherthanthoseforsmallerfamilies.Tosummarise,thefallinemploymentandincreasinginequalityinearningsamongworkingfamilieslooklikelytobethemainfactorsunderlyingtheincreaseinchildpovertyduringthe1980sandearly1990s.Andaswithworking-ageadultswithoutchildren,whilstthebenefitandtaxcreditsystemprovidedsupportforthosewhosawtheirprivateincomesfall,thereductioninbenefitratesrelativetomedianincome,andthusthepovertyline,alsocontributedtorisingchildpoverty.Ontheotherhand,since1996–97,increasedparentalemployment–especiallyamongloneparents–and,aboveall,increasesinthegenerosityofbenefitsandtaxcreditsforfamilieswithchildren,haveactedtoundoalargepartoftheearlierriseinchildpoverty,especiallyforyoungchildrenandforfamilieswiththreeormorechildren.However,theincreaseinearningsinequalitysincethelate1970smeansthatthereremainmorechildrenwithincomesbeloworjustabovethepovertylinethanin1978–1980.6.5 ConclusionThelast50yearshaveseenmajorchangesintheratesofpovertyfacedbydifferentpopulationgroups.Whereasinthe1960sandearly1970saroundtwooutoffivepoorpeoplewerepensioners,by2011–12thishaddeclinedtolessthanoneoutoffiveonaBHCbasis,andlessthanoneoutofeightonanAHCbasis,despiteanincreaseinthefractionofpensionersinthepopulation.Ontheotherhand,relativepovertyratesforworking-ageadultswithandwithoutchildrenhaveincreasedsincethe1970s.

The changing face(s) of poverty
135
Overall,fallingpovertyamongpensionersandrisingpovertyamongworking-ageadultswithoutchildrenmeanthat,whereas40to50yearsagotherateofpovertyamongpensionerswasaroundsixtoeighttimeshigherthanthatamongworking-ageadultswithoutchildren,by2011–12itwasatasimilarlevelonaBHCbasis,andjusttwo-thirdsofthelevelamongworking-ageadultsonanAHCbasis.Thisisadramaticimprovementintherelativepositionofpensioners,drivenbyincreasedincomefromstatebenefitsandpensionsandfromprivatepensions,andafallinrelativehousingcostsasmorepensionershavecometoowntheirhomesoutright.Indeed,withmostoftheimprovementhavingtakenplacesincetheearly1990s,today’spensionersfindthemselvesmuchlesslikelytobetowardsthebottomoftheincomedistributionthanjustagenerationearlier.Risingpovertyamongworking-ageadultsandchildrenduringthe1980sandearly1990swasdrivenbyincreasinglevelsofworklessness,growinginequalityinearnings,andfallsinbenefitratesrelativetomedianincomes,andthusthepovertyline.Since1996–97,weakearningsgrowthhascontinuedtoincreasepovertyamongworking-ageadultswithoutchildren,butincreasesinparentalemploymentrates,and,aboveall,anincreaseinthegenerosityofbenefitsandtaxcreditsforfamilieswithchildren,havereducedrelativechildpoverty.Thisisparticularlythecaseforthosewholivewithloneparents,thosewholiveinlargefamilies,andthosewhoseparentsdonotwork.Indeed,despiteafallinthefractionofchildrenandworking-ageadultslivinginfamilieswheresomeoneworkssincethe1970s,thefractionofpoorchildrenandworking-ageadultsfrom‘workingfamilies’hasincreasedsubstantially,toaroundhalfofworking-ageadultswithoutchildrenandtoalmosttwo-thirdsofchildren.Togetherwiththeshiftintheincidenceofpovertyfrompensionerstoworking-agefamilies,thismeanspovertyhasbecomemuchmoreofanin-workphenomenonsincethe1970s,asincreasedearningsinequalityinthe1980sandrelativelyslowgrowthinearningssincehavepushedmorelowandmiddleearnersintopoverty.Thisshiftinpovertyfromsomethingconcentratedamongtheoldandworklesstosomethingincreasinglyfeltbyemployedandself-employedworking-ageadultsisamajorsocio-economicchange.Thereductioninrelativeincomepovertyamongpensioners,inparticular,canbeseenasarealachievementinimprovingthemateriallivingstandardsofavulnerablegroupwhopreviouslyoftenhadverylowincomes.Andwithcurrentwelfarepolicyprotectingpensionerbenefitswhilstreducingmanybenefitsaimedatworking-ageadultsandchildren,thistrendislikelytocontinue.Indeed,pensionerpovertylooksincreasinglylikeyesterday’sproblem,withthegrowingissueofworking-agepovertyandaresurgenceinchildpovertybeingthekeyconcerninthecomingyears.
136
© Institute for Fiscal Studies
Appendix A. The Households Below Average Income(HBAI) methodology126
Income as a measure of living standardsMostpeoplewouldconsiderthatwell-beingconsistsofmorethanasimplemeasureofmaterialcircumstances.However,evenifwewantedto,itwouldbeextremelyhardtodefineanobjectiveindexofwell-beingorhappiness,letalonetomeasureit.Themainapproachtolivingstandardstakeninthegovernment’sHBAIdocument(andthereforeinthisreporttoo)istofocussolelyonmaterialcircumstances,andtouseincomeasaproxyformostoftheanalysis.Forfamilieswithchildrenandpensioners,‘materialdeprivation’indicatorsarealsoused,tosupplementandperhapsimproveupontheinformationonlivingstandardsprovidedbyincome.Theseindicatorsarebasedonquestionsthateffectivelyaskpeoplewhethertheycanaffordtodoparticularthings,withthepreciseproceduredifferingbetweenfamilieswithchildrenandpensioners.AppendixDdescribesthelevelsandtrendsinmaterialdeprivationaccordingtotheseindicators.Evenasameasureofmaterialwell-being,theHBAIincomemeasurehassomeimportantlimitations.Forexample,itisa‘snapshot’measure–reflectingactual,orinsomecases‘usual’,incomeataroundthetimeoftheFamilyResourcesSurvey(FRS)interview.MeasuringincomeinthiswaymeansthattheHBAIincomestatisticscapturebothtemporaryandpermanentvariationinincomebetweenindividuals,butthelatterwouldgenerallyberegardedasabettermeasureoftheirrelativewelfare.Forexample,havingatemporarilylowincomeisunlikelytohavesevereconsequencesforcurrentmateriallivingstandardsifindividualsareabletodrawonpreviously-accumulatedwealth.Statisticsbaseduponcurrentincomeswillattributethesamelevelofwelfaretopeoplewiththesameincome,regardlessofhowmuchsavingsorotherassetstheyhave,orhowmuchtheyspend.Consumptionwouldarguablymakeabettermeasureofmaterialwell-being,butreliabledatacanbeharderandmoreexpensivetocollect.Usingconsumptionasthemeasureofwell-beingcanchangeourinterpretationofwhois‘poor’andhowratesofpovertyhavechangedovertime.127The treatment of housing costsThegovernment’sHBAIpublicationslookattwomeasuresofincome.Onemeasurecapturesincomebeforehousingcostsarededucted(BHC)andtheotherisameasureafterhousingcostshavebeendeducted(AHC).Thecaseforusingthesedifferentincomemeasuresarisesfromvariationinhousingcosts.WhendecidingwhethertomeasurelivingstandardsonanAHCbasisaswellasBHC,themainissuesarewhetherpeoplefacegenuinechoicesovertheirhousingandwhetherhousingcostdifferentialsaccuratelyreflectdifferencesinhousingquality.Itisoftenarguedthatsomeindividualsdonothavemuchchoiceoverthetypeorcostofhousingservicesthattheyconsume,whereastheyhaveconsiderablymorechoiceoverthepurchaseofotherconsumptiongoods(suchasfoodorclothing).Fortheseindividuals,itcouldbearguedthatanAHCmeasureisamoresuitablemeasureoftheirwell-being.Lackofchoiceoverhousingcostandqualityisparticularlyimportantinthesocialrentedsector,whereindividualstendto126 Many of these issues are also discussed in Berthoud and Zantomio (2008).
127 See Brewer, Goodman and Leicester (2006) and Brewer and O’Dea (2012).

Appendix A
137
havelittlechoiceovertheirhousingandwhererentshaveoftenbeensetwithlittlereferencetohousingqualityortheprevailingmarketrents.Forlow-incomeindividuals,AHCmeasuresalsohaveanadvantageoverBHCmeasuresthatarisesduetotheexistenceofhousingbenefit–anincome-relatedbenefitthatreimbursespeoplespecificallyfortheirhousingcosts.Considerahouseholdwithnoprivateincomewhoserentincreasesby£10perweek.Thiswouldtriggera£10increaseinhousingbenefitentitlementtocovertherentincrease.Hence,AHCincomewouldremainunchangedbutBHCincomewouldincreaseby£10perweek.Therefore,whererentchangesdonotreflectchangesinhousingquality–forexample,whentheysimplyreflectchangesintherelativesupplyofrentedaccommodation–thesubsequentchangesinBHC(butnotAHC)incomecangiveamisleadingimpressionofthechangeinlivingstandardsofhouseholdsonhousingbenefit.PensionersareanothergroupforwhomanAHCmeasurehasoftenbeenconsideredappropriate.Thisisbecausemorethansevenintenpensionersowntheirhomesoutright(mostoftheremainderaresocialrenters).128Peoplewhoowntheirhomesoutrightwillbeabletoattainahigherstandardoflivingthanindividualswiththesameincomelevelbutwhohavemortgageorrentalpayments,sincehousingisanassetwhichisofbenefittothosewhoowntheirownhomes.OnaBHCmeasure,anindividualwhoownstheirownhousewillbetreatedasbeingaswelloffasanotherwise-identicalindividualwhoisstillpayingoffamortgage;anAHCmeasure,though,wouldindicatethattheformerwasbetteroff.129However,forindividualswhodoexerciseaconsiderabledegreeofchoiceoverhousingcostandquality,housingcanbeseenmoreasaconsumptiongoodlikeanyother,andaBHCincomemeasuremaythereforebepreferable.Forinstance,considertwohouseholdswiththesameBHCincome,oneofwhichdecidestospendalargerfractionofthatincomeonalargerhouseinabetterneighbourhood,andtheotherspendsthedifferenceonconsumerdurables.OnanAHCbasis,theformerhouseholdwouldbeconsideredpoorer,whilsttheirlivingstandardsmaybecomparable(and,indeed,thehouseholdspendingmoreonhousinghasrevealedthroughitschoicethatitis‘betteroff’spendingmoreonhousingratherthanhavingmoretospendonothergoodsandservices).Forthesereasons,commentators(includingtheauthorsofthisreport)haveoftenfocusedonAHCincomeswhenconsideringthelivingstandardsofindividualsatthelowerendoftheincomescale,orwhenmeasuringpoverty,butlookedatincomesmeasuredBHCwhenconsideringtheentireincomedistribution.However,forafullerpictureoflivingstandards,itisbesttokeepinmindbothmeasures.Income sharingTotheextentthatincomesharingtakesplacewithinhouseholds,thewelfareofanyoneindividualinahouseholdwilldependnotonlyontheirownincome,butalsoontheincomesofotherhouseholdmembers.Bymeasuringincomeatthehouseholdlevel,theHBAIstatisticsimplicitlyassumethatallindividualswithinthehouseholdareequallywelloffandthereforeoccupythesamepositionintheincomedistribution.Forsomehouseholds,thisassumptionmayprovideareasonableapproximation–forexample,somecouplesmaybenefitequallyfromall128 Authors’ calculations using Family Resources Survey 2011–12.
129 A conceptually better solution to this problem would be to impute an income from owner-occupationand add this to BHC income. Unlike the AHC measure, this would also capture the benefits to individualsof living in better-quality housing.

Living standards, poverty and inequality: 2013
138
incomecomingintothehousehold.Forothers,suchasstudentssharingahouse,itisunlikelytobeappropriate.Perfectincomesharingisbynomeanstheonly‘reasonable’assumptionthatonecouldmake:forexample,onecouldeffectivelyassumethatthereiscompleteincomesharingwithinthedifferentbenefitunitsofahouseholdbutnotbetweenthem,bymeasuringincomesatthebenefit-unitlevelratherthanatthehouseholdlevel.However,giventhedataavailable,perfectincomesharingisoneoftheleastarbitraryandmosttransparentassumptionsthatcouldbemade.Comparing incomes across householdsIfhouseholdincomeistoreflectthestandardoflivingthathouseholdmembersexperience,andifwearetocomparetheseincomesacrossdifferenthouseholdtypes,thensomemethodisrequiredtoadjustincomesforthedifferentneedsthatdifferenthouseholdsface.TheofficialHBAIincomestatisticscurrentlyusethemodifiedOECDscaleandaDepartmentforWorkandPensions(DWP)AHCvariant,showninTableA.1,toadjustincomesonthebasisofhouseholdsizeandcomposition,expressingallincomesastheamountthatachildlesscouplewouldrequiretoenjoythesamestandardofliving.Forexample,whenincomeismeasuredbeforehousingcosts,theOECDscaleimpliesthatasinglepersonwouldrequire67%oftheincomethatachildlesscouplewouldrequiretoattainthesamestandardofliving.So,togettheequivalentincomeofthatsingleperson,wedividetheiractualincomeby0.67.Thisprocessisreferredtoas‘incomeequivalisation’.Table A.1. Equivalence scales used in HBAI
BHC equivalence scale AHC equivalence scale
First adult 0.67 0.58
Spouse 0.33 0.42
Other second adult 0.33 0.42
Third and subsequent adults 0.33 0.42
Child aged under 14 0.20 0.20
Child aged 14 and over 0.33 0.42
ThemodifiedOECDscaledoesnottakeintoaccountothercharacteristicsofthehouseholdbesidestheageandnumberofindividualsinthehousehold,althoughtheremaybeotherimportantfactorsaffectingahousehold’sneeds.Animportantexampleofthesewouldbethedisabilityorhealthstatusofhouseholdmembers.TheconventionalmethodologyinHBAIwouldplaceahouseholdreceivingdisabilitybenefitshigheruptheincomedistributionthananotherwise-equivalenthouseholdwithoutsuchbenefits.Butifthishigherlevelofincomeonlycompensatesthehouseholdforthegreaterneedsithasortheextracostsitfaces,thenthestandardoflivingofthishouseholdmaybenohigher.130Sample weighting, and adjusting the incomes of the ‘very rich’TheincomesanalysedinthisreportarederivedfromtheFamilyResourcesSurvey(FRS)and,priorto1994–95,theFamilyExpenditureSurvey(FES).ThesesurveysaredesignedtoprovideabroadlyrepresentativesampleofhouseholdsinGreatBritainuntil2001–02,andinthewhole130 See also section 5.3 of Brewer, Muriel, Phillips and Sibieta (2008).
Appendix A
139
UnitedKingdomfrom2002–03onwards.However,becausetheyarevoluntarysurveys,thereisinevitablyaproblemofnon-response,whichmaydifferaccordingtofamilytypeandaccordingtoincome.Suchnon-responsebiasisdealtwithintwoways.First,weightsareappliedtothedatatoensurethatthecompositionofthesample(intermsofage,sex,maritalstatus,regionandanumberofothervariables)reflectsthetrueUKpopulation.131Forexample,ifthereareproportionatelyfewerloneparentsinthesamplethanthereareinthepopulation,thenrelativelymoreweightmustbeplaceduponthedatafromthoseloneparentswhoactuallydorespond.Second,aspecialprocedureisappliedtoincomesattheverytopoftheincomedistributiontocorrectfortheparticularproblemsinobtaininghighresponseratesfromveryrichindividualsandthevolatilityintheirreportedincomes.ThisadjustmentprocedureusesprojecteddatafromHMRC’sSurveyofPersonalIncomes(SPI)–asupposedlymorereliablesourceofdatafortherichestindividualsbasedonincometaxreturns.Theveryrichestindividuals,forwhomtheSPIadjustmentisapplied,areassignedanincomelevelderivedfromtheSPIsurvey.Thereisnocorrespondingcorrectionfornon-response,orformisreportingofincomes,atthelowerendoftheincomedistribution,meaningcautionshouldbeusedwhenconsideringthosewiththeverylowestincomes.The income measure summarisedIntheanalysisinthisreport,wethereforefollowthegovernment’sHBAImethodology,usinghouseholdequivalisedincomeafterdeductingtaxesandaddingbenefitsandtaxcredits,expressedastheequivalentincomeforacouplewithnodependentchildrenandinaverage2011–12prices,asourmeasureoflivingstandards.Forbrevity,weoftenusethisterminterchangeablywith‘income’.
131 See Department for Work and Pensions (2013).

140
© Institute for Fiscal Studies
Appendix B. Benefit and tax credit income: comparingHBAI and administrative data
FigureB.1showstotalbenefitspending(includingtaxcredits)asrecordedinadministrativedatabytheDepartmentforWorkandPensions(DWP)andHMRevenueandCustoms(HMRC),comparedwithnominalgrowthinbenefitandtaxcreditincomemeasuredbyHBAI.(Reflectingtheavailabilityofadministrativedata,taxcreditandchildbenefitincomeisfortheUKandotherbenefitincomeisforGreatBritain.)ThefigureshowsthattheincreaseinbenefitandtaxcreditreceiptsfoundintheHBAIdatain2011–12was2.0%,significantlylowerthanthe4.2%increaseintheamountthatthegovernmentrecordsasbeingpaidoutinitsadministrativerecords.Figure B.1. Nominal growth in total spending on benefits and tax credits:comparing HBAI and administrative data
Note: Tax credit and child benefit income is for the UK. Other benefit income is for Great Britain.Source: HBAI benefits income from authors’ calculations using Family Resources Survey, various years.Administrative expenditure from DWP benefit expenditure table 1(http://research.dwp.gov.uk/asd/asd4/index.php?page=medium_term) and HMRC annual accounts,various years (available at http://www.hmrc.gov.uk/about/reports.htm).Thegraphshowsthatthisdiscrepancyisbynomeansunprecedented,however.Differencesfromyeartoyeararetobeexpectedduetorandomsamplingvariationintheunderlyingsurveydata,aswellaspossiblefluctuationsinthesurvey’sabilitytocorrectlyrecordbenefitandtaxcreditincomefromthosewhoaresampled.Inrecenthistory,theHBAIdatahavebeengettingprogressivelyworseatrecordingbenefitandtaxcreditreceipt,atrendthatcontinuedin2011–12.Takingtheperiodsince1999–2000asawhole,administrativedatashowacashincreaseinbenefitandtaxcreditspendingof100%,whilstHBAIrecordsanincreaseofonly81%.TableB.1documentstheextentofunder-recordingofthelargestbenefitsandtaxcredits(inexpenditureterms,accordingtoadministrativedata)intheHBAIdata.Overall,theHBAIdatacapturedaround80%ofbenefitandtaxcreditspendingin2011–12.Withinthataggregate
0%
2%
4%
6%
8%
10%
HBAI benefits income Benefits expenditure (administrative data)

Appendix B
141
figure,thegeneralpatternthatemergesisparticularlypoorrecordingofreceiptofmeans-testedpayments.Forexample,whilstHBAIpickeduparound90%ofchildbenefitandbasicstatepensionspendingin2011–12,itrecordedjust52%ofpensioncreditspendingand64%oftaxcreditspending.Theparticularlypoorrecordingofpensioncreditreceiptisofcontinuingconcern,givenitspotentialimplicationsforthemeasurementofpensionerpoverty.Moregenerally,theeffectofthisunder-recordingonmedianincome,inequalityandpovertyisnotknown,asitdependsuponpreciselywherethosewithunder-reportedincomesareintheincomedistribution.Butthegeneraltendencyformeans-testedbenefitstoberecordedpoorlyissuggestivethatthelargestbiascausedmaybeanunderestimationoftheincomesoflow-incomehouseholds.Table B.1. Total annual expenditure on major benefits in 2011–12
Administrativedata
(£ billion)
HBAI data(£ billion)
% of totalexpenditurerecorded inHBAI data
Basic state pension 74.1 66.1 89
Pension credit 8.1 4.2 52
Tax credits 30.4 19.5 64
Child benefit 12.2 11.0 90
Housing benefit 22.8 17.5 77
Disability living allowance 12.6 9.7 77
All benefits and tax credits 201.2 158.3 79Note: Figures for tax credits and child benefit are for the UK. Other figures are for Great Britain.Source: HBAI benefit receipts data from authors’ calculations using Family Resources Survey 2011–12.Administrative benefit expenditure data from DWP benefit expenditure table 1(http://research.dwp.gov.uk/asd/asd4/index.php?page=medium_term) and HMRC annual accounts(available at http://www.hmrc.gov.uk/about/reports.htm).

142
© Institute for Fiscal Studies
Appendix C. The decomposition of the Gini coefficient
InSection3.2,wedecomposetheoverallGinicoefficientintothreecomponents:1) incomeinequalitywithinthebottom99%oftheincomedistribution;2) incomeinequalitywithinthetop1%oftheincomedistribution;3) incomeinequalitybetweenthebottom99%andthetop1%oftheincomedistribution.FigureC.1presentsastylisedpictureofhowthisdecompositionworks.132Theboldblacklineplotssharesofthepopulationagainsttheshareofincomeheldbythatshareofthepopulation,andisknownastheLorenzcurve.TheGinicoefficientisthencalculatedasG=A/(A+B),whereAistheareabetweentheLorenzcurveandthe45-degreeline,andBistheareaundertheLorenzcurve.Theintuitionforthisisstraightforward.Ifalltheindividualsinaneconomyhadthesameincome,theLorenzcurvewouldbethe45-degreeline,andtheGinicoefficientwouldbe0.Ifasingleindividualhadalltheincomeinaneconomy,theareaundertheLorenzcurve(B)wouldbe0,andsotheGinicoefficientwouldbe1.ThedecompositionthensimplydividesAintothreeareasindicatedbythedottedlines,correspondingtothethreecomponentsgivenabove.‘1’istheinequalitywithinthebottompartofthedistribution,‘2’theinequalitywithinthetoppartofthedistribution,and‘3’theinequalitybetweenthetopandthebottom.Figure C.1. The decomposition of the Gini coefficient
Moreformally,theGinicoefficientiscalculatedastheaveragedifferencebetweenthe(household)incomesofallthepairsofindividualsinaneconomy,scaledbymeanhouseholdincome:
132 We would like to thank Ian Preston for assistance with this figure.
1
1Population share0
B
A
3
2Income share
1

Appendix C
143
whereNisthenumberofindividualsinaneconomy,μistheaveragehouseholdincome,yiisthehouseholdincomeofindividualiandyjisthehouseholdincomeofindividualj.Ifweindexthepopulationfrom1toNinorderofhouseholdincome,theGinicoefficientcanalsobedefinedforanypopulationN*inwhichallindividualshaveahouseholdincomey<y*:
where istheGinicoefficientforthepopulationN*and ismeanincomeforthatpopulation.TheGiniforthebottom99%oftheincomedistribution,forexample,isthereforesimplytheaveragedifferencebetweenthehouseholdincomesofallpairsofindividualsinthatpartofthedistribution,scaledbytheirmeanhouseholdincome.Followingthisdefinition(andasimilaronefortheGinicoefficientforthepopulationwithahouseholdincomey>y*),theGinicoefficientcanbedecomposedasfollows:
Now, where .Bydefinition, .So where .Thenwehave .
TheGinicoefficientcanthusbeexpressedastheweightedsumofthreecomponents:1) theGinicoefficientforthepopulationwithhouseholdincomey≤y*,weightedbytheproductoftheirpopulationshareandtheirincomeshare;2) theGinicoefficientforthepopulationwithhouseholdincomey>y*,weightedbytheproductoftheirpopulationshareandtheirincomeshare;3) a‘cross-term’consistingoftheaveragedifferencebetweenthehouseholdincomeofeachpairofindividualsinwhichonehasanincomeyi≤y*andtheotherhasanincomeyj>y*,scaledbymeanincome.
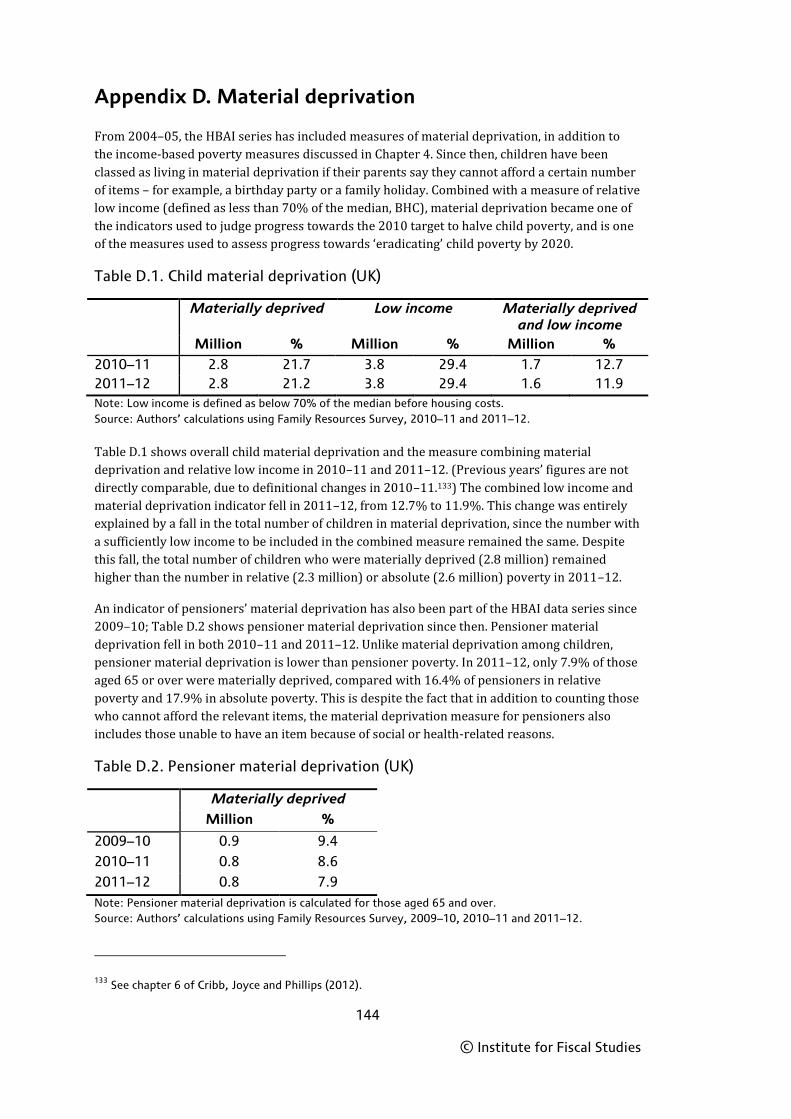
144
© Institute for Fiscal Studies
Appendix D. Material deprivation
From2004–05,theHBAIserieshasincludedmeasuresofmaterialdeprivation,inadditiontotheincome-basedpovertymeasuresdiscussedinChapter4.Sincethen,childrenhavebeenclassedaslivinginmaterialdeprivationiftheirparentssaytheycannotaffordacertainnumberofitems–forexample,abirthdaypartyorafamilyholiday.Combinedwithameasureofrelativelowincome(definedaslessthan70%ofthemedian,BHC),materialdeprivationbecameoneoftheindicatorsusedtojudgeprogresstowardsthe2010targettohalvechildpoverty,andisoneofthemeasuresusedtoassessprogresstowards‘eradicating’childpovertyby2020.Table D.1. Child material deprivation (UK)
Materially deprived Low income Materially deprivedand low income
Million % Million % Million %2010–11 2.8 21.7 3.8 29.4 1.7 12.72011–12 2.8 21.2 3.8 29.4 1.6 11.9Note: Low income is defined as below 70% of the median before housing costs.Source: Authors’ calculations using Family Resources Survey, 2010–11 and 2011–12.TableD.1showsoverallchildmaterialdeprivationandthemeasurecombiningmaterialdeprivationandrelativelowincomein2010–11and2011–12.(Previousyears’figuresarenotdirectlycomparable,duetodefinitionalchangesin2010–11.133)Thecombinedlowincomeandmaterialdeprivationindicatorfellin2011–12,from12.7%to11.9%.Thischangewasentirelyexplainedbyafallinthetotalnumberofchildreninmaterialdeprivation,sincethenumberwithasufficientlylowincometobeincludedinthecombinedmeasureremainedthesame.Despitethisfall,thetotalnumberofchildrenwhoweremateriallydeprived(2.8million)remainedhigherthanthenumberinrelative(2.3million)orabsolute(2.6million)povertyin2011–12.Anindicatorofpensioners’materialdeprivationhasalsobeenpartoftheHBAIdataseriessince2009–10;TableD.2showspensionermaterialdeprivationsincethen.Pensionermaterialdeprivationfellinboth2010–11and2011–12.Unlikematerialdeprivationamongchildren,pensionermaterialdeprivationislowerthanpensionerpoverty.In2011–12,only7.9%ofthoseaged65oroverweremateriallydeprived,comparedwith16.4%ofpensionersinrelativepovertyand17.9%inabsolutepoverty.Thisisdespitethefactthatinadditiontocountingthosewhocannotaffordtherelevantitems,thematerialdeprivationmeasureforpensionersalsoincludesthoseunabletohaveanitembecauseofsocialorhealth-relatedreasons.Table D.2. Pensioner material deprivation (UK)
Materially deprivedMillion %
2009–10 0.9 9.4
2010–11 0.8 8.6
2011–12 0.8 7.9Note: Pensioner material deprivation is calculated for those aged 65 and over.Source: Authors’ calculations using Family Resources Survey, 2009–10, 2010–11 and 2011–12.
133 See chapter 6 of Cribb, Joyce and Phillips (2012).

145
© Institute for Fiscal Studies
Appendix E. After-housing-cost analysis, supplementaryto Chapter 5
ThisAppendixpresentssomeofthekeyanalysisfromChapter5onanafter-housing-cost(AHC)basis.FiguresE.1toE.6aretheAHCanaloguesofFigures5.1,5.2,5.5,5.8,5.10and5.11respectively.NotabledifferencesbetweentheBHCandAHCanalysesarereferredtointhemaintextofChapter5,aspartofthediscussionoftherelevantfigures.Figure E.1. Position in overall income distribution, by family type (AHC, GB)
Note: Incomes have been measured after housing costs have been deducted. ‘1979’ refers to the pooledthree-year period between 1978 and 1980. ‘1996’ and ‘2011’ refer to financial years.Source: Authors’ calculations using Family Expenditure Survey, 1978 to 1980, and Family ResourcesSurvey, 1996–97 and 2011–12.
1979 1996 2011 1979 1996 2011 1979 1996 2011
0%
10%
20%
30%
40%
50%
60%
70%
80%
90%
100%
Parents and children Pensioners Working-age without children
1st quintile (lowest income) 2nd 3rd 4th 5th quintile (highest income)

Living standards, poverty and inequality: 2013
146
Figure E.2. Real income growth by percentile point for different family types(AHC, GB)
1978–1980 to 2011–12
1978–1980 to 1996–97
1996–97 to 2011–12
Note: The changes in income at the 1st, 2nd and 99th percentiles are not shown on this graph due to high levels ofstatistical uncertainty. Incomes have been measured after housing costs have been deducted. Since the distributions ofhousehold income in different family types are different, the same percentile points of each distribution do notcorrespond to the same absolute income levels.Source: Authors’ calculations using Family Expenditure Survey, 1978 to 1980, and Family Resources Survey, 1996–97and 2011–12.
-3%
-2%
-1%
0%
1%
2%
3%
4%
10 20 30 40 50 60 70 80 90
Ann
ualincomechan
ge
Parents and children Pensioners Working-age without children
Percentile point
-3%
-2%
-1%
0%
1%
2%
3%
4%
10 20 30 40 50 60 70 80 90
Ann
ualincomechan
ge
Percentile point
-3%
-2%
-1%
0%
1%
2%
3%
4%
10 20 30 40 50 60 70 80 90
Ann
ualincomechan
ge
Percentile point

Appendix E
147
Figure E.3. Median income by age (AHC, GB)
Note: All monetary amounts have been equivalised using the DWP AHC variant of the modified OECDequivalence scale and are expressed in terms of equivalent amounts for a childless couple. Incomes havebeen measured after housing costs have been deducted.Source: Authors’ calculations using Family Expenditure Survey and Family Resources Survey, variousyears.
Figure E.4. 90/10 ratios by age (AHC, GB)
Note: Incomes have been measured after housing costs have been deducted. Data points show the ratiobetween incomes at the 90th and 10th percentiles.Source: Authors’ calculations using Family Expenditure Survey and Family Resources Survey, variousyears.
100
150
200
250
300
350
400
450
500
550
600Med
ianinco
me(£
perwee
k)
1961–1963 1978–1980 2001–02 2007–08 2011–12
Age
2.0
2.5
3.0
3.5
4.0
4.5
5.0
5.5
6.0
6.5
7.0
90/10ratio
1961–1963 1978–1980 2001–02 2007–08 2011–12
Age

Living standards, poverty and inequality: 2013
148
Figure E.5. Median income from age 50, by birth cohort (AHC, GB)
Note: All monetary amounts have been equivalised using the DWP AHC variant of the modified OECDequivalence scale and are expressed in terms of equivalent amounts for a childless couple. Incomes havebeen measured after housing costs have been deducted.Source: Authors’ calculations using Family Expenditure Survey and Family Resources Survey, variousyears.
Figure E.6. Income at 20th percentile from age 50, by birth cohort (AHC, GB)
Note and source: See Figure E.5.
150
200
250
300
350
400
450
50 55 60 65 70 75 80
Med
ianinco
me(£
perwee
k)
Born 1901–1910 Born 1911–1920
Born 1921–1930 Born 1931–1940
Age
100
120
140
160
180
200
220
240
260
280
300
50 55 60 65 70 75 80
20thpe
rcen
tile
(£pe
rwee
k)
Born 1901–1910 Born 1911–1920
Born 1921–1930 Born 1931–1940
Age

149
© Institute for Fiscal Studies
Appendix F. Non-pensioner incomes in families with andwithout children: quantile regression analysis
Section5.1(andinparticularFigure5.2)showedthat,between1996–97and2011–12,incomegrowthwashigherforindividualsinfamilieswithchildrenthanforworking-ageadultswithoutchildren.Herewebrieflyinvestigatetheroleinthisofbasicdemographicchangesovertheperiod.Weconsiderchangesinthenumberofchildrenthatfamilieswithchildrenarehavingandchangesintheagesofparents.Weshowthatthesechangesdonotaccountforthedifferencesinincomegrowthbetweennon-pensionersinfamilieswithandwithoutchildren.Rather,asshowninthemainanalysisinSection5.1,thekeyexplanationsthatremainarebenefitandtaxcreditpolicyandpatternsofearningsgrowth.TableF.1presentsresultsfromaseriesofquantileregressions.Theseestimatetheassociationbetweenapointinthedistributionofincomeandexplanatoryvariables.Forexample,iftheonlyexplanatoryvariableisanindicatorforhavingdependentchildren,onecanestimatetheassociationbetweenhavingchildrenandincomeatthemedian,oratthe20thpercentile,oratanyotherchosenpercentileofthedistribution.Thedependentvariableusedisthenaturallogarithmofnethouseholdequivalisedincome(thesamestandardmeasureofincomeusedthroughoutthisreport).Coefficientestimatespresentedinthetablecanbemultipliedby100andinterpretedapproximatelyaspercentagechangesinincomeassociatedwithhavingTable F.1. Association between having dependent children in the family and(log) household equivalised BHC income for non-pensioners: quantileregression results (GB)
1996–97 2011–1220th
percentileMedian 80th
percentile20th
percentileMedian 80th
percentile
Specification 1At least one child –0.31 –0.35 –0.32 –0.13 –0.24 –0.22
Specification 2One child –0.19 –0.24 –0.21 –0.05 –0.17 –0.16
Two children –0.24 –0.28 –0.29 –0.10 –0.21 –0.17
Three children –0.41 –0.50 –0.47 –0.23 –0.43 –0.43
Four or more children –0.54 –0.85 –0.82 –0.31 –0.56 –0.70
Specification 3(controls for age offamily head)One child –0.24 –0.33 –0.31 –0.09 –0.23 –0.29
Two children –0.30 –0.42 –0.42 –0.15 –0.30 –0.35
Three children –0.48 –0.64 –0.62 –0.29 –0.53 –0.58
Four or more children –0.64 –0.96 –0.95 –0.38 –0.66 –0.79Note: Sample is individuals in families where the head of the family is aged under 60. Numbers arecoefficient estimates from quantile regressions. All coefficient estimates in this table are statisticallysignificant at the 5% level. Controls for age of the head of the family are defined by eight indicatorvariables for being under 25 and being in each five-year age band up to and including 55–59. Regressionswere run separately for each year. Individuals in households without a strictly positive net income areexcluded. Incomes have been measured before housing costs have been deducted.Source: Authors’ calculations using Family Resources Survey, 1996–97and 2011–12.

Living standards, poverty and inequality: 2013
150
children.Thesampleonwhichtheregressionsarerunisthesampleoffamiliesinwhichtheoldestmemberisagedunder60.Henceweareestimatingdifferencesamongindividualsinnon-pensionerfamilies.Aswithanyregression,theestimatesarestatisticalassociationsandarenot(withoutassumptions)estimatesofcausaleffects.AlloftheestimatedcoefficientsinTableF.1arestatisticallysignificantatthe5%level.Thefirstrowofnumbersinthetablegivesresultsfromquantileregressionswithjustoneexplanatoryvariable:anindicatorforthepresenceofanydependentchildreninthefamily.Theresultssuggestthat,in1996–97,thepresenceofdependentchildreninthefamilywasassociatedwithapproximatelya31%reductioninhouseholdincomeatthe20thpercentile,a35%reductionatthemediananda32%reductionatthe80thpercentile.By2011–12,thesehadfallento13%,24%and22%respectively.Inotherwords,havingdependentchildrenin2011–12isclearlyassociatedwithasmallerdropinincomeacrossthedistributionthanwasthecasein1996–97–familieswithchildrenhavebeen‘catchingup’withworking-agefamilieswithoutchildren,withaparticularlylargecatch-upatthebottomofthedistribution.Thesecondsetofnumbersinthetableexploreswhetherthiscanbeexplainedsimplybychangesinthenumberofchildrenthatfamiliesarehaving.AsdescribedinSection5.1,familieswithchildrentendtohavefewerchildrennowthanwasthecasein1996–97,andhavingfewerchildrenisassociatedwithhavinghigherincome.Buttheresultsmakeclearthatfamilieswithchildrenhaveexperiencedfasterincomegrowthevenafteraccountingforthisdemographicchange.Havingagivennumberofchildrenisnowassociatedwithasmallerreductioninincome–relativetohavingnochildren–thanwasthecasein1996–97.Thisresultisconsistentacrossthedistribution(specifically,atthe20th,50thand80thpercentiles)andacrossfamilieswithdifferentnumbersofchildren(i.e.onechild,twochildren,threechildrenoratleastfourchildren).Finally,thethirdsetofnumbersinthetableshowsthatthisremainstrueonceonealsocontrolsforadultage.134Inotherwords,thefactthatfamilieswithgivennumbersofchildrenhaveexperiencedfasterincomegrowththanworking-ageadultswithoutchildrensince1996–97isnotsimplybecauseofchangesintheagesofparents.
134 For couples, we use the age of the older member. Coefficient estimates for age are not included in thetable, as they are not of primary interest here. They are available from the authors on request.

151
© Institute for Fiscal Studies
ReferencesAldridge,H.,Kenway,P.,MacInnes,T.andParekh,A.(2012),MonitoringPovertyandSocialExclusion2012,York:JosephRowntreeFoundation(http://www.jrf.org.uk/publications/monitoring-poverty-2012).Arulampalam,W.(2001),‘Isunemploymentreallyscarring?Effectsofunemploymentexperiencesonwages’,EconomicJournal,vol.111,pp.585–606.Atkinson,A.,Piketty,T.andSaez,E.(2011),‘Topincomesinthelongrunofhistory’,JournalofEconomicLiterature,vol.49,pp.3–71.Attanasio,O.,Battistin,E.andIchimura,H.(2005),‘WhatreallyhappenedtoconsumptioninequalityintheUS?’,inE.BerndtandC.Hulten(eds),MeasurementIssuesinEconomics–ThePathsAhead:EssaysinHonorofZviGriliches,Chicago:UniversityofChicagoPress.Banks,J.,Blundell,R.andTanner,S.(1998),‘Istherearetirement-savingspuzzle?’,AmericanEconomicReview,vol.88,pp.769–88.Bell,D.andBlanchflower,D.(2011),‘YoungpeopleandtheGreatRecession’,InstitutefortheStudyofLabor(IZA),DiscussionPaperno.5674(http://ftp.iza.org/dp5674.pdf).Berthoud,R.,Bryan,M.andBardasi,E.(2004),TheDynamicsofDeprivation:TheRelationshipbetweenIncomeandMaterialDeprivationoverTime,DWPResearchReportno.219,London:DepartmentforWorkandPensions(http://statistics.dwp.gov.uk/asd/asd5/rports2003-2004/rrep219.pdf).Berthoud,R.andZantomio,F.(eds)(2008),MeasuringPoverty:SevenKeyIssues,Colchester:InstituteforSocialandEconomicResearch.Blundell,R.andEtheridge,B.(2010),‘Consumption,incomeandearningsinequalityinBritain’,ReviewofEconomicDynamics,vol.13,pp.76–102.Bozio,A.,Crawford,R.andTetlow,G.(2010),‘ThehistoryofstatepensionsintheUK:1948to2010’,InstituteforFiscalStudies(IFS),BriefingNoteno.105(http://www.ifs.org.uk/bns/bn105.pdf).Bradshaw,J.,Middleton,S.,Davis,A.,Oldfield,N.,Smith,N.,Cusworth,L.andWilliams,J.(2008),AMinimumIncomeStandardforBritain:WhatPeopleThink,York:JosephRowntreeFoundation(http://www.jrf.org.uk/sites/files/jrf/2226-income-poverty-standards.pdf).Brewer,M.,Browne,J.,Hood,A.,Joyce,R.andSibieta,L.(2013),‘Theshort-andmedium-termimpactsoftherecessionontheUKincomedistribution’,FiscalStudies,vol.34,pp.179–201.Brewer,M.,Browne,J.,Joyce,R.andSibieta,L.(2010),‘ChildpovertyintheUKsince1998–99:lessonsfromthepastdecade’,InstituteforFiscalStudies(IFS),WorkingPaperno.10/23(http://www.ifs.org.uk/publications/5303).Brewer,M.,Goodman,A.andLeicester,A.(2006),HouseholdSpendinginBritain:WhatCanItTeachUsaboutPoverty?,Bristol:PolicyPress.Brewer,M.,May,R.andPhillips,D.(2009),Taxes,BenefitsandtheNationalMinimumWage,London:LowPayCommission(http://www.lowpay.gov.uk/lowpay/research/pdf/FromLPC_Document_Feb.pdf).

Living standards, poverty and inequality: 2013
152
Brewer,M.,Muriel,A.,Phillips,D.andSibieta,L.(2008),PovertyandInequalityintheUK:2008,Commentaryno.105,London:InstituteforFiscalStudies(http://www.ifs.org.uk/comms/comm105.pdf).Brewer,M.,Muriel,A.andWren-Lewis,L.(2009),AccountingforChangesinInequalitysince1968:DecompositionAnalysesforGreatBritain,ResearchReportfortheNationalEqualitiesPanel,GovernmentEqualitiesOffice(http://webarchive.nationalarchives.gov.uk/20110608160754/http://www.equalities.gov.uk/pdf/Accounting%20for%20changes%20in%20inequality.pdf).Brewer,M.andO’Dea,C.(2012),‘Measuringlivingstandardswithincomeandconsumption:evidencefromtheUK’,InstituteforFiscalStudies(IFS),WorkingPaperno.12/12(http://www.ifs.org.uk/publications/6276).Brewer,M.,O’Dea,C.,Paull,G.andSibieta,L.(2009),TheLivingStandardsofFamilieswithChildrenReportingLowIncomes,DWPResearchReportno.577,London:DepartmentforWorkandPensions(http://research.dwp.gov.uk/asd/asd5/rports2009-2010/rrep577.pdf).Brewer,M.,Phillips,D.andSibieta,L.(2010),‘Whathashappenedto“severepoverty”underLabour?’,InstituteforFiscalStudies(IFS),2010ElectionBriefingNoteno.3(http://www.ifs.org.uk/bns/bn90.pdf).Brewer,M.,Sibieta,L.andWren-Lewis,L.(2008),‘Racingaway?Incomeinequalityandtheevolutionofhighincomes’,InstituteforFiscalStudies(IFS),BriefingNoteno.76(http://www.ifs.org.uk/publications.php?publication_id=4108).Browne,J.(2011),‘TheimpactoftaxandbenefitchangestobeimplementedinApril2011’,inM.Brewer,C.EmmersonandH.Miller(eds),TheIFSGreenBudget:February2011,Commentaryno.117,London:InstituteforFiscalStudies(http://www.ifs.org.uk/publications/5460).Browne,J.,Cribb,J.,Hood,A.,Johnson,P.,Joyce,R.,O’Dea,C.,Phillips,D.andSibieta,L.(2013),‘ResponseofIFSresearchersto“MeasuringChildPoverty:aconsultationonbettermeasuresofchildpoverty”’(http://www.ifs.org.uk/publications/6607).Browne,J.,Hood,A.andJohnson,P.(2013),‘Optionsforcuttingspendingonsocialsecurity’,inC.Emmerson,P.JohnsonandH.Miller(eds),TheIFSGreenBudget:February2013,Reportno.74,London:InstituteforFiscalStudies(http://www.ifs.org.uk/publications/6562).Browne,J.,Hood,A.andJoyce,R.(2013),ChildandWorking-AgePovertyinNorthernIrelandfrom2010to2020,Reportno.78,London:InstituteforFiscalStudies(http://www.ifs.org.uk/publications/6668).Browne,J.andPhillips,D.(2010),‘TaxandbenefitreformsunderLabour’,InstituteforFiscalStudies(IFS),2010ElectionBriefingNoteno.1(http://www.ifs.org.uk/bns/bn88.pdf).Burgess,S.,Propper,C.,Rees,H.andShearer,A.(2003),‘Theclassof1981:theeffectsofearlycareerunemploymentonsubsequentunemploymentexperiences’,LabourEconomics,vol.10,pp.291–309.Cribb,J.,Joyce,R.andPhillips,D.(2012),LivingStandards,PovertyandInequalityintheUK:2012,Commentaryno.124,London:InstituteforFiscalStudies(http://www.ifs.org.uk/publications/6196).Davis,A.,Hirsch,D.,Smith,N.,Beckhelling,J.andPadley,M.(2012),AMinimumIncomeStandardfortheUKin2012,York:JosephRowntreeFoundation(http://www.jrf.org.uk/publications/MIS-2012).Davison,A.C.andHinkley,D.V.(1997),BootstrapMethodsandTheirApplication,Cambridge:CambridgeUniversityPress.

References
153
DepartmentforWorkandPensions(2012),HouseholdsbelowAverageIncome:AnAnalysisoftheIncomeDistribution1994/95–2010/11,London:DWP.DepartmentforWorkandPensions(2013),HouseholdsbelowAverageIncome:AnAnalysisoftheIncomeDistribution1994/95–2011/12,London:DWP.Dickens,R.(2011),‘ChildpovertyinBritain:pastlessonsandfutureprospects’,NationalInstituteEconomicReview,no.218,pp.R7–19.Diewert,W.E.(2012),‘ConsumerpricestatisticsintheUK’,OfficeforNationalStatistics(availableontheONSwebsite:http://www.ons.gov.uk).Gordon,D.,Adelman,L.,Ashworth,K.,Bradshaw,J.,Levitas,R.,Middleton,S.,Pantazis,C.,Patsios,D.,Payne,S.,Townsend,P.andWilliams,J.(2000),PovertyandSocialExclusioninBritain,York:JosephRowntreeFoundation.Gregory,M.andJukes,R.(2001),‘Unemploymentandsubsequentearnings:estimatingscarringamongBritishmen1984–94’,EconomicJournal,vol.111,pp.607–25.Heckman,J.andBorjas,G.(1980),‘Doesunemploymentcausefutureunemployment?Definitions,questionsandanswersfromacontinuoustimemodelofheterogeneityandstatedependence’,Economica,vol.47,pp.247–83.HMGovernment(2011a),ANewApproachtoChildPoverty:TacklingtheCausesofDisadvantageandTransformingFamilies’Lives,Cm8061,London:TSO(https://www.education.gov.uk/publications/eOrderingDownload/CM-8061.pdf).HMGovernment(2011b),Budget2011,London:TSO(http://webarchive.nationalarchives.gov.uk/+/http://www.hm-treasury.gov.uk/2011budget_documents.htm).Jin,W.,Joyce,R.,PhillipsD.andSibieta,L.(2011),PovertyandInequalityintheUK:2011,Commentaryno.118,London:InstituteforFiscalStudies(http://www.ifs.org.uk/publications/5584).Joyce,R.andSibieta,L.(2013),‘AnassessmentofLabour’srecordonincomeinequalityandpoverty’,OxfordReviewofEconomicPolicy,vol.29,pp.178–202.Kahn,L.(2010),‘Thelong-termlabormarketconsequencesofgraduatingfromcollegeinabadeconomy’,LabourEconomics,vol.17,pp.303–16.Kaplan,G.(2012),‘Movingbackhome:insuranceagainstlabourmarketrisk’,JournalofPoliticalEconomy,vol.120,pp.446–512.Lambert,P.J.andAronson,J.R.(1993),‘InequalitydecompositionanalysisandtheGinicoefficientrevisited’,EconomicJournal,vol.103,pp.1221–7.Levell,P.(2012a),‘Possiblechangestotheretailpricesindex:whattheyareandwhytheymatter’,InstituteforFiscalStudies(IFS),Observation(http://www.ifs.org.uk/publications/6457).Levell,P.(2012b),‘Awinningformula?Elementaryindicesintheretailpricesindex’,InstituteforFiscalStudies,WorkingPaperno.12/22(http://www.ifs.org.uk/publications/6456).Levell,P.andOldfield,Z.(2011),TheSpendingPatternsandInflationExperienceofLow-IncomeHouseholdsoverthePastDecade,Commentaryno.119,London:InstituteforFiscalStudies(http://www.ifs.org.uk/publications/5606).

Living standards, poverty and inequality: 2013
154
Lindley,J.andMachin,S.(2013),‘WageinequalityintheLabouryears’,OxfordReviewofEconomicPolicy,vol.29,pp.165–77.Machin,S.andVanReenen,J.(2007),‘Changesinwageinequality’,CentreforEconomicPerformance,SpecialPaperno.18(http://eprints.lse.ac.uk/4667/1/Changes_in_Wage_Inequality.pdf).McKay,S.(2004),‘Povertyorpreference:whatdo“consensualdeprivationindicators”reallymeasure?’,FiscalStudies,vol.25,pp.201–23.Miller,R.(2011),‘Thelong-rundifferencebetweenRPIandCPIinflation’,OfficeforBudgetResponsibility(OBR),WorkingPaperno.2(http://budgetresponsibility.independent.gov.uk/category/publications/working-papers).OfficeforBudgetResponsibility(2012),EconomicandFiscalOutlook–March2012(http://budgetresponsibility.independent.gov.uk/economic-and-fiscal-outlook-march-2012/).OfficeforBudgetResponsibility(2013),EconomicandFiscalOutlook–March2013(http://budgetresponsibility.independent.gov.uk/economic-and-fiscal-outlook-march-2013/).OfficeforNationalStatistics(2013),‘RPIConsultationfreedomofinformationresponse’(availableontheONSwebsite:http://www.ons.gov.uk).Oreopoulos,P.,vonWachter,T.andHeisz,A.(2012),‘Theshort-andlong-termcareereffectsofgraduatinginarecession’,AmericanEconomicJournal:AppliedEconomics,vol.4,pp.1–29.