little rock school district read 180 evaluation · little rock school district read 180 evaluation...
TRANSCRIPT

Center for Research in Educational Policy The University of Memphis 325 Browning Hall Memphis, Tennessee 38152 Toll Free: 1-866-670-6147
Little Rock School District READ 180 Evaluation FINAL TECHNICAL REPORT

Center for Research in Educational Policy The University of Memphis 325 Browning Hall Memphis, Tennessee 38152 Toll Free: 1-866-670-6147
Little Rock School District READ 180 Evaluation TECHNICAL REPORT November 2006 Clif Mims, Ph. D. Deborah L. Lowther, Ph.D. J. Daniel Strahl, M.S. Center for Research in Educational Policy John Nunnery, Ph.D. Old Dominion University

LRSD READ 180 Final Report Page 1
READ 180 Little Rock School District (LRSD)
Executive Summary
This report summarizes the evaluation study results of the Little Rock School District’s (LRSD) 2005-2006 READ 180 program. The overall purpose of the evaluation was threefold: 1) to assess the effects of READ 180 on improving and remediating the academic achievement of African American students, 2) to examine READ 180 implementation processes and practices, and 3) to document the perceptions of students, teachers, principals, and district and school personnel involved with READ 180 regarding strengths, weaknesses, and needed improvements of the program.
Research Questions Primary Evaluation Question
• Has the READ 180 program been effective in improving and remediating the academic achievement of African American students?
Supplemental (Qualitative/Step 2) Evaluation Questions • What are the quality and level of implementation of READ 180 at the schools
implementing it in 2005-2006? • What is the level of participation in READ 180 by African American students
relative to other ethnic groups at the school? • What are the perceptions of READ 180 teachers regarding program
implementation, impacts, strengths, and weaknesses? • What are the perceptions of other teachers in the school regarding program
implementation, impacts, strengths, and weaknesses? • What are the perceptions of parents/guardians of students participating in READ
180 regarding program impacts, strengths, and weaknesses?
Evaluation Design and Measures
Participants. LRSD identified five middle schools and five high schools to participate in the evaluation. Collectively, the evaluation participants included approximately 1000 READ 180 students and 23 READ 180 teachers.
Design. The evaluation utilized a mixed-method design. Both quantitative and qualitative data were collected from the participating schools by trained external researchers. The researchers observed classrooms, administered surveys for teachers, students and parents, conducted teacher and student focus groups, and interviewed school principals.
Instrumentation. Five measurement strategies were used to collect the
evaluation data: direct classroom observations, surveys, focus groups, interviews, and assessment of student academic achievement. Following are descriptions of the assessment instruments.

LRSD READ 180 Final Report Page 2
• Direct Classroom Observations. Three instruments were used to collect observation data: 1) School Observation Measure – used to record the use or nonuse of 24 target strategies; 2) READ 180 Quality Assessment - used to document READ 180 implementation practices; 3) READ 180 Survey of Computer Use - used to record student use of READ 180 software.
• Surveys. Four surveys were administered to the following groups to collect perceptions of the READ 180 program: 1) READ 180 Teachers; 2) Non-READ 180 Teachers; 3) READ 180 Students; and 4) READ 180 Parents
• Focus Groups. READ 180 teacher and student focus groups were conducted to solicit impressions about READ 180.
• Principal Interview. The interview focused on principal impressions of READ 180 implementation, how it meets the learning needs of African American students, and how READ 180 could be improved.
• Student Achievement. ITBS Total Reading Normal Curve Equivalent (NCE) from 2005 was used as a student matching variable and pretest covariate in all analyses. ITBS Vocabulary, Comprehension, Total Reading, and Revised Writing NCE scores from 2006 were employed as outcome variables, as were 2006 Literacy Scale Scores and Proficiency Levels from the Arkansas Benchmark examinations.
Procedure and Data Sources All data were collected during the spring of 2006 by external researchers. Direct observations were conducted in 17 randomly selected READ 180 classrooms across all 10 schools participating in this evaluation study. These observations each covered a full (90-minute) class period. Seventeen teachers participated in focus groups at seven randomly selected schools, 38 students participated in focus groups at eight randomly selected schools, and all 10 principals were interviewed. Surveys were administered to all READ 180 students, teachers, and parents and yielded the following: students n = 579; teachers n = 18; parents n = 164 and non-Read 180 teachers n = 269.
Results Direct Observation
School Observation Measure. Observation results from 17 READ 180 classrooms, revealed that teachers most frequently used direct instruction, higher level questioning, and acted as a coach, or facilitator. Students were most frequently engaged in reading, writing, or student discussion. Students were observed using computers to complete READ 180 activities in 94.1% of the observations. Overall, the observers reported that the READ 180 classes were always highly focused on learning and that the students were highly engaged all or nearly all of the time (76.5% extensively; 23.5% frequently).
READ 180 Quality Assessment. There was a low occurrence of teachers utilizing
fluency, vocabulary, text comprehension, or writing strategies recommended by READ 180. However, the learning environments were observed to be conducive to cooperative interactions, effective classroom management, and active teacher monitoring, while

LRSD READ 180 Final Report Page 3
slightly less were found to be conducive for READ 180 rotation. Only 62% substantially adhered to the recommended 90-minute cycle.
READ 180 Survey of Computer Use. The observed classes were comprised of
212 African American and 19 non-African American students. Most classrooms had 8-10 up-to-date computers. Students used READ 180 software in 15 of the 17 classes and primarily worked on reading comprehension, vocabulary, and spelling activities. All African American students demonstrated a high level of attention, interest and engagement when using the READ 180 software. The non-African American students, present in slightly over half of the classes, demonstrated slightly lower overall levels of attention, interest and engagement.
Surveys
READ 180 Teacher Questionnaire. Eighteen of the 23 READ 180 teachers (Caucasian = 61.1%; African American = 33.3%) completed the questionnaire. Approximately 80% of the teachers indicated they adhered to the 90-minute READ 180 schedule, while all agreed that they routinely used READ 180 data to customize activities to meet student needs. However, almost half indicated that class by ethnicity reports were only used on a monthly basis. All teachers indicated that their computer skills were adequate and most felt they had received enough training to effectively utilize READ 180 resources. Less than half (44.4%) of the teachers indicated their school had formal guidelines for placing students in READ 180. All but one teacher indicated that the program should be continued.
Non-READ 180 Teacher Questionnaire. The Non-READ 180 survey was distributed to all non-READ 180 teachers at the 10 participating schools. A total of 269 non-READ 180, grades 6-9 teachers (Caucasian = 62.5%; African American = 28.3%) completed the survey. Most agreed that they understood the READ 180 program goals and how the classes are structured. However, 66.9% were not able to identify students who were taking or who had taken READ 180 classes. Of those who were able to identify READ 180 students, about 60% indicated that the students demonstrated improved vocabulary, literacy and comprehension skills while in their classes. There was less agreement that READ 180 students showed more interest in learning, changed their classroom behavior or submitted work that reflected better writing. Only about half felt the program should be continued.
READ 180 Student Questionnaire. A total of 579 READ 180 grade 6 – 9 students completed the Questionnaire (62.8% of 921 total READ 180 students). Of these, most (88.3%) were African American, nearly half were in the 9th grade and 75% were in their first year of READ 180. Nearly three-fourths of the students agreed that their reading skills and slightly more than one-half agreed that their writing skills had improved due to READ 180. Approximately 60% indicated that they learned “a lot” from computers; teacher directed small groups, reading by themselves, and teacher instruction at the beginning of the class. Nearly a third reported they did not learn from reading with other students.

LRSD READ 180 Final Report Page 4
READ 180 Parent Survey. Over three-fourths of 164 parents completing the survey had African American children. Most parents were aware that their children were participating in the READ 180 program, with 44.9% indicating it had helped them “a lot,” or “some” (43.5%). Specifically parents indicated that the program improved their children’s reading grades (68.7%); interest in learning (67.3%). interest in reading (58.5%), and time spent reading (51.0%). Almost all parents indicated that they felt READ 180 was an important part of their children’s education.
Focus Groups
READ 180 Teachers. A total of 17 READ 180 teachers from seven randomly selected schools participated in the focus groups. The teachers reported the following as overall strengths of READ 180: students like and are motivated by the program, it supports progress and success, student reading has increased, repetition provides practice and increases comprehension, and rotation of activities. Suggested improvements included: reduce technical difficulties, increase class time, create more user-friendly reports, and reduce class size. All teachers wanted the READ 180 program to be continued.
READ 180 Students. A total of 38 students from eight randomly selected schools
participated in the focus groups. The students reported the following as overall strengths of READ 180: increased time spent reading and improving reading skills, using the computer (16%), and working in small groups. In contrast, the students reported that the following were areas in need of improvement: increase READ 180 time, reduce computer and CD problems, and improve book collections. All of the students wanted the program to be continued because it improved their reading and spelling skills, increased their desire to read, and was fun. Principal Interviews
The ten principals from the schools participating in this READ 180 program evaluation were interviewed to examine their impressions of the program. The majority of these principals (60%) were administrators of schools that were using READ 180 for the second year. Nearly all of the principals indicated a positive overall impression of the READ 180 program while one reported that the benefits were dependent on the classroom teacher. Three of the principals indicated that their faculty liked READ 180 and two reported that they personally believe it is beneficial. One principal described that the program is wonderful because it restores confidence in the students. Student Achievement
Sixth grade. ITBS 2006 subtests. No statistically significant main effects for program or for school X program interaction were revealed. Benchmark Literacy. No statistically significant main effects for program or program X school interaction were revealed. The percentages of students obtaining proficiency on the Benchmark Literacy exam were nearly equal between Read180 and Control groups.
Seventh grade. ITBS 2006 subtests. A statistically significant main effect for program (p = .03), with no school X program interaction effect was revealed. Follow-up tests showed that READ 180 students performed significantly lower than the Control

LRSD READ 180 Final Report Page 5
groups for Reading Comprehension (p = .001) and Total Reading (p = .006). Benchmark Literacy. No statistically significant main effects for program or program X school interaction were revealed. A lower percentage of Read180 vs. Control students achieved proficiency at Southwest, Henderson, and Cloverdale, whereas a higher percentage achieved proficiency at Mabelvale.
Eighth grade. ITBS 2006 subtests. A statistically significant main effect for program (p = .04), with no school X program interaction effect was revealed. Follow-up tests showed that READ 180 students performed significantly lower than the Control groups for Revised Writing (p = .001). Benchmark Literacy. No statistically significant main effects for program were revealed, but a significant program X school interaction effect (p = .04) was observed. Follow-up tests revealed a statistically significant positive effect at Mabelvale (ES = +0.38) and a statistically significant negative effect at Henderson (ES = -0.29). Nearly equal percentages of Read180 vs. Control students achieved proficiency at Henderson, Cloverdale, and Mabelvale, but lower percentage at Southwest.
Ninth grade. ITBS 2006 subtests. A statistically significant main effect for program (p = .02), with no school X program interaction effect was revealed. Follow-up tests showed that READ 180 students performed significantly lower than Control groups on Vocabulary (p = .01), Reading Comprehension (p = .004) and Total Reading (p = .002).
Student Achievement Summary. ITBS 2006 subtests. The mean effect size estimates for all four ITBS subtests were statistically significantly less than zero, indicating overall negative effects of Read180. Benchmark Literacy. Overall, Read180 students were less likely to obtain proficiency on the Arkansas Benchmark Literacy examination.
Conclusions Primary Evaluation Question
• Has the READ 180 program been effective in improving and remediating the academic achievement of African American students? The preponderance of evidence suggests that the READ 180 program has not
been effective in improving or remediating the academic achievement of African American students. Relative to Control students who were individually matched on the basis of prior achievement, sex, race, special education status, and free or reduced-price lunch status, READ 180 students consistently performed lower on both ITBS Reading subtests and the Benchmark Literacy exam. The only exception to the general pattern of Read180 students performing at equal or lower levels to Comparison students was that eighth grade Read180 students at Mabelvale performed significantly higher than their matched Control counterparts, with an effect size of +0.38. The design employed to assess READ 180 effects, while quite rigorous, cannot rule out the possibility of selection effects because students were not randomly assigned to treatment conditions. A second consideration is that standardized state tests may not be adequately aligned to the READ 180 curriculum and may have limited sensitivity

LRSD READ 180 Final Report Page 6
compared to individually administered reading inventories for assessing program effects.
Supplemental (Qualitative/Step 2) Evaluation Questions
• What are the quality and level of implementation of READ 180 at the schools implementing it in 2005-2006? Overall, the observers reported that the READ 180 classes were always highly
focused on learning and that the students were highly engaged all or nearly all of the time. Although 60% of the teachers reported use of the READ 180 professional modules, teacher infrequent use of targeted literacy strategies indicates that additional teacher professional development focused on implementing these strategies is needed. Also needed is a modified class schedule and increased technical support to ensure students spend the recommended time completing READ 180 computer activities.
• What is the level of participation in READ 180 by African American students relative to other ethnic groups at the school?
The 2005-2006 READ 180 program was implemented in ten LRSD schools with
student populations comprised of approximately 90% African American students. Of the 231 students observed during direct observation of READ 180 classes, all of the 212 African American students were rated as having a “high” level of attention, interest, and engagement, while the ratings of the 19 non-African American students were distributed across “High”, “Moderate,” and “Low”. Approximately 90% of the READ 180 teachers agreed that READ 180 was valuable for improving the achievement of African American students in reading and literacy. In addition, many of the READ 180 students, agreed that the program had increased their reading (70%) and writing (56%) skills. Approximately 75% of the 164 parents who responded to the survey were parents of African American students in READ 180, and nearly all parents felt the program was an important part of their child’s education. School principals were also in agreement that READ 180 met the needs of African American students by providing individualized literacy instruction that was highly motivating and used hands-on, practical approaches to assist students with low reading abilities to achieve greater learning.
• What are the perceptions of READ 180 teachers regarding program implementation, impacts, strengths, and weaknesses?
There was an general consensus among the READ 180 teachers that the
program had a positive impact on students by improving students' literacy skills, overall quality of work, achievement and engagement in learning. Key strengths reported were that the program motivated students to learn and the repetition increased comprehension and reading skills. In contrast, the teachers reported that READ 180 needed to increase technical support for computer problems; increase and/or better distribute time; create more user-friendly reports, decrease class size; and establish formal guidelines for student placement into READ 180. Some teachers reported a

LRSD READ 180 Final Report Page 7
need for more READ 180 professional development (PD), yet concern was raised as to the quality of the READ 180 PD modules. Teachers agreed that READ 180 was supported and liked by school principals, other teachers, parents, and the students and all but one teacher agreed that the READ 180 program should be continued.
• What are the perceptions of other teachers in the school regarding program
implementation, impacts, strengths, and weaknesses? Of the 269 non-READ 180 teachers that completed a survey, most were aware of
READ 180 and understood the program goals and class rotation structure. However, two-thirds indicated that they were not able to identify students who were taking or who had taken READ 180 classes. Therefore, data reflecting non-READ 180 teacher perceptions of the program are limited to 81 teachers. Of these, about 60% indicated that while the READ 180 students were in their classes, the students demonstrated improved written, oral vocabulary, and literacy skills, increased reading comprehension, and were more willing to read in class. While, only about half of the non-READ 180 teachers thought that READ 180 students showed more interest in learning, changed their classroom behavior, or submitted work that reflected better writing while in their classes. Similarly, only half of the non-READ 180 teachers felt the program should be continued.
• What are the perceptions of parents/guardians of students participating in READ 180 regarding program impacts, strengths, and weaknesses? Over 75% of the 164 parents responding to the survey represented African
American students enrolled in READ 180 classes. Nearly all of the parents responded that they were aware of and supportive of their child’s participation in the READ 180 program and believed that the program was an important part of their child or children’s education. Most of the parents thought READ 180 had helped or somewhat helped improve their child’s reading grades; interest in learning and in reading. Slightly fewer parents agreed that the program increased the amount of time that their son or daughter spent reading. Overall, the parents agreed that it is beneficial for their children to participate in the READ 180 program because of its positive impact on their reading and overall learning.
Compliance Remedy Questions
Teacher and Administrator Involvement
The evaluation involved 287 classroom teachers and 10 school principals from 10 schools implementing the READ 180 Program. Eighteen of the 287 teachers taught in the READ 180 program, while 269 were non-READ 180 teachers. Program Modifications Needed
The evaluation revealed that the READ 180 program is valued by students, READ 180 teachers, non-READ 180 teachers, parents, and principals as helping students to improve their reading ability. However, the examination of student achievement scores

LRSD READ 180 Final Report Page 8
did not show learning advantages for student using the READ 180 program. Possible program modifications needed to produce greater achievement gains are described below.
• Adjust class schedules to ensure students spend the recommended amount of time completing READ 180 activities for identified areas of deficiency. The schedule should provide students at least 20 minutes per day per student.
• Better prepare READ 180 teachers to utilize strategies recommended by READ 180 for increasing literacy skills, such as Fluency (Models fluent oral reading; Has students read/re-read orally); Vocabulary (Introduces or reviews key vocabulary words; Explicit vocabulary instruction); Text Comprehension (Explicit comprehension strategy instruction; Makes connection to prior knowledge; Ask students for predictions; Uses higher order questioning; Guides visual imaging; Guides interactive discussion); and Writing (Instructs letter formation, handwriting; Explains the writing process; Conducts language mechanics lesson)
• Better prepare READ 180 teachers to generate and frequently use READ 180 reports of student-level performance as well as class-level performance by ethnicity. Ensure that teachers understand which reports will provide information most critical for adapting lessons to meet the needs of African American and non-African American students. Also, ensure that teachers use the reports to modify READ 180 activities to more specifically address learning deficiencies.
• Implement consistent district and school level procedures for placing students into the READ 180 program to ensure the program enrolls students with the greatest learning deficiencies. Explore options for offering the program to more students.
• Implement a monitoring process to ensure schools implementing READ 180 follow recommended guidelines for achieving improved academic achievement.
Expectations of Program Modifications
READ 180 is an established program that when implemented according to
recommended guidelines has been shown to improve student learning in a setting similar to Little Rock School District (Papalewis, 2004). With program modifications as described above, the Little Rock School District could expect:
• Progressive gains on standardized test scores over time. • A greater adherence to READ 180 guidelines, especially those relating to the
amount of time-on-task for the READ 180 computer program required for optimum benefits.
• More teachers in READ 180 schools who are better able to use student performance data to meet the individual learning needs of African American and non-African American students
• Improved computer resources and support to better enable LRSD to provide students time to learn from READ 180 software and other computer-based programs.
• More READ 180 teachers who are able to effectively implement recommended literacy strategies in their classrooms.
LRSD READ 180 Final Report Page 9
READ 180 Little Rock School District (LRSD)
FINAL REPORT
INTRODUCTION
This report summarizes the evaluation study results of the Little Rock School
District’s (LRSD) 2005-2006 READ 180 program. The overall purpose of the evaluation
was threefold: 1) to assess the effects of READ 180 on improving and remediating the
academic achievement of African American students, 2) to examine READ 180
implementation processes and practices, and 3) to document the perceptions of
students, teachers, principals, and parents involved with READ 180 regarding strengths,
weaknesses, and needed improvements of the program.
READ 180 is a reading intervention program that is aimed at assisting low
performing adolescent readers. The program provides adaptive instructional software,
high-interest literature, and direct instruction in reading, writing, and vocabulary skills.
Each READ 180 class is designed for a 90 minute time block that is divided into three
primary components. The class begins with 20-minutes of Whole Group Direct
Instruction during which the teacher generally lectures and provides instructions for the
remaining activities. Next is the 60-minute Small Group Rotations, in which small
groups of students rotate through each of three 20-minute modules. The three modules
include small group direct instruction from the teacher, modeled and independent
reading and computer time using the READ 180 software. The class concludes with the
final component, known as the Whole Group Wrap-up. During this final 10 minutes the
teacher leads the students in the lesson’s conclusion.

LRSD READ 180 Final Report Page 10
Currently, five middle schools and five high schools in LRSD use this program.
Students are targeted to participate in the program based on results from the Arkansas
Benchmark Exam.
EVALUATION QUESTIONS
This evaluation was structured around one over-arching, primary question
concerning the impact of READ 180 on student achievement, and five supplemental
questions that addressed contextual factors related to implementation of the READ 180
program.
Primary Evaluation Question
1. Has the READ 180 program been effective in improving and remediating the
academic achievement of African American students?
Supplemental (Qualitative/Step 2) Evaluation Questions
1. What are the quality and level of implementation of READ 180 at the schools
implementing it in 2005-2006?
2. What is the level of participation in READ 180 by African American students
relative to other ethnic groups at the school?
3. What are the perceptions of READ 180 teachers regarding program
implementation, impacts, strengths, and weaknesses?
4. What are the perceptions of other teachers in the school regarding program
implementation, impacts, strengths, and weaknesses?
5. What are the perceptions of parents/guardians of students participating in READ
180 regarding program impacts, strengths, and weaknesses?

LRSD READ 180 Final Report Page 11
EVALUATION DESIGN AND MEASURES
The following section describes the participants, the student achievement
sample, design, instrumentation and procedures utilized for this evaluation.
Participants
The Little Rock School District has seven middle schools, five high schools and 1
alternative high school. Of these, five middle and five high schools use the READ 180
program. LRSD identified these five middle schools and five high schools as
participants in the 2005-2006 READ 180 evaluation. The ten schools implementing
READ 180 collectively served grades 6th through 12th. However the READ 180 program
was only implemented in 6th through 9th grades. Collectively these schools had an
enrollment of around 10,000 students and employed approximately 750 classroom
teachers. There were approximately 1,000 total READ 180 students in the program and
23 READ 180 teachers. All READ 180 schools schedule classes in blocks, so they all
scheduled READ 180 classes in approximate 90-minute blocks.
Student Achievement Sample
According to district records, 921 students in ten schools participated in the
READ 180 program. Participation by school ranged from a low of n = 18 at Parkview
Arts & Science Magnet School, to a high of n = 149 at Cloverdale Magnet Middle
School. READ 180 students performed significantly and substantially lower than other
students in the same schools on 2005 ITBS Reading normal curve equivalent (NCE)
scores, with a mean NCE of 30.48 for program participants versus a mean NCE of
48.71 for non-participants (t = 23.32, df = 4918, p < .001). Given that NCE scores have
a standard deviation of 21.06, participants scored 0.87 standard deviation units lower

LRSD READ 180 Final Report Page 12
than all non-participants attending the same schools. District enrollment records with
basic demographic information were available for 910 of the 921 participants, yielding a
match rate of 98.8%. Compared to students attending the same schools, READ 180
participants were more likely to be male (53.6% vs. 47.6%), African American (91.1%
vs. 70.3%), free lunch recipients (69.7% vs. 47.5%), and special education students
(17.5% vs. 9.0%). Participants were about equally as likely as non-participants to have
limited English proficiency (1.6% vs. 1.2%).
Design
The evaluation, which utilized a mixed-method design, was conducted during the
2005-2006 academic year. Both quantitative and qualitative data were collected from
the participating schools by trained external researchers (e.g., university faculty and
staff). The researchers observed classrooms, administered surveys for teachers,
students and parents, conducted teacher and student focus groups, and interviewed
school principals. Table 1 provides a description of the evaluation instruments and a
summary of the participants and data sources, presented with associated research
questions.

LRSD READ 180 Final Report Page 13
Table 1. Summary of Instruments, Participants, and Data Sources by Evaluation Question Evaluation Questions Participants Data Sources Primary Question:
Has the READ 180 program been effective in improving and remediating the academic achievement of African American students?
• All READ 180 students
• ITBS and Benchmark Exam
Supplemental Questions: What are the quality and level of implementation of READ 180 at the schools implementing it in 2005-06?
• All READ 180 teachers • All READ 180 students • All Principals at READ 180
schools
• READ 180 Observations (17
90-minute observations): SOM/READ 180 Quality Assessment/READ 180 SCU
• School level READ 180 reports • READ 180 Teacher
Questionnaire • READ 180 Student
Questionnaire (all READ 180 students)
• READ 180 Teacher Focus Groups
• READ 180 Student Focus Groups (random sample)
• Principal Interviews What is the level of participation in READ 180 by African American students relative to other ethnic groups at the school?
• All READ 180 schools • School level READ 180 reports • READ 180 Observations (17
90-minute observations): SOM/READ 180 Quality Assessment/READ 180 SCU
What are the perceptions of READ 180 teachers regarding program implementation, impacts, strengths, and weaknesses?
• All READ 180 teachers • READ 180 Teacher Questionnaire
• READ 180 Teacher Focus Groups
What are the perceptions of other teachers in the school regarding program implementation, impacts, strengths, and weaknesses?
• All Non-READ 180 Teachers at schools using the program
• Non-READ 180 Teacher Questionnaire (random selection of teachers)
What are the perceptions of parents/guardians of READ 180 students regarding program impacts, strengths, and weaknesses?
• All Parents of READ 180 students
• READ 180 Parent Survey

LRSD READ 180 Final Report Page 14
Instrumentation Five measurement strategies were used to collect the evaluation data:
assessment of student academic achievement, direct classroom observations,
surveys/questionnaires, focus groups, and interviews. Following are descriptions of the
evaluation instruments.
Student Academic Achievement
ITBS Total Reading NCE from 2005 was used as a student matching variable
and pretest covariate in all analyses. ITBS Vocabulary, Comprehension, Total Reading,
and Revised Writing NCE scores from 2006 were employed as outcome variables, as
were 2006 Literacy Scale Scores and Proficiency Levels from the Arkansas Benchmark
examinations.
Observations
Observation data were collected with three measures: READ 180 School
Observation Measure, READ 180 Quality Assessment, and the READ 180 Survey of
Computer Use.
READ 180 School Observation Measure. The School Observation Measure
(SOM) was developed to determine the extent to which different common and
alternative teaching practices are used throughout an entire school (Ross, Smith, &
Alberg, 1999). The target strategies include traditional practices (e.g., direct instruction
and independent seatwork) and alternative, predominately student-centered methods
associated with educational reforms (e.g., cooperative learning, project-based learning,
inquiry, discussion, using technology as a learning tool). The strategies were identified
through surveys and discussions involving policy makers, researchers, administrators,

LRSD READ 180 Final Report Page 15
and teachers, as those most useful in providing indicators of schools’ instructional
philosophies and implementations of commonly used reform designs (Ross, Smith,
Alberg, & Lowther, 2001).
Using the SOM, the observer examined classroom events and activities
descriptively, not judgmentally. Notes were taken relative to the use or nonuse of 24
target strategies. The observer completed a SOM every 10 minutes throughout the
class time. At the conclusion of the 90-minute visit, the observer summarized the
frequency with which each of the strategies was observed across all 9 of the completed
SOMs on a data summary form. The frequency is recorded via a 5-point rubric that
ranges from (0) Not Observed to (4) Extensively.
To ensure the reliability of data, observers receive a manual providing definitions
of terms, examples and explanations of the target strategies, and a description of
procedures for completing the instrument. After receiving the manual and instruction in
a group session, each observer participates in sufficient practice exercises to ensure
that his/her data are comparable with those of experienced observers. In a 2004
reliability study reported by Sterbinsky, Ross & Burke, pairs of trained observers were
within one category for 96% of the whole-school observations and for 91% of the
targeted observations.
READ 180 Quality Assessment. The READ 180 Quality Assessment (QA) was
designed to document the processes and practices used to implement READ 180 in
classrooms during the approximately ninety minute observation period. The instrument
was used to record the meaningfulness of the following instructional components:

LRSD READ 180 Final Report Page 16
fluency, vocabulary, text comprehension, writing and the learning environment. The
data were recorded every 10 minutes for the duration of the observation.
READ 180 Survey of Computer Use. The READ 180 Survey of Computer Use
(SCU) was designed to document the processes and practices used to implement the
READ 180 computer program in classrooms. The instrument was used to record the
number of students in each READ 180 class by ethnicity (African American and Non-
African American) and computer configuration data (e.g., number, type, and working
condition of the computers). Data were also recorded regarding student use of READ
180 software including: subject area of the activities, teacher/student interactions during
READ 180 use, and level of African American and non-African American student
engagement/interest. The data were recorded during two 10 minute time slots of the
Small Group Rotations component of the class. The SCU data was summarized on a
data summary form at the end of the entire observation period.
Surveys
READ 180 Teacher Questionnaire. The READ 180 Teacher Questionnaire is a
three-part instrument used to collect teachers’ perceptions of the READ 180 program.
In the first section, teachers rate their level of agreement with 21 statements regarding
six program-related areas: compliance with READ 180 guidelines, impact on instruction,
impact on students, readiness to teach READ 180, overall support for READ 180 and
technology support. Items are rated with a five-point Likert-type scale that ranges from
(1) Strongly Disagree to (5) Strongly Agree. Two primary questions are asked in the
second section. The first asks teachers to rate the frequency of their use of different
READ 180 reports as daily, weekly or monthly. Next, teachers indicate the number of

LRSD READ 180 Final Report Page 17
minutes they spend on the following READ 180 activities: whole class direct instruction,
small group direct instruction, READ 180 software, modeled/independent work and
whole group wrap-up. The third section asks teachers to comment on the strengths and
weakness of the program. The final question asks teachers about changes they would
recommend for the READ 180 program.
The Non-READ 180 Teacher Questionnaire. The Non-READ 180 Teacher
Questionnaire is a two-part instrument designed to ascertain perceptions of the READ
180 program held by teachers at schools that offer the program but are not involved in
teaching READ 180 classes. In the first section, teachers rate their level of agreement
with 10 statements regarding their own understanding of the program and their
perceptions about READ 180’s influence on their students’ literacy, vocabulary, writing
and behavior. In the second section, teachers are asked to comment on the strengths
and weakness of the program. Teachers are also asked about changes they would
recommend for the READ 180 program. The final question asks teachers if they think
the program should be continued.
The READ 180 Student Questionnaire. The READ 180 Student Questionnaire
is a three-part instrument used to collect students’ perceptions of the READ 180
program. In the first section, students rate their level of agreement with 10 statements
regarding their progress related to reading and writing skills, their interest in learning,
and their value and enjoyment of READ 180. Items are rated with a five-point Likert-
type scale that ranges from (1) Strongly Disagree to (5) Strongly Agree. Two primary
questions are asked in the second section. The first asks students to rate the frequency
that they work on reading, writing and vocabulary activities in their READ 180 class.

LRSD READ 180 Final Report Page 18
Students also rate how much they learn from the following class activities: teacher
instruction at the beginning of class, computer activities, teacher directed small group
work, reading by yourself and reading with another student. In the third section
students are asked to comment on the strengths and weakness of the program. The
final question asks students about changes they would recommend for the READ 180
program.
The READ 180 Parent Survey. The READ 180 Parent Survey was designed to
ascertain parent awareness and perceptions regarding their child’s participation in the
program. They were asked to complete one survey per household, but indicate the
number and ethnicity of their school-aged child/children. If the parent or guardian was
aware of the READ 180 program, they were asked five general questions regarding
student attitudes about READ 180 and the value of the program. The final section of
the survey consisted of three open-ended items to record parents’ perceptions of the
best and worst aspects of their child’s/children’s use of READ 180 and what changes
they recommended.
Focus Groups
Teacher Focus Groups. The Teacher Focus Group Protocol solicited teachers’
impressions about the following components of the READ 180 program: whole-group
direct instruction, computer activities, small-group direct instruction, and independent
reading/reading with another student. Focus group participants were asked what was
the best part of each of these components and how could each be improved. In closing,
the teachers were asked what they believed to be the strongest and weakest aspects of
the overall READ 180 program and whether they advised continuing the program.

LRSD READ 180 Final Report Page 19
Student Focus Groups. The Student Focus Group Protocol solicited students’
impressions about the following components of the READ 180 program: whole-group
direct instruction, computer activities, small-group direct instruction, and independent
reading/reading with another student. Focus group participants were asked what was
the best part of each of these components and how could each be improved. In closing,
the students were asked what they believed to be the strongest and weakest aspects of
the overall READ 180 program and whether they advised continuing the program.
Interviews
Principal Interviews. The principal interview was designed for principals of
schools that were using READ 180. Interviewees were asked how many years the
school been using READ 180. Interview questions examined each principal’s
impressions about the following: how the program is implemented, degree to which the
READ 180 program meets the learning needs of African American students, overall
impressions of the program and how his/her school’s use of READ 180 could be
improved.
PROCEDURE
The ten data collection measures are summarized in Table 2 by type of measure,
instrument, number completed and the data collection procedure.

LRSD READ 180 Final Report Page 20
Table 2. Data Collection Summary
Timeline: 2005-2006 Number of Schools = 10 READ 180 schools selected to participate in the study
Type of Measure Instrument Number Collected Description
SOM 17 • Prearranged 90 minute sessions in which teachers were observed following the READ 180 rotation protocol. Note forms were completed every 10 minutes of the lesson and summarized on a Data Summary Form.
QA 147 • Prearranged 90 minute sessions in which teachers were observed following the READ 180 rotation protocol. Instruments were completed every 10 minutes of the lesson
Observations
SCU 17 • Prearranged 90 minute sessions in which teachers were observed following the READ 180 rotation protocol. Note forms completed every 10 minutes during the 60 minutes of student computer rotation only. The six notes forms from each visit were summarized on a data summary form.
READ 180 Teacher
18 • Teacher surveys distributed to each of the 23 READ 180 teachers. Eighteen completed surveys were returned to the evaluators.
Non-READ 180 Teacher
269 • Non-READ 180 Teacher surveys distributed to all non-READ 180 teachers in the ten participating schools.
READ 180 Student
579 • Distributed to all READ 180 students during class by teacher for completion. Completed surveys were forwarded to the evaluators.
Surveys
READ 180 Parent
164 • Distributed by READ 180 teachers to all students for delivery home. All parents were requested to complete the survey. Completed surveys were returned to the school and forwarded to the evaluators
Focus Groups READ 180 Teacher
7 groups, total number of teachers
= 17
• Researchers conducted teacher focus groups with all READ 180 teachers at 7 randomly selected schools. Each focus group interview lasted approximately 30-45 minutes
READ 180 Student
8 Focus groups with a total number of
students = 38
• Researchers conducted student focus groups at 8 randomly selected schools. The focus groups at each school consisted of 4 to 5 students randomly selected from students with signed parent consent forms. Each focus group interview lasted approximately 30-45 minutes
Interviews Principal 10 • Researchers individually interviewed each principal. Each interview lasted approximately 60 minutes.

LRSD READ 180 Final Report Page 21
REPORT OF THE FINDINGS
The results of the study are presented below by measurement strategy:
observations, surveys, focus groups, interviews, and student achievement. In the
Discussion and Conclusions section, the findings are synthesized across instruments to
address each research question.
Observation Results All the observation results (READ 180 SOM, READ 180 Qualitative Assessment
and READ 180 SCU) reflect data collected during observations conducted in 17
randomly selected READ 180 classrooms across all 10 schools participating in this
evaluation study.
READ 180 School Observation Measure.
In observations of 17 READ 180 classrooms, observers found that the main
instructional orientation was towards direct instruction, or lecture. Nearly two-thirds of
the observations found this kind of teaching to be occurring (41.2% frequently; 23.5%
extensively).
The most common type of instructional strategy being used, among those
considered, was the use of higher level questioning. This was used occasionally in
47.1% of the cases, and frequently in 23.5% of the cases. Another often-used strategy
was for the teacher to act as a coach, or facilitator, which happened occasionally 41.2%
of the time and frequently 11.8% of the time. One strategy that was used by some, and
not by others, was to give higher-level instructional feedback to enhance learning. Over

LRSD READ 180 Final Report Page 22
40% (41.2%) were found to never use this strategy and 29.4% to rarely use it; but
29.5% were found to use it at least occasionally.
The observers also recorded the frequency that students engaged in particular
activities. Of those reported, the most frequent student activity was sustained reading,
which was observed to happen frequently or extensively in 53% of the cases and
occasionally in 41.2% of the cases. Two other popular strategies were to engage the
students in sustained writing (17.7% frequently and 35.3% occasionally) or student
discussion (23.5% frequently and 17.7% occasionally). Rarely was independent
seatwork, such as self-paced worksheets or individual assignments, used (35.3% rarely,
41.2% never).
In areas of technology use, computers were used for instructional delivery of the
READ 180 software in 94.1% of the observations. Nearly 30% (29.4%) were found to
use technology in this way frequently or extensively. while 64.7% used the READ 180
software occasionally. The observers did not observe any of the classes using
technology as a learning tool (e.g., use of word processing, spreadsheets, or conducting
Internet searches).
In areas of assessment, the observers rarely found examples of student self-
assessment (5.9%) and no cases of performance assessment strategies. Overall, the
observers reported that the READ 180 classes were always highly focused on learning
and that the students were highly engaged all or nearly all of the time (76.5%
extensively; 23.5% frequently). The results from these observations are reported in
Table 3.

LRSD READ 180 Final Report Page 23
Table 3. READ 180 School Observation Measure (SOM) Results
N = 17 READ 180 Classrooms Percent Observed The extent to which each of the following was
observed in the classroom. None
(0) Rarely
(1) Occasionally
(2) Frequently
(3) Extensively
(4) Mean SD
Instructional Orientation Direct instruction (lecture) 0.0 17.7 17.7 41.2 23.5 2.7 1.1 Team teaching 82.4 5.9 0.0 5.9 5.9 0.5 1.2 Cooperative/collaborative learning 100.0 0.0 0.0 0.0 0.0 0.0 0.0 Individual tutoring 76.5 17.7 0.0 5.9 0.0 0.4 0.8
Classroom Organization
Ability groups 100.0 0.0 0.0 0.0 0.0 0.0 0.0
Multi-age grouping 100.0 0.0 0.0 0.0 0.0 0.0 0.0
Work centers (for individuals or groups) 5.9 0.0 0.0 23.5 70.6 3.5 1.0
Instructional Strategies
Higher level instructional feedback (written or verbal) to enhance student learning 41.2 29.4 11.8 17.7 0.0 1.1 1.1
Integration of subject areas 94.1 0.0 0.0 0.0 5.9 0.2 1.0
Project-based learning 94.1 0.0 0.0 5.9 0.0 0.2 0.7
Use of higher-level questioning strategies 11.8 17.7 47.1 23.5 0.0 1.8 1.0 Teacher acting as a coach/facilitator 17.7 29.4 41.2 11.8 0.0 1.4 1.0 Parent/community involvement in learning activities 100.0 0.0 0.0 0.0 0.0 0.0 0.0
Student Activities
Independent seatwork (self-paced worksheets, individual assignments) 41.2 35.3 11.8 11.8 0.0 0.9 1.0
Experiential, hands-on learning 94.1 5.9 0.0 0.0 0.0 0.1 0.2 Systematic individual instruction 100.0 0.0 0.0 0.0 0.0 0.0 0.0 Sustained writing/composition (self-selected or teacher-generated topics) 29.4 17.7 35.3 17.7 0.0 1.4 1.1
Sustained reading 5.9 0.0 41.2 41.2 11.8 2.5 1.0 Independent inquiry/research on the part of students 88.2 5.9 0.0 5.9 0.0 0.2 0.8
Student discussion 29.4 29.4 17.7 23.5 0.0 1.4 1.2
Technology Use
Computer for instructional delivery 5.9 0.0 64.7 23.5 5.9 2.2 0.8 Technology as a learning tool or resource 100 0.0 0.0 0.0 0.0 0.0 0.0
Assessment
Performance assessment strategies 100.0 0.0 0.0 0.0 0.0 0.0 0.0 Student self-assessment (portfolios, individual record books) 94.1 5.9 0.0 0.0 0.0 0.1 0.2
Summary Items
High academically focused class time 0.0 0.0 0.0 0.0 100.0 4.0 0.0
High level of student attention, interest, engagement 0.0 0.0 0.0 23.5 76.5 3.8 0.4 Note. Item percentages may not total 100% because of missing data

LRSD READ 180 Final Report Page 24
READ 180 Quality Assessment.
The Quality Assessment instrument was used to record the occurrence of
processes and practices used to implement READ 180. The observations were
recorded every 10 minutes, typically resulting in nine observations in a 90-minute class
period. The observations were made in five different categories: fluency, vocabulary,
text comprehension, writing, and learning environment.
Overall, as seen in Table 4, there was a low occurrence of teachers utilizing
fluency, vocabulary, text comprehension, or writing strategies recommended by READ
180. Specifically, observers reported about 20% frequent or extensive evidence of
student work on reading fluency (18.4% for modeling fluent oral reading; 19.1% for
students reading orally). In vocabulary, observers reported frequent or extensive
evidence of introducing or reviewing key vocabulary words only 13.6% of the time and
explicit vocabulary instruction only 4.8% of the time. In text comprehension, there were
only two strategies that were observed frequently or extensively in approximately 20%
of the observations: higher order questioning (20.4%) and interactive discussion
(18.4%). Techniques for writing were the least observed strategy when compared to
techniques for fluency, vocabulary, or for text comprehension.
On a positive note, the learning environments observed in the READ 180
classrooms were frequently to extensively observed to be conducive to cooperative
interactions (98.6%), have students actively engaged (98.0%), have effective classroom
management (93.2%), and to have teachers actively monitoring (98.6%). Slightly less
classes were found to be set up in a manner conducive for READ 180 rotation (78.2%)
and only 62% substantially adhered to the recommended 90-minute cycle.

LRSD READ 180 Final Report Page 25
Table 4. READ 180 Quality Assessment Results
N = 156
The extent to which each of the following was observed in the classroom.
None ((0)
Rarely or
Occasionally(1,2)
Frequently or
Extensively (3,4) Mean
Standard Deviation
Fluency Models fluent oral reading 80.3 1.4 18.4 0.4 0.8 Has students read/re-read orally 78.2 2.7 19.1 0.4 0.8
Vocabulary
Introduces or reviews key vocabulary words 83.7 2.7 13.6 0.3 0.7 Explicit vocabulary instruction 94.6 0.7 4.8 0.1 0.4
Text Comprehension
Explicit comprehension strategy instruction 89.1 7.5 3.4 0.1 0.4 Makes connection to prior knowledge 86.4 2.0 11.6 0.3 0.7 Ask students for predictions 92.5 4.1 3.4 0.1 0.4 Uses higher order questioning 72.8 6.8 20.4 0.5 0.8 Guides visual imaging 91.8 1.4 6.8 0.2 0.5 Guides interactive discussion 81.6 0.0 18.4 0.4 0.8
Writing
Instructs letter formation, handwriting 100.0 0.0 0.0 0.0 0.0
Explains the writing process 90.5 3.4 6.1 0.2 0.5 Conducts language mechanics lesson 91.8 4.1 4.1 0.1 0.4
Learning Environment
Conducive to cooperative interactions 0.7 0.7 98.6 2.0 0.2 Students are actively engaged 0.0 2.0 98.0 2.0 0.1 Effective classroom management 0.0 6.8 93.2 1.9 0.3 Teacher actively monitors 0.0 1.4 98.6 2.0 0.1 The room is set up conducive to the READ 180 rotation 0.0 21.8 78.2 1.8 0.4 The teacher substantially adheres to the 90 min. cycle 6.8 31.3 62.0 1.6 0.6 READ 180 supporting material are available for student use 0.0 100.0 0.0 2.0 0.0
READ 180 Survey of Computer Use.
A total of 17 6th-9th grade READ 180 classes were observed. These classes
were comprised of 212 African American students and 19 non-African American
students. The majority (88.2%) of these classrooms had 8-10 computers and all the
computers in the classes observed were up-to-date. Students were observed using the
READ 180 software in 15 (88.2%) of the 17 classes. The students were observed

LRSD READ 180 Final Report Page 26
rarely asking questions related to the use of READ 180 software or the computer
equipment (Table 5).
There was a high level of academic focus during the Small Group Rotations
component of the READ 180 classes, when the students were working on the computer
modules. The students were observed predominately spending computer time working
on READ 180 reading comprehension (82.4% of time), vocabulary (76.5%) and spelling
(70.6%) activities. They were not observed asking any content related questions while
using the software.
All African American students demonstrated a high overall level of attention,
interest and engagement when observed using the READ 180 computer program. The
Non-African American students, present in slightly over half (52.9%) of the classes,
demonstrated lower overall levels of attention, interest and engagement.
While data were colleted about the types of instruction teachers provided specific
to students’ use of READ 180 computer program, analysis indicates that in over half
(52.9%) of the classes, students received no instructions from the teacher. When
instruction was provided, the most frequently observed type was related to using the
computer, which was observed rarely to occasionally in nearly 30 percent of the classes
(29.4%). Other types of instruction seen were related to classroom rules (17.7%),
READ 180 software (11.8%), and only 5.9% related to the READ 180 subject-area
content.

LRSD READ 180 Final Report Page 27
Table 5. READ 180 Survey of Computer Use Results
N = 17 READ 180 Classrooms
Number of students by ethnicity
School Grade Observed
African American Non-African American Number of classes observed
Cloverdale Middle 6 14 0 1 Cloverdale Middle 7 14 0 1
Central High 9 11 1 1 Central High 9 12 1 1
Hall High 9 15 3 1 Hall High 9 19 2 1
Henderson Middle 7 5 1 1 Henderson Middle 8 13 0 1
J.A. Fair High 9 13 2 1 Mabelvale Middle 8 13 1 1 McClellan High 9 13 0 1 McClellan High 9 13 0 1 Parkview High 9 12 3 1 Pulaski Middle 6 14 0 1 Pulaski Middle 6 14 0 1
Southwest Middle 6 10 2 1 Southwest Middle 8 7 3 1
TOTAL NA 212 19 17
Computer Configuration and Use
How many computers were available for READ 180? % Observed
Most computers used for READ 180 were: % Observed
Only one 0.0 Up to date 100.0 2-4 0.0 Aging but adequate 0.0 5-7 11.8 Outdated/Limited Capacity 0.0
8-10 88.2 11 or more 0.0
Never Rarely Occasionally Frequently Extensively How frequently did malfunctions occur on computers used for READ 180?
76.5 11.8 5.9 0.0 0.0
No Headphones Headphones with no microphones
Headphones and
Microphones Computers used for READ 180 most frequently had: 5.9 5.9 88.2
Mostly Non-functional
Displayed signs of disrepair
All in good working order
Headphones and Microphones used for READ 180 were:
11.8 0.0 82.4
READ 180 Computer Activities In which subject areas did students complete READ 180 computer work? % of time
Reading comprehension 82.4 Vocabulary 76.5
Spelling 70.6

LRSD READ 180 Final Report Page 28
Table 5. Continued
Items Not Applicable Low Moderate High
What was the level of academically focused time while students were using the computer for READ 180? 17.6* 0.0 5.9 76.5
What was the overall level of African American student attention, interest, and engagement while using the READ 180 computer program?
11.8* 0.0 0.0 88.2
What was the overall level of NON African American students attention, interest, and engagement while using the READ 180 computer program?
52.9** 11.8 5.9 29.4
• *Students did not use computers; • **Class did not have any NON-African American students
Types of Questions Students Asked While Using the computer READ 180
% Not Observed
% Rarely
% Occasionally
% Frequently
% Extensively
Content area (e.g. how to solve a problem, the meaning of a word). 100.0 0.0 0.0 0.0 0.0
Software use (e.g. how to log in; how to move to the next section; how to take a test)
88.2 11.8 0.0 0.0 0.0
Computer use (e.g. how to get the mouse or keyboard to work properly)
70.6 29.4 0.0 0.0 0.0
Non-READ 180 questions (e.g. Do I have to sit next to John? Can I go to the restroom?)
94.1 5.9 0.0 0.0 0.0
The teacher provided the following types of instruction specifically for student use of READ 180 computer activities:
% Not Observed
% Rarely
% Occasionally
% Frequently
% Extensively
Content area (e.g. reading, vocabulary) 94.1 0.0 5.9 0.0 0.0
Software use (e.g. how to log in; find correct lesson) 88.2 11.8 0.0 0.0 0.0
Computer use (e.g. locate software, use mouse) 70.6 23.5 5.9 0.0 0.0
Classroom behavior rules 82.4 11.8 5.9 0.0 0.0 No instructions were given 52.9 11.8 0.0 0.0 35.3
READ 180 Time-on-Task.
As seen in Table 6, the READ 180 teachers whose classes were observed spent
close to the recommended amount of time for each of the five READ 180 activities.
However, when examining a district provided sample of READ 180 computer program

LRSD READ 180 Final Report Page 29
time-on-task reports from six of the 10 schools, the results revealed that an average
READ 180 computer session lasted from 9.3 to 13.6 minutes per student (Table 7).
Students completed an average of 0.2 to 2.0 sessions per week for up to 31 weeks.
Thus, the mean overall time that students spent working on READ 180 computer
activities during the 2005-2006 academic year ranged from 2.2 hours to 16.1 hours, with
the average being 10.2 hours per student.
READ 180 as the name implies, recommends that students spend 20 minutes
per day throughout the academic year. When computing this number with the required
180 days of school attendance, the total time equals 60 hours. The LRSD READ 180
students worked less than 20% of the recommended time completing the instructional
activities presented by READ 180 software.
Table 6. Observed vs. Recommended time per READ 180 Activity
Whole Class Instruction Computer
Small Group
Independent Reading
Whole Group Wrap
Total Time
Average Time Observed* 19.4 19.4 19.4 18.2 8.2 84.7
READ 180 Recommended Time 20 20 20 20 10 90
*N = 17 observations at 10 READ 180 schools
Table 7. READ 180 Computer Program Report of Student Time-on-Task
N = 6 of the 10 READ 180 schools participating in the study
Schools Weeks of Time
Mean Sessions Per Week
Mean Session Time
Mean Total Sessions
Mean Total Time (Min)
Mean Total Time (Hrs)
Hall HS 31.0 2.0 12.3 78.7 968 16.1 McClellan HS 24.6 1.6 10.1 71.9 728 12.1 Parkview HS 30.3 1.4 12.5 57.2 717 12.0
Pulaski Heights MS 21.9 1.4 12.6 54.4 688 11.5 Fair HS 28.0 1.2 9.3 46.9 437 7.3
Southwest Alt. Center 20.3 0.2 13.6 9.7 132 2.2 Average 26.0 1.3 11.8 53.1 612 10.2

LRSD READ 180 Final Report Page 30
Survey Results
READ 180 Teacher Questionnaire.
The READ 180 Teacher Questionnaire was completed by 18 of the 23 READ
180 teachers, representing a 78.2% return rate. The respondents were primarily
Caucasian (61.1%), and secondarily African American (33.3%), with most being female
(94.4%). Nearly two-fifths (38.9%) of the respondents were first year READ 180
teachers while 22.2% were teaching their second year with the program and 38.9%
were in their third. The respondents represented all READ 180 grade levels, with sixth
and ninth grade teachers (33.3% each) more heavily represented than seventh and
eight grade teachers (22.2% each).
As shown in Table 8, the first 21 items assessing teachers’ perceptions of the
READ 180 program were indicative of a relatively high level of teacher approval for the
program (as measured by a combination of the categories “Strongly Agree” and
“Agree”. Almost 90% (88.9%) of respondents strongly agreed or agreed that the
program had a positive impact on students, improving their overall quality of work,
achievement and engagement in learning. All teachers were in agreement that they
routinely customized READ 180 activities to meet the instructional needs of students,
while over four fifths (83.3%) reported that they modified READ 180 on the basis of
report feedback. Only whole class and individual reports were used on a daily basis,
but the majority of teachers indicated they used these reports at least weekly. Almost
half (44.4%) of respondents indicated they used the class by ethnicity and class by
gender reports on a monthly basis and never on a daily basis.

LRSD READ 180 Final Report Page 31
Over four-fifths (83.3%) of teachers indicated that they adhered to the full 90
minute implementation schedule. This time was fairly evenly split among the required
learning activities. Most teachers (94.4%) used 20 minutes for small group discussion
and 20 minutes for READ 180 software. Additionally, 83.4% of teachers spent between
15-20 minutes on whole class or group discussion. Whole group wrap up was the
activity teachers reported spending the least amount of time on, although 27.8% of
teachers did report spending 15-20 minutes on wrap up.
All teachers indicated that their computer skills were adequate to effectively
utilize READ 180 resources. While nearly four-fifths of teachers felt they had received
enough training, 16.7% indicated that they could use more training in order to address
students’ learning needs.
Interestingly only 61.1% used the READ 180 professional modules to enhance
their own effectiveness as READ 180 teachers. This may be related to the 66.7%
agreement that the READ 180 resources enabled teachers to effectively implement the
program according to recommended guidelines. In addition less than half the
respondents strongly agreed that their school has a well-developed plan to guide the
READ 180 program. Nearly two-fifths (38.9%) of respondents were neutral as to the
school’s well-developed plans and 16.7% disagreed that there were well-developed
plans at all. In addition, less than half (44.4%) of the respondents indicated their school
had formal guidelines in place for determining which students should participate in the
READ 180 program. The same percentage (44.4%) actually disagreed or strongly
disagreed that their school used the Scholastic Reading Inventory to place READ 180
students. In fact, two thirds (66.6%) reported that the school’s administration did not

LRSD READ 180 Final Report Page 32
routinely use READ 180 reports to monitor and adjust implementation practices.
However, these shortcomings in formal guidelines do not indicate lack of support. In
fact, 83.3% of respondents agreed or strongly agreed that the school administration fully
supports READ 180, with no disagreements. Similarly, two-thirds (66.7%) reported that
their colleagues were generally supportive of the READ 180 program, with almost the
same number (61.1%) reporting support from parents. All but one teacher indicated
that the program should be continued.
When asked to describe READ 180 program strengths, teachers listed
individualized and small group instruction, the teaching materials, and that the program
was motivating, assisted students in achieving rapid progress, and that they received
positive feedback about the program (Appendix B). The primary weaknesses noted
were technology problems, not enough time, limited selection of books, inflexible
structure, and lack of organization in the READ 180 materials. The teachers offered the
following recommendations for improving the program: better student screening,
correct technical problems, train new teachers, include higher-level questions on the
handouts, and provide materials that are more engaging and books that are more
interesting for the students.

LRSD READ 180 Final Report Page 33
Table 8. READ 180 Teacher Questionnaire Results
N = 18
READ 180 Teacher Questionnaire Items
% Strongly Agree and Agree
(4,5)
% Neutral
(3)
% Strongly Disagree and
Disagree (1,2) Mean
Standard Deviation
Impact on Students The use of the READ 180 has increased the level of student attention, interest and engagement in learning.
88.9 11.1 0.0 4.2 0.6
READ 180 has had a positive impact on student learning and achievement. 88.9 5.6 5.6 4.3 0.8
Overall, the READ 180 program seems valuable for improving the achievement of African American students in reading and literacy.
88.9 5.6 5.6 4.2 1.0
The use of READ 180 has improved the quality of student work. 88.9 0.0 5.6 4.2 0.8
Impact on Instruction I frequently use the READ 180 professional development modules to enhance my effectiveness as a READ 180 teacher.
61.1 22.2 16.7 3.7 1.2
I routinely customize READ 180 activities to meet the instructional needs of students. 100.0 0.0 0.0 4.6 0.5
I routinely modify my READ 180 instructional practices based on READ 180 report feedback. 83.3 11.1 5.6 4.1 0.8
The design of the READ 180 resources enables me to effectively implement the READ 180 program according to recommended guidelines.
66.7 16.7 16.7 3.8 1.4
Compliance with READ 180 Guidelines I adhere to the READ 180 recommended 90 minute implementation schedule. 83.3 5.6 5.6 4.2 0.8
My school has formal guidelines for placing students in the READ 180 program. 44.4 22.2 33.3 3.1 1.2
My school has formal guidelines for determining when a student no longer needs the READ 180 program. 22.2 27.8 50.0 2.6 1.3
My school uses the Scholastic Reading Inventory (SRI) to place students in the READ 180 program. 38.9 16.7 44.4 2.9 1.3
Readiness to Teach READ 180 I have received enough training to address student learning needs through the use of READ 180 resources.
77.8 5.6 16.7 3.9 1.1
My computer skills are adequate to effectively utilize READ 180 resources. 100.0 0.0 0.0 4.7 0.5

LRSD READ 180 Final Report Page 34
Table 8. Continued
READ 180 Teacher Questionnaire Items
% Strongly Agree and Agree
(4,5)
% Neutral
(3)
% Strongly Disagree and
Disagree (1,2) Mean
Standard Deviation
Technology Support I can readily obtain answers to questions about READ 180. 83.3 16.7 0.0 4.2 0.7
Most of our school computers that are used for READ 180 are kept in good working condition. 83.3 16.7 0.0 4.1 0.7
Overall Support for READ 180 My school's administration fully supports the READ 180 program. 83.3 11.1 0.0 4.4 0.7
Our school has a well developed plan that guides the READ 180 program. 44.4 38.9 16.7 3.5 1.0
My school's administration routinely uses the READ 180 reports to monitor and adjust program implementation practices.
27.8 33.3 33.3 2.9 1.2
Teachers in this school are generally supportive of the READ 180 program. 66.7 33.3 0.0 3.9 0.8
Parents and community members support our school's use of READ 180. 61.1 38.9 0.0 3.8 0.7
Indicate the minutes that you use the following READ 180 activities. % 10 min. % 15 min. % 20 min. % 25 min. % 30 min. Whole class direct instruction 11.1 27.8 55.6 0.0 5.6 Small group direct instruction 0.0 0.0 94.4 0.0 0.0 READ 180 software 0.0 0.0 94.4 0.0 0.0 Modeled, Independent reading 5.6 0.0 88.9 0.0 5.6 Whole group wrap-up 66.7 16.7 11.1 0.0 0.0 Teachers who feel the READ 180 program should be continued. %
Yes 88.9 No 5.6
Respondents teaching at each grade level % Ethnicity % Gender % 6th Grade 33.3 Caucasian 61.1 Male 0.0 7th Grade 22.2 African American 33.3 8th Grade 22.2 Hispanic 0.0
Asian 0.0 9th Grade 33.3 Multi-Ethnic 0.0
Female 94.4
How long have you taught a READ 180 class?
1 year 38.9% 2 years 22.2% 3 years 38.9%
How routinely do you use the following READ 180 performance report formats? % Daily % Weekly % Monthly Whole class 16.7 61.1 22.2 Class by ethnicity 0.0 11.1 44.4 Class by gender 0.0 5.6 44.4 Individual student 11.1 72.2 16.7

LRSD READ 180 Final Report Page 35
Non-READ 180 Teacher Questionnaire.
The Non-READ 180 Teacher Questionnaire is a two-part instrument designed to
ascertain perceptions of the READ 180 program held by teachers at schools that offer
the program but are not involved in teaching READ 180 classes. The Non-READ 180
surveys were distributed to the principals at the 10 participating schools for distribution
to all non-READ 180 teachers. As seen in Table 9, of the 269 respondents, 62.5% were
Caucasian, 28.3% were African American, with less than 3% representing other races.
Most respondents (44.4%) were 9th grade teachers, with the remaining grades being
represented fairly evenly at around 20%. Nearly three-fourths (73.6%) were female.
Reports from colleagues of READ 180 teachers revealed that most (86.4%)
agreed or strongly agreed that they understood the READ 180 program goals, and
nearly as many (79%) indicated they understood how READ 180 classes are structured.
However, two-thirds (66.9%) of the teachers indicated that they were not able to identify
students who were taking or who had taken READ 180 classes.
The non-READ 180 teachers (30.1%) who were able to identify READ 180
students were generally positive with regard to the impact of READ 180 on students.
Specifically, 63.0% indicated that while READ 180 students were in their classes, the
students demonstrated improved written and oral vocabulary skills, continuous
improvement in literacy skills (61.7%), increased comprehension of assigned reading
(60.5%), and were more willing to read in class (59.3%). However, there was less
agreement among the non-READ 180 teachers that READ 180 students showed more
interest in learning (55.6%), changed their classroom behavior (51.9%) or submitted
work that reflected better writing (50.6%) during the time that the students were in the

LRSD READ 180 Final Report Page 36
their classrooms. Only about half (49.8%) of these non-READ 180 teachers felt the
program should be continued.
Responses of teachers who could identify the READ 180 students responded to
open-ended comments are located in Appendix C. When asked to describe strengths
of READ 180, the most common responses were that the program improved student
reading skills, grades, and tests. Also mentioned was the individualized approach to
instruction and use of a variety of instructional delivery methods. The most frequent
response to program weakness and areas of needed improvement was that access to
the program was limited – that it is not reaching all the students with low reading ability.
The teachers also indicated that there were not enough books or computers to
adequately support implementation of READ 180. There were 99 of the 269 non-READ
180 teachers who supported continuation of the program because it improved student
reading skills and performance and provided “good” teacher and student feedback.

LRSD READ 180 Final Report Page 37
Table 9. Non-READ 180 Teacher Questionnaire Results
N = 269
Non-READ 180 Teacher Questionnaire Items
% Strongly
Agree and Agree (4,5)
% Neutral
(3)
% Strongly Disagree
and Disagree
(1,2) Mean Standard Deviation
I have an understanding of the READ 180 program goals. 86.4 7.4 4.9 4.2 0.8
I have an understanding of the READ 180 program classroom implementation (how the classes are structured).
79.0 12.3 7.4 4.0 0.9
The students in my class who are taking or have taken READ 180 classes demonstrate improved written and oral vocabulary skills.
63.0 30.9 3.7 3.8 0.9
The students in my class who are taking or have taken READ 180 classes demonstrate continuous improvement in literacy skills.
61.7 30.9 4.9 3.8 0.9
The students in my class who are taking or have taken READ 180 classes show increased comprehension of assigned reading.
60.5 34.6 2.5 3.8 0.8
The students in my class who are taking or have taken READ 180 classes show more willingness to read aloud in class.
59.3 30.9 6.2 3.7 0.9
The students in my class who are taking or have taken READ 180 classes show increased attention and interest in learning.
55.6 35.8 6.2 3.7 0.9
The students in my class who are taking or have taken READ 180 classes have improved classroom behavior.
51.9 37.0 8.6 3.6 0.9
The students in my class who are taking or have taken READ 180 classes submit work that reflects improved writing.
50.6 40.7 3.7 3.7 0.9
Teachers able to identify students who are taking or have taken READ 180 classes. %
Teachers who feel the READ 180 program should be continued. %
Yes 30.1 Yes 49.8 No 66.9 No 0.7
Respondents teaching at each grade level % Ethnicity % Gender % 6th Grade 19.3 Caucasian 62.5 Male 24.5
7th Grade 18.6 African American 28.3
8th Grade 16.4 Hispanic 0.7 Asian 0.4 9th Grade 44.6 Multi-Ethnic 1.9
Female 73.6
Note: Item percentages may not total 100% because of missing input from some respondents.

LRSD READ 180 Final Report Page 38
READ 180 Student Questionnaire.
There was a total of 579 students involved in READ 180 classes that completed
the READ 180 Student Questionnaire (Table 10). This number represents 62.8% of the
total 921 READ 180 students. Of these, most (88.3%) were African American and
nearly half (45.9%) were in the 9th grade, all other grades being represented fairly
equally. This sample is representative of the whole population as 45.2% of READ 180
participants were in the 9th grade and all other grades are also represented fairly
equally. Additionally, nearly half of the respondents were female (44.6%) and slightly
over half (52.5%) were male. Three-fourths of the students were in their first year of
READ 180, while most of the remaining students (23.7%) were in their second year of
the program. READ 180 was implemented in 6th through 9th grades.
While the overall means of responses on this 5-point Likert-type survey were
generally lower than scores reported by teachers, overall student response to the READ
180 program tended to be positive. Nearly three-fourths (74.1%) of the students agreed
that their reading skills and slightly more than one-half (55.4%) agreed that their writing
skills had improved due to the READ 180 program. Additionally, 48.4% of the students
also felt as if their overall schoolwork had improved due to READ 180.
Student attitudes were generally more positive than perceptions of increased
ability. Approximately 70% (69.6%) of students agreed that their READ 180 classes
were well-organized, while 58.9% looked forward to their READ 180 classes and 57.7%
agreed that they were more interested in learning in general due to READ 180.
Interestingly this is slightly higher than the same perception of increased interest by
non-READ 180 teachers. Only about half (52.0%) of the students agreed that READ

LRSD READ 180 Final Report Page 39
180 was the best reading class that they had ever taken or that they learned more than
in their other classes (47.2%). Even less, or nearly a third of students (31.8%) reported
not wanting to repeat the program.
READ 180 activities were broken down into reading, writing and vocabulary and
students were asked to indicate how much they engaged in each of these (not at all, a
little, or a lot) during their 90-minute READ 180 classes. Nearly 70% of the students
indicated that they worked on reading (69.8%) and writing (69.6%) “a lot”, while one
fourth (25.6%) reported that they only worked on these areas “a little” (reading = 25.6%;
writing = 24.4%). The READ 180 students reported working on vocabulary to a lesser
degree, as “a lot” was reported by 57.0% and “a little” by 32.5%.
Students were asked to respond to closed- and open-ended items to indicate
how much they learned from READ 180 activities (see Appendix D). The closed-ended
items revealed that over 60% (63.7%) learned “a lot” from computers. Nearly as many
indicated that they learned “a lot’ from teacher directed small groups (59.4%), reading
by themselves (58.7%), and teacher instruction at the beginning of the class (57.7%).
Nearly a third (30.6%) reported they did not learn from reading with another student.
The open-ended responses revealed spelling, pronunciation, reading and Reading Zone
as most frequently cited activities that helped students to learn the most. Whereas,
Reading was also cited along with Vocabulary Zones as activities that do not help
students learn. When asked what would make the READ 180 better, most students
wanted the program to last longer, more activities, videos, and centers, and more time
on the computer.

LRSD READ 180 Final Report Page 40
Table 10. READ 180 Student Questionnaire Results
N = 579
READ 180 Student Questionnaire Items
% Strongly Agree and
Agree (4,5)
% Neutral
(3)
% Strongly Disagree and
Disagree (1,2) Mean St Dev
My reading skills have improved because of READ 180. 74.1 16.4 9.2 3.9 1.0 My READ 180 class is well organized. 69.6 16.4 13.1 3.9 1.2 READ 180 has made me want to get better grades. 62.5 23.0 13.5 3.8 1.1 I look forward to my READ 180 class. 58.9 23.8 16.8 3.6 1.2 READ 180 has made me more interested in learning. 57.7 25.2 16.2 3.6 1.1 My writing has improved because of READ 180. 55.4 20.4 23.5 3.5 1.3 READ 180 is the best reading class I have ever taken. 52.0 24.4 23.0 3.5 1.3 I would like to be in the READ 180 class again next year. 50.4 16.9 31.8 3.3 1.5 My schoolwork is better because of what I have learned in READ 180. 48.4 28.5 22.1 3.4 1.2 I learn more in the READ 180 class than in my other classes. 47.2 24.2 27.8 3.3 1.3 In your READ 180 class, how often do you work on the following activities:
% A lot (3)
% A little (2)
% Not at all (1) Mean St Dev
Reading? 69.8 25.6 2.8 1.7 0.5 Writing? 69.6 24.4 3.5 1.7 0.5 Vocabulary? 57.0 32.5 7.1 1.5 0.6 In your READ 180 class, how much do you learn from the following activities:
% A lot (3)
% A little (2)
% Not at all (1)
Computer activities? 63.7 24.7 9.0 1.6 0.7 Teacher directed small group work? 59.4 30.2 6.9 1.5 0.6 Reading by yourself? 58.7 31.1 6.2 1.6 0.6 Teacher instruction at the beginning of class? 57.7 32.1 7.3 1.5 0.6 Reading with another student? 28.3 36.8 30.6 1.0 0.8 Respondents at each grade level % Ethnicity % Gender % 6th Grade 20.0 Caucasian 2.9 Male 52.5 7th Grade 19.5 African American 88.3 8th Grade 14.5 Hispanic 2.8
Asian 0.2 9th Grade 45.9 Multi-Ethnic 4.3
Female 44.6
How long have you been in a READ 180 class?
1 year 74.3 2 years 23.7 3 years 0.7
READ 180 Parent Survey.
The READ 180 Parent Survey was completed by 164 parents (Table 11). Over
three-fourths of these parents had African American children (75.6%), while 7.3% had
Caucasian children, and the remainder represented Hispanic, Asian, or multi-ethnic
backgrounds. Nearly 40% of the children (39.6%) whose parents completed this survey

LRSD READ 180 Final Report Page 41
were in ninth grade while 26.8% were in sixth grade, 20.7% were in eighth grade, and
11% were in seventh grade.
The vast majority of the parents (89.6%) were aware that their children were
participating in the READ 180 program, with over half (53.7%) having learned this from
their children. Other parents learned about the READ 180 program from teachers
(28.6%) or from the schools (16.3%). Nearly all of the parents felt that the READ 180
program had improved their son’s/daughter’s reading skills, with 44.9% indicating it had
helped them “a lot,” and 43.5% indicating it has helped them “some.” None of the
parents felt the program had not helped their children at all, but 8.8% were still not sure.
To understand how these parents felt the READ 180 program helped their
children, the parents were asked to what level they agreed with statements regarding
the program’s impact on their children’s reading ability. The most positive response was
that the program improved their children’s achievement or reading grades (68.7%
indicated yes; 23.1% indicated somewhat). Parents also felt that the READ 180
program improved their children’s interest in learning (67.3% indicated yes; 25.2%
indicated somewhat) and their interest in reading (58.5% indicated yes; 26.5 indicated
somewhat). Fifty-one percent of parents agreed that the program improved the time
their children spent reading, while 34.7% somewhat felt that it did.
Similar results are seen in the parent’s responses to the open-ended item asking
them to describe the best thing about their son/daughter being in a READ 180 class
(Appendix E). The most frequent comments were that the program improved their
child’s reading skills and interest in reading. The parents indicated that the “worst”
aspects of the program were that it did not encourage students to read at home,

LRSD READ 180 Final Report Page 42
computer time was too limited, the activities were too challenging, there were too many
computer problems, and it did not seem that students were learning anything new and
did not have READ 180 homework.
To summarize their support for the program, 89.1% of parents indicated that they
felt READ 180 was an important part of their children’s education while 4.8% somewhat
felt this way and less than one percent (0.7%) did not.
Table 11. READ 180 Parent Survey Results
N = 164
Do you think READ 180 has increased your son’s/daughter’s: Yes Somewhat No Not sure Mean
Std. Dev.
Interest in reading. 58.5 26.5 6.1 6.1 1.6 0.9 Interest in learning 67.3 25.2 1.4 2.7 1.4 0.7 Achievement or grades in reading. 68.7 23.1 2.0 2.7 1.4 0.7 Time spent reading. 51.7 34.7 8.8 2.7 1.6 0.8
Do you think READ 180 is an Important part of your son/daughter’s education? Yes Somewhat No Not sure Mean
Std. Dev.
89.1 4.8 0.7 3.4 1.2 0.6
To what degree has the READ 180 improved your son’s/daughter’s reading skills? A lot Some Not at all Not Sure
44.9 43.5 0.0 8.8 Parents who are aware of the READ 180 program son/daughter is taking.
% How did you learn about the reading (READ 180)
class? % Yes 89.6 School 16.3 No 10.4 Teacher 28.6 My kids 53.7 Other parents/friends 0.0 Grade level(s) of your son/daughter. % Ethnicity % 6th Grade 26.8 Caucasian 7.3 7th Grade 11.0 African American 75.6 8th Grade 20.7 Hispanic 2.4
Asian 0.6 9th Grade 39.6 Multi-Ethnic 3.7

LRSD READ 180 Final Report Page 43
Focus Group Results
Teacher Focus Groups.
A total of 17 READ 180 teachers from seven randomly selected schools
participated in the focus groups. The teachers were asked to respond to questions
related to implementing the READ 180 curriculum. Full results of the Teacher Focus
Group are in Appendix F.
Whole group direct instruction. The teachers reported that the best part about
the teacher whole-group instruction at the beginning of class was that it provided an
opportunity too explain the lesson, address the students all at once, and set the focus
and tone for the day (82% of responses). When asked to describe strategies for
improving this component of the READ 180 classroom, approximately one-fourth (24%)
did not feel any changes were needed, while the same percent of teachers responded
the time format should be revised (24%), that smaller classes would be beneficial
(24%).
Computer module. When describing the strengths of the READ 180 computer
activities the teachers explained that it provides new subject matter in a format
(computer, video, etc.) that keeps students interested (48%) while also addressing
students’ individual needs and abilities (24%). The teachers also reported that the
computer activities provide repetition and fluency practice (16%) and gave students and
teachers immediate feedback (8%). The teachers suggested that overcoming technical
issues should be the primary means of improving this READ 180 module. The teachers
reported technical failures sometimes resulting in the loss of students’ work (43%) and

LRSD READ 180 Final Report Page 44
equipment issues with headphones, software CDs, etc. (21%) as the major areas for
improvement.
Small group direct instruction module. The majority of the responses (55%)
indicated that the teachers valued this one-on-one time with students allowing them to
interact with and focus on individual students. The teachers explained that during this
time individual needs can be met (23%) and that the small groups allowed ease in
monitoring (9%). When asked to describe changes that should be recommended the
teachers explained that more time (23%) and more space and smaller groups (23%)
would be beneficial. The teachers also reported difficulties in being available to
students in the other modules (15%) and classroom distractions (8%) as areas for
improvement.
Independent reading. The teachers reported that independent reading time
provides students with an opportunity for quiet reading and practice (21%) and that this
activity can be individualized for students’ reading levels (16%). The teachers also
noted that the ability to retake quizzes and get immediate feedback (11%), listen to
audio books (10%), allow students to choose their own books to read (11%) as
strengths of the independent reading time. While describing strategies for improving
this module the teachers reported that the reading collection needed to be updated and
increased to include more variety (38%) and that strategies for keeping students
engaged for the duration of this module were needed (25%). The teachers explained
that an aide/assistant would be helpful (13%) as would smaller group sizes (13%) as
this was a time during the READ 180 when ‘trouble-makers” act up (6%).

LRSD READ 180 Final Report Page 45
Modeled reading. Nearly two-fourths (38%) of the teachers described that the
best part of students reading in pairs was the opportunity for modeling. The teachers
reported that students enjoy reading, sharing, and discussing books using this strategy
(23%). However, 15% of the teachers explained that modeling is rarely or never done
in their READ 180 classrooms. One-third (33.3%) of the responses suggest that no
changes are needed for this module. Other suggestions included more time for peer
reading (17%), smaller class size (17%), and smaller group size (17%).
Overall. The teachers reported the following as overall strengths of the READ
180 program: students like and are motivated by the program (16%), the program
supports progress and success (16%), students are better able to focus and stay on-
task (11%), student reading has increased (11%), repetition provides practice and
increases comprehension (11%), and rotation of activities (11%).
In contrast, the teachers stated that the following were areas in need of
improvement: too many technical difficulties (16%), the need for more and better
distributed time (16%), more user-friendly reports, and the need for smaller groups of
students (10%). All of the teacher responses suggest that the READ 180 program
should be continued. They explain that student improvement and success are notable
(23%), that students enjoy the program (17%), and an increase in student reading
comprehension and skills (17%), and an increase students’ self-worth from their own
accomplishments (10%).
Student Focus Groups.
A total of 38 students from eight randomly selected schools participated in the
focus groups. Full results of the Student Focus Group are in Appendix G.

LRSD READ 180 Final Report Page 46
Whole group direct instruction. The students reported that the best part about
the teacher instruction at the beginning of class was that they are provided with an
overview of what is to be expected (40% of responses). The students also liked that it
provided an opportunity for them to receive study questions, practice sheets and a
review of previous work (13%). When asked to describe strategies for improving this
component of the READ 180 classroom the majority of the student responses (78%)
stated that nothing needed to be changed. The only suggestions given were allowing
students more time to complete their work during this component before moving on to
the small group rotations (11%) and providing students with a better explanation of
expectations for the rest of class (11%).
Computer module. When describing the strengths of the READ 180 computer
activities the students explained that they enjoyed the Spelling Zone (23%), learning
new vocabulary in the Word Zone (20%), reading (20%) and videos (11%). Half of the
student responses (50%) indicate that no changes to this module are needed.
Suggestions that were made included increasing the time allowed for the computer
module (17%) and overcoming computer malfunctions (17%).
Small group direct instruction module. The student responses indicate that they
valued the following as strengths of small group interactions with the teacher:
discussion and helping each other (30%). writing (18%), one-on-one attention (12%),
and reading and writing essays (12%). The majority of the student responses (67%)
indicate that no changes to this module of the READ 180 program are needed. Those
suggestions that were given are linked. It was suggested that more time is needed
during this module (22%) and that group sizes should be smaller (11). It was explained

LRSD READ 180 Final Report Page 47
that if five students working at varying skill/ability levels each need individualized
help/instruction, then 20 minutes goes by too quickly for the teacher to assist each
student and teach a lesson.
Independent reading. The students reported that their favorite aspects of the
independent reading time included reading (27%), exploring new books and progressing
to more advanced books (27%) and working on vocabulary words and questions (12%).
While describing strategies for improving this module the students reported that the
reading collection needed to be increased and include more variety. better books,
longer books, and more audio books (39%). The students also suggested that this
module needed to be more fun (6%) and incorporate opportunities for discussion (6%).
Modeled reading. While describing the strengths of reading in pairs the students
reported that they enjoyed partner work by modeling reading (25%), that it was more
interesting and fun (19%) and helped them focus on emphasis and comprehension
(19%). It was also reported that this module was not used in some classes (19%).
When asked to suggest improvements for this module 67% reported that no changes
were needed and 33% reported a desire to read in pairs more often.
Overall. The students reported the following as overall strengths of the READ
180 program: increased time spent reading and improving reading skills (26%), the
computer component (16%), working in small groups (14%), and the whole experience
(14%). In contrast, the students reported that the following were areas in need of
improvement: increase allotment of time (11%), too many computer difficulties (11%)
and CD/disk problems (11%), as well as improvements to the book collections (11%).
All of the student responses suggest that the READ 180 program should be continued.

LRSD READ 180 Final Report Page 48
They reported that improves reading and increases the desire to read (17%), learn more
(13%), improves spelling skills (7%) and it is fun (7%). It was also explained that the
READ 180 program helped in other classes (7%) which all can result in students feeling
more successful (4%).
Interview Results
Principal Interviews.
The ten principals from the schools participating in this READ 180 program
evaluation were interviewed to examine their impressions of the program. The majority
of these principals (60%) were administrators of schools that were using READ 180 for
the second year, 30% were at schools using it for the third year and one school was
using the program for the fourth year. Full results of the Student Focus Group are in
Appendix H.
Overall impressions. Nearly all of the principals indicated a positive overall
impression of the READ 180 program while one reported that the benefits were
dependent on the classroom teacher. Three of the principals indicated that their faculty
liked READ 180 and two reported that they personally believe it is beneficial. One
principal described that the program is wonderful because it restores confidence in the
students.
Meeting needs. When asked to evaluate how READ 180 meets the learning
needs of African American students 50% of the responses described that it improves
reading abilities and comprehension. One principal indicated that it helps individualize
instruction while others mentioned that it provided a practical instructional model for
teachers to use. One principal explained that READ 180 is helpful for African American

LRSD READ 180 Final Report Page 49
students with deficient reading, comprehension and analytical skills. While, another
indicated that the quality of the teacher impacted student ability to achieve success.
Implementation. The principals were asked to describe how their READ 180
programs were implemented with regard to student selection, role of the READ 180
course (replace or supplement Standard English course), student “graduation” from
READ 180, and use of tracking elements. Responses revealed that students were
primarily from 9th grade (25%), but also included grades 6-8 students. Students were
primarily selected on the basis of Benchmark scores (77%), while one indicated
automatic enrollment for all resource students, one used transcript data, and one staff
recommendations. The READ 180 program was equally used to replace or to
supplement Standard English courses. Principals indicated that students typically
(60%) “graduate” at the end of the school year.
Reporting and tracking elements. Four of the ten principals reported that the
tracking forms included in the READ 180 software were used for program assessment.
Three interviewees indicated that READ 180 in their schools used the software for pre-
and post-assessment of student performance. One principal further described that
students were assessed at the beginning of the year, quarterly and at the end of the
year using these tools.
Strengths. The principals interviewed were asked what they considered to be the
best aspects or strengths of the READ 180 program. The ability to work in small groups
and individualize instruction was reported in 21% of the responses while 16% of the
responses focused on the technological aspects of the program. One principal
explained that the faculty believes that the READ 180 program meets the students at

LRSD READ 180 Final Report Page 50
their reading level and helps them progress from there. It was also reported that the
program encourages the use of a variety of teaching strategies (11%), that students, as
well as teachers, can track student progress (11%) and that READ 180 classes holds
students’ attention (11%). One principal commented that the faculty loves the program
because of the hands-on approach. Another stated that READ 180 improved students’
vocabulary, reading and comprehension abilities.
Improvements. The following were suggested as areas of improvement in the
READ 180 program by the interviewees: overcoming technical issues (30%), bad
marketing/image of the READ 180 program (20%) and costs of the program (20%).
One principal reported that it was also difficult to ensure that everyone is maintaining
data regarding students’ progress within the READ 180 program. Another indicated that
as a result of the program’s success the faculty at his/her school would like to offer the
program to more students. However, the program’s expense made this an unlikely
possibility.
Student Achievement Analyses and Results
Student Achievement Analyses
For all tests of program effects, a matched-samples design was employed.
Where possible, each READ 180 student was individually matched to another student
within the same school, at the same grade level, with the same 2005 ITBS Reading
NCE score and demographic characteristics. In 13 of the 15 school/grade level
combinations in which the program was implemented, this process resulted in nearly
perfect matching based on a comparison of READ 180 and non-READ 180 students’
2005 ITBS Reading NCE scores. Independent samples t-tests were performed on 2005

LRSD READ 180 Final Report Page 51
ITBS Reading NCE scores within each grade and school, and in 12 of 15 cases the
resulting p-value was at or above 0.95, where 1.00 indicates a perfect match (i.e.,
exactly the same pretest mean; see Table 12). The least efficient matching occurred at
Central High and J.A. Fair High, where the p-values were 0.481 and 0.494, respectively.
In these two instances, a preponderance of students with low pretest scores
participated in the program, so it was not possible to match each program student to a
control student on a one-to-one basis. Nevertheless, the results of the pretest
comparisons indicate that there were no statistically significant differences between
program and control students within any grade level or school.

LRSD READ 180 Final Report Page 52
Table 12 Mean 2005 ITBS Reading NCE Scores (Pretest) by School, Grade, and Treatment Condition: Matched Samples
School Grade Treatment Mean SD n t
p
Central High 9 Not Read180 29.89 10.169 64 .481 .632 Read180 28.94 12.172 64
Hall High 9 Not Read180 37.88 11.244 51 .018 .990 Read180 37.84 11.261 51
Parkview High 9 Not Read180 41.67 12.228 15 .000 1.00 Read180 41.67 12.228 15
J.A. Fair High 9 Not Read180 28.78 11.741 51 .494 .620 Read180 27.68 13.643 103
Pulaski Heights Middle 6 Not Read180 29.36 13.003 25 .157 .876 Read180 28.76 13.989 25
Southwest Middle 6 Not Read180 24.32 13.431 25 .021 .983 Read180 24.24 13.627 25
7 Not Read180 28.00 14.386 22 -.063 .950 Read180 28.27 14.109 22
8 Not Read180 24.27 13.854 22 -.033 .974 Read180 24.41 13.727 22
McClellan High 9 Not Read180 27.15 9.144 39 -.009 .993 Read180 27.18 14.011 68
Henderson Middle 7 Not Read180 28.90 14.734 21 .072 .943 Read180 28.57 15.148 21
8 Not Read180 40.11 11.985 35 .040 .968 Read180 40.00 11.995 35
Cloverdale Middle 6 Not Read180 29.36 15.237 28 .053 .958 Read180 29.14 15.207 28
7 Not Read180 26.10 13.757 30 .056 .956 Read180 26.27 12.642 44
8 Not Read180 25.91 12.094 44 -.080 .937 Read180 26.11 11.979 44
Mabelvale Middle 6 Not Read180 36.92 14.866 25 .000 1.00 Read180 36.92 14.855 25
7 Not Read180 38.61 20.043 31 -.025 .980 Read180 38.74 20.409 31
8 Not Read180 36.68 12.679 38 .018 .986 Read180 36.63 12.691 38
A total of 661 READ 180 (72% of participants) had matching 2005 ITBS, district
enrollment, program enrollment records, and 2006 ITBS scores. The matched
comparison sample was comprised of a total of 566 students. The overall number in
LRSD READ 180 Final Report Page 53
the comparison sample was smaller due to the lack of sufficient one-to-one matches at
Central and J.A. Fair. In addition to the near exact matches on pretest scores, program
students and comparison students were quite similar on other demographics: 52.6%
vs. 51.8% male, 93.5% vs. 92.4% African American, 71.4% vs. 71.2% eligible for free
lunch, and 19.1% vs. 17.5% special education students for READ 180 and the control
group, respectively. For each grade 6-9, a multivariate analysis of covariance
(MANCOVA) was performed with program (READ 180, Control) and school serving as
independent variables; 2006 ITBS Vocabulary, Reading Comprehension, Total
Reading, and Revised Writing NCE scores as outcomes; and 2005 ITBS Reading NCE,
student sex, special education status, and free or reduced-price lunch status as
covariates. Wilk’s lambda was used as the criterion of multivariate significance and
alpha was set at .05. When MANCOVA indicated a significant multivariate effect,
univariate follow-up tests were conducted using a sequential Bonferroni approach; i.e.,
employing an alpha of .0125 to adjust for the fact that four outcome measures were
being analyzed. Effect size estimates were computed for each outcome by subtracting
the covariate-adjusted Control mean from the Read180 adjusted mean, and dividing the
difference by 21.06 (the national norm standard deviation for NCE scores).
Arkansas Benchmark Literacy scale scores were available for grades six through
eight. For these grades, analyses of covariance were performed with program (READ
180, Control) and school serving as independent variables; Literacy scale scores as
outcomes; and 2005 ITBS Reading NCE, student sex, special education status, and
free or reduced-price lunch status as covariates. Effect size estimates were computed
by subtracting the covariate-adjusted Control mean from the Read180 adjusted mean,

LRSD READ 180 Final Report Page 54
then dividing the difference by the total standard deviation for each respective grade
level. The percentages of students obtaining proficiency were computed for each
combination of grade level, school, and treatment.
Student Achievement Results
Sixth grade
ITBS 2006 subtests. MANCOVA indicated no statistically significant multivariate
main effects for program (λ = 0.98, F4,188 = 1.11, p = .36) or for the school X program
interaction effect (λ = 0.92, F12,498 = 1.31, p = .21). Directionally, results tended to favor
Control students (see Table 13 and Figures 1-4), particularly at Cloverdale and
Mabelvale. At Pulaski Heights and Southwest, effect size estimates across subtests
ranged from -0.11 to +0.05, showing essentially no differences between Read180 and
Control students. At Mabelvale, moderately large negative effects were observed on
Vocabulary (-0.39), Reading Comprehension (-0.21), and Total Reading (-0.33; see
Table 12). Mean NCE scores for all groups across all subtests were quite low, ranging
from 17.96 on Total Reading for the Read180 group at Southwest Middle, to a high of
32.28 on Vocabulary for the Control group at Mabelvale Middle.

LRSD READ 180 Final Report Page 55
Table 13 Sixth Grade 2006 ITBS Means, Adjusted Means, and Effect Size Estimates1 by Treatment Condition and School
Treatment School Mean Adjusted Mean
Effect Size N
Vocabulary: NCE Control Pulaski Heights Middle 27.65 27.47 23
Southwest Middle 20.60 22.38 25
Cloverdale Middle 27.50 27.82 28
Mabelvale Middle 32.28 29.81 25
Read180 Pulaski Heights Middle 27.63 28.31 0.04 24
Southwest Middle 19.80 22.31 0.00 25
Cloverdale Middle 24.46 24.80 -0.14 28
Mabelvale Middle 24.56 21.51 -0.39 25
Control Pulaski Heights Middle 29.43 29.29 23
Southwest Middle 26.00 28.17 25
Cloverdale Middle 28.61 28.73 28
Reading Comprehension: NCE Mabelvale Middle 31.04 27.53 25
Read180 Pulaski Heights Middle 27.58 28.99 -0.01 24
Southwest Middle 22.96 26.65 -0.07 25
Cloverdale Middle 24.61 24.86 -0.18 28
Mabelvale Middle 27.00 23.01 -0.21 25
Reading Total: NCE Control Pulaski Heights Middle 26.74 26.55 23
Southwest Middle 21.52 23.84 25
Cloverdale Middle 26.43 26.69 28
Mabelvale Middle 30.64 27.12 25
Read180 Pulaski Heights Middle 25.79 27.03 0.02 24
Southwest Middle 17.96 21.60 -0.11 25
Cloverdale Middle 22.79 23.13 -0.17 28
Mabelvale Middle 24.24 20.11 -0.33 25
Control Pulaski Heights Middle 31.87 32.07 23 Revised Writing: NCE Southwest Middle 25.20 26.19 25
Cloverdale Middle 28.96 28.90 28
Mabelvale Middle 29.44 26.03 25
Read180 Pulaski Heights Middle 28.58 30.55 -0.07 24
Southwest Middle 22.04 27.19 0.05 25
Cloverdale Middle 23.61 23.62 -0.25 28
Mabelvale Middle 30.92 26.16 0.01 25 1Effect size estimates are all based on the NCE standard deviation of 21.06.

LRSD READ 180 Final Report Page 56
Figure 1. Sixth Grade 2006 ITBS Vocabulary NCE Adjusted Means by School and Treatment.

LRSD READ 180 Final Report Page 57
Figure 2. Sixth Grade 2006 ITBS Reading Comprehension NCE Adjusted Means by School and Treatment.

LRSD READ 180 Final Report Page 58
Figure 3. Sixth Grade 2006 ITBS Total Reading NCE Adjusted Means by School and Treatment.

LRSD READ 180 Final Report Page 59
Figure 4. Sixth Grade 2006 ITBS Revised Writing NCE Adjusted Means by School and Treatment.
Benchmark Literacy. ANCOVA revealed no statistically significant main effects
for program (F1,193 = 3.23, p = .07), and no program X school interaction effect F3,193 =
.11, p = .96). Directionally, results consistently favored the Control group, with effect
size estimates ranging from –0.27 at Pulaski Heights to –0.12 at Cloverdale (see Table
14 and Figure 18). The percentages of students obtaining proficiency on the Benchmark
Literacy exam were nearly equal between Read180 and Control groups at Southwest
(0.0% vs. 4.0%), Cloverdale (14.3% vs. 14.3%), and Mabelvale (16.0% vs. 20.8%), but

LRSD READ 180 Final Report Page 60
only half the percentage of Read180 students achieved proficiency relative to Control
students at Pulaski Heights (12.0% vs. 24.0%; see Table 15).
Table 14 2006 Benchmark Literacy Scale Score Means, Adjusted Means, and Effect Size Estimates by Grade Level, School, and Treatment
Grade School Treatment Mean Adjusted
Mean Effect Size N
6 Pulaski Heights Middle Control 534.04 539.07 25 Read180 487.24 501.06 -0.27 25 Southwest Middle Control 434.60 451.97 25 Read180 373.00 431.13 -0.15 25 Cloverdale Middle Control 518.54 523.56 28 Read180 505.61 506.76 -0.12 28 Mabelvale Middle Control 537.71 490.71 24 Read180 518.84 462.69 -0.20 25 7 Southwest Middle Control 465.18 498.85 22 Read180 450.91 479.84 -0.12 22 Henderson Middle Control 550.67 550.10 21 Read180 541.62 576.35 0.16 21 Cloverdale Middle Control 565.17 584.53 30 Read180 522.50 533.80 -0.31 44 Mabelvale Middle Control 600.97 555.98 31 Read180 629.57 570.30 0.09 30 8 Southwest Middle Control 620.57 651.44 21 Read180 581.59 647.78 -0.03 22 Henderson Middle Control 733.66 690.90 35 Read180 707.26 652.18 -0.29 35 Cloverdale Middle Control 594.95 629.81 44 Read180 595.40 629.24 0.00 43 Mabelvale Middle Control 649.82 629.56 38 Read180 704.84 680.53 0.38 37
Note. Total standard deviations by grade were 142.00, 163.52, and 135.24 for grades six, seven, and eight, respectively.

LRSD READ 180 Final Report Page 61
Figure 18. Sixth Grade Mean Adjusted 2006 Arkansas Benchmark Literacy Scale Scores by School and Treatment.

LRSD READ 180 Final Report Page 62
Table 15 2006 Arkansas Benchmark Literacy Proficiency Categories by School and Treatment Condition, Sixth Grade
School Treatment
Control Read180Pulaski Heights
Middle Proficiency Category Not Proficient n 19 22
% within treatment
condition 76.0% 88.0%
Proficient n 6 3
% within treatment
condition 24.0% 12.0%
Southwest Middle Proficiency Category Not Proficient n 24 25
% within treatment
condition 96.0% 100.0%
Proficient n 1 0
% within treatment
condition 4.0% .0%
Cloverdale Middle Proficiency Category Not Proficient n 24 24
% within treatment
condition 85.7% 85.7%
Proficient n 4 4
% within treatment
condition 14.3% 14.3%
Mabelvale Middle Proficiency Category Not Proficient n 19 21
% within treatment
condition 79.2% 84.0%
Proficient n 5 4
% within treatment
condition 20.8% 16.0%

LRSD READ 180 Final Report Page 63
Seventh grade
ITBS 2006 subtests. MANCOVA indicated a statistically significant multivariate
main effect for program (λ = 0.95, F4,205 = 2.81, p = .03), with no school X program
interaction effect (λ = 0.92, F12,543 = 1.37, p = .18). Follow-up univariate tests showed a
significant program effect for Reading Comprehension (F1,208 = 10.59, p = .001) and
Total Reading (F1,208 = 7.70, p = .006). In both cases, the overall adjusted mean for
READ 180 students was significantly lower than that of the Control group (M180’ = 30.96
vs. MC’ = 36.55 for Reading Comprehension; M180’ = 28.84 vs. MC’ = 33.64 for Total
Reading). As shown in Figures 5-8 and on Table 16, Reading Comprehension and Total
Reading scores consistently favored Control students at all schools, with effect size
estimates ranging from –0.44 at Cloverdale Middle on Total Reading to –0.13 at
Mabelvale Middle on Total Reading. Mean NCE scores across subtests for all groups,
while somewhat higher than sixth grade, were still quite low, ranging from M = 23.5 on
Vocabulary for the Southwest Middle Control students, to M = 43.43 on Reading
Comprehension for the Mabelvale Control group (see Table 16).

LRSD READ 180 Final Report Page 64
Table 16 Seventh Grade 2006 ITBS Means, Adjusted Means, and Effect Size Estimates1 by Treatment Condition and School
Treatment School Mean Adjusted
Mean ES N Vocabulary: NCE Control Southwest Middle 23.50 25.82 22 Henderson Middle 31.14 31.67 21 Cloverdale Middle 34.27 36.82 30 Mabelvale Middle 39.87 34.55 30 Read180 Southwest Middle 26.43 28.71 0.14 21 Henderson Middle 23.90 26.24 -0.26 21 Cloverdale Middle 25.41 27.45 -0.44 44 Mabelvale Middle 40.26 34.91 0.02 31
Control Southwest Middle 32.00 34.91 22 Henderson Middle 32.52 33.03 21
Reading Comprehension: NCE
Cloverdale Middle 37.60 40.27 30
Mabelvale Middle 43.43 37.99 30 Read180 Southwest Middle 25.33 27.80 -0.34 21 Henderson Middle 27.48 30.11 -0.14 21 Cloverdale Middle 30.43 32.71 -0.36 44 Mabelvale Middle 39.65 33.23 -0.23 31 Reading Total: NCE Control Southwest Middle 26.86 29.85 22 Henderson Middle 30.67 31.18 21 Cloverdale Middle 35.17 38.00 30 Mabelvale Middle 41.43 35.53 30 Read180 Southwest Middle 23.86 26.58 -0.16 21 Henderson Middle 24.19 27.06 -0.20 21 Cloverdale Middle 26.52 28.82 -0.44 44 Mabelvale Middle 39.42 32.89 -0.13 31
Control Southwest Middle 33.64 37.16 22 Revised Writing: NCE Henderson Middle 30.71 30.62 21 Cloverdale Middle 33.10 34.80 30 Mabelvale Middle 37.30 33.41 30 Read180 Southwest Middle 27.33 29.97 -0.34 21 Henderson Middle 30.48 33.87 0.15 21 Cloverdale Middle 30.57 31.63 -0.15 44 Mabelvale Middle 38.68 32.76 -0.03 31
1Effect size estimates are all based on the NCE standard deviation of 21.06.

LRSD READ 180 Final Report Page 65
Figure 5. Seventh Grade 2006 ITBS Vocabulary NCE Adjusted Means by School and Treatment.

LRSD READ 180 Final Report Page 66
Figure 6. Seventh Grade 2006 ITBS Reading Comprehension NCE Adjusted Means by School and Treatment.

LRSD READ 180 Final Report Page 67
Figure 7. Seventh Grade 2006 ITBS Total Reading NCE Adjusted Means by School and Treatment.

LRSD READ 180 Final Report Page 68
Figure 8. Seventh Grade 2006 ITBS Revised Writing NCE Adjusted Means by School and Treatment.
Benchmark Literacy. ANCOVA revealed no statistically significant main effects
for program (F1,209 = 0.25, p = .62), and no program X school interaction effect F3,209 =
1.59, p = .19). Results were mixed across schools, with small positive effects at
Mabelvale (ES = +0.09) and Henderson (ES = +0.16), and small to moderately large
negative effects at Cloverdale (ES = -0.31) and Southwest (ES = -0.12; see Table 14
and Figure 19). A lower percentage of Read180 students achieved proficiency at
Southwest (4.5% vs. 13.6%), Henderson (14.3% vs. 19.0%), and Cloverdale (11.4% vs.

LRSD READ 180 Final Report Page 69
30.0%), whereas a higher percentage of Read180 students achieved proficiency at
Mabelvale (43.3% vs. 38.7%; see Table 17).
Figure 19. Seventh Grade Mean Adjusted 2006 Arkansas Benchmark Literacy Scale Scores by School and Treatment.

LRSD READ 180 Final Report Page 70
Table 17 2006 Arkansas Benchmark Literacy Proficiency Categories by School and Treatment Condition, Seventh Grade
School Treatment
Control Read180
Southwest Middle Proficiency Category Not Proficient n 19 21
% within treatment
condition 86.4% 95.5%
Proficient n 3 1
% within treatment
condition 13.6% 4.5%
Henderson Middle Proficiency Category Not Proficient n 17 18
% within treatment
condition 81.0% 85.7%
Proficient n 4 3
% within treatment
condition 19.0% 14.3%
Cloverdale Middle Proficiency Category Not Proficient n 21 39
% within treatment
condition 70.0% 88.6%
Proficient n 9 5
% within treatment
condition 30.0% 11.4%
Mabelvale Middle Proficiency Category Not Proficient n 19 17
% within treatment
condition 61.3% 56.7%
Proficient n 12 13
% within treatment
condition 38.7% 43.3%

LRSD READ 180 Final Report Page 71
Eighth grade
ITBS 2006 subtests. MANCOVA indicated a statistically significant multivariate
main effect for program (λ = 0.96, F4,261 = 2.62, p = .04), with no school X program
interaction effect (λ = 0.95, F12,691 = 1.09, p = .36). Follow-up univariate tests showed a
significant program effect on Revised Writing (F1,264 = 9.66, p = .001), with Control
students (M’ = 35.52) having significantly higher adjusted mean scores than Read180
students (M’ = 31.58). Directionally, there tended to be either no difference, or a small
to moderate difference favoring the Control group across all tests and schools (see
Figures 9 – 12 and Table 18). Effect size estimates ranged from –0.32 (Revised
Writing at both Southwest Middle and Henderson Middle) to +0.05 for Revised Writing
at Mabelvale Middle (see Table 18).

LRSD READ 180 Final Report Page 72
Table 18 Eighth Grade 2006 ITBS Means, Adjusted Means, and Effect Size Estimates1 by Treatment Condition and School
Treatment School Mean Adjusted
Mean ES N Vocabulary: NCE Control Southwest Middle 28.86 32.63 22 Henderson Middle 36.71 31.64 35 Cloverdale Middle 25.67 29.01 43 Mabelvale Middle 34.92 33.03 38 Read180 Southwest Middle 23.29 27.61 -0.24 21 Henderson Middle 36.14 32.04 0.02 35 Cloverdale Middle 25.55 29.14 0.01 44 Mabelvale Middle 31.63 29.46 -0.17 38
Control Southwest Middle 29.18 33.98 22 Henderson Middle 40.26 34.93 35
Reading Comprehension: NCE
Cloverdale Middle 29.07 33.39 43
Mabelvale Middle 38.89 36.21 38 Read180 Southwest Middle 25.86 31.66 -0.11 21 Henderson Middle 40.03 34.34 -0.03 35 Cloverdale Middle 26.50 30.71 -0.13 44 Mabelvale Middle 34.82 31.89 -0.21 38 Reading Total: NCE Control Southwest Middle 28.00 32.73 22 Henderson Middle 38.06 32.37 35 Cloverdale Middle 25.88 30.16 43 Mabelvale Middle 36.61 34.06 38 Read180 Southwest Middle 23.05 28.70 -0.19 21 Henderson Middle 37.83 32.33 0.00 35 Cloverdale Middle 24.34 28.64 -0.07 44 Mabelvale Middle 32.58 29.75 -0.20 38
Control Southwest Middle 31.59 34.65 22 Henderson Middle 42.51 38.32 35 Cloverdale Middle 31.33 35.23 43
Revised Writing: NCE
Mabelvale Middle 35.71 33.88 38 Read180 Southwest Middle 22.52 27.93 -0.32 21 Henderson Middle 37.20 31.64 -0.32 35 Cloverdale Middle 28.55 31.88 -0.16 44 Mabelvale Middle 37.08 34.85 0.05 38
1Effect size estimates are all based on the NCE standard deviation of 21.06.

LRSD READ 180 Final Report Page 73
Figure 9. Eighth Grade 2006 ITBS Vocabulary NCE Adjusted Means by School and Treatment.

LRSD READ 180 Final Report Page 74
Figure 10. Eighth Grade 2006 ITBS Reading Comprehension NCE Adjusted Means by School and Treatment.

LRSD READ 180 Final Report Page 75
Figure 11. Eighth Grade 2006 ITBS Total Reading NCE Adjusted Means by School and Treatment.

LRSD READ 180 Final Report Page 76
Figure 12. Eighth Grade 2006 ITBS Revised Writing NCE Adjusted Means by School and Treatment.
Benchmark Literacy. ANCOVA revealed no statistically significant main effects
for program (F1,263 = 0.03, p = .86), but a significant program X school interaction effect
F3,263 = 2.92, p = .04) was observed. Follow-up tests indicated that there were: no
statistically significant program effects at either Cloverdale (ES = 0.00) or Southwest
(ES = -0.03); a statistically significant positive effect at Mabelvale (ES = +0.38); and a
statistically significant negative effect at Henderson (ES = -0.29; see Table 14 and
Figure 20). Nearly equal percentages of Read180 vs. Control students achieved

LRSD READ 180 Final Report Page 77
proficiency at Henderson (60.0% vs. 62.9%), Cloverdale (20.9% vs. 20.5%), and
Mabelvale (48.6% vs. 42.1%), while Read180 students at Southwest had a much lower
percentage achieving proficiency (18.2% vs. 33.3%; see Table 19).
Figure 20. Eighth Grade Mean Adjusted 2006 Arkansas Benchmark Literacy Scale Scores by School and Treatment.

LRSD READ 180 Final Report Page 78
Table 19
2006 Arkansas Benchmark Literacy Proficiency Categories by School and Treatment Condition, Eighth Grade
School Treatment
Control Read180
Southwest Middle Proficiency Category Not Proficient n 14 18
% within treatment
condition 66.7% 81.8%
Proficient n 7 4
% within treatment
condition 33.3% 18.2%
Henderson Middle Proficiency Category Not Proficient n 13 14
% within treatment
condition 37.1% 40.0%
Proficient n 22 21
% within treatment
condition 62.9% 60.0%
Cloverdale Middle Proficiency Category Not Proficient n 35 34
% within treatment
condition 79.5% 79.1%
Proficient n 9 9
% within treatment
condition 20.5% 20.9%
Mabelvale Middle Proficiency Category Not Proficient n 22 19
% within treatment
condition 57.9% 51.4%
Proficient n 16 18
% within treatment
condition 42.1% 48.6%

LRSD READ 180 Final Report Page 79
Ninth grade
ITBS 2006 subtests. MANCOVA indicated a statistically significant multivariate
main effect for program (λ = 0.98, F4,504 = 3.04, p = .02), with no school X program
interaction effect (λ = 0.97, F16,1540 = 0.93, p = .53). Follow-up univariate tests showed a
significant program effect on Vocabulary (F1,507 = 5.87, p = .01), Reading
Comprehension (F1,507 = 8.42, p = .004) and Total Reading (F1,507 = 9.41, p = .002). In
all three instances, the overall adjusted mean for READ 180 students was significantly
lower than that of the Control group (M180’ = 26.53vs. MC’ = 29.52 for Vocabulary; M180’
= 31.64 vs. MC’ = 34.88 for Reading Comprehension; and M180’ = 28.06 vs. MC’ = 31.46
for Total Reading). As shown in Figures 13-16 and on Table 20, results consistently
favored Control group students, with effect size estimates ranging from –0.30 for
Reading Comprehension at McClellan High, to +0.04 for Revised Writing at Hall High.
Mean NCE scores across tests were generally low for both groups, ranging from M =
21.21 on Total Reading for the Read180 group at McClellan High, to M = 46.00 for the
Read180 group at Parkview High (see Table 20).

LRSD READ 180 Final Report Page 80
Table 20 Ninth Grade 2006 ITBS Means, Adjusted Means, and Effect Size Estimates1 by Treatment Condition and School
Treatment School Mean Adjusted
Mean ES N Control Central High 29.69 30.77 64 Vocabulary:
NCE Hall High 31.65 27.68 51 Parkview High 43.00 36.72 15 J.A. Fair High 27.10 27.74 51 McClellan High 21.97 24.66 39
Read180 Central High 25.98 26.43 -0.21 64 Hall High 31.18 27.84 0.01 51 Parkview High 37.67 31.94 -0.23 15 J.A. Fair High 22.27 23.89 -0.18 103 McClellan High 20.34 22.55 -0.10 68
Control Central High 35.14 35.81 64 Hall High 36.16 33.35 51 Parkview High 42.53 38.31 15
Reading Comprehension: NCE J.A. Fair High 32.69 33.13 51 McClellan High 32.33 33.79 39
Read180 Central High 32.70 33.10 -0.13 64 Hall High 34.96 32.34 -0.05 51 Parkview High 39.53 35.19 -0.15 15 J.A. Fair High 28.81 30.22 -0.14 103 McClellan High 25.72 27.37 -0.30 68
Control Central High 31.95 33.05 64 Reading Total: NCE Hall High 33.73 29.72 51 Parkview High 42.67 36.48 15 J.A. Fair High 29.41 30.00 51 McClellan High 25.64 28.06 39
Read180 Central High 28.36 28.82 -0.20 64 Hall High 32.82 29.32 -0.02 51 Parkview High 38.87 32.97 -0.17 15 J.A. Fair High 23.92 25.71 -0.20 103 McClellan High 21.21 23.49 -0.22 68
Control Central High 35.83 36.60 64 Hall High 39.76 36.44 51
Revised Writing: NCE Parkview High 45.20 40.32 15 J.A. Fair High 37.51 37.74 51 McClellan High 32.33 33.93 39
Read180 Central High 35.78 35.87 -0.03 64 Hall High 40.47 37.35 0.04 51 Parkview High 46.00 40.30 0.00 15 J.A. Fair High 31.65 33.66 -0.19 103 McClellan High 30.06 32.28 -0.08 68
1Effect size estimates are all based on the NCE standard deviation of 21.06.

LRSD READ 180 Final Report Page 81
Figure 13. Ninth Grade 2006 ITBS Vocabulary NCE Adjusted Means by School and Treatment.
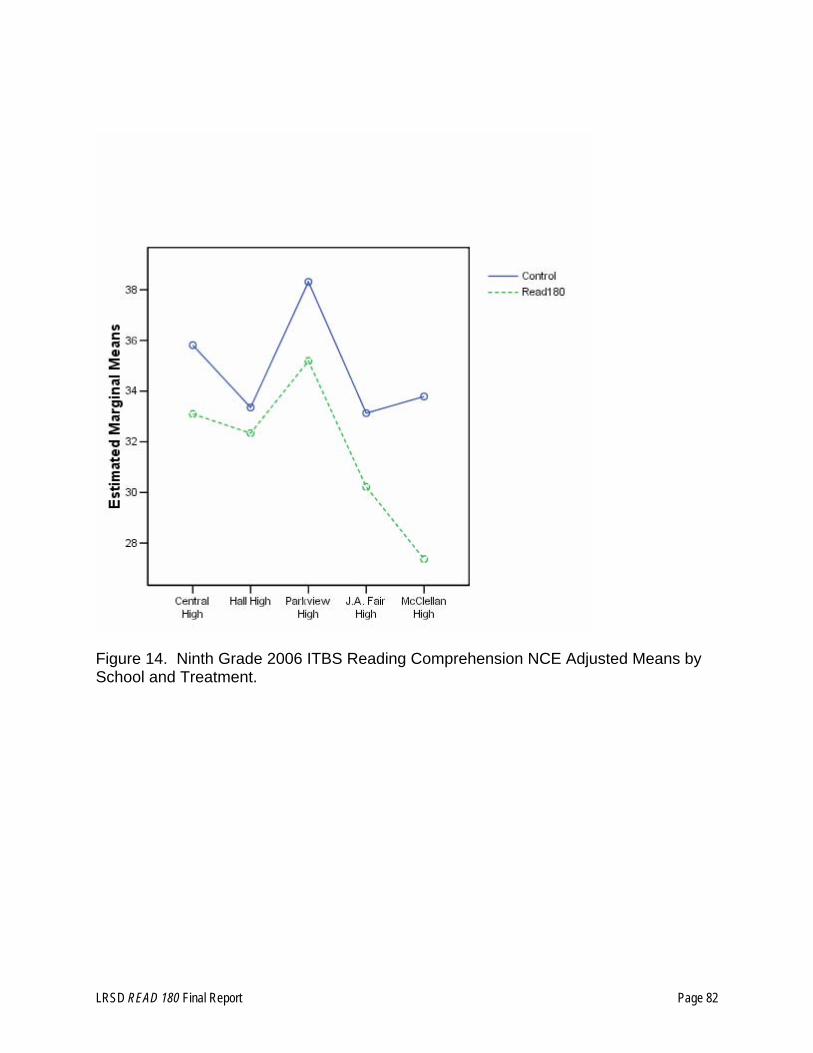
LRSD READ 180 Final Report Page 82
Figure 14. Ninth Grade 2006 ITBS Reading Comprehension NCE Adjusted Means by School and Treatment.

LRSD READ 180 Final Report Page 83
Figure 15. Ninth Grade 2006 ITBS Total Reading NCE Adjusted Means by School and Treatment.

LRSD READ 180 Final Report Page 84
Figure 16. Ninth Grade 2006 ITBS Revised Writing NCE Adjusted Means by School and Treatment.

LRSD READ 180 Final Report Page 85
Summary of Read180 Effects
ITBS 2006 subtests. As shown in Figure 17, the mean effect size estimates for
all four ITBS subtests were statistically significantly less than zero, indicating overall
negative effects of Read180. A total of 17 independent effect size estimates were
computed for each of four ITBS outcome variables: Vocabulary, Comprehension, Total
Reading, and Revised Writing. For Vocabulary, effect size estimates ranged from –0.44
to 0.14, with a median effect size estimate of –0.14. The 95% confidence interval for
the mean Vocabulary effect size estimate was –0.21 to –0.04, indicating a statistically
significant negative effect associated with READ 180. For Comprehension, effect size
estimates ranged from –0.36 to -0.01, with a median effect size estimate of –0.14. The
95% confidence interval for the mean Comprehension effect size estimate was –0.22 to
–0.11, indicating a statistically significant negative effect associated with READ 180.
For Total Reading, effect size estimates ranged from –0.44 to +0.02, with a median
effect size estimate of –0.17. The 95% confidence interval for the mean
Comprehension effect size estimate was –0.22 to –0.11, indicating a statistically
significant negative effect associated with READ 180. Finally, for Revised Writing,
effect size estimates ranged from –0.34 to +0.15, with a median effect size estimate of –
0.07. The 95% confidence interval for the mean Comprehension effect size estimate
was –0.17 to –0.02, indicating a statistically significant negative effect associated with
READ 180.

LRSD READ 180 Final Report Page 86
Figure 17. Read180 Mean Effect Size Estimates with 95% Confidence Intervals by ITBS Subtest: 2006. Note: LB = lower bound of 95% confidence interval, UB = upper bound of 95% confidence interval.
Benchmark Literacy. Overall, Read180 students were less likely to obtain
proficiency on the Arkansas Benchmark Literacy examination. As seen in Figure 21,
substantially higher percentages of Control students obtained proficiency in sixth grade
(15.7% vs. 10.7%) and seventh grade (26.9% vs. 18.8%), while there was essentially no
difference in the percentage obtaining proficiency in eighth grade (39.1% for Control
students and 38.0% for Read180 students).
-0.25
-0.20
-0.15
-0.10
-0.05
0.00Vocabulary Comprehension Total Reading Revised Writing
LB Mean UB

LRSD READ 180 Final Report Page 87
Figure 21. Percentage of Students Obtaining Proficiency on the Arkansas Benchmark Literacy Exam by Grade and Treatment Group.
10.7
18.815.7
39.138.0
26.9
0.0
5.0
10.0
15.0
20.0
25.0
30.0
35.0
40.0
45.0
6th 7th 8th
Read180 Control
10.7
18.815.7
39.138.0
26.9
0.0
5.0
10.0
15.0
20.0
25.0
30.0
35.0
40.0
45.0
6th 7th 8th
Read180 Control

LRSD READ 180 Final Report Page 88
CONCLUSIONS
The conclusions of the present study are presented in association with each of the
major research questions in the respective sections below. The conclusions are
followed responses to the Compliance Remedy Questions.
Primary Evaluation Question
• Has the READ 180 program been effective in improving and remediating the academic achievement of African American students? The preponderance of evidence suggests that the READ 180 program has not
been effective in improving or remediating the academic achievement of African
American students. Relative to Control students who were individually matched on the
basis of prior achievement, sex, race, special education status, and free or reduced-
price lunch status, READ 180 students consistently performed lower on both ITBS
Reading subtests and the Benchmark Literacy exam. The design employed to assess
READ 180 effects, while quite rigorous, cannot rule out the possibility of selection
effects because students were not randomly assigned to treatment conditions. A
second consideration is that standardized state tests may not be adequately aligned to
the READ 180 curriculum and may have limited sensitivity compared to individually
administered reading inventories for assessing program effects.
Without exception, Read180 students had equal or lower average performance
than matched Control students on ITBS subtests. In seventh grade, Read180 students
had statistically significantly lower NCE scores on ITBS Reading Comprehension and
ITBS Total Reading. In eighth grade, Read180 students had statistically significantly
lower NCE scores on ITBS Revised Writing. In ninth grade, Read180 students had

LRSD READ 180 Final Report Page 89
statistically significantly lower NCE scores on ITBS Vocabulary, Reading
Comprehension, and Total Reading. Combined average effects across grade levels
suggest a small, statistically significant negative effect associated with Read180 for all
four ITBS NCE scales, with median effect size estimates across grades and schools of -
0.14, -0.14, -0.17, and -0.07 for Vocabulary, Comprehension, Total Reading, and
Revised Writing, respectively.
Results on the Benchmark Literacy exam also suggested overall negative effects
in sixth and seventh grade, with much higher percentages of control students obtaining
proficiency than Read180 students. In eighth grade, the percentages obtaining
proficiency were equal. Comparisons on Benchmark Literacy scale scores showed no
statistically significant overall differences between Read180 and Control students in
sixth and seventh grade, although, consistent with the differences in proficiency
attainment, results directionally tended to favor Control students. The only exception to
the general pattern of Read180 students performing at equal or lower levels to
Comparison students was that eighth grade Read180 students at Mabelvale performed
significantly higher than their matched Control counterparts, with an effect size of +0.38.
Supplemental (Qualitative/Step 2) Evaluation Questions
• What are the quality and level of implementation of READ 180 at the schools implementing it in 2005-2006? The observation data and results from surveys and focus groups indicate that the
quality and level of READ 180 implementation was in general fairly high. For instance,
the READ 180 teachers most frequently utilized direct instruction, asked higher-level
questions, acted as a coach and facilitator, and engaged students in reading, writing,

LRSD READ 180 Final Report Page 90
and discussions. Plus, all READ 180 teachers agreed that they customized activities to
meet the needs of students, and approximately 70% indicated that they used READ 180
individual student reports on a weekly basis. In addition, the READ 180 Quality
Assessment results revealed that the learning environments were observed to be
conducive to cooperative interactions, effective classroom management, and active
teacher monitoring. When students were observed using the computers, they remained
focused and on task while working on reading comprehension, vocabulary, and spelling
activities. The teachers, students, parents, and principals all believed that the READ
180 computer program was beneficial because it provided individualized instruction to
students.
Yet, less positive outcomes were also revealed in that there was low occurrence
(approximately 20%) of teachers utilizing fluency, vocabulary, text comprehension, or
writing strategies as recommended by READ 180. An additional concern was revealed
in the LRSD provided READ 180 computer reports, which showed that students at six of
the 10 schools were only spending about 20% of the recommended time completing the
READ 180 computer activities. Perhaps some of the reduced time can be attributed to
the technical difficulties cited by teachers and students as being a major concern.
Overall, the observers reported that the READ 180 classes were highly focused
on learning and that the students were highly engaged all or nearly all of the time.
Although 60% of the teachers reported use of the READ 180 professional modules,
teacher infrequent use of targeted literacy strategies indicates that additional teacher
professional development focused on implementing these strategies is needed.
Classroom schedules need to be adjusted and technical support increased to better

LRSD READ 180 Final Report Page 91
ensure that students spend the recommended time completing READ 180 computer
activities.
• What is the level of participation in READ 180 by African American students relative to other ethnic groups at the school?
The 2005-2006 READ 180 program was implemented in ten LRSD schools with
student populations comprised of approximately 90% African American students.
Triangulation of data from multiple sources indicated that all of the African American
and most of the non-African American students enrolled in READ 180 classes fully and
equally participated in READ 180 activities. Specifically, of the 231 students observed
during direct observation of READ 180 classes, all of the 212 African American students
were rated as having a “high” level of attention, interest, and engagement, while the
ratings of the 19 non-African American students were distributed across “High”,
“Moderate,” and “Low”. Approximately 90% of the READ 180 teachers agreed the
READ 180 “seems valuable for improving the achievement of African American
students in reading and literacy.” In addition, the majority of the READ 180 students,
who were 90% African American, agreed that the program had increased their reading
(70%) and writing (56%) skills. With regard to parent impressions, approximately 75%
of the 164 who responded to the survey were parents of African American students in
the READ 180 program. Nearly all parents were aware that their children were
participating in the READ 180 program and 90% felt it was an important part of their
child’s education. School principals were also in agreement that the READ 180 program
met the needs of African American students by providing individualized literacy

LRSD READ 180 Final Report Page 92
instruction that was highly motivating and used hands-on, practical approaches to assist
students with low reading abilities to achieve greater learning.
• What are the perceptions of READ 180 teachers regarding program implementation, impacts, strengths, and weaknesses?
There was an overall general consensus among the READ 180 teachers that the
program had a positive impact on students by improving students' literacy skills, overall
quality of work, achievement and engagement in learning. In particular, the teachers
felt the computer activities kept students interested while also addressing students’
individual needs and abilities through repetition, practice and immediate feedback. The
teachers valued the one-on-one time with students because it allowed them to interact
with and focus on individual students. The teachers were also in agreement that the
independent reading time was worthwhile because students enjoyed choosing their own
books and reading at their own pace with the assistance of audio books and recording
devices to improve oral reading.
The teachers reported the following as overall strengths of the READ 180
program: students were motivated by the program and were able to focus and stay on-
task, student reading had increased, repetition provided practice and increased
comprehension, and improved reading ability has increased students’ self-worth and
confidence.
In contrast, the teachers stated that the following were areas in need of
improvement: increase technical support to address computer problems; increase
and/or better distribute time; create more user-friendly reports, and decrease class size
to allow greater individualization of student instruction. Teachers also indicated a need

LRSD READ 180 Final Report Page 93
for formal guidelines for student placement into the READ 180 program. Some
teachers reported a need for more READ 180 professional development, yet concern
was raised as to the quality of the READ 180 professional development modules.
The teachers were in agreement that the READ 180 program was supported and
liked by school principals, other teachers, parents, and the students. This was reflected
in agreement from all but one teacher that the READ 180 program should be continued.
• What are the perceptions of other teachers in the school regarding program
implementation, impacts, strengths, and weaknesses? Of the 269 non-READ 180 teachers that completed a survey, nearly 90% were
aware of READ 180 and understood the program goals, while about 80% were familiar
with the READ 180 class rotation structure. However, two-thirds (66.9%) of the
teachers indicated that they were not able to identify students who were taking or who
had taken READ 180 classes. Therefore, data reflecting non-READ 180 teacher
perceptions of the program are limited to 81 teachers. Of those who were able to
identify READ 180 students, about 60% indicated that while the READ 180 students
were in their class, the students demonstrated improved written, oral vocabulary, and
literacy skills, increased reading comprehension, and were more willing to read in class.
Only about half of the non-READ 180 teachers thought that READ 180 students in their
class showed more interest in learning, changed their classroom behavior, or submitted
work that reflected better writing. A concern noted by the teachers was that access to
the program was limited in that it did not reaching all students with low reading ability.
The teachers also indicated that there were not enough books or computers to

LRSD READ 180 Final Report Page 94
adequately support implementation of READ 180. Only half (49.8%) of the non-READ
180 teachers felt the program should be continued.
• What are the perceptions of parents/guardians of students participating in READ 180 regarding program impacts, strengths, and weaknesses? The Parent Survey results reflect the target population for this evaluation in that
over 75% of the 164 parents represented African American students enrolled in READ
180 classes. Nearly all of the parents responded that they were aware of and
supportive of their child’s participation in the READ 180 program. This support was
expressed by 90% of the parents who believed that the program was an important part
of their child or children’s education. Most of the parents thought the READ 180
program had helped or somewhat helped improve their child or children’s achievement
or reading grades; interest in learning and their interest in reading. Slightly fewer
parents agreed that the program increased the amount of time that their son or daughter
spent reading. The parents indicated that the “worst” aspects of the program were that
it did not encourage students to read at home, computer time was too limited, the
activities were too challenging, there were too many computer problems, and it did not
seem that students were learning anything new and did not have READ 180 homework.
In summary, the parents agreed that it is beneficial for their children to participate in the
READ 180 program because of its positive impact on their reading and overall learning.

LRSD READ 180 Final Report Page 95
COMPLIANCE REMEDY QUESTIONS
Teacher and Administrator Involvement
The evaluation involved 287 classroom teachers and 10 school principals from 10
schools implementing the READ 180 Program. Eighteen of the 287 teachers taught in
the READ 180 program, while 269 were non-READ 180 teachers. These teachers were
primarily Caucasian (61.1%), and secondarily African American (33.3%), with most
being female (94.4%). Nearly two-fifths (38.9%) were first year READ 180 teachers
while 22.2% were teaching their second year with the program and 38.9% were in their
third. The teachers represented all READ 180 grade levels, with sixth and ninth grade
teachers (33.3% each) more heavily represented than seventh and eight grade teachers
(22.2% each). Of the 269 non-READ 180 teachers, 62.5% were Caucasian, 28.3%
were African American, with less than 3% representing other races. Most (44.4%) were
9th grade teachers, with the remaining grades being represented fairly evenly at around
20%. Nearly three-fourths (73.6%) were female. The 10 principals of the READ 180
schools were interviewed. Six of the principals were administrators of schools that were
using READ 180 for the second year, three were at schools using it for the third year
and one school was using the program for the fourth year.
Recommended Program Modifications
The evaluation revealed that the READ 180 program is valued by students, READ
180 teachers, non-READ 180 teachers, parents, and principals as helping students to
improve their reading ability. However, the examination of student achievement scores
revealed little or no learning advantages for student using the READ 180 program.

LRSD READ 180 Final Report Page 96
Possible program modifications needed to produce greater achievement gains are
described below.
• Adjust class schedules to ensure students spend the recommended amount of
time completing READ 180 activities for identified areas of deficiency. The
schedule should provide students at least 20 minutes per day per student.
• Better prepare READ 180 teachers to utilize strategies recommended by READ
180 for increasing literacy skills, such as Fluency (Models fluent oral reading; Has
students read/re-read orally); Vocabulary (Introduces or reviews key vocabulary
words; Explicit vocabulary instruction); Text Comprehension (Explicit
comprehension strategy instruction; Makes connection to prior knowledge; Ask
students for predictions; Uses higher order questioning; Guides visual imaging;
Guides interactive discussion); and Writing (Instructs letter formation, handwriting;
Explains the writing process; Conducts language mechanics lesson)
• Better prepare READ 180 teachers to generate and frequently use READ 180
reports of student-level performance as well as class-level performance by
ethnicity. Ensure that teachers understand which reports will provide information
most critical for adapting lessons to meet the needs of African American and non-
African American students. Also, ensure that teachers use the reports to modify
READ 180 activities to more specifically address learning deficiencies.
• Implement consistent district and school level procedures for placing students into
the READ 180 program to ensure the program enrolls students with the greatest
learning deficiencies. Explore options for offering the program to more students.

LRSD READ 180 Final Report Page 97
• Implement a monitoring process to ensure schools implementing READ 180
follow recommended guidelines for achieving improved academic achievement.
Expectations of Program Modifications
READ 180 is an established program that when implemented according to
recommended guidelines has been shown improve student learning in a setting similar
to Little Rock School District (Papalewis, 2004). With program modifications as
described above, the Little Rock School District could expect:
• Progressive gains on standardized test scores over time.
• A greater adherence to READ 180 guidelines, especially those relating to the
amount of time-on-task for the READ 180 computer program required for optimum
benefits.
• More READ 180 teachers who are better able to use student performance data to
meet the individual learning needs of African American and non-African American
students
• Improved computer resources and support to better enable LRSD to provide
students time to learn from READ 180 software and other computer-based
programs.
• More READ 180 teachers who are able to effectively implement recommended
literacy strategies in their classrooms.

LRSD READ 180 Final Report Page 98
References
Papalewis, R. (Spring, 2004). Struggling middle school readers: Successful,
accelerating intervention. Reading Improvement, 41, 1, pp. 24-37.
Ross, S. M., Smith, L. J., & Alberg, M. (1999). The School Observation Measure
(SOM©). Memphis, TN: Center for Research in Educational Policy, The
University of Memphis.
Ross, S. M., Smith, L. J., Alberg, M., & Lowther, D. L. (2001). Using classroom
observation as a research and formative evaluation tool in educational reform:
The School Observation Measure. In H. Waxman, R. G. Tharp, & R. S. Hilberg
(Eds.), Observational research in culturally and linguistically diverse classrooms.
Cambridge, UK: Cambridge University Press.
Sterbinsky, A., Ross, S. M. & Burke, D., (2004). Tennessee EdTech Accountability
Model (TEAM) Reliability Study. The CNA Corporation, Alexandria, VA.

LRSD READ 180 Final Report Page 99
Appendix A* Data Collection Instruments • School Observation Measure • READ 180 Quality Assessment • READ 180 Survey of Computer Use • READ 180 Teacher Questionnaire • READ 180 Student Questionnaire • Non-READ 180 Teacher Questionnaire • READ 180 Parent Questionnaire
*Note (will be included in hard copy)

LRSD READ 180 Final Report Page 100
Appendix B READ 180 Teacher Questionnaire
Comment Summary

LRSD READ 180 Final Report Page 101
Little Rock School District READ 180 Teacher Questionnaire Comments Summary
N = 18 What are the strengths of the READ 180 Program? Response Categories # of responses % of responses Individualized instruction 3 27% Small group instruction 2 18% Teaching material 2 18% Motivating/Engaging 2 18% Rapid Progress 1 9% Positive feedback 1 9% Total 11 Sample responses:
• Individualized programming based on student learning. • Small group, direct instruction. • High interest reading material. • It is engaging and keeps the attention of the students. • The students are able to make rapid progress with their literary skills. • The positive feedback the students receive throughout the program. My students have said many,
many times how much they like READ 180. What are the weaknesses of the READ 180 program? Response Categories # of responses % of responses Technological problems 3 33% Lack of time 2 22% Not enough selection of books 1 11% Inflexible 1 11% Multitasking 1 11% Lack of organization of the material 1 11% Total 9 Sample responses:
• READ 180 software malfunctions. • The students do not have enough time to read at their seat or with Read180 or in big or small
groups when teaching skills and them working to do their skills. • We need a more diverse selection of books to read in independent reading. We need books that
appeal to teenagers. • It is not very flexible. There are no levels to the handouts. • I cannot effectively teach 8 in small groups, keep 8 reading (not sleeping), and deal with various
computer issues the other 8 have! Also some materials are dull and insultingly simple. • So many READ 180 materials it makes it difficult to find what you need.
Which reports do you most frequently use? Response Categories # of responses % of responses Grading report 4 44% Comprehension skills report 2 22% Growth report 1 11% Parent letter 1 11% Intervention grouping 1 11% Total 9

LRSD READ 180 Final Report Page 102
What changes do you recommend for the READ 180 program? Response Categories # of responses % of responses Better student screening 3 38% Correct technical problems 2 25% Training for new teachers 1 13% Higher-level questioning on handouts 1 13% More engaging learning material 1 13% Total 8 Sample responses:
• We need a better way to screen students who are admitted into the class. • Correct the technical problems. • More training for new teachers. “Optional structures for 30 minutes.” Ex.: Some days – 30 min.
computer, 30min. reading, 30min whole group. • Higher level questioning on handouts, better customer service after technical issues. • More engaging student materials and silent reading books.

LRSD READ 180 Final Report Page 103
Appendix C Non- READ 180 Teacher Questionnaire
Comment Summary

LRSD READ 180 Final Report Page 104
Little Rock School District Non-READ 180 Teacher Questionnaire Comments Summary
N = 269 What do you think are the strengths of the READ 180 program? Response Categories # of responses % of responses Improved reading skills/grades/tests 29 27% Individualized progress/instruction 12 11% Variety in instruction delivery 10 9% Students read more/Practice reading 9 8% One-on-one instruction 8 7% Improved confidence 7 7% Reinforces hard work/Motivates 6 6% Basic skills improvement 6 6% Improving low achieving students’ 5 5% Technology use/Software 5 5% Structure 4 4% Spelling exercises 3 3% Good teachers 2 2% Engaging learning material 1 1% Total 107 Sample responses:
• This program gives the student an opportunity to be successful in developing their reading skills. • Student progress at their level. • It makes students read more. • Individual attention, small class, double time. • The program helped raise student confidence. • Continuous feedback with score and/or criteria level. • It helps the students tremendously. It has a great impact on every subject students take. • The program provides instruction for low performing students. • The continuous use of technology. • The classroom layout and organization keep students more on task. • Spelling is a strength of this program. • The program gives students a much higher interest level in class material.
What do you think are the weaknesses of the READ 180 program? Response Categories # of responses % of responses Access 23 28% Larger selection of books 23 28% More computers/facilities/supplies 10 12% Lack of communication with staff 7 9% Technological deficits 3 4% Marginalizes 3 4% Lack of flexibility 2 2% Too little writing 2 2% No transition to regular class work 2 2% Intervention comes too late 2 2% Too much homework 1 1% Expects active student involvement 1 1% Too little discipline 1 1% Emotional, social and behavioral issues are not addressed 1 1% Class size 1 1% Total 82

LRSD READ 180 Final Report Page 105
Response summary: • More students could benefit from the program. Students who are weak in reading should take
reading 180 and English. • We need a larger variety of books. We need at least one more lab. • There are not enough computers. • Teachers of other disciplines could be given mini courses so we are aware of methods and could
give support. • Equipment failure and not enough disks. • Isolation from others, not following regular 9th grade curriculum. • We cannot do “teaming” because the READ 180 program lacks flexibility. For example, we could
do a unit with social studies on the holocaust and have readings that correspond with science or time periods in history.
• The students don’t write enough so even though they can read they are incapable of writing about what they have read.
• There is no transition between READ 180 and the regular tenth grade English class. • Teacher seems to schedule too much additional work – reading materials could be updated – not
enough students are able to use this program. • Too often students must motivate and monitor their own progress. • Students are not required to behave or conduct themselves as other students do in a normal
classroom. • Students often have other issues that cannot be addressed by READ 180 – emotional issues,
social issues. • Class size and physical plant problems
What changes do you recommend for the READ 180 program? Response Categories # of responses % of responses Access 17 23% More computer labs/computers 15 21% Greater selection of books/materials 9 12% Better and earlier screening 5 7% Smaller groups/More staff 5 7% More information and communication with staff 5 7% Monitoring/Evaluation 3 4% Add transitional class 3 4% Motivate students more 3 4% Make it a daily requirement/ Structures like a normal classroom 2 3% More writing 2 3% Address behavioral deficits 1 1% More online quizzes 1 1% Collaborate with regular classes 1 1% More training 1 1% Total 73 Response summary:
• Expand to all students that need it have access to it. • More labs/computers. • A variety of books that reflect the demographic of the school. • That all students (6th graders) are screened for possible inclusion. • Much smaller groups, an aid is needed. • More communication between READ 180 and other teachers. • Monitoring and evaluation of READ 180 teachers. I have heard of success on the 8th grade level
but have heard little on the other levels. • A transition program to 10th grade English.

LRSD READ 180 Final Report Page 106
• Students need to be able to see their progression in the program. • Have the structures like a normal classroom – no free time to play computer games. • More writing. • Wider scope, behavior component (low skilled readers usually have behavior problems to cover
up low skills). • More online-quizzes, earlier identification of students to be in the program and also another lab. • Writing assignments are short and students respond with just anything. Yet teachers could adapt
assignments. Some assignments could work along English curriculum. • The teachers should be given more training and more teachers teach READ 180.
Briefly explain why you believe your school should or shouldn’t continue using READ 180? Response Categories # of responses % of responses Yes 99 100% No 0 0% Response Categories # of responses % of responses Improves skill and performance 30 30% Beneficial/Good teacher and student feedback 30 30% Enhances student learning/ Basic skills 19 19% Large number of low achievers 9 9% Reading is fundamental to every Subject 5 5% Improves students’ confidence/ Empowerment 2 2% Motivates students to read 2 2% Individualized instruction 1 1% Results are not immediate 1 1% Total 99 Response summary:
• Yes. Helps children with their reading skills • Yes. I think the student benefits from it. I know this because I spoke to one of the teachers. • Yes. I have noticed academic benefits of this program in increasing their ability and eagerness to
learn. • Yes. We have many students on a low reading level. • Yes. It helps students learn in all content areas. • Yes. It seems to be helping our students improve their confidence and skill in reading. • Yes. Because it is the only way students will read. • Yes. It allows the students who are below basic to get the individualized help they need. • It takes time to see results. If a child starts in the 6th grade then we have to wait for them to get
into 8th grade to see real results.

LRSD READ 180 Final Report Page 107
Appendix D READ 180 Student Questionnaire
Comment Summary

LRSD READ 180 Final Report Page 108
Little Rock School District READ 180 Student Questionnaire Comments Summary
N = 579 What READ 180 activities help you learn the most? Response Categories # of responses % of responses Spelling/Pronunciation 60 30% Reading/Reading zone 50 25% Computer 33 17% Small group activities 33 17% Vocabulary/word zone 15 8% Individual instruction 4 2% Writing 4 2% Projects 1 1% Total 200 Sample responses:
• The spelling zone helped me learn the most. • Reading. • The computer zone. • I learn more in small group. • The vocabulary because I learn a word I didn’t know how to spell. • Working with [name removed]. • Writing. • When we learn about new kinds of speeches like acronyms. But the good thing is when we do
projects on the books that we read that include mind maps. What READ 180 activities do not help you to learn? Response Categories # of responses % of responses All activities help 97 57% Reading/Reading zone 30 18% Vocabulary/word zone/word speed 28 17% Spelling/Pronunciation 4 2% Small group activities 4 2% Writing 3 2% Computer 2 1% Success zone 1 1% Total 169 Sample responses:
• They all help me. • Reading by myself and with a friend. • Vocabulary. • Spelling because all the words are too easy and I am a good speller without the help. • Small group didn’t help me that much. • Doing research on the computer. • Writing and spelling. • The success zone because you are not doing nothing but going over what you already went over.

LRSD READ 180 Final Report Page 109
What would make the READ 180 class better? Response Categories # of responses % of responses Continue program/Longer time 28 17% More activities/videos/centers 23 14% More time on computer 23 14% Games 15 7% Newer equipment/more books 8 5% More reading/Silent reading 7 4% More challenging work/Tests 7 4% More free time/no work/no homework 7 4% More spelling/spelling tests 5 3% More variety/more zones 5 3% More books/Better selection 4 2% More research 3 2% Access for more students 3 2% Music 2 1% No word zone 2 1% More writing/Writing summaries 2 1% Field trips 1 1% More flexibility/choice 1 1% Less computer work 1 1% Less reading 1 1% More individual help 1 1% Food 1 1% Total 162 Sample responses:
• Give us more time with each section. • More activities. • More time on the computer. • To have more colorful things and more games to learn better. • The activities need to be more interesting. • More computer disk selection. • If we had more reading and vocabulary activities. • Awards for people who finish every section. • More free time. • More spelling • What would make it better is if we had other options to choose from and more things to do on the
computer. • Better book selection. • Do more research. • More people in the class so that they can learn, too. • If we get to listen to music why we do READ 180. • If they don’t have the word zone on there because I don’t think it helps you. • Put writing in the READ 180 class. • Field trips would make it more fun. • If we can pick which group we want to go to every day in our class. • Less work on the computer. • It would be better if there were not a lot of reading. • If we get a little bit more help with me teachers. • Food.
LRSD READ 180 Final Report Page 110
Appendix E READ 180 Parent Questionnaire
Comment Summary

LRSD READ 180 Final Report Page 111
Little Rock School District READ 180 Parent Questionnaire Comments Summary
N = 164 What is the Best thing about your Son/Daughter being in a READ 180 class? Response Categories # of responses % of responses Improved reading skills 43 36% Increased interest in reading 36 30% Improved grades 8 7% Improved overall learning 6 5% Computer skills 6 5% Comprehension 4 3% Spelling 4 3% Concentration 3 3% Individual instruction 2 2% Writing skills 1 1% Listening skills 1 1% Verbal skills 1 1% More conversations about school work 1 1% Motivation 1 1% Teacher 1 1% Increased self-esteem 1 1% Total 119 Sample responses:
• He wants to read more. • His grade has improved. • The best thing is that my child learns more. • Using the computers. • He is learning to read more for understanding. • His spelling has improved. • Smaller class size and individualized programming. • Better with sentence structure. • [Name removed] seems to be speaking clearer. • He talks more about his schoolwork.
What is the Worst thing about your Son/Daughter being in READ 180? Response Categories # of responses % of responses No encouragement to read at home 6 26% Lack of time/computer time 4 17% Challenging class work/tests 4 17% Lack of equipment/technical problems 3 13% No new learning/little homework 3 13% Lack of discipline 1 4% No book check-out 1 4% Lack of transparency of the program 1 4% Total 23 Sample responses:
• It did not encourage him to read more at home. • Having so little time to be in it. • The worst part is it gets harder every 9 weeks. • They don’t have enough CD’s to work on. • She’s still a little below her grade level. • Acting up.

LRSD READ 180 Final Report Page 112
• Can’t bring books home. What changes would you like to see in the READ 180 class? Response Categories # of responses % of responses Increase communication with parents 8 17% More reading/interest in reading 6 13% More learning material/variety/motivating 6 13% Continued services/wider access/longer time 6 13% Skill improvement 5 11% Grades 3 6% Book and material check-out 3 6% More individualized services/more focus 3 6% More assignments/harder assignments 3 6% More interesting topics 2 4% After-school program 1 2% More computer time 1 2% Total 47 Sample responses:
• Communicate with parents more. • I would like him to read more • More selection of books to read. • I wish it could be throughout high school (all grades). • Books to bring home. • More of a one-on-one focusing on areas that need improvement. • More homework. • More interesting topics. • I’d like to see the program after school. • More computer time.

LRSD READ 180 Final Report Page 113
Appendix F READ 180 Teacher Focus Group Results

LRSD READ 180 Final Report Page 114
Little Rock School District READ 180 Teacher Focus Group Results
N = 18 Teachers
Teacher instruction at the beginning of READ 180 class What is the best part? Response categories # of responses % of responses Gives the students a focus and set the tone for the day Students are able to address one another Builds student enthusiasm Helps teacher organize for the day
14 1 1 1
82% 06% 06% 06%
TOTAL 17 Sample responses: • This opening sets the mood and the course for the day with the students. • This assists in organization and plans for the teacher for the day. • Get to explain/introduce topic and model reading strategy • Interaction with entire class • Introduce expectations & framework
What can/should be changed? Response categories # of responses % of responses Nothing Time format of the program needs to be broken down differently Smaller classes Better instruction on how to use resources Feel like you are still teaching a class
3 3 3 2 1
24% 24% 24% 20% 8%
TOTAL 12 Sample responses: • Time should be lengthened to make sure the entire 90 minute tasks are understood • Smaller classes would be beneficial • Better instruction on how to use resources for that the whole-group period • Feel like you are still teaching a traditional class rather than READ 180
Computer activities: What is the best part? Response categories # of responses % of responses New subject matter and computer (video) format keeps students interested Individualized needs are addressed Repetition and fluency practice Immediate feedback for students and teachers Good for all level students – appropriately tests and places them for success
12 6 4 2 1
48% 24% 16% 8% 4%
TOTAL 25 Sample responses: • Repetition with immediate feedback helps scores improve • The computer gathers information for the teacher to adjust instruction to learner needs • The 180 program is paced for each student’s needs. • Individualized according to student needs which helps them to make gains • Slower kids successful and rewarding to see them successful • Exposes them to knowledge that they haven’t been exposed to • Fluency practice • Students engaged and very interested

LRSD READ 180 Final Report Page 115
• Students exited about working on computers What can/should change? Response categories # of responses % of responses Technology failures/technical problems Equipment issues (headphones, CDs) Sometimes the lessons are repetitive Need more challenging lessons Would like to get daily grades Nothing
6 3 2 1 1 1
43% 21% 14% 7% 7% 7%
TOTAL 14 Sample responses: • Technology - frequently fails, so many times kids’ data is lost and they have to start over • Software causes technical problems • If the computers are “down” or malfunctioning, they must redirect instructional needs. • Some disks and headphones needed replacement and repairs • Would like to be able to get a daily grade rather than just cumulative grades
Teacher directed small groups: What is the best part? Response categories # of responses % of responses One on one time and attention and interaction Individual needs can be met Small group size is appealing Can change the groups Assessing student needs can be quickly achieved Students are easier to monitor
12 5 2 1 1 1
55% 23% 9% 4% 4% 4%
TOTAL 22 Sample responses: • Working with smaller groups • Students do hands on with what was talked about in class • Individualized to person or small group • Know if they are doing their work • Teacher can observe student’s needs very fast
What can/should be changed? Response categories # of responses % of responses Nothing More time More space and smaller groups Difficult being available at all areas when needed Dealing with classroom distractions Difficult to which grouping works best for students
3 3 3 2 1 1
23% 23% 23% 15% 8% 8%
TOTAL 13 Sample responses: • Creating groups in which students aren’t intimidated to open up • Have no more than 5 students in the small group instruction. • Room too small – distracts other students • Teacher not readily available for kids in reading or computers

LRSD READ 180 Final Report Page 116
Independent Reading Time: What is the best part? Response categories # of responses % of responses Provides an opportunity for quiet reading, good practice Individualized by reading level Quizzes can be taken more than once and provide immediate feedback Audio books Students choose their own books Increase reading speed and builds vocabulary Books are interesting for students Filling out Reading log
4 3 2 2 2 2 2 2
21% 16% 11% 11% 11% 11% 11% 11%
TOTAL 19 Sample responses: • Kids develop an interest in reading • The students prefer to pick their own book. • At Jr. High Level, most still like to have time to sit in a comfortable chair and just read. • Love the quizzes - students get immediate feedback and can take it more than once • Very individualized
What can/should be changed? Response categories # of responses % of responses Need to increase and update collection, more variety and more interesting Difficult to keep students engaged and focused Need aide or additional help Smaller groups This is time when “trouble-makers” act-up Works best when teacher models reading for whole class
6 4 2 2 1 1
38% 25% 13% 13% 6% 6%
TOTAL 16 Sample responses: • Often students will get off task or quit reading – it’s hard to monitor and teach small group • Keep groups small. The larger the group, talking is common and disrupts the other groups. • Needs to be another person to help monitor • Need more books geared towards culture • For the most part this is a time when the trouble maker will cause trouble
Modeled Reading with another student: What is the best part? Response categories # of responses % of responses Modeling reading Students enjoy sharing book, reading aloud, and discussing reading Builds pronunciation, fluency, and comprehension Students help one another in less intimidating manner Rarely or not done
5 3 3 2
38% 23% 23% 15%
TOTAL 13 Sample responses: • Less intimidation • Not done in my class • Students enjoy sharing books and discussing what is happening • Models and helps one another • They read aloud and it helps them with comprehension and fluency

LRSD READ 180 Final Report Page 117
What can/should be changed? Response categories # of responses % of responses Nothing More time Classroom size Group size Hard to monitor and keep ADD students focused
2 1 1 1 1
33% 17% 17% 17% 17%
TOTAL 6 Sample responses: • Size of classroom affects this • 20 minutes rotation time is not enough time • Do more as a group with 3 or 4 students – have students move from table to table • Nothing • Some ADD students “squirm” and disturb others (lack of constant supervision)
Overall, what are the strongest aspects of the READ 180 Program? Response categories # of responses % of responses Students like and are motivated by program Supports individual progress and success Student stay focused and “on task” Increased reading Repetition: increases comprehension, provides practice, feedback, etc. Rotation Classroom management Improved reading and writing skills Data/Reports Feedback Healthy competition Improved test scores More willing to read aloud Computer component Adding to collection
6 6 4 4 4 4 2 2 2 2 2 1 1 1 1
16% 16% 11% 11% 11% 11% 5% 5% 5% 5% 5% 3% 3% 3% 3%
TOTAL 38 Sample responses: • Reading a lot of books • The repetition of the program is excellent because it seems most children need that repetition to begin to
recognize common words and to see how they are used in sentences. • The students stay (and interact in the small group situation) on their level and progress through the year at a
steady pace. • The program adds variety and movement for the students. Keeps them on task and focused. They know
what to do every 20 minutes. • Number and type of reports on students tell where they are struggling • Good feedback on problems and weaknesses • Rotating management system that benefits the middle school age student very much • Adding to collection of books (for students) • Computer component • Students love program – don’t want to go back to old way • Kids never read books but will read 10 before the year is up • All components of the program are wonderful • Each gives our students repetitive practice in reading, vocabulary, and spelling, whether in a small group or
while working the computer program • Student’s don’t get bored • Student’s have a chance for success

LRSD READ 180 Final Report Page 118
• Stories are interesting • Student improvement (ACCTAP scores up)
Overall, what are the weakest aspects of the READ 180 Program? Response categories # of responses % of responses Technology and technical problems Time, need more & needs to be distributed better Reports, too many or not the right kind Smaller groups, too many students Too much material and information for teachers Not enough books District needs to do a better job of screening for program Students who do not utilize program need to be able to be removed More computers Some inclusion students feel inadequate Need help with implementation Need more workshops for teachers Need aide Need bigger space Some of material seems to low level for the students
5 5 4 3 2 2 1 1 1 1 1 1 1 1 1
16% 16% 14% 10% 7% 7% 3% 3% 3% 3% 3% 3% 3% 3% 3%
TOTAL 31 Sample responses: • The fact that there are so many technical problems • Don’t have enough books for 3rd /4th level • Set-up of classroom – too much in small space • Trying to help a lot of students at once • Probably need an aide for help • Some of material seems way to low for students • Disks for computer – not going low enough to meet students reading needs • Students (5 – 10%) who do not utilize the program should be (easily – i.e. not any red tape) removed • No more than 21 students (smaller groups make all the difference in scores) • Some inclusion students feel inadequate • As a district we need to do a better job selecting kids for the program • 90 minutes is not enough time • Need more program oriented workshops for new READ 180 teachers • Changing discs wastes valuable time, especially for some of our lower students. • Also, when a student completes one CD and is told to “pick another CD”, no matter which CD they select
and insert, it continues to tell them to “pick another CD”. • Need more computers • Reports are not teacher friendly • Lots of reports – seem to be the same, should condense the reports • Need better reports for students to see their progress • So much stuff – it is overwhelming for new teachers

LRSD READ 180 Final Report Page 119
Should the program be continued? Why? Response categories # of responses % of responses Yes Why: • Success and Improvement are notable. It is a good program that
works. • Students like the program. • Comprehension and skills are increased. • Increases student self-worth and gives them a sense of
accomplishment. • Teachers like the program. • Parents like the program. • Regular English class would not allow as much success. • Retention rate dropped and reading levels increased. • Students are able to chart their own progress. • Teachers can give immediate feedback.
17 7 5 5 3 2 2 2 2 2 2
100% 23% 17% 17% 10% 7% 7% 7% 7% 7% 7%
TOTAL 30 Sample responses: • We have worked 2 years with the 180 Reading program and can see the success with the students in areas
of skills 9 comprehension, vocabulary and writing skills) • Students are much more motivated to read, as well as feeling better about themselves and what they have
accomplished. • The students gain study skills, as they have to focus on one thing for a short period and complete a task
designated to that period. • Students want and need structure that is provided in this program. • Teacher can give instant feedback for reading/writing skills • Students love rotation – up and moving every 20 minutes • In 2 years – retention rate dropped and reading levels increased • Students more involved in learning process • Without program kids are going to be more and more behind • Need more READ 180 classes • Regular English wouldn’t allow lower kids to be successful • Our parents like the program • We like the program • It gives kids confidence about their ability to read and boosts their self-worth • Students love it

LRSD READ 180 Final Report Page 120
Appendix G READ 180 Student Focus Group Results

LRSD READ 180 Final Report Page 121
Little Rock School District READ 180 Student Focus Group Results
N = 38 Students
Teacher instruction at the beginning of READ 180 class: What is the best part? Response categories # of responses % of responses Given instruction, overview for what is to be expected. Provides study questions, practice sheets, and review of previous work. Miscellaneous: say pledge, watch TV, etc. Learning new things (i.e. vocabulary, sentences). Helps with future tests and corrections on essays. Get to know each other. Talk about books. Read papers out loud
12 4 4 4 3 1 1 1
40% 13% 13% 13% 11% 3% 3% 3%
TOTAL 30 Sample responses:
• Study questions given out • Explaining the daily plan • Not confused about what you will be doing in groups • Learning new words • Getting to know everyone • Learning new things • Helps correct sentence error • Helps on test • Come in & watch channel 1 • Gives a lot of practice sheets to help us out with paragraph & grammar • Talk about books
What can/should be changed? Response categories # of responses % of responses Nothing Need more description Feeling rushed.
7 1 1
78% 11% 11%
TOTAL 9 Sample responses:
• Need more description to be better prepared at for group work at tables • Feel rushed into group work before they have time to complete the opening exercises.
Computer activities: What is the best part? Response categories # of responses % of responses Spelling; Spelling zone Learning new words, vocabulary; Word zone Reading Videos Success zone Typing Listening to new story Talking into microphone, pronunciation Helps with computer skills Writing skills
8 7 7 4 3 2 1 1 1 1
23% 20% 20% 11% 8% 6% 3% 3% 3% 3%

LRSD READ 180 Final Report Page 122
TOTAL 35 Sample responses:
• Reading stories • Helps with other computer classes • We get to learn new words and how to spell them • Helps with reading skills • Use headsets to listen to a story – helps break down new words and how to spell • Vocabulary – help pronounce words • Success zone because it shows us where we are
What can/should be changed? Response categories # of responses % of responses Nothing Needs to be longer. Computer malfunctions. Man talking on program. Hearing zone- say word
6 2 2 1 1
50% 17% 17% 8% 8%
TOTAL 12 Sample responses:
• The man talking in program is hard to understand • Need more time to do the activities • Computer break down too often
Teacher directed small groups: What is the best part? Response categories # of responses % of responses Discussion and helping each other in small groups Writing: sentences, paragraphs One on one attention, individualized Essay: construction, comprehension Reading Learn new stuff Grammar Good grades Understanding of work
10 6 4 4 4 2 1 1 1
30% 18% 12% 12% 12% 7% 3% 3% 3%
TOTAL 33 Sample responses
• Reading out loud • Write sentences for nouns or adjectives • Discussions • Have sections instead of whole groups with teacher • Helping each other • Getting good grades on work • Teacher available to help you • Writing on the board and trying to figure out verbs/nouns • Grammar • One on one time • Easier to understand • Essays – make sure we get all 5 paragraphs and conclusion • Improve on writing and understanding • Shows new stuff and tips like note cards • Individualized help • It is easy to ask the teacher for assistance without holding up the whole class.

LRSD READ 180 Final Report Page 123

LRSD READ 180 Final Report Page 124
What can/should be changed? Response categories # of responses % of responses Nothing Need more time. Smaller groups
6 2 1
67% 22% 11%
TOTAL 9 Sample responses
• Nothing • Group number should be smaller (no more than 5 students) • This time also seemed short to the students. IF 5 students need help with instruction on their level, the 20
minutes goes by too fast to assist everyone and teach a lesson. Independent Reading Time: What is the best part? Response categories # of responses % of responses Reading Exploring new books, working up to bigger books, Vocabulary words and questions Nothing Creating summaries Using imagination Post-reading tests Listening to audio tapes Quiet time Finishing a book Bean bags
9 9 4 3 2 1 1 1 1 1 1
27% 27% 12% 9% 6% 3% 3% 3% 3% 3% 3%
TOTAL 33 Sample responses
• Just reading is fun by itself • Have your own role in summarizing • Questions & vocabulary for each chapter • Drift off into own world while reading (puts you in the story) • Learn about new books we haven’t read • A lot of books to read – helps to raise reading level • You can listen to tapes • Start off with small books and move to novels • Writing summary • Quiet time • Using imagination • Exploring new books • Expanding vocabulary • The students like to choose their own book. • It is easier to finish books because in READ 180 program we read one chapter a day.
What can/should be changed? Response categories # of responses % of responses More books – more variety (better, longer, more audio) Nothing Need more time. Shorten the time. Should be more fun Need to be able to discuss Would like to read aloud sometimes Headphones
7 3 2 1 1 1 1 1
39% 17% 10% 6% 6% 6% 6% 6%

LRSD READ 180 Final Report Page 125
TOTAL 18 Sample Responses
• Need better books (sports, comedy) • More headsets are needed because it was too noisy to read individually on some days.
Modeled Reading with another student What is the best part? Response categories # of responses % of responses Partner work by modeling reading More interesting & fun Emphasis and comprehension Not done Really get into book Makes the time go by faster Get own characters
4 3 3 3 1 1 1
25% 19% 19% 19% 6% 6% 6%
TOTAL 16 Sample Responses
• Get your own character • See and hear how others read • Sticky notes to describe chapters • If you mess up partner can help • Understand book better • Really get into book • Helps time go by faster • More interesting
What can/should be changed? Response categories # of responses % of responses Nothing More often
4 2
67% 33%
TOTAL 6 Sample responses
• Wish we could read together more often Overall, what are the strongest aspects of the READ 180 Program? Response categories # of responses % of responses Reading, increasing reading time and skills. Computer part. Small group work. Whole experience. Improves vocabulary. Spelling. Discussing day’s work. Writing improvements. Teacher. Taking tests. Gives you more confidence. Structure makes class time quick.
10 6 5 5 2 2 1 1 1 1 1 1
26% 16% 14% 14% 6% 6% 3% 3% 3% 3% 3% 3%
TOTAL 36 Sample responses
• Discussing what you’ve done that day • Learning new words • Reading new books • Teaches, helps you get to your grade level fast

LRSD READ 180 Final Report Page 126
• Makes you want to read more • It helps understand big words
What are the weakest aspects? Response categories # of responses % of responses Need more time Nothing Computer problems CD/disk problems Books- not enough/not interesting Not fun, boring Computer time – too short Reading time- too short Writing paragraphs and summaries People in video too loud Individual reading
2 2 2 2 2 2 2 1 1 1 1
11% 11% 11% 11% 11% 11% 11% 6% 6% 6% 6%
TOTAL 19 Sample responses
• People in video talking too long • Not enough time for computers • When computers mess up • Back and forth on CD’s • Books aren’t interesting
Should the program be continued? Why? What can/should be changed? Response categories # of responses % of responses Yes. Improves reading and increases the desire to read. We learn more. Improves spelling skills It’s fun. Helps in other classes. Comprehension is better Improves computer skills Makes us feel successful Rotation and individualized lessons Better than reading a textbook. Important
7 5 4 2 2 2 1 1 1 1 1 1
25% 17% 13% 7% 7% 7% 4% 4% 4% 4% 4% 4%
TOTAL 28 Sample Responses
• Learn more things • Get better at computers, spelling, and reading • Helps you learn more • Helps make us feel successful • Help you read more • Help kids get smarter • Help become a better reader • Lets me learn without being embarrassed to ask for help • This program makes me read on my own. I would never get a book out of the library before.

LRSD READ 180 Final Report Page 127
Appendix H READ 180 Principal Interview Results

LRSD READ 180 Final Report Page 128
Little Rock School District READ 180 Principal Interview Results
N = 10 How many years has your school used the READ 180 program? Response categories # of responses % of responses Second year Third year Fourth year
6 3 1
60% 30% 10%
Total 10 What is your overall impression of the program? Response categories # of responses % of responses Positive impression Staff likes the program Beneficial Principal likes the program Benefit depends on the teachers
9 3 2 1 1
90% 30% 20% 10% 10%
Total 16 Sample responses
• READ 180 is absolutely wonderful because it restores confidence in the students. Most of the students have low self-esteem.
• The staff believes the program is fantastic; the staff loves the way the classes are conducted. • There is a definite benefit for the students participating in the READ 180 program. The students can see
their progress because of the different teaching and learning strategies. • Principal values the program. Staff likes the data generated for the reading assessments. This allows
students to see their growth. • Principal believed that READ 180 is a good program. However, it is like any other program; it depends on
the teachers. If the teacher is good, then students will benefit from the program. To what degree does the READ 180 program meet the learning needs of African American students? Please explain your response. Response categories # of responses % of responses Improves reading & comprehension Individualized instruction Race has no influence on needs Very practical instruction model Motivating format Quality of the teacher is essential
5 1 1 1 1 1
50% 10% 10% 10% 10% 10%
Total 10 Sample responses
• The program is great for African American students who are deficient in their reading, comprehension, and analytical skills.
• The program does a good job of meeting these students where they are in reading. • Principal does not see race being a factor in READ 180. • The hands-on approach is the learning style of the African American students in the school. • Many of the African American students do not like to read; however, the software motivates students. • Once again the principal believes that the teachers make a difference. Therefore, some students succeed and
some do not succeed.

LRSD READ 180 Final Report Page 129
How is the program implemented? a) Which students are enrolled in READ 180 classes? Response categories # of responses % of responses 9th grade 6th grade 7th grade 8th grade Students in special education/Students with learning disabilities/Resource students
5 4 4 4 3
25% 20% 20% 20% 15%
Total 20 b) How are students selected? Response categories # of responses % of responses Selection based on previous years benchmark scores Automatic enrollment for resource students Transcripts Staff recommendation
10 1 1 1
77% 8% 8% 8%
Total 13 c) Does the READ 180 program replace other language arts/reading classes or is it used to supplement language/arts/reading classes? Response categories # of responses % of responses Replaces language/arts/reading classes Supplements language/arts/reading classes
5 5
50% 50%
Total 10 d) How do you determine when a student “graduates” from READ 180? Response categories # of responses % of responses Some students graduate Students do not graduate until the following school year If students have reached their READ 180 goal If the students’ test scores improve
3 3 2 2
30% 30% 20% 20%
Total 10 Which reporting and tracking elements of READ 180 do you use? Which reporting and tracking elements of READ 180 do your teachers use? How and when are the reports most frequently used? Response categories # of responses % of responses Tracking forms and assessment of the program Pre and post-tests Evaluations Exams Verbal messages about progress
4 3 1 1 1
40% 30% 10% 10% 10%
Total 10 Sample responses
• The teachers use the tracking information included in the software package of the program. • Students are assessed in the beginning and the end of the school year and quarterly. • Principal is notified via evaluations regarding the students’ progress. • Nine different exams are used to assess students. In addition, students are tested every nine weeks. • The principal relies on verbal messages from the teachers regarding students’ progress.

LRSD READ 180 Final Report Page 130
What are the best aspects of the READ 180 program? Response categories # of responses % of responses Individualized tutoring/Small groups Computer Program holds students’ attention Students and teachers can track progress Variety of teaching strategies Teacher training Longer duration than standard English class Staff and student interest in content User friendliness Practical approach Skill improvement
4 3 2 2 2 1 1 1 1 1 1
21% 16% 11% 11% 11% 5% 5% 5% 5% 5% 5%
Total 19 Sample responses
• The staff believes that the program meets the students at their current reading level. • The use of computers enhances the program. • The students are not restless because of the various multi-tasks, such as reading, computer instruction, and
group interaction. • Staff is able to assess the students more frequently. Therefore, during the class the teacher is able to make
changes according to the students’ progress. • The variety of teaching strategies utilized to connect with the students. It is the perfect model for a 90-
minute block. • Teachers are trained using the program. There is a prescriptive method to using the program. • READ 180 program consists of two block hours rather than one block. Therefore, students have the
program longer than a Standard English course. • Staff and students have a high interest in the program. • READ 180 is user friendly. • Staff loves the program because it’s hands-on approach to learning. • READ 180 has improved the students’ vocabulary, reading, and comprehension.
What are the worst aspects of the READ 180 program? Response categories # of responses % of responses Technical problems Bad marketing/Image Cost Progress data exchange Time None noted
3 2 2 1 1 1
30% 20% 20% 10% 10% 10%
Total 10 Sample responses
• Staff complained about technology problems with the computers. • More education is needed for the parents and the remaining staffs in order to help them better
understand the program. • As a result of the program’s success, the staff would like to offer the program to more students.
However, the READ 180 program is very expensive. • Ensuring that everyone maintains data regarding students’ progress. • The staff would like to teach the READ 180 program and the Standard English curriculum. However,
there is not enough time in the day to teach both.

LRSD READ 180 Final Report Page 131
How could your school’s use of the READ 180 be improved? Response categories # of responses % of responses Benchmarking scores are not received in time Making it an after-school program Larger book selection Implement transition More training Qualified assistant Utilizing teachers’ skills more Examples for use of monitoring forms Improve technology
2 1 1 1 1 1 1 1 1
20% 10% 10% 10% 10% 10% 10% 10% 10%
Total 10
• Staff stated at times the state benchmarking results are not received in time. Therefore, some students enrolled in READ 180 are taken out and placed in a Standard English class. Scores need to be released in a timely manner for schools.
• The staff would value having the program implemented in the Extended Day Program. The Extended Day program is a program that conducts after-school programming four days a week.
• Staff would like to enhance the program by refreshing the reading library with more current books. • Transition for students from the READ 180 program is not easy because of the connection between
English 1 (9th grade) and English 2 (10th grade). READ 180 classes are smaller and there is more time for individual learning.
• More training for the staff is needed. • An assistant is needed for the classroom in order to assist the teacher with keeping students on task. • The school has a great READ 180 teacher. However, next year the school would like to utilize more of
her skills and training. • Staff would welcome some examples from other schools on the use and development of monitoring
forms for the assessment of the program. • Principal mentioned that the technology could be improved. Principal stated that teachers needed to be
in control of the technology.