literature review on community cohesion and community ... · cohesion and community severance:...
TRANSCRIPT
Literature Review on
Community Cohesion and Community Severance:
Definitions and Indicators for
Transport Planning and Monitoring
Report to New Zealand Transport Agency
June 2011
Prepared by Robert Quigley and Louise Thornley,
Quigley and Watts Ltd

2
Table of Contents
Acknowledgements ................................................................................................................. 3
1 Key Points ......................................................................................................................... 4
2 Introduction....................................................................................................................... 6
3 Methods............................................................................................................................. 7
3.1 Review questions ...........................................................................................................7
3.2 Search strategy ..............................................................................................................7
3.3 Results of search strategy ..............................................................................................9
3.4 Limitations of this review.................................................................................................9
4 Findings of the review .....................................................................................................11
4.1 Introduction to definitions........................................................................................11
4.2 Definitions of community severance and similar concepts ......................................11
4.3 Towards a relevant definition of community severance for the New Zealand Transport
Sector.................................................................................................................................14
4.4 Methods and tools for measuring community severance ........................................15
4.5 Towards a relevant assessment approach for community severance in the New
Zealand Transport Sector. ..................................................................................................21
4.6 Indicators used to measure community severance and related terms.....................23
4.7 Definitions of community cohesion and similar concepts ........................................27
4.8 Methods and tools for measuring community cohesion and social connectedness .32
4.9 Indicators used to measure community cohesion and social connectedness..........35
4.10 Consideration of indicators to measure community cohesion and social
connectedness in a transport context .................................................................................38
5 References .......................................................................................................................39
Appendix 1 – Classification of facilities (Clark et al, 1991) ..................................................41
Appendix 2 – Classification of severance effects, Department of Transport, UK (1993) ...42
Appendix 3. New Zealand documents and road assessment reports that describe community severance. ...........................................................................................................44
Appendix 4 – NZTA suggestions for ways to assess connectivity. ....................................46
Appendix 5 – NZTA suggestions on monitoring techniques for pedestrians.....................47
Appendix 6 – NZTA suggestions for potential walking indicators: .....................................48
Appendix 7 – Accessibility planning. ....................................................................................49

3
Acknowledgements
The authors wish to acknowledge the valuable assistance received from the following
sources:
� New Zealand Transport Agency for funding this work.
� Balt Gregorius and Carl Reller (New Zealand Transport Agency) for their continued
interest in expanding understanding about community cohesion and community
severance.
� Balt Gregorius for peer review.
� Martin Ward for contacting colleagues who offered suggestions on potential literature
and for peer review.
� Susan Chapman and Jacqueline Blake from the New Zealand Transport Agency for
providing an up to date description of accessibility planning (Appendix 7).
Suggested reference: Quigley R and Thornley L (2011). Literature Review on Community
Cohesion and Community Severance: Definitions and Indicators for Transport Planning and
Monitoring. Wellington: Quigley and Watts Ltd.

4
1 Key Points
• There is a variety of understandings of community severance and social connectedness,
the terms being used interchangeably at times, used in different ways and in different
contexts
• Overall both community severance and community cohesion are not currently well
addressed in practice by the transport sector
• Community severance guidance is described in the literature, and recommended for
assessing transport projects.
• Community severance is not described in the literature, or recommended, regarding
monitoring at a regional or national level.
• Community severance is generally perceived as a negative term, about not walking, not
bicycling etc.
• Community cohesion and social connectedness has little mention in transport sector
research/literature.
• Community cohesion guidance does not exist in the literature for assessing transport
projects, nor is it recommended.
• Community cohesion is not described in the literature regarding monitoring at a regional or
national level, though the authors of this review recommend it is monitored.
• There is learning and applicability from other sectors regarding community cohesion or
social connectedness indicators, especially the local government sector.
• Community cohesion is generally perceived as a positive term, about belonging to a
community, about having life opportunities, etc.
• Community cohesion and community severance appear to measure quite different
aspects, on differing ends of a wide spectrum. The reverse of one does not necessarily
produce/measure the other.
• Definitions that we recommend for consideration for use in the New Zealand Transport
sector include:
Community Severance - ‘Separation of people from facilities, services and
social networks they wish to use within their community; changes in comfort
and attractiveness of areas; and/or people changing travel patterns due to the
physical, traffic flow and/or psychological barriers created by transport corridors
and their use.’
Community Cohesion – ‘A state of togetherness and unity across diverse
people in the community, with social engagement, participation and shared
values. A cohesive and integrated community is characterised by equality of
opportunity, citizen awareness of rights and responsibilities, and high levels of
trust in each other and local institutions.’

5
Social Connectedness – ‘The social interactions, relationships and networks that people have with others and the benefits these relationships can bring to the individual as well as to society.’ It can be viewed as one aspect of community cohesion.
� It is recommended that NZTA focuses initially on the term ‘social connectedness’ rather than social connectivity or community cohesion, as social connectedness is an aspect of, and a marker for, the broader concept of community cohesion.
� To encourage further discussion within the New Zealand transport sector and local government sector about appropriate ways to assess community severance, we suggest the following approach be trialled and evaluated:
1. Define the facilities to which access is typically desired – health, education, services, social, leisure, shops and transport facilities (example UK list in Appendix 1 that would need modification to a New Zealand context).
2. Define facility catchment areas from which users may be drawn – boundaries to catchment areas should be halfway between the existence of the nearest alternative
3. Estimate the total and vulnerable populations within those areas
� groups without full mobility (mobility-restricted older people; families with preschool children, people with disabilities who have restricted mobility)
� groups with a need for safety (school children (accompanied and unaccompanied); people with disabilities and all other adults (who also need safety)
� groups depending on the locality (ethnic groups; low income households)
� Maori and Pacific populations
4. Assessment would then entail:
� a qualitative assessment by contractors/field workers and representatives of the community (clubs, societies, iwi etc) of difficulties likely to be encountered for each of the above groups regarding crossing and travelling along roads;
� describing changes in comfort and attractiveness of local area – described qualitatively by field officer. Also include data from other assessments such as noise, air quality, visual quality, vibration and infrastructure.
� counting the number of trips made to each of the specified facilities, and use of origin/destination surveys for each of the above groups.
� purposive sampling of vulnerable groups to ensure representation (see Bradbury, 2007)
� mapping of above data; together with all new roads, roads removed and/or roads with additional traffic flow (arbitrarily set at 30% change).
� assessment of changes in travel on a route by route basis assuming people will travel to the nearest destination via the shortest route. A calculation of the number of people affected from each subgroup and the magnitude of effect would be provided (of new severance or relief from severance). That can be further summarised into categories of slight; moderate and severe (see Appendix 2 for UK example that would need to be modified for New Zealand.

6
Modification should consider weighting for additional impact on children as per Swedish National Road Association, 1986).
• Indicators of social connectedness already being used in New Zealand are a useful
starting point for considering appropriate and useable indicators for social connectedness
in the transport sector. As social connectedness is a marker for, and an element of, the
broader concept of community cohesion, it would be a more feasible initial goal than
attempting to measure the full concept of community cohesion.
• There is a need for research into community cohesion and social connectedness in the
transport context. For example, filling information gaps as they become apparent during
the trialling of community severance assessment; and generation of willingness to pay and
willingness to accept values for different transport elements to allow quantification of
community severance; for further development of indicators at the national level; and
indicators for measurement during local level assessments
• We provide a description of potential indicators for social connectedness at the national or
regional level; and for community severance during project-level assessment.
2 Introduction
The New Zealand Transport Agency (NZTA) contracted Quigley and Watts Ltd to carry out a rapid literature review. The purpose of the literature review was to provide an understanding of the definitions, methods, measures and indicators of community cohesion and community severance that could be used when planning and designing roads or monitoring their impacts. At the time of commissioning this review, NZTA was reviewing the post-implementation review process for major roading projects such as the Roads of National Significance. These Roads of National Significance are designed to have impacts beyond the road corridor itself. The literature review was requested within that context.
Major road projects bring a variety of economic, social, environmental and community benefits, and they may also have some disbenefits. Having a full understanding of both benefits and disbenefits is an integral aspect of rigorous transport planning and monitoring in New Zealand and in other jurisdictions. An area where the social benefits and disbenefits are poorly understood internationally is how transport projects affect community cohesion and community severance.
It is well known that the construction of major new roads can result in severance effects potentially leading to a reduction in community cohesion. A prominent recent example in New Zealand was the severance of a refugee community in Auckland with the construction of SH20 Mt Roskill Extension. Yet new roads also present opportunities to introduce or support activities to enhance community cohesion through the addition of cycle or walk ways, or for placing existing roads underground in trenches/tunnels, for example. The Waterview Extension is a current example of a New Zealand road that may improve some aspects of community cohesion. As described by Tate (1997), community severance indicators have typically fallen into two groups: those that consider the cohesiveness of communities; and those that consider the accessibility or mobility of communities. Hence our review attempts to review both concepts in a single document.
7
Critics of new major road projects commonly focus on potential impacts on community severance and community cohesion, but neither of these effects have been a focus of the transport sector. Without good understanding of all issues related to community severance and cohesion, opportunities to reduce impacts and develop creative solutions are likely being missed. Some major road projects are likely to improve community cohesion for most of the community, and some road projects for some members of the community. Finding out who benefits, how and how much would greatly assist planners in guiding the design, funding and monitoring process and help ensure cost benefit analyses for project approvals are more complete.
While planners involved with major road projects generally understand that community cohesion is an issue, they struggle to apply a rigorous approach to the assessment of baseline data, prediction of potential change in effects or in the post implementation monitoring of community cohesion or community severance. Also, those set the task of monitoring are left with little information about what to measure. A carefully designed literature scan has been proposed as a first step to provide them with an understanding of the definitions, methods and indicators needed to plan and design roads, and to monitor outcomes that will contribute to community cohesion and community severance.
3 Methods
This section outlines the methods used in this scan of the literature including the search strategy and selection of papers, and extraction and synthesis of data.
The review was rapid due to its scope and budget. In contrast to a comprehensive or systematic review, a rapid review is more limited in scope and relies on less extensive search methods. However, some principles of systematic review methodology were used such as transparency, replicability and use of agreed standard selection criteria for inclusion and exclusion.
3.1 Review questions
The review aimed to identify, review and summarise international and local literature and evidence-based best-practice indicators and definitions on community cohesion/severance. The research questions of the review were:
1) What are the definitions used for the terms community cohesion and community severance in New Zealand and internationally? (New Zealand transport uses were the primary focus, however other definitions from non-transport sectors were also sought as well as international concepts).
2) What tools, methods and indicators are used to monitor/measure factors that contribute to community cohesion and community severance?
3.2 Search strategy
The following search strategy, including selection criteria, was developed in conjunction with NZTA. Articles were primarily retrieved from electronic databases, journals and websites. These sources are listed below:
Databases and search engines
Ovid (MEDLINE, PsycINFO, CINAHL), Proquest, Scopus, Web of Science – Social Science Citation Index (via Web of Knowledge), Cochrane Database of Systematic

8
Reviews (CDSR), Campbell Collaboration, EBSCO, Google Scholar, Google advanced (for grey literature)
Websites The following websites were searched by using online search functions and browsing:
New Zealand Transport Agency
New Zealand Ministry of Health
National Health Committee of New Zealand
Victorian Transport Policy Institute, (Canada)
Transport Research Laboratory (UK)
UK Department for Transport – including webtag.org (UK)
Transportation Research Board of the National Academies (USA)
World Health Organization (Switzerland)
Centers for Disease Control and Prevention (USA)
HIA Gateway (UK).
Swedish Transport Research Institute (VTI) (Sweden)
Campaign to Protect Rural England (UK)
Campaign for Better Transport (UK
European Transport Conference Website, 2007.
The CIHT Manual for Streets 2.
VicRoads or ARRB Ltd (former research board) in Australia
Rudi.net (UK)
TREK project at the University of Western Australia (Australia)
Robert Wood Johnston Foundation, Active Living Research (USA)
American Society of Civil Engineers Library (USA)
Living Streets (UK)
Road Safety Analysis Ltd (UK)
Pedestrian and Bicycle Information Centre: Walkinginfo.org (USA)
Highway Safety Research Center, University of North Carolina (USA)
The following experts were searched for specifically:
• Dr Fergus Tate
• Bruce Appleyard
• Donald Appleyard
Search terms
The following search terms were used:
Population: [pedestrian OR walk OR nonmotoriz(s)ed], OR (bi)cycle OR [vehicle OR car OR automobile OR motorist OR driving].
OR

9
Intermediate factor: [litter] OR [noise] OR [cycleway OR cycle path] OR[footpath] OR [walkway] or [*bridge*] or [road OR street] OR [alley] OR [underpass*]
AND
Outcome [severance OR barrier effect] OR [mobility] OR [accessibility] OR [cohesion] OR [connectivity] OR [transport] OR [roading]
Selection criteria
To undertake a focused and transparent review, inclusion criteria were established to screen potential papers and documents for relevance prior to their selection:
Inclusion criteria
• Published 1980 onwards
• English language
• Focus on indicators, approaches and tools; and evidence-informed expert opinion on best practice
3.3 Results of search strategy
The results of the selection process were as follows:
• Initial selection of 104 papers, including grey literature.
• The full text was located for each of the 104 papers; following application of the selection criteria to these papers, 53 were excluded.
• This process resulted in 51 papers being selected for inclusion in this review.
The final list of included papers is noted in the reference list.
Data extraction and synthesis
Two reviewers drew out the essential information about study characteristics and findings from the 51 included papers into an Excel table or Word document where appropriate.
In the data synthesis stage, the reviewers analysed the findings and assessed the strength of evidence. The data synthesis process primarily used a qualitative assessment to summarise and assess the evidence, drawing on the reviewer’s expertise and experience. The research objectives guided decisions on the grouping and tabulating of the information. The final stage of the data synthesis stage was to write a description of the review’s findings as a whole.
3.4 Limitations of this review
This review was limited in scope, and did not use a comprehensive or fully systematic process. The time frame and budget for the review was modest and demanded a rapid approach to identifying and summarising key findings from the literature.
A formal quality assessment process was not carried out, however the reviewers recorded strengths and limitations of each paper when extracting the data, and this was taken into

10
account in the analysis. In addition, many papers reported reviews of evidence which did include consideration of quality issues and had conducted systematic quality assessment.
The majority of findings are from the UK and Canada. The potential applicability of these and other international findings to the New Zealand context is not well established. Accessibility planning was specifically excluded from the search as there is a very substantial literature already in existence, though a brief comment about accessibility planning is included in Appendix 7.

11
4 Findings of the review
The findings are structured as follows:
� Community severance – definitions, measurement, indicators
� Community cohesion – definitions, measurement, indicators
� Recommended/suggested definitions and measurement issues
4.1 Introduction to definitions
The definitions for the terms ‘community severance’ and ‘community cohesion’ differ between agencies and between countries. Subsequently it is easy to understand how two people might have a conversation about community severance or cohesion and each person might talk about different things, even while using the same term.
Importantly for planning and monitoring, the definition typically sets what is studied in any situation. If a narrow definition is used, then community severance or cohesion becomes a more narrow construct and can be studied using one or two indicators. If a broader definition is used, then additional elements can be studied. In the case of community severance in a transport decision making process, the definition used allows more, or less, information to be provided to the decision maker. There are also examples of community severance where no definition has been provided therefore allowing the decision maker or monitoring agency to present little, any, or no data to underpin statements about community severance. This was summed up by Clark et al (1991) who wrote:
“community severance has received insufficient attention due to a lack of
understanding of a complex issue.”
In general terms, urban planners and transport engineers conceptualise community severance as an outcome of traffic infrastructure (Tate, 1997, Bradbury et al, 2007). In contrast, public health researchers consider it as an intermediary on the pathway between transport and resultant health effects. (Egan et al, 2003, Watkiss et al, 2000) These differences pose difficulties for those interested in the measurement of community severance.
4.2 Definitions of community severance and similar concepts
Historical definitions of community severance are available in Clark et al (1991) but in the interest of brevity we have presented contemporary definitions from 1980 onwards as that is the time period for which most research has occurred. There is no single agreed international definition of community severance and those listed below give a flavour of how community severance and other concepts capture a variety of very real and observable impacts (Table 1).
Table 1. Contemporary definitions of community severance in the literature
Definition Source
The separation of residents from facilities and services they use within their
community, from friends and relations and perhaps from place of work as a
result of changes in road patterns and traffic levels.
Department of Transport Manual of
Environmental Appraisal, 1983.
Government guidance.
Separation of adjacent areas by road or rail infrastructure or heavy traffic, Standing Advisory Committee on

12
causing negative impact on human beings or flora and fauna. Trunk Road Assessment, UK, 1986.
Government research.
The sum of the divisive effects a road has on those in the locality. Clark et al, UK, 1991. Government
research.
The separation of residents from facilities and services they use within their
community caused by new or improved roads or by changes in traffic flows.
Highways Agency, UK, 1993.
Government guidance.
The range of community effects from small increases in journey lengths or
times through to the situation where journeys are no longer made, or
alternative facilities are visited because of the additional inconvenience,
delay or danger caused by the barrier or because the barrier is perceived to
be impassable.
Chinn and Davies, 1995.
Government research.
The divisive effects that result from the provision and use of transport
infrastructure.
Tate et al, 1997, New Zealand.
Government research.
Separation of people from facilities and services they wish to use within
their community due to obstacles to access such as busy roads.
NZ Transport Agency, 2009, New
Zealand. Pedestrian and planning
guidance.
The dislocation and alienation a community feels as a result of roads which
sever communities or hinder access
Transfund New Zealand Project
Evaluation Manual 1995)
The positive or negative effects of a scheme on the ability to move around
on foot bicycle or horseback. It reflects in particular the improvement in or
deterioration of the ability of the community to cross major road or rail links
and thereby reach local destinations.
Scottish Executive, 2001, Scotland.
Government guidance.
Reduced access to local amenities and disruption of social networks caused
by a road running through a community
Scottish Health Impact Assessment
Network (2008) in Thomson et al
(2008)
The impact of high levels of traffic on the 'liveability' of a street. Where traffic
dominates a street environment, the noise, danger, and physical obstacle of
a 'river of traffic', can lower the quality of life and sense of community by
preventing children playing outside, making it difficult for neighbours to
meet, talk, and walk.
UK House of Commons. Seventh
Select Committee Report on
Transport.
The impacts of new or wider highways. Litman et al, Victoria Transport
Policy Institute, 2010, Canada.
Chapter in web book.
Other authors split community severance into several sub components/dimensions and
defined those, presented in Table 2.
Table 2. Definitions of sub-components of community severance
Term Definition Source
Physical
severance
The physical changes to the ability of people to move around
the locality, particularly on foot or by bicycle
Read and Cramphorn,
2001. Research paper.
Physical
severance:
mobility
The ability of an individual or type of individual to move about
[includes both individual attributes such as ability to walk or
drive; and transport attributes such as transport system
performance].
Tate, 1993, New Zealand.
Research paper
Static severance A man-made [physical] structure that artificially divides an area
into two separate parts so that it is difficult for one side to
interact with another.
Guo and Black, 2000,
Australia. Research paper.
Dynamic
severance
Traffic flow along a road acting as a dynamic barrier impeding
the movement of pedestrians crossing the road.
Guo and Black, 2000,
Australia. Research paper.

13
Land-locked
communities
A community with a barrier that had to be crossed on each
occasion to reach a service, substitution of services was not
possible
Kirby, 1981, Australia.
Road assessment inquiry.
Bisected
communities
A community with a barrier that did not have to be crossed to
reach a ‘substitute’ service, by definition a second best service
Kirby, 1981, Australia.
Road assessment inquiry.
Physical
severance:
accessibility
The opportunity that an individual, or type of person, at a given
location possesses to take part in a particular activity or set of
activities.
Tate, 1993, New Zealand.
Research paper
Social severance The wider social effects arising from physical severance Read and Cramphorn,
2001. Research paper.
Psychological
severance
Feeling of being cut off [to a facility or community]. Tate, 1993, New Zealand.
Research paper
Physical
severance:
amenity issues
The development of a feeling of general unease from real or
perceived effects. For example, perceived danger, noise,
pollution, visual intrusion, unpleasantness, lifestyle disruption
and pedestrian delay.
Tate, 1993, New Zealand.
Research paper
Barrier effect Delays, discomfort and lack of access that vehicle traffic
imposes on pedestrians and cyclists.
Victoria Transport Policy
Institute, 2010, Canada.
Chapter in web book.
Throughout the reviewed documents, authors described similar types of barriers and we have
summarised them as:
� Roading that severs a locality due to fencing, kerbing, centre-line barriers, bunds,
ditches, plantings, etc. (physical barrier)
� Roading that severs a locality and can be crossed (at specific crossing points or along
the length of the road when traffic flow allows) (traffic flow barrier).
� Roading that is unpleasant producing a psychological barrier to travelling across, along
or near that road (psychological barrier).
These barriers are not mutually exclusive. For example, an urban road could be perceived to
be a physical, traffic flow and psychological barrier by one individual, yet just a traffic flow
barrier by another individual.
These barriers cause certain intermediate outcomes that are experienced by pedestrians,
cyclists and equestrian users, which authors describe in their definitions. We believe these
can be categorised as:
� Amenity outcomes related to the local area: perceived danger (accidents, crime),
traffic noise, traffic pollution, visual intrusion, overall unpleasantness; feeling of
unease; discomfort;
� Trip changes/moving about outcomes: trip delay, trip lengthening/diversion; mode
change; trip suppression/trip no longer made; alternative destinations visited; positive
or negative effects of a scheme on ability to move around on foot, bicycle or
horseback; impeding movement of pedestrians crossing the road;
� Separation from facilities, services and social network outcomes: separation from
facilities and services; separation from friends and relations; separation from work;
inability to cross roads to reach local destinations; feeling of being cut off; lack of

14
access; use of cars to overcome severance reducing face:face interaction with
neighbours; inability to take part in a particular activity.
These intermediate outcomes may then have longer term outcomes that are not typically
described in the literature, such as health outcomes, economic outcomes, other social
outcomes and cultural outcomes. These have not been explored as part of this review as they
are out of scope.
It is worth noting that some definitions:
� explicitly acknowledge real or perceived changes;
� explicitly describe a population of interest, e.g. residents. Thereby excluding all others.
Or offer wider populations of interest such as ‘those in a locality’, ‘their community’;
� explicitly acknowledge effects can be from new roads, or from improved roads, or from
changes in traffic flows on existing roads.
� are time specified, acknowledging that a road may be harder to cross at peak-traffic
flow than at other times; that quiet roads at night allow speeding and subsequent loud
noise.
� acknowledge that where pedestrian and bicycle traffic incur severance effects, so will
motorised traffic on those same routes (but to lesser or greater degrees)
� implicitly acknowledge that severance already exists in some situations (and so
baseline is not zero)
� explicitly acknowledge that severance can be reduced
4.3 Towards a relevant definition of community severance for the New
Zealand Transport Sector.
Tate (1997) notes that
“A simple catchall definition is not considered to be particularly useful when attempting to determine and compare the magnitude of severance effects”.
Yet Tate then went on to propose one of the most simplest catchall definitions in the international literature:
“The divisive effects that result from the provision and use of transport infrastructure.”
While a simple catchall definition does allow incredibly wide scope for information to be collected for planning/assessment or monitoring – from the use of such phrases as ‘divisive effects’ (Tate et al, 1997) or “the impacts of new or wider highways” (Litman et al, 2010). Such phrases retain a fundamental problem – that community severance can mean different things to different people and are inexplicit.
Without an explicit definition, those charged with monitoring or assessing could therefore do as little or as much as they like regarding community severance. This is certainly the case in the New Zealand documents and road assessments that we have sourced for this review. Most have not defined community severance (see Appendix 3). We therefore argue for a definition that explicitly reflects the complexity above, but also reflects the simplicity of the
15
most recent New Zealand transport sector definition1 (NZTA, 2009). We suggest that the New Zealand transport sector consider using the following definition that we have devised:
‘Separation of people from facilities, services and social networks they wish to
use within their community; changes in comfort and attractiveness of areas;
and/or people changing travel patterns due to the physical, traffic flow and/or
psychological barriers created by transport corridors and their use.’
The definition above captures the main aspects of community severance, is simple, yet describes the complexity of what is attempting to be measured.
4.4 Methods and tools for measuring community severance
When searching the literature for methods, tools and indicators to measure community cohesion and community severance, it was clear that two distinct types of measurement were described. Firstly, those measuring a baseline of community cohesion or severance. And secondly, those taking that baseline information and manipulating it in some way to predict future community cohesion and severance. Both components are critical for assessment studies, where a new road is proposed and a contractor may be required to not only assess baseline community severance, but also predict future community severance if a road option proceeds. Only the baseline data is needed for an indicator for monitoring however.
The methods and tools described below are largely assessment procedures recommended in various countries used to assess the potential community severance impacts of a proposed new road, or change in traffic conditions to an existing road. As such they have approaches that determine the baseline (existing situation); and then attempt to predict changes to the baseline via manipulation of existing data. To manipulate the existing data, new data to inform the assumptions underpinning the data manipulation is required.
4.4.1 The Manual of Environmental Appraisal (1983, Department of Transport, UK)
This manual sets out a process for undertaking an environmental appraisal of new transport projects in the United Kingdom. It lists 11 impacts, one of which is community severance. The manual suggests that roads will not only create new severance but also ‘heal some divisions’, thereby reducing community severance. The manual suggests that the two effects, working in opposite directions, should not be allowed to offset each other. Instead, each should be described separately. The manual describes a qualitative approach that delivers a four stage classification of severance – none, slight, moderate, severe. Despite a wide definition of severance, the data collected is:
� changes in pedestrian distances to key facilities, and
� changes in vehicle journey times to key facilities.
Field officers using their local knowledge or via interviews with facility managers determine the number of people likely affected from the local community.
1 Separation of people from facilities and services they wish to use within their community due to obstacles to
access such as busy roads (NZTA, 2009. Pedestrian Planning Guidance)

16
4.4.2 Standing Advisory Committee for Trunk Road Appraisal (1986, UK)
SACTRA left the basic appraisal structure of the Manual for Environmental Appraisal (above) intact, but made two additional recommendations for community severance:
� Delays to pedestrians as a symptom of severance should be included within the economic evaluation.
� Particular attention should be placed on vulnerable groups in society, particularly focusing on access to facilities required by such groups living within particular catchments [areas]. The size of relative disadvantage could then be described.
A worked example was described in the document, and unfortunately severance was poorly dealt with in the economic evaluation where pedestrian delay was not modelled on a matrix of trips, but instead specific crossing points on the main street. Vehicle trips were modelled using a matrix of trips. Also, the catchment area for vulnerable groups was described as that within half a mile of the town centre, which one reviewer described as an arbitrary cut-off that is more likely to relate to the distances central city car drivers would walk after parking their cars, rather than real-life catchments of vulnerable groups (Clark et al, 1991).
4.4.3 London Assessment Studies (1986)
The Department of Transport commissioned groups of consultants to assess four parts of London and each covered community severance in some manner, but on existing infrastructure, not planned new infrastructure. Key methodological components included in different studies were:
� Two studies defined populations and sub-population groups that were most likely to be vulnerable. This was combined with lists of facilities (post offices, doctors, railway stations, shops, hospitals etc) to which groups would most likely require access. Trip beginnings and ends were therefore described, but actual measurement or estimation of numbers of trips was not done. Instead it was a theoretical ‘propensity for severance’ that was qualitatively described, rather than actual severance.
� In one study, the list of facilities (described as attractors) was split into four groups based on the volume of pedestrians using them.
� One study focused on delays at crossing points – counting and classifying the physical attributes of pedestrian crossings. From this they identified crossing points that were a current problem.
� Two studies used a 400m reasonable walking distance to community facilities to describe the catchment. The reviewers were ‘unhappy with this definition’ as they believed the variance about the mean would likely be large and that substantial numbers of people would be disregarded. They also thought 400m would be an overestimate in high density areas and an underestimate in others (Clark et al 1991). Both studies used the number of people within the defined catchment but on the wrong side of the road link to define gross severance. This severance was then related to trip length to give a severance density.

17
4.4.4 Appraisal of community severance (Transport Research Laboratory, 1991)
This report (Clarke et al, 1991) drew on the previous studies above and described three essential components for assessing potential community severance:
1. Defining the facilities to which access is potentially impaired – health, education, services, social, leisure, shops and transport facilities (full list in Appendix 1). The authors noted that within the London studies when a reduced list was used, underestimation of community severance was described.
2. Defining facility catchment areas from which users may be drawn – boundaries to catchment areas should be halfway between the existence of the nearest alternatives and not be bound by 400m limits
3. Estimating the total and vulnerable populations within those areas
- groups without full mobility (those aged over 70 years; families with preschool children; wheelchair users)
- groups with a need for safety (school children; people with disabilities; other adults)
- groups depending on the locality (ethnic groups; low income households)
- other less vulnerable groups (while not as vulnerable as the groups above, the balance of the population is not invulnerable).
Assessment would then entail:
� understanding the numbers of people in each vulnerable category;
� a qualitative assessment by field officers of difficulties likely to be encountered (as in the Manual of Environmental Assessment);
� counting the number of trips made to each of the specified facilities
Again, this would be a theoretical ‘propensity for severance’ that was qualitatively described (but in more detail than previous studies), rather than actual severance. This would avoid the additional work of having to map individual trips that the author suggests would add little to the qualitative manner of results.
4.4.5 Proposal for a severance index (1991, Transport Research Ltd, UK)
Clarke et al (1991) proposed a severance index be developed. It appears not to have occurred and would have required substantial, though finite resources. It was to use the work above as a framework and then multiplied that data firstly against traffic density of the road and multiplied it secondly against the presence and acceptability of mitigation factors. It would produce a separate index for each facility and for each vulnerable group, allowing the scores to be summed to give a total score for each scheme.

18
4.4.6 Design Manual for Roads and Bridges Part II Environmental Assessment (1993, Department of Transport, UK)
This manual replaced previous assessment requirements in the UK for new transport projects. This section of the manual is still current as of April 2011. The manual describes a three step process relevant to community severance, to:
� map journey length and local travel patterns using two different methods:
o identify catchments of key facilities and count pedestrian movements at important locations, with a particular focus on children, the elderly and other groups with reduced mobility.
o measure travel via origin and destination surveys at important locations, with a particular focus on children, the elderly and other groups with reduced mobility
These are then drawn on a map together with all roads for which traffic volumes will change by more than 30% (arbitrary number). Changes in travel are assessed on a route by route basis assuming people will travel to the nearest destination via the shortest route.
� describe changes in amenity – described qualitatively by field officer;
� determine new severance or relief from existing severance – on analysis of the information from the two steps above, a calculation of the number of people affected and the magnitude of effect is provided. That is further summarised into categories of slight; moderate and severe (see Appendix 2 for example).
4.4.7 Barrier effect and risk perception effect (1992, Road Directorate, Denmark)
Tate (1997) describes a quantitative severance assessment undertaken in Denmark that is derived from the sum of two effects, a barrier effect and a risk perception effect. The final numeric is monetised to give the economic cost of severance, although the basis for this valuation is not presented. Data required for the calculation include:
� average daily traffic;
� proportion of heavy vehicles;
� number of pedestrian crossings, subways or other facilities;
� length of road
� average traffic speed
� weighting of relative importance of various land uses, i.e. it is 4 times more important to cross the road to access shops than a recreation space;
� “risk impact adjustment factors” for cyclists and vehicles that are arbitrarily set at 50% of the value of noise nuisance effect.
Tate (1997) describes that no distinction is made between more or less sensitive users. Despite the highly complex mathematical formulas used to calculate severance Tate (1997) states ‘Not surprisingly […] the valuation of severance effects were approximately half the value of noise”. Presumably he is referring back to the arbitrary risk impact adjustment factor that is set at 50%, implying that it is the determining variable.

19
4.4.8 Assessing Barrier Effects (Swedish National Road Administration, 1986, Sweden)
Tate (1997) describes a quantitative barrier effect assessment undertaken in Sweden derived from the sum of two effects, the disturbance resulting from a barrier to transverse movements and a longitudinal barrier effect on cyclists travelling down the road being passed by moving traffic. The final numeric is monetised to give the economic cost of severance. Substantial data is required for the complex calculations. Tate (1997) could not gain access to the full methods, and this may explain why the equations presented do not have all of the equation terms described and are therefore not possible to describe here fully. As with the Danish work, correction factors and numerous other ‘weights’ built into the equations would likely have a greater impact on the final result than the direct data itself.
The monetisation of the final numeric is different for different ages. The value of the disturbance for those aged 7-9 years is four times higher than the value of disturbance for those aged 13-65 years. Tate (1997) believed that this was because when a barrier is imposed, children aged 7-9 years must either abandon their journey or be accompanied by an adult. He states ‘A child’s trip to school is essentially inelastic. If due to increased traffic volumes a child is not allowed to walk unaccompanied the alternative is a change of mode to an escorted journey”. Obviously the escorted trip could be via the same mode, i.e. accompanied walking, or via a new mode, such as vehicle travel by the parent and child. He also describes that some trips are likely to be more elastic than others. School trips must be taken (inelastic), whereas trips to the park would be more likely to be elastic, and therefore suppressed if a new barrier is presented.
4.4.9 A proposed New Zealand Evaluation Framework (1997)
Tate (1997) was funded by Transfund New Zealand to set out the beginnings of a framework for the evaluation of community severance in New Zealand. He concluded by stating it needed pilot testing and some of the information gaps likely to be encountered required research to fill them before proceeding. It does not appear that the framework was adopted. The framework had a three step process:
1. Identify and map key destinations and catchments, particularly for young children and the elderly. Community consultation was recommended to identify additional walking patterns and to generate a community concern model based on data collected from parents about whether they would allow a child to cross a road unaccompanied. The purpose of this was to identify areas where social severance may be a problem.
2. Observe or use surveys to determine current trip patterns. Trip patterns and crossing movements are classified for different users groups such as children (accompanied and unaccompanied), elderly, those mobility impaired and adults. Calculations are then used to determine the ‘change’ in trip patterns if assessing a new road. However ‘barrier effect’ and ‘potential need’ are part of those equations and these terms are not described.
3. Calculate the probability of a child being allowed to cross the road unaccompanied. This requires data on the age of the child, average weekday traffic, mean spot speed of traffic and survey data from parents about whether they would allow their child to cross a particular road unaccompanied.

20
4.4.10 Quantifying the social severance impact of roads: A proposed New Zealand approach (2001)
Read and Cramphorn (2001) were commissioned by Transfund New Zealand to suggest an approach for quantifying the social severance impact of roads. This work described an approach based on willingness to pay and willingness to accept values that would need to be generated for different elements of road projects, for both pedestrians and cyclists. Read and Cramphorn (2001) noted that the development work would be substantial and had numerous difficult issues to overcome if it is to be undertaken. It would involve focus group work to understand how people would react to road and traffic changes; and further surveys about stated preference, again asking communities how they would react to road and traffic changes. Fortunately such work would only need to be undertaken approximately every 5 years, as the results would be able to be used throughout New Zealand on multiple projects. The preferences of different population groups would be required.
Read and Cramphorn (2001) go on to suggest that the data collected above could then be used to calculate willingness to pay and willingness to accept data for each project, via complex statistical modelling.
The authors also stated ‘the internationally accepted approach to assessing physical severance is qualitative’, which would provide a broader understanding of social consequences than would be provided by the analytical framework suggested by themselves. Read and Crampton (2001) noted that the research would be expensive, but also stated that the significance of severance is unlikely to be described appropriately without some form of substantial research. We were unable to find evidence of the above research being undertaken.
4.4.11 New Zealand Transport Agency Minimum Standard (Z/19) (2011), Social and Environmental Management Form (PSF/13) (2011) and Professional Services Guide (PSG13) (2010).
The Minimum Standard Z/19 – Social and Environmental Management specifies that when identifying the social and environmental effects (including opportunities) of each road option, the consultant must undertake certain actions. Those include establishing and keeping an up to date copy of the PSF/13 (discussed below); and ‘for each new road option considered, the Consultant shall identify:
� The potential social and environmental effects of each option including opportunities to improve social and environmental outcomes; and
� The degree of potential effect (before mitigation) in the most affected area(s) of each option’.
The social and environmental issues against which each option shall be screened include several that are relevant to community severance:
� Noise � Air quality; � Social responsibility; � Visual quality; � Vibration; � Cycling infrastructure; � Cycle crossing facilities; � Walking infrastructure; � Pedestrian crossing facilities;

21
� Bus related infrastructure;
For the preferred option (and any other options required), the consultant must prepare a Social and Environmental Assessment and complete the relevant sections of the PSF/13. The term ‘severance’ is not present in Z/19 explicitly.
The PSF13 – Social and Environment Management Form is completed for each NZ Transport Agency project as part of the application to gain resource consent for a new road project. There are two stages, a social and environmental screen; and a social and environmental assessment. One of the issues (of many) that are required to be considered includes ‘Social Responsibility, e.g. social severance, social interaction, connectivity.’ No further definition of these terms exists in the document, nor in the guidance document PSG13. As can be seen from Z/19 (above), many other issues are indirectly relevant to community severance, and either directly or indirectly relevant to community cohesion.
During the social and environmental screening step, the consultant to NZTA is required to ‘Describe the potential social and environmental effects of the option, including where the option may improve social and environmental outcomes” and classify the degree of effect as high, medium, low or not applicable.
The social and environmental assessment step requires the NZTA consultant to “List all legal requirements and relevant Transit social and environmental objectives” and to “List actions to be taken to meet specific social and environmental requirements and objectives and address all effects identified. Include an estimated cost.”
Certainly these two documents (Z/19 and PSF/13) are enabling in that they provide ample scope to allow assessment of community severance and community cohesion, if and when deemed applicable. However these documents are not guidance documents for practitioners, that is presented below.
The Professional Services Guide (PSG13) provides guidance on meeting the requirements in the NZ Transport Agency’s Minimum Standard Z/19 - Social and Environmental Management (SEM) and completing the NZ Transport Agency’s Social and Environmental Management Form PSF/13. Neither community severance nor cohesion are explicitly mentioned or defined, although ‘Social Responsibility’ is one of the headings stipulated in the guidance for the screening stage. No definitions are provided. Helpfully, a completed-PSF/13 example is provided as an appendix to the guidance. Under ‘Social Responsibility’ it lists an ‘example effect’ as ‘reduced access for the community to the estuary during construction’. However, it does not describe the definition used, the data accessed or what was being assessed.
4.5 Towards a relevant assessment approach for community severance in
the New Zealand Transport Sector.
The United Kingdom has undoubtedly led the development of approaches for assessing community severance. The current assessment approach in the UK is the Design Manual for Roads and Bridges Part II Environmental Assessment (1993). Despite its age, the approach is still currently used in the UK and presents clear thinking on how to assess the complexity of community severance while not getting bogged down in the need to overly quantify or monetise benefits.
Two subsequent New Zealand pieces of work both proposed more complex modelled/monetised approaches to assess community severance. Both authors of those reports (Tate, 1997; Read and Cramphorn, 2001) commented on the difficultly and cost

22
surrounding their proposals, and noted that neither may add substantially more value than the existing assessment approaches based on qualitative interviews and surveys, basic counts and map-work. Perhaps not surprisingly, neither Tate’s (1997) nor Read and Cramphorn’s (2001) proposals have been taken up by Government.
We also agree an emphasis on quantification/monetisation would be substantial amounts of work. Given what is known from the descriptive studies around community severance, different subpopulations would have to have their willingness to pay researched separately and the scale of the research would therefore balloon rapidly. Substantial other research is required just to set the assumptions for any modelling. All that prior to research being required on each individual road project being assessed, and then the modelling itself.
Several methods have used pedestrian delay at single crossing points as a proxy for community severance. This is inadequate given that trip delay is a single factor within the definition of community severance. Rather, suggesting catchment areas, identifying relevant facilities and then identifying origins/destinations and numbers of people affected is clearly better. Several authors have suggested that a more proactive approach to gathering evidence from community members could be taken. For example, robust social research with affected, or potentially affected, users could be conducted (James et al, 2005).
The idea of a catchment ‘community’ is important and it’s likely in a mobile society such as New Zealand that people are members of more than one community, especially those who are very mobile. Community severance has been suggested to be less of an issue for highly mobile people (Tate, 1997), though they are described as ‘not invulnerable’ by Clarke et al (1991). However, for those who are less mobile (families with young children, school children, elderly and those with disabilities), the literature is clear that geographic communities are likely to be particularly important (Tate, 1997; Clarke et al, 1991). In our opinion service substitution is a far superior method than use of a 400m radius for setting catchment areas because service substitution attempts to understand the potential separation that people may have from facilities.
To encourage further discussion within the New Zealand transport sector about appropriate ways to assess community severance, we suggest a way forward:
1. Define the facilities to which access is typically desired – health, education, services, social, leisure, shops and transport facilities (example UK list in Appendix 1 that would need modification to a New Zealand context).
2. Define facility catchment areas from which users may be drawn – boundaries to catchment areas should be halfway between the existence of the nearest alternative
3. Estimate the total and vulnerable populations within those areas
� groups without full mobility (mobility-restricted older people; families with preschool children, people with disabilities who have restricted mobility)
� groups with a need for safety (school children (accompanied and unaccompanied); people with disabilities and all other adults (who also need safety)
� groups depending on the locality (ethnic groups; low income households)
� Maori and Pacific populations

23
4. Assessment would then entail:
� a qualitative assessment by contractors/field workers and representatives of the community (clubs, societies, iwi etc) of difficulties likely to be encountered for each of the above groups regarding crossing and travelling along roads;
� describing changes in comfort and attractiveness of local area – described qualitatively by field officer. Also include data from other assessments such as noise, air quality, visual quality, vibration and infrastructure.
� counting the number of trips made to each of the specified facilities, and use of origin/destination surveys for each of the above groups.
� purposive sampling of vulnerable groups to ensure representation (see Bradbury, 2007)
� mapping of above data; together with all new roads, roads removed and/or roads with additional traffic flow (arbitrarily set at 30% change).
� assessment of changes in travel on a route by route basis assuming people will travel to the nearest destination via the shortest route. A calculation of the number of people affected from each subgroup and the magnitude of effect would be provided (of new severance or relief from severance). That can be further summarised into categories of slight; moderate and severe (see Appendix 2 for UK example that would need to be modified for New Zealand. Modification should consider weighting for additional impact on children as per Swedish National Road Association, 1986).
This would provide a rich qualitative description of actual severance backed up by basic numeric counts and GIS information.
4.6 Indicators used to measure community severance and related terms
Performance indicators are essential for good transport planning. The choice of indicator affects how problems are defined and solutions evaluated. A particular policy or programme may seem desirable when measured using one type of indicator and undesirable using another (Litman 2010b). Litman (2010b) further argues that the current and future transport context requires a broad indicator set that reflects accessibility rather than mobility, and rigorously considers additional travel modes and broader impacts such as community cohesion.
Indicators are typically used to measure the current situation (baseline), and require additional information if an attempt is made to predict future situations. Indicators are also typically used for monitoring, and so can be tracked across time. We have identified potential indicators from the literature as we progressed our work. We have presented a broad set below, with indicators spanning the three key intermediate outcomes of severance: separation from facilities; trip changes; and amenity outcomes. Two documents had substantial sections on ways to collect data, they were:
4.6.1 Pedestrian Planning and Design Guide (New Zealand Transport Agency, 2007)
This guidance document describes that local areas may already have a number of strategies and plans in place that may impact on walking, such as community development plans, local area traffic management plans, neighbourhood accessibility plans, community walking plans, workplace travel plans, school travel plans, and safe routes to schools. All of these have related data needs and may be a source of data for community cohesion or severance

24
indicators/studies. The guide suggests that in Pedestrian Planning processes, data regarding ‘likely points of severance’ and ‘community severance locations and extent’ should be collected via site visits and interviews. It also describes that planners should ‘identify where walking may be expected by plotting significant trip origins and destinations, together with existing facilities (and severance)’. The guidance notes that some elements of walkability are very difficult to quantify accurately, and so ‘connectivity of the pedestrian network’ is used as a proxy measure. It suggests identifying and assessing the routes between potential walking trip origins and destinations and suggests several ways to assess connectivity (Appendix 4). The guidance also has a whole section on monitoring pedestrian movements (Appendix 5) and suggestions for walking indicators (Appendix 6).
4.6.2 The Federal Highway Administration of the US Department of Transportation (2005)
This document provides information on the methods and optimum timing for pedestrian and bicycle data collection; emerging technologies that can be used to gather and analyze data; and benefits, limitations, and costs of different techniques.
4.6.3 Transport Monitoring Indicator Framework (New Zealand Transport Agency, 2011)
There are two indicators relevant to community severance in the Transport Monitoring Indicator Framework, they are:
AM10 – Travel perceptions for walking
AM11 – Travel perceptions for cycling.
These indicators measure aspects such as the percentage of people ‘feeling hassle free walking’ and ‘feeling safe bicycling’. As such they are amenity indicators only.
All indicators below are from the transport sector.
Table 3. Potential indicators for assessing community severance at the project level
Outcomes
measured
Specific indicators Source Country
Separation
from
facilities
Journey length and travel pattern - Origin and
destination surveys and pedestrian/bicycling
counts at key facilities/routes. Allows estimation
of number of trips, type (return, or one-way) and
purpose of trip (work, recreational, etc), journey
length and time to travel for different modes and
vulnerable groups.
Clarke et al, 1991;
Tate, 1997,
UK Design Manual for
Roads and Bridges (1993)
Scottish Executive,
undated.
UK
NZ
UK
Scotland
Trip
changes
Conflict index – used to assess the level of
conflict on the network for the journey of school
children.
average annual daily traffic x No. of paths crossing
Index = ∑ ______________________________________
100
Tate, 1997 New
Zealand

25
Trip
changes
Pedestrian delay crossing a road. Calculates
the mean pedestrian delay in seconds while
crossing a road. Different crossing approaches
(zebra crossing, signals, no facilities etc
produce different delay times, and these delay
times tend to rise as vehicle/hour increases.
Multiple methods exist to calculate pedestrian
delay including observation, video and
modelling. It appears to be highly dependent on
the ‘person’ under study, with highly mobile
people having substantially less delay than
those less mobile. Guo and Black (2000)
present a modelling approach that takes
account of urban bunched traffic and different
crossing approaches, producing better
approximation of real data.
Tate, 1997
Guo and Black (2000)
New
Zealand
Australia
Amenity Perceived danger – the probability of not
crossing a road when compared with average
weekday traffic volumes. Calculated for each
vulnerable group in the locality.
Tate, 1997 New
Zealand
Amenity Questionnaires were devised to obtain data on
residents’ and pedestrian activity patterns;
perceptions of the street environment and their
variation by time of day; and how these may in
turn affect behaviour and activity patterns by
time of day. In depth interviews undertaken.
Hine and Russell, 1993.
Hine, 1996
UK
Amenity Travel perceptions for walking
Travel perceptions for cycling
NZ Transport Agency
(2011)
New
Zealand
We make no conclusion about which indicators should be used in the assessment or monitoring situations, as that would require substantial additional information about the purpose of each indicator in each specific setting, and that is beyond the scope of this brief.
4.6.4 Accessibility planning
Accessibility planning is an approach, an integrated planning tool and is described more fully
in Appendix 7. Of course there are crossover aspects with project-level assessment of
community severance. The most obvious crossover is where accessibility planning ‘assesses
accessibility of a transport option or study area”. Population groups are chosen to study, and
distance and time indicators are used to monitor access of those groups to particular
services/destinations.
In the New Zealand transport setting, examples of accessibility indicators have been
generated by NZTA to attempt to quantify accessibility (Appendix 7). They attempt to
determine the distance or time that an individual (or population segment or community) can

26
access activities from where they live via available modes of transport, or services and/or
technologies. It therefore has many similarities to assessment approaches that might be used
for assessing community severance at a project level, particularly its focus on people who
may be socially disadvantaged. In comparison however, the example accessibility indicators
are solely quantitative and all except three are about travel time. Some of the accessibility
indicators would likely be very useful in assessing community severance at the project level; in
conjunction with other project-level indicators presented throughout this report. Similarly,
community severance indicators, particularly the qualitative indicators that attempt to assess
‘changes in comfort and attractiveness of areas’ (from our definition of community severance)
may make a useful addition to accessibility planning. The explicit inclusion of community
severance within accessibility planning may be warranted.
27
4.7 Definitions of community cohesion and similar concepts
4.7.1 History and usage of terms
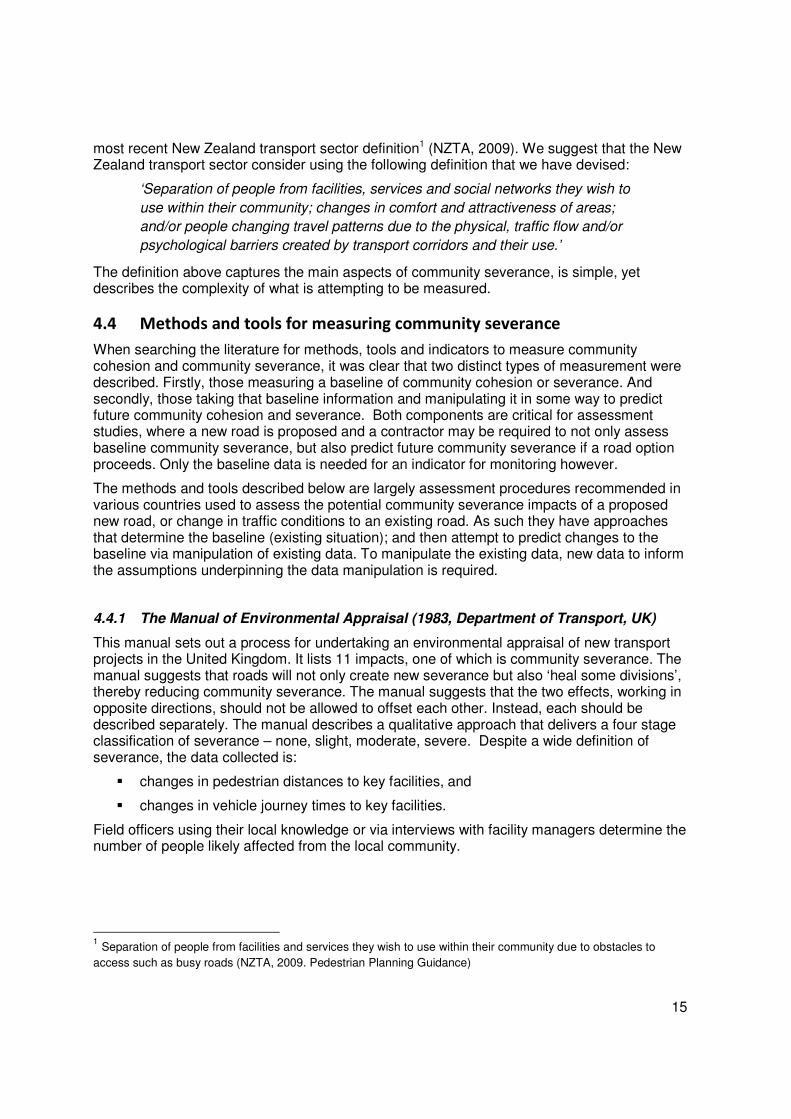
The term 'community cohesion' is not new. It has been used for centuries in the writings of political theorists and in contemporary social policy, sociology and political science. It has gained popularity in recent years with the focus on social inequalities and evidence of racial or religious intolerance, for example in the UK since the early 21st Century. Community cohesion is widely used to describe a state of harmony or tolerance between people from different backgrounds living within a community (Institute of Community Cohesion). There is a strong emphasis on issues of social justice, equality of opportunity and diversity. It is linked to the concept of social capital and the concept that if we know our neighbours and contribute to community activity then we are more likely to look out for each other, increase cohesion and minimise the cost of dependency and institutional care.
According to the UK government-commissioned State of the English Cities thematic reports, there are five different dimensions of social cohesion: material conditions, passive relationships, active relationships, inclusion and equality. Over time in the UK the concept of community cohesion has broadened to include an emphasis on integration and citizen rights.
Social connectedness can be viewed as a ‘marker’ for a cohesive community, as it represents one element of community cohesion. For instance, if a transport or roading design project measures social connectedness and finds the project will impact negatively on levels of social connectedness, then community cohesion will also be reduced. As community cohesion is a broader concept that includes other elements, such as shared values and equality of opportunity, it cannot be assumed that a project likely to increase social connectedness would necessarily substantially increase community cohesion.
4.7.2 Example definitions of community cohesion
This section sets out examples of definitions from transport and related sectors. The first table gives definitions of community cohesion, and the following table gives definitions of social connectedness. There is discussion provided after each table.
Table 4. Definitions of community cohesion
Definition of community cohesion (summarised) Source Country Sector
Community cohesion is what must happen in all communities to enable different groups of people to get on well together. A key contributor to community cohesion is integration which is what must happen to enable new residents and existing residents to adjust to one another. A vision of an integrated and cohesive community is based on three foundations:
• People from different backgrounds having similar life opportunities
• People knowing their rights and responsibilities
• People trusting one another and trusting local institutions to act fairly
And three ways of living together:
• A shared future vision and sense of belonging
• A focus on what new and existing communities have in common, alongside a recognition of the value of diversity
UK Govt’s response to the Commission on Integration and Cohesion, 2008
UK Central govt

28
Definition of community cohesion (summarised) Source Country Sector
• Strong and positive relationships between people from different backgrounds.
A cohesive community is one where:
• there is a common vision and a sense of belonging for all communities
• the diversity of people's different backgrounds and circumstances are appreciated and positively valued
• those from different backgrounds have a similar life opportunities; and
• strong and positive relationships are being developed between people from different backgrounds in the workplace, in schools and within neighbourhoods
UK Home Office (Community Cohesion Unit) and Local Government Association
UK (multiple sectors) = widely adopted working definition in the UK
Local government, immigration, police, drugs, crime
Social cohesion is the collective values people hold, patterns of social engagement and participation, and the levels of unity and harmony within society. It does not require uniformity but exists where the different communities in a society work well both within each community and with each other. Social cohesion has four key aspects: social connectedness; human rights; culture and identity; and safety and security.
Statistics New Zealand
NZ Statistics
Social cohesion is a state in which all groups have a sense of belonging, participation, inclusion, recognition and legitimacy
Public Health Advisory Committee
NZ Public health
Processes between people which establish networks, norms, and social trust, and facilitate coordination and cooperation for mutual benefit
Auckland Regional Council
NZ Local government
Quantity and quality of interactions among people in a community, as indicated by the degree to which residents know and care about their neighbours and participate in community activities.
Litman 2010a Canada Transport
Quality of relationships, as indicated by the frequency of positive interactions, the number of neighbourhood friends and acquaintances, and their sense of community connections, particularly among people of different economic classes and social backgrounds
Litman 2007 Canada Transport
Urban planning term for patterns of social networking within a neighbourhood or community
Transportation Economic Committee
US Transport
Sense of neighbourliness and togetherness, including addressing needs of low income and minority groups so they share in benefits of transport investments. Civic participation, closeness among neighbours and improved sense of safety.
Cambridge Systematics Inc.
US Transport
Interestingly, the Auckland Regional Council definition and all of the Canada and US examples above are actually definitions of social connectedness. This is because they focus on social interactions and relationships, rather than a broader concept.
Most of the above definitions include reference to diversity - a key feature of community cohesion. The Auckland Regional Council, for instance, emphasises the importance of respecting diversity. The Canadian Victoria Transport Policy Institute has pointed to the particular importance of community connections between people of differing social backgrounds and economic classes (Litman 2007). Likewise, a US definition of community

29
cohesion stresses a sense of togetherness and addressing the needs of low income and minority groups so they share in the benefits of transport investments (Cambridge Systematics Inc. 2002).
4.7.3 Transport, land use planning and community cohesion
Community cohesion is inclusive of all ages in a community. Similarly in a transport context, specific groups such as children, older people, and those who are disabled or who have mobility problems are important to consider in the planning and implementation of transport policies.
The research indicates that transport and land use planning decisions affect community cohesion in the following ways, by affecting:
� the quality of the public realm, particularly footpaths, walking trails, streets and parking space, and traffic volumes on local roads.
� The quality of the private realm, particularly dirty, dusty, noisy, littered front yards and areas that are infrequently used for by the owners/occupiers
� the amount of walking that occurs in a neighbourhood, and therefore opportunities for neighbourly interactions.
� land use mix, such as locating stores, cafes, parks and schools within neighbourhoods, and therefore the frequency of social interactions when running errands or participating in local activities.
� diversity of housing (type and price) and hence demographic mix and opportunities for interaction among different income, ethnic and racial classes (Litman 2010).
Transport planning projects, such as a proposal for a new road or redesign of roading, can have various potential impacts, either beneficial or adverse, on community cohesion. These may include:
• generating new development, which can benefit communities economically and socially
• changing property values (either increasing or decreasing)
• physically severing neighbourhoods by the introduction of a new major road that bisects a community
• isolating a portion of a neighbourhood or an ethnic group through transport infrastructure (e.g. a new road), or uniting a neighbourhood through the provision of walkways
• separating residents from, or improving access to, community facilities (Transportation Economics Committee).
Separation or isolation may be physical, social or psychological. Potential displacement of businesses and residences resulting from a transportation project is another important related impact (Transportation Economics Committee).
4.7.4 Criteria for a cohesive community
In the late sixties Donald Appleyard, a Berkeley urban design professor, carried out a classic study on social interactions and traffic volumes in San Francisco. The study compared three residential streets which were similar apart from their levels of traffic. The 2,000 vehicles per day

30
street was considered Light Street, 8,000 travelled on Medium Street and 16,000 vehicles passed down Heavy Street. Appleyard's research showed that residents of Light Street had three times more friends and twice as many acquaintances as the people on Heavy Street.
Further, as traffic volume increased, the space people considered to be their territory shrank. Appleyard suggested these results were related, indicating that residents on Heavy Street had fewer friends and acquaintances precisely because there was less 'home territory' (exchange space) in which to interact socially. Other studies have confirmed these findings (e.g. Hart 2007) and found cul-de-sac streets and stable neighbourhoods also promote greater social interaction in neighbourhoods (Litman 2010a).
In a 1980 journal article on protected neighbourhoods and liveable streets, Appleyard suggested criteria for a ‘protected neighbourhood’ which is essentially a cohesive community in relation to transport and urban design considerations. Appleyard’s criteria were:
• Acceptable vehicle speeds and volumes
• Acceptable noise levels
• Reduction of pedestrian accidents, and rights-of-way for pedestrians
• The street environment should have places where people can sit, converse, and play
• Streets should be places where communal life is possible and where it can happen if residents want
• The street as 'neighbourly territory' - that the residents believe the street belongs to them, for which they have a sense of pride and responsibility. The street should be “a fine place for children to play” (Appleyard 1980).
A recent report by New Zealand's Public Health Advisory Committee (2010) provides a list of features that promote a socially cohesive urban environment. These have some similarities with Appleby’s criteria and include:
• Public spaces are high quality and accessible for all populations.
• Multi-purpose spaces accommodate activities for different age groups.
• Public spaces are located near more deprived areas.
• Public spaces are accessible by public transport and a connected network of walking routes.
• Seating, shelter and shade are available in public spaces.
• Facilities are able to be shared, to ensure a wide range of people can access them.
These are also consistent with goals of the Auckland Regional Council, stated in a paper on community cohesion and cultural diversity. The goals include quality public spaces; safe and attractive neighbourhoods; and transport and communications networks that encourage interaction between people and communities, reflect cultural diversity and are accessible to everyone. 4.7.5 Example definitions of social connectedness
Social connectedness is characterised in this review as a dimension of, and marker for, community cohesion. The following table gives example definitions of social connectedness.

31
Table 5. Definitions of social connectedness
Definition of social connectedness (summarised) Source Country Sector
Reciprocal relationships that sustain social participation. Social connectedness is one of four aspects of social cohesion.
Statistics New Zealand
NZ Statistics
How people come together, interact and network. It provides an indication of community strength or community cohesion.
Jamieson 2007 (Quality of Life in cities report)
NZ Local government
The relationships people have with others and the benefits these relationships can bring to the individual as well as to society. It includes relationships with family, friends, colleagues and neighbours, as well as connections people make through paid work, sport and other leisure activities, or through voluntary work or community service.
Ministry of Social Development
NZ Social development
According to the reviewed literature, social connectedness does not appear to be a common term overseas in the context of transport. Community or social cohesion seems to be frequently used in Canada and the US, whereas the UK uses the terms community cohesion and social inclusion (which evolved from an earlier focus on social exclusion). However, as raised above, the term community cohesion is sometimes used interchangeably with social connectedness.
In New Zealand the concept of social connectedness is used and measured in two regularly published sources of progress indicators; the Quality of Life in New Zealand Cities reports (local government) and the Social Reports (Ministry of Social Development). The indicators section later in this report discusses these in more detail.
4.7.6 Social connectivity
Interestingly, the term 'social connectivity' is used in New Zealand's Transport Monitoring Indicator Framework but it is not defined. The indicators used to measure it are more about accessibility and alternatives to car travel (this differs greatly from other indicators for community cohesion and social connectedness, such as overseas indicators and New Zealand indicators on social connectedness). Social connectivity comes under the broad grouping of ‘Access to the Transport System’ in New Zealand's monitoring framework. The three indicators are:
• AM004 Access to essential services
• AM005 Percentage of the population who can get to key locations door-to-door by public transport, walking and cycling
• AM015 Percentage of the population living within 500 metres of a bus route
For AM004 and AM005 there is currently no data available.
These indicators do not measure social connectivity or community cohesion, instead they are focused on accessibility and alternatives to car travel (public transport, walking and cycling). The current indicators also lack specificity – for example, it is not clear how ‘access to essential services’ would be measured, nor how ‘key locations’ might be defined.

32
4.7.7 Suggested definitions for community cohesion and social connectedness
The terms community cohesion and social connectedness are defined in various ways and contexts, and are used interchangeably at times. However, this review has found important differences between the two terms:
• Social connectedness is a term derived from psychology and is more about the presence of social interactions, relationships and networks than an overall state of cohesion.
• Social connectedness can be defined as one element of community cohesion.
• Community cohesion is a broader concept that describes the state of togetherness and tolerance between people from different backgrounds in a community.
• Social connectedness can be applied to an individual, family, street, neighbourhood, community or society. In comparison, community cohesion is usually applied at the neighbourhood, community or societal level.
It is recommended that NZTA focuses initially on the term ‘social connectedness’ rather than social connectivity or community cohesion, as social connectedness is an aspect of, and a marker for, the broader concept of community cohesion.
Based on the review, a suggested working definition of each term is as follows:
Social connectedness is defined as the social interactions, relationships and networks that people have with others and the benefits these relationships can bring to the individual as well as to society. It can be viewed as one aspect of community cohesion.
Community cohesion is defined as a state of togetherness and unity across diverse people in the community, with social engagement, participation and shared values. A cohesive and integrated community is characterised by equality of opportunity, citizen awareness of rights and responsibilities, and high levels of trust in each other and local institutions.
Both terms are related to other concepts including social capital, social inclusion and social exclusion. These were outside the scope of this review.
Statistics New Zealand also conceptualises social connectedness as one element of social cohesion. Other elements are human rights, culture and identity, and safety and security (Statistics New Zealand). It is noted that these elements can be variously defined and interpreted.
4.8 Methods and tools for measuring community cohesion and social
connectedness
Measures that assess community cohesion and social connectedness are useful in predicting the potential negative impacts on cohesion, or potential for community severance, from a proposed roading or transport development. To measure the concept of community cohesion in full, the degree of harmony and mutual respect in communities, there is a need for indicators that measure the strength of social capital as reflected in social networks, degrees of positive interaction and both shared and individual sense of identity (UK Institute of Community Cohesion).
The literature review identified several specific methods for measuring elements of community cohesion. These methods could potentially be used to measure single aspects of community cohesion, such as the connectivity and accessibility of transport networks. These elements

33
contribute to community cohesion, but measurement of these aspects alone would not give the total picture of community cohesion.
Surveys are the primary method of data collection for measures in both community cohesion and social connectedness. This means the measurement of progress is largely measured by self-reported information, rather than more objective measures. Social measures lend themselves more towards subjective measurement than objective, as it would often be difficult or not feasible to obtain an objective measurement.
4.8.1 Quality of Life in New Zealand Cities and the Social Report - New Zealand
In New Zealand the concept of social connectedness is used and measured in two regularly published sources of progress indicators; the Quality of Life in New Zealand Cities reports (local government) and the Social Reports (Ministry of Social Development). The specific indicators used are discussed in the following section on indicators.
The Quality of Life Project was established in 1999 to provide social, economic and environmental indicators of quality of life in New Zealand. Initially covering the six largest cities, coverage since 2004 has expanded to include 12 territorial authorities. Topics include people, knowledge and skills, standard of living, economic development, housing, health, natural environment, built environment, safety, social connectedness, and civil and political rights.
The Social Report has been an annual publication from 2001 onwards. It gives a 'big picture' view and has data on health, knowledge and skills, safety and security, paid work, human rights, culture and identity, economic standard of living, social connectedness and the environment. All the indicators are objective measures, e.g. the domain of “social connectedness” has the measures of: telephone and internet access in the home; regularity of contact with family/friends; trust in others; proportion of the population experiencing loneliness; and contact between young people and their parents.
Two sources of data inform the Quality of Life project – specific biennial Quality of Life surveys and regular collection of data from secondary sources (e.g. government agencies, councils etc.) The surveys are of residents to seek their perceptions of various aspects of wellbeing including social connectedness.
The main method for gathering information for the Social Report measures is by reviewing existing statistical information across a wide range of sectors. For example, the measure 'contact with family and friends' is defined as:
The proportion of people aged 15 years and over who said the amount of contact they have with family and friends who don’t live with them is “about right”, and is measured by the New Zealand General Social Survey. Contact includes face-to-face meetings as well as letters, phone calls and all forms of electronic communication (Ministry of Social Development 2010).
Information for the measure 'contact between young people and their parents' is sourced from the New Zealand youth surveys. Information for the measures on loneliness and trust comes from the Quality of Life in New Zealand Cities survey.
Despite the existence of these reports there are challenges in the availability and quality of the necessary data to measure such issues, including:
• information and statistical gaps

34
• alignment between different data collection agencies and those responsible for measuring and monitoring social cohesion
• balance between quantitative and qualitative information on key social cohesion issues.
4.8.2 New Zealand Census
Statistics New Zealand does not directly measure social connectedness in the Census, but it includes some relevant measures such as participation in unpaid work outside the home and access to telecommunications.
Statistics New Zealand has noted there are substantial gaps in New Zealand’s current measurement of social or community cohesion (Statistics New Zealand).
4.8.3 Network Connectivity (road network design method) – Victoria Transport Policy
Institute, Canada
‘Network Connectivity’ refers to how efficiently a road or pedestrian network connects destinations (Victoria Transport Policy Institute 2011). A grid road network allows relatively direct connections between destinations, providing a high degree of connectivity. This type of road network design was frequently used until the middle of the 20th Century, however in the latter half of the 20th Century, a ‘hierarchical’ road network was common, especially in suburbs. The hierarchical road network design uses a few major arterials to connect each centre or neighbourhood (Victoria Transport Policy Institute 2011). Requiring more indirect and circuitous travel routes, this model has a low degree of connectivity which discourages walking and cycling.
A Connectivity Index evaluates how well a roadway network connects destinations. It is calculated by dividing the number of roadway links (i.e. segments between intersections) by the number of roadway nodes (i.e. the intersections themselves). Connectivity can be calculated separately for pedestrian and cycling access, taking into account connections and links for non-motorised travel, such as a path that connects the ends of two cul-de-sacs. A higher index means that travellers have increased route choice, allowing more direct connections for access between any two locations. This sort of connectivity is important for non-motorised accessibility (Victoria Transport Policy Institute 2011).
4.8.4 Walking Permeability Index – Victoria Transport Policy Institute, Canada
The Walking Permeability Index indicates how directly a pedestrian can reach destinations (Allan 2001, cited in Victoria Transport Policy Institute 2011). The index is calculated by dividing the direct distance by the actual distance, and indicates the connectedness of the pedestrian network. A low index means streets are connected, relatively small, with good footpaths, and pedestrians can walk directly to destinations. If a street network has many unconnected dead-ends, a lack of footpaths, and large distances, the street network will have a higher Walking Permeability Index (Victoria Transport Policy Institute 2011).
4.8.5 Child-specific Walkability Index – University of Western Australia, Perth
The TREK project examined the extent to which the urban design of local neighbourhoods hinders or facilitates the active transport patterns of primary school children (Wood et al 2010). Using GIS software, the project developed a child-specific ‘walkability’ index to examine walkability within 2km of all (238) Perth metropolitan public primary schools. The index took into account the connectivity of the streets surrounding the schools and exposure

35
to traffic measured by a ratio of local access roads to busier roads within 2km of the school. The most ‘walkable’ and least ‘walkable’ public primary schools were identified and approached to participate in a cross-sectional survey.
The survey found perceived urban design factors such as busy traffic, crossing a busy road, distance, steep hills and a lack of safe crossings and footpaths all influenced the likelihood of walking to school (Wood et al 2010). The findings suggest that school location is an important factor influencing whether or not children walk to school. The authors note that situating schools away from major traffic routes appears to be an important factor warranting consideration when planning new schools. In established areas, traffic management around schools is critical. The potential to reduce traffic around the school by restricting and slowing traffic during peak hours, as well as locating ‘drop off zones’ on the same side of busy roads, but some distance from the school, may all contribute to reducing children’s traffic exposure near and around school grounds (Wood et al 2010).
4.8.6 Accessibility planning
Accessibility planning is an approach, an integrated planning tool and is described more fully
in Appendix 7, and has been discussed in the community severance sections above. There
are crossover aspects with regional/national monitoring of community cohesion. The most
striking difference is that accessibility planning is about people accessing destinations/places
whereas social connectedness has a broader concern about people accessing people (of
which people accessing places is one important aspect).
4.9 Indicators used to measure community cohesion and social
connectedness
Estimates of the extent to which a proposed transportation project may affect community cohesion rely heavily on site analysis, self-reporting, and survey analysis (Transportation Economics Committee). Measuring the changes in community cohesion resulting from a transportation project requires documenting existing patterns of community cohesion (base case) and then estimating the potential reduction of or increase in community cohesion if the proposed project were built. It is important to note that this impact category does not lend itself to quantitative measures, and these impacts also overlap with several other impact categories (e.g., safety, noise, or distributive effects).
Community cohesion and ‘liveability’ of a neighbourhood can be difficult to evaluate. A variety of factors affect perceived environmental and social conditions, many of which are difficult to measure. People often have different preferences and priorities regarding community liveability and cohesion. Despite these obstacles, liveability or community cohesion can be evaluated using various indicators (Victoria Transport Policy Institute 2010).
The following table gives examples of a range of indicators internationally and in New
Zealand. The indicators below measure both social connectedness and community cohesion.

36
Table 6. Examples of indicators used to measure social connectedness and community cohesion.
Type Specific indicators Source Sector
Cohesion
Cohesion
Connectedness
Cohesion
The percentage of people who believe people from different backgrounds get on well together in their
local area
The percentage of people who believe they belong to their area
The percentage of people who have meaningful interactions with people from different backgrounds
The percentage of people who feel they can influence decisions in their locality
Institute of
Community
Cohesion
(UK)
Cross-
government
Connectedness
Cohesion
Frequency of positive interactions among community residents
Relative level of accessibility and transport affordability for disadvantaged people (e.g., non-drivers and
low income people) relative to more advantaged people.
Litman
2007
(Canada)
Transport
Cohesion
Cohesion
Connectedness
Cohesion
Existence of community events that attract diverse participants
Children and older people travelling independently
People assisting strangers
Children playing in public
Litman
2010a
(Canada)
Transport
Type Specific indicators of social connectedness Source Sector
Cohesion
Cohesion
Connectedness
Cohesion
Connectedness
Cohesion
Connectedness
Connectedness
Connectedness
Self-reported overall quality of life (self reported perception on a scale of one to five - extremely poor to extremely good)
Perception of the impact of increased cultural diversity (residents asked in survey if they thought increasing lifestyle and cultural diversity made their area a better or worse place to live, and asked for reasons for this view)
Types and location of social networks
Self-reported sense of community and community resilience - asked in survey if they thought a local sense of community was important and whether they felt a sense of community in their local neighbourhood. The measure of community resilience uses a community resilience index (combined of six factors from Census data) - estimates an overall score of community resilience on a scale of one to nine.
Reported contact with neighbours
Participation in unpaid work
Levels of trust in others
Levels of social isolation (how often people had felt lonely or isolated over the last 12 months)
Levels of personal support (asked if there was someone they could turn to for help or support if felt
Jamieson
2007
(Quality of
Life in NZ
Cities report)
(New
Zealand)
Local
governme
nt

37
Type Specific indicators of social connectedness Source Sector
under stress)
Connectedness
Connectedness
Connectedness
Connectedness
Connectedness
Cohesion
The proportion of the population with telephone (mobile or landline) and internet access in the home
The proportion of people aged 15 years and over who said the amount of contact they have with family and friends who don’t live with them is ‘about right’, as measured by the NZ General Social Survey
The proportion of secondary school students aged 12-18 years who said they get enough time with Mum/Dad (or someone else in this role) most of the time, based on the national youth survey
Trust in others – the proportion of the population aged 15 years and over who report that people can ‘almost always’ or ‘usually’ be trusted, in the Quality of Life survey
Loneliness - the proportion of the population aged 15 years and over who report feeling isolated or lonely ‘sometimes’, ‘most of the time’ or ‘always’ in the previous 12 months, in the Quality of Life survey
Participation in voluntary work - the proportion of the population aged 15 years and over who report having done voluntary work for a group or organisation in the last four weeks, in the NZ General Social Survey.
Ministry of
Social
Development
(New
Zealand
Social
Connectedness
Connectedness
Connectedness
Connectedness
Connectedness
Connectedness
Average number of social contacts (local friends and acquaintances)
Extent of perceived 'home territory' (=area for which residents felt a sense of personal responsibility or
stewardship)
Reported street-based social activity
Number of gathering places
Number of street parties or events
Number of car sharing programmes
Hart 2007
(UK)
Transport

4.10 Consideration of indicators to measure community cohesion and social
connectedness in a transport context
We suggest that indicators of social connectedness already being used in New Zealand (Ministry of Social Development, Quality of Life project) are a useful starting point for considering appropriate and useable indicators for social connectedness in the transport sector. Those from Hart (2007) are also relevant for the transport sector. As social connectedness is a marker for, and an element of, the broader concept of community cohesion, it would be a more feasible initial goal than attempting to measure the full concept of community cohesion. The indicators of social connectedness used in the two projects are already being used to monitor progress towards greater social connectedness and are used in both local government and national contexts.
Social cohesion is monitored by other agencies, rightly so, and the transport sector has the potential to impact on social connectedness far more than community cohesion.

39
5 References
Appleyard, D (1980) Liveable streets; protected neighbourhoods? In xxx journal
Auckland Regional Council (undated) Cultural diversity and community cohesion paper.
Auckland Regional Transport Authority, Counties Manukau DHB, Auckland councils (undated) Strategic Plan for School Travel in Counties Manukau
Beca Carter Ferner and Hollings Ltd (1998). Monetary valuation of intangibles: Literature review and pilot surveys. Transfund New Zealand Research Report Number 98. Wellington: Transfund New Zealand.
Bradbury A, Tomlinson P and Millington A (2007). Understanding the evolution of community severance and its consequences on mobility and social cohesion over the past century. Association for European Transport and contributors.
Cambridge Systematics Inc. 2002 Community and social benefits of transportation investment, paper to Transportation Research Board
Clark JM and Hutton BJ (1991). The appraisal of community severance. Contractor Report 135. Berkshire, England: Transport and Road Research Laboratory, Department of Transport.
Department for Transport (1993, but still current). Design Manual for Roads and Bridges: Volume 11 Part 8. http://www.dft.gov.uk/ha/standards/dmrb/vol11/section3.htm
Department for Transport 2007 – web article
Dora and Phillips 2000 Transport, Environment and Health, WHO Regional Office for Europe, Copenhagen
Egan M. Pettigrew M, Ogilvie D, et al (2003). New Roads and Human Health: A systematic review. American Journal of Public Health 93: 9: 1463-1471
Federal Highways Administration of the Department of Transportation (2005). Pedestrian and Bicycle Data Collection in United States Communities: Quantifying Use, Surveying Users, and Documenting Facility Extent.
Hart, J 2008 Driven to Excess; Impacts of motor vehicle traffic on residential quality of life in Bristol, UK, Masters thesis in transport planning
Institute of Community Cohesion: Toolkit on community cohesion; measuring community cohesion http://www.cohesioninstitute.org.uk/Resources/Toolkits/Health/TheNatureOfCommunityCohesion/MeasuringCommunityCohesion. Accessed 5/4/11
Hine J. Pedestrian travel experiences: Assessing the impact of traffic on behaviour and perceptions of safety using an in-depth interview technique. Journal of Transport Geography, 1996; 4(3):179-99.
James E, Millington A, Tomlinson P (2005). Understanding Community Severance part I - Views of practitioners and Communities. London: Department for Transport.
Kirby, 1981 (from Tate, 1997). Commission of inquiry into the Kyeemag-Chullora Road, volume III Criteria for Evaluations. Parliament of New South Wales, Australia.
Litman, T 2007 Evaluating Transportation Land Use Impacts
Litman, T 2010a Community cohesion as a transport planning objective, paper, Victoria Transport Policy Institute

40
Litman, T 2010b Indicators for Sustainable Transport Policy Making and Performance Evaluation, paper
Ministry of Transport 2009 Transport Monitoring Indicator Framework 2009 Version 2
Public Health Advisory Committee 2008 Evidence review
Public Health Advisory Committee main urban environments report (2010) Healthy Places, Healthy Lives: Urban environments and wellbeing, National Health Committee, Wellington.
Read MD and Cramphorn B (2001). Quantifying the impact of social severance caused by roads. Transfund New Zealand Research Report Number 201. Wellington: Transfund New Zealand.
Tate FN (1997). Social severance. Transfund New Zealand Research Report Number 80. Wellington: Transfund New Zealand.
Thomson H, Jepson R, Hurley F et al (2008). Assessing the unintended health impacts of road transport policies and interventions: translating research evidence for use in policy and practice. BMC Public Health, 8(339)
Transportation Economics Committee of the Transportation Research Board (undated) Transportation Cost-Benefit Analysis, Wiki website maintained by the Transportation Economics Committee.
UK Design Manual for Roads and Bridges (1993). Volume 11 Section 3 Part 8 Pedestrians, cyclists, equestrians and community effects.
Victoria Transport Policy Institute 2010
Victoria Transport Policy Institute 2011
Watkiss P, Brand C, Hurley F, Pilkington A, et al (2000). Informing transport health impact assessment in London. London: Public health Directorate, NHS Executive London.
Wood G, Giles-Corti B, Pikora T, et al (2010). The Travel, Environment and Kids Project: Preliminary findings report. Centre for the Built Environment and Health, School of Population Health, The University of Western Australia: Perth.

41
Appendix 1 – Classification of facilities (Clark et al, 1991)
Doctor
Pharmacy
Dentist
Clinic
Optician
Chiropodist
Health
Hospital
Playgroup
Infant school
Junior school
Secondary school
Education
Further education
Post office
Telephone
Day centre
Launderette
Services
Library
Pub
Community centre
Youth club
Social
Church/ hall
Sports centre
Playground
Leisure
Park
Convenience
Supermarket
Shops
Take-away
Railway / tube station
Bus stop
Transport
Car parking

Appendix 2 – Classification of severance effects, Department of Transport, UK (1993)
Level Slight Moderate Severe
Description In general the current journey
pattern is likely to be maintained,
but there will probably be some
hindrance to movement.
Some residents, particularly
children and elderly people are
likely to be dissuaded from
making rips. Other trips will be
made longer and less
attractive.
People are likely to be
deterred from making trips
to an extent sufficient to
induce a reorganisation of
their habits. This would lead
to a change in the location
of centres of activity or in
some cases to a permanent
loss to a particular
community. Alternatively,
considerable hindrance will
be caused to people trying
to make their existing
journeys.
New
Severance
Example - pedestrian at grade crossing of a
new road carrying below 8000
vehicles per day (AADT); or
- a new bridge will need to be
climbed or a subway traversed; or
- journeys will be increased by up
to 250 m.
- two or more hindrances set
out under ‘slight’ applying to a
single trip; or
- pedestrian at grade crossing
of new road carrying between
8000 and 16000 vehicles per
day (AADT) in the opening
year; or
- journeys will be increased by
250 m to 500 m.
- pedestrian at grade
crossing of new road
carrying between 16000
and 16000 vehicles per day
(AADT) in the opening year;
or
- journeys will be increased
by over 500 m; or
- three or more hindrances
set out under ‘slight’ or two
or more hindrances set out

43
under moderate.
Built up area Traffic volumes reduce by 30%. Traffic volumes reduce by 30
to 60%.
Traffic volumes reduce by
60% +.
Relief from
severance
Rural area 60 to 75% reduction in traffic
volumes where road passes
through a village or on the
perimeter of a built up area 30%.
75 to 90% reduction in traffic
volumes where road bisects a
village or small town. This may
be halved.
90%+ reduction in traffic
volumes where road bisects
a small town or village. This
figure may be reduced to
60%.

44
Appendix 3. New Zealand documents and road assessment reports that describe community
severance.
Document and author Example of use
Auckland Transport Plan (ARTA, 2009) Priority will be given to solutions which avoid or improve community severance (p55). Not defined. Priority will be given to addressing transport-related community dislocation in areas where this is significant (p55). Not defined.
Hutt Corridor Plan for the Transport Network – Social sustainability of Road Link Options (Enviro Solutions, 2002).
A broad and coarse comparative assessment, the results are qualitative and the professional opinion of the author (p1). The issues ‘covered’ under ‘community severance and conflict’ were: Effects on local amenities/utilities; Effects on amenity/quality of life; Effects on people’s properties; Community disruption/severance; Impacts on cycle/walk opportunity. No data or analysis was presented for any of these issues (p11).
Western Ring Route – Waterview Connection: Report on Community Engagement (NZTA, 2009)
Reducing severance was a key area identified for mitigation and enhancement (p11). Many of the submitters (21%) were concerned about ‘community effects’ which included community severance (p23). Not defined.
McKays Crossing to Peka Peka Community Engagement Report (NZTA, 2009).
531 submissions commented on the potential effects of community severance that might occur as a consequence of constructing an expressway option (p18). Not defined.
Additional Waitemata Harbour Crossing: Technical Papers: Parallel Bridge and Wynyard Quarter Impacts (NZTA, 2010)
‘…potentially exacerbating the current level of community severance…. (p6)’. ‘…potentially result in localised community severance impacts. (p9)’. No other references to community severance made. Not defined.
Hawke’s Bay Regional Council Regional Land Transport Programme 2009-2012.
Under ‘Access and Mobility’, one of several issues was ‘The avoidance of community severance by arterial road transport links’. No other references to community severance made. Not defined.
North Otaki to Peka Peka Road State Highway 1 Upgrade Investigation: Social Severance Issues (Environmental Management Services Ltd, 2002).
‘Connectivity and severance describe the effects that roads and traffic have on social interaction within and between urban settlements’ (p3). Physical and psychological severance is defined (p3-4). Indicators said to be used in study were (a) increase in traffic volume and (b) Arterial route bisecting a local residential street or recreation area. Simple traffic volume data is presented and a qualitative assessment of the options is undertaken by the author.
Social effects of proposed Kapiti expressway options: Technical Report
‘Social severance is the term used to describe the effects that roads and traffic have on the social interaction within a community’ (p2). Physical and psychological severance (p2) and
45
(Buchan D, 2009) amenity (p3) are defined. A qualitative assessment by the author is undertaken with references to ‘road width’, ‘traffic speeds’ and ‘severance of walkways’, ‘underpasses’, ‘removal of through traffic’ and ‘grade separated access routes’.

46
Appendix 4 – NZTA suggestions for ways to assess connectivity.

47
Appendix 5 – NZTA suggestions on monitoring techniques for
pedestrians

48
Appendix 6 – NZTA suggestions for potential walking indicators:

49
Appendix 7 – Accessibility planning.
Accessibility planning was specifically excluded from the search due to the modest scope of the
project and the very substantial literature already in existence about accessibility planning.
Having said that, a brief comment about accessibility planning is included below:
Accessibility planning is a structured process to reduce social exclusion and improve personal
access to the opportunities that are likely to have the greatest impact on life chances. It builds
up an evidence base, including access maps, to identify access-related problems and plan and
implement solutions to resolve them. These may include transport solutions, such as improving
travel choice and reducing the distances travelled or the need to travel by private car, or non-
transport solutions such as modifying the design, location and delivery of services as well as
mobile or internet-based services.
Accessibility planning can be applied across the entire population or to specific groups (eg the
socially excluded). It can also be undertaken at different spatial levels, for example from
transport and land-use planning at a regional level down to curb design and public transport
vehicle quality standards. It must involve multiple stakeholders and government agencies to be
successful. Comprehensive accessibility planning can contribute to the broader end state of
community cohesion; however it can not deliver it specifically or independently of other
influencers.
Accessibility assessment and modelling are components of accessibility planning. They assess
and measure (respectively) the ease with which people can reach the destinations they wish to
access. Accessibility assessment and modelling in New Zealand currently include the following
core destinations:
• primary, secondary and tertiary (university, polytechnic, waananga) education
• general practitioners and medical centres
• public hospitals and private hospitals providing public services
• supermarkets and shopping centres
• food shops (this can include petrol stations)
• employment.
Having trialled a comprehensive accessibility planning process in Gisborne district and an
accessibility model in the Heretaunga Plains Transportation Study, the NZTA recognises the
value of accessibility planning in improving social inclusion, and how accessibility modelling can
contribute to the discipline of integrated planning. Through these trials it has learned that levels
of accessibility (and community cohesion) can be influenced by many factors other than
transport. These include geographical, personal mobility, socio- demographic and economic,
technological, the location of services and their availability / provision. As a result, and in line
with its mandate, the NZTA now takes a transport-focused approach to accessibility.
It does this by employing accessibility modelling on a project-by-project basis, to determine the
impact transport infrastructure and services have on improving or inhibiting accessibility to core

50
destinations. This includes complementing ‘traditional’ transport modelling exercises, and
identifying and assessing any potential severance issues caused by a new or altered state
highway. Accessibility modelling is also used within New Zealand to help identify the best
locations for new cycling infrastructure that services target communities, and to aid the
optimisation of public transport services to increase patronage.
Accessibility indicators
Accessibility indicators are not widely used in New Zealand, simply because accessibility
assessment is not yet commonplace. The accessibility model used by the NZTA can measure
accessibility in the following two ways:
• Continuous indicators are origin-based. They measure a household’s overall
accessibility, via a specific mode, to a destination type (eg primary school). Continuous
indicators are calculated on the household’s distance to a set number of the same type
of destination, valuing the closest destination the highest and each subsequent
destination less that the previous.
• Threshold indicators are destination-based. They measure, in a range of travel times,
the catchment area of a specific destination, by a specific mode of transport. Threshold
indicators are more easily understood, than continuous indicators, by people outside the
transport sector.
Tables and maps depicting how many households have access within each threshold
are produced and can be used for reporting, graphing and further analysis including
potentially benchmarking.
A set of threshold indictors, based on information from the National Household Travel Survey,
was developed during the creation of the Heretaunga Plains accessibility model. The travel
threshold times used were 5, 10, 15, 20, and 30 minutes for walking, cycling and private vehicle.
Public transport thresholds were set at 10, 20, 30, 40 and 55 minutes. These indicators provide
the three local authorities with accessibility results on which they can track the impact on
accessibility of any changes to transport infrastructure and services. For example the following
results, combined with the supporting access maps can be used to target bus patronage growth,
improve route efficiencies and identify new routes. It can also be used by the District Health
Board to identify easily accessible locations for new medical centres:
There are 48,557 households within the study area
• 30% (14,567 households) can get to their nearest General Practitioner within 10 minutes
by bus
• 71% (34,475 households) can get to their nearest General Practitioner within 20 minutes
by bus. From the 2008 NZTA Research Report on accessibility planning a set of example indicators was produced. These are presented below, but if considering using these it would be worthwhile contacting NZTA to receive an update on the indicators being used most frequently.

51

52
Local level accessibility indicators are recommended in the United Kingdom, and some of these are likely to be highly relevant to those that would be useful for project-level assessment of community severance.