literature analysis how to - tu graz
TRANSCRIPT

© f
oto
pro
- F
oto
lia.c
om
Institute of Electrical Power Systems
Literature Analysis
How to
February 2020 | Version 0.3

TU Graz – Institut für Elektrische Anlagen und Netze
II/21
The author does not guarantee the completeness and correctness of the information. Typing errors and changes reserved. For errors and comments please contact the author via [email protected].
Graz University of Technology Institute of Electrical Power Systems Inffeldgasse 18/I 8010 Graz Austria
Author Dennis Albert
February 16th, 2020
Version 0.3

TU Graz – Institut für Elektrische Anlagen und Netze
III/21
CONTENTS
1 Introduction ...................................................................................... 1
2 Bibliometric Analysis ...................................................................... 2
2.1 What is a bibliometric analysis? .......................................................................................................... 2
2.2 Research Question(s) ......................................................................................................................... 2
2.3 Select key words ................................................................................................................................. 2
2.4 Select appropriate data base .............................................................................................................. 4
2.5 Boundaries for literature research and bibliometric analysis ............................................................... 4
3 Scopus, IEEE, Citavi and Excel for your bibliometric analysis .... 5
3.1 User Accounts .................................................................................................................................... 5
3.2 Process Search Results manually ...................................................................................................... 5
3.3 Scopus with offered analysis .............................................................................................................. 6
3.3.1 Metrics in Scopus .............................................................................................................................. 6
3.3.2 A Bibliometric Analysis with Scopus – An Example ........................................................................... 7
3.4 Presentation of search results and conclusions from the results ...................................................... 15
4 Helpful Web Links .......................................................................... 19
5 Helpful Software ............................................................................ 20
6 Tipps for your Publication ............................................................ 21

TU Graz – Institute of Electrical Power Systems
1/21
1 Introduction
This “How to…” should be used as a practical user guide for basic bibliometric analysis to identify field of research
in the reader’s research area. A literature analysis helps to defend your own research and gives a short answer on
the question “Why are you doing research in the field of…”
In Figure 1 the research loop is depicted. To identify a research gap helps to focus and to defend your thesis.
Figure 1: Research Loop
(© Schreibportal Uni Leipzig, http://home.uni-leipzig.de/schreibportal/wp-content/uploads/2014/01/forschungskreislauf-neu.png)
DISS TOPIC
bibliometric analysis

TU Graz – Institute of Electrical Power Systems
2/21
2 Bibliometric Analysis
2.1 What is a bibliometric analysis?
A bibliometric analysis is the use of statistical methods to analyse literature (articles, books, …). For example, how
many article are published by Graz University of Technology per year.
2.2 Research Question(s)
Think about concise phrases, words or statements that your thesis deal with.
For the justification that your question is previously unanswered, refer to the state of the art
chapter/section.
Describe why it is worthwhile to answer this question(s), by highlighting the advantages if these questions
are answered.
2.3 Select key words
Table 1 shows the organization of search key words for three different topics. The number of combining topics can
change from research topic to research topic.

TU Graz – Institute of Electrical Power Systems
3/21
Table 1: Search terms and structure – project search
Topic 1 Topic 2 Topic 3
Nam
e /
Desig
na
t
ion
Power networks Transformer
Space Weather
Synonyms Power grid Power system
Cate
go
ry
1) Power transmission network 2) Current Traction network
1) Power Transformer 2) Instrument Transformer
Geomagnetism
Synonyms 2) railway traction network 2) railway traction system 2) railway traction grid
2) CT | Current transformer 2) VT | Voltage transformer
Su
b-c
ate
go
ry
GIC | Geomagnetically Induced Currents LFC | Low Frequency currents Quasi DC
Saturation (Effects)
CME | Coronal Mass Ejection
Synonyms GMD | Geomagnetic Disturbances Geomagnetic Storms
(Core) Saturation Half-Cycle Saturation Magnetizing Current DC Bias Magnetic Flux Magnetic curve Noise Vibration Direct Current
Solar Flares Geomagnetic Storms Solar activity Kp-Index NOAA K-Index
Cate
go
ry
Power Quality
Geomagnetically Induced Currents
Synonyms
Su
b-
cate
go
ry 1) Harmonics
2) Reactive Power Demand Plane-wave method
Synonyms 1) harmonic distortion
Cate
go
ry
Load Flow Analysis
Synonyms
Su
b-c
ate
go
ry
DC Load Flow AC Load Flow Plane-wave method
Synonyms
Cate
go
ry
DC Countermeasures
Synonyms DCC | DC Compensation DCBD | DC Blocking Device
Su
b-c
ate
go
ry
Synonyms
*numbering shows different (sub-)categories

TU Graz – Institute of Electrical Power Systems
4/21
2.4 Select appropriate data base
To find an appropriate data base (1) check available literature (theses, book, papers,…) which journals, papers and
books they are refer to. (2) Look for a data base, which is most likely to indexing most of the pre-reviewed literature.
In order to find as much related literature as possible with the least effort, check if your selected data base(s)
indexing all the major literature and conferences (3). Most of the data bases offer a list of indexing literature sources.
For example, Scopus is indexing more than 38,000 journals, including IEEE.
2.5 Boundaries for literature research and bibliometric analysis
To find an appropriate set of literature you probably need to define some boundaries for your literature research.
The following boundaries should give you an idea for possible limitations.
Language
If you do a bibliometric analysis you don’t read the papers, you are only processing the meta data of the literature.
Therefore, you don’t need to read the publications and you can include literature in languages you can’t read. If you
plan to also read the literature, it might be helpful to limit the search to languages you can read.
Year of publication
If special events or the availability of the technique is known, limit the years of publication to prevent to many
literature matches.
Meta data to be searched
Select the meta data field which should be searched. For example, article title, abstract and key words or full-text.
Exclude phrases
Exclude phrases/words which are not related to your literature research or bibliometric analysis. Sometimes the
same wording is used in more than one research field, but with different meanings.
Wildcards
Use available wildcards your search engine is offering you. With the wildcards you can include one word with
different suffixes or word which are written different in other regions of the world. For example, organization (AE)
and organisation (BE): organi*ation. For more information regarding wildcards, check the help in your data base.

TU Graz – Institute of Electrical Power Systems
5/21
3 Scopus, IEEE, Citavi and Excel for your
bibliometric analysis
3.1 User Accounts
Scopus: Sign in via University Account (see Figure 2)
Figure 2: Scopus - Institution sign-in
Citavi: Shareware - up to 100 title. You can get a full license from university.
3.2 Process Search Results manually
1.) Save all search results as .bib and/or as .ris-file
2.) Import .bib file in Citavi
3.) Export all titles from Citavi in an Excel file
a. Select data columns to be exported
4.) Process data in excel
a. use 2D-Bar diagram
b. use Data > Sort & Filter for an appropriate data representation
c. use Data > Text to Columns to give each author name one cell
d. use Data > Remove Duplicates
e. use function COUNTIF() (ZÄHLENWENN) to count results
5.) Create network plots, use VSOviewer (import .ris-file)
Interesting diagrams could be:
Documents per year
Documents per affiliation
Documents per author
Documents per sponsor
Documents per countries
Documents per language
Documents per journal
Documents per source
Documents per subject area
Number of used words in the title/abstract
Number of used key words

TU Graz – Institute of Electrical Power Systems
6/21
3.3 Scopus with offered analysis
Scopus can be used to do a quick search result analysis. Figure 3 shows the Scopus homepage and the button
Analyse search results.
Figure 3: Use Scopus for a quick search result analysis
Figure 4 depicts the view on the Scopus Analyse search results window. To download the charts of the analysis,
click on Export and select the desired file format (.csv or .zip). Fehler! Verweisquelle konnte nicht gefunden
werden. depicts the downloaded analysis results of the affiliations of the authors from the search. The charts are
downloaded as .jpeg, .png, .svg and .pdf.
Figure 4: Scopus analyse search results view
3.3.1 Metrics in Scopus
Metrics should give an idea to the reader how much impact/reputation a publication/author has. Table 2 give
overview of the metrics used by Scopus.
TU Graz – Institute of Electrical Power Systems
7/21
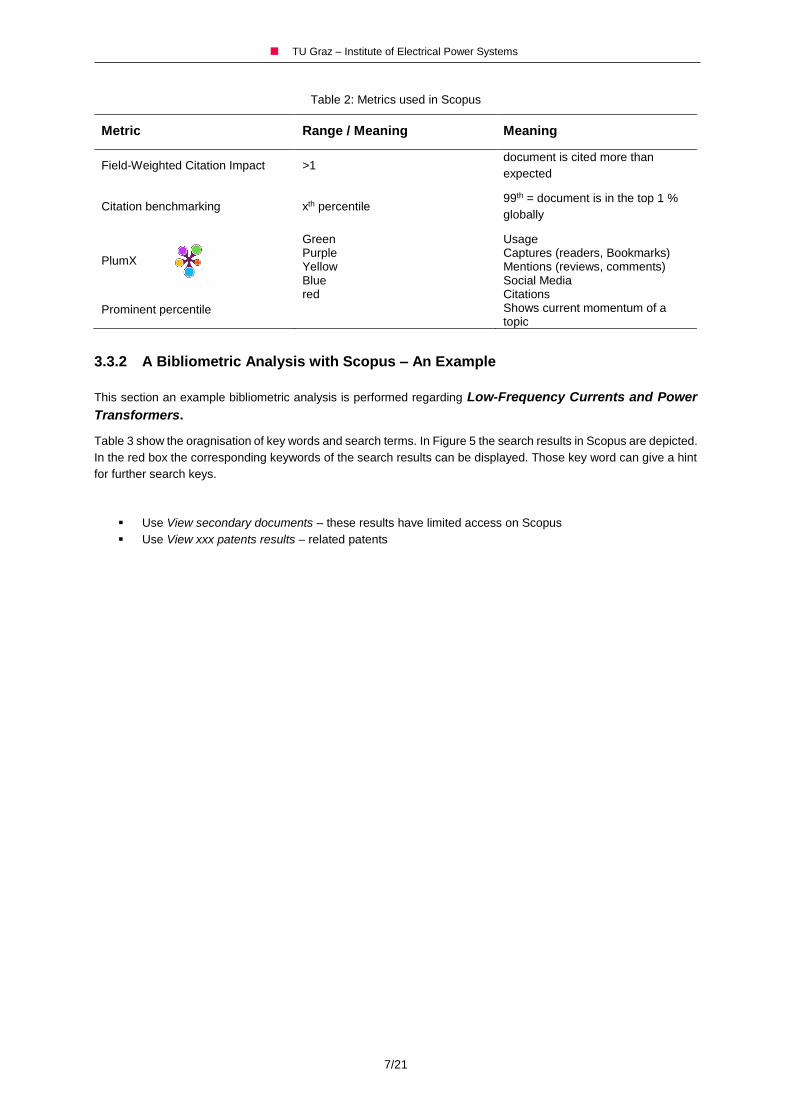
Table 2: Metrics used in Scopus
Metric Range / Meaning Meaning
Field-Weighted Citation Impact >1 document is cited more than
expected
Citation benchmarking xth percentile 99th = document is in the top 1 %
globally
PlumX
Green Purple Yellow Blue red
Usage Captures (readers, Bookmarks) Mentions (reviews, comments) Social Media Citations
Prominent percentile Shows current momentum of a topic
3.3.2 A Bibliometric Analysis with Scopus – An Example
This section an example bibliometric analysis is performed regarding Low-Frequency Currents and Power
Transformers.
Table 3 show the oragnisation of key words and search terms. In Figure 5 the search results in Scopus are depicted.
In the red box the corresponding keywords of the search results can be displayed. Those key word can give a hint
for further search keys.
Use View secondary documents – these results have limited access on Scopus
Use View xxx patents results – related patents

TU Graz – Institute of Electrical Power Systems
8/21
Table 3:Search terms and structure - power transformers and the effect of LFC; measurement system
Topic 1 Topic 2
Nam
e /
Desig
na
t
ion
Power Transformer Low-Frequency Currents
Synonyms Power grid Power system
LFC
Cate
go
ry
1) Power Transformer*
2) Instrument Transformer* Geomagnetically Induced Current*
Synonyms 2) CT | Current transformer 2) VT | Voltage transformer
GIC, Induced Current*
Su
b-c
ate
go
ry
Saturation (Effects)
Synonyms
(Core) Saturation Half-Cycle Saturation Magnetizing Current DC Bias DC Bias Current DC-Bias DC Biased DC Magnetic Bias Bias Voltage Magnetic Flux Magnetic curve Noise Vibration* Direct Current
Cate
go
ry
Power Quality LFC Source*
Synonyms
Su
b-c
ate
go
ry 1) Harmonics
2) Reactive Power Demand Classification, Class
Synonyms 1) harmonic distortion
2) Reactive Power Loss, non-active power demand,
Cate
go
ry
DC Countermeasures
Synonyms DCC | DC Compensation, Direct Current Compensation
DCBD | DC Blocking Device Mitigation, Compensation
Su
b-c
ate
go
ry
Synonyms
Wildcard: *

TU Graz – Institute of Electrical Power Systems
9/21
Figure 5: Search results from Scopus
Publications per Year
Total documents found: 321. This is the basis for this section. Figure 6 depicts the number of publications per year
of the searched key 8. From Figure 6 we can conclude, that the interest in this topic increase significantly from year
2010 on. This could probably correlate with the solar cycle 24, started in 2008 with low activity. After 2010 the
activity increased
Figure 6: Publication related to LFC and power transformers (search key *8)
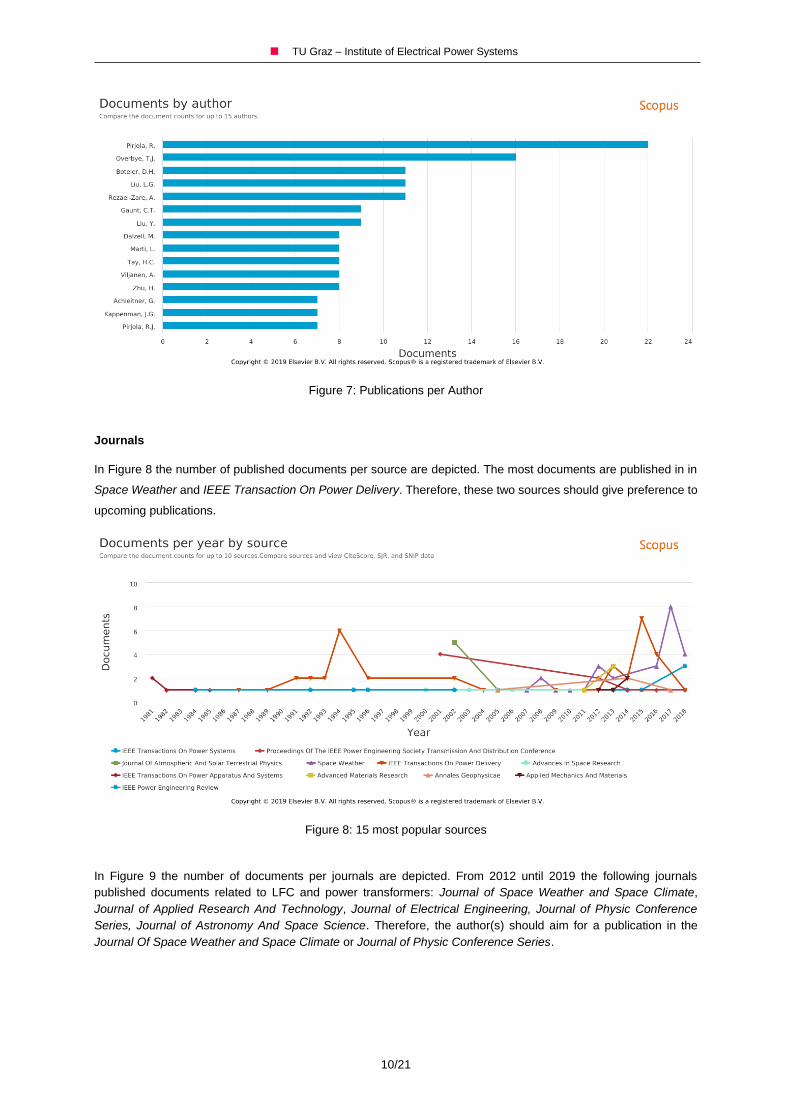
Publications per Author
Figure 7 depicts the 15 most publishing authors regarding search key 8. This figure can give a hint for co-author
ship or joint research projects.
TU Graz – Institute of Electrical Power Systems
10/21
Figure 7: Publications per Author
Journals
In Figure 8 the number of published documents per source are depicted. The most documents are published in in
Space Weather and IEEE Transaction On Power Delivery. Therefore, these two sources should give preference to
upcoming publications.
Figure 8: 15 most popular sources
In Figure 9 the number of documents per journals are depicted. From 2012 until 2019 the following journals
published documents related to LFC and power transformers: Journal of Space Weather and Space Climate,
Journal of Applied Research And Technology, Journal of Electrical Engineering, Journal of Physic Conference
Series, Journal of Astronomy And Space Science. Therefore, the author(s) should aim for a publication in the
Journal Of Space Weather and Space Climate or Journal of Physic Conference Series.

TU Graz – Institute of Electrical Power Systems
11/21
Figure 9: 15 most popular Journals
Table 4: Highly ranked Journals related to Figure 8
Document Cite Score SJR SNIP
IEEE Transactions
On Power Delivery 5.75 1.844 2.385
IEEE On Power
Systems 8.94 3.14 2.888
Space Weather 3.14 1.185 1.578
Proceedings Of The
IEEE Power
Engineering Society
Transmission And
Distribution
Conference
1.12 0.326 0.478
Journal of
Atmospheric And
Solar Terrestrical
Physics
1.71 0.633 0.977
Advances In Space
Research 1.97 0.589 1.186
IEEE Transaction On
Power Apparatus And
Systems
- - -
Advanced Materials
Research 0.08 0.121 0.179
Annales Geophysicae 1.62 0.781 0.81
Applied Mechanics
and Materials 0.07 0.112 0.0
IEEE Power
Engineering Review - 0.17 1.13

TU Graz – Institute of Electrical Power Systems
12/21
Affiliations
In Figure 10 the number of documents per affiliation are depicted (English publishing affiliations). The high ranking
affiliations should be considered for a joint research project because of their interest in the searched research field.
Figure 10: 15 most popular affiliations
In Figure 11 the number of documents per affiliations from Europe are depicted. For a joint research project, the
Finnish Meteorological Institute or the British Geological Survey should be considered.
Figure 11: 15 most popular affiliation in Europe
For the following three geographical areas the three most publishing affiliations with the last publication year in
brackets are listed below.
Affiliations for possible cooperation world-wide:
1. North China Electric Power University (2019)
2. Finnish Meteorological Institute (2016)
3. University of Illinois at Urbana-Champaign (2018)

TU Graz – Institute of Electrical Power Systems
13/21
Affiliations for possible cooperation in Europe:
1. Finish Meteorological Institute (2016)
2. British Geological Survey (2018)
3. University of Manchester (2018)
Countries
In Figure 12 the number of documents per country are depicted. The high ranking countries are the United Stated,
Canada followed by China. From this figure we can conclude which countries are interested in this research topic
and where further publication could come from or should be searched.
Figure 12:15 most publishing countries
In Figure 13 the number of documents by European countries are depicted. Only Finland and the United Kingdom
are publishing more documents in the present research field as Austria. We can conclude for the future, that more
documents are published by these countries.
Figure 13: 15 most publishing countries from Europe

TU Graz – Institute of Electrical Power Systems
14/21
The most publishing countries in the world are:
1. United stated
2. Canada
3. China
The most three publishing European countries are:
1. Finland
2. United Kingdom
3. Austria
Subject Areas
319 documents excluding the following subjected areas: Agricultural and Biological Sciences; Biochemistry,
Genetics and Molecular Biology. Form Figure 14 we can conclude, that most documents (41.2 %) are related to
engineering. For new publications the subject areas with lower percentage could be more interesting, due to lower
number of publications.
Figure 14: documents by subject area
Funding Sponsors
Figure 15 depicts the number of documents and the related sponsors. This figure can give a hint where to apply for
further research project and joint research.

TU Graz – Institute of Electrical Power Systems
15/21
Figure 15: 15 most funding organizations
3.4 Presentation of search results and conclusions from the results
Project Research Areas
Only results in English are considered (basis: 321 documents), due to readability. Table 5 lists the number of
publications related to the topics in the field of Low Frequency Currents and at the same time are related to the
topics in the field of power transformers. The green marked fields show a low number of publications are show the
research gap. Research work and publications should consider these fields.
Table 5: Research Areas and corresponding # of publication
Low Frequency Currents
GIC GIC OR Source GIC OR Source OR
Classification OR Class
Po
wer
Tra
ns
form
ers
Monitoring OR Measurement
OR Experiment 103*1 14*18 15*19
Experiment*, Monitoring,
Measurement* AND Reactive
Power OR Non-active Power 21*2 14*30 1*20
Power Quality OR
Reactive/Apparent Power OR
Harmonic* 110*3 9*29 9*21
Compensation OR
Measurement* 87*4 11*28 13*22
Compensation* OR
Mitigation* 31*5 2*27 3*23
Compensation* 7*9 0*16 0*17
Compensation* OR
Mitigation* OR Modelling OR
Simulation*
15*6 19*26 21*24
Experiment OR Monitoring
OR Measurement, AND
(Noise OR Vibration*)
10*7 3*25 3*25
Noise OR Vibration 16*13 5*12 5*12
Asymmetric* 10*14 1*15 1*15
Legend | #: <10 10-20 21-50 >51
TU Graz – Institute of Electrical Power Systems
16/21
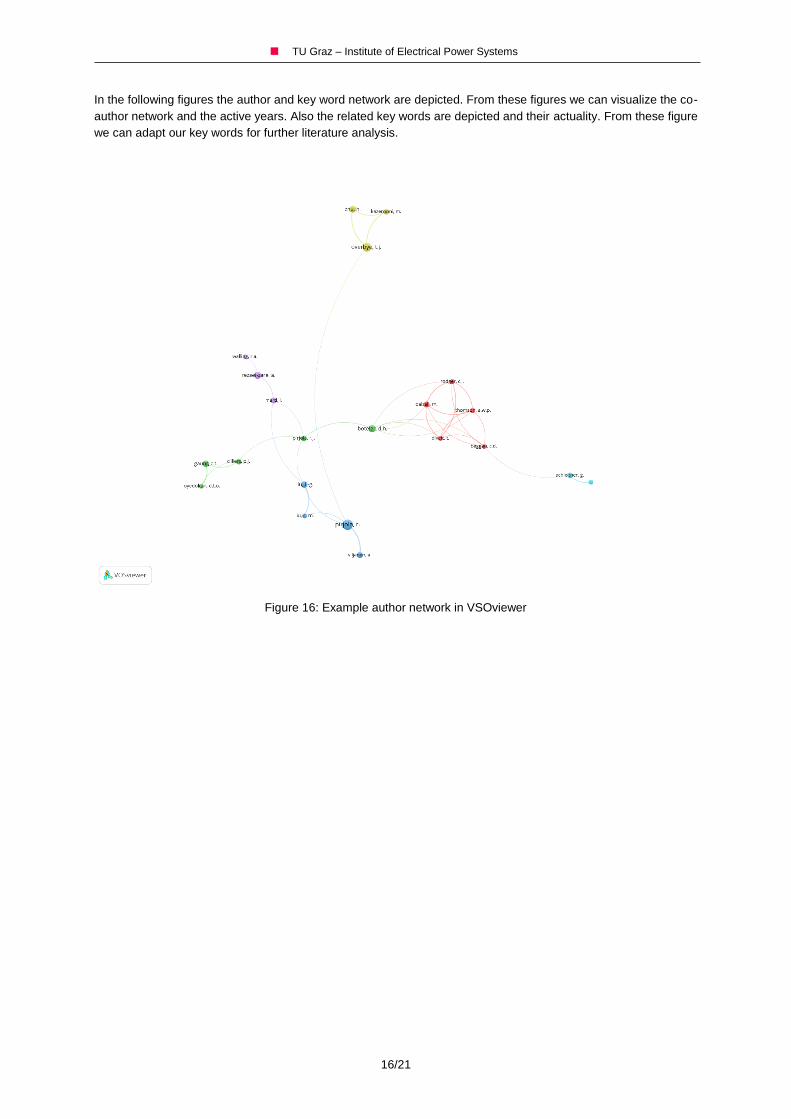
In the following figures the author and key word network are depicted. From these figures we can visualize the co-
author network and the active years. Also the related key words are depicted and their actuality. From these figure
we can adapt our key words for further literature analysis.
Figure 16: Example author network in VSOviewer

TU Graz – Institute of Electrical Power Systems
17/21
Figure 17: Authors and their most publishing years
Figure 18: Example key word network in VSOviewer

TU Graz – Institute of Electrical Power Systems
18/21
Figure 19: Key words and their most common used years of publication

TU Graz – Institute of Electrical Power Systems
19/21
4 Helpful Web Links
Austrian standards | http://lamp.tugraz.at/~karl/php/dbdetail3.php?nav=2,4,339,0
( “effects 2.0”; if you can’t find a standard there write an email to
IEEE | IEEE Wildcard Help
SpringerLink | https://link.springer.com/
Springer DozentenPLUS (2 free books per semester (hard cover) |
https://www.springer.com/de/dozenten/dozentenplus
De Gruyter | https://www.degruyter.com/
GoogleScholar | GoogleScholar Wildcard Search Tips
Citavi “Literaturrecherche” | Citavi Wildcard Searching
E-Cigré | https://e-cigre.org/
Österreichische Bibliothekenverbund | https://www.obvsg.at/
KIT Bibiliothek | https://www.bibliothek.kit.edu/cms/suchen-finden.php
TU Graz Library Search | http://tugraz.summon.serialssolutions.com/#!/
ScienceDirect | www.sciendirect.com
Elsevier | https://www.elsevier.com
Deutsche Nationalbliothek | https://dnb.de/DE/Home/home_node.html
NDLTD | http://search.ndltd.org/ (PhD thesis database)
ResearchGate | https://www.researchgate.net/
Course on TUG: Finding scientific literature and publishing your texts | LV-No.:
940.930 (winter term seminar)
Comparison of literature management tools:
http://mediatum.ub.tum.de/node?id=1127579/
academic.microsoft.com | quick overview of top authors, top journals, top
conferences, top institutions
Elektronische Zeitschriftenbibliothek | https://rzblx1.uni-regensburg.de/ezeit/

TU Graz – Institute of Electrical Power Systems
20/21
5 Helpful Software
Table 6: Software tools
Program Use Remarks
Citavi Literature organisation; Word Plug-In, BibTex
export to LaTex
Share-Ware: up to 100 titles; full
version: unlimited titles free for
TUG members/students
Visio Drawing electrical circuit; IEAN-Shape bib on
server
LaTex e. g.: TeXstudio, MikeTex 2.9
MindjetManager Create MindMaps on the computer use for
brainstorming
Microsoft Project Organize your work and identify
dependencies
VOSviewer Visualize the author network Requires .RIS-file (can be created by
Citavi)

TU Graz – Institute of Electrical Power Systems
21/21
6 Tips for your Publication
Always use the same name (your name) in all publication. For example, Mustermann, M. and not ones
Mustermann, K.. M. or Mustermann, M. K. In bibliometric analysis different wordings of your name will
count as different authors.
Citavi: Check if the author uses only one name. For example, Mustermann, M. or Mustermann, Max. If
both names are used, Citavi treat them as two different authors.