literacy for a billion: same language subtitling on...
TRANSCRIPT

Literacy for a Billion:Same Language Subtitling on TV
Brij Kothari
Library of Congress, Literacy AwardsNovember 4, 2013

India: Impressive progress
18.3
28.334.4
43.5
52.5
65.6
74
0
10
20
30
40
50
60
70
80
1940 1950 1960 1970 1980 1990 2000 2010 2020
Lit
eracy rate
(%
)
Year
India: Progress in literacy rate (7+)
Number of illiterates: 273 million (2011 Census)

Kavita, 7th GradeGulbai Tekra Slum, Ahmedabad
Problem: “Literates” who cannot read
Video Clip

Kavita’s story
Quality of teaching
Teacher absenteeism
Can decode some (not entirely illiterate)
Can’t read newspaper, simple books
No reading matter in own language

India: Reading Skills
Source: ASER 2012
46.8%53.2%
Ability of children in Class 5 to readClass 2 text (rural)
Can read
Cannot read

311
467
273
(Millions)
Readers (30+words/min)
Weak-readers
Non-readers
Problem: “Literates” who cannot read
Source: Census (2011); Kothari & Bandyopadhyay (2010)

Father of chaos theory
“Does the Flap of a Butterfly's Wings in Brazil Set Off a Tornado in Texas?"
Prof. Edward Lorenz1917 – 2008

Father of chaos theory
Prof. Edward Lorenz
“Does the Flap of a Butterfly's Wings in Brazil Set Off a Tornado in Texas?"
Is there such a butterfly for literacy?

Growth of TV in India
Viewers: 750 million (2012)
Source: Zee TV White Paper

Solution: 1st proposed in 1996
Same Language Subtitling (SLS)What you hear is what you read.

Same Language Subtitling (SLS)
Video Clip

First Implemented: State TV, Gujarat

Supporters
IIM AhmedabadClinton Global InitiativeAshokaSchwab Foundation
Google FoundationSir Ratan Tata TrustDM (World Bank)DELL GivingUSAIDLibrary of Congress
National TV networkGovt. of Karnataka
Implemented on 1 weekly TV Program in:Hindi + Telugu + Bengali + Kannada + Tamil + Marathi + Punjabi + Gujarati
Inescapable reading practice:200 Million Weak Readers
…but only 30 minutes/week.

Reading in one of the 640,000 villages: During live telecast of Rangoli on DD
Video Clip

Do people read the subtitles?
Video Clip

Watch or read?
Video Clip

Perceived Benefits
Video Clip

With subtitling: Eye-fixation on TVNo subtitling: Eye-fixation on TV
Eye-Tracking Research

Data collected independently, after 4.5 years of SLS on national TV, by AC Nielsen (ORG-CSR)
Impact on illiterate students
School only versus School + SLS
after 4.5 years
(n = 700)
25.511.7
50.5
32.4
24
55.9
0
20
40
60
80
100
No SLS (school effect
only)
SLS + School
%
Good-Reader
Early-Reader
Non-Reader

Impact on newspaper reading: Early-readers
33.7
42
34
70
0
10
20
30
40
50
60
70
80
Baseline (2002) 2007
% Reading at least once a week
Newspaper reading among early-readers
No SLS
SLS
Data collected independently, after 4.5 years of SLS on national TV, by AC Nielsen (ORG-CSR)

Ability to write any 5 words
Impact on writing among illiterate students
(n=700)
0.3 1
2124.3
45.2
72.3
0
10
20
30
40
50
60
70
80
No SLS SLS No SLS SLS No SLS SLS
Baseline 1 year after baseline 4.5 years after baseline
% Who wrote any 5
words correctly
Data collected independently, after 4.5 years of SLS on national TV, by AC Nielsen (ORG-CSR)

Ability to write complete addressIlliterate students at baseline
(n=700)
0 0.7
1214.7
34.4
56.4
0
10
20
30
40
50
60
No SLS SLS No SLS SLS No SLS SLS
Baseline 1 year after baseline 4.5 years after baseline
% Who wrote
any address
correctly
Data collected independently, after 4.5 years of SLS on national TV, by AC Nielsen (ORG-CSR)

Source: TAM, average rating of 12 episodes before and after
4.9
5.3
3.6
5.7
6.26.0
0.0
1.0
2.0
3.0
4.0
5.0
6.0
7.0
Chitrahaar (National) Rangoli (National) Chitrageet (Gujarat)
Before subtitling
After subtitling
Ratings 15%

Cost Comparison
Cost
(per person per year)
Estimated Reach
(weak readers)
SLS (Hindi) $ 0.0002 100 million
Reading reinforcement programs
$3 5 million

Liking for SLS among Deaf
88.9
11.1
0
10
20
30
40
50
60
70
80
90
100
Yes No

School for the deaf, Ahmedabad
SLS and the deaf
Video Clip

Policy challenge
Implement SLS on ALL songs, in ALL languages.
Why?
Mass literacy skills
Media access among deaf
Language learning
Ratings and popularity
Extremely low cost
Synergy with PSB’s mission
Other countries?

Clinton Global Initiative, Sept. 24, 2009
Video Clip
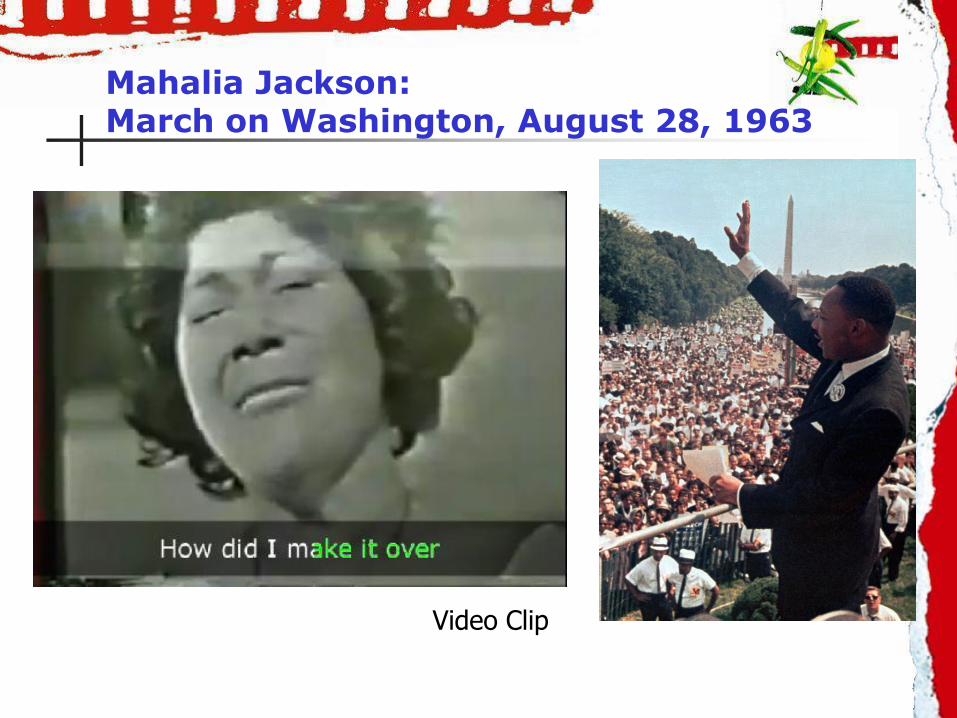
Mahalia Jackson:March on Washington, August 28, 1963
Video Clip

Is SLS a butterfly for literacy?
… that can cause a reading storm?
