literacy boost rwanda
TRANSCRIPT

Literacy Boost
Rwanda
Teacher Survey & Observation Report
April 2014
Saima Malik, Stanford University
Janvier Gasana, Rwanda Education Board
Erin Raab, Stanford University
Kijoo Cha, Stanford University
Dr. Claude Goldenberg, Stanford University
Malik, Gasana, Raab, Cha, & Goldenberg i
Acknowledgements
Many people played critical roles in the creation of the reading assessment and the collection
of data. Most importantly, we would like to thank all the head teachers, teachers and students
in Burera for their assistance in the piloting of instruments, and those in Gicumbi for their
generous participation in the teacher study.
None of this would have been possible without the oversight of the Rwanda National Ethics
Committee, the Directorate of Science, Technology, and Research at the Rwanda Ministry of
Education, and the Rwanda Education Board.
A special thanks goes to the teacher observers and everyone involved in the teacher survey,
including: Avrile Pacifique, David Rugaju, Innocent Hitimana, Marie Providence Uwera,
Jean Claude Akili, Joshua Byaruhanga, Joseph Kabarangira, Monique Niwenshuti, Pierre
Celestin Rutayisire, Molly Uwamahoro, Charles Gashaija, Tite Bizimana, Charles
Ngenedahimana, Alfred Twahirwa.
And additional thanks to the Rwanda Education Board, Ministry of Education, and Save the
Children staff in Rwanda: Olivier Rwanukwaya, Jean Nizeyimana, Bethany Ericson, David
Rugaju, Avrile Pacifique Niyibizi, Tite Bizimana, Charles Gashaija, and Molly Uwamahoro.

Malik, Gasana, Raab, Cha, & Goldenberg ii
Executive Summary
Introduction
In the autumn of 2013, researchers from Stanford University led an assessment of the teaching of
reading in the Gicumbi district of Rwanda. Coordinated by Save the Children staff, with approval
from both the Rwanda National Ethics Committee (RNEC) and the Stanford University Ethics
Review Board (referred to as the Stanford IRB), and with in partnership with the Rwanda Education
Board (REB) and the Rwandan Ministry of Education (MiniEduc), the Stanford team and its partners
designed and piloted a teacher survey and classroom observation of teachers of early Primary grade
students in the district. Save the Children conducted the teacher survey as part of their regular
monitoring protocol and the Stanford team led analysis of this survey data. The Stanford research
team and its partners collaborated in conducting the classroom observations.
The purpose of this assessment was to establish a baseline for the randomized control trial of Literacy
Boost, which began implementation in January 2014. Literacy Boost is a holistic early grades reading
program designed to help children learn to read better, both in-school through teacher training and
support, and out-of-school through community and home activities.
The key research questions to be explored in this report include the following:
How do teachers in Gicumbi approach the teaching of reading (including teachers’ knowledge,
attitudes and practice surrounding literacy instruction) at baseline?
How can this inform Literacy Boost implementation in these schools?
The teacher survey examines teachers’ knowledge, attitudes and practices surrounding literacy
instruction and the classroom observation provides a more in-depth look at classroom practices
around reading instruction for a subset of these teachers.
Context
As this report focuses on teachers, we briefly describe the general requirements for teaching in
Gicumbi. In order to get a teaching position in Gicumbi as well as in the rest of Rwanda, primary
teachers need to have a certificate in teaching graded or described as A2. A teacher must also have a
minimum of 18 year of age.
Data and Methods
Sample Selection
All teachers (those who were employed as teachers in Gicumbi district) were invited to participate in
the survey. The teacher survey was completed by 452 teachers from 102 schools across all 21 sectors
of Gicumbi district. At the end of the survey, teachers indicated their assent to be observed teaching a
Kinyarwanda lesson. Twenty-one schools were randomly selected and two teachers (mostly Primary 1
but in some cases Primary 2) within each school who had consented to be observed were selected for
classroom observation for a total of 42 teachers.
Survey Sample
A total of 452 primary school teachers completed the teacher survey. Respondents consisted of 39.6
percent male and 60.4 percent female teachers1 with a mean age of 38 years. On average, teachers
surveyed had 13 years of teaching experience with 8 years of experience at their current school. A
vast majority of teachers (90.5 percent) had completed 6 years of secondary education.
Observation Sample
1 There were fewer female teachers in the Control group than the Teacher Training (TT) only and the Literacy
Boost (LB) groups.

Malik, Gasana, Raab, Cha, & Goldenberg iii
A total of 42 Primary 1 and Primary 2 teachers (across 21 schools) were observed teaching a
Kinyarwanda lesson by Save the Children staff members. These teachers were 77.6 percent female
and 21.4 percent male. Of the classes observed, 73.8 percent were Primary 1 and 26.2 percent were
Primary 2 classrooms. There was a mean of 44.9 students (22.1 male and 22.8 female) in each class.
On average, the lessons observed lasted about 42 minutes.
Personnel
Survey and observation instruments were created and pilot tested by Save the Children staff and the
Stanford University research team prior to data collection. Items were refined so that they were
relevant to teachers and classrooms in the context of Gicumbi. Save the Children administered the
teacher survey and collected data as part of their monitoring efforts and the Stanford research team
agreed to analyze this data. Save the Children and the Stanford research team collaborated in
administration of the classroom observations.
Data Collection
Save the Children, Rwanda staff members collected survey data. Staff members explained the purpose
and methodology of the survey to teachers. Teachers who consented to participate signed a consent
form before completing the survey.
Save the Children staff members served as observers for the first round of observations. Six staff
members were divided into 3 teams of 2 observers each. Each teacher was observed twice and by two
observers on each occasion2. This was done so that reliability of classroom observations could be
assessed during the analysis phase. Observation teams also received thorough training on reducing
subjectivity in observation and inter-rater reliability during the observation pilot phase. Each teacher
was observed by a different team on each of the two observation days. Scores from the four
observations were averaged to create one composite observation per teacher. This average observation
provided a picture of typical teaching practice for that teacher.
Analysis
Quantitative data was analyzed using STATA statistical software. Data was tabulated and summarized
for simple descriptive statistics including means, standard deviations and percentages. In addition,
ANOVA and Chi-square tests were used to check for any significant differences between the Control,
Teacher Training Only and Literacy Boost groups at baseline3. Qualitative items were analyzed using
Dedoose software. Codes were developed based on teacher responses and these codes were used to
analyze frequencies and co-occurrences of the various responses.
Findings
Reading Material in the Classroom
Teachers displayed a good understanding of the importance of literacy materials over non-literacy
materials in the development of reading skills. When presented with a list of items, a majority
indicated they would purchase textbooks (77.7 percent), storybooks (61.2 percent) and flash cards
(48.4 percent) over distractor items (such as soccer balls and science equipment) to help their students
learn to read.
Teachers reported that reading materials (including textbooks, storybooks and posters) were only
present in less than half of the classrooms and that students interacted with books (other than
textbooks) daily in only 42 percent of classrooms. However few, some textbooks were found in all of
the classrooms observed. Dictionaries were found in just over half of the classrooms observed
whereas storybooks, religious books and newspapers were found in under half of the classrooms.
2 With the exception of 6 teachers, (2 of whom had 3 observations and 4 of whom had 2 observations-due to unavailability
for a follow up observation on the part of the teacher or illness on the part of an observer). 3 ANOVA and Chi-square tests revealed significant differences between groups on some items at baseline and these are
mentioned in the report. However, since these differences are not more than we would expect to see by chance we can be
assured that randomization of groups was appropriately done.

Malik, Gasana, Raab, Cha, & Goldenberg iv
Most commonly found in classrooms were textbooks in Kinyarwanda (11-50 per classroom on
average), followed by textbooks in English (11-50 per classroom on average) and some other print
material in Kinyarwanda (1-10 per classroom on average). It is important to note that these estimates
are presented as ranges that may conceal how few books were actually present. In addition, the
number of students may exceed the amount of material available in classrooms.
Observers noted that some type of print material was present on the walls of 69 percent of classrooms.
Most of the material found on classroom walls was teacher-made (54.8 percent of classrooms had
items with text in Kinyarwanda, 45.2 percent in English, 9.5 percent in French and 7.1 percent with
only images). Some of the material found on classroom walls was professionally printed or store
bought (7.1 percent of classrooms had items with text in Kinyarwanda, 21.4 percent with text in
English and 7.1 percent with images only). Very few classrooms had student-made material on the
walls (4.8 percent of classrooms had items with text Kinyarwanda, 4.8 percent in English and 2.4
percent in French). The type of material present on walls most often was words matched to pictures
whereas songs or poems were found least often on classroom walls.
Observation of General Pedagogy
In general, teachers observed provided clear instructions, responded when students were off task and
used positive discipline strategies most often. Teachers almost never promoted small group
interactions between students and students never asked questions during lessons. A minority of
teachers observed linked lessons to previous learning in class or to students’ home experiences. Only
7 percent of teachers were observed assigning literacy homework. No teachers were observed
explicitly teaching students how to handle books.
Time spent on Literacy Instruction
On average, teachers spent about 26 minutes (out of an average 42 minutes) on letter knowledge,
decoding/encoding or phonological awareness (including awareness of phonemes and syllables)
activities, about 14 minutes on reading fluency and reading comprehension activities and about 3
minutes on vocabulary instruction.
Alphabet Knowledge
The Kinyarwanda curriculum for P1 prescribes that a pupil should be able to recognize all letters of
the alphabet by end of P1 including some letter combinations. A majority of teachers surveyed (67.6
percent) felt that children should be able to identify all letters of the alphabet by Primary 1. The
baseline reading assessment found that students in Primary 1 knew only 34.7% of their letters.
The majority of teachers surveyed (82 percent) identified ‘being able to identify letters and the sounds
the represent’ as one of five most important skills for children to read well. Observers noted that
teachers or students identified letters/letter sounds in 45 percent of classrooms and students wrote
letters in their notebooks in17 percent of classrooms observed. Teachers/students wrote letters in the
air with their fingers (a kinesthetic, creative method of practicing letters) in 5 percent of the
classrooms observed. There was evidence of teachers and students participating in decoding and
encoding activities in the classroom and the activity they participated in most often (69 percent of
classrooms) was sounding out words.
Phonological Awareness
The concept that teachers seemed to struggle with the most was that of phonemes and phonemic
awareness. Based on discussions with team members in country, the concept of phonemes is
unfamiliar to teachers in Rwanda and is not usually taught in classrooms. Unfamiliarity with the
concept of phonemes may be associated with the issues faced during translation of this term on the
survey forms as well, a fact that limits our interpretation of any findings related to phonemic
awareness. Future rounds of assessment may shed light on potential benefits of phonemic awareness
instruction in the teaching of Kinyarwanda language.

Malik, Gasana, Raab, Cha, & Goldenberg v
Only 31 percent of teachers identified ‘awareness of how words can be broken down into individual
sounds’ as one of five most important skills for children to read well. While teachers seemed to have
an understanding of the concept of syllables in a word, they did not display a correct understanding of
phonemes. When asked how many phonemes are in the word ‘muraho’, only 1.4 percent correctly
responded ‘6’.
Observers noted that very few teachers identified or played with words with the same beginning,
middle and ending sounds. Almost no teachers used clapping or tapping to practice listening for
sounds in words and only a few used clapping or tapping to listen for syllables in words during
literacy lessons. There was some evidence of students generating words that contained specific sounds
(50 percent of classrooms) and listening for and identifying a sound within a word said orally (26
percent of classrooms). Teachers and students in very few classrooms separated words or syllables
into phonemes and teachers hardly ever made explicit mention of breaking words up into syllables.
Vocabulary
Only 20 percent of teachers surveyed identified ‘having a good vocabulary’ as one of five core
reading skills and vocabulary instruction took up the least amount of observed literacy instruction
time (mean=3 minutes). However, teachers seemed to display a strong understanding of activities that
would develop vocabulary skills among students. During classroom observations, while teachers
taught the meanings of words, less than half of the teachers taught words related to the text children
had read. Almost none of the teachers explicitly taught the orthographic (standardized system for
using a particular writing system) and morphological (identification, analysis, and description of the
structure of a given language) structures of the words and only half practiced new vocabulary words
with students. Only a few teachers taught the meanings of words by having students generate
synonyms or antonyms for words.
Reading Fluency
Of teachers surveyed, 72 percent identified ‘reading accurately with proper pacing and intonation’ as
one of five core skills for reading well. A majority of teachers surveyed (84.5 percent) reported an
accurate understanding of what it means to read fluently. While teacher survey data indicates that
teachers do not model/exhibit fluent reading to students regularly (only about 9 percent reported doing
so daily), a majority of the teachers observed (90 percent) modeled fluent reading in the classroom.
Some type of text (textbook, storybook, newspaper etc.) was read out loud in 95.2 percent of the
classrooms observed. Teachers were observed encouraging students to read fluently (88 percent) and
explicitly teaching students about fluent reading (83 percent) during lessons.
However, all students did not have the opportunity for independent reading out loud daily. While
some students read individually to the entire class during observations, the number of students in the
class (mean=44.9) would likely inhibit every student being able to do so regularly.
Reading Comprehension
While a majority of teachers (82 percent) identified ‘understanding what you read’ as one of five core
reading skills, survey responses indicate that many teachers were unclear about which specific skills
are associated with successful comprehension of text that is read (a notable number of teachers
selected options such as ‘reading out loud without mistakes’ (39.3 percent), ‘reading out loud with
accuracy’ (35.1 percent) and ‘repeating a text from memory’ (29.1 percent) from a list of options
defining what it means to comprehend a text. According to teacher report, the strategies used to teach
reading comprehension strategies most often in classrooms observed involved asking questions about
text (87 percent) and asking students to summarize text (82 percent).
Observation of Teacher Questions
On average, teachers called on about four students during the lesson. Most of the questions the
teachers asked students were closed ended, short answer questions (questions that elicit ‘Yes/No’
responses or very short responses such as ‘what item did the boy leave at home?’) When students
responded to questions incorrectly, teachers observed had a variety of responses including calling on

Malik, Gasana, Raab, Cha, & Goldenberg vi
another student, providing the right answer, repeating the question and providing clues about the right
answer.
Literacy Assessment
Of the teachers surveyed 97.6 percent reported tracking students’ literacy skills and progress in some
way. Teachers report many students struggling with each of the five core literacy skills. Reading
fluency was the skill that students were reported to have the most difficulty with, followed by letter
identification and writing letters.4
Most of the teachers observed (98 percent) provided informal assessment to individual students during
the lesson while only 29 percent provided formal assessment. While a majority of teachers (83
percent) kept summative assessment records, very few teachers (2 percent) kept formative assessment
records of their students.
Literacy Homework
Fewer than half of the teachers surveyed reported providing any regular literacy homework to their
students and teachers assigned literacy homework in only 7 percent of classrooms observed.
Second Language Learners in the Classroom
A quarter of teachers (24 percent) indicated that they had students in their classrooms whose home
language was something other than Kinyarwanda (while 43 percent of teachers observed indicated
this to be the case). About 76 percent of the students who have a home language other than
Kinyarwanda are reported as having difficulty understanding instructions in the classroom. Only 38
percent of teachers of second language learners are fluent in the students’ home language, 21 percent
are conversational and 7 percent know some words and phrases. Over half of the teachers of second
language learners report never using the students’ home language in class in order to clarify concepts.
Recommendations
Given that frequent exposure to reading material is essential to reading development, provision of
books (and other reading materials) to classrooms where they are not present is a necessary first step
towards building students’ literacy skills. In addition, it is recommended that LB training include
guidance regarding the importance of frequent exposure to reading material to literacy acquisition as
well as help teachers to develop strategies to effectively incorporate the use of books (other than
textbooks) into lessons.
It is recommended that the LB program underline the importance of print material in the environment
of young literacy learners and encourage teachers to create print-rich environments for their students.
In addition, it is recommended that material displayed on classroom walls include examples of various
types of print including letters of the alphabet, syllables, words matched to pictures, sentences, songs
and poems.
Based on teacher responses to survey items, there may be a need to improve teacher knowledge
regarding phonemes as well as the importance of phonological awareness and vocabulary skills to
reading success. However, further research is necessary to determine if phonemic awareness is truly
critical for successful reading acquisition in young children. Nonetheless, it is recommended that an
understanding of phonemes be emphasized during the teacher-training component of LB
implementation. Strategies that are effective in teaching vocabulary skills must also be emphasized
with teachers during LB implementation.
4 There was a significant difference between groups in terms of understanding words in Kinyarwanda with more
students reported to be struggling with that skill in the control group (41.9 percent) than the TT only group (28.9
percent). Additionally, significantly more students were reported to be struggling with decoding in the control
group (51.1 percent) than the TT only group (37.6 percent).

Malik, Gasana, Raab, Cha, & Goldenberg vii
Furthermore, classroom observations suggest that there is a need to support teachers in developing
creative strategies to teach letter knowledge, reading comprehension and reading fluency.
It is recommended that LB expose teachers to research regarding the benefits associated with early
involvement in literacy activities and encourage a culture where students begin to learn letters prior to
the start of Primary 1.
While teachers do focus on letter knowledge activities, there is a need for supporting teachers to do so
in more varied, creative ways (one such way may be writing letters in the air with fingers) that
provide students with opportunities to practice their letters.
The LB program should aim to increase teacher knowledge regarding the important features of
reading out loud to students (with prosody, i.e. appropriate rhythm, stress, and intonation), the
benefits associated with reading out loud regularly to young literacy learners, and encourage teachers
to increase the frequency of this teaching strategy. Additionally, while it is encouraging that many
teachers report students reading out loud regularly, it is important that all teachers allow students
opportunities to practice reading out loud so that students are able to practice reading fluently. The LB
program can encourage teachers to create more opportunities for students to read individually,
providing them with greater practice and allowing for more productive feedback when it comes to
fluency.
The LB program should support teachers in learning the wide variety of strategies that are useful in
teaching students to comprehend text. By having students participate in activities such as
summarizing a text, discussing their opinions of content read or linking text to their own life
experiences, teachers can enhance students’ comprehension beyond basic facts contained in text.
These strategies should be highlighted during LB implementation.
Currently, teachers appear to be asking mainly fact-based questions about text students read. LB
training can encourage teachers to ask questions that help students to think more deeply about content
that they are exposed to and allow students to be more creative and expressive in their dialogue about
text they read.
Information regarding the importance of formative assessment as well as strategies to conduct and
record this type of assessment is essential to include in LB implementation. Assignment of literacy
homework should also be encouraged during LB implementation so that children have the opportunity
to practice literary skills beyond the walls of their classrooms.
If the home language is indeed different than the language of instruction, it is imperative that teachers
employ strategies that will ease learning for these second language learners. These strategies could
include speaking clearly at a comfortable pace, using the home language strategically (brief
explanations or definitions), and employing cognates (words that look and/or sound the same or very
similar in both the home language and Kinyarwanda) during lessons to aid comprehension. It is
recommended that these strategies that are useful for the instruction of second language learners be
highlighted during LB implementation so that those students whose home language is not
Kinyarwanda may fully benefit from the lessons presented.
Conclusion
Teacher Baseline assessment indicates that there are some gaps in teacher knowledge regarding the
core skills of literacy development. When asked which five skills are most important in learning to
read, 82 percent of teachers surveyed included letter knowledge, 82 percent included reading
comprehension, 72 percent included reading fluency, 31 percent included phonological awareness
(translated as identifying constituents within a word) and 20 percent included vocabulary in the list.
There appears to be a lack of clear understanding among teachers regarding the concept of phonemes
and phonemic awareness activities did not occur in all classrooms (although words with specific

Malik, Gasana, Raab, Cha, & Goldenberg viii
sounds were generated in 50 percent of classrooms and specific sounds with a spoken word were
identified in 26 percent of classrooms).
Classroom observations provide evidence that although teachers focus on some skills (letter
knowledge, reading comprehension and fluency) in Primary I and Primary 2 classrooms, they are
being taught in very basic ways indicating that teachers could benefit from support regarding more
creative ways to teach them. Only a minority of teachers considered vocabulary one of the core
reading skills and teachers observed spent the least amount of time on vocabulary instruction.
A lack of clear understanding among teachers regarding the core skills of reading development may
ultimately impact student acquisition of literacy skills. Given that Literacy Boost has as strong teacher
training component that highlights these core skills as well as supports teachers to adopt evidence
based strategies for teaching reading within the local context, the program has the potential to
positively impact literacy instruction in Gicumbi. The recommendations provided below will help
target LB implementation in the district and strengthen the teaching of literacy skills in classrooms.
Follow-up assessments will provide insight into the effectiveness of teacher training in this context.

Table of Contents
Acknowledgements ................................................................................................................... i
Executive Summary ................................................................................................................. ii
1 Introduction ........................................................................................................................... 1
2 Context ................................................................................................................................... 1
3 Data and Methods ................................................................................................................. 2
3.1 Sample Selection ......................................................................................................................................... 2
3.2 Instrument Development .......................................................................................................................... 2
3.3 Data Collection ........................................................................................................................................... 3
3.4 Data Analysis ............................................................................................................................................... 4
4 Findings .................................................................................................................................. 5
4.1 Demographics of Teachers Surveyed .................................................................................................... 5
4.2 Demographics of Classrooms Observed ............................................................................................... 5
4.3 Teacher Report of Reading Material in the Classroom. ................................................................... 6
4.4 Books Observed in the Classroom ......................................................................................................... 7
4.5 Print Material Observed on the Walls .................................................................................................. 9
4.6 Teacher Knowledge. ................................................................................................................................ 10
4.7 Literacy instruction in the classroom. ................................................................................................. 12
4.8 Teacher Report of Reading Activities ................................................................................................. 12
4.9 Teacher Report of Use of Books (other than textbooks)................................................................. 12
4.10 Components of Reading Development .............................................................................................. 13
4.11 Time Spent on Reading Activities ...................................................................................................... 13
4.12 Letter Knowledge ................................................................................................................................... 13
4.13 Phonemic Awareness ............................................................................................................................. 15
4.14 Vocabulary .............................................................................................................................................. 17
4.15 Reading Fluency ..................................................................................................................................... 18
4.16 Reading Comprehension ...................................................................................................................... 21
4.17 Literacy Homework............................................................................................................................... 23
4.18 Teaching Practice and Student Engagement................................................................................... 24
4.19 Student Achievement, Literacy Assessment and Teacher Feedback ........................................ 25
4.20 Language of Instruction ....................................................................................................................... 27
5 Recommendations for Literacy Boost Implementation................................................... 28
6 Conclusion ........................................................................................................................... 29
References ............................................................................................................................... 31
Appendix A: Descriptive Statistics ....................................................................................... 33

Malik, Gasana, Raab, Cha, & Goldenberg 1
1 Introduction
This report presents findings from teacher surveys and classroom observations conducted between
August and October 2013 as part of the baseline assessment of the randomized trial of Literacy Boost
in Rwanda.
Teachers were recruited from the 102 schools that participated in a randomized control trial of Save
the Children’s Literacy Boost program. Following collection of the baseline data, the 21 sectors of
Gicumbi district were assigned to either receive Literacy Boost (LB group), the teacher training part
of Literacy Boost (TT only group), or to receive no program support from Save the Children for the
initial phase of the project (Control group). The teacher survey covered 452 teachers from 102 schools
across these 21 sectors of Gicumbi district. The classroom observation covered 42 teachers from 21
schools within the district.
This study examines teacher beliefs and practice related to the main components of reading
development including letter knowledge/alphabetic principle, phonemic awareness, vocabulary,
reading comprehension and reading fluency. The teacher survey examines teachers’ knowledge,
attitudes and practices surrounding literacy instruction and the classroom observation provides a more
in-depth look at classroom practices around reading instruction for a subset of these teachers. Data
gathered through the teacher survey and classroom observations is presented to provide an idea of the
type of literacy instruction students receive in classrooms in participating schools. This understanding
will be used to inform implementation of Literacy Boost in this region as well as provide a baseline
against which to compare the literacy beliefs and practices of teachers following participation in
teacher training or the Literacy Boost program.
The key research questions addressed in this report include the following:
I. How do teachers in Gicumbi approach the teaching of reading (including teachers’
knowledge, attitudes and practice surrounding literacy instruction) at baseline?
II. How can this knowledge inform Literacy Boost implementation in these schools?
The report first describes the research methods used including sampling, instrument development,
data gathering and analysis. Then it presents findings regarding availability of reading material in
classrooms as well as teachers’ knowledge, attitudes and practices regarding literacy instruction. The
report concludes with recommendations for implementation of Literacy Boost in country.
2 Context5
As this report focuses on teachers, we briefly describe the general requirements for teaching in
Gicumbi. In order to get a teaching position in Gicumbi as well as in the rest of Rwanda, primary
teachers need to have a certificate in teaching graded or described as A2. A teacher must also have a
minimum of 18 year of age.
The literacy rate in Gicumbi is 70.5 percent which is similar to the national level 67.7 percent with at
least 13 percent of men to 11.1 percent women having completed primary education.
Northern Province statistics show that 15.2 percent of the population has no education, while 70.2
percent have attained primary education and 13.2 percent have attained secondary education.
Completion of primary school enables individuals contribute largely in physical economic
development activities like agriculture and animal husbandry, making traditional handcraft, carpentry,
commerce and trade, motorcycle transport, some load carriers in town. Of recent, many people are
involved in political responsibilities as well as all the above activities do not impede them from
5 Source of all the data in this section come from the Rwanda Demographic and Health Survey 2010

Malik, Gasana, Raab, Cha, & Goldenberg 2
participating in different political activities like leadership for example. In this area you can find some
people who are village leaders, local defenses, in charge of community policing, etc.
Individuals who have completed secondary studies in Gicumbi district are involved in a wide range of
activities including those listed above. Many of them are able to do jobs that have slightly advanced
skills than the primary leavers or those who didn’t have a chance to complete primary. Often
completion of secondary education gives individuals more chances of employment based on post-
secondary education including technical and vocation responsibilities. Secondary leavers often get
training in education and end up in primary school teaching. A number also take up local leadership
responsibilities including becoming Executive Secretaries of cells, secretaries in various institutions
as well as veterinary assistants and at the cells levels. Other characteristic jobs include being
accountants, cashiers in Savings and Credit Cooperatives, nurses, working in the policemen, serving
in restaurants and bars, ticket inspectors on buses etc. A significant number also remain unemployed
due to a range of reasons including mainly low levels of education.
A significant proportion of the population of Gicumbi district live on agriculture with a majority of
the people involved in crop production and others involved in small scale animal husbandry. The
district is largely rural with a hilly landscape. A section of the population also works on tea
plantations mainly in the low laying swampy valleys. The district has wide rice fields in different
wetland valleys made up of small patches owned by individuals. This often enables rice producers to
cultivate at the same time and sell collectively. Other sources of livelihood include stone quarry
business and charcoal making.
3 Data and Methods
3.1 Sample Selection A survey of teaching practices was conducted with all willing teachers in primary schools in the
Gicumbi district of Rwanda. The criterion for inclusion was that an individual be employed as a
teacher in the Gicumbi district. A total of 452 teachers completed the survey. Teachers were asked to
indicate on the survey form whether they would allow researchers to observe their teaching practice.
Ninety four percent of the teachers surveyed agreed to be observed. For observation, 21 schools were
randomly selected and two (either Primary 1 or Primary 2) teachers from within each school who had
agreed to the observations were observed, for a total of 42 teachers. Preference was given to Primary
1 teachers but in schools where two Primary 1 teachers were either not available or had not agreed to
be observed, a Primary 2 teacher was observed.
3.2 Instrument Development 3.2.1 Teacher Survey
The Stanford research team collaborated with Save the Children’s Education team in Gicumbi district
to develop the teacher survey form. Survey items were based on content outlined in the Literacy Boost
Teacher Training Manual and aimed to investigate teacher understanding of components of literacy
development, teaching and assessment strategies and the teaching of literacy skills to second language
learners. Members of the Stanford research team drafted the survey, trained the Education team on the
instrument remotely and sought their feedback for adjustments to the form. Following training, the
Education team translated the revised survey form into Kinyarwanda and piloted it with 9 teachers in
a neighboring district. The form was also translated back to English to confirm that the intended
meaning of items was retained during translation6. The Education team provided feedback from the
6 A note about translation: Translation of the Kinyarwanda version of the survey from Kinyarwanda back to
English revealed that the term ‘phonemic awareness’ had been translated in different ways on different items
(e.g. as ‘constituents of a word’ and ‘to know how words are pronounced’). These translations do not fully
capture the intended meaning of the term. This error was noted following survey data collection and appropriate
adjustments could not be made to the form. Since the translation did not accurately capture the intended
meaning of phonemic awareness, any findings regarding teacher understanding of phonemic awareness from the
survey form are limited.

Malik, Gasana, Raab, Cha, & Goldenberg 3
pilot to the Stanford team regarding the contextual relevance of items, item redundancy, any
challenges in survey administration and survey completion time. Following this feedback, the
Stanford team made further adjustments to the survey form. The final form consisted of 6 sections and
45 items and had a completion time of approximately one hour. The last item on the survey form
sought teacher permission to observe their classroom during a Kinyarwanda lesson.
3.2.2 Classroom Observation
The Stanford research team created the teacher observation form in order to assess the presence and
use of print material in the classroom and literacy instruction practices of teachers in Gicumbi at
baseline. Observation items were based on content outlined in the Literacy Boost Teacher Training
manual and included checks for presence and use of reading material, explicit instruction of and
strategies used to teach the five components of literacy development, classroom management and
assessment strategies used by the teacher and literacy instruction for second language learners.
Members of the Gicumbi Education team served as observers for the baseline classroom observations.
The Stanford research team trained the observers on the observation instrument in person. Training
included piloting the form in 14 classrooms in a neighboring district. The team held an extensive
debriefing and discussion following each pilot session with the aim of developing a shared
understanding of items to try to achieve high inter-rater reliability and revise items to be more
relevant based on experiences in the field. Items were modified based on both contextual relevance
and to facilitate coding and inter-rater agreement.
The final form consisted of 196 items, most of which required observers to estimate the number of
print materials (e.g. tick ‘Yes’ or ‘No’), to indicate presence of a teacher behavior/reading activity
(e.g. tick ‘Yes’ or ‘No’), or indicate frequency of a behavior/activity on a scale (e.g. tick ‘Never’, ‘A
Few Times’, ‘Sometimes’ or ‘Frequently’.
3.3 Data Collection 3.3.1 Teacher Survey
Once survey development was complete, the Gicumbi Education team administered the survey with
teachers in the district as part of their regular monitoring protocol. Teachers signed consent forms
prior to survey administration. Teachers were given the survey, instructed to complete the form
independently and return it to the Education team member at the school.
3.3.2 Classroom Observation
Members of the Gicumbi Education team served as observers for the baseline observation of
classroom teaching. Observers participated actively in piloting the tool and modifying items based on
pilot feedback. In order to maximize inter-rater agreement, each item was discussed during the pilot
phase until a shared understanding of the item and its corresponding scale was reached. Each
classroom observation was conducted by two independent observers on two separate occasions (four
observations total7) so that inter rater agreement could be assessed during the data analysis phase.
Two team members were paired as co-observers and remained in this pairing for all classroom
observations.
Teachers had indicated they would participate in the observation study when filling out the teacher
survey. They also read and signed a more in-depth consent form, approved by the Rwanda National
Ethics Committee and by the Stanford University Human Subjects Internal Review Board prior to the
classroom observation. Observation pairs were present in the classroom for the duration of a lesson,
and filled out the observation form during and immediately after observing. In some cases, if
clarification was required (e.g. regarding presence of formal assessment records or location of books)
observers spoke briefly with the teacher following the lesson. Observers did not share or discuss their
individual observations with their partners.
7 With the exception of 6 teachers, (2 of whom have 3 observations and 4 of whom have 2 observations-due to
unavailability for a follow up observation on the part of the teacher or illness on the part of an observer)

Malik, Gasana, Raab, Cha, & Goldenberg 4
3.4 Data Analysis 3.4.1 Teacher Survey
Data from the teacher surveys was entered into excel by Save’s Education team members. The
original forms were kept in the Gicumbi office and the secondary data excel files (with names of
teachers removed) were sent electronically to the Stanford research team. Data entry accuracy was
checked through double entry of a randomly selected 10 percent of the data. Data entry accuracy for
the quantitative survey data was 98.9 percent. Stanford team members cleaned and analyzed the
quantitative data using Stata statistical analysis software. Data was tabulated and summarized for
basic descriptive statistics such as means, standard deviations and percentages. ANOVA and chi-
square tests were used to check for any differences between groups at baseline.
3.4.2 Qualitative Data
The qualitative items included in this report (teacher description of reading activities used most
frequently in the classroom) were analyzed using the analysis software Dedoose. Using the survey
form, Literacy Boost toolkit, and discussions with Rwandan teachers, the initial codes of Phonemic
Awareness, Letter – Sound correspondence, Storytelling, Vocabulary, Reading Fluency, Reading
Comprehension, and Writing were established. As new potential codes emerged, they were first
recorded as memos, then, if they appeared at least five times, a new code was created and applied to
all relevant answers.
Each answer given by teachers was coded individually (i.e. they were not coded by combining the two
answers each individual teacher provided). Some codes were specific to who the actor was (i.e.
teacher does something or students do something), other codes were used to specify the category of
literacy skill (i.e. reading fluency or letter-sound correspondence, and still other codes were used to
disentangle specifics within activities (i.e. if only individual words were read, or if the reading activity
was from the blackboard or a text).
The number of codes that could apply to any particular answer was not limited; that is, each answer
could be coded for several different features at once. For instance, Participant 323 answered
“Reading aloud a text for children, gives the meaning of the new words after student read one by one
encouraging who read fluently.” This was coded with all of the following: Teacher models, Reading
text, Reading fluency, Vocabulary, Students Show/do, and Teacher feedback/encouragement.
After the initial round of coding, the codes and results were reviewed to be sure they were accurately
representing the data. A few codes were deleted because they did not contribute to making meaning
from the answers, and a few had their definitions revised and were recoded. The most substantive
change was in the “Reading Fluency” code. After the initial coding, it became clear there were
actually two different kinds of answers emerging – those that specifically referenced a focus on
“fluency” (i.e. mentioned the word fluency, or “respecting punctuation”, or the teacher modeling
reading aloud), and those that were simply a “reading aloud” activity without explicit reference to
building fluency. There is no overlap between the two codes so we could still look at the two
holistically. We chose to make this distinction, because experience from classroom observations
made it clear that not all “reading aloud” was actually focused on building fluency. In fact, many
times, “reading aloud” as an activity consisted of was decoding text in a mono-tonic, almost staccato,
tone of voice. Dividing the code in two allowed us to see how many teachers were explicit about
focusing on fluency as a skill in their reading aloud activities.
3.4.3 Classroom Observation
Data from the classroom observations of 42 teachers was entered into excel by Education team
members. The original forms were kept in the Gicumbi office and the secondary data excel files (with
teacher names removed) were shared electronically with the Stanford research team. Data entry
accuracy was checked through a double entry of a randomly selected10 percent of the data. Data entry
accuracy for the observation data was 98.5 percent. Stanford team members cleaned and analyzed the
data using Stata statistical analysis software. Data was tabulated and summarized for basic descriptive

Malik, Gasana, Raab, Cha, & Goldenberg 5
statistics such as means, standard deviations and percentages. Anova and chi-square tests were used to
check for any differences between groups at baseline.
4 Findings
4.1 Demographics of Teachers Surveyed A total of 452 primary school teachers completed the teacher survey. Respondents consisted of 39.6
percent male and 60.4 percent female teachers; mean age was about 38 years. As Table 1 shows,
teachers surveyed had a mean of 13 years of teaching experience and 8 years of teaching at their
current school. A vast majority of teachers (90.5 percent) had completed 6 years of secondary
education.8
Table 4.1a: Teacher Survey Demographics
Control
TT
only LB Sig. Diff. Overall
% Female Teachers 47.52 65.5 67.42 * 60.36
N 141 171 132 444
Mean Years at Current School (SD)
8.74
(7.71)
7.62
(6.25)
8.52
(7.24) − 8.24 (7.03)
N 141 173 134
448
Mean Years of Teaching (SD)
12.82
(10.36)
12.66
(8.85)
14.66
(8.98) − 13.3 (9.4)
N 140 174 132
446
Mean Age (SD)
37.74
(9.66)
36.96
(8.7)
38.59
(8.07) −
37.69
(8.85)
N 144 173 133
450
Highest Formal Education
% 4-year University (A0) 3.47 2.3 1.49 − 2.43
% 2-to-3-year University (A1) 3.47 2.87 2.24 − 2.88
% 7 years of Secondary School (D7) 1.39 0 0 − 0.44
% 6 years of Secondary School (A2) 88.19 92.53 93.28 − 91.37
% 5 years of secondary School (D5) 0.69 0.57 0 − 0.44
% 4 years of secondary School (D4) 0.69 1.15 0 − 0.66
% 6 years of primary School (P6) 0.69 0 0 − 0.22
N 144 174 134 452 *
Significant difference between Control and TT Only groups as well as between Control and LB groups
As Table 4.1a shows, 95.1 percent of teachers were government schoolteachers. Most (98.0 percent)
were responsible for teaching Kinyarwanda and mainly taught students at the Primary 1 (32.7
percent), Primary 2 (22.7 percent) and Primary 3 (20.9 percent) levels.
4.2 Demographics of Classrooms Observed A total of 42 teachers (77.6 percent female and 21.4 percent male) were observed teaching a
Kinyarwanda lesson. On average, lessons observed lasted about 42 minutes. Of the classes observed,
73.8 percent were Primary 1 and 26.2 percent were Primary 2 classrooms. There was a mean of 44.9
students (22.12 male and 22.80 female) students in each class observed.
A majority of the classrooms observed (97.6 percent) had adequate seating space for students There
were chairs or benches with tables in most (93.8 percent) of the classrooms. The classrooms seemed
well organized (95.2 percent) and blackboards were legible in all of the classrooms. Although natural
8 The Control group had significantly fewer female teachers than the TT only and LB groups.

Malik, Gasana, Raab, Cha, & Goldenberg 6
light was the only source of light in a majority (95.2 percent) of the classrooms, observers thought that
there was sufficient light for reading/learning in all of the classrooms observed.
Table 4.2a. Teachers and Classrooms observed
Gender of Teachers Observed
Control TT only LB
Sig.
Diff Overall
% Male 35.71% 21.43% 7.14% - 21.43%
% Female 64.29% 78.57% 92.86% - 78.57%
Grade Level Observed
% Primary 1 57.14% 85.71% 78.57% - 73.81%
% Primary 2 42.86% 14.29% 21.43% - 26.19%
Mean number of students in classrooms observed
Male
21.64
(5.50) 21.5 (3.76) 23.21 (6.17) -
22.12
(5.17)
Female
23.43
(4.86)
22.07
(4.34) 22.90 (7.97) -
22.80
(5.82)
Total
45.07
(8.01)
43.57
(6.01)
46.12
(13.42) -
44.92
(9.49)
Mean condition of classrooms
Adequate seating space1 1.68 (.33) 1.63 (.40) 1.27 (.63) - 1.53 (.49)
Well organized classroom1
1.59 (.33) 1.45 (.43) 1.46 (.43) - 1.50 (.44)
Legible blackboard1 1.88 (.21) 1.82 (.32) 1.89 (.23) - 1.86 (.25)
Adequate lighting1 1.91 (.19) 1.86 (.31) 1.89 (.23) - 1.89 (.24)
Overall room condition2 3.07 (.55) 2.13 (.42) 2.37 (.61) * 2.53 (.66)
Mean Observation Time (in minutes)
41.79
(8.52)
39.38
(6.13)
44.01
(8.27) -
41.96
(7.71)
N 14 14 14 42 1 0=no, 1=somewhat, 2=yes
2 1=very poor, 2=poor, 3=good, 4=excellent
*significant differences between Control and TT only and Control and LB groups
4.3 Teacher Report of Reading Material in the Classroom.
The presence of various kinds of reading material in a child’s environment, particularly in the early
years, has been linked to reading achievement and ability. In order to get a baseline assessment of
how much reading material is available to students in classrooms in Gicumbi, teachers were asked to
specify the type and amount of reading material available in their classrooms. Survey results based on
teacher report indicated that most classrooms were lacking reading materials. According to teacher
report, less than half of the classrooms contained any reading material (Fig.1). School textbooks were
reportedly present in only 46 percent of the classrooms and storybooks were present in only 23
percent of the classrooms.

Malik, Gasana, Raab, Cha, & Goldenberg 7
Table 4.3a shows the mean number of each type of reading material reported to be present in
classrooms. Teachers reported a mean of about 15 textbooks, 4 storybooks and 2 posters with words
in each classroom.
Table 4.3a. Mean Number of Reading Materials Reported in the Classroom
Control
(SD)
TT only
(SD)
LB
(SD)
Sig.
Diff. Overall
Storybooks 4.24 (9.23) 4.68 (11.35) 2.62 (7.25) − 3.92 (9.63)
N 137 168 130
435
Newspapers 1.19 (6.99) 0.11 (.99) 0.23 (1.29) − 0.49 (4.07)
N 144 174 134
452
Textbooks 15.12 (21.47) 16.05 (19.31) 13.77 (20.83) − 15.09 (20.42)
N 132 168 126
426
Posters with words 1.26 (4.85) 3.34 (12.99) 1.01 (4.04) − 1.99 (8.85)
N 144 174 134
452
Magazines 0.26 (2.51) 0.55 (3.83) 0.04 (.27) − 0.31 (2.77)
N 144 174 134
452
Hand-made books 0.14 (.99) 0.06 (.76) 0.48 (5.19) − 0.21 (2.91)
N 144 174 134
452
Religious books 0.38 (1.04) 0.17 (.60) 0.34 (1.19) − 0.29 (.95)
N 139 173 131
443
Comics 0.41 (1.66) 0.23 (1.12) 0.19 (1.28) − 0.27 (1.36)
N 130 161 130
421
Outliers in the number of reading materials (i.e., storybooks (90 or more), textbooks (80 or more),
posters (90 or more), religious books (10 or more), and comics (10 or more)) were dropped
considering the high likelihood of misunderstanding the items by respondents based on the local
context.
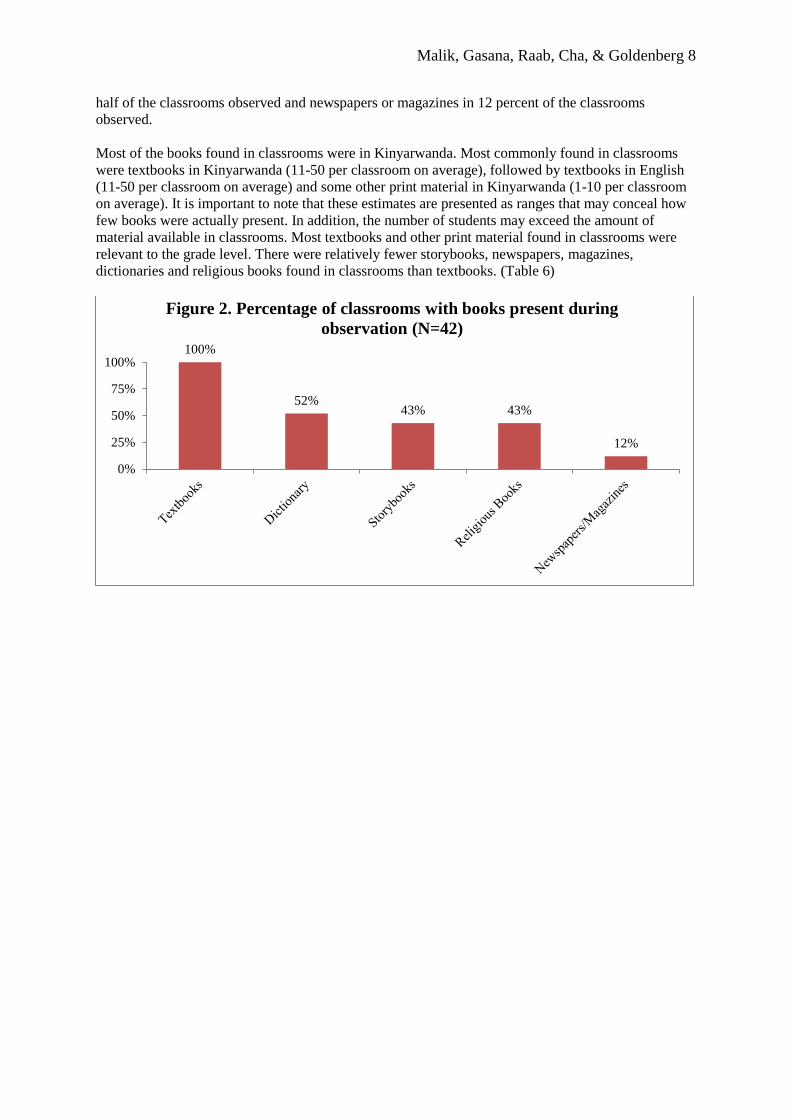
4.4 Books Observed in the Classroom Classroom observers found textbooks in every class observed. Figure 2 shows that observers found
dictionaries in just over half of the classrooms observed, storybooks and religious books in just under
46%
23%
13% 13%
6% 4% 3% 2%
0%
5%
10%
15%
20%
25%
30%
35%
40%
45%
50%
Textbooks Storybooks Posters with
words
Religious
books
Comics Newspapers Magazines Hand-made
books
Figure 1. Percentage of Total Classrooms Where Reading Material
was Reported Present
(N=452)
Malik, Gasana, Raab, Cha, & Goldenberg 8
half of the classrooms observed and newspapers or magazines in 12 percent of the classrooms
observed.
Most of the books found in classrooms were in Kinyarwanda. Most commonly found in classrooms
were textbooks in Kinyarwanda (11-50 per classroom on average), followed by textbooks in English
(11-50 per classroom on average) and some other print material in Kinyarwanda (1-10 per classroom
on average). It is important to note that these estimates are presented as ranges that may conceal how
few books were actually present. In addition, the number of students may exceed the amount of
material available in classrooms. Most textbooks and other print material found in classrooms were
relevant to the grade level. There were relatively fewer storybooks, newspapers, magazines,
dictionaries and religious books found in classrooms than textbooks. (Table 6)
100%
52% 43% 43%
12%
0%
25%
50%
75%
100%
Figure 2. Percentage of classrooms with books present during
observation (N=42)
Malik, Gasana, Raab, Cha, & Goldenberg 9
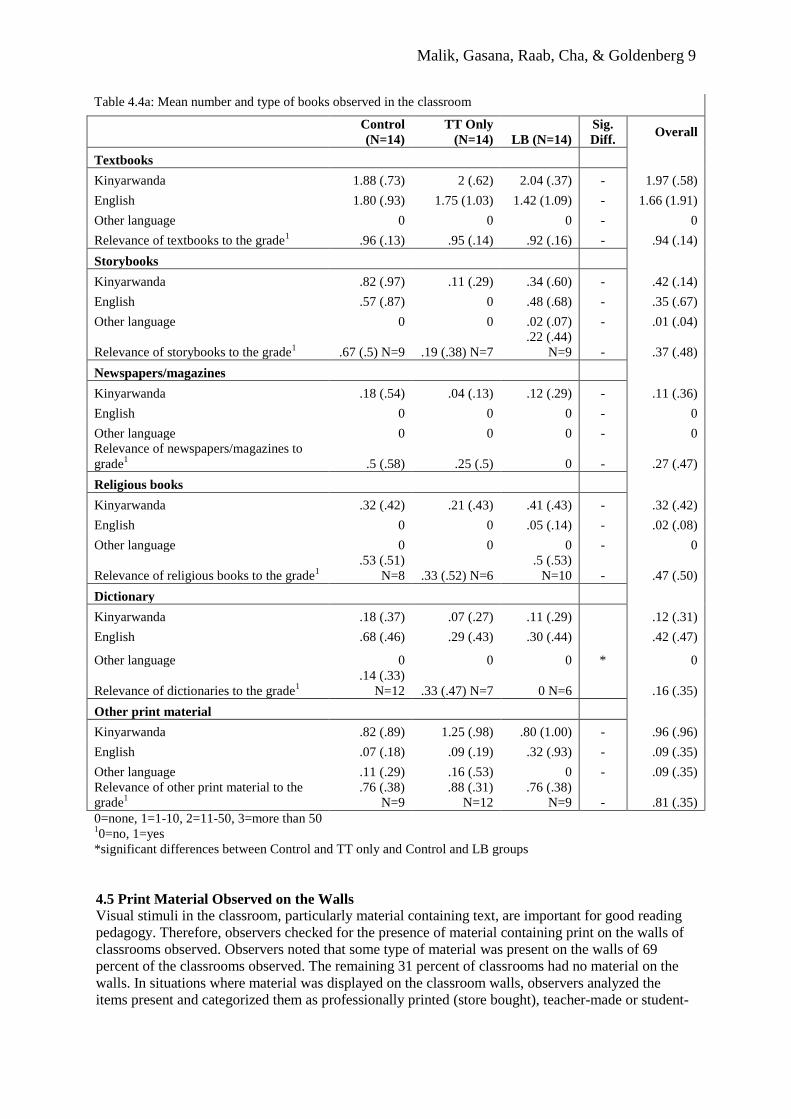
Table 4.4a: Mean number and type of books observed in the classroom
Control
(N=14)
TT Only
(N=14) LB (N=14)
Sig.
Diff. Overall
Textbooks
Kinyarwanda 1.88 (.73) 2 (.62) 2.04 (.37) - 1.97 (.58)
English 1.80 (.93) 1.75 (1.03) 1.42 (1.09) - 1.66 (1.91)
Other language 0 0 0 - 0
Relevance of textbooks to the grade1
.96 (.13) .95 (.14) .92 (.16) - .94 (.14)
Storybooks
Kinyarwanda .82 (.97) .11 (.29) .34 (.60) - .42 (.14)
English .57 (.87) 0 .48 (.68) - .35 (.67)
Other language 0 0 .02 (.07) - .01 (.04)
Relevance of storybooks to the grade1
.67 (.5) N=9 .19 (.38) N=7
.22 (.44)
N=9 - .37 (.48)
Newspapers/magazines
Kinyarwanda .18 (.54) .04 (.13) .12 (.29) - .11 (.36)
English 0 0 0 - 0
Other language 0 0 0 - 0
Relevance of newspapers/magazines to
grade1
.5 (.58) .25 (.5) 0 - .27 (.47)
Religious books
Kinyarwanda .32 (.42) .21 (.43) .41 (.43) - .32 (.42)
English 0 0 .05 (.14) - .02 (.08)
Other language 0 0 0 - 0
Relevance of religious books to the grade1
.53 (.51)
N=8 .33 (.52) N=6
.5 (.53)
N=10 - .47 (.50)
Dictionary
Kinyarwanda .18 (.37) .07 (.27) .11 (.29)
.12 (.31)
English .68 (.46) .29 (.43) .30 (.44)
.42 (.47)
Other language 0 0 0 * 0
Relevance of dictionaries to the grade1
.14 (.33)
N=12 .33 (.47) N=7 0 N=6
.16 (.35)
Other print material
Kinyarwanda .82 (.89) 1.25 (.98) .80 (1.00) - .96 (.96)
English .07 (.18) .09 (.19) .32 (.93) - .09 (.35)
Other language .11 (.29) .16 (.53) 0 - .09 (.35)
Relevance of other print material to the
grade1
.76 (.38)
N=9
.88 (.31)
N=12
.76 (.38)
N=9 - .81 (.35)
0=none, 1=1-10, 2=11-50, 3=more than 50 10=no, 1=yes
*significant differences between Control and TT only and Control and LB groups
4.5 Print Material Observed on the Walls Visual stimuli in the classroom, particularly material containing text, are important for good reading
pedagogy. Therefore, observers checked for the presence of material containing print on the walls of
classrooms observed. Observers noted that some type of material was present on the walls of 69
percent of the classrooms observed. The remaining 31 percent of classrooms had no material on the
walls. In situations where material was displayed on the classroom walls, observers analyzed the
items present and categorized them as professionally printed (store bought), teacher-made or student-

Malik, Gasana, Raab, Cha, & Goldenberg 10
made. When text was present, observers noted the language used on the item. As outlined below, most
of the items found on classroom walls were teacher made and very few of the items were student
made. Items containing words matched to pictures were found most often on classroom walls whereas
songs or poems were found least often (Table 4.5a).
Observers found that most of the material found on classroom walls was teacher-made (54.76 percent
in Kinyarwanda, 45.24 percent in English, 9.52 percent in French and 7.14 percent with only images).
Some of the material found on classroom walls was professionally printed or store bought (7.14
percent in Kinyarwanda, 21.43 percent in English and 7.14 percent with images only). Very few
classrooms had student-made material on the walls (4.76 percent in Kinyarwanda, 4.76 percent in
English and 2.38 percent in French).
Table 4.5a: Types of Print Present in Classroom1
Control
(SD)
TT Only
(SD) LB (SD)
Sig.
Diff. Overall (SD)
Items with only words .52 (.50) .41 (.60) .17 (.29) - .37 (.49)
Items with words matched to pictures .68 (.72) .77 (.79) .71 (.88) - .72 (.78)
Songs/Poems .07 (.27) .02 (.07) 0 - .03 (.16)
Alphabet letters .46 (.63) .43 (.51) .29 (.41) - .39 (.52)
Syllables .29 (.51) .29 (.59) .14 (.36) - .24 (.48)
N 14 14 14 42 10=no, 1-minimal (less than 5), 2= a lot (5 or more)
Table 4.5b: Print Material Observed on the Walls
Control
(SD)
TT Only
(SD) LB (SD)
Sig.
Diff.
Overall
(SD)
Mean number of items on the wall
10.14
(12.66) 12.68 (14.87)
11.50
(16.50) -
11.44
(14.43)
Mean number of professionally printed items
With text in Kinyarwanda 0 1.36 (4.80) .07 (.27) - .48 (2.78)
With text in English .52 (.97) .21 (.38) .07 (.28) - .27 (.63)
With text in another language 0 0 0 - 0
Images only 0 .11 (.40) .07 (.18) - .06 (.25)
Mean number of teacher made items
With text in Kinyarwanda 5.07 (7.30) 5.09 (6.46) 5.82 (9.23) - 5.32 (7.57)
With text in English 2.29 (6.15) .45 (.86) 3.52 (8.03) - 2.08 (5.85)
With text in another language .04 (.13) 1.04 (3.89) .12 (.31) - .40 (2.23)
Images only 1.41 (3.25) 1.57 (2.47) .14 (.36) - 1.04 (2.40)
Mean number of student made items
With text in Kinyarwanda 0 .04 (.13) .02 (.07) - .02 (.09)
With text in English .07 (.28) 0 .02 (.07) - .03 (.16)
With text in another language 0 .29 (1.06) 0 - .10 (.62)
Images only 0 0 0 - 0
4.6 Teacher Knowledge. To provide effective literacy instruction, it is helpful if teachers are aware of the importance of
literacy materials, the various types of literacy skills a successful reader should possess, and what it
means to be a fluent reader who comprehends texts – in other words, it is important for teachers to
Malik, Gasana, Raab, Cha, & Goldenberg 11
know the end goal and also know the processes and materials they need to get there. Teachers
surveyed were asked questions to understand their perceptions about these aspects of literacy
instruction.
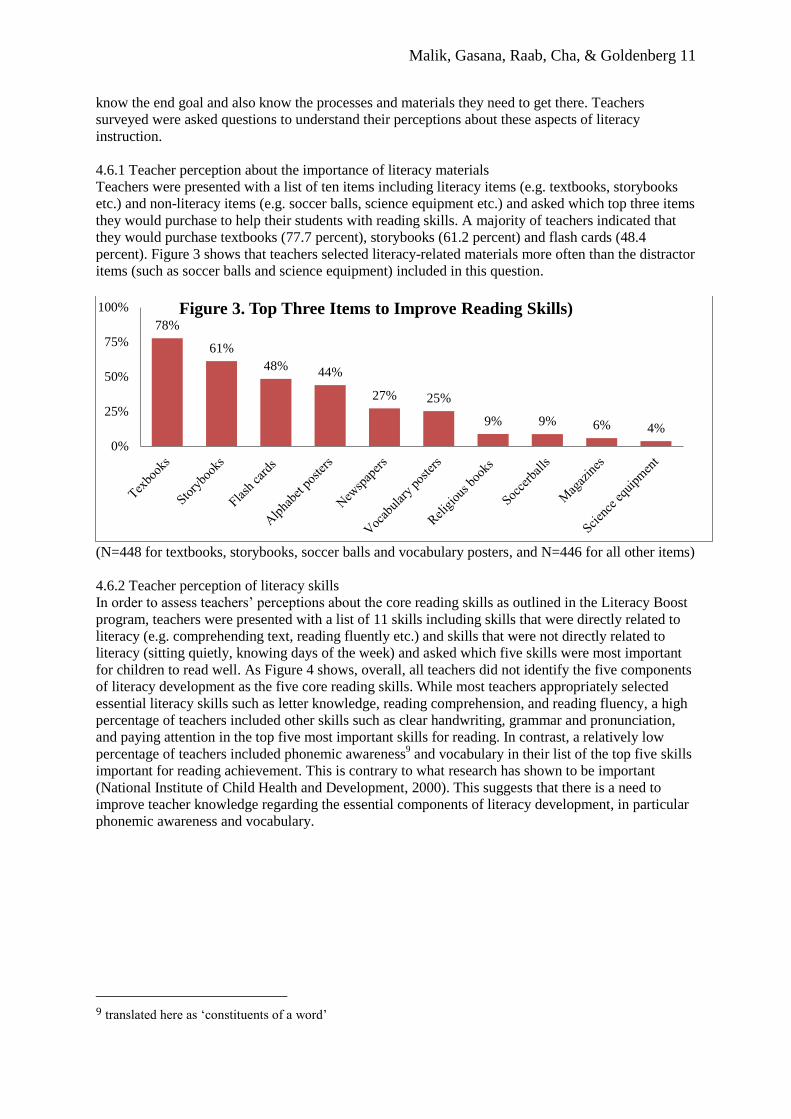
4.6.1 Teacher perception about the importance of literacy materials
Teachers were presented with a list of ten items including literacy items (e.g. textbooks, storybooks
etc.) and non-literacy items (e.g. soccer balls, science equipment etc.) and asked which top three items
they would purchase to help their students with reading skills. A majority of teachers indicated that
they would purchase textbooks (77.7 percent), storybooks (61.2 percent) and flash cards (48.4
percent). Figure 3 shows that teachers selected literacy-related materials more often than the distractor
items (such as soccer balls and science equipment) included in this question.
(N=448 for textbooks, storybooks, soccer balls and vocabulary posters, and N=446 for all other items)
4.6.2 Teacher perception of literacy skills
In order to assess teachers’ perceptions about the core reading skills as outlined in the Literacy Boost
program, teachers were presented with a list of 11 skills including skills that were directly related to
literacy (e.g. comprehending text, reading fluently etc.) and skills that were not directly related to
literacy (sitting quietly, knowing days of the week) and asked which five skills were most important
for children to read well. As Figure 4 shows, overall, all teachers did not identify the five components
of literacy development as the five core reading skills. While most teachers appropriately selected
essential literacy skills such as letter knowledge, reading comprehension, and reading fluency, a high
percentage of teachers included other skills such as clear handwriting, grammar and pronunciation,
and paying attention in the top five most important skills for reading. In contrast, a relatively low
percentage of teachers included phonemic awareness9 and vocabulary in their list of the top five skills
important for reading achievement. This is contrary to what research has shown to be important
(National Institute of Child Health and Development, 2000). This suggests that there is a need to
improve teacher knowledge regarding the essential components of literacy development, in particular
phonemic awareness and vocabulary.
9 translated here as ‘constituents of a word’
78%
61%
48% 44%
27% 25%
9% 9% 6% 4%
0%
25%
50%
75%
100% Figure 3. Top Three Items to Improve Reading Skills)

Malik, Gasana, Raab, Cha, & Goldenberg 12
(N=450 for phonemic awareness, having good vocabulary and days of the week)
4.7 Literacy instruction in the classroom.
In order to ascertain the kinds of activities teachers currently used, teachers were asked questions
related to literacy instruction in their classrooms. These included questions about strategies teachers
used to teach letter knowledge and reading comprehension to their students, how often students used
books in their classrooms, opportunities for students to practice reading out loud and whether teachers
assigned literacy homework and assessed students’ literacy development.
4.8 Teacher Report of Reading Activities 4.8.1 Most frequent reading activities in the classroom
Teachers gave a wide variety of answers to the survey question, “What are the two reading activities
you do most often with your students?” Of these answers, only about half (51 percent) were explicit
about focusing on one of the main skills identified and developed through the Literacy Boost program
(though some of the activities may be implicitly targeting these skills). The data suggests that the
activity most frequently engaged in by students was reading aloud, though the qualitative data
suggests that some of this reading aloud did not target reading fluency or understanding specifically.
Similarly, while there were many teachers who indicated that they often focused on letter id and
letter-sound correspondence and vocabulary in their reading activities, the qualitative data suggests
that some of the current practices could be made more effective. (Table A4)
4.8.2 Most effective reading activities in the classroom
Some of the most effective reading activities reported by the teachers surveyed included the using
instructional materials during lessons, reading at the blackboard, reading silently and showing
students words matched to pictures.
4.9 Teacher Report of Use of Books (other than textbooks) Regular and extensive interaction with books is important for children who are learning to read. As
shown in Figure 5, students use books (other than textbooks) daily in only 42 percent of the
classrooms surveyed and never have exposure to books other than textbooks in 22 percent of the
classrooms.
The fact that a majority of classrooms were reported to have no books present along with teacher
report of students’ low interaction with books may be a severe impediment to the successful
acquisition of literacy skills among students. Provision of books to the classrooms where they are not
82% 82% 75% 72%
51% 45%
31% 24% 20%
11% 3%
0%
25%
50%
75%
100%
Figure 4. Five most important skills for children to read well
(N=451)

Malik, Gasana, Raab, Cha, & Goldenberg 13
present as well as an increased amount of interaction with books is essential towards the goal of
successful reading development for students.
4.10 Components of Reading Development Before teachers can be expected to successfully teach components of literacy to students, it is
important that they have an understanding of what each component means as well as be familiar with
the strategies that can be employed to teach each skill. To get an idea of teachers’ perceptions about
how to teach different literacy skills, some items on the survey presented them with the scenario of a
teacher conducting a reading activity with students. They were then asked to identify from a given list
which reading skill they thought was the focus of the reading activity.
In addition, while observing literacy lessons, observers made note of whether any of the basic reading
components were explicitly addressed by teachers. They measured the amount of time teachers spent
on each component and looked for which specific activities and strategies teachers employed to teach
specific literacy skills. Both survey and observation results are outlined below.
4.11 Time Spent on Reading Activities On average, teachers spent about 26 minutes on letter knowledge, decoding/encoding or phonological
awareness activities (focusing on sounds/syllables within words), about 14 minutes on reading fluency
activities and about 3 minutes on vocabulary instruction during classroom observations (Table A18).
4.12 Letter Knowledge Letter knowledge is one of the most basic skills for literacy development. It refers to the
understanding that sounds can be matched with printed letters and that these letters have names. A
child who has letter knowledge would be able to recognize a letter by both its name as well as its
associated sound.
According to Metsala & Ehri (1998), knowledge of letter-sound relationships provides a powerful
mnemonic system that bonds the written words to their pronunciations in memory. Muter & Diethelm
(2001) found that phonological segmentation ability and letter knowledge proved significant
predictors of both concurrent and later reading achievement irrespective of children’s native language.
Similarly, Bowey (1994) posits letter knowledge and phoneme sensitivity as the two skills that co-
determine early reading development (in reciprocal relationship with each other).
Following the Kinyarwanda curriculum for P1 which prescribes that a pupil should be able to
recognize all letters of the alphabet by the end of P1 including some letter combinations, a majority of
teachers surveyed (67.6 percent) felt that children should be able to identify all letters of the alphabet
by P1 (Fig. 6).
42%
22% 21%
8% 3% 3% 2%
0%
10%
20%
30%
40%
50%
daily never 2-4 times per
week
weekly 2-3 times per
month
montly once per
school term
Figure 5. Frequency of book use in classroom (other than
textbooks)
(N=400)

Malik, Gasana, Raab, Cha, & Goldenberg 14
A majority of teachers surveyed (64 percent) reported teaching letter names and sounds to their
students. Some strategies teachers described using in their classrooms included using stories to
introduce new letters, displaying flash cards and charts with letters on classroom walls and giving
students words with a letter, emphasizing the target letter/sound and having the students repeat it.
Figure 7 shows that teachers/students identified letters and letter sounds in 45 percent of classrooms
and students wrote letters in their notebooks in 17 percent of classrooms observed. Students in very
few classrooms (5%) wrote letters in the air with their fingers. There was evidence of teachers and
students participating in decoding and encoding activities in the classroom and the activity they
participated in most often was sounding out words (69 percent) (Fig. 8).
68%
15% 12%
4% 2% 0% 0%
20%
40%
60%
80%
P1 P2 P3 before P1 P4 P5
Figure 6. Level by when students should be able to identify all
letters (N=444)
24% 31% 45%
86%
10% 5%
40% 43%
17%
0%
25%
50%
75%
100%
No
Som
e E
vid
ence
Yes
No
Som
e E
vid
ence
Yes
No
Som
e E
vid
ence
Yes
Teachers or students identify
letters/letter sounds
Teachers or students write
letters in the air or with their
finger
Students write
letters in their
notebooks
Figure 7. Letter knowledge activities observed in
the classroom (N=42)

Malik, Gasana, Raab, Cha, & Goldenberg 15
4.13 Phonemic Awareness Phonemic awareness refers to the ability to differentiate between basic sounds and understand that
words are made up of the smallest unit of sounds (called phonemes). Current research and theory
suggests that it is beneficial for beginning readers to be able to hear these phonemes and differentiate
between the different sounds they hear in words as a precursor to understanding that different letters
make up words that are heard, read, and later, written. Research suggests that kindergarten students
who lack the language competency known as phonemic awareness often experience subsequent
difficulties learning to read (Bishop & Adams, 1990; Blachman, 2000, Pennington, Groisser & Welsh,
1993; Stanovich, 1986, 1988). One study found that the best predictor of poor reading achievement in
grade 1 was phonemic awareness and that low phonemic awareness was highly predictive of
continuing reading difficulties in grade 4 (Juel, 1988).
It is important to note that this research was done in the developed world, in a language with a very
deep orthography. That is, the orthographic system for writing English is extremely complex, in
contrast to “shallow” orthographies where the letter-sound relationship is more consistent. Less
research has been done on the relationship between phonemic awareness in languages such as
Kinyarwanda, with shallower orthographies. A study by Goldenberg and colleagues (in press)
provides evidence that phonemic awareness instruction may not contribute to students’ learning to
read in Spanish as it does for students learning to read in English. The importance of phonemic
awareness instruction to the acquisition of Kinyarwanda reading skills is currently unclear.
When the survey was translated from Kinyarwanda back into English, the back-translation revealed
that the word/phrase that came closest to describing the number of individual phonemes in a word was
‘individual constituents’. This translation does not fully capture the meaning of phoneme and it is
possible that teachers may not have fully understood questions regarding phonemic awareness on the
survey and subsequently interpretation of any findings related to phonemic awareness are limited.
33% 33% 33%
5%
26%
69%
21%
31%
48%
26%
38% 36%
0%
25%
50%
75%
100%
No
So
me
Evid
ence
Yes
No
So
me
Evid
ence
Yes
No
So
me
Evid
ence
Yes
No
So
me
Evid
ence
Yes
Teachers/students blend
letters to form
sounds/syllables
Teachers/students sound
out words
Teacher showsstudents
parts of words that make a
certain sound
Teacher asks
students to write
words/sentences
using letter
knowledge
Figure 8. Decoding/Encoding activities observed in the classroom
(N=42)

Malik, Gasana, Raab, Cha, & Goldenberg 16
Teachers surveyed did not display an understanding regarding the concept of phonemes. When asked
how many phonemes are in the word ‘muraho’, only one percent of teacher correctly responded ‘6’
(Fig.9).
In contrast to the lack of understanding regarding phonemes, teachers seemed to have a strong
understanding of the concept of syllables in a word. When asked how many syllables are present in
the word ‘muramuke’, a majority of teachers (97 percent) correctly responded that there were 4
syllables (Fig. 10). There is confirmatory evidence of this in the student reading assessment baseline,
where students scored very highly on the assessment of syllabic awareness but scored very low on the
phonemic awareness assessment.
Observers noted that very few teachers identified or played with words with the same beginning,
ending or middle sounds. Almost no teachers used clapping or tapping to practice listening for sounds
in words and only a few used clapping or tapping to listen for syllables in words. There was some
evidence of students generating words that sounded the same or listening for and identifying a sound
within a word said orally (Fig. 11). While pilot testing indicated that most words were read
syllabically, teachers observed hardly ever made explicit mention of breaking words up into syllables.
In very few classrooms did teachers and students separate words or syllables into phonemes (Fig. 12).
55%
38%
5% 1% 1%
2 phonemes 3 phonemes 4 phonemes 5 phonemes 6 phonemes
Figure 9. Number of phonemes in the
word ‘muraho’ (N=418)
97%
2% 0% 0% 0% 0%
20%
40%
60%
80%
100%
4 syllables 3 syllables 5 syllables 2 syllables 6 syllables
Figure 10. Number of syllables in
‘muramuke’ (N=442)

Malik, Gasana, Raab, Cha, & Goldenberg 17
4.14 Vocabulary
Explicitly teaching word meanings can modestly improve children’s comprehension of text (Stahl &
Fairbanks, 1986). The best strategy to teach vocabulary is to combine direct instruction and
conversation about words with wide reading (Chall, 1996)
When asked which literacy skill was being taught if a teacher taught the meanings of words to
students prior to a read aloud, then asked them the meanings of those words as the story was read, a
little over half of the teachers appropriately responded that the skill was ‘vocabulary’ (Fig. 13). A
notable amount (23 percent) felt that the skill taught was ‘reading comprehension’ and some (12
percent) thought it was ‘memory building’.
In the classrooms observed, while teachers taught the meanings of words, less than half of the
teachers taught words related to the text children had read. Hardly any of the teachers explicitly taught
the orthographic and morphological structures of the words and only half practiced new vocabulary
words with students. Only a few teachers taught the meaning of words by having students generate
86%
14% 0%
98%
2% 0%
29% 45%
26% 19% 31%
50%
0%
25%
50%
75%
100%
No
So
me
Evid
ence
Yes
No
So
me
Evid
ence
Yes
No
So
me
Evid
ence
Yes
No
So
me
Evid
ence
Yes
Teachers/students
identify/play with similar
sounding words
Teahers/students use
clapping or tapping
to teach/learn
phonemes
Students identify
specific sounds
within a word said
orally
Students
generate words
that contain
specific sounds
Figure 11. Phonemic Awareness Activities Observed in the
Classroom (N=42)
26%
43% 31%
45% 43%
12%
95%
5% 0%
93%
7% 0%
0%10%20%30%40%50%60%70%80%90%
100%
No
Som
e E
vid
ence
Yes
No
Som
e E
vid
ence
Yes
No
Som
e E
vid
ence
Yes
No
Som
e E
vid
ence
Yes
Teacher/students separate
words into syllables
Teacher explicitly mentions
syllables or breaking words
into sounds
Teacher/students separate
words/syllables into
phonemes
Teacher/students use
clapping or tapping
to teach/learn
syllables
Figure 12. Phonological Awareness Activities Observed in the
Classroom (N=42)

Malik, Gasana, Raab, Cha, & Goldenberg 18
synonyms or antonyms for words (Fig. 14). These effective strategies to teach vocabulary skills can
be emphasized with teachers during Literacy Boost implementation.
4.15 Reading Fluency
Fluency is most often defined as the reader’s reading rate, gauged in words read correctly per minute.
A lack of oral fluency is often indicative of reading difficulty among poor readers (Allington, 1983).
52%
23%
12%
5% 5% 3%
0%
25%
50%
75%
100%Figure 13. Skill taught when teacher asks meaning of
words during
text reading that were taught prior to reading (N=428)
83%
17%
0%
14%
71%
14%
48% 50%
2%
90%
7% 2%
52% 45%
2%
31% 38%
31% 29% 38%
33%
0%
25%
50%
75%
100%
No
So
me
Evid
ence
Yes
No
So
me
Evid
ence
Yes
No
So
me
Evid
ence
Yes
No
So
me
Evid
ence
Yes
No
So
me
Evid
ence
Yes
No
So
me
Evid
ence
Yes
No
So
me
Evid
ence
Yes
Teacher explicity
teaches
orthographic and
morphological
structures
Teacher explicitly
teaches meanings of
words
Teacher practices
new vocabulary
words with students
Teacher has
students think of
synonyms/antonyms
Teacher explicitly
teaches words
related to a text
children read
Teacher asks
students to define
vocabulary words
Teacher uses
instructional
materials in
teaching
vocabulary
Figure 14. Vocabulary activities observed in the classroom
(N=42)

Malik, Gasana, Raab, Cha, & Goldenberg 19
Research has suggested that there are two strategies that can be used to increase fluency among early
readers; modeling of reading fluently by the teacher and repeated reading of texts (Smith, 1979;
Allington, 1977; Cunningham, 1979; Samuels, 1979).
Survey results indicated that most teachers understood what it means to be a fluent reader. When
asked what it means to be a fluent reader, 84.5 percent of teachers chose the correct response ‘being
able to read a text out loud with accuracy, appropriate speed, and expression.’
4.15.1 Teacher Reading Out Loud
By reading books out loud to students, teachers can model reading fluently with appropriate speed and
inflection, encourage students to make predictions about text before and during reading, summarize
text along the way and show how to decode with unfamiliar words. Teacher reading text aloud to
students may also generate an interest in reading various types of books. Teachers were asked to
indicated what material they read out lout do their students and how frequently. Survey baseline
results indicate that many teachers never read books (story books and textbooks) out loud to their
students and those who did read out loud to students, did not do so on a daily basis (Table 3.20).
Figure 15 indicates that of the material that was reported to be read out loud daily by the teacher,
words teacher wrote on the board was the most common (71 percent), followed by words students
wrote on the board (62 percent). Textbooks were only read aloud daily by 24 percent of teachers
surveyed and very few teachers reported reading storybooks out loud in the classroom on a daily
basis.
Table 4.15 Percentage of Teachers Reporting Frequency and Type of Material They Read Out Loud in the
Classroom
%Words
Teacher
Writes
on the
Board
% Words
Students
Write on
the Board %Textbooks
%
Storybooks
%
Newspapers
or Magazines
%
Flashcards
or Word
Strips
Never 2.95 10.51 6.57 32.35 58.36 38.27
Once per school term 0 0 3.65 5.12 5.28 1.4
Monthly 0.98 0 3.41 12.13 7.33 2.51
2-3 times per month 1.97 2.43 5.6 11.86 6.45 2.23
Weekly 3.19 4.58 13.38 21.83 11.73 12.01
2-4 times per week 19.9 20.49 43.31 12.94 8.21 19.55
Daily 71.01 61.99 24.09 3.77 2.64 24.02
N1 407 371 411 371 341 358
1 Sample size varies here due to missing responses on each item. Missing data here may have indicated ‘never’
responses but were not coded as such.
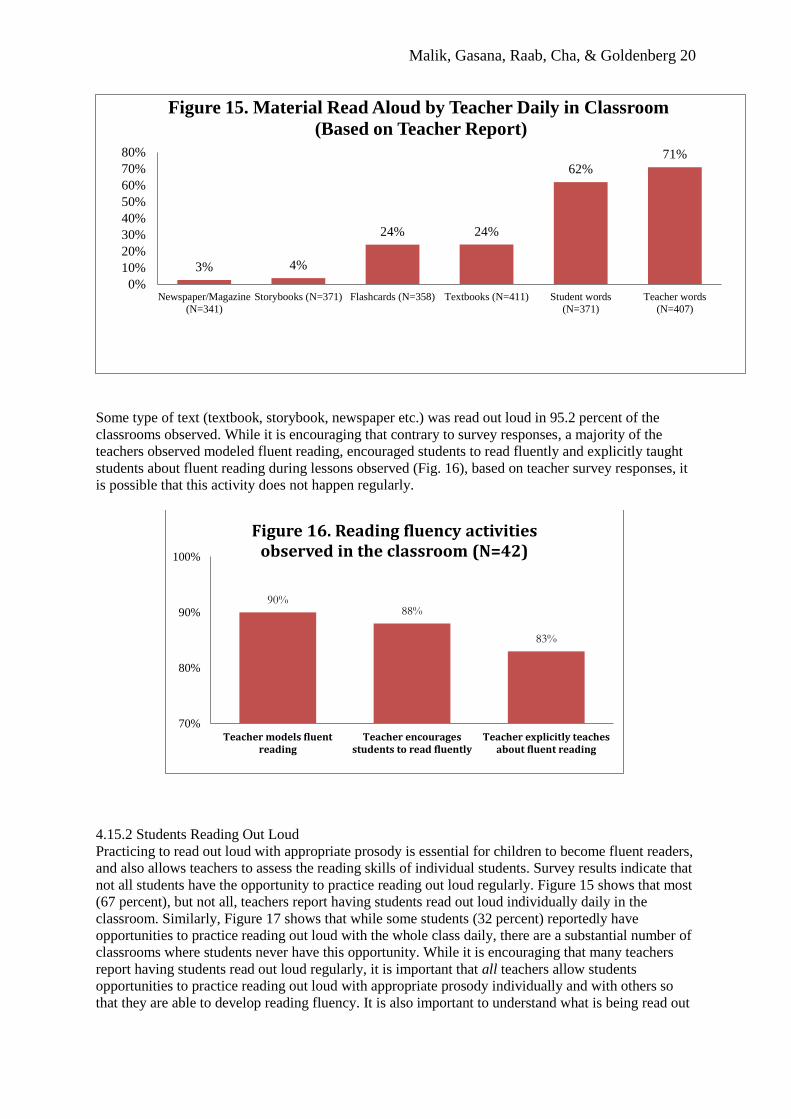
Malik, Gasana, Raab, Cha, & Goldenberg 20
Some type of text (textbook, storybook, newspaper etc.) was read out loud in 95.2 percent of the
classrooms observed. While it is encouraging that contrary to survey responses, a majority of the
teachers observed modeled fluent reading, encouraged students to read fluently and explicitly taught
students about fluent reading during lessons observed (Fig. 16), based on teacher survey responses, it
is possible that this activity does not happen regularly.
4.15.2 Students Reading Out Loud
Practicing to read out loud with appropriate prosody is essential for children to become fluent readers,
and also allows teachers to assess the reading skills of individual students. Survey results indicate that
not all students have the opportunity to practice reading out loud regularly. Figure 15 shows that most
(67 percent), but not all, teachers report having students read out loud individually daily in the
classroom. Similarly, Figure 17 shows that while some students (32 percent) reportedly have
opportunities to practice reading out loud with the whole class daily, there are a substantial number of
classrooms where students never have this opportunity. While it is encouraging that many teachers
report having students read out loud regularly, it is important that all teachers allow students
opportunities to practice reading out loud with appropriate prosody individually and with others so
that they are able to develop reading fluency. It is also important to understand what is being read out
3% 4%
24% 24%
62% 71%
0%
10%
20%
30%
40%
50%
60%
70%
80%
Newspaper/Magazine
(N=341)
Storybooks (N=371) Flashcards (N=358) Textbooks (N=411) Student words
(N=371)
Teacher words
(N=407)
Figure 15. Material Read Aloud by Teacher Daily in Classroom
(Based on Teacher Report)
90% 88%
83%
70%
80%
90%
100%
Teacher models fluentreading
Teacher encouragesstudents to read fluently
Teacher explicitly teachesabout fluent reading
Figure 16. Reading fluency activities observed in the classroom (N=42)
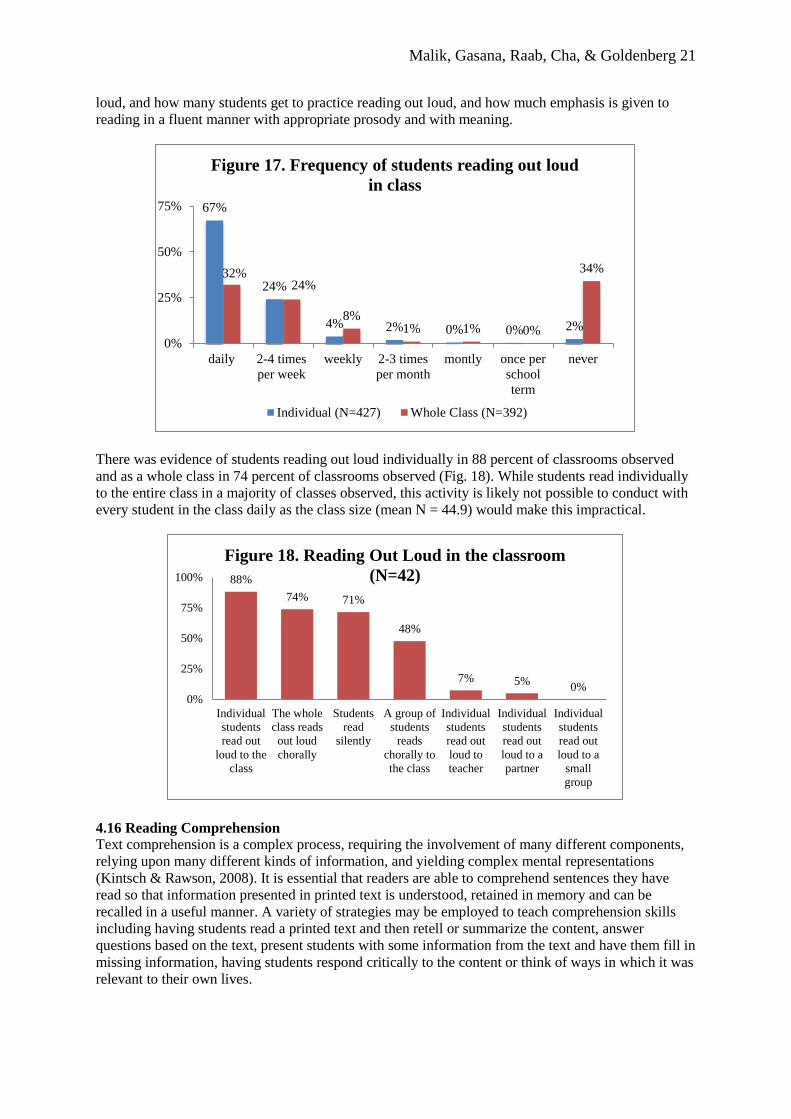
Malik, Gasana, Raab, Cha, & Goldenberg 21
loud, and how many students get to practice reading out loud, and how much emphasis is given to
reading in a fluent manner with appropriate prosody and with meaning.
There was evidence of students reading out loud individually in 88 percent of classrooms observed
and as a whole class in 74 percent of classrooms observed (Fig. 18). While students read individually
to the entire class in a majority of classes observed, this activity is likely not possible to conduct with
every student in the class daily as the class size (mean N = 44.9) would make this impractical.
4.16 Reading Comprehension
Text comprehension is a complex process, requiring the involvement of many different components,
relying upon many different kinds of information, and yielding complex mental representations
(Kintsch & Rawson, 2008). It is essential that readers are able to comprehend sentences they have
read so that information presented in printed text is understood, retained in memory and can be
recalled in a useful manner. A variety of strategies may be employed to teach comprehension skills
including having students read a printed text and then retell or summarize the content, answer
questions based on the text, present students with some information from the text and have them fill in
missing information, having students respond critically to the content or think of ways in which it was
relevant to their own lives.
67%
24%
4% 2% 0% 0% 2%
32% 24%
8% 1% 1% 0%
34%
0%
25%
50%
75%
daily 2-4 times
per week
weekly 2-3 times
per month
montly once per
school
term
never
Figure 17. Frequency of students reading out loud
in class
Individual (N=427) Whole Class (N=392)
88%
74% 71%
48%
7% 5% 0%
0%
25%
50%
75%
100%
Individual
students
read out
loud to the
class
The whole
class reads
out loud
chorally
Students
read
silently
A group of
students
reads
chorally to
the class
Individual
students
read out
loud to
teacher
Individual
students
read out
loud to a
partner
Individual
students
read out
loud to a
small
group
Figure 18. Reading Out Loud in the classroom
(N=42)

Malik, Gasana, Raab, Cha, & Goldenberg 22
There appears to be a lack of clarity among teachers regarding the specific skills that are associated
with successful comprehension of text. When asked to select from a list of skills what it means to
comprehend a text, a majority of 450 teachers appropriately selected ‘being able to answer questions
about the plot of the text’ (86.9 percent) ‘being able to summarize accurately in your own words (74.7
percent), ‘understanding, interpreting and using information from a text’ (65.6 percent) and ‘being
able to relate it to a similar text you have read’ (40.4 percent). However, a fairly high percentage of
teachers understood reading comprehension as ‘reading out loud without mistakes’ (39.3 percent),
‘reading out loud with accuracy’ (35.1 percent), ‘repeating a text from memory’ (29.1 percent),
‘understanding that spoken word is made up of individual sounds’ (12.2 percent) and ‘identifying
letters’ (12.9 percent) (Fig. 19).
Survey results indicated that teachers are aware of the strategies used to assess lower level reading
comprehension such as ‘asking questions about the text’ ‘asking students to summarize the text’ and
‘asking to tell the main points’. However, activities that would delve into higher-level comprehension
skills such as ‘asking to act out the text’ or ‘asking to write a response’ were chosen less frequently.
(N=437 for ‘Asking about specific vocabulary words’)
In total, 446 teachers (98.9 percent) reported teaching reading comprehension in the classroom. As
Figure 20 indicates, a majority of these teachers reported using strategies that are generally considered
to be associated with developing reading comprehension skills such as asking students to answer
questions about what is happening in the text, asking students to summarize the text and telling
students the meaning of the stories they read. While teachers reportedly employed useful strategies to
teach reading comprehension skills, other good strategies such as asking for predictions before and
during the reading of a text and having students retell the story were reportedly used less often. In
addition, some teachers named an irrelevant strategy, asking students to name letters from the text, in
order to teach comprehension skills.
The reading comprehension strategy observed most often by teachers in classrooms observed
involved asking questions during and after reading a text (Fig. 21)10
.
10 Significant difference between Control and LB and TT-only and LB groups at baseline with percentage of teachers who asked children to summarize a text.
95%
78% 71% 71%
53%
28%
2% 1% 0%
25%
50%
75%
100%
Asking
questions
about text
Asking to
summarize
the text
Asking
specific
voca.
words
Asking to
tell the
main points
of the text
Asking to
write a
response
Asking to
act out the
story
By facial
expression
No need to
check
Figure19. Ways to assess reading comprehension (N=438)
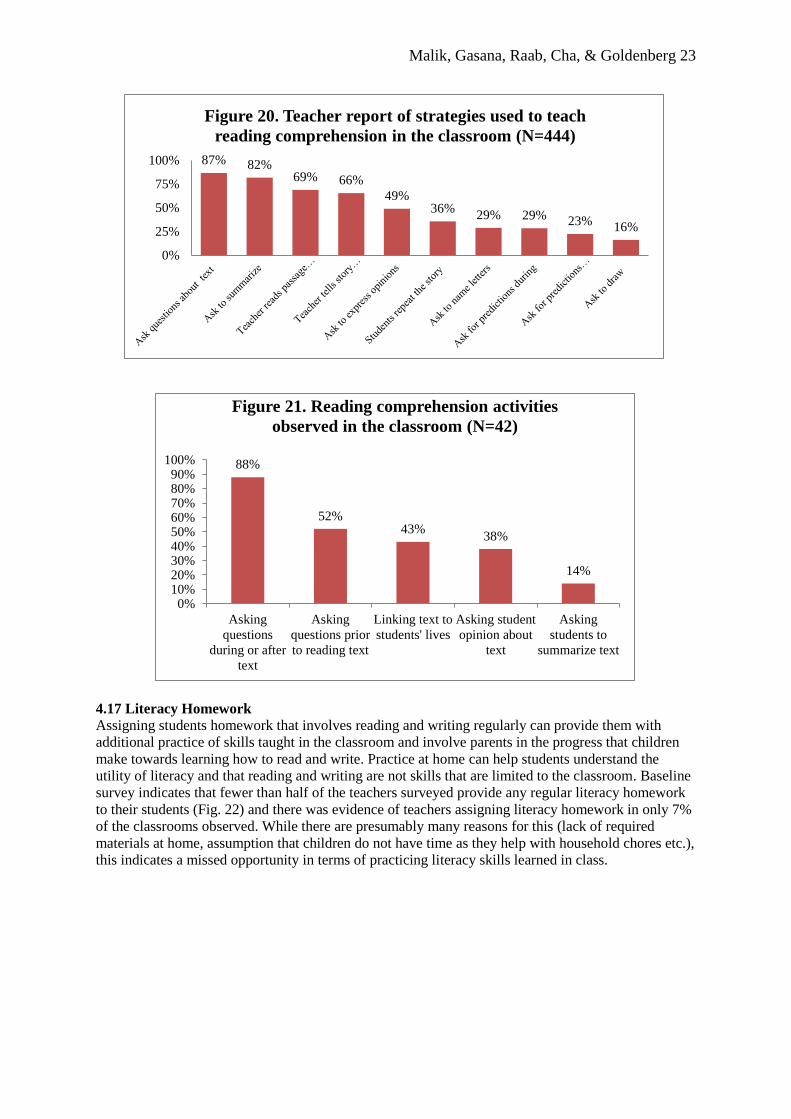
Malik, Gasana, Raab, Cha, & Goldenberg 23
4.17 Literacy Homework
Assigning students homework that involves reading and writing regularly can provide them with
additional practice of skills taught in the classroom and involve parents in the progress that children
make towards learning how to read and write. Practice at home can help students understand the
utility of literacy and that reading and writing are not skills that are limited to the classroom. Baseline
survey indicates that fewer than half of the teachers surveyed provide any regular literacy homework
to their students (Fig. 22) and there was evidence of teachers assigning literacy homework in only 7%
of the classrooms observed. While there are presumably many reasons for this (lack of required
materials at home, assumption that children do not have time as they help with household chores etc.),
this indicates a missed opportunity in terms of practicing literacy skills learned in class.
87% 82% 69% 66%
49% 36%
29% 29% 23% 16%
0%
25%
50%
75%
100%
Figure 20. Teacher report of strategies used to teach
reading comprehension in the classroom (N=444)
88%
52% 43%
38%
14%
0%10%20%30%40%50%60%70%80%90%
100%
Asking
questions
during or after
text
Asking
questions prior
to reading text
Linking text to
students' lives
Asking student
opinion about
text
Asking
students to
summarize text
Figure 21. Reading comprehension activities
observed in the classroom (N=42)

Malik, Gasana, Raab, Cha, & Goldenberg 24
4.18 Teaching Practice and Student Engagement
In addition to the teaching of literacy skills, observers made note of teaching practice and student
engagement in the classroom in general. In general, teachers provided clear instructions, responded
when students were off task and used positive discipline strategies most often (Table 7). Teachers
hardly ever promoted small group interactions and students never asked questions during lessons
(Table 7, Table 8). Only a minority of teachers observed linked lessons to previous learning in class or
to students’ home experiences. Hardly any of the teachers were observed assigning literacy homework
to students or explicitly teaching students how to handle books.
Table 4.18a. Observation of Teaching practice and classroom management
Control
(SD)
TT only
(SD) LB (SD)
Sig.
Diff.
Overall
(SD)
Teacher provides clear instructions to students 2.86 (.31) 2.80 (.34) 2.93 (.21) - 2.86 (.29)
Teacher responds when students are off task 2.52 (.40) 2.29 (.32) 2.53 (.41) - 2.45 (.39)
Teacher uses positive discipline (praise, applause
etc.) 2.23 (.62) 1.83 (.55) 2.40 (.37) * 2.16 (.56)
Teacher uses negative discipline (corporal
punishment, embarrassment etc.) 1.30 (.42) 1.32 (.37) 1.48 (.44) - 1.37 (.41)
Teacher promotes small group interactions among
students during lesson 1.04 (.13) 1.04 (.13) 1.07 (.27) - 1.05 (.19)
1=never, 2=sometimes, 3=most-always
* significant difference between TT and LB groups
Table 4.18b. Observation of student engagement in the classroom
Student Engagement
Control
(SD)
TT only
(SD) LB (SD)
Sig.
Diff.
Overall
(SD)
Students ask questions during lesson 1.11 (.40) 1.04 (.13) 1.05 (.18) - 1.06 (.26)
Students actively participate during lesson 3.73 (.32) 3.66 (.32) 3.61 (.42) - 3.67 (.35)
Students have the opportunity to practice skill or
activity focused on during lesson 3.61 (.45) 3.25 (.73) 3.63 (.38) - 3.50 (.56)
Teacher asks students questions related to the lesson 3.82 (.42) 3.73 (.40) 3.69 (.37) - 3.75 (.39)
1=never, 2=a few times, 3=sometimes, 4=frequently
On average, teachers called on about four students during the lesson. Given that lessons observed
were on average 42 minutes long and that there were, on average, about 45 students in each class
observed, it seems that teachers are calling on very few students during lessons. Furthermore, most of
the questions the teachers asked students were closed ended short answer questions (e.g. yes/no
42% 41%
12%
2% 2% 1% 0% 0%
10%
20%
30%
40%
50%
daily 2-4 times
per week
weekly 2-3 times
per month
monthly never once per
school term
Figure 22. Teacher report of frequency of literacy
homework assignment to
class (N=448)

Malik, Gasana, Raab, Cha, & Goldenberg 25
questions) and the type of questions least asked were open ended long answer questions (e.g. How do
you feel about character X and why?) (Table 9). When students responded to questions incorrectly,
teachers responded in a variety of ways including calling on another student, providing the right
answer, repeating the question and providing clues about the right answer (Table 10).
Table 4.18c. Observation of Teacher Questions
Control (SD) TT only (SD) LB (SD) Sig. Diff.
Overall
(SD)
Mean number of students called on by
teacher 3.73 (.37) 3.93 (.43) 3.82 (.50) - 3.82 (.44)
Teacher asks questions that require a
short, right/wrong answer 3.18 (.39) 3.50 (.55) 3.31 (.77) - 3.33 (.59)
Teacher asks questions that require a
long, right/wrong answer 1.48 (.42) 1.39 (.63) 1.82 (.71) - 1.57 (.61)
Teachers asks questions that have
multiple short answers 2.68 (.62) 2.82 (.53) 3.08 (.75) - 2.86 (.64)
Teacher asks questions that require
longer, open ended answers 1 1 1.03 (.13) - 1.01 (.77)
1=none, 2=a few, 3=some, 4=most, 5=all
Table 4.18d. Observation of Teacher response to incorrect student answers
Control
(SD)
TT only
(SD) LB (SD)
Sig.
Diff. Overall (SD)
Teacher calls on another student to
answer the question 2.14 (.36) 2.11 (.21) 2.03 (.31) - 2.09 (.30)
Teacher provides the right answer 2 (.26) 2 (.20) 2.02 (.15) - 2.01 (.20)
Teacher says the answer is incorrect and
repeats question 2.13 (.31) 2.04 (.31) 2.20 (.31) - 2.12 (.31)
Teacher provides student with clues
regarding the correct answer 2.12 (.29) 2.21 (.26) 2.23 (.25) - 2.18 (.27)
1=never, 2=sometimes, 3=frequently
4.19 Student Achievement, Literacy Assessment and Teacher Feedback
As students learn new skills in class, it is important for them to receive an appropriate type and
amount of feedback. Acknowledging ones’ strengths and weaknesses can help a learner to progress
towards skill acquisition. Classroom observers noted whether teachers provided feedback to students
and whether the feedback was directed towards individual students, a small group of students or the
entire classroom. They noted that most of the oral feedback that teachers provided to students was to
individual students (Table 11).
Table 4.19. Observation of oral feedback teacher gives to students (N=42)
Control
(SD)
TT only
(SD) LB (SD)
Sig.
Diff. Overall
Oral feedback to individual students 2.29 (.54) 2.04 (.37) 2.38 (.38) - 2.23 (.45)
Oral feedback to a small group of students 1.11 (.29) 1 1.06 (.19) - 1.06 (.20)
Oral feedback to the entire classroom 1.95 (.42) 1.88 (.63) 2.40 (.37) - 2.08 (.53)
N 14 14 14 42
1=Never, 2=Sometimes, 3=Frequently
4.19.1 Student Achievement
Baseline assessment, based on teacher report, found that a substantial number of students are
struggling with each of the literacy skills presented to teachers. Teachers believed that reading fluency
is the skill that students have the most difficulty with, followed by letter identification and writing

Malik, Gasana, Raab, Cha, & Goldenberg 26
letters (Fig. 23)11
. Figure 24 outlines the percentage of teachers surveyed who feel that most to all of
their students have developed the skills: identifying some letters, identifying all letters, reading a word
out loud, reading a sentence out loud, reading a paragraph out loud and summarizing a text.
4.19.2 Literacy Assessment.
In order to help children improve their reading and writing skills, it is important for teachers to track
their progress, both formally and informally. Of the teachers surveyed 97.6 percent (N=414) reported
tracking students’ literacy skills and progress in some way. Some of the strategies used by teachers to
assess students’ reading abilities included having students read out loud individually, having students
summarize text, having students write words on the board and giving students dictation, exercises,
homework and tests related to content covered in class.
Most of the teachers were observed providing informal assessment to students during the lesson (Fig.
25). Very few teachers were observed providing formal assessment. When observers checked to see
what type of assessment records teachers kept, a majority of teachers shared summative assessment
records such as scores from tests or final exams. Very few teachers kept formative assessment records
of their students that would enable them to chart student progress throughout the school year and
adjust instruction accordingly (Fig. 26).
11
There was a significant difference between groups in terms of understanding words in Kinyarwanda with
more students reported to be struggling with that skill in the Control group (42 percent) than the TT only group
(28.9 percent). Additionally, significantly more students were reported to be struggling with decoding in the
Control group (51.1 percent) than the TT only group (37.6 percent).
57% 56% 51%
46% 45% 44% 43% 38% 36%
28%
0%
25%
50%
75%
100%
Figure 23. Teacher report of skills students struggle with the most
(N=447)

Malik, Gasana, Raab, Cha, & Goldenberg 27
4.20 Language of Instruction
Teachers reported that all of the students learn to read in Kinyarwanda. A quarter of teachers (24
percent) indicated that they had students in their classrooms whose home language was something
other than Kinyarwanda (while 43 percent of teachers observed indicated this to be the case). About
76 percent of the students who have a home language other than Kinyarwanda are reported as having
difficulty understanding instructions in the classroom. Figure 27 shows that only 38 percent of
teachers of second language learners are fluent in the students’ home language, 21 percent are
conversational and 7 percent know some words and phrases. Over half of the teachers of second
language learners report never using the students’ home language in class in order to clarify concepts
(Fig. 28).
98%
29%
0%
50%
100%
Informal assessment Formal assessment
Figure 25. Type of assessment conducted by teacher during
lesson observed (N=42)
83%
2%
0%
20%
40%
60%
80%
100%
Summative assessment Formative assessment
Figure 26. Type of assessment records kept by teacher (N=42)
38% 34%
21%
7%
0%
20%
40%
60%
80%
100%
Fluent Don't know Conversational Know some
words/phrases
Figure 27. Reported level of teacher proficiency with students’
home language (when other than Kinyarwanda) (N=105)

Malik, Gasana, Raab, Cha, & Goldenberg 28
5 Recommendations for Literacy Boost Implementation
Baseline assessment found that there is a lack of print material, especially books other than textbooks,
in classrooms in Gicumbi. This lack of books may be associated with the low levels of regular reading
out loud that has been found to take place in classrooms in this study. Given that the presence of
reading material is an essential first step towards successful acquisition of literacy skills for young
children, it is recommended that classrooms be provided with an adequate number and type of books
during LB implementation. In addition to providing books and other reading materials to classrooms
where they are lacking, Literacy Boost should aim to increase teacher knowledge regarding the
importance of frequent exposure to books (textbooks and other) as well as train them on strategies to
effectively incorporate books into lessons.
It is recommended that the Literacy Boost program underline the importance of print material in the
environment of young literacy learners and encourage teachers to create print-rich environments for
their students. The material displayed on classroom walls should include examples of various types of
print including letters of the alphabet, syllables, words matched to pictures, sentences, songs and
poems.
As the project moves into the teacher training phase, it may be useful to think about how to make
small changes in the activities that teachers already employ that would make them more effective in
achieving their teaching/learning goals, as well as introducing new activities and methods for the
skills that do not currently receive much focus by teachers (e.g. reading comprehension and writing).
It is recommended that LB expose teachers to research regarding the benefits associated with early
involvement in literacy activities and encourage a culture where students know their letters prior to
start of Primary 1.
While teachers may be using a variety of strategies to teach letter knowledge, it is recommended that
teachers be supported in the use of creative strategies (such as writing letters in the air with fingers)
that provide students with opportunities to practice their letters in a variety of ways.
While teachers indicated an understanding of syllables, they seemed to struggle with the concept of
phonemes. It is highly recommended that an understanding of phonemes be emphasized during the
Teacher Training component of LB implementation. Teacher training should provide teachers with an
understanding of phonemes, outline the importance of phonological awareness as a basic component
of reading development and provide teachers with tools to develop phonological awareness skills
among students.
57%
25%
8% 7% 4%
0%
20%
40%
60%
80%
100%
Never Few times/month Every lesson 1-2 times/wk Every day
Figure 28. Frequency of teacher using students’ home language to
help them understand concepts in class (when the home language is
other than Kinyarwanda) (N=102)

Malik, Gasana, Raab, Cha, & Goldenberg 29
LB training should emphasize the importance of vocabulary skills towards reading success. Strategies
that are effective in teaching vocabulary skills must also be emphasized with teachers during LB
implementation.
The LB program should aim to increase teacher knowledge regarding the important features of
reading out loud to students (with prosody (rhythm, stress, and intonation)) and subsequently increase
the frequency of this teaching strategy. Additionally, while it is encouraging that many teachers report
that students read out loud regularly, it is important that all teachers allow students opportunities to
practice reading out loud with fluency and appropriate prosody. While reading words out loud is
important, reading sentences and passages out loud from a variety of text is essential to developing
reading fluency. Literacy Boost training should encourage teachers to incorporate daily read-aloud
time into their lesson plans and to read various types of text out loud on a regular basis to students.
The Literacy Boost program can also encourage teachers to create regular opportunities for students to
read individually, providing them with greater practice and allowing for more productive feedback
when it comes to fluency
LB training should assist teachers in understanding skills that indicate reading comprehension among
students and which are indicators of other literacy skills. While teachers have a good grasp on some
explicit ways to assess reading comprehension, there is a need to increase teacher knowledge
regarding the various methods to assess student’s deeper understanding about the text (i.e. strategies
that have students interact with text in a more meaningful way than simply parroting back facts from
the text). Literacy Boost should build on the methods teachers already use and support them in
developing additional effective strategies to teach reading comprehension skills in the classroom. By
having students participate in activities such as summarizing a text, discussing their opinions of
content read or linking text to their own life experiences, teachers can enhance students’
comprehension beyond basic facts contained in text. These strategies can be highlighted during
Literacy Boost implementation. Currently, teachers appear to be asking mainly fact-based questions
about text students read. Literacy Boost training can encourage teachers to ask different types of
questions, particularly questions that help students to think more deeply about content that they are
exposed to and allow students to be more creative and expressive in their dialogue about text they
read.
Information regarding the importance of formative assessment as well as strategies to conduct and
record this type of assessment is essential to include in LB implementation. Assignment of literacy
homework should also be encouraged during LB implementation so that children have the opportunity
to practice literary skills beyond the walls of their classrooms.
If the home language is indeed different than the language of instruction, it is imperative that teachers
employ strategies that will ease learning for these second language learners. These strategies could
include speaking clearly at a comfortable pace, strategically employing words from the students’
home language during lessons to aid comprehension (but not engaging in simultaneous translations),
and using visuals, and using visuals, gestures, and other redundant information to help students
understand lesson content. Supporting teachers in the use of these strategies will ensure that all
students are able to benefit from the literacy lessons presented in class.
6 Conclusion
Teacher Baseline assessment indicates that there are some gaps in teacher knowledge regarding the
core skills for literacy development. When asked which five skills are most important in learning to
read, 82 percent of teachers surveyed included letter knowledge, 82 percent included reading
comprehension, 72 percent included reading fluency, 31 percent included phonemic awareness
(translated as identifying constituents within a word) and 20 percent selected vocabulary.
Classroom observations provide evidence that although teachers are focusing on development of letter
knowledge skills in Primary I and Primary 2 classrooms, these skills are being taught in traditional,
basic ways (such as reading the letter or writing the letter in students’ notebooks) indicating that

Malik, Gasana, Raab, Cha, & Goldenberg 30
teachers may benefit from support regarding varied, creative (i.e. more kinesthetic and fun) ways to
teach these skills.
It is presently unclear whether phonemic awareness is an essential component of acquiring literacy in
Kinyarwanda. Baseline results found that there appears to be a lack of clear understanding among
teachers regarding the concept of phonemes and phonemic awareness activities did not occur in all
classrooms (words with specific sounds were generated in 50 percent of classrooms and specific
sounds with a spoken word were identified in 26 percent of classrooms). However, the importance of
phonemic awareness in the Rwandan classroom is still not clear. Similarly, vocabulary skills were not
widely considered a core reading skills by teachers and the least amount of observed lesson time was
spent on vocabulary instruction.
Reading fluency is the skill that the highest number of teachers reported their students to be struggling
with. Teachers may be modeling reading to students but they do not appear to be doing so (with books
other than textbooks) regularly. In addition, not all students are provided the opportunity to practice
reading books out loud on a regular basis-although this may be in part due to a lack of reading
material in the classroom.
Comprehension skills are currently being taught in a very basic way such as asking direct questions
about text and asking students to summarize text. Teachers may benefit from training on strategies
that allow students to think about text that is read on a deeper level, such as explicitly relating text to
their own lives or generating new ideas based on ideas found within the text.
Although there appears to be adequate seating and lighting in classrooms, there is a need for more
print material on the walls of the classrooms, in particular examples of developmentally appropriate
and meaningful use of print such as songs and poems. There appears to be very little small group
interaction between students during literacy lessons, teachers call on very few students and students
almost never ask questions during lessons. Although teachers ask questions of students, most of the
questions teachers ask are short, closed ended questions. Teachers could benefit from literacy
instruction strategies that allow students more independent practice of skills learned during lessons as
well as more ‘hands-on’ participation during class.
Although teachers appear to conduct informal assessment of students during lessons and keep
summative assessment records, most teachers do not keep formative assessment records. Because
charting student progress through formative assessment can guide lesson planning and the strategies
teachers use within lessons, it is imperative that teachers be encouraged to keep formative assessment
records of each student. Only a handful of teachers give literacy homework to students. In this way,
students miss the opportunity to practice literacy skills at home and possibly involve family members
in their literacy development.
Some teachers indicated the presence of students in their classrooms who are struggling with
Kinyarwanda, indicating the need for strategies that cater to the needs of second language learners
during literacy instruction. If there are learners in the classroom who are struggling due to a difference
between home language and language of instruction, teachers will benefit from strategies such as
speaking clearly at a comfortable pace, and employing cognates (words that are the same or very
similar in both the home language and Kinyarwanda) during lessons so that second language learners
may participate comfortably and work towards successfully acquisition of literacy skills as well.
A lack of clear understanding among teachers regarding the core skills of reading development may
ultimately impact student acquisition of literacy skills. Given that Literacy Boost has a strong teacher
training component that highlights these core skills as well as supporting teachers to adopt evidence-
based strategies for teaching reading within the local context, the program has the potential to
positively impact literacy instruction in Gicumbi. The recommendations provided will help target LB
implementation in the district and strengthen the teaching of literacy skills in classrooms. Follow-up
assessments will provide insight into the effectiveness of teacher training in this context.

Malik, Gasana, Raab, Cha, & Goldenberg 31
References
Allington, R. L. (1977). If They Don't Read Much How They Ever Gonna Get Good? Journal of
Reading, 21. 57-61.
Allington, R. L. (1983) The Reading Instruction Provided Readers of Differing Reading Abilities. The
Elementary School Journal, 83 (5). 548-559.
Bishop, D. V. M. & Adams, C. (1990). A Prospective Study of the Relationship Between Impairment,
Phonlogical Disorders and Reading Retardation. Journal of Child Psychology and Psychiatry,
31 (7). 1027-1050.
Blachman, B. A. (2000). Phonological Awareness. In M. L. Kamil, P. B. Mosenthal, P. D. Pearson, &
R. Barr (Eds.), Handbook of Reading Research, 3. 483–502.
Bowey, J. A. (1994). Phonological Sensitivity in Novice Readers and Non-Readers. Journal of
Experimental Child Psychology, 58(1). 134-159.
Byrne, B., Fielding-Barnsley, R., & Ashley, L. (2000). Effects of Preschool Phoneme Identity
Training After Six Years: Outcome level distinguished from rate of response. Journal of
Educational Psychology. 92 (4). 659-667.
Chall, J. S. (1996). American Reading Achievement: Should we worry? Research in the Teaching of
English, 30 (3). 303-310.
Cunningham, J. W. (1979). An Automatic Pilot for Decoding. The Reading Teacher, 32. 420-424.
Elbro, C., Borstrom, I., & Peterson, D. K. (1998). Predicting Dyslexia From Kindergarten: The
Importance of Distinctness of Phonological Representations of Lexical Items. Reading
Ressearch Quarterly, 33 (1). 36-60.
Goldenberg, C. Tolar, T., Reese, L., Francis, D., Ray, A., & Mejia-Arauz, R. (in press). How
important is teaching phonemic awareness to children learning to read in Spanish? American
Educational Research Journal.
Juel, C. (1988). Learning to Read and Write: A longitudinal study of 54 children from first through
fourth grades. Journal of Educational Psychology, 80(4). 437-447.
Kintsch, W. & Rawson, K. A. (2008). Comprehension. In Snowling M. J. & Hume, C. (Eds) The
Science of Reading: A handbook.
Metsala, J. L. & Ehri, L. C. (1998). Word Recognition in Beginning Literacy. Psychology Press.
Muter, V. & Diethelm, K. (2001). The Contribution of Phonological Skills and Letter Knowledge to
Early Reading Development in a Multilingual Population. Language Learning 51 (2) 187-
219.
National Institute of Child Health and Human Development. (2000). Report of the National Reading
Panel. Teaching children to read: an evidence-based assessment of the scientific research
literature on reading and its implications for reading instruction. Retrieved December, 30,
2013 from http://www.nichd.nih.gov/publications/nrp/smallbook.htm.
Pennington, B. F., Groisser, D. & Welsch, M. C. (1993). Contrasting Cognitive Deficits in Attention
Deficit Hyperactivity Disorder Versus Reading Disability. Developmental Psychology, 29 (3)
511-523.

Malik, Gasana, Raab, Cha, & Goldenberg 32
Pressley, M. (2002). Reading Instruction That Works: The case for balanced teaching. Guilford Press.
Samuels, S. J. (1979). The Method of Repeated Readings. The Reading Teacher, 32.403-408.
Smith, D., D. (1979). The Improvement of Children's Oral Reading through the Use of Teacher
Modeling. Journal of Learning Disabilities, 12. 39-42.
Stahl, S. A. & Fairbanks, M. M. (1986). The Effects of Vocabulary Instruction: A model-based meta-
analysis. Review of Educational Research, 56. 72-110.
Stanovich, K. E. (1986). Matthew Effects in Reading: Some consequences of individual differences in
the acquisition of literacy. Reading Research Quarterly, 21 (4). 360-407.
Stanovich, K. E. (1988). Explaining the Differences Between the Dyslexic and the Garden Variety
Poor Reader: The phonological-core variable-difference model. Journal of Learning
Disabilities, 21 (10) 590-604.
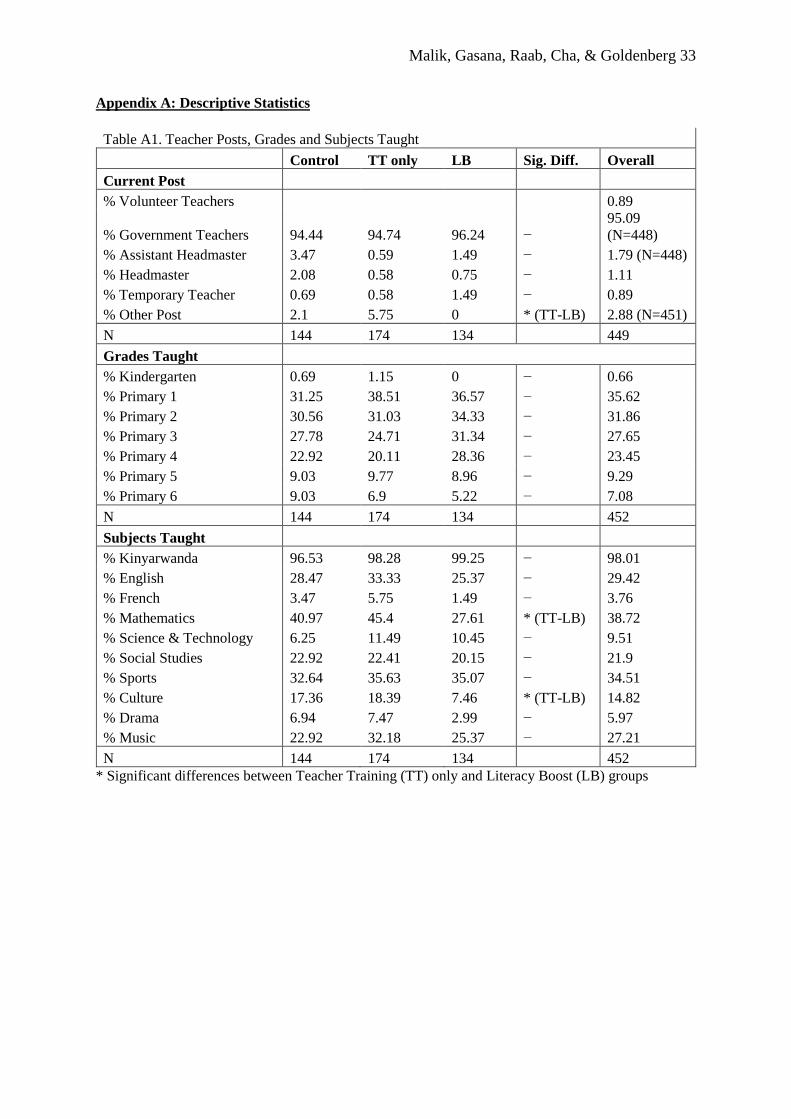
Malik, Gasana, Raab, Cha, & Goldenberg 33
Appendix A: Descriptive Statistics
Table A1. Teacher Posts, Grades and Subjects Taught
Control TT only LB Sig. Diff. Overall
Current Post
% Volunteer Teachers 0.89
% Government Teachers 94.44 94.74 96.24 −
95.09
(N=448)
% Assistant Headmaster 3.47 0.59 1.49 − 1.79 (N=448)
% Headmaster 2.08 0.58 0.75 − 1.11
% Temporary Teacher 0.69 0.58 1.49 − 0.89
% Other Post 2.1 5.75 0 * (TT-LB) 2.88 (N=451)
N 144 174 134 449
Grades Taught
% Kindergarten 0.69 1.15 0 − 0.66
% Primary 1 31.25 38.51 36.57 − 35.62
% Primary 2 30.56 31.03 34.33 − 31.86
% Primary 3 27.78 24.71 31.34 − 27.65
% Primary 4 22.92 20.11 28.36 − 23.45
% Primary 5 9.03 9.77 8.96 − 9.29
% Primary 6 9.03 6.9 5.22 − 7.08
N 144 174 134 452
Subjects Taught
% Kinyarwanda 96.53 98.28 99.25 − 98.01
% English 28.47 33.33 25.37 − 29.42
% French 3.47 5.75 1.49 − 3.76
% Mathematics 40.97 45.4 27.61 * (TT-LB) 38.72
% Science & Technology 6.25 11.49 10.45 − 9.51
% Social Studies 22.92 22.41 20.15 − 21.9
% Sports 32.64 35.63 35.07 − 34.51
% Culture 17.36 18.39 7.46 * (TT-LB) 14.82
% Drama 6.94 7.47 2.99 − 5.97
% Music 22.92 32.18 25.37 − 27.21
N 144 174 134 452
* Significant differences between Teacher Training (TT) only and Literacy Boost (LB) groups

Malik, Gasana, Raab, Cha, & Goldenberg 34
Table A2. Teacher Understanding of Literacy Materials and Literacy Skills
Control
TT
only LB
Sig.
Diff. Overall
The Top 3 Important Items to Improve Reading Skills
% Textbooks 79.02 75.58 78.95 − 77.68 (N=448)
% Storybooks 59.44 61.05 63.16 − 61.16 (N=448)
% Soccer balls 6.99 12.21 6.02 − 8.71 (N=448)
% Vocabulary Posters 25.87 27.91 21.05 − 25.22 (N=448)
% Newspapers 30.77 26.32 24.24 − 27.13
% Alphabet Posters 41.96 45.61 43.94 − 43.95
% Science Equipment 5.59 3.51 1.52 − 3.59
% Magazines 4.90 7.02 5.30 − 5.83
% Religious Books 8.39 8.77 9.09 − 8.74
% Flash Cards 49.65 43.86 53.03 − 48.43
N 143 172 133 446
Five Key Skills to Becoming a Good Reader
% Memorizing Passages 26.57 26.44 17.16 − 23.73
% Identifying Letters and Sounds 81.82 81.03 83.58 − 82.04
% Knowing Days of the Week 1.4 3.47 4.48 − 3.11 (N=450)
% Phonemic Awareness 32.87 26.01 36.57 − 31.33 (N=450)
% Clear Handwriting 73.43 75.29 74.63 − 74.5
% Reading Fluently 71.33 74.14 70.9 − 72.28
% Having Good Vocabulary 16.78 20.23 21.64 − 19.56 (N=450)
% Understanding What is Read 82.52 83.33 79.1 − 81.82
% Sitting Quietly 6.29 12.07 13.43 − 10.64
% Paying Good Attention 52.45 45.4 38.06 − 45.45
% Good Grammar/Pronunciation 51.05 45.4 57.46 − 50.78
N 143 174 134 451
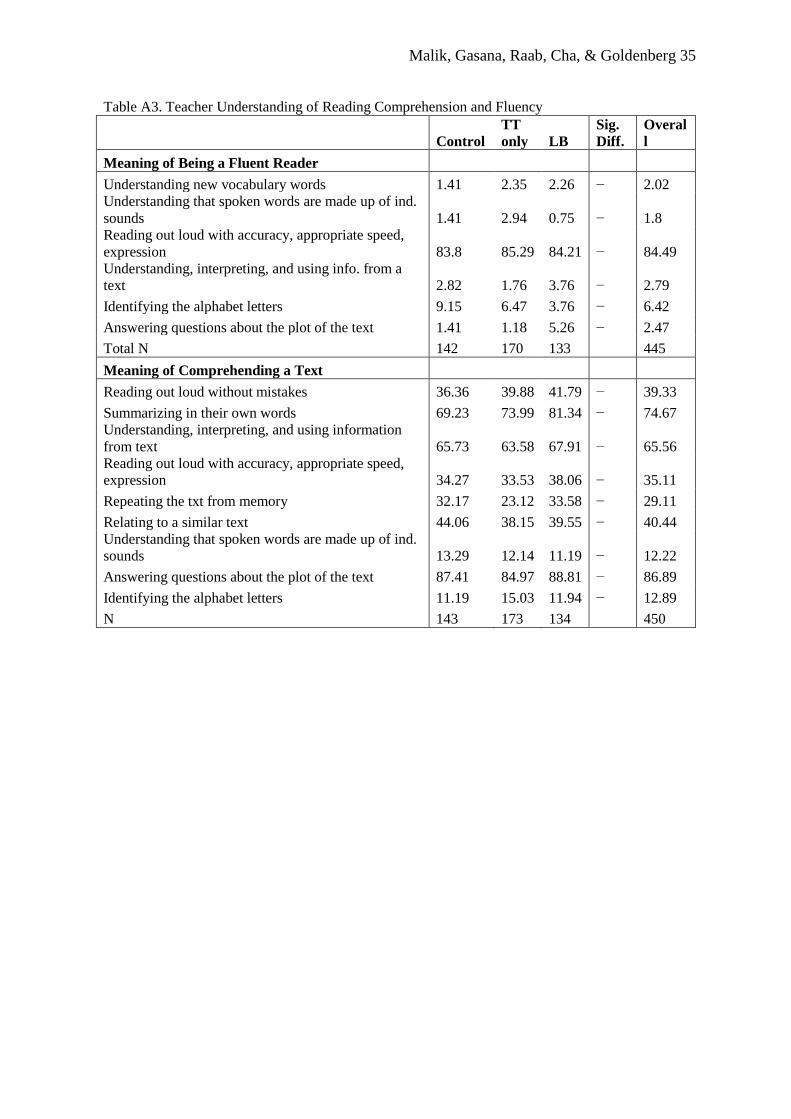
Malik, Gasana, Raab, Cha, & Goldenberg 35
Table A3. Teacher Understanding of Reading Comprehension and Fluency
Control
TT
only LB
Sig.
Diff.
Overal
l
Meaning of Being a Fluent Reader
Understanding new vocabulary words 1.41 2.35 2.26 − 2.02
Understanding that spoken words are made up of ind.
sounds 1.41 2.94 0.75 − 1.8
Reading out loud with accuracy, appropriate speed,
expression 83.8 85.29 84.21 − 84.49
Understanding, interpreting, and using info. from a
text 2.82 1.76 3.76 − 2.79
Identifying the alphabet letters 9.15 6.47 3.76 − 6.42
Answering questions about the plot of the text 1.41 1.18 5.26 − 2.47
Total N 142 170 133 445
Meaning of Comprehending a Text
Reading out loud without mistakes 36.36 39.88 41.79 − 39.33
Summarizing in their own words 69.23 73.99 81.34 − 74.67
Understanding, interpreting, and using information
from text 65.73 63.58 67.91 − 65.56
Reading out loud with accuracy, appropriate speed,
expression 34.27 33.53 38.06 − 35.11
Repeating the txt from memory 32.17 23.12 33.58 − 29.11
Relating to a similar text 44.06 38.15 39.55 − 40.44
Understanding that spoken words are made up of ind.
sounds 13.29 12.14 11.19 − 12.22
Answering questions about the plot of the text 87.41 84.97 88.81 − 86.89
Identifying the alphabet letters 11.19 15.03 11.94 − 12.89
N 143 173 134 450

Malik, Gasana, Raab, Cha, & Goldenberg 36
Table A4. Frequency Co-Occurrence Chart for Reading Skills with Actors & Activities Mentioned by
Teachers (Note: number of total mentions in answers not teachers
To
tal
in R
ead
ing
Act
ivit
y
1&
2
Wo
rds
wit
h l
ette
r in
th
em
Rea
d f
rom
Bla
ckb
oard
Rea
din
g S
ilen
tly
Rea
din
g t
ext
Rep
eat
aft
er t
each
er
Sto
ry-t
elli
ng
Stu
den
ts S
ho
w/D
o
Tea
cher
Fee
db
ack
Tea
cher
mo
del
s
Use
In
stru
ctio
na
l
Ma
teri
als
Vo
cab
ula
ry
Wo
rds
Phonemic Awareness 47 12 22 5 10
Reading
Comprehension 54 11 11 5 11 6
Reading Aloud
(without explicit
reference to fluency)
113 10 13 14 7 88 24 15 6
Reading Fluency 123 10 6 12 50 20 78 11
--All Reading Aloud 236 10 23 20 19 138 44 93 17
Decoding/ Encoding 36 7 9 9 16
Letter Id & Letter-
Sound
Correspondence
100 47 5 11 20 7 19 15
Writing 41 5 13 5 14
Vocabulary 61 7 5 13 12

Malik, Gasana, Raab, Cha, & Goldenberg 37
Table A5. Teacher Report of Literacy Instruction in the Classroom
Control
TT
only LB
Sig.
Diff.
Overal
l
% Teaching Reading Comprehension 99.29 98.26 99.25 − 98.88
N 141 172 133 446
% Teaching Letter Names/Sounds 62.79 64.71 64.29 − 63.97
N 129 153 126 − 408
Strategy Used to Teach Reading Comprehension
Teacher's reading passage repeatedly 72.34 71.18 62.41 − 68.92
Having students repeat the story 36.17 37.65 33.08 − 35.81
Telling students the meaning of story 68.79 65.88 61.65 − 65.54
Asking to predict about the text before reading
it 24.11 22.35 21.05 − 22.52
Asking to predict about the text while reading
it 32.62 29.41 23.31 − 28.6
Asking to answer questions about the text 88.65 84.71 87.22 − 86.71
Asking to summarize the text 81.56 82.94 80.45 − 81.76
Asking to make visual representations of the
text 15.6 16.47 16.54 − 16.22
Asking to express opinions about the text 53.9 44.12 50.38 − 49.1
Asking to name the letters out loud 29.79 30.59 25.56 − 28.83
N 141 170 133 444

Malik, Gasana, Raab, Cha, & Goldenberg 38
Table A6. Teacher Report of Reading out Loud in the Classroom
Control TT only LB Sig. Diff. Overall
Students reading out loud individually
Never 3.68 2.98 0 − 2.34
Once per school term 0.74 0 0 − 0.23
Monthly 0 1.19 0 − 0.47
2-3 times per month 3.68 1.19 0.81 − 1.87
Weekly 4.41 4.17 2.44 − 3.75
2-4 times per week 18.38 26.79 26.83 − 24.12
Daily 69.12 63.69 69.92 − 67.21
N 136 168 123 427
Students reading out loud in chorus as a class
Never 29.55 37.67 34.21 − 33.93
Once per school term 0 0.68 0 − 0.26
Monthly 0.76 0.68 0 − 0.51
2-3 times per month 0.76 0.68 1.75 − 1.02
Weekly 12.88 4.79 6.14 − 7.91
2-4 times per week 21.97 23.29 28.95 − 24.49
Daily 34.09 32.19 28.95 − 31.89
N 132 146 114 392
Teacher reading out loud a storybook to students
Never 20.33 35.29 29.57 − 28.9
Once per school term 4.07 3.92 4.35 − 4.09
Monthly 5.69 7.19 7.83 − 6.91
2-3 times per month 9.76 7.19 6.96 − 7.93
Weekly 22.76 19.61 23.48 − 21.74
2-4 times per week 26.02 19.61 19.13 − 21.48
Daily 11.38 7.19 8.7 − 8.95
N
391
Teacher reading out loud other texts to students
Never 22.05 23.53 22.73 − 22.82
Once per school term 5.51 5.88 3.64 − 5.13
Monthly 7.09 10.46 10 − 9.23
2-3 times per month 11.02 10.46 10 − 10.51
Weekly 24.41 19.61 23.64 − 22.31
2-4 times per week 19.69 22.88 21.82 − 21.54
Daily 10.24 7.19 8.18 − 8.46
N 127 153 110 390

Malik, Gasana, Raab, Cha, & Goldenberg 39
A7. Teacher Report of Materials Read and Frequency of Reading Out Loud
Control
TT
only LB Sig. Diff.
Overa
ll
Words teacher wrote
Never 3.88 3.05 1.75 − 2.95
Once per school term 0.78 1.22 0.88 − 0.98
Monthly 2.33 1.83 1.75 − 1.97
2-3 times per month 5.43 2.44 1.75 − 3.19
Weekly 18.6 20.73 20.18 − 19.9
Daily 68.99 70.73 73.68 − 71.01
N 129 164 114 407
Newspapers or magazines
Never 52.68 64.44 56.38 − 58.36
Once per school term 6.25 5.93 3.19 − 5.28
Monthly 8.93 4.44 9.57 − 7.33
2-3 times per month 10.71 4.44 4.26 − 6.45
Weekly 14.29 11.11 9.57 − 11.73
2-4 times per week 5.36 8.15 11.7 − 8.21
Daily 1.79 1.48 5.32 − 2.64
N
341
Textbooks
Never 9.02 7.01 3.31 − 6.57
Once per school term 4.51 2.55 4.13 − 3.65
Monthly 3.01 3.18 4.13 − 3.41
2-3 times per month 5.26 4.46 7.44 − 5.6
Weekly 11.28 15.29 13.22 − 13.38
2-4 times per week 45.11 44.59 39.67 − 43.31
Daily 21.8 22.93 28.1 − 24.09
N 133 157 121 411
Storybooks
Never 27.56 37.96 30.84 − 32.35
Once per school term 3.94 6.57 4.67 − 5.12
Monthly 11.81 11.68 13.08 − 12.13
2-3 times per month 11.02 9.49 15.89 − 11.86
Weekly 26.77 21.17 16.82 − 21.83
2-4 times per week 14.17 10.22 14.95 − 12.94
Daily 4.72 2.92 3.74 − 3.77
N 127 137 107 371
Words students wrote
Never 6.61 15.07 8.65 10.51
Once per school term − − − − −
Monthly − − − − −
2-3 times per month 1.65 2.05 3.85 − 2.43
Weekly 4.96 5.48 2.88 − 4.58
2-4 times per week 17.36 17.81 27.88 − 20.49
Daily 69.42 59.59 56.73 − 61.99

Malik, Gasana, Raab, Cha, & Goldenberg 40
A8. Frequency of homework assignment involving reading or writing
Control TT only LB Sig. Diff. Overall
Never 1.4 0.57 2.29 − 1.34
Once per school term 0.7 0 0 − 0.22
Monthly 1.4 0.57 3.05 − 1.56
2-3 times per month 2.1 1.72 2.29 − 2.01
Weekly 15.38 12.07 6.87 − 11.61
2-4 times per week 39.86 39.08 45.8 − 41.29
Daily 39.16 45.98 39.69 − 41.96
N 143 174 131 448
A9. Teacher Report of Assessment of Reading Skills
Control TT only LB Sig. Diff. Overall
% Assessing reading abilities 97.69 98.12 96.77 − 97.58
130 160 124 414
How to check text
comprehension
By facial expression 2.16 2.4 1.52 − 2.05
No need to check 0 1.2 0.76 − 0.68
Asking about specific vocabulary
words 71.94 74.1 66.67 −
71.17
(N=437)
Asking to summarize the text 74.82 77.84 80.3 − 77.63
Asking to tell the main points of
the text 73.38 68.26 70.45 − 70.55
Asking to write a response 55.4 49.1 53.79 − 52.51
Asking questions about the text 93.53 94.61 95.45 − 94.52
Asking to act out the story 25.18 30.54 28.03 − 28.08
N 139 167 132 438
N 121 146 104 − 371
Flashcards/word strips
Never 32.77 35.92 48.45 38.27
Once per school term 2.52 1.41 0 1.4
Monthly 0.84 4.93 1.03 2.51
2-3 times per month 0.84 4.93 0 2.23
Weekly 15.13 12.68 7.22 12.01
2-4 times per week 18.49 17.61 23.71 19.55
Daily 29.41 22.54 19.59 24.02
N 119 142 97 358

Malik, Gasana, Raab, Cha, & Goldenberg 41
A10. Teacher Report of Frequency of Holding and Using Books (Other than
Textbooks) at School
Control TT only LB Sig. Diff. Overall
Never 17.19 25.81 23.08 − 22.25
Once per school term 0.78 2.58 2.56 − 2
Monthly 0.78 3.23 3.42 − 2.5
2-3 times per month 2.34 3.23 3.42 − 3
Weekly 10.94 7.1 5.13 − 7.75
2-4 times per week 20.31 14.84 29.06 − 20.75
Daily 47.66 43.23 33.33 − 41.75
N 128 155 117 400
Table A11. Teacher Knowledge About Phonological Awareness
Contr
ol TT only LB Sig. Diff. Overall
Number of syllables in the word
"Muramuke"
% 2 syllables 0 0 0.76 − 0.23
% 3 syllables 4.32 2.33 0.76 − 2.49
% 4 syllables 95.68 96.51 97.71 − 96.61
% 5 syllables 0 1.16 0 − 0.45
% 6 syllables 0 0 0.76 − 0.23
N 139 172 131 442
Number of phonemes in the word
"Muraho"
% 2 phoneme 47.33 56.88 59.84 54.78
% 3 phonemes 39.69 39.38 34.65 38.04
% 4 phonemes 10.69 1.88 3.15 5.02
% 5 phonemes 1.53 0 0.79 0.72
% 6 phonemes 0.76 1.88 1.57 1.44
N 131 160 127 418

Malik, Gasana, Raab, Cha, & Goldenberg 42
Table A12. Teacher Knowledge about Literacy Skills and Teaching Strategies
Control TT only LB Sig. Diff. Overall
Teaching Strategy: Teaching that syllables together form a word (mu-ra-ho)
% Phonemic awareness 33.06 37.42 34.96 − 35.37
% Memory building 1.61 0.61 2.44 − 1.46
% Reading fluency 12.9 8.59 11.38 − 10.73
% Letter knowledge 45.97 49.08 45.53 − 47.07
% Reading
comprehension 0.81 0 0 − 0.24
% Handwriting 3.23 0.61 4.88 − 2.68
%of Vocabulary 2.42 3.68 0.81 − 2.44
N 124 163 123 410
Teaching Strategy: Asking to sound a word without the first letter (Meza-->Eza)
% Phonemic awareness 37.31 43.21 37.3 − 39.57
% Memory building 2.24 3.7 1.59 − 2.61
% Reading fluency 8.96 6.17 4.76 − 6.64
% Letter knowledge 41.79 39.51 51.59 − 43.84
% Reading
comprehension 0 0 0.79 − 0.24
% Handwriting 0 0.62 0 − 0.24
% Vocabulary 9.7 6.79 3.97 − 6.87
N 134 162 126 422
Teaching Strategy: Asking to tell the meaning of the words taught
% Phonemic awareness 6.67 5.39 3.17 − 5.14
% Memory building 8.89 12.57 13.49 − 11.68
% Reading fluency 5.93 3.59 6.35 − 5.14
% Letter knowledge 5.19 2.99 0.79 − 3.04
% Reading
comprehension 23.7 25.15 20.63 − 23.36
% Vocabulary 49.63 50.3 55.56 − 51.64
N 135 167 126 428
Teaching Strategy: Asking to practice reading out loud
% Phonemic awareness 23.7 23.98 18.25 − 22.22
% Memory building 4.44 2.92 3.97 − 3.7
% Reading fluency 59.26 63.74 67.46 − 63.43
% Letter knowledge 6.67 4.09 4.76 − 5.09
% Reading
comprehension 5.19 3.51 3.17 − 3.94
% Handwriting 0 0 0.79 − 0.23
% Vocabulary 0.74 1.75 1.59 − 1.39
N 135 171 126 432

Malik, Gasana, Raab, Cha, & Goldenberg 43
Table A13. Teacher Report of Skills Students Struggle with the Most
Control TT only LB
Sig.
Diff. Overall
% Letter identification 58.04 53.18 58.78 − 56.38
% Writing letters 47.55 47.4 58.78 − 50.78
% Understanding words in
Kinyarwanda 41.96 28.9 39.69 * (C-TT) 36.24
% Decoding (sounding out words) 51.05 37.57 48.85 * (C-TT) 45.19
% Figuring out the meaning of
unfamiliar words 48.95 43.35 45.04 − 45.64
% Reading sentences fluently 58.74 53.18 60.31 − 57.05
% Reading paragraphs fluently 39.86 42.77 46.56 − 42.95
% Reading stories fluently 39.16 43.93 48.09 − 43.62
% Comprehending text read to them 29.37 24.86 31.3 − 28.19
% Comprehending text they read 38.46 35.26 40.46 − 37.81
N 143 173 131 447
*significant differences between Control and TT only groups

Malik, Gasana, Raab, Cha, & Goldenberg 44
Table A14. Teacher Report of Percentage of Students in Their Classroom Having
Developed Specific Literacy Skills
Control
TT
only LB Sig. Diff. Overall
Identification of some letters
% None 0.72 0.58 0 − 0.46
% A few 18.12 28.65 19.38 − 22.6
% About half 18.84 19.3 24.81 − 20.78
% Most 46.38 40.35 48.84 − 44.75
% All 15.94 11.11 6.98 − 11.42
N 138 171 129 − 438
Identifying all letters
% None 1.46 1.82 1.57 − 1.63
% A few 22.63 26.67 28.35 − 25.87
% About half 17.52 20 18.11 − 18.65
% Most 41.61 41.82 44.88 − 42.66
% All 16.79 9.7 7.09 − 11.19
N 137 165 127 − 429
Reading out loud a sentence
% None 2.16 3.59 0 − 2.07
% A few 32.37 44.31 46.51 − 41.15
% About half 23.74 26.35 27.91 − 25.98
% Most 30.94 21.56 22.48 − 24.83
% All 10.79 4.19 3.1 − 5.98
N 139 167 129 − 435
Reading out loud a word
% None 3.6 4.13 3.64 − 3.8
% A few 34.23 28.1 29.09 − 30.41
% About half 10.81 27.27 25.45 − 21.35
% Most 37.84 31.4 35.45 − 34.8
% All 13.51 9.09 6.36 − 9.65
N 111 121 110 − 342
Reading out loud a
paragraph
% None 5.97 10 11.29
* (C-TT/C-
LB)
9.09
% A few 37.31 48.12 43.55 43.3
% About half 17.91 18.75 24.19 20.1
% Most 29.85 19.38 20.97 23.21
% All 8.96 3.75 0 4.31
N 134 160 124 418
Summarizing a text
% None 15.38 17.83 21.77 − 18.25
% of A few 43.08 45.22 50 − 45.99
% of About half 17.69 18.47 15.32 − 17.27
% of Most 20.77 17.83 12.1 − 17.03
% of All 3.08 0.64 0.81 − 1.46
N 130 157 124 − 411
*significant differences exist between groups

Malik, Gasana, Raab, Cha, & Goldenberg 45
Table A15. Teaching in Kinyarwanda and Home Language of Students
Control TT only LB
Sig.
Diff. Overall
% Teaching in a language other than Kinyarwanda
28.06 37.21 26.12 − 31.01
N 139 172 134 445
Other Languages of Instruction
% Teaching in Rukiga 4.21 3.79 3.85 − 3.93 (N=331)
% Teaching in Kiswahili 1.05 1.52 1.92 − 1.51 (N=331)
% Teaching in English 40.62 48.12 32.69 − 41.14
N 96 133 104 333
Language of reading in school
% Kinyarwanda 100 100 100 − 100
N 138 166 132 436
Number of students whose home language is Kinyarwanda
% None 2.8 9.25 6.11 − 6.26
% A few 11.19 8.09 6.11 − 8.5
% About half 0.7 0.58 1.53 − 0.89
% Most 9.09 6.36 5.34 − 6.94
% All 76.22 75.72 80.92 − 77.4
N 143 173 131 447
Number of students having home language other than Kinyarwanda and difficulty
understanding instructions in Kinyarwanda
% None 74.31 72.99 82.58 − 76.22
% A few 15.97 11.49 6.82 − 11.56
% About half 4.17 5.17 3.79 − 4.44
% Most 3.47 8.05 5.3 − 5.78
% All 2.08 2.3 1.52 − 2
N 144 174 132 450
Teacher speaking students' home language
% Don't know 10.64 12.21 5.97 − 9.84
% Know some words and phrases 2.84 0 2.24 − 1.57
% Conversational 4.96 8.14 7.46 − 6.94
% Fluent 81.56 79.65 84.33 − 81.66
N 141 172 134 447
How often teachers speak other languages to help students understand concepts
% Never 66.4 55.77 54.29 − 58.81
% A few times per month 10.4 7.05 7.62 − 8.29
% 1-2 times per week 2.4 2.56 2.86 − 2.59
% Everyday 3.2 3.21 8.57 − 4.66
% In every lesson 17.6 31.41 26.67 − 25.65
N 125 156 105 386
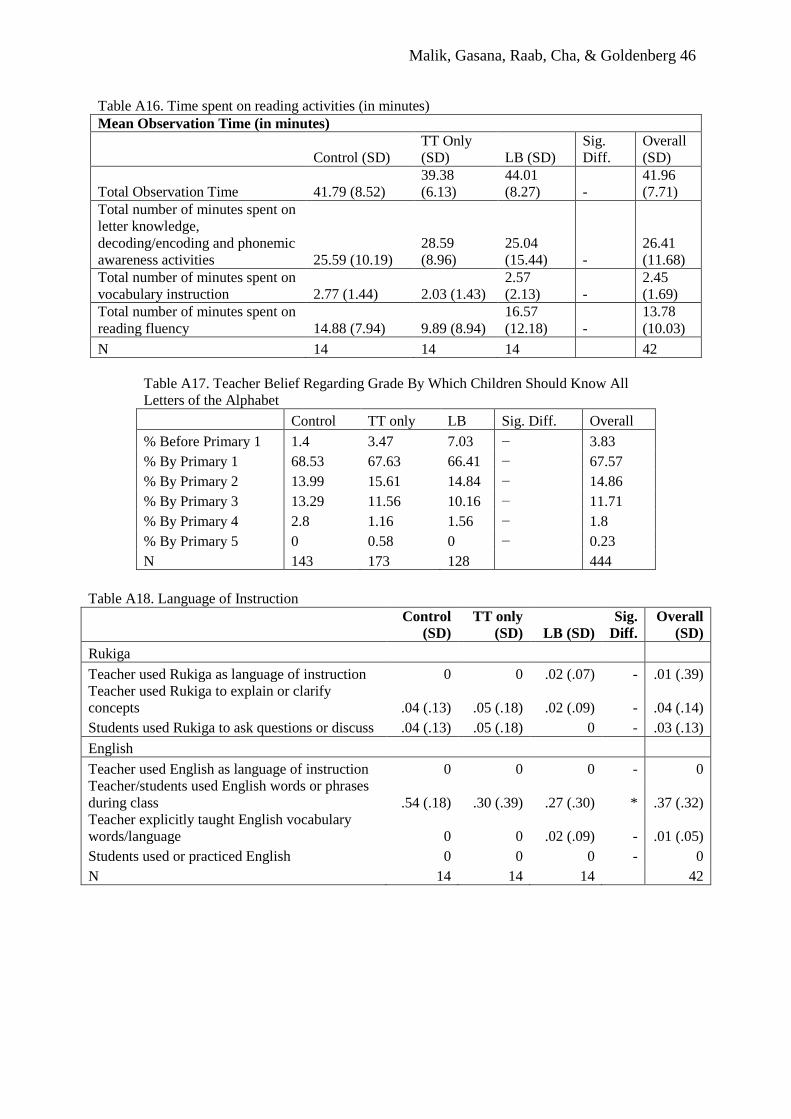
Malik, Gasana, Raab, Cha, & Goldenberg 46
Table A16. Time spent on reading activities (in minutes)
Mean Observation Time (in minutes)
Control (SD)
TT Only
(SD) LB (SD)
Sig.
Diff.
Overall
(SD)
Total Observation Time 41.79 (8.52)
39.38
(6.13)
44.01
(8.27) -
41.96
(7.71)
Total number of minutes spent on
letter knowledge,
decoding/encoding and phonemic
awareness activities 25.59 (10.19)
28.59
(8.96)
25.04
(15.44) -
26.41
(11.68)
Total number of minutes spent on
vocabulary instruction 2.77 (1.44) 2.03 (1.43)
2.57
(2.13) -
2.45
(1.69)
Total number of minutes spent on
reading fluency 14.88 (7.94) 9.89 (8.94)
16.57
(12.18) -
13.78
(10.03)
N 14 14 14 42
Table A17. Teacher Belief Regarding Grade By Which Children Should Know All
Letters of the Alphabet
Control TT only LB Sig. Diff. Overall
% Before Primary 1 1.4 3.47 7.03 − 3.83
% By Primary 1 68.53 67.63 66.41 − 67.57
% By Primary 2 13.99 15.61 14.84 − 14.86
% By Primary 3 13.29 11.56 10.16 − 11.71
% By Primary 4 2.8 1.16 1.56 − 1.8
% By Primary 5 0 0.58 0 − 0.23
N 143 173 128 444
Table A18. Language of Instruction
Control
(SD)
TT only
(SD) LB (SD)
Sig.
Diff.
Overall
(SD)
Rukiga
Teacher used Rukiga as language of instruction 0 0 .02 (.07) - .01 (.39)
Teacher used Rukiga to explain or clarify
concepts .04 (.13) .05 (.18) .02 (.09) - .04 (.14)
Students used Rukiga to ask questions or discuss .04 (.13) .05 (.18) 0 - .03 (.13)
English
Teacher used English as language of instruction 0 0 0 - 0
Teacher/students used English words or phrases
during class .54 (.18) .30 (.39) .27 (.30) * .37 (.32)
Teacher explicitly taught English vocabulary
words/language 0 0 .02 (.09) - .01 (.05)
Students used or practiced English 0 0 0 - 0
N 14 14 14 42

Malik, Gasana, Raab, Cha, & Goldenberg 47
Table A19. Second language learners in the classroom
Contro
l (SD)
TT only
(SD)
LB
(SD)
Sig.
Diff.
Overal
l (SD)
Mean number of students who speak Rukiga
11.68
(18.19)
6.75
(14.17)
3.91
(9.74) -
7.45
(14.46)
Mean number of students who do not speak
Kinyarwanda fluently
7.25
(7.92)
N=6
9.29 (12.
62 ) N=7
7.92
(11.73)
N=6 -
8.21
(10.47)
% Teachers who do/need to do something to
help second language students
100 %
(N=5)
85.71%
(N=7)
42.86%
(N=7) -
73.68%
(N=14)