listeria monocytogenes: prevalence and levels in deli- meat at retail the nafss study public...
TRANSCRIPT

Listeria monocytogenes: Prevalence and Levels in Deli-
Meat at Retail The NAFSS Study
Public Meeting: June 23, 2009
.
Funding: National Alliance for Food Safety and Security, Universities of Tennessee, Minnesota, UC Davis, Auburn
and USDA/ARS
Dr. Ann Draughon, Roddy Distinguished Professor
The University of Tennessee, Knoxville

Collaborators: NAFSS USDA-ARS
Consultants:
AMI, FMI, NTF, NFPA/FPA, USDA-FSIS
Michigan State UniversityU. C. Davis Auburn University
Draughon Cliver, Hajmeer Ryser Oyarzabal
Objective 1 - Determine the occurrence of Listeria monocytogenes in 8015 selected RTE meat and poultry deli meats sliced at deli counter and product pre-packaged under USDA inspection Objective 2 - Determine the levels of Listeria monocytogenes (LM) in RTE meat and poultry that is positive for LM
Objectives:

Types of Samples Targeted
Goal: 8000 Samples Total
(½ retail deli and ½ pre-packed manufacturer)
LM Sample Size: 125 g (FSIS methodology)
Uncured Poultry:1000 deli, 1000 pre-pack
Cured Poultry: 1000 deli, 1000 pre-pack
Beef and Pork: 2000 deli, 2000 pre-pack
Previously Unopened Chub Samples:1000
Locations for Sample Collection1. Collect data in locations where
foodborne illness data are routinely documented by FoodNet/PulseNet
2. Choose locations representative of the United States (geographic, product availability, age & other demographics)
3. Choose locations where NAFSS scientist were willing to work collaboratively and follow highly specific and identical detailed protocols for sample collection, handling, analysis and data reporting

FoodNet Sites
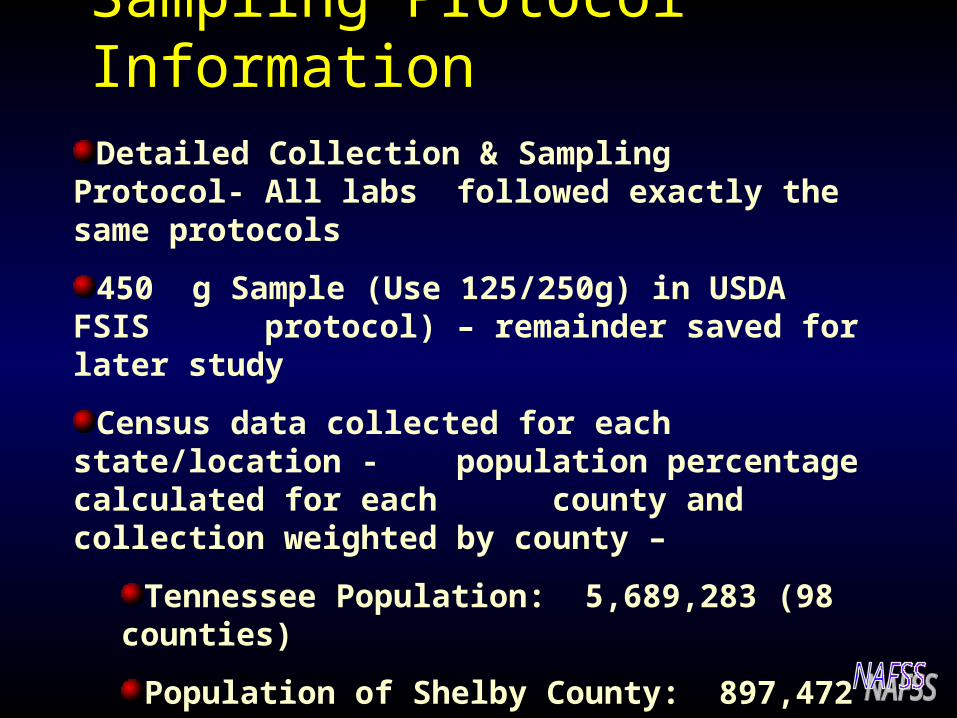
Sampling Protocol InformationDetailed Collection & Sampling Protocol- All labs
followed exactly the same protocols
450 g Sample (Use 125/250g) in USDA FSIS protocol) – remainder saved for later study
Census data collected for each state/location - population percentage calculated for each county and collection weighted by county –
Tennessee Population: 5,689,283 (98 counties)
Population of Shelby County: 897,472
Shelby is 15.7% of population x 2000 samples
315 samples collected in Shelby County

Sampling Protocol Information
Stores in sampling area (yellow pages and internet) selected based on random number generator. Each store visited only once.
Information on Deli Practices Collected with Sample
From store to lab in <24h, held at <4 C Temperature Data Loggers in all coolers Extensive Information Collected With Sample
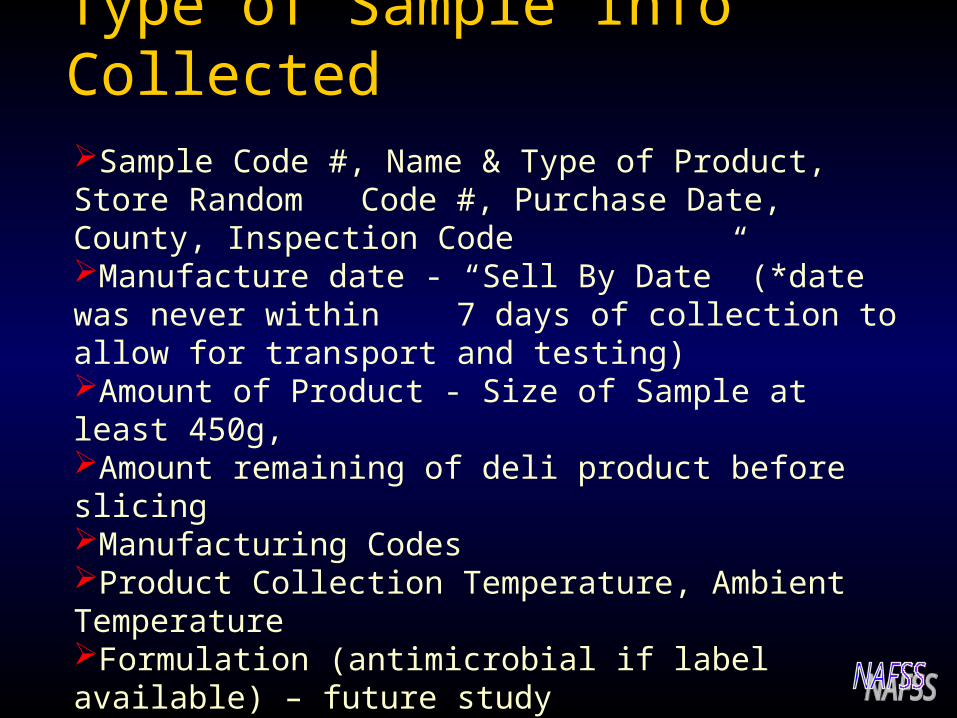
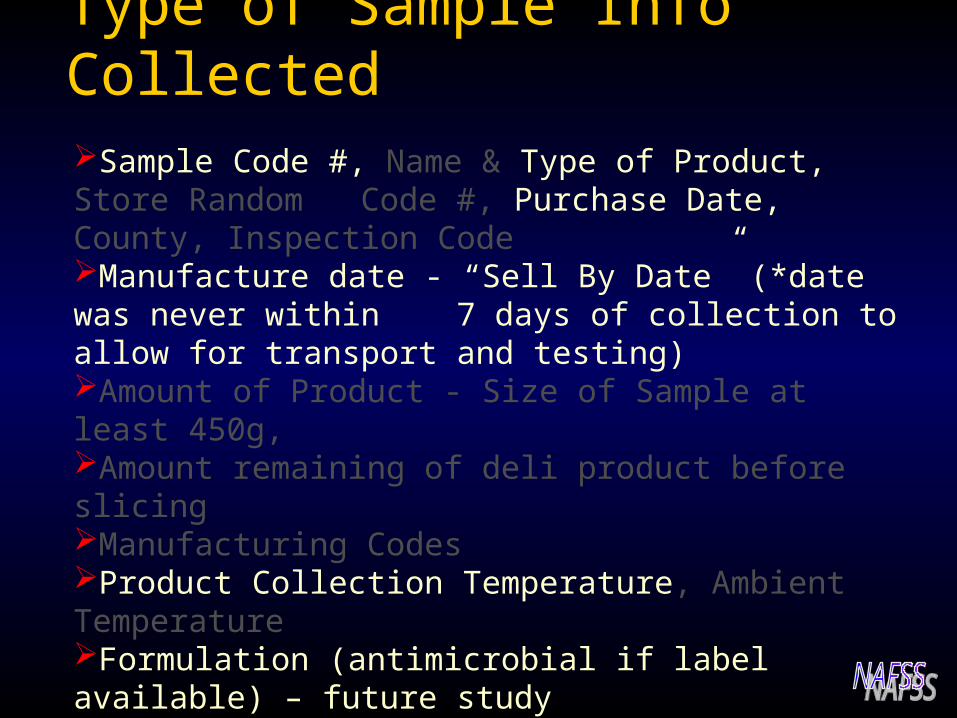
Type of Sample Info CollectedSample Code #, Name & Type of Product, Store Random
Code #, Purchase Date, County, Inspection CodeManufacture date - “Sell By Date” (*date was never within
7 days of collection to allow for transport and testing)Amount of Product - Size of Sample at least 450g, Amount remaining of deli product before slicingManufacturing CodesProduct Collection Temperature, Ambient Temperature Formulation (antimicrobial if label available) – future studyState or Federally inspected Brand varieties encouraged so that a cross section of the
market was demonstrated. Brand Matching (ie. Retail Case Ready vs Deli) was not possible.
Customer Based Deli Practices Score (our system)

Selection of Grocery StoresType A Stores: 75% of samples
In the Top 100 Retailers: Examples: Wal-Mart, Kroger, Albertsons, Safeway, Ahold, Publix, Delhaize, Winn Dixie, A&P, HEB, Supervalu, Shaws, Eagle, Hy-Vee, Pathmark, Raley’s, Wegmans, Harris-Teeter, Stater Bro, Price Shopper, Whole Foods (including ALL store names owned by the corporation – i.e.. Kroger (Ralphs, King Sooper, Smith’s, Dillons, QFC, PayLess, etc.)
Type B Stores: 25% of samples
Examples: Small regional chains, privately or family owned, small national chains

Analysis Protocol for LM(USDA with additions)
125 g sample
UVM Broth
Fraser Broth MOX
Rapid LM
Chrom Agar
Horse Blood Overlay Agar
Gene Trak Listeria Assay
3 Tube MPN (USDA Protocol)
API &
GeneQuence Genetic Confirmation
STORAGE, PFGE, PCR
Only if Presumptive Positive
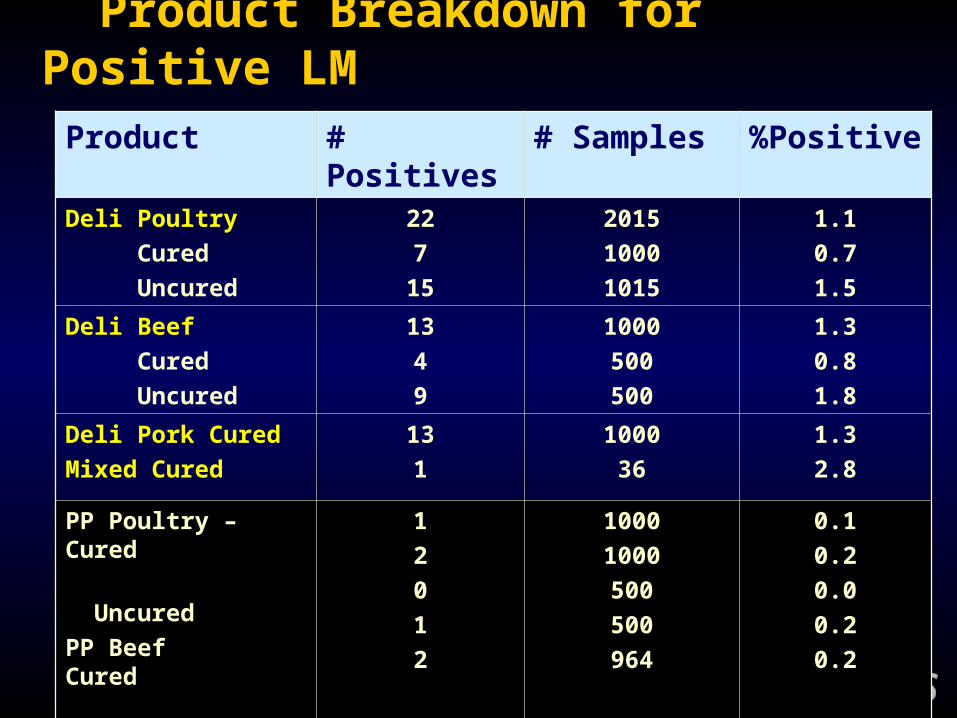
Product Breakdown for Positive LMProduct # Positives # Samples %Positive
Deli Poultry
Cured
Uncured
22
7
15
2015
1000
1015
1.1
0.7
1.5
Deli Beef
Cured
Uncured
13
4
9
1000
500
500
1.3
0.8
1.8
Deli Pork Cured
Mixed Cured
13
1
1000
36
1.3
2.8
PP Poultry – Cured
Uncured
PP Beef Cured
Uncured
PP Pork Cured
1
2
0
1
2
1000
1000
500
500
964
0.1
0.2
0.0
0.2
0.2

LM Positive Deli Style RTE Meat & Poultry Samples -2005-2006
State Pre-Packed
Deli Sliced
Total
Pos
Total Samples
CA 0 12 12 2015
GA 0 10 10 2000
MN 4 12 16 2000
TN 2 15 17 2000
% POS 0.15% 1.23% 0.69% 8015
NFPA ‘03 0.4% 2.7% 0.89% (2000-2001)

Comparison of LM Occurrence in RTE Meat and Poultry at Retail
Product
RTE Meat & Poetry
2001-02
% Pos
LM
2005-06
% Pos
LM
Reduction in Pos LM
Pre-Pack 0.40 0.15 63%
Deli-Pack 2.70 1.23 55%
Ratio of LM in
deli vs. pre-pack
7:1 8:1

MPN of LM in RTE Meat& Poultry 2005-2006
0
5
10
15
20
25
30
35
40
45
0.08 to0.3
0.3 to 1 1 to 10 10 to100
>100
Total Deli Sliced Prepacked
Number of
Positive Samples
Level of LM in MPN/g
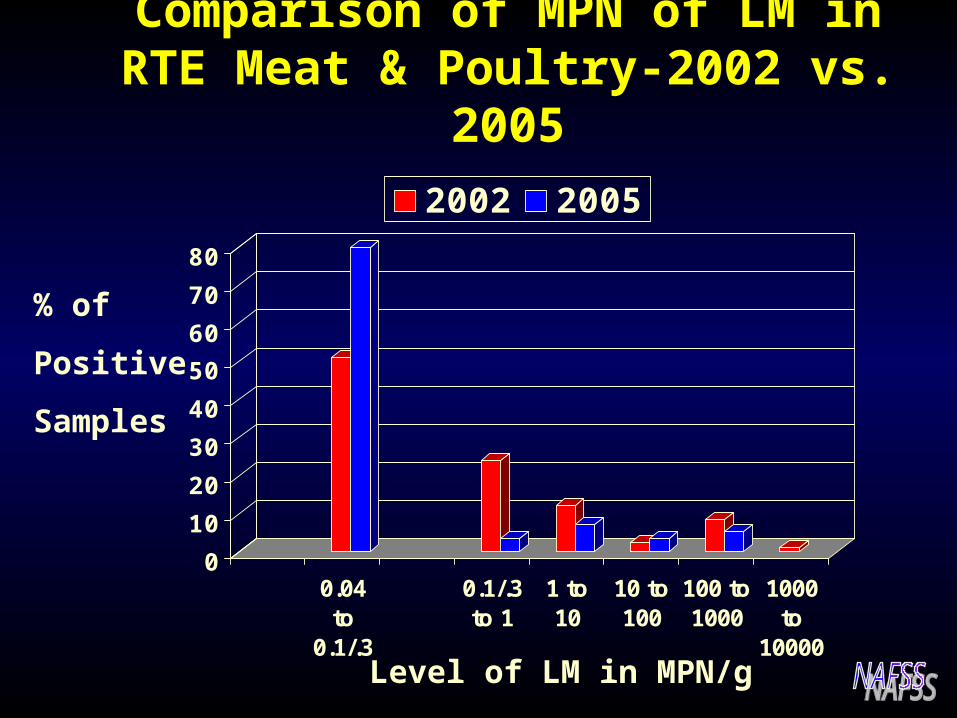
Comparison of MPN of LM in RTE Meat & Poultry-2002 vs. 2005
0
10
20
30
40
50
60
70
80
0.04to
0.1/.3
0.1/.3to 1
1 to10
10 to100
100 to1000
1000to
10000
2002 2005
% of
Positive
Samples
Level of LM in MPN/g

Deli Checklist 10 pt Maximum
Score of 0, 1or 2 for each section (2=no observed deficiency)
Personnel – cleanliness, hairnet, gloves, apron, etc.
Product – clean, orderly, refrigerated, no raw meat contact, unprotected contact with surfaces
Display Case – clean, drip, maintenance, customer access, temperature
Checklist continued…
Visible Deli Facilities – clean, trash covered, food prep in serving area, clutter, floors, slicers- set up and cleanliness, food contact surfaces cleaned frequently, etc.
Premises – appear clean, off-odors, rodents, bait or insects, standing water, appropriate indoor temperature (68 to 78), humidity if available, product transport carts
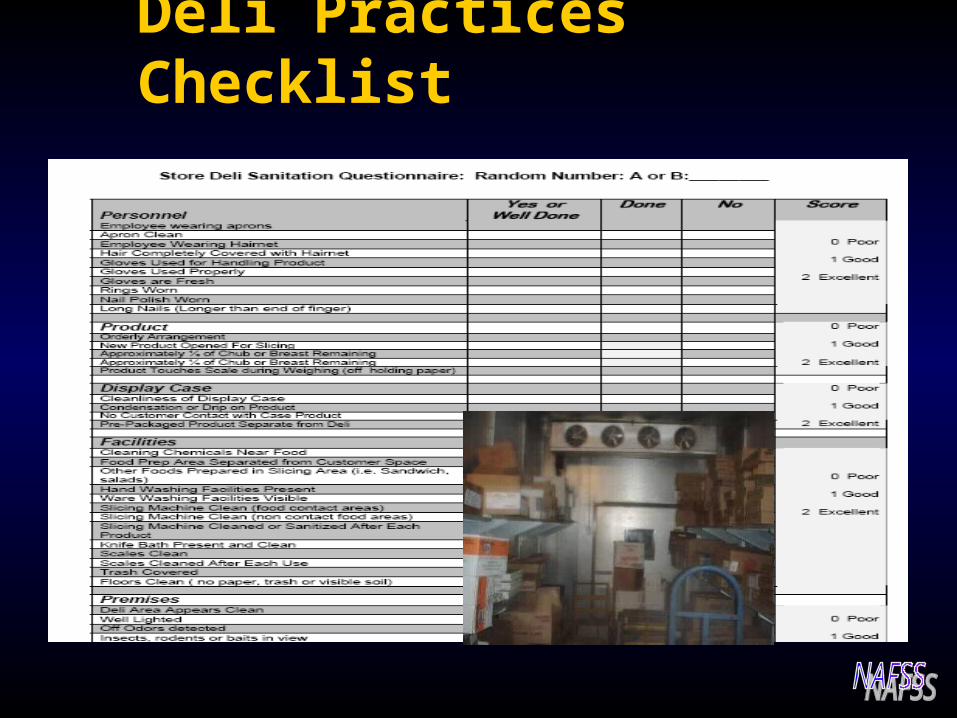
Deli Practices Checklist

Deli Checklist Scores - All Stores
0
10
20
30
40
50
60
0 1 2 3 4 5 6 7 8 9 10
A STORES B STORES
Deli Checklist Score 0-10 (10=excellent)
Number of stores

LM Positives Compared to Checklist Scores
0
2
4
6
8
10
12
14
16
0 1 2 3 4 5 6 7 8 9 10
A STORES B STORES
Check-List Score 0-10 (10=excellent)
Po
siti
ve S
amp
les

Product Temperature at Time of Collection of LM pos Samples
0
1
2
3
4
5
6
7
8
9
1 3 5 7 9 11 13 15 20
POS LM
Temperature °C
#
Samples

Refrigeration Storage Times for Deli Meatsa
Average Storage Time
PrePacked
Deli Meats
Sliced at Deli
Deli Meats
1 to 3 days 32% 39%
4 to 7 days 37% 36%
8 to 10 days 6% 3%
11 to 14 days 4% 1%
15 to 60 days 3% 0%
Source: AMI 2001, FDA CFSAN, 2003
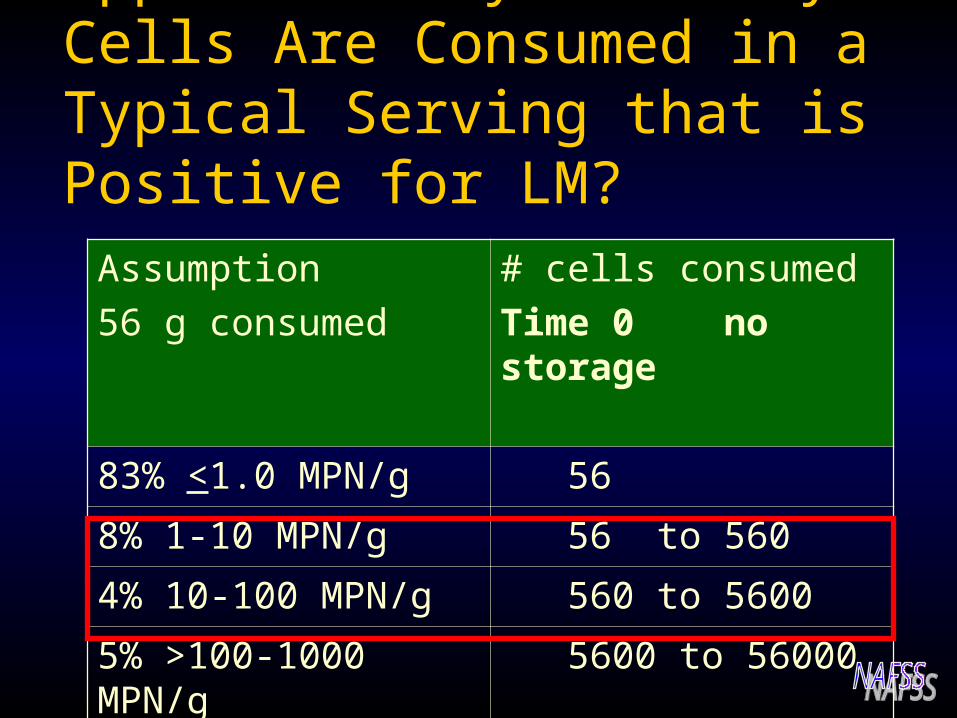
Approximately How Many Cells Are Consumed in a Typical Serving that is Positive for LM?
Assumption
56 g consumed
# cells consumed
Time 0 no storage
83% <1.0 MPN/g 56
8% 1-10 MPN/g 56 to 560
4% 10-100 MPN/g 560 to 5600
5% >100-1000 MPN/g 5600 to 56000

Concluding ThoughtsLM Prevalence: 0.15% pre-packed
1.2% deli sliced
LM Prevalence in RTE meat and poultry reduced by more than half since 2002
LM Levels were reduced compared to 2002
Intervention is needed to assist some of the smaller grocery deli operators to improve deli practices
Delis that are attractive and look clean may still have issues with LM
Acknowledgement and Appreciation: Folks Who Critically Reviewed and Contributed
to Methodology , Experimental Design and Sampling Protocol
Listeria Research Team: Ryser, Oryzabal, Hajmeer, Cliver
USDA-ARS Liaison: Jim Lindsay
USDA-FSIS Lynda K., Heather H-F, Many
Formerly NFPA now FPA: Jenny Scott
American Meat Institute: Randy Huffman
Food Marketing Institute: Jill Hollingsworth
National Alliance for Food Safety & Security: J. Denton
Thank you