lister ebusiness white paper 2013 10 webintegration omnitureanalytics
TRANSCRIPT

8/10/2019 Lister EBusiness White Paper 2013 10 WebIntegration OmnitureAnalytics
http://slidepdf.com/reader/full/lister-ebusiness-white-paper-2013-10-webintegration-omnitureanalytics 1/10
WHITE PAPER
Web Integration
Omniture Analytics
May 2013
Deepak RatheeDelivery Manager, Lister Technologies
Vijay RamananSr. ProjecT Manager, Lister Technologies
8/10/2019 Lister EBusiness White Paper 2013 10 WebIntegration OmnitureAnalytics
http://slidepdf.com/reader/full/lister-ebusiness-white-paper-2013-10-webintegration-omnitureanalytics 2/10
WHITE PAPER
Executive Summary
Organizations are constantly challenged
to meet the dynamic demands of an
online business. For most organizations,
digital channels represent a growing
percentage of overall sales, whether
directly through the site, on mobile
devices, or via social media. Digital
channels also play a vital role in an
organization’s broader marketing
strategy, because they provide an exciting
avenue for customers to interact with the
brand. However, marketers need to be
able to make better strategic decisions
based on multichannel data sources, aswell as immediate operational decisions
driven by real-time online data analysis.
Some of the key challenges that online
marketers currently face are:
Correctly attributing marketing
activity to online campaigns
Identifying how social media affects
the business and the brand
Mobilizing marketing initiativesMaking sense of all the data available
from digital channels
Integrating web analytics with other
marketing solutions to get a holistic
customer picture
Understanding customer engagement
The challenge for most organizations is
not gathering data - there are plenty of
•
•
•
•
•
•
tools that can do that. The challenge lies
in analyzing that data and then taking the
necessary steps to yield optimized
improvement that increases a company’s
return on their digital marketing
investments. Companies who grasp this
opportunity will remain relevant.
Companies that don’t will disappear.
SiteCatalyst (Omniture) is the
industry-leading solution to address the
above given challenges. SiteCatalyst
enables organizations to capture and
analyze how customers arrived at theirsite, as well as how customers interact
with the site after they arrive, including
product searches, content viewed, and
the final steps leading up to a completed
or abandoned sale. Whether a site is a
media site that needs to increase
viewership and drive advertising
revenues or a retailer that needs to
identify and highlight its bestselling
products, SiteCatalyst users can generatea variety of highly detailed reports and
dashboards that give clues about how to
reengage lost sales or leads for higher
conversion and revenue. SiteCatalyst
advanced reporting provides
management with the information
needed to manage campaigns and drive
the business forward.
“SiteCatalyst offers Web analytics
(client-side analytics)”
Over the past few years Lister
Technologies has developed and
integrated various websites with the
number of analytical tools in order to
capture the web metrics. The data
gathered from these tools is useful to the
customer in different ways viz. Marketers
need to manage visitor acquisition
budgets, content creators need to know if
their work is engaging (building
relationships or not), e-commercemanagers need to know their conversion
rates, and webmasters/developers
require data on which to base decisions
for technology investment (internal site
search, rich media applications, checkout
systems).
This white paper has been compiledbased on the experience of customer’swebsite integration to the Omniture(SiteCatalyst) tool and further the bestusage of the analytical results forprofitable business decisions.
Lister Technologies White Paper | Web Integration - Omniture Analytics 2
8/10/2019 Lister EBusiness White Paper 2013 10 WebIntegration OmnitureAnalytics
http://slidepdf.com/reader/full/lister-ebusiness-white-paper-2013-10-webintegration-omnitureanalytics 3/10
A High Level Walkthrough
Lister Technologies White Paper | Web Integration - Omniture Analytics 3
Web analytics is not just a tool for
measuring web traffic but can be used as
a tool for business and market research,
and to assess and improve the
effectiveness of a web site. Web analytics
applications can also help companies
measure the results of traditional print
advertising campaigns. It helps one to
estimate how the traffic of a website
changes after launch of a new advertising
campaign. Web analytics
provides information about the number
of visitors to a website and the number of
page views. It helps gauge traffic and
popularity trends which is useful for
market research.
There are two categories of web
analytics: Off-site and On-site web
analytics.
Off-site web analytics refers to web
measurement and analysis regardless of
whether you own or maintain a website.It includes the measurement of a
website's potential audience
(opportunity), share of voice (visibility),
and buzz (comments) that is happening
on the Internet as a whole.
On-site web analytics measure a visitor's
journey once on your website. This
includes its drivers and conversions. For
example - which landing page encourage
people to make a purchase. Onsite web
analytics measures the performance of
your website in a commercial context.
Major expectations from a web analytics
solution are:
Break through measurement
challenges by using a holistic analytics
platform
Measure as well as monetize social
media just like any other channel
Hold your app to the same standard of
measurement as your website.
Optimize mobile and social channels
together
Close the loop between online and
offline marketing campaigns
Integrate all your digital data in one
location
Report less, do more
Distribute data to all stakeholders
throughout the organizationUse one tool that provides one
multichannel view
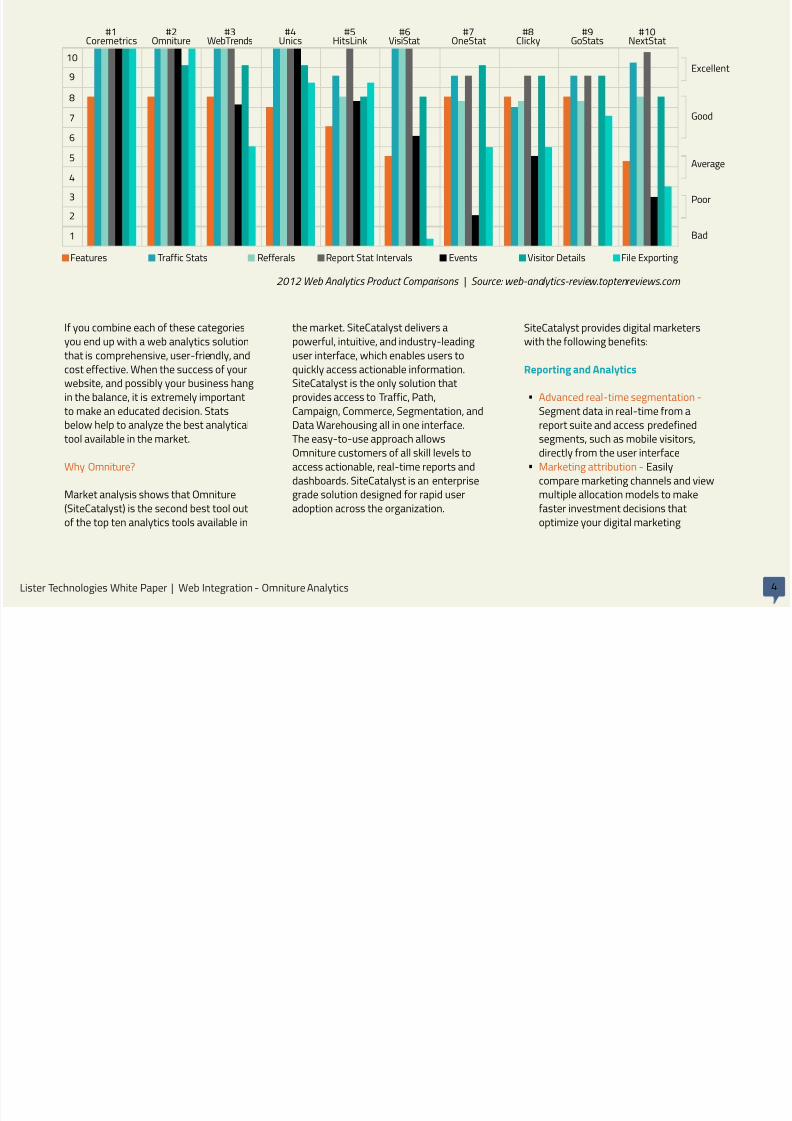
Market research on web analytics
product comparison shows ready to grab
top ten best tools available in the market.
The comparative results of various web
analytic providers displayed on next page
are based out of the list of eight different
categories given below:
Features - Offers a top level view of
several features that will be useful in
measuring your website traffic
Traffic - Information regarding who
visits a website, what each visitor
does on the site (what they click on,
pages they view, etc.), and at what
point they exit the website
Referrals - From where your guest
came from immediately before
arriving on your website
Report Stat Intervals - Whether youneed yearly or monthly reports, or
details down to the day or hour, it's
important that your analytics provider
is versatile with reporting dates and
the accompanying stats
Events - An event is “any logged or
recorded action that has a specific
date and time assigned to it by either
the browser or server”
Visitor Details - Identify targetaudiences, develop campaigns, or
learn what might work better to
increase conversions
File Exporting - Exporting options to
meet your specific needs
Tech Support/Help - Look for a
solution that offers product support
for a period of time following the
initial purchase
•
•
•
•
•
•
•
•
•
•
•
•
•
•
•
•
•
8/10/2019 Lister EBusiness White Paper 2013 10 WebIntegration OmnitureAnalytics
http://slidepdf.com/reader/full/lister-ebusiness-white-paper-2013-10-webintegration-omnitureanalytics 4/10
10
9
8
7
6
5
4
3
2
1
#1Coremetrics
#2Omniture
#3WebTrends
#4Unics
#5HitsLink
#6VisiStat
#7OneStat
#8Clicky
#9GoStats
#10NextStat
Report Stat Intervals Events Visitor Details File ExportingFeatures Traffic Stats Refferals
Excellent
Good
Average
Poor
Bad
2012 Web Analytics Product Comparisons | Source: web-analytics-review.toptenreviews.com
If you combine each of these categories
you end up with a web analytics solution
that is comprehensive, user-friendly, and
cost effective. When the success of your
website, and possibly your business hang
in the balance, it is extremely important
to make an educated decision. Statsbelow help to analyze the best analytical
tool available in the market.
Why Omniture?
Market analysis shows that Omniture
(SiteCatalyst) is the second best tool out
of the top ten analytics tools available in
the market. SiteCatalyst delivers a
powerful, intuitive, and industry-leading
user interface, which enables users to
quickly access actionable information.
SiteCatalyst is the only solution that
provides access to Traffic, Path,
Campaign, Commerce, Segmentation, andData Warehousing all in one interface.
The easy-to-use approach allows
Omniture customers of all skill levels to
access actionable, real-time reports and
dashboards. SiteCatalyst is an enterprise
grade solution designed for rapid user
adoption across the organization.
SiteCatalyst provides digital marketers
with the following benefits:
Reporting and Analytics
Advanced real-time segmentation -
Segment data in real-time from areport suite and access predefined
segments, such as mobile visitors,
directly from the user interface
Marketing attribution - Easily
compare marketing channels and view
multiple allocation models to make
faster investment decisions that
optimize your digital marketing
Lister Technologies White Paper | Web Integration - Omniture Analytics 4
•
•

8/10/2019 Lister EBusiness White Paper 2013 10 WebIntegration OmnitureAnalytics
http://slidepdf.com/reader/full/lister-ebusiness-white-paper-2013-10-webintegration-omnitureanalytics 5/10
Lister Technologies White Paper | Web Integration - Omniture Analytics 5
Prebuilt Reporting - Take advantage of
a comprehensive set of ready-to-use
reports and metrics that can be
shared in PDF, Excel, Word, and HTML
formatsCustom Reporting - Measure any
event on your site, including
drill-down reporting to answer
complex web analytics questions
Flexible data integration - Integrate
multichannel or offline data with data
collected on the website through
SOAP based open standards
One Integrated Tool - Measure,
analyze, and optimize integrated datafrom all online initiatives across
multiple marketing channels and
technologies in one place
Drag-and-drop dashboard design -
Personalize dashboards, alerts, and
bookmarks to deliver quick snapshots
of key performance indicators (KPIs)
for online marketing initiatives
ClickMap Graphic Overlays - Measure
traffic, commerce, and successmetrics visually to display the most
relevant elements on each page of
your website
Publishing Widget - Embed reports on
an intranet or website to
communicate KPIs in real time to
stakeholders who do not have a
SiteCatalyst account
Social, Mobile and Video Measurement
Decisive Social Media Insight -
Understand the impact of online
communities, identify how sharingservices contribute to user behavior,
and gain insight into user-generated
content
Facebook Analytics - Measure key
areas of Facebook - 100% of apps, fan
pages, ads, and Facebook Connect
Mobile Analytics - Accurately profile
mobile audiences, devices, and app
use on major mobile platforms to
improve mobile visitor reportingVideo Reporting - Access in-depth
data on individual videos, comparisons
between videos, video ad reporting,
and which parts are most engaging
Innovative Workflow
Intuitive User Interface - Reveal key
online marketing insights quickly and
easilyReal-time Availability - Access data
from your iPad. Scroll, swipe, and
zoom into specific time periods. Add
new metrics or email reports with a
simple touch
Vast Resources For Self-paced
Learning - Take advantage of training
video modules, user manuals, white
papers, and an extensive
knowledgebase of questions
Automated Decisions - Set up
automatic notification of event
triggers when key metrics exceed orfall below expectations
Adobe SiteCatalyst provides marketerswith actionable, real-time intelligenceabout digital strategies and marketinginitiatives. SiteCatalyst helps marketersidentify the most profitable pathsthrough a website, segment traffic tospot high-value web visitors, determinewhere visitors are navigating away fromthe site, and develop critical successmetrics for digital marketing campaigns.
•
•
•
•
•
•
•
•
•
•
•
•
•
•
•
8/10/2019 Lister EBusiness White Paper 2013 10 WebIntegration OmnitureAnalytics
http://slidepdf.com/reader/full/lister-ebusiness-white-paper-2013-10-webintegration-omnitureanalytics 6/10
Requirements, Integrations & Challenges
Lister Technologies White Paper | Web Integration - Omniture Analytics 6
One of our esteemed clients, a global
leader in e-learning solutions provider,
approached Lister Technologies to
integrate Omniture (SiteCatalyst)
analytical tool to its websites (publishedacross various geographies). This
integration was implemented in order to
capture the web analytics for client’s
websites. And based on the regressive
analysis of those analytical metrics,
business decides on what – when -
where to launch the campaigns,
promotions, price tests, offers, discounts,
and other new strategies to boost the
sale.
Below given is the brief about the Client
Requirements, Integration Steps, and
Challenges faced by development and
test teams (QA).
Client Requirement
Client wanted to capture numerous
metrics’ for different websites and thuswas interested to gather and integrate
statistical data related to the website.
The client’s eCommerce website was
divided under two main headers -
website pages and shopping cart pages.
The events to be captured were listed by
the business and development team
integrated those events (to be fired) into
the web pages and the cart pages.
This integration made the application
smarter by increasing their ability to:
Target the most meaningful customersegments
Take relevant action in real time to
engage customers
Consolidate measurement and
optimize around virtually on any
qualitative or quantitative success
metrics such as: leads, order size,
revenue, profitability or behavioral
scenarios
Omniture Integration Steps:
Omniture provides JS (javascript) file,
which includes the settings to capture
the analytics of the website behavior
This JS file needs to be integrated in
the application source code. One can
modify the JS by adding custom
variables as per the business need
Once integrated into the source of theapplication archive, it’s deployed in the
test/staging environment
Post deployment QA tracks the
requests by checking the variables
fired
Automated reports are generated and
can be checked out at Omniture
console (unique for every client)
These reports provide the detailed
analytics on end-user <-> marketing
front and gives detailed information
for the business strategy team to take
business decisions
Challenges faced by Development & QA
Initial implementation was a challenge
as development team had to integrate
all the required events on web pages
and cart pages
Thus, Omniture came up with a simple
process of adding the following two
components to the pages of a websiteSiteCatalyst implementation
JavaScript code
JavaScript library file
Deploying SiteCatalyst involves
attaching Omniture JS code onto
each page (or page template) of a
website. This JS code contains
variables and other identifiers that
facilitate the data collection
process. These variables may bedynamically populated with server
or application variables. The code
snippet also calls the JavaScript
library file, which contains
SiteCatalyst-specific JavaScript
functions used during metrics
collection. Client browsers cache
this file after the first request,
resulting into virtually no
•
•
•
•
•
•
•
•
•
•
•
•
•
8/10/2019 Lister EBusiness White Paper 2013 10 WebIntegration OmnitureAnalytics
http://slidepdf.com/reader/full/lister-ebusiness-white-paper-2013-10-webintegration-omnitureanalytics 7/10Lister Technologies White Paper | Web Integration - Omniture Analytics 7
incremental server load for the
instrumented site
QA faced issues while capturing and
testing the application in various
browsers. As the custom JS integrated
was not compatible with all the
browsers.
Omniture came up with a solution
viz. Omniture debugger which
executes on all types of browsers
and analyses the web pages
online. To use Omniture debugger,
one has to save it as a bookmark
on the browser window, click on
that bookmark while on a page
with Omniture information. The
debugger will open in a new
window and display information
about the page you are on. There
was too much to capture in terms
of analytical data and thus the
challenge was ‘How’ to identify
and capture all those numerous
components
Omniture bifurcated the
components into certain headers
viz. evars (evariables), events,
sprops (property variables)
To capture the numerous http
requests was a challenge.
Omniture came up with a “http
sniffer” for example – “HttpFox”
tool to track http requests on a
page and filter it with the relevant
keywords on the webpage to
search the Omniture calls. Note-
HttpFox is an addon for Mozilla
based browsers that monitors and
analyzes all incoming and outgoing
http traffic between the browser
and the web servers
Web analytics is the measurement,collection, analysis and reporting ofinternet data for purposes of
understanding and optimizing web usage.It is often done without the permission orknowledge of the user, particularly withthird party cookies which can be sharedbetween different web sites.
•
•
•
•
•

8/10/2019 Lister EBusiness White Paper 2013 10 WebIntegration OmnitureAnalytics
http://slidepdf.com/reader/full/lister-ebusiness-white-paper-2013-10-webintegration-omnitureanalytics 8/10Lister Technologies White Paper | Web Integration - Omniture Analytics 8
Reports, Results & DiscussionThere are various tools in the market that
can help gather the web analytics and
thus capture the reports and results. Few
of the well known tools in the market are
- Coremetrics, Omniture, WebTrends,
Unica, HitsLink, VisiStat, OneStat, Clicky,
GoStats, and NextSTAT etc.
Omniture is one of the best tools in the
market with numerous features that
capture and display ‘N number’ of
reports. For one of our esteemed
customer we captured various reports as
per their business requirement, few of
the reports we captured are:
Site Metrics – Captures the reports
related to Visits, Page views,
hourly / daily / weekly / monthly /
quarterly and yearly unique visitors,
time spent per visit, purchase
conversion funnel, revenue, orders,
units and custom events
Site Content – Gives the reports
related to page ranks, site sections,
exit links, file downloads, click maps,
custom links and Page not found
reports
Legacy Videos – Captures the Video
Views, visits, daily unique video
visitors, video flows, video segments
viewed, Time Spent on Video and
video players
Mobile Metrics – Captures analytics
based on Mobile devices, device types,
manufacturer, audio/video support,
cookie/image support, screen
size/height/width, mobile OS
Paths (the way user is directed to the
website) – Captures next page flow,
next/previous page, fallout, full paths,pathfinder, path length, page
summary, reloads, time spent on
page, clicks on page and exit pages
Traffic sources – Captures Search
keywords all/paid/natural, search
engines all/paid/natural, search page
ranking, referring domains and
referrers
Campaigns – Gives the reports on
campaign conversion funnel, creative
elements, tracking code, promotions,
offers and strategic parameters.
Products – Captures product
conversion funnel, cross sell,
categories, types of products / name /
language / level etc.
Visitors – Captures statistics related
to the visitors i.e. return frequency,
return visits, visit number, customer
loyalty, and new visitors
Visitors Profiles- Gives captured
details of visitors’ country / region /
city / state, language, time zones,
domains etc.
Out of the above given numerous types
of reports we analyzed ‘Monthly Unique
Visitors Report’ and ‘Mobile Device Types
Report’. A detailed graphical output and
analysis of those reports is given below:
Date Selected Month 4 Weeks Prior 52 Weeks Prior
Jul 01, 2012 32,966 42,493 26,489
Jul 02, 2012 28,926 43,314 26,879
Jul 03, 2012 25,908 37,354 30,279
Jul 04, 2012 25,121 39,876 29,520
Jul 05, 2012 26,397 37,394 26,159
Jul 06, 2012 25,180 37,022 23,883
Jul 07, 2012 25,899 33,946 21,122
Jul 08, 2012 28,851 35,551 28,828
Jul 09, 2012 30,171 42,013 29,269
Jul 10, 2012 28,798 36,888 26,955
Jul 11, 2012 27,519 43,437 25,714
Jul 12, 2012 26,773 37,904 24,910
Jul 13, 2012 24,327 44,318 21,971
Jul 14, 2012 23,090 80,766 20,180
Fig. 1: Numeric count of ‘Monthly Unique Visitors’
Fig. 2: Mobile Device Type Report
Device Type Report, July 2012 (July1, 2012 - July 31, 2012)
Other
Device Types
Mobile Phone
Tablet
Gaming Console
eReader
81.5%
Views
12.1%
6.4%
0%
0%
•
•
•
•
•
•
•
•
•
•
8/10/2019 Lister EBusiness White Paper 2013 10 WebIntegration OmnitureAnalytics
http://slidepdf.com/reader/full/lister-ebusiness-white-paper-2013-10-webintegration-omnitureanalytics 9/10Lister Technologies White Paper | Web Integration - Omniture Analytics 9
100,000
90,000
80,000
70,000
60,000
50,000
40,000
30,000
20,000
10,000
Selected Month
1
July 2012
2 3 4 5 6 7 8 9 10 11 12 13 14 15 16 17 18 19 20 21 22 23 24 25 26 27 28 29 30 31
Monthly Unique Visitors Report
M o n t h l y U n i q u e V i s i t o r s
July 2012 (July 1, 2012 - July 31, 2012)
52 Weeks Prior4 Weeks PriorFig. 3: Monthly Unique Visitors Report
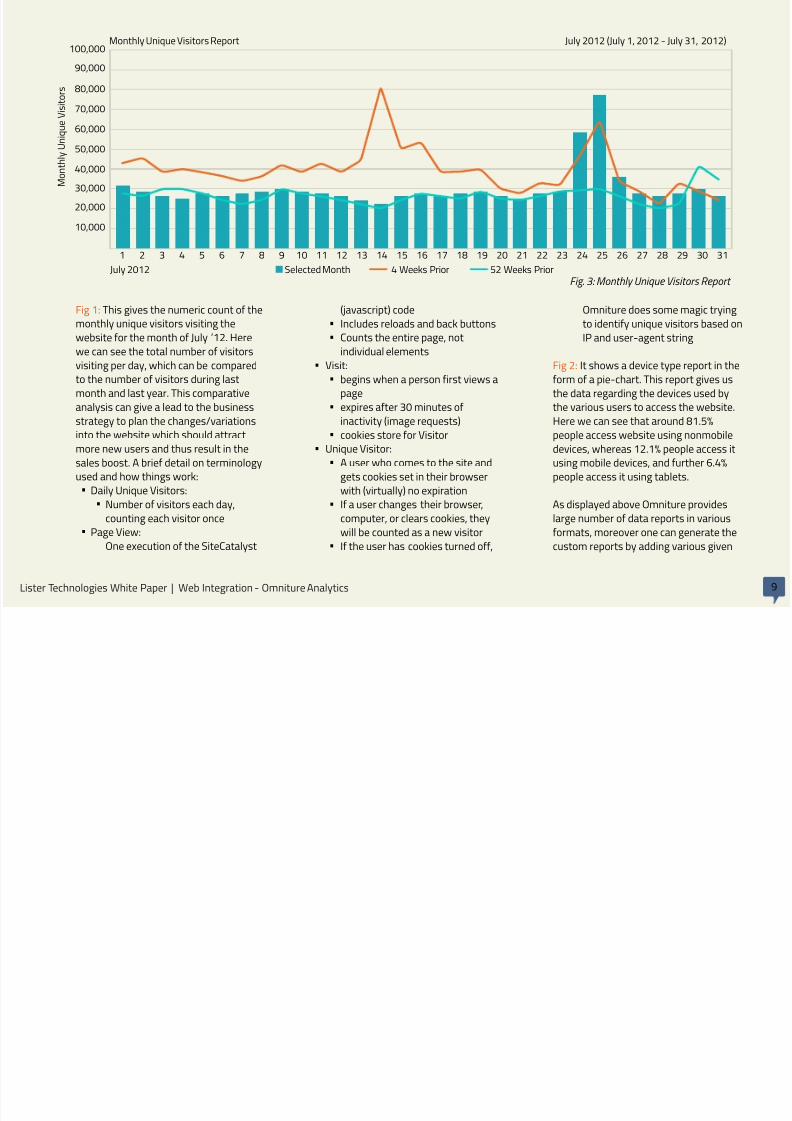
Fig 1: This gives the numeric count of the
monthly unique visitors visiting the
website for the month of July ’12. Here
we can see the total number of visitors
visiting per day, which can be compared
to the number of visitors during last
month and last year. This comparative
analysis can give a lead to the business
strategy to plan the changes/variations
into the website which should attract
more new users and thus result in the
sales boost. A brief detail on terminology
used and how things work:
Daily Unique Visitors:
Number of visitors each day,
counting each visitor once
Page View:
One execution of the SiteCatalyst
(javascript) code
Includes reloads and back buttons
Counts the entire page, not
individual elements
Visit:
begins when a person first views a
page
expires after 30 minutes of
inactivity (image requests)
cookies store for Visitor
Unique Visitor:
A user who comes to the site and
gets cookies set in their browser
with (virtually) no expiration
If a user changes their browser,
computer, or clears cookies, they
will be counted as a new visitor
If the user has cookies turned off,
Omniture does some magic trying
to identify unique visitors based on
IP and user-agent string
Fig 2: It shows a device type report in the
form of a pie-chart. This report gives us
the data regarding the devices used by
the various users to access the website.
Here we can see that around 81.5%
people access website using nonmobile
devices, whereas 12.1% people access it
using mobile devices, and further 6.4%
people access it using tablets.
As displayed above Omniture provides
large number of data reports in various
formats, moreover one can generate the
custom reports by adding various given
•
•
•
•
•
•
•
•
•
•
•
•
•
8/10/2019 Lister EBusiness White Paper 2013 10 WebIntegration OmnitureAnalytics
http://slidepdf.com/reader/full/lister-ebusiness-white-paper-2013-10-webintegration-omnitureanalytics 10/10
©Lister Technologies, 2013. White PaperWeb Integration - Omniture Analytics.All rights reserved.
metrics. The SiteCatalyst Reporting API
gives programmatic access to the
SiteCatalyst's core report data. The
Reporting API lets you create customized
reports that address your specific needs.
The Reporting API also lets you useSiteCatalyst data in third-party
applications, such as an intranet site or a
company-branded application. You can
access the data to create calculated
metrics, or format the data as needed.
The Reporting API uses the generic term
"breakdown" to refer to both
"correlations" (Traffic metrics) and
"sub-relations" (Commerce metrics). Thevariables used to capture commerce
metrics are:
Commerce Visits/Visitors:
cVisits
cVisitors
Commerce Pathing Metrics:
cEntries
cExits
bounces
bounceRate
totalTimeSpent
Traffic:
bots
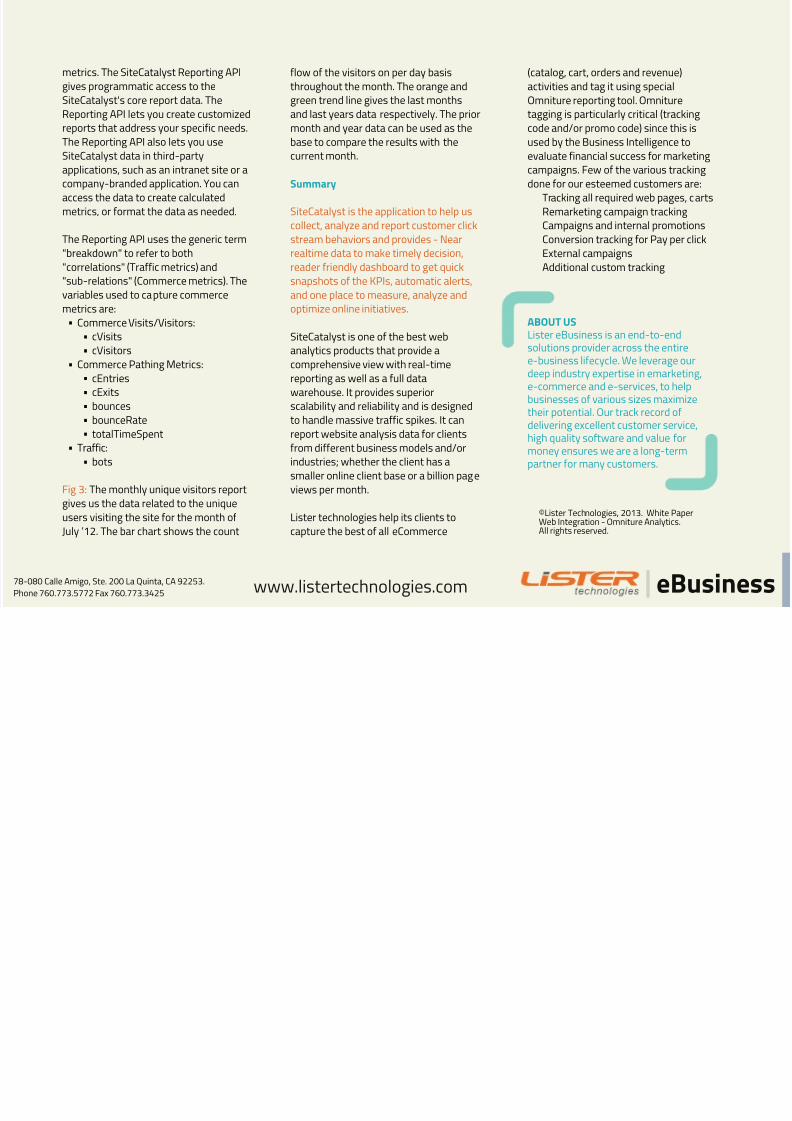
Fig 3: The monthly unique visitors report
gives us the data related to the unique
users visiting the site for the month of
July ’12. The bar chart shows the count
flow of the visitors on per day basis
throughout the month. The orange and
green trend line gives the last months
and last years data respectively. The prior
month and year data can be used as the
base to compare the results with thecurrent month.
Summary
SiteCatalyst is the application to help us
collect, analyze and report customer click
stream behaviors and provides - Near
realtime data to make timely decision,
reader friendly dashboard to get quick
snapshots of the KPIs, automatic alerts,and one place to measure, analyze and
optimize online initiatives.
SiteCatalyst is one of the best web
analytics products that provide a
comprehensive view with real-time
reporting as well as a full data
warehouse. It provides superior
scalability and reliability and is designed
to handle massive traffic spikes. It can
report website analysis data for clients
from different business models and/or
industries; whether the client has a
smaller online client base or a billion page
views per month.
Lister technologies help its clients to
capture the best of all eCommerce
(catalog, cart, orders and revenue)
activities and tag it using special
Omniture reporting tool. Omniture
tagging is particularly critical (tracking
code and/or promo code) since this is
used by the Business Intelligence toevaluate financial success for marketing
campaigns. Few of the various tracking
done for our esteemed customers are:
Tracking all required web pages, carts
Remarketing campaign tracking
Campaigns and internal promotions
Conversion tracking for Pay per click
External campaigns
Additional custom tracking
ABOUT USLister eBusiness is an end-to-endsolutions provider across the entiree-business lifecycle. We leverage ourdeep industry expertise in emarketing,e-commerce and e-services, to helpbusinesses of various sizes maximize
their potential. Our track record ofdelivering excellent customer service,high quality software and value formoney ensures we are a long-termpartner for many customers.
eBusiness78-080 Calle Amigo, Ste. 200 La Quinta, CA 92253.
Phone 760.773.5772 Fax 760.773.3425 www.listertechnologies.com
•
•
•
•
•
•
•
•
•
•
•