listed investment ompanies weekly report. 15 otoer …
TRANSCRIPT
LISTED INVESTMENT COMPANIES WEEKLY REPORT. 15 OCTOBER 2021
Indicative NTA
Premium/Discount 2
Dividends 4
Performance Data 6
Normalisation Effect 8
Options 10
Charts
NTA Performance 12
Premium/Discount 14
Share Price Performance 15
Hayden Nicholson 613 9235 1757
Bell Potter Securities Limited [email protected]
www.bellpotter.com.au
ABN 25 006 390 771
AFSL no. 243480
Upcoming Dividends/Distributions
Index
Code Ex-Div Pay Amount Frank.
CDM 18-Oct 29-Oct $0.0300 100%
PL8 18-Oct 29-Oct $0.0050 100%
WAA 18-Oct 29-Oct $0.0300 100%
WAM 18-Oct 29-Oct $0.0775 100%
WLE 18-Oct 29-Oct $0.0350 100%
KAT 19-Oct 12-Nov $0.0050 100%
SNC 19-Oct 5-Nov $0.0275 100%
ACQ 11-Nov 29-Nov $0.0400 100%
FGX 19-Nov 26-Nov $0.0300 100%
WGB 19-Nov 26-Nov $0.0500 100%
SNC 30-Nov 20-Dec $0.0100 100%
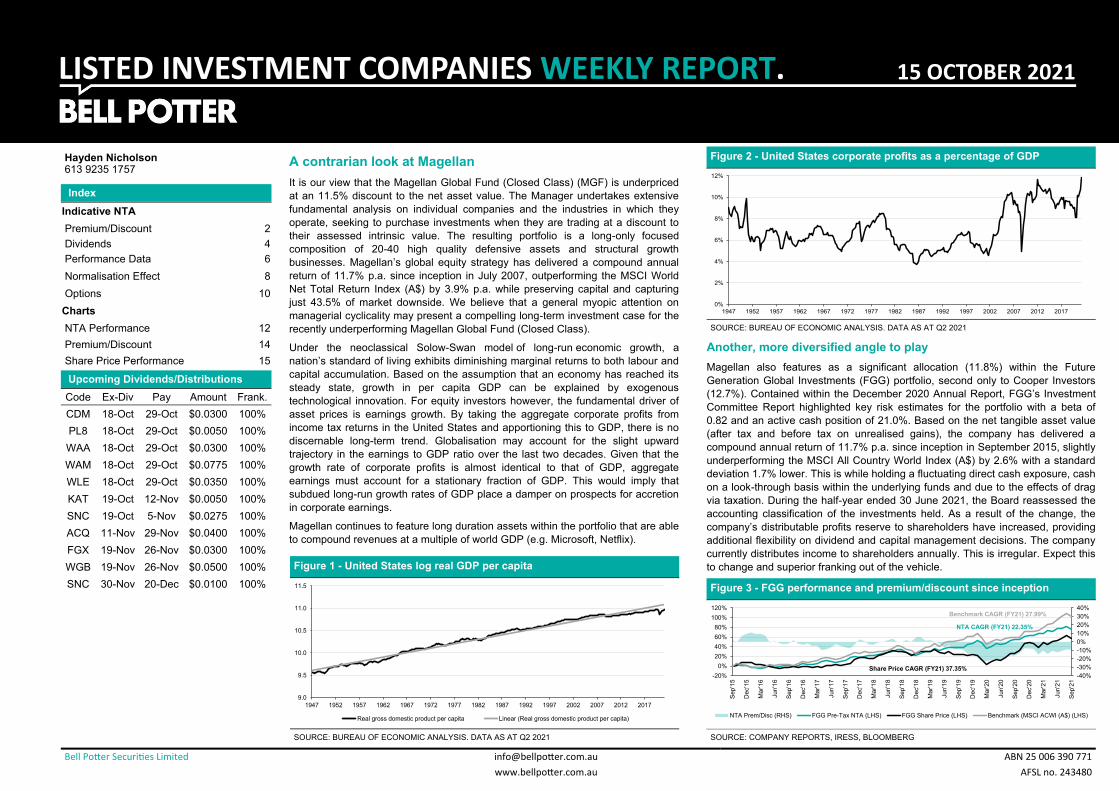
Figure 2 - United States corporate profits as a percentage of GDP
SOURCE: BUREAU OF ECONOMIC ANALYSIS. DATA AS AT Q2 2021
Another, more diversified angle to play
Magellan also features as a significant allocation (11.8%) within the Future
Generation Global Investments (FGG) portfolio, second only to Cooper Investors
(12.7%). Contained within the December 2020 Annual Report, FGG’s Investment
Committee Report highlighted key risk estimates for the portfolio with a beta of
0.82 and an active cash position of 21.0%. Based on the net tangible asset value
(after tax and before tax on unrealised gains), the company has delivered a
compound annual return of 11.7% p.a. since inception in September 2015, slightly
underperforming the MSCI All Country World Index (A$) by 2.6% with a standard
deviation 1.7% lower. This is while holding a fluctuating direct cash exposure, cash
on a look-through basis within the underlying funds and due to the effects of drag
via taxation. During the half-year ended 30 June 2021, the Board reassessed the
accounting classification of the investments held. As a result of the change, the
company’s distributable profits reserve to shareholders have increased, providing
additional flexibility on dividend and capital management decisions. The company
currently distributes income to shareholders annually. This is irregular. Expect this
to change and superior franking out of the vehicle.
A contrarian look at Magellan
It is our view that the Magellan Global Fund (Closed Class) (MGF) is underpriced
at an 11.5% discount to the net asset value. The Manager undertakes extensive
fundamental analysis on individual companies and the industries in which they
operate, seeking to purchase investments when they are trading at a discount to
their assessed intrinsic value. The resulting portfolio is a long-only focused
composition of 20-40 high quality defensive assets and structural growth
businesses. Magellan’s global equity strategy has delivered a compound annual
return of 11.7% p.a. since inception in July 2007, outperforming the MSCI World
Net Total Return Index (A$) by 3.9% p.a. while preserving capital and capturing
just 43.5% of market downside. We believe that a general myopic attention on
managerial cyclicality may present a compelling long-term investment case for the
recently underperforming Magellan Global Fund (Closed Class).
Under the neoclassical Solow-Swan model of long-run economic growth, a
nation’s standard of living exhibits diminishing marginal returns to both labour and
capital accumulation. Based on the assumption that an economy has reached its
steady state, growth in per capita GDP can be explained by exogenous
technological innovation. For equity investors however, the fundamental driver of
asset prices is earnings growth. By taking the aggregate corporate profits from
income tax returns in the United States and apportioning this to GDP, there is no
discernable long-term trend. Globalisation may account for the slight upward
trajectory in the earnings to GDP ratio over the last two decades. Given that the
growth rate of corporate profits is almost identical to that of GDP, aggregate
earnings must account for a stationary fraction of GDP. This would imply that
subdued long-run growth rates of GDP place a damper on prospects for accretion
in corporate earnings.
Magellan continues to feature long duration assets within the portfolio that are able
to compound revenues at a multiple of world GDP (e.g. Microsoft, Netflix).
Figure 1 - United States log real GDP per capita
SOURCE: BUREAU OF ECONOMIC ANALYSIS. DATA AS AT Q2 2021
Figure 3 - FGG performance and premium/discount since inception
SOURCE: COMPANY REPORTS, IRESS, BLOOMBERG
0%
2%
4%
6%
8%
10%
12%
1947 1952 1957 1962 1967 1972 1977 1982 1987 1992 1997 2002 2007 2012 2017
9.0
9.5
10.0
10.5
11.0
11.5
1947 1952 1957 1962 1967 1972 1977 1982 1987 1992 1997 2002 2007 2012 2017
Real gross domestic product per capita Linear (Real gross domestic product per capita)
-40%
-30%
-20%
-10%
0%
10%
20%
30%
40%
-20%
0%
20%
40%
60%
80%
100%
120%
Se
p'1
5
De
c'1
5
Ma
r'1
6
Jun
'16
Se
p'1
6
De
c'1
6
Ma
r'1
7
Jun
'17
Se
p'1
7
De
c'1
7
Mar'18
Jun
'18
Se
p'1
8
De
c'1
8
Ma
r'1
9
Jun
'19
Se
p'1
9
De
c'1
9
Ma
r'2
0
Jun
'20
Se
p'2
0
De
c'2
0
Ma
r'2
1
Jun
'21
Se
p'2
1
NTA Prem/Disc (RHS) FGG Pre-Tax NTA (LHS) FGG Share Price (LHS) Benchmark (MSCI ACWI (A$) (LHS)
Benchmark CAGR (FY21) 27.99%
NTA CAGR (FY21) 22.35%
Share Price CAGR (FY21) 37.35%
Hayden Nicholson
2
LISTED INVESTMENT COMPANIES INDICATIVE NTA.
“The Indicative Pre-Tax NTA has been adjusted for dividends. Dividends are removed from the NTA once the security goes ex-date and until the receipt of the new cum-dividend NTA. #The Indicative NTA is the actual reported monthly pre-tax NTA as we have been unable to calculate the
Indicative NTA within a reasonable level of accuracy. *The Indicative NTA is the actual reported weekly pre-tax NTA as we have been unable to calculate the Indicative NTA within a reasonable level of accuracy. ^The Indicative NTA is the actual reported daily pre-tax NTA as we have been
unable to calculate the Indicative NTA within a reasonable level of accuracy. +Prem/Disc does not adjust for the dilution of unexercised options.
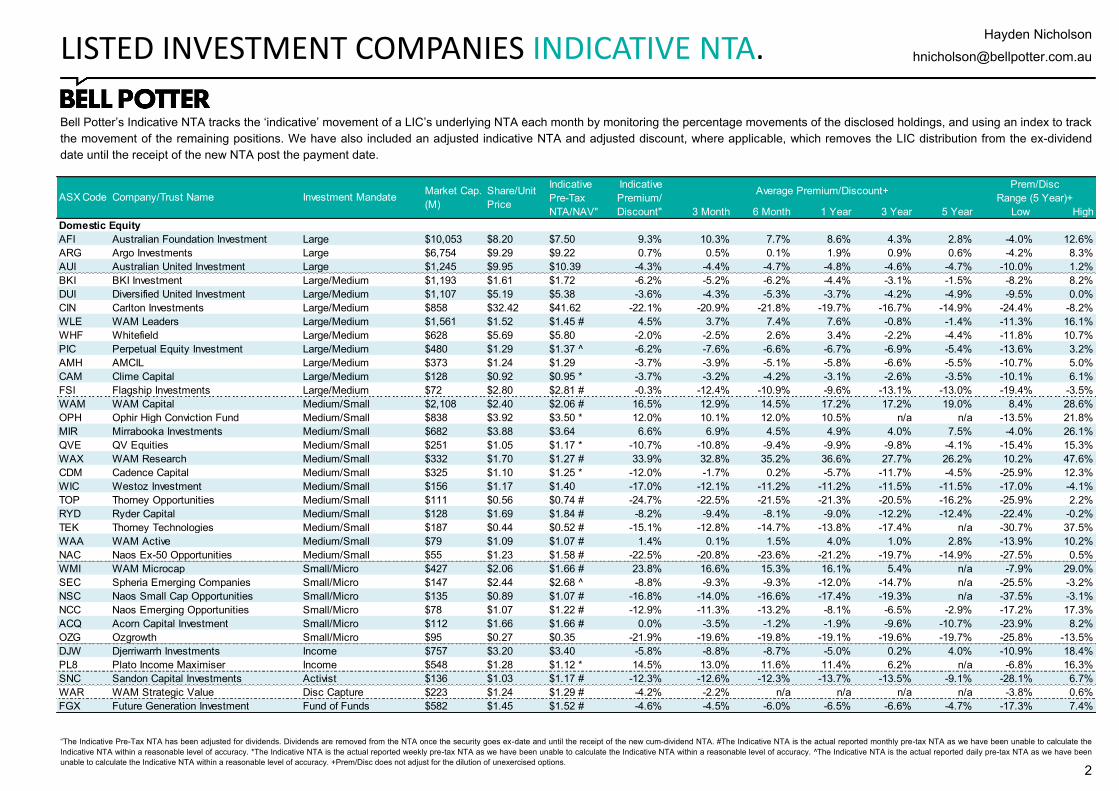
Bell Potter’s Indicative NTA tracks the ‘indicative’ movement of a LIC’s underlying NTA each month by monitoring the percentage movements of the disclosed holdings, and using an index to track
the movement of the remaining positions. We have also included an adjusted indicative NTA and adjusted discount, where applicable, which removes the LIC distribution from the ex-dividend
date until the receipt of the new NTA post the payment date.
3 Month 6 Month 1 Year 3 Year 5 Year Low High
Domestic Equity
AFI Australian Foundation Investment Large $10,053 $8.20 $7.50 9.3% 10.3% 7.7% 8.6% 4.3% 2.8% -4.0% 12.6%
ARG Argo Investments Large $6,754 $9.29 $9.22 0.7% 0.5% 0.1% 1.9% 0.9% 0.6% -4.2% 8.3%
AUI Australian United Investment Large $1,245 $9.95 $10.39 -4.3% -4.4% -4.7% -4.8% -4.6% -4.7% -10.0% 1.2%
BKI BKI Investment Large/Medium $1,193 $1.61 $1.72 -6.2% -5.2% -6.2% -4.4% -3.1% -1.5% -8.2% 8.2%
DUI Diversified United Investment Large/Medium $1,107 $5.19 $5.38 -3.6% -4.3% -5.3% -3.7% -4.2% -4.9% -9.5% 0.0%
CIN Carlton Investments Large/Medium $858 $32.42 $41.62 -22.1% -20.9% -21.8% -19.7% -16.7% -14.9% -24.4% -8.2%
WLE WAM Leaders Large/Medium $1,561 $1.52 $1.45 # 4.5% 3.7% 7.4% 7.6% -0.8% -1.4% -11.3% 16.1%
WHF Whitefield Large/Medium $628 $5.69 $5.80 -2.0% -2.5% 2.6% 3.4% -2.2% -4.4% -11.8% 10.7%
PIC Perpetual Equity Investment Large/Medium $480 $1.29 $1.37 ^ -6.2% -7.6% -6.6% -6.7% -6.9% -5.4% -13.6% 3.2%
AMH AMCIL Large/Medium $373 $1.24 $1.29 -3.7% -3.9% -5.1% -5.8% -6.6% -5.5% -10.7% 5.0%
CAM Clime Capital Large/Medium $128 $0.92 $0.95 * -3.7% -3.2% -4.2% -3.1% -2.6% -3.5% -10.1% 6.1%
FSI Flagship Investments Large/Medium $72 $2.80 $2.81 # -0.3% -12.4% -10.9% -9.6% -13.1% -13.0% -19.4% -3.5%
WAM WAM Capital Medium/Small $2,108 $2.40 $2.06 # 16.5% 12.9% 14.5% 17.2% 17.2% 19.0% 8.4% 28.6%
OPH Ophir High Conviction Fund Medium/Small $838 $3.92 $3.50 * 12.0% 10.1% 12.0% 10.5% n/a n/a -13.5% 21.8%
MIR Mirrabooka Investments Medium/Small $682 $3.88 $3.64 6.6% 6.9% 4.5% 4.9% 4.0% 7.5% -4.0% 26.1%
QVE QV Equities Medium/Small $251 $1.05 $1.17 * -10.7% -10.8% -9.4% -9.9% -9.8% -4.1% -15.4% 15.3%
WAX WAM Research Medium/Small $332 $1.70 $1.27 # 33.9% 32.8% 35.2% 36.6% 27.7% 26.2% 10.2% 47.6%
CDM Cadence Capital Medium/Small $325 $1.10 $1.25 * -12.0% -1.7% 0.2% -5.7% -11.7% -4.5% -25.9% 12.3%
WIC Westoz Investment Medium/Small $156 $1.17 $1.40 -17.0% -12.1% -11.2% -11.2% -11.5% -11.5% -17.0% -4.1%
TOP Thorney Opportunities Medium/Small $111 $0.56 $0.74 # -24.7% -22.5% -21.5% -21.3% -20.5% -16.2% -25.9% 2.2%
RYD Ryder Capital Medium/Small $128 $1.69 $1.84 # -8.2% -9.4% -8.1% -9.0% -12.2% -12.4% -22.4% -0.2%
TEK Thorney Technologies Medium/Small $187 $0.44 $0.52 # -15.1% -12.8% -14.7% -13.8% -17.4% n/a -30.7% 37.5%
WAA WAM Active Medium/Small $79 $1.09 $1.07 # 1.4% 0.1% 1.5% 4.0% 1.0% 2.8% -13.9% 10.2%
NAC Naos Ex-50 Opportunities Medium/Small $55 $1.23 $1.58 # -22.5% -20.8% -23.6% -21.2% -19.7% -14.9% -27.5% 0.5%
WMI WAM Microcap Small/Micro $427 $2.06 $1.66 # 23.8% 16.6% 15.3% 16.1% 5.4% n/a -7.9% 29.0%
SEC Spheria Emerging Companies Small/Micro $147 $2.44 $2.68 ^ -8.8% -9.3% -9.3% -12.0% -14.7% n/a -25.5% -3.2%
NSC Naos Small Cap Opportunities Small/Micro $135 $0.89 $1.07 # -16.8% -14.0% -16.6% -17.4% -19.3% n/a -37.5% -3.1%
NCC Naos Emerging Opportunities Small/Micro $78 $1.07 $1.22 # -12.9% -11.3% -13.2% -8.1% -6.5% -2.9% -17.2% 17.3%
ACQ Acorn Capital Investment Small/Micro $112 $1.66 $1.66 # 0.0% -3.5% -1.2% -1.9% -9.6% -10.7% -23.9% 8.2%
OZG Ozgrowth Small/Micro $95 $0.27 $0.35 -21.9% -19.6% -19.8% -19.1% -19.6% -19.7% -25.8% -13.5%
DJW Djerriwarrh Investments Income $757 $3.20 $3.40 -5.8% -8.8% -8.7% -5.0% 0.2% 4.0% -10.9% 18.4%
PL8 Plato Income Maximiser Income $548 $1.28 $1.12 * 14.5% 13.0% 11.6% 11.4% 6.2% n/a -6.8% 16.3%
SNC Sandon Capital Investments Activist $136 $1.03 $1.17 # -12.3% -12.6% -12.3% -13.7% -13.5% -9.1% -28.1% 6.7%
WAR WAM Strategic Value Disc Capture $223 $1.24 $1.29 # -4.2% -2.2% n/a n/a n/a n/a -3.8% 0.6%
FGX Future Generation Investment Fund of Funds $582 $1.45 $1.52 # -4.6% -4.5% -6.0% -6.5% -6.6% -4.7% -17.3% 7.4%
Indicative
Pre-Tax
NTA/NAV"
Indicative
Premium/
Discount"
Average Premium/Discount+Prem/Disc
Range (5 Year)+ASX Code Company/Trust Name Investment MandateMarket Cap.
(M)
Share/Unit
Price

Hayden Nicholson
3
Bell Potter’s Indicative NTA tracks the ‘indicative’ movement of a LIC’s underlying NTA each month by monitoring the percentage movements of the disclosed holdings, and using an index to track
the movement of the remaining positions. We have also included an adjusted indicative NTA and adjusted discount, where applicable, which removes the LIC distribution from the ex-dividend
date until the receipt of the new NTA post the payment date.
LISTED INVESTMENT COMPANIES INDICATIVE NTA.
“The Indicative Pre-Tax NTA has been adjusted for dividends. Dividends are removed from the NTA once the security goes ex-date and until the receipt of the new cum-dividend NTA. #The Indicative NTA is the actual reported monthly pre-tax NTA as we have been unable to calculate the
Indicative NTA within a reasonable level of accuracy. *The Indicative NTA is the actual reported weekly pre-tax NTA as we have been unable to calculate the Indicative NTA within a reasonable level of accuracy. ^The Indicative NTA is the actual reported daily pre-tax NTA as we have been
unable to calculate the Indicative NTA within a reasonable level of accuracy. +Prem/Disc does not adjust for the dilution of unexercised options.
3 Month 6 Month 1 Year 3 Year 5 Year Low High
International Equity
MGF Magellan Global Fund (Closed Class) Global $2,943 $1.73 $1.95 -11.4% -10.1% -9.9% n/a n/a n/a -12.0% -2.5%
MFF MFF Capital Investments Global $1,692 $2.93 $3.36 * -12.7% -12.9% -12.6% -10.1% -6.9% -9.2% -21.0% 6.3%
WGB WAM Global Global $639 $2.64 $2.71 # -2.6% -2.8% -2.6% -3.0% -9.3% n/a -25.9% 5.9%
PMC Platinum Capital Global $408 $1.39 $1.60 * -13.3% -11.0% -9.8% -9.9% -3.5% 0.6% -15.4% 19.5%
PGF PM Capital Global Opportunities Global $596 $1.53 $1.69 * -9.8% -9.0% -10.5% -13.8% -14.5% -12.8% -22.2% -3.5%
PIA Pengana International Equities Global $355 $1.39 $1.47 * -5.5% -5.1% -7.7% -7.6% -11.4% -8.8% -24.7% 0.6%
TGG Templeton Global Growth Fund Global $323 $1.63 $1.68 * -3.1% -7.4% -7.4% -8.1% -11.1% -10.5% -17.1% -3.2%
WQG WCM Global Growth Global $301 $1.63 $1.79 * -8.8% -10.6% -7.9% -6.2% -12.2% n/a -20.9% 8.9%
ALI Argo Global Listed Infrastructure Global (Infrastructure) $353 $2.30 $2.36 * -2.5% -3.9% -5.2% -4.4% -8.4% -10.5% -20.9% 1.9%
LRT Lowell Resources Fund Global (Jnr Resources) $47 $1.61 $1.89 -14.8% -15.6% -12.1% -15.3% -19.0% n/a -29.4% 4.1%
GVF Global Value Fund Global (Disc Capture) $202 $1.17 $1.23 # -4.8% -4.0% -4.9% -4.5% -3.8% -1.7% -10.0% 5.9%
FGG Future Generation Global Investment Global (Fund of Funds) $607 $1.55 $1.72 # -10.0% -9.6% -11.1% -10.7% -9.9% -7.0% -22.9% 5.9%
HM1 Hearts and Minds Investments Global (High Conviction) $976 $4.32 $4.04 * 6.9% 7.8% 5.8% 8.9% n/a n/a -13.7% 18.8%
PAI Platinum Asia Investments Asia $400 $1.09 $1.23 * -11.2% -8.8% -8.5% -7.1% -5.9% -4.0% -14.3% 10.2%
EAI Ellerston Asian Investments Asia $142 $1.09 $1.19 ^ -8.5% -6.1% -7.3% -7.4% -10.9% -10.3% -18.5% -2.3%
PAF PM Capital Asian Opportunities Asia $63 $1.10 $1.10 * -0.5% -12.3% -14.6% -15.7% -12.8% -9.8% -21.3% 7.5%
Alternatives
LSF L1 Long Short Fund Long/Short (Global) $1,727 $2.84 $3.21 ^ -11.6% -11.9% -12.9% -14.5% -14.7% n/a -29.4% 7.3%
VG1 VGI Partners Global Investments Long/Short (Global) $772 $2.03 $2.38 * -14.7% -10.7% -10.9% -13.7% -8.2% n/a -22.5% 15.2%
APL Antipodes Global Investment Long/Short (Global) $551 $1.14 $1.18 ^ -3.5% -6.9% -8.9% -10.6% -11.3% -7.9% -18.7% 4.0%
RF1 Regal Investment Fund Long/Short (Global) $479 $4.13 $3.85 * 7.3% 19.9% 16.6% 9.1% n/a n/a -27.1% 36.0%
TGF Tribeca Global Natural Resources Long/Short (Global) $154 $2.50 $2.78 * -10.1% -15.0% -12.9% -14.3% -15.0% n/a -48.1% 2.6%
VG8 VGI Partners Asian Investments Long/Short (Asia) $461 $2.07 $2.48 * -16.5% -15.1% -15.1% -16.0% n/a n/a -25.8% -4.5%
AEG Absolute Equity Performance Long/Short $95 $1.03 $1.07 * -3.7% -8.6% -8.3% -5.4% -6.2% -3.8% -14.6% 7.7%
WMA WAM Alternative Assets Private Assets $200 $1.03 $1.16 # -11.1% -11.2% -12.7% -11.5% n/a n/a -15.3% -8.0%
D2O Duxton Water Water Entitlements $181 $1.51 $1.72 # -12.2% -25.5% -25.4% -24.1% n/a n/a -31.9% 1.9%
PE1 Pengana Private Equity Trust Private Equity (Global) $348 $1.45 $1.47 # -1.4% -6.8% -5.9% -3.2% n/a n/a -13.2% 30.9%
BTI Bailador Technology Investments Private Equity (Tech) $239 $1.70 $1.50 # 13.0% -6.0% -8.6% -11.1% -22.0% -20.9% -47.2% 4.0%
Fixed Interest
GCI Gryphon Capital Income Trust ABS & RMBS $491 $2.02 $2.03 ^ -0.3% 0.9% 0.3% -0.9% -1.6% n/a -17.2% 4.5%
QRI Qualitas Real Estate Income Fund CRE $435 $1.63 $1.60 * 1.3% 2.6% 2.4% 0.5% n/a n/a -18.8% 7.5%
MXT MCP Master Income Trust Diversified Loans $1,516 $2.06 $2.00 ^ 2.8% 2.8% 2.2% 1.4% 0.6% n/a -15.5% 5.4%
MOT MCP Income Opportunities Trust Private Credit $437 $2.07 $2.04 ^ 1.5% 1.2% 0.6% -1.1% n/a n/a -26.4% 3.6%
NBI NB Global Corporate Income Trust High Yield (Global) $846 $1.90 $1.99 ^ -4.8% -5.8% -7.5% -7.2% -3.3% n/a -11.9% 4.5%
PCI Perpetual Credit Income Trust Domestic & Global Credit $423 $1.06 $1.11 ^ -5.3% -2.6% -4.4% -4.3% n/a n/a -14.5% 5.7%
KKC KKR Credit Income Fund Global Credit $833 $2.25 $2.52 ^ -10.7% -11.7% -11.1% -11.0% n/a n/a -22.2% 1.1%
ASX Code Company/Trust Name Investment MandateMarket Cap.
(M)
Share/Unit
Price
Indicative
Pre-Tax
NTA/NAV"
Indicative
Premium/
Discount"
Average Premium/Discount+Prem/Disc
Range (5 Year)+
Hayden Nicholson
4
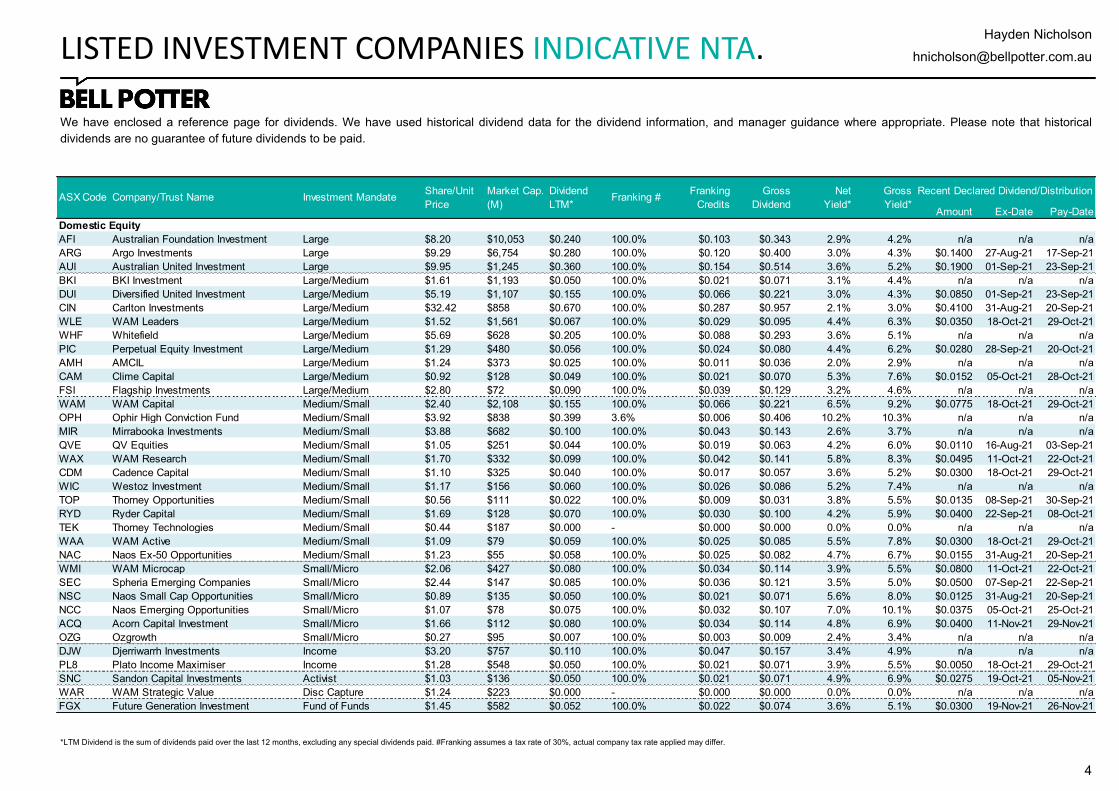
We have enclosed a reference page for dividends. We have used historical dividend data for the dividend information, and manager guidance where appropriate. Please note that historical
dividends are no guarantee of future dividends to be paid.
LISTED INVESTMENT COMPANIES INDICATIVE NTA.
*LTM Dividend is the sum of dividends paid over the last 12 months, excluding any special dividends paid. #Franking assumes a tax rate of 30%, actual company tax rate applied may differ.
Amount Ex-Date Pay-Date
Domestic Equity
AFI Australian Foundation Investment Large $8.20 $10,053 $0.240 100.0% $0.103 $0.343 2.9% 4.2% n/a n/a n/a
ARG Argo Investments Large $9.29 $6,754 $0.280 100.0% $0.120 $0.400 3.0% 4.3% $0.1400 27-Aug-21 17-Sep-21
AUI Australian United Investment Large $9.95 $1,245 $0.360 100.0% $0.154 $0.514 3.6% 5.2% $0.1900 01-Sep-21 23-Sep-21
BKI BKI Investment Large/Medium $1.61 $1,193 $0.050 100.0% $0.021 $0.071 3.1% 4.4% n/a n/a n/a
DUI Diversified United Investment Large/Medium $5.19 $1,107 $0.155 100.0% $0.066 $0.221 3.0% 4.3% $0.0850 01-Sep-21 23-Sep-21
CIN Carlton Investments Large/Medium $32.42 $858 $0.670 100.0% $0.287 $0.957 2.1% 3.0% $0.4100 31-Aug-21 20-Sep-21
WLE WAM Leaders Large/Medium $1.52 $1,561 $0.067 100.0% $0.029 $0.095 4.4% 6.3% $0.0350 18-Oct-21 29-Oct-21
WHF Whitefield Large/Medium $5.69 $628 $0.205 100.0% $0.088 $0.293 3.6% 5.1% n/a n/a n/a
PIC Perpetual Equity Investment Large/Medium $1.29 $480 $0.056 100.0% $0.024 $0.080 4.4% 6.2% $0.0280 28-Sep-21 20-Oct-21
AMH AMCIL Large/Medium $1.24 $373 $0.025 100.0% $0.011 $0.036 2.0% 2.9% n/a n/a n/a
CAM Clime Capital Large/Medium $0.92 $128 $0.049 100.0% $0.021 $0.070 5.3% 7.6% $0.0152 05-Oct-21 28-Oct-21
FSI Flagship Investments Large/Medium $2.80 $72 $0.090 100.0% $0.039 $0.129 3.2% 4.6% n/a n/a n/a
WAM WAM Capital Medium/Small $2.40 $2,108 $0.155 100.0% $0.066 $0.221 6.5% 9.2% $0.0775 18-Oct-21 29-Oct-21
OPH Ophir High Conviction Fund Medium/Small $3.92 $838 $0.399 3.6% $0.006 $0.406 10.2% 10.3% n/a n/a n/a
MIR Mirrabooka Investments Medium/Small $3.88 $682 $0.100 100.0% $0.043 $0.143 2.6% 3.7% n/a n/a n/a
QVE QV Equities Medium/Small $1.05 $251 $0.044 100.0% $0.019 $0.063 4.2% 6.0% $0.0110 16-Aug-21 03-Sep-21
WAX WAM Research Medium/Small $1.70 $332 $0.099 100.0% $0.042 $0.141 5.8% 8.3% $0.0495 11-Oct-21 22-Oct-21
CDM Cadence Capital Medium/Small $1.10 $325 $0.040 100.0% $0.017 $0.057 3.6% 5.2% $0.0300 18-Oct-21 29-Oct-21
WIC Westoz Investment Medium/Small $1.17 $156 $0.060 100.0% $0.026 $0.086 5.2% 7.4% n/a n/a n/a
TOP Thorney Opportunities Medium/Small $0.56 $111 $0.022 100.0% $0.009 $0.031 3.8% 5.5% $0.0135 08-Sep-21 30-Sep-21
RYD Ryder Capital Medium/Small $1.69 $128 $0.070 100.0% $0.030 $0.100 4.2% 5.9% $0.0400 22-Sep-21 08-Oct-21
TEK Thorney Technologies Medium/Small $0.44 $187 $0.000 - $0.000 $0.000 0.0% 0.0% n/a n/a n/a
WAA WAM Active Medium/Small $1.09 $79 $0.059 100.0% $0.025 $0.085 5.5% 7.8% $0.0300 18-Oct-21 29-Oct-21
NAC Naos Ex-50 Opportunities Medium/Small $1.23 $55 $0.058 100.0% $0.025 $0.082 4.7% 6.7% $0.0155 31-Aug-21 20-Sep-21
WMI WAM Microcap Small/Micro $2.06 $427 $0.080 100.0% $0.034 $0.114 3.9% 5.5% $0.0800 11-Oct-21 22-Oct-21
SEC Spheria Emerging Companies Small/Micro $2.44 $147 $0.085 100.0% $0.036 $0.121 3.5% 5.0% $0.0500 07-Sep-21 22-Sep-21
NSC Naos Small Cap Opportunities Small/Micro $0.89 $135 $0.050 100.0% $0.021 $0.071 5.6% 8.0% $0.0125 31-Aug-21 20-Sep-21
NCC Naos Emerging Opportunities Small/Micro $1.07 $78 $0.075 100.0% $0.032 $0.107 7.0% 10.1% $0.0375 05-Oct-21 25-Oct-21
ACQ Acorn Capital Investment Small/Micro $1.66 $112 $0.080 100.0% $0.034 $0.114 4.8% 6.9% $0.0400 11-Nov-21 29-Nov-21
OZG Ozgrowth Small/Micro $0.27 $95 $0.007 100.0% $0.003 $0.009 2.4% 3.4% n/a n/a n/a
DJW Djerriwarrh Investments Income $3.20 $757 $0.110 100.0% $0.047 $0.157 3.4% 4.9% n/a n/a n/a
PL8 Plato Income Maximiser Income $1.28 $548 $0.050 100.0% $0.021 $0.071 3.9% 5.5% $0.0050 18-Oct-21 29-Oct-21
SNC Sandon Capital Investments Activist $1.03 $136 $0.050 100.0% $0.021 $0.071 4.9% 6.9% $0.0275 19-Oct-21 05-Nov-21
WAR WAM Strategic Value Disc Capture $1.24 $223 $0.000 - $0.000 $0.000 0.0% 0.0% n/a n/a n/a
FGX Future Generation Investment Fund of Funds $1.45 $582 $0.052 100.0% $0.022 $0.074 3.6% 5.1% $0.0300 19-Nov-21 26-Nov-21
ASX CodeShare/Unit
Price
Market Cap.
(M)
Dividend
LTM*Investment MandateCompany/Trust Name Franking #
Franking
Credits
Gross
Dividend
Net
Yield*
Gross
Yield*
Recent Declared Dividend/Distribution

Hayden Nicholson
5
We have enclosed a reference page for dividends. We have used historical dividend data for the dividend information, and manager guidance where appropriate. Please note that historical
dividends are no guarantee of future dividends to be paid.
LISTED INVESTMENT COMPANIES INDICATIVE NTA.
*LTM Dividend is the sum of dividends paid over the last 12 months, excluding any special dividends paid. #Franking assumes a tax rate of 30%, actual company tax rate applied may differ.
Amount Ex-Date Pay-Date
International Equity
MGF Magellan Global Fund (Closed Class) Global $1.73 $2,943 $0.073 0.0% $0.000 $0.073 4.2% 4.2% n/a n/a n/a
MFF MFF Capital Investments Global $2.93 $1,692 $0.065 100.0% $0.028 $0.093 2.2% 3.2% $0.0350 08-Oct-21 05-Nov-21
WGB WAM Global Global $2.64 $639 $0.088 100.0% $0.038 $0.126 3.4% 4.8% $0.0500 19-Nov-21 26-Nov-21
PMC Platinum Capital Global $1.39 $408 $0.070 100.0% $0.030 $0.100 5.0% 7.2% $0.0400 26-Aug-21 16-Sep-21
PGF PM Capital Global Opportunities Global $1.53 $596 $0.100 100.0% $0.043 $0.143 6.6% 9.4% $0.0500 15-Sep-21 14-Oct-21
PIA Pengana International Equities Global $1.39 $355 $0.051 100.0% $0.022 $0.073 3.7% 5.2% $0.0135 07-Sep-21 22-Sep-21
TGG Templeton Global Growth Fund Global $1.63 $323 $0.045 100.0% $0.019 $0.064 2.8% 3.9% n/a n/a n/a
WQG WCM Global Growth Global $1.63 $301 $0.058 100.0% $0.025 $0.082 3.5% 5.0% $0.0250 16-Sep-21 30-Sep-21
ALI Argo Global Listed Infrastructure Global (Infrastructure) $2.30 $353 $0.080 100.0% $0.034 $0.114 3.5% 5.0% $0.0450 10-Sep-21 01-Oct-21
LRT Lowell Resources Fund Global (Jnr Resources) $1.61 $47 $0.150 0.2% $0.000 $0.150 9.3% 9.3% n/a n/a n/a
GVF Global Value Fund Global (Disc Capture) $1.17 $202 $0.063 100.0% $0.027 $0.090 5.4% 7.7% $0.0330 30-Sep-21 08-Nov-21
FGG Future Generation Global Investment Global (Fund of Funds) $1.55 $607 $0.030 100.0% $0.013 $0.043 1.9% 2.8% $0.0300 11-Oct-21 22-Oct-21
HM1 Hearts and Minds Investments Global (High Conviction) $4.32 $976 $0.120 100.0% $0.051 $0.171 2.8% 4.0% n/a n/a n/a
PAI Platinum Asia Investments Asia $1.09 $400 $0.100 100.0% $0.043 $0.143 9.2% 13.1% $0.0600 26-Aug-21 16-Sep-21
EAI Ellerston Asian Investments Asia $1.09 $142 $0.055 100.0% $0.024 $0.079 5.1% 7.2% $0.0300 06-Sep-21 05-Oct-21
PAF PM Capital Asian Opportunities Asia $1.10 $63 $0.040 100.0% $0.017 $0.057 3.7% 5.2% $0.0250 15-Sep-21 14-Oct-21
Alternatives
LSF L1 Long Short Fund Long/Short (Global) $2.84 $1,727 $0.045 100.0% $0.019 $0.064 1.6% 2.3% $0.0300 13-Sep-21 01-Oct-21
VG1 VGI Partners Global Investments Long/Short (Global) $2.03 $772 $0.070 100.0% $0.030 $0.100 3.4% 4.9% $0.0550 26-Aug-21 29-Sep-21
APL Antipodes Global Investment Long/Short (Global) $1.14 $551 $0.060 83.3% $0.021 $0.081 5.3% 7.2% $0.0400 08-Sep-21 30-Sep-21
RF1 Regal Investment Fund Long/Short (Global) $4.13 $479 $1.021 0.0% $0.000 $1.021 24.7% 24.7% n/a n/a n/a
TGF Tribeca Global Natural Resources Long/Short (Global) $2.50 $154 $0.000 - $0.000 $0.000 0.0% 0.0% n/a n/a n/a
VG8 VGI Partners Asian Investments Long/Short (Asia) $2.07 $461 $0.055 100.0% $0.024 $0.079 2.7% 3.8% $0.0550 30-Aug-21 29-Sep-21
AEG Absolute Equity Performance Long/Short $1.03 $95 $0.052 100.0% $0.022 $0.074 5.0% 7.2% $0.0260 14-Sep-21 15-Oct-21
WMA WAM Alternative Assets Private Assets $1.03 $200 $0.030 100.0% $0.013 $0.043 2.9% 4.2% $0.0200 11-Oct-21 22-Oct-21
D2O Duxton Water Water Entitlements $1.51 $181 $0.061 100.0% $0.026 $0.087 4.0% 5.8% n/a n/a n/a
PE1 Pengana Private Equity Trust Private Equity (Global) $1.45 $348 $0.048 0.0% $0.000 $0.048 3.3% 3.3% n/a n/a n/a
BTI Bailador Technology Investments Private Equity (Tech) $1.70 $239 $0.000 - $0.000 $0.000 0.0% 0.0% $0.0140 23-Aug-21 08-Sep-21
Fixed Interest
GCI Gryphon Capital Income Trust ABS & RMBS $2.02 $491 $0.092 0.0% $0.000 $0.092 4.6% 4.6% $0.0074 29-Sep-21 11-Oct-21
QRI Qualitas Real Estate Income Fund CRE $1.63 $435 $0.096 0.0% $0.000 $0.096 5.9% 5.9% $0.0075 29-Sep-21 15-Oct-21
MXT MCP Master Income Trust Diversified Loans $2.06 $1,516 $0.086 0.0% $0.000 $0.086 4.2% 4.2% $0.0064 30-Sep-21 08-Oct-21
MOT MCP Income Opportunities Trust Private Credit $2.07 $437 $0.134 15.2% $0.009 $0.142 6.5% 6.9% $0.0093 30-Sep-21 08-Oct-21
NBI NB Global Corporate Income Trust High Yield (Global) $1.90 $846 $0.100 0.0% $0.000 $0.100 5.3% 5.3% $0.0080 01-Oct-21 11-Oct-21
PCI Perpetual Credit Income Trust Domestic & Global Credit $1.06 $423 $0.036 0.0% $0.000 $0.036 3.5% 3.5% $0.0031 29-Sep-21 08-Oct-21
KKC KKR Credit Income Fund Global Credit $2.25 $833 $0.120 0.0% $0.000 $0.120 5.3% 5.3% $0.0100 29-Sep-21 14-Oct-21
Dividend
LTM*ASX Code Company/Trust Name Investment Mandate
Share/Unit
Price
Market Cap.
(M)Franking #
Franking
Credits
Gross
Dividend
Net
Yield*
Gross
Yield*
Recent Declared Dividend/Distribution

Hayden Nicholson
6
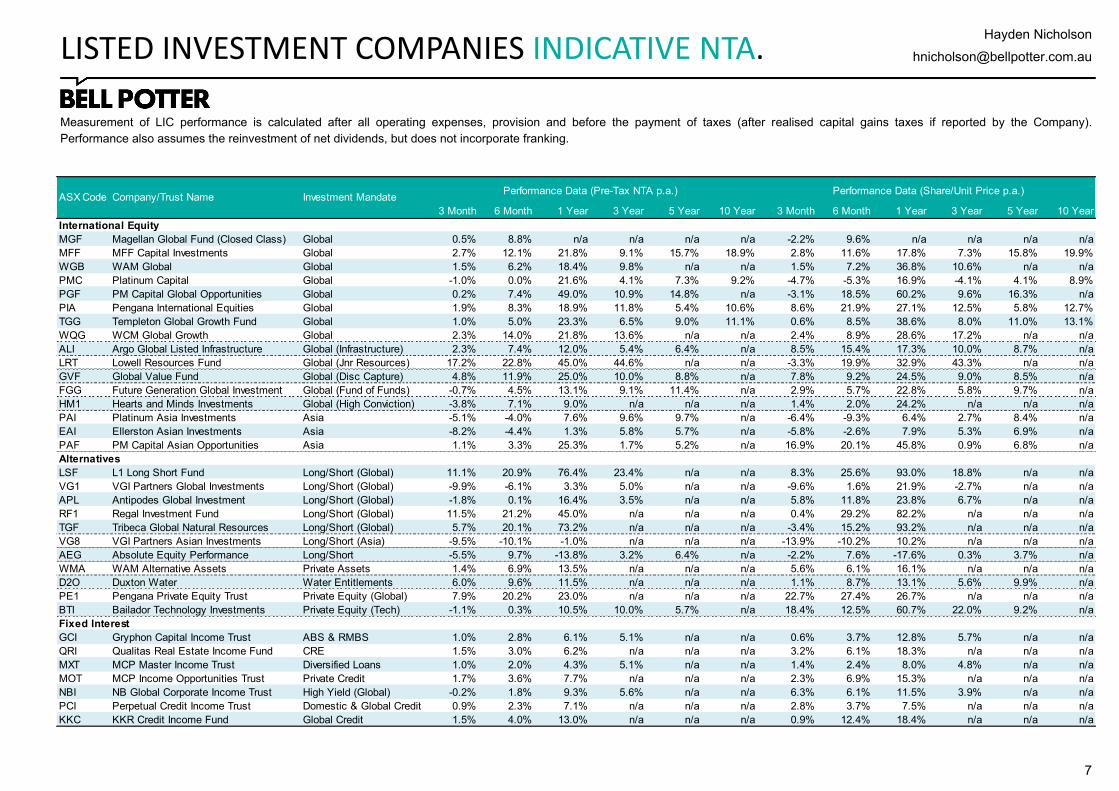
Measurement of LIC performance is calculated after all operating expenses, provision and before the payment of taxes (after realised capital gains taxes if reported by the Company).
Performance also assumes the reinvestment of net dividends, but does not incorporate franking.
LISTED INVESTMENT COMPANIES INDICATIVE NTA.
3 Month 6 Month 1 Year 3 Year 5 Year 10 Year 3 Month 6 Month 1 Year 3 Year 5 Year 10 Year
Domestic Equity
AFI Australian Foundation Investment Large 3.0% 12.9% 32.1% 11.2% 10.5% 10.6% 9.3% 15.2% 37.4% 15.0% 12.5% 12.5%
ARG Argo Investments Large 4.0% 11.4% 33.3% 8.6% 8.9% 10.0% 1.6% 6.7% 24.5% 7.9% 8.4% 10.5%
AUI Australian United Investment Large 1.5% 9.8% 32.2% 8.2% 9.9% 10.0% -1.7% 12.5% 27.6% 9.2% 10.8% 11.0%
BKI BKI Investment Large/Medium 1.7% 9.4% 25.0% 6.3% 6.6% 7.8% 1.8% 13.0% 23.4% 6.8% 5.6% 9.1%
DUI Diversified United Investment Large/Medium 2.9% 11.7% 28.7% 10.0% 12.2% 12.1% -0.1% 10.3% 25.6% 10.9% 13.1% 13.4%
CIN Carlton Investments Large/Medium 7.6% 16.8% 44.3% 5.3% 5.3% 11.3% 8.0% 15.8% 40.7% 2.0% 3.8% 12.1%
WLE WAM Leaders Large/Medium 4.9% 13.1% 33.9% 12.3% 9.7% n/a -3.3% 1.5% 31.5% 14.1% 10.4% n/a
WHF Whitefield Large/Medium 3.6% 12.6% 31.4% 8.7% 8.1% 12.0% -8.5% 8.3% 28.0% 10.8% 10.0% 13.4%
PIC Perpetual Equity Investment Large/Medium 3.2% 10.9% 32.8% 13.0% 11.6% n/a 0.2% 6.1% 36.6% 10.4% 11.9% n/a
AMH AMCIL Large/Medium 5.7% 16.8% 29.1% 14.4% 11.3% 11.8% 7.7% 21.6% 35.4% 16.2% 9.7% 12.6%
CAM Clime Capital Large/Medium -1.8% 9.9% 24.0% 5.1% 7.1% 5.1% 1.9% 11.4% 26.8% 6.3% 10.1% 7.6%
FSI Flagship Investments Large/Medium 3.7% 16.7% 24.9% 15.5% 13.2% 12.7% 4.9% 7.1% 28.2% 15.8% 14.5% 12.2%
WAM WAM Capital Medium/Small 7.4% 11.2% 26.8% 8.8% 8.2% 10.5% 8.2% 11.0% 13.8% 5.8% 7.3% 12.6%
OPH Ophir High Conviction Fund Medium/Small 7.8% 22.6% 34.7% n/a n/a n/a -0.2% 26.7% 45.0% n/a n/a n/a
MIR Mirrabooka Investments Medium/Small 8.1% 22.1% 38.9% 18.9% 14.6% 15.5% 11.7% 19.4% 49.3% 19.4% 11.0% 16.5%
QVE QV Equities Medium/Small 7.5% 10.6% 31.4% 3.4% 4.0% n/a 5.7% 13.1% 33.6% 1.7% 1.1% n/a
WAX WAM Research Medium/Small 8.3% 13.6% 29.0% 8.6% 8.2% 11.9% 7.3% 2.1% 24.1% 8.5% 9.0% 17.4%
CDM Cadence Capital Medium/Small 14.3% 23.1% 47.6% 7.4% 7.8% 6.9% 5.1% 8.5% 58.7% 2.4% 4.0% 6.7%
WIC Westoz Investment Medium/Small 2.3% 6.3% 19.3% 5.2% 8.8% 6.1% -1.4% 0.4% 22.2% 4.8% 10.4% 9.8%
TOP Thorney Opportunities Medium/Small 10.1% 13.1% 19.6% -1.1% 2.3% n/a 4.3% 7.3% 21.5% -5.1% -0.8% 6.1%
RYD Ryder Capital Medium/Small -3.1% 2.0% 9.5% 9.9% 13.0% n/a -0.6% 1.1% 15.5% 15.8% 13.9% n/a
TEK Thorney Technologies Medium/Small 6.1% 17.2% 37.1% 23.3% n/a n/a 1.2% 19.2% 30.6% 22.1% n/a n/a
WAA WAM Active Medium/Small 2.4% 4.0% 14.3% 5.7% 6.1% 6.4% -2.3% 2.8% 10.4% 4.0% 3.9% 7.1%
NAC Naos Ex-50 Opportunities Medium/Small -0.2% 16.8% 33.8% 17.0% 10.0% n/a 1.3% 11.6% 33.7% 11.5% 8.1% n/a
WMI WAM Microcap Small/Micro 5.7% 10.8% 27.0% 14.0% n/a n/a 16.2% 4.1% 42.8% 19.1% n/a n/a
SEC Spheria Emerging Companies Small/Micro 4.5% 12.8% 43.2% 11.6% n/a n/a 5.8% 18.7% 63.4% 14.9% n/a n/a
NSC Naos Small Cap Opportunities Small/Micro -2.5% 10.6% 50.2% 10.3% n/a n/a -9.0% 20.0% 66.0% 10.3% n/a n/a
NCC Naos Emerging Opportunities Small/Micro 0.8% 17.8% 34.9% 6.2% 4.0% n/a 9.2% 1.8% 22.7% 2.6% 3.2% n/a
ACQ Acorn Capital Investment Small/Micro 6.0% 11.3% 18.9% 14.0% 11.6% n/a 12.5% 3.1% 42.4% 17.9% 14.9% n/a
OZG Ozgrowth Small/Micro 12.3% 24.9% 47.3% 16.3% 12.9% 8.5% 9.8% 22.6% 48.3% 17.7% 12.9% 11.9%
DJW Djerriwarrh Investments Income 4.4% 13.3% 32.6% 6.5% 7.3% 7.9% 4.5% 15.4% 34.9% 1.9% 2.6% 5.2%
PL8 Plato Income Maximiser Income -0.2% 7.5% 24.4% 7.7% n/a n/a 2.2% 11.1% 26.3% 14.9% n/a n/a
SNC Sandon Capital Investments Activist 5.4% 17.0% 45.9% 11.1% 10.4% n/a 2.4% 16.2% 56.8% 10.2% 10.8% n/a
WAR WAM Strategic Value Disc Capture 1.0% n/a n/a n/a n/a n/a -2.4% n/a n/a n/a n/a n/a
FGX Future Generation Investment Fund of Funds 4.0% 11.9% 28.2% 10.4% 9.5% n/a 5.8% 15.1% 35.5% 7.5% 9.2% n/a
Performance Data (Share/Unit Price p.a.)ASX Code Company/Trust Name Investment Mandate
Performance Data (Pre-Tax NTA p.a.)
Hayden Nicholson
7
LISTED INVESTMENT COMPANIES INDICATIVE NTA.
Measurement of LIC performance is calculated after all operating expenses, provision and before the payment of taxes (after realised capital gains taxes if reported by the Company).
Performance also assumes the reinvestment of net dividends, but does not incorporate franking.
3 Month 6 Month 1 Year 3 Year 5 Year 10 Year 3 Month 6 Month 1 Year 3 Year 5 Year 10 Year
International Equity
MGF Magellan Global Fund (Closed Class) Global 0.5% 8.8% n/a n/a n/a n/a -2.2% 9.6% n/a n/a n/a n/a
MFF MFF Capital Investments Global 2.7% 12.1% 21.8% 9.1% 15.7% 18.9% 2.8% 11.6% 17.8% 7.3% 15.8% 19.9%
WGB WAM Global Global 1.5% 6.2% 18.4% 9.8% n/a n/a 1.5% 7.2% 36.8% 10.6% n/a n/a
PMC Platinum Capital Global -1.0% 0.0% 21.6% 4.1% 7.3% 9.2% -4.7% -5.3% 16.9% -4.1% 4.1% 8.9%
PGF PM Capital Global Opportunities Global 0.2% 7.4% 49.0% 10.9% 14.8% n/a -3.1% 18.5% 60.2% 9.6% 16.3% n/a
PIA Pengana International Equities Global 1.9% 8.3% 18.9% 11.8% 5.4% 10.6% 8.6% 21.9% 27.1% 12.5% 5.8% 12.7%
TGG Templeton Global Growth Fund Global 1.0% 5.0% 23.3% 6.5% 9.0% 11.1% 0.6% 8.5% 38.6% 8.0% 11.0% 13.1%
WQG WCM Global Growth Global 2.3% 14.0% 21.8% 13.6% n/a n/a 2.4% 8.9% 28.6% 17.2% n/a n/a
ALI Argo Global Listed Infrastructure Global (Infrastructure) 2.3% 7.4% 12.0% 5.4% 6.4% n/a 8.5% 15.4% 17.3% 10.0% 8.7% n/a
LRT Lowell Resources Fund Global (Jnr Resources) 17.2% 22.8% 45.0% 44.6% n/a n/a -3.3% 19.9% 32.9% 43.3% n/a n/a
GVF Global Value Fund Global (Disc Capture) 4.8% 11.9% 25.0% 10.0% 8.8% n/a 7.8% 9.2% 24.5% 9.0% 8.5% n/a
FGG Future Generation Global Investment Global (Fund of Funds) -0.7% 4.5% 13.1% 9.1% 11.4% n/a 2.9% 5.7% 22.8% 5.8% 9.7% n/a
HM1 Hearts and Minds Investments Global (High Conviction) -3.8% 7.1% 9.0% n/a n/a n/a 1.4% 2.0% 24.2% n/a n/a n/a
PAI Platinum Asia Investments Asia -5.1% -4.0% 7.6% 9.6% 9.7% n/a -6.4% -9.3% 6.4% 2.7% 8.4% n/a
EAI Ellerston Asian Investments Asia -8.2% -4.4% 1.3% 5.8% 5.7% n/a -5.8% -2.6% 7.9% 5.3% 6.9% n/a
PAF PM Capital Asian Opportunities Asia 1.1% 3.3% 25.3% 1.7% 5.2% n/a 16.9% 20.1% 45.8% 0.9% 6.8% n/a
Alternatives
LSF L1 Long Short Fund Long/Short (Global) 11.1% 20.9% 76.4% 23.4% n/a n/a 8.3% 25.6% 93.0% 18.8% n/a n/a
VG1 VGI Partners Global Investments Long/Short (Global) -9.9% -6.1% 3.3% 5.0% n/a n/a -9.6% 1.6% 21.9% -2.7% n/a n/a
APL Antipodes Global Investment Long/Short (Global) -1.8% 0.1% 16.4% 3.5% n/a n/a 5.8% 11.8% 23.8% 6.7% n/a n/a
RF1 Regal Investment Fund Long/Short (Global) 11.5% 21.2% 45.0% n/a n/a n/a 0.4% 29.2% 82.2% n/a n/a n/a
TGF Tribeca Global Natural Resources Long/Short (Global) 5.7% 20.1% 73.2% n/a n/a n/a -3.4% 15.2% 93.2% n/a n/a n/a
VG8 VGI Partners Asian Investments Long/Short (Asia) -9.5% -10.1% -1.0% n/a n/a n/a -13.9% -10.2% 10.2% n/a n/a n/a
AEG Absolute Equity Performance Long/Short -5.5% 9.7% -13.8% 3.2% 6.4% n/a -2.2% 7.6% -17.6% 0.3% 3.7% n/a
WMA WAM Alternative Assets Private Assets 1.4% 6.9% 13.5% n/a n/a n/a 5.6% 6.1% 16.1% n/a n/a n/a
D2O Duxton Water Water Entitlements 6.0% 9.6% 11.5% n/a n/a n/a 1.1% 8.7% 13.1% 5.6% 9.9% n/a
PE1 Pengana Private Equity Trust Private Equity (Global) 7.9% 20.2% 23.0% n/a n/a n/a 22.7% 27.4% 26.7% n/a n/a n/a
BTI Bailador Technology Investments Private Equity (Tech) -1.1% 0.3% 10.5% 10.0% 5.7% n/a 18.4% 12.5% 60.7% 22.0% 9.2% n/a
Fixed Interest
GCI Gryphon Capital Income Trust ABS & RMBS 1.0% 2.8% 6.1% 5.1% n/a n/a 0.6% 3.7% 12.8% 5.7% n/a n/a
QRI Qualitas Real Estate Income Fund CRE 1.5% 3.0% 6.2% n/a n/a n/a 3.2% 6.1% 18.3% n/a n/a n/a
MXT MCP Master Income Trust Diversified Loans 1.0% 2.0% 4.3% 5.1% n/a n/a 1.4% 2.4% 8.0% 4.8% n/a n/a
MOT MCP Income Opportunities Trust Private Credit 1.7% 3.6% 7.7% n/a n/a n/a 2.3% 6.9% 15.3% n/a n/a n/a
NBI NB Global Corporate Income Trust High Yield (Global) -0.2% 1.8% 9.3% 5.6% n/a n/a 6.3% 6.1% 11.5% 3.9% n/a n/a
PCI Perpetual Credit Income Trust Domestic & Global Credit 0.9% 2.3% 7.1% n/a n/a n/a 2.8% 3.7% 7.5% n/a n/a n/a
KKC KKR Credit Income Fund Global Credit 1.5% 4.0% 13.0% n/a n/a n/a 0.9% 12.4% 18.4% n/a n/a n/a
Performance Data (Share/Unit Price p.a.)ASX Code Company/Trust Name Investment Mandate
Performance Data (Pre-Tax NTA p.a.)
Hayden Nicholson
8
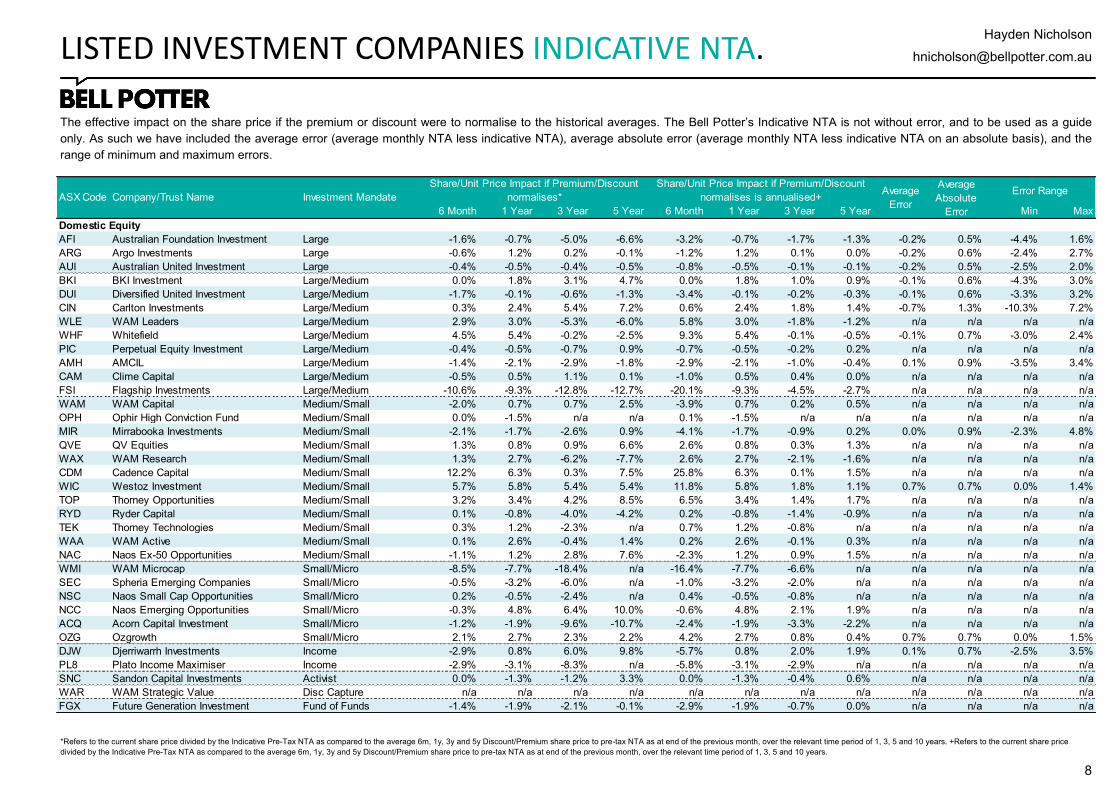
The effective impact on the share price if the premium or discount were to normalise to the historical averages. The Bell Potter’s Indicative NTA is not without error, and to be used as a guide
only. As such we have included the average error (average monthly NTA less indicative NTA), average absolute error (average monthly NTA less indicative NTA on an absolute basis), and the
range of minimum and maximum errors.
LISTED INVESTMENT COMPANIES INDICATIVE NTA.
*Refers to the current share price divided by the Indicative Pre-Tax NTA as compared to the average 6m, 1y, 3y and 5y Discount/Premium share price to pre-tax NTA as at end of the previous month, over the relevant time period of 1, 3, 5 and 10 years. +Refers to the current share price
divided by the Indicative Pre-Tax NTA as compared to the average 6m, 1y, 3y and 5y Discount/Premium share price to pre-tax NTA as at end of the previous month, over the relevant time period of 1, 3, 5 and 10 years.
6 Month 1 Year 3 Year 5 Year 6 Month 1 Year 3 Year 5 Year Min Max
Domestic Equity
AFI Australian Foundation Investment Large -1.6% -0.7% -5.0% -6.6% -3.2% -0.7% -1.7% -1.3% -0.2% 0.5% -4.4% 1.6%
ARG Argo Investments Large -0.6% 1.2% 0.2% -0.1% -1.2% 1.2% 0.1% 0.0% -0.2% 0.6% -2.4% 2.7%
AUI Australian United Investment Large -0.4% -0.5% -0.4% -0.5% -0.8% -0.5% -0.1% -0.1% -0.2% 0.5% -2.5% 2.0%
BKI BKI Investment Large/Medium 0.0% 1.8% 3.1% 4.7% 0.0% 1.8% 1.0% 0.9% -0.1% 0.6% -4.3% 3.0%
DUI Diversified United Investment Large/Medium -1.7% -0.1% -0.6% -1.3% -3.4% -0.1% -0.2% -0.3% -0.1% 0.6% -3.3% 3.2%
CIN Carlton Investments Large/Medium 0.3% 2.4% 5.4% 7.2% 0.6% 2.4% 1.8% 1.4% -0.7% 1.3% -10.3% 7.2%
WLE WAM Leaders Large/Medium 2.9% 3.0% -5.3% -6.0% 5.8% 3.0% -1.8% -1.2% n/a n/a n/a n/a
WHF Whitefield Large/Medium 4.5% 5.4% -0.2% -2.5% 9.3% 5.4% -0.1% -0.5% -0.1% 0.7% -3.0% 2.4%
PIC Perpetual Equity Investment Large/Medium -0.4% -0.5% -0.7% 0.9% -0.7% -0.5% -0.2% 0.2% n/a n/a n/a n/a
AMH AMCIL Large/Medium -1.4% -2.1% -2.9% -1.8% -2.9% -2.1% -1.0% -0.4% 0.1% 0.9% -3.5% 3.4%
CAM Clime Capital Large/Medium -0.5% 0.5% 1.1% 0.1% -1.0% 0.5% 0.4% 0.0% n/a n/a n/a n/a
FSI Flagship Investments Large/Medium -10.6% -9.3% -12.8% -12.7% -20.1% -9.3% -4.5% -2.7% n/a n/a n/a n/a
WAM WAM Capital Medium/Small -2.0% 0.7% 0.7% 2.5% -3.9% 0.7% 0.2% 0.5% n/a n/a n/a n/a
OPH Ophir High Conviction Fund Medium/Small 0.0% -1.5% n/a n/a 0.1% -1.5% n/a n/a n/a n/a n/a n/a
MIR Mirrabooka Investments Medium/Small -2.1% -1.7% -2.6% 0.9% -4.1% -1.7% -0.9% 0.2% 0.0% 0.9% -2.3% 4.8%
QVE QV Equities Medium/Small 1.3% 0.8% 0.9% 6.6% 2.6% 0.8% 0.3% 1.3% n/a n/a n/a n/a
WAX WAM Research Medium/Small 1.3% 2.7% -6.2% -7.7% 2.6% 2.7% -2.1% -1.6% n/a n/a n/a n/a
CDM Cadence Capital Medium/Small 12.2% 6.3% 0.3% 7.5% 25.8% 6.3% 0.1% 1.5% n/a n/a n/a n/a
WIC Westoz Investment Medium/Small 5.7% 5.8% 5.4% 5.4% 11.8% 5.8% 1.8% 1.1% 0.7% 0.7% 0.0% 1.4%
TOP Thorney Opportunities Medium/Small 3.2% 3.4% 4.2% 8.5% 6.5% 3.4% 1.4% 1.7% n/a n/a n/a n/a
RYD Ryder Capital Medium/Small 0.1% -0.8% -4.0% -4.2% 0.2% -0.8% -1.4% -0.9% n/a n/a n/a n/a
TEK Thorney Technologies Medium/Small 0.3% 1.2% -2.3% n/a 0.7% 1.2% -0.8% n/a n/a n/a n/a n/a
WAA WAM Active Medium/Small 0.1% 2.6% -0.4% 1.4% 0.2% 2.6% -0.1% 0.3% n/a n/a n/a n/a
NAC Naos Ex-50 Opportunities Medium/Small -1.1% 1.2% 2.8% 7.6% -2.3% 1.2% 0.9% 1.5% n/a n/a n/a n/a
WMI WAM Microcap Small/Micro -8.5% -7.7% -18.4% n/a -16.4% -7.7% -6.6% n/a n/a n/a n/a n/a
SEC Spheria Emerging Companies Small/Micro -0.5% -3.2% -6.0% n/a -1.0% -3.2% -2.0% n/a n/a n/a n/a n/a
NSC Naos Small Cap Opportunities Small/Micro 0.2% -0.5% -2.4% n/a 0.4% -0.5% -0.8% n/a n/a n/a n/a n/a
NCC Naos Emerging Opportunities Small/Micro -0.3% 4.8% 6.4% 10.0% -0.6% 4.8% 2.1% 1.9% n/a n/a n/a n/a
ACQ Acorn Capital Investment Small/Micro -1.2% -1.9% -9.6% -10.7% -2.4% -1.9% -3.3% -2.2% n/a n/a n/a n/a
OZG Ozgrowth Small/Micro 2.1% 2.7% 2.3% 2.2% 4.2% 2.7% 0.8% 0.4% 0.7% 0.7% 0.0% 1.5%
DJW Djerriwarrh Investments Income -2.9% 0.8% 6.0% 9.8% -5.7% 0.8% 2.0% 1.9% 0.1% 0.7% -2.5% 3.5%
PL8 Plato Income Maximiser Income -2.9% -3.1% -8.3% n/a -5.8% -3.1% -2.9% n/a n/a n/a n/a n/a
SNC Sandon Capital Investments Activist 0.0% -1.3% -1.2% 3.3% 0.0% -1.3% -0.4% 0.6% n/a n/a n/a n/a
WAR WAM Strategic Value Disc Capture n/a n/a n/a n/a n/a n/a n/a n/a n/a n/a n/a n/a
FGX Future Generation Investment Fund of Funds -1.4% -1.9% -2.1% -0.1% -2.9% -1.9% -0.7% 0.0% n/a n/a n/a n/a
Share/Unit Price Impact if Premium/Discount
normalises*Average
Error
Average
Absolute
Error
Error RangeShare/Unit Price Impact if Premium/Discount
normalises is annualised+ASX Code Company/Trust Name Investment Mandate
Hayden Nicholson
9
LISTED INVESTMENT COMPANIES INDICATIVE NTA.
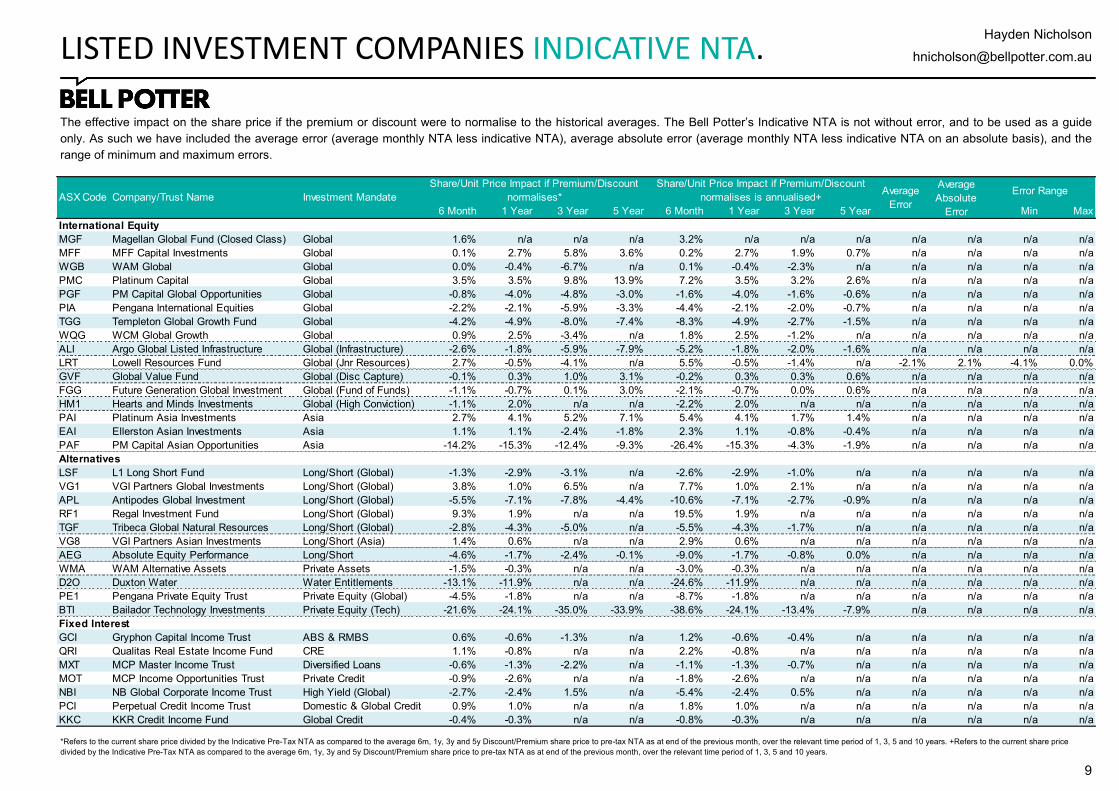
The effective impact on the share price if the premium or discount were to normalise to the historical averages. The Bell Potter’s Indicative NTA is not without error, and to be used as a guide
only. As such we have included the average error (average monthly NTA less indicative NTA), average absolute error (average monthly NTA less indicative NTA on an absolute basis), and the
range of minimum and maximum errors.
*Refers to the current share price divided by the Indicative Pre-Tax NTA as compared to the average 6m, 1y, 3y and 5y Discount/Premium share price to pre-tax NTA as at end of the previous month, over the relevant time period of 1, 3, 5 and 10 years. +Refers to the current share price
divided by the Indicative Pre-Tax NTA as compared to the average 6m, 1y, 3y and 5y Discount/Premium share price to pre-tax NTA as at end of the previous month, over the relevant time period of 1, 3, 5 and 10 years.
6 Month 1 Year 3 Year 5 Year 6 Month 1 Year 3 Year 5 Year Min Max
International Equity
MGF Magellan Global Fund (Closed Class) Global 1.6% n/a n/a n/a 3.2% n/a n/a n/a n/a n/a n/a n/a
MFF MFF Capital Investments Global 0.1% 2.7% 5.8% 3.6% 0.2% 2.7% 1.9% 0.7% n/a n/a n/a n/a
WGB WAM Global Global 0.0% -0.4% -6.7% n/a 0.1% -0.4% -2.3% n/a n/a n/a n/a n/a
PMC Platinum Capital Global 3.5% 3.5% 9.8% 13.9% 7.2% 3.5% 3.2% 2.6% n/a n/a n/a n/a
PGF PM Capital Global Opportunities Global -0.8% -4.0% -4.8% -3.0% -1.6% -4.0% -1.6% -0.6% n/a n/a n/a n/a
PIA Pengana International Equities Global -2.2% -2.1% -5.9% -3.3% -4.4% -2.1% -2.0% -0.7% n/a n/a n/a n/a
TGG Templeton Global Growth Fund Global -4.2% -4.9% -8.0% -7.4% -8.3% -4.9% -2.7% -1.5% n/a n/a n/a n/a
WQG WCM Global Growth Global 0.9% 2.5% -3.4% n/a 1.8% 2.5% -1.2% n/a n/a n/a n/a n/a
ALI Argo Global Listed Infrastructure Global (Infrastructure) -2.6% -1.8% -5.9% -7.9% -5.2% -1.8% -2.0% -1.6% n/a n/a n/a n/a
LRT Lowell Resources Fund Global (Jnr Resources) 2.7% -0.5% -4.1% n/a 5.5% -0.5% -1.4% n/a -2.1% 2.1% -4.1% 0.0%
GVF Global Value Fund Global (Disc Capture) -0.1% 0.3% 1.0% 3.1% -0.2% 0.3% 0.3% 0.6% n/a n/a n/a n/a
FGG Future Generation Global Investment Global (Fund of Funds) -1.1% -0.7% 0.1% 3.0% -2.1% -0.7% 0.0% 0.6% n/a n/a n/a n/a
HM1 Hearts and Minds Investments Global (High Conviction) -1.1% 2.0% n/a n/a -2.2% 2.0% n/a n/a n/a n/a n/a n/a
PAI Platinum Asia Investments Asia 2.7% 4.1% 5.2% 7.1% 5.4% 4.1% 1.7% 1.4% n/a n/a n/a n/a
EAI Ellerston Asian Investments Asia 1.1% 1.1% -2.4% -1.8% 2.3% 1.1% -0.8% -0.4% n/a n/a n/a n/a
PAF PM Capital Asian Opportunities Asia -14.2% -15.3% -12.4% -9.3% -26.4% -15.3% -4.3% -1.9% n/a n/a n/a n/a
Alternatives
LSF L1 Long Short Fund Long/Short (Global) -1.3% -2.9% -3.1% n/a -2.6% -2.9% -1.0% n/a n/a n/a n/a n/a
VG1 VGI Partners Global Investments Long/Short (Global) 3.8% 1.0% 6.5% n/a 7.7% 1.0% 2.1% n/a n/a n/a n/a n/a
APL Antipodes Global Investment Long/Short (Global) -5.5% -7.1% -7.8% -4.4% -10.6% -7.1% -2.7% -0.9% n/a n/a n/a n/a
RF1 Regal Investment Fund Long/Short (Global) 9.3% 1.9% n/a n/a 19.5% 1.9% n/a n/a n/a n/a n/a n/a
TGF Tribeca Global Natural Resources Long/Short (Global) -2.8% -4.3% -5.0% n/a -5.5% -4.3% -1.7% n/a n/a n/a n/a n/a
VG8 VGI Partners Asian Investments Long/Short (Asia) 1.4% 0.6% n/a n/a 2.9% 0.6% n/a n/a n/a n/a n/a n/a
AEG Absolute Equity Performance Long/Short -4.6% -1.7% -2.4% -0.1% -9.0% -1.7% -0.8% 0.0% n/a n/a n/a n/a
WMA WAM Alternative Assets Private Assets -1.5% -0.3% n/a n/a -3.0% -0.3% n/a n/a n/a n/a n/a n/a
D2O Duxton Water Water Entitlements -13.1% -11.9% n/a n/a -24.6% -11.9% n/a n/a n/a n/a n/a n/a
PE1 Pengana Private Equity Trust Private Equity (Global) -4.5% -1.8% n/a n/a -8.7% -1.8% n/a n/a n/a n/a n/a n/a
BTI Bailador Technology Investments Private Equity (Tech) -21.6% -24.1% -35.0% -33.9% -38.6% -24.1% -13.4% -7.9% n/a n/a n/a n/a
Fixed Interest
GCI Gryphon Capital Income Trust ABS & RMBS 0.6% -0.6% -1.3% n/a 1.2% -0.6% -0.4% n/a n/a n/a n/a n/a
QRI Qualitas Real Estate Income Fund CRE 1.1% -0.8% n/a n/a 2.2% -0.8% n/a n/a n/a n/a n/a n/a
MXT MCP Master Income Trust Diversified Loans -0.6% -1.3% -2.2% n/a -1.1% -1.3% -0.7% n/a n/a n/a n/a n/a
MOT MCP Income Opportunities Trust Private Credit -0.9% -2.6% n/a n/a -1.8% -2.6% n/a n/a n/a n/a n/a n/a
NBI NB Global Corporate Income Trust High Yield (Global) -2.7% -2.4% 1.5% n/a -5.4% -2.4% 0.5% n/a n/a n/a n/a n/a
PCI Perpetual Credit Income Trust Domestic & Global Credit 0.9% 1.0% n/a n/a 1.8% 1.0% n/a n/a n/a n/a n/a n/a
KKC KKR Credit Income Fund Global Credit -0.4% -0.3% n/a n/a -0.8% -0.3% n/a n/a n/a n/a n/a n/a
Error RangeASX Code Company/Trust Name Investment Mandate
Share/Unit Price Impact if Premium/Discount
normalises*
Share/Unit Price Impact if Premium/Discount
normalises is annualised+Average
Error
Average
Absolute
Error

Hayden Nicholson
10
A number of LICs under our coverage currently have options outstanding. Options dilute the NTA when exercised and therefore have an impact on the Premium or Discount on a look through
basis.
LISTED INVESTMENT COMPANIES INDICATIVE NTA.
Options outstanding and shares on issue are as at the date of the report.
100% 50% 100% 50%
Domestic Equity
AFI Australian Foundation Investment Large n/a 1,226 n/a n/a $8.20 n/a n/a n/a n/a n/a n/a
ARG Argo Investments Large n/a 727 n/a n/a $9.29 n/a n/a n/a n/a n/a n/a
AUI Australian United Investment Large n/a 125 n/a n/a $9.95 n/a n/a n/a n/a n/a n/a
BKI BKI Investment Large/Medium n/a 741 n/a n/a $1.61 n/a n/a n/a n/a n/a n/a
DUI Diversified United Investment Large/Medium n/a 213 n/a n/a $5.19 n/a n/a n/a n/a n/a n/a
CIN Carlton Investments Large/Medium n/a 26 n/a n/a $32.42 n/a n/a n/a n/a n/a n/a
WLE WAM Leaders Large/Medium n/a 1,030 n/a n/a $1.52 n/a n/a n/a n/a n/a n/a
WHF Whitefield Large/Medium n/a 110 n/a n/a $5.69 n/a n/a n/a n/a n/a n/a
PIC Perpetual Equity Investment Large/Medium PICOA 374 372,365 $1.350 $1.29 $0.018 02-Sep-22 $1.40 $1.40 -8.1% -8.1%
AMH AMCIL Large/Medium n/a 301 n/a n/a $1.24 n/a n/a n/a n/a n/a n/a
CAM Clime Capital Large/Medium n/a 140 n/a n/a $0.92 n/a n/a n/a n/a n/a n/a
FSI Flagship Investments Large/Medium n/a 26 n/a n/a $2.80 n/a n/a n/a n/a n/a n/a
WAM WAM Capital Medium/Small n/a 878 n/a n/a $2.40 n/a n/a n/a n/a n/a n/a
OPH Ophir High Conviction Fund Medium/Small n/a 214 n/a n/a $3.92 n/a n/a n/a n/a n/a n/a
MIR Mirrabooka Investments Medium/Small n/a 176 n/a n/a $3.88 n/a n/a n/a n/a n/a n/a
QVE QV Equities Medium/Small n/a 241 n/a n/a $1.05 n/a n/a n/a n/a n/a n/a
WAX WAM Research Medium/Small n/a 196 n/a n/a $1.70 n/a n/a n/a n/a n/a n/a
CDM Cadence Capital Medium/Small n/a 296 n/a n/a $1.10 n/a n/a n/a n/a n/a n/a
WIC Westoz Investment Medium/Small n/a 134 n/a n/a $1.17 n/a n/a n/a n/a n/a n/a
TOP Thorney Opportunities Medium/Small n/a 198 n/a n/a $0.56 n/a n/a n/a n/a n/a n/a
RYD Ryder Capital Medium/Small RYDOA 76 9,275 $1.500 $1.69 $0.200 10-Dec-21 $1.80 $1.82 -6.3% -7.2%
TEK Thorney Technologies Medium/Small n/a 425 n/a n/a $0.44 n/a n/a n/a n/a n/a n/a
WAA WAM Active Medium/Small WAAOA 73 67,393 $1.100 $1.09 $0.016 31-Oct-22 $1.07 $1.07 1.4% 1.4%
NAC Naos Ex-50 Opportunities Medium/Small NACOA 45 21,837 $1.030 $1.23 $0.165 31-Mar-23 $1.40 $1.47 -12.6% -16.8%
WMI WAM Microcap Small/Micro n/a 207 n/a n/a $2.06 n/a n/a n/a n/a n/a n/a
SEC Spheria Emerging Companies Small/Micro n/a 60 n/a n/a $2.44 n/a n/a n/a n/a n/a n/a
NSC Naos Small Cap Opportunities Small/Micro NSCOA 152 50,906 $1.020 $0.89 $0.053 28-Jun-24 $1.07 $1.07 -16.8% -16.8%
NCC Naos Emerging Opportunities Small/Micro n/a 73 n/a n/a $1.07 n/a n/a n/a n/a n/a n/a
ACQ Acorn Capital Investment Small/Micro n/a 68 n/a n/a $1.66 n/a n/a n/a n/a n/a n/a
OZG Ozgrowth Small/Micro n/a 350 n/a n/a $0.27 n/a n/a n/a n/a n/a n/a
DJW Djerriwarrh Investments Income n/a 237 n/a n/a $3.20 n/a n/a n/a n/a n/a n/a
PL8 Plato Income Maximiser Income n/a 428 n/a n/a $1.28 n/a n/a n/a n/a n/a n/a
SNC Sandon Capital Investments Activist n/a 133 n/a n/a $1.03 n/a n/a n/a n/a n/a n/a
WAR WAM Strategic Value Disc Capture n/a 180 n/a n/a $1.24 n/a n/a n/a n/a n/a n/a
FGX Future Generation Investment Fund of Funds FGXO 401 400,998 $1.480 $1.45 $0.027 28-Apr-23 $1.52 $1.52 -4.6% -4.6%
Option
PriceExpiry
NTA after % ExcercisedEffective Prem/Disc after
% Exc.Investment MandateOption
Code
Shares/Units
On Issue (M)
Options
'000Strike
Share/Unit
PriceASX Code Company/Trust Name

Hayden Nicholson
11
A number of LICs under our coverage currently have options outstanding. Options dilute the NTA when exercised and therefore have an impact on the Premium or Discount on a look through
basis.
LISTED INVESTMENT COMPANIES INDICATIVE NTA.
Options outstanding and shares on issue are as at the date of the report.
100% 50% 100% 50%
International Equity
MGF Magellan Global Fund (Closed Class) Global MGFO 1,701 1,064,457 7.5% Disc $1.73 $0.015 01-Mar-24 $1.95 $1.95 -11.4% -11.4%
MFF MFF Capital Investments Global MFFOA 577 85,012 $2.600 $2.93 $0.320 31-Oct-22 $3.26 $3.31 -10.1% -11.4%
WGB WAM Global Global WGBO 242 183,649 $2.540 $2.64 $0.096 12-Sep-22 $2.64 $2.66 0.1% -0.9%
PMC Platinum Capital Global n/a 293 n/a n/a $1.39 n/a n/a n/a n/a n/a n/a
PGF PM Capital Global Opportunities Global n/a 391 n/a n/a $1.53 n/a n/a n/a n/a n/a n/a
PIA Pengana International Equities Global n/a 255 n/a n/a $1.39 n/a n/a n/a n/a n/a n/a
TGG Templeton Global Growth Fund Global n/a 198 n/a n/a $1.63 n/a n/a n/a n/a n/a n/a
WQG WCM Global Growth Global WQGOA 185 50,300 $1.500 $1.63 $0.140 31-Aug-22 $1.73 $1.75 -5.5% -7.0%
ALI Argo Global Listed Infrastructure Global (Infrastructure) n/a 154 n/a n/a $2.30 n/a n/a n/a n/a n/a n/a
LRT Lowell Resources Fund Global (Jnr Resources) n/a 29 n/a n/a $1.61 n/a n/a n/a n/a n/a n/a
GVF Global Value Fund Global (Disc Capture) n/a 173 n/a n/a $1.17 n/a n/a n/a n/a n/a n/a
FGG Future Generation Global Investment Global (Fund of Funds) n/a 393 n/a n/a $1.55 n/a n/a n/a n/a n/a n/a
HM1 Hearts and Minds Investments Global (High Conviction) n/a 226 n/a n/a $4.32 n/a n/a n/a n/a n/a n/a
PAI Platinum Asia Investments Asia n/a 367 n/a n/a $1.09 n/a n/a n/a n/a n/a n/a
EAI Ellerston Asian Investments Asia n/a 131 n/a n/a $1.09 n/a n/a n/a n/a n/a n/a
PAF PM Capital Asian Opportunities Asia n/a 57 n/a n/a $1.10 n/a n/a n/a n/a n/a n/a
Alternatives
LSF L1 Long Short Fund Long/Short (Global) n/a 608 n/a n/a $2.84 n/a n/a n/a n/a n/a n/a
VG1 VGI Partners Global Investments Long/Short (Global) n/a 380 n/a n/a $2.03 n/a n/a n/a n/a n/a n/a
APL Antipodes Global Investment Long/Short (Global) n/a 485 n/a n/a $1.14 n/a n/a n/a n/a n/a n/a
RF1 Regal Investment Fund Long/Short (Global) n/a 116 n/a n/a $4.13 n/a n/a n/a n/a n/a n/a
TGF Tribeca Global Natural Resources Long/Short (Global) n/a 62 n/a n/a $2.50 n/a n/a n/a n/a n/a n/a
VG8 VGI Partners Asian Investments Long/Short (Asia) n/a 223 n/a n/a $2.07 n/a n/a n/a n/a n/a n/a
AEG Absolute Equity Performance Long/Short n/a 92 n/a n/a $1.03 n/a n/a n/a n/a n/a n/a
WMA WAM Alternative Assets Private Assets n/a 194 n/a n/a $1.03 n/a n/a n/a n/a n/a n/a
D2O Duxton Water Water Entitlements n/a 120 n/a n/a $1.51 n/a n/a n/a n/a n/a n/a
PE1 Pengana Private Equity Trust Private Equity (Global) n/a 240 n/a n/a $1.45 n/a n/a n/a n/a n/a n/a
BTI Bailador Technology Investments Private Equity (Tech) n/a 141 n/a n/a $1.70 n/a n/a n/a n/a n/a n/a
Fixed Interest
GCI Gryphon Capital Income Trust ABS & RMBS n/a 243 n/a n/a $2.02 n/a n/a n/a n/a n/a n/a
QRI Qualitas Real Estate Income Fund CRE n/a 267 n/a n/a $1.63 n/a n/a n/a n/a n/a n/a
MXT MCP Master Income Trust Diversified Loans n/a 736 n/a n/a $2.06 n/a n/a n/a n/a n/a n/a
MOT MCP Income Opportunities Trust Private Credit n/a 211 n/a n/a $2.07 n/a n/a n/a n/a n/a n/a
NBI NB Global Corporate Income Trust High Yield (Global) n/a 446 n/a n/a $1.90 n/a n/a n/a n/a n/a n/a
PCI Perpetual Credit Income Trust Domestic & Global Credit n/a 401 n/a n/a $1.06 n/a n/a n/a n/a n/a n/a
KKC KKR Credit Income Fund Global Credit n/a 370 n/a n/a $2.25 n/a n/a n/a n/a n/a n/a
Company/Trust Name Investment MandateOption
Code
Shares/Units
On Issue (M)
Options
'000Strike
Share/Unit
Price
Option
PriceExpiry
NTA after % ExcercisedEffective Prem/Disc after
% Exc.ASX Code
Hayden Nicholson
12
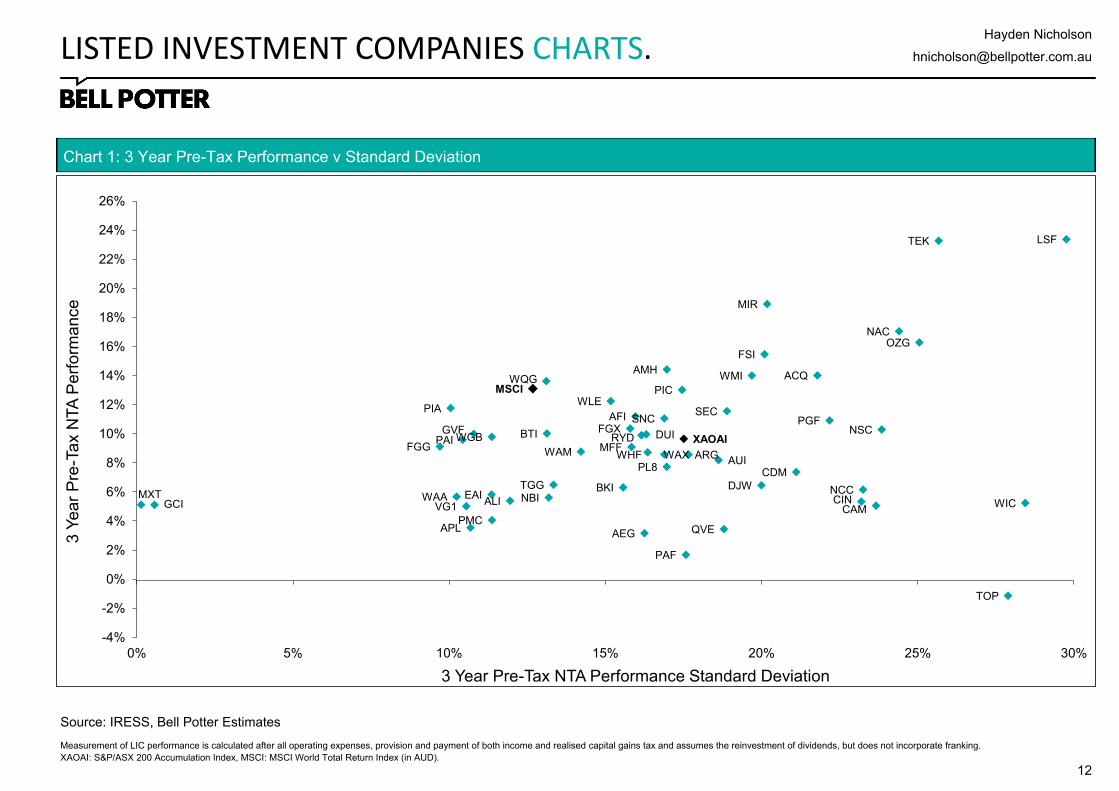
LISTED INVESTMENT COMPANIES CHARTS.
Source: IRESS, Bell Potter Estimates
Measurement of LIC performance is calculated after all operating expenses, provision and payment of both income and realised capital gains tax and assumes the reinvestment of dividends, but does not incorporate franking.
XAOAI: S&P/ASX 200 Accumulation Index, MSCI: MSCI World Total Return Index (in AUD).
Chart 1: 3 Year Pre-Tax Performance v Standard Deviation
AFI
ARGAUI
BKI
DUI
CIN
WLE
WHF
PIC
AMH
CAM
FSI
WAM
MIR
QVE
WAX
CDM
WIC
TOP
RYD
TEK
WAA
NAC
WMI
SEC
NSC
NCC
ACQ
OZG
DJW
PL8
SNCFGX
MFFWGB
PMC
PGFPIA
TGG
WQG
ALI
GVF
FGGPAI
EAI
PAF
LSF
VG1
APLAEG
BTI
GCIMXT NBI
XAOAI
MSCI
-4%
-2%
0%
2%
4%
6%
8%
10%
12%
14%
16%
18%
20%
22%
24%
26%
0% 5% 10% 15% 20% 25% 30%
3 Y
ea
r P
re-T
ax N
TA
Pe
rfo
rma
nce
3 Year Pre-Tax NTA Performance Standard Deviation
Hayden Nicholson
13
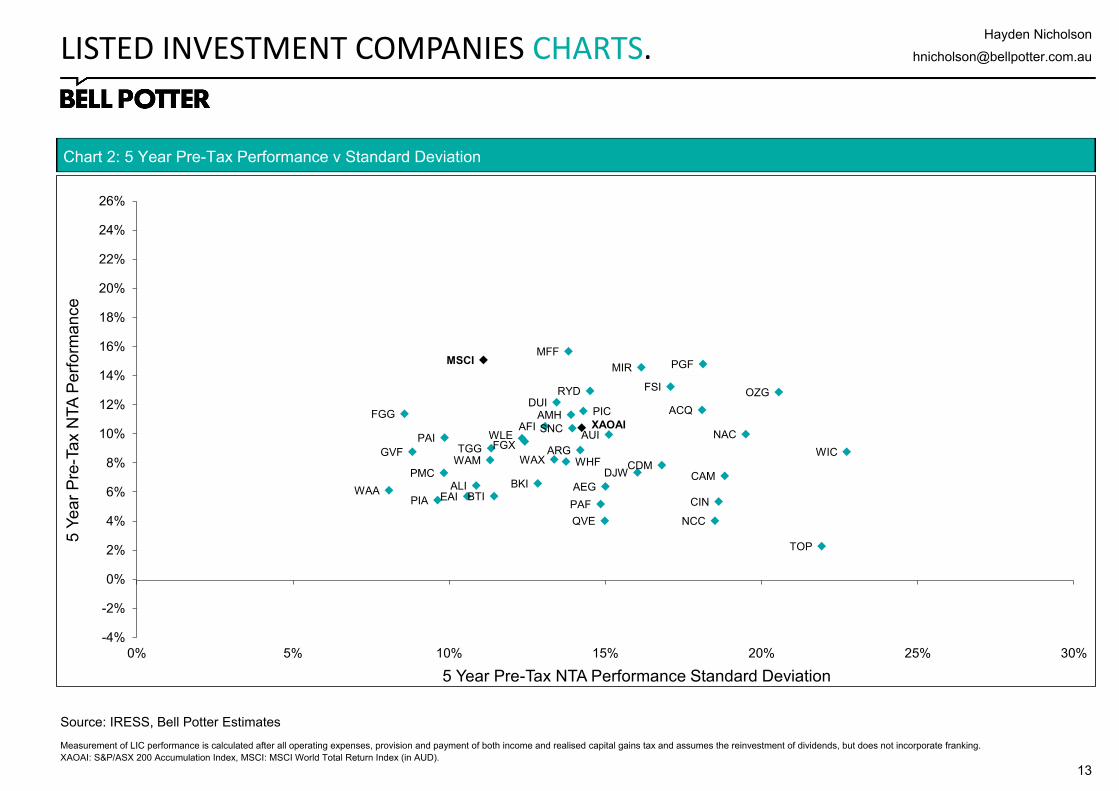
LISTED INVESTMENT COMPANIES CHARTS.
Source: IRESS, Bell Potter Estimates
Chart 2: 5 Year Pre-Tax Performance v Standard Deviation
Measurement of LIC performance is calculated after all operating expenses, provision and payment of both income and realised capital gains tax and assumes the reinvestment of dividends, but does not incorporate franking.
XAOAI: S&P/ASX 200 Accumulation Index, MSCI: MSCI World Total Return Index (in AUD).
AFI
ARG
AUI
BKI
DUI
CIN
WLE
WHF
PICAMH
CAM
FSI
WAM
MIR
QVE
WAXCDM
WIC
TOP
RYD
WAA
NAC
NCC
ACQ
OZG
DJW
SNC
FGX
MFF
PMC
PGF
PIA
TGG
ALI
GVF
FGG
PAI
EAIPAF
AEGBTI
XAOAI
MSCI
-4%
-2%
0%
2%
4%
6%
8%
10%
12%
14%
16%
18%
20%
22%
24%
26%
0% 5% 10% 15% 20% 25% 30%
5 Y
ea
r P
re-T
ax N
TA
Pe
rfo
rma
nce
5 Year Pre-Tax NTA Performance Standard Deviation

Hayden Nicholson
14
LISTED INVESTMENT COMPANIES CHARTS.
Source: IRESS, Company Data, Bell Potter Estimates
Chart 3: Premium/Discount Relationship Across Market Cap (Equal-Weighted Average Indicated by Red Line)
Chart 4: 5 Year Historical Premium/Discount Tracker by Market Capitalisation
Source: IRESS, Company Data, Bell Potter Estimates
TEKD2O
WIC
TGFSECEAI
SNC
NSC
RYD
CAM
ACQ
TOP
AEG
OZG
WAA
NCC
FSIPAF
NAC
LRT
-30%
-20%
-10%
0%
10%
20%
30%
40%
0 50 100 150 200
Ind
ica
tive
Pre
miu
m / D
isc
ou
nt
Market Cap. ($M)
WAM
LSFMFF
WLEMXT
AUIBKI
DUI
HM1
CIN
NBI
OPH
KKC
VG1
DJW
MIR
WGBWHF
FGGPGF
FGXAPL
PL8
-30%
-20%
-10%
0%
10%
20%
30%
40%
500 1,000 1,500 2,000 2,500
Ind
ica
tive
Pre
miu
m / D
isc
ou
nt
Market Cap. ($M)
GCI
PIC
RF1
VG8
MOTQRI
WMI
PCI
PMCPAI
AMHPIA
ALIPE1
WAX
CDM
TGG
WQGQVE
BTI
WARGVF
-30%
-20%
-10%
0%
10%
20%
30%
40%
200 250 300 350 400 450 500
Ind
ica
tive
Pre
miu
m / D
isc
ou
nt
Market Cap. ($M)
-25%
-20%
-15%
-10%
-5%
0%
5%
10%
Sep 16 Mar 17 Sep 17 Mar 18 Sep 18 Mar 19 Sep 19 Mar 20 Sep 20 Mar 21 Sep 21
<$200m $200m-$500m >$500m

Hayden Nicholson
15
LISTED INVESTMENT COMPANIES CHARTS.
Source: IRESS
Chart 5: Share Price Performance since 31 December 2020 (Including Net Dividends)
$0m
$1,500m
$3,000m
$4,500m
$6,000m
$7,500m
$9,000m
$10,500m
$12,000m
TG
FB
TI
LS
FLR
TR
F1
NS
CS
NC
PG
FS
EC
CD
MP
AF
OZ
GM
IRF
SI
PE
1O
PH
CIN
QV
EA
MH
FG
XN
AC
TG
GW
GB
AC
QA
FI
WLE
WM
IW
AX
AP
LP
ICP
L8
ALI
AR
GG
VF
AU
ID
2O
TE
KD
UI
WA
MM
FF
NC
CM
OT
PIA
WM
AW
HF
BK
IC
AM
DJW
QR
IW
QG
NB
IF
GG
MG
FG
CI
MX
TR
YD
PC
IW
ICT
OP
KK
CW
AA
PM
CW
AR
HM
1E
AI
PA
IV
G1
VG
8A
EG
-20%
-10%
0%
10%
20%
30%
40%
50%
60%
Share Price Return (LHS) Market Cap (RHS)
Hayden Nicholson
16
The following may affect your legal rights. Important Disclaimer:
This document is a private communication to clients and is not intended for public circulation or for the use of any third party, without the prior approval of Bell Potter Securities Limited. In the USA and the UK this research is only for institutional investors. It is not for release, publication or distribution in whole or in part to any persons in the two specified countries. In Hong Kong, this research is being distributed by Bell Potter Securities (HK) Limited which is licensed and regulated by the Securities and Futures Commission, Hong Kong. In the United States, this research is issued and distributed by Bell Potter Securities (US) LLC which is a registered broker-dealer and member of FINRA. Any person receiving this report from Bell Potter Securities (US) LLC and wishing to transact in any security described herein should do so with Bell Potter Securities (US) LLC.
This is general investment advice only and does not constitute personal advice to any person. Because this document has been prepared without consideration of any specific client’s financial situation, particular needs and investment objectives (‘relevant personal circumstances’), a Bell Potter Securities Limited investment adviser (or the financial services licensee, or the representative of such licensee, who has provided you with this report by arrangement with Bell Potter Securities Limited) should be made aware of your relevant personal circumstances and consulted before any investment decision is made on the basis of this document.
While this document is based on information from sources which are considered reliable, Bell Potter Securities Limited has not verified independently the information contained in the document and Bell Potter Securities Limited and its directors, employees and consultants do not represent, warrant or guarantee, expressly or impliedly, that the information contained in this document is complete or accurate. Nor does Bell Potter Securities Limited accept any responsibility for updating any advice, views opinions, or recommendations contained in this document or for correcting any error or omission which may become apparent after the document has been issued.
Except insofar as liability under any statute cannot be excluded. Bell Potter Securities Limited and its directors, employees and consultants do not accept any liability (whether arising in contract, in tort or negligence or otherwise) for any error or omission in this document or for any resulting loss or damage (whether direct, indirect, consequential or otherwise) suffered by the recipient of this document or any other person.
Research Policies:
For Bell Potter’s Research Coverage Decision Making Process and Research Independence Policy, please refer to our company website:
https://www.bellpotter.com.au/topnavigation/private-clients/stockbroking/research
Disclosure of interest:
Bell Potter Securities Limited, its employees, consultants and its associates within the meaning of Chapter 7 of the Corporations Law may receive commissions, underwriting and management fees from transactions involving securities referred to in this document (which its representatives may directly share) and may from time to time hold interests in the securities referred to in this document.
Additional disclosure:
Bell Potter Securities Limited acted as a Co-Manager or Lead Manager to the following capital raisings and/or IPOs: FGG, FGX, GCI, HM1, LSF, MOT, MXT, NBI, PCI, PE1, RF1, TOP, TEK, WAR, WGB, WQG. Bell Potter Securities Limited received fees for these services.
ANALYST CERTIFICATION
Each research analyst primarily responsible for the content of this research report, in whole or in part, certifies that with respect to each security or issuer that the analyst covered in this report: (1) all of the views expressed accurately reflect his or her personal views about those securities or issuers and were prepared in an independent manner and (2) no part of his or her compensation was, is, or will be, directly or indirectly, related to the specific recommendations or views expressed by that research analyst in the research report.
Bell Potter Securities Limited
ACN25 006 390 7721
Level 29, 101 Collins Street
Melbourne, Victoria, 3000
Telephone +61 3 9256 8700
www.bellpotter.com.au
Bell Potter Securities (HK) Limited
Room 1701, 17/F
Prosperity Tower, 39 Queens Road
Central, Hong Kong, 0000
Telephone +852 3750 8400
Bell Potter Securities (US) LLC
Floor 39
444 Madison Avenue, New York
NY 10022, U.S.A
Telephone +1 917 819 1410
Bell Potter Securities (UK) Limited
16 Berkeley Street
London, England
W1J 8DZ, United Kingdom
Telephone +44 7734 2929
Listed
Investment
Companies