list of tablesvi chapter 2: an experimental · pdf file · 2012-07-17chapter 2...
TRANSCRIPT

Interactions between macroalgae and the sediment microbial community: Nutrient
cycling within shallow coastal bays
_________________________
A Dissertation
Presented to
The Faculty of the School of Marine Science
The College of William and Mary in Virginia
In Partial Fulfillment
Of the requirements for the Degree of
Doctor of Philosophy
___________________________
By
Amber Kay Hardison
2009

ii
APPROVAL SHEET
This dissertation is submitted in partial fulfillment of
the requirements for the degree of
Doctor of Philosophy
_____________________________ Amber K. Hardison
Approved, by the Committee, November 2009
_____________________________________ Iris C. Anderson, Ph.D Co-Advisor
_____________________________________ Elizabeth A. Canuel, Ph.D Co-Advisor
_____________________________________ Mark Luckenbach, Ph.D
_____________________________________ Carl Friedrichs, Ph.D
_____________________________________ Karen J. McGlathery, Ph.D University of Virginia Charlottesville, Virginia

iii
TABLE OF CONTENTS ACKNOWLEDGEMENTS................................................................................................ v LIST OF TABLES............................................................................................................. vi LIST OF FIGURES .......................................................................................................... vii ABSTRACT....................................................................................................................... ix CHAPTER 1: INTRODUCTION...................................................................................... 2
Literature Cited.......................................................................................................................... 13 CHAPTER 2: AN EXPERIMENTAL APPARATUS FOR LABORATORY AND FIELD-BASED PERFUSION OF SEDIMENT POREWATER WITH DISSOLVED TRACERS ........................................................................................................................ 20
Abstract...................................................................................................................................... 21 Introduction ............................................................................................................................... 22 Methods ..................................................................................................................................... 25 Results & Discussion................................................................................................................. 35 References ................................................................................................................................. 48
CHAPTER 3: BENTHIC ALGAE DETERMINE SEDIMENT ORGANIC MATTER COMPOSITION IN SHALLOW PHOTIC SEDIMENTS............................................... 69
Abstract...................................................................................................................................... 70 Introduction ............................................................................................................................... 72 Methods ..................................................................................................................................... 74 Results ....................................................................................................................................... 81 Discussion.................................................................................................................................. 86 Literature Cited.......................................................................................................................... 96
CHAPTER 4: CARBON AND NITROGEN DYNAMICS IN SHALLOW PHOTIC SYSTEMS: INTERACTIONS BETWEEN MACRO- AND MICROALGAL COMMUNITIES ............................................................................................................ 121
Abstract.................................................................................................................................... 123 Introduction ............................................................................................................................. 125 Methods ................................................................................................................................... 127 Results ..................................................................................................................................... 137 Discussion................................................................................................................................ 141 Literature Cited........................................................................................................................ 149

iv
CHAPTER 5: FATE OF MACROALGAE IN BENTHIC SYSTEMS: CARBON AND NITROGEN CYCLING WITHIN THE MICROBIAL COMMUNITY ....................... 175
ABSTRACT ............................................................................................................................ 176 INTRODUCTION ................................................................................................................... 177 METHODS.............................................................................................................................. 179 RESULTS................................................................................................................................ 187 DISCUSSION.......................................................................................................................... 194 LITERATURE CITED............................................................................................................ 204
CHAPTER 6: SYNTHESIS........................................................................................... 226
Literature Cited........................................................................................................................ 230 APPENDIX A: CHAPTER 2 SF6 DATA…………………………………………… 235 APPENDIX B: CHAPTER 2 STABLE ISOTOPE DATA………………………… 236 APPENDIX C: CHAPTER 2 RHODAMINE DATA………………………………. 238 APPENDIX D: CHAPTER 3 BULK, THAA CONCENTRATION DATA……….. 241 APPENDIX E: CHAPTER 3 PLFA CONCENTRATION DATA…………………. 249 APPENDIX F: CHAPTER 4 BULK, THAA ISOTOPE DATA……………………. 263 APPENDIX G: CHAPTER 4 PLFA ISOTOPE DATA……………………………... 266 APPENDIX H: CHAPTER 5 BULK, THAA ISOTOPE DATA……………………. 278 APPENDIX I: CHAPTER 5 PLFA ISOTOPE DATA………………………………. 279 VITA............................................................................................................................... 285

vi
LIST OF TABLES CHAPTER 3 Table 3-1: Parameters measured concurrently at Hog Island Bay field sites and in mesocosms. ..................................................................................................................... 104 Table 3-2: Results of two-factor repeated measures ANOVA. ..................................... 105 Table 3-3 Mole percent individual amino acids of THAA. ............................................ 106 CHAPTER 4 Table 4-1: Results of two-factor repeated measures ANOVA. ..................................... 156 Table 4-2: Uptake and loss rates for label into bulk, THAA, and PLFA. ..................... 157 Table 4-3: Isotope inventory in macroalgae and sediments........................................... 158 CHAPTER 5 Table 5-1: Environmental parameters measured in the field and in the mesocosms..... 210 Table 5-2: Bulk sediment characterization parameters and statistical results from repeated measures ANOVA............................................................................................ 211 Table 5-3: Statistical results for repeated measures ANOVA of isotopic enrichments. 212 Table 5-4. Fraction (%) of excess isotope (13C or 15N) in THAA, D-Ala, and PLFA out of excess isotope in bulk sediment...................................................................................... 213

vii
LIST OF FIGURES CHAPTER 2 Figure 2-1. Perfusionator diagram. .................................................................................. 53 Figure 2-2. Plumbing schematic for field deployment. ................................................... 55 Figure 2-3. Rhodamine WT concentrations for the laboratory test of the perfusionator. 57 Figure 2-4. SF6 concentrations during outdoor mesocosm array experiment.................. 59 Figure 2-5. Bulk sediment isotopic enrichments for surface sediments (0-1 cm) during outdoor mesocosm array experiment. ............................................................................... 61 Figure 2-6. SF6 concentrations during field deployment of the perfusionator................ 63 Figure 2-7. Bulk sediment isotopic enrichments for surface sediments (0-1 cm) during the field deployment of the perfusionator. ........................................................................ 65 Figure 2-8. Isotopic enrichment (δ15N) for porewater NH4+ during the field deployment of the perfusionator. .......................................................................................................... 67 CHAPTER 3 Figure 3-1. Study site..................................................................................................... 107 Figure 3-2. Macroalgal biomass (a) and benthic chlorophyll a concentrations for surface (0-1 cm) sediments (a). ................................................................................................... 109 Figure 3-3. Total nitrogen (a) and total organic carbon (b) concentrations and C/N (c) in surface (0-1 cm) sediments. ............................................................................................ 111 Figure 3-4. THAA (a) and total PLFA (b) concentrations in surface (0-1 cm) sediments.......................................................................................................................................... 113 Figure 3-5. Composition as mole percent of THAA for select HAA. ........................... 115 Figure 3-6. Concentrations of select algal and bacterial PLFA. .................................... 117 Figure 3-7. Score and loading results for PC1 and PC2 from PCA analyses. ............... 119 CHAPTER 4 Figure 4-1. Map of study site.......................................................................................... 159 Figure 4-2. Macroalgal biomass and isotopic enrichment. ............................................ 161 Figure 4-3. Benthic chlorophyll a concentrations in a) Surface Water and b) Pore Water treatments........................................................................................................................ 163 Figure 4-4. Bulk sediment isotopes. ............................................................................... 165 Figure 4-5. PLFA isotopic enrichments.......................................................................... 167 Figure 4-6. The bacteria-to-algae ratio (BAR). .............................................................. 169 Figure 4-7. THAA isotopic enrichments. ....................................................................... 171 Figure 4-8. D-alanine isotopic enrichments.................................................................... 173 CHAPTER 5 Figure 5-1. Study sites. ................................................................................................... 214

viii
Figure 5-2. Bulk sediment isotopic enrichments for HIB (solid lines) and IWB (dotted lines)................................................................................................................................ 216 Figure 5-3. Amino acid isotopic enrichments for HIB (solid line) and IWB (dotted line).......................................................................................................................................... 218 Figure 5-4. The ratio of excess 13C (a) or 15N (b) in D-Ala/L-Ala. ............................... 220 Figure 5-5. PLFA isotopic enrichments......................................................................... 222 Figure 5-6. Proposed mechanism for microbial processing of dead macroalgal biomass within the sediments. ...................................................................................................... 224 CHAPTER 6 Figure 6-1. Conceptual diagram summarizing macroalgal and sediment microbial interactions in a shallow coastal system. ………………………………………………233

ix
ABSTRACT Ephemeral macroalgal blooms are considered a symptom of eutrophication in shallow coastal lagoons, but their influence on nutrient cycling dynamics in these systems is not fully understood. From 2006-2008, I conducted a series of experiments to determine the influence of living and senescent macroalgae on sediment carbon (C) and nitrogen (N) cycling in coastal lagoons along the Delmarva Peninsula, USA. In particular, I focused on how macroalgae affect the microbial community at the sediment-water interface of shallow subtidal sediments because this complex consortium of autotrophic (e.g. benthic microalgae, BMA) and heterotrophic (e.g. bacteria) organisms plays a critical role in nutrient cycling within these systems. To more accurately address microbial uptake of nutrients and organic matter from porewater and surface water sources, I designed and tested the “perfusionator,” an experimental apparatus which allowed for continuous and homogenous perfusion of sediment porewater with dissolved tracers. I used the perfusionator in an outdoor mesocosm study to investigate the influence of benthic micro- and macroalgae on sediment organic matter quantity and quality using bulk and molecular level (total hydrolyzable amino acids, THAA; phospholipid linked fatty acids, PLFA) analyses. In a companion study, I further quantified C and N cycling by explicitly tracking C and N uptake into the sediments in the presence and absence of macroalgae using a dual stable isotope (H13CO3
-, 15NH4+) tracer approach in combination with
isotope analyses of THAA and PLFA. Together, the studies demonstrated that BMA activity, which was dominated by diatoms according to PLFA biomarkers, increased storage of C and N in surface sediments, relative to dark treatments without BMA. BMA also increased the lability of sediment organic matter, which in turn resulted in observed increases in bacterial PLFA concentrations and isotopic incorporation. Efficient shuttling of C and N between BMA and bacteria in this system served as a mechanism for retention of C and N within the sediments. Macroalgae fundamentally altered sediment C and N cycling by decreasing sediment organic matter buildup. Macroalgae also sequestered C and N, but sediment C and N uptake decreased by ~40% when macroalgae were present. This was likely due to shading of the sediment surface by macroalgae, which decreased BMA production, which in turn decreased bacterial production. Although macroalgae are capable of sequestering significant amounts of nutrients, storage of C and N as macroalgal biomass is only temporary, as these blooms often exhibit a bloom and die-off cycle. In the final portion of this project, I traced C and N from senescing macroalgae into relevant sediment pools. A macroalgal die-off was simulated by the addition of freeze-dried macroalgae, pre-labeled with 13C and 15N, to sediment mesocosms. Bulk sediments took up label immediately following the die-off, and macroalgal C and N were retained in the sediments for >2 weeks. Approximately 6 to 50% and 2 to 9% of macroalgal N and C, respectively, were incorporated into the sediments. Label from the macroalgae appeared first in bacterial and then BMA biomarkers, suggesting that shuttling of macroalgal C and N between these communities may serve as a mechanism for retention of some macroalgal nutrients within the sediments. Together, these experiments suggest that ephemeral macroalgae diminish C and N uptake by the sediment microbial community, which may substantially impact the response of coastal bays to increased nutrient loading.

Interactions between macroalgae and the sediment microbial community: Nutrient
cycling within shallow coastal bays

2
CHAPTER 1: INTRODUCTION

3
Eutrophication and primary producers in coastal lagoons
Projected changes in land use and population densities in coastal regions indicate
that delivery of nutrients to coastal systems will increase considerably over the coming
decades; consequently, nutrient pollution is a significant and urgent threat to the health of
coastal systems globally (Nixon 1995, Howarth et al. 2000, NRC 2000). A great deal of
research attempting to predict the response of coastal systems to nutrient enrichment has
focused on relatively deep estuaries where primary production is dominated by
phytoplankton (Cloern 2001). Less attention has been paid, however, to shallow coastal
lagoons and estuaries, common to the East and Gulf coasts of the U.S. and constituting at
least 13% of the world’s coastline (Boynton et al. 1996). These shallow lagoons,
typically 2-5 m deep, provide important societal and ecosystem functions. Coastal bays
sustain recreational and commercial fisheries, support travel and tourism, and serve as an
estuarine filter to incoming land-derived nutrients. Given their widespread global
distribution and the important services that they perform, these bays require increased
attention as the threat from anthropogenic changes along the coastal margin escalates.
Because most of the seafloor in coastal bays lies within the photic zone, benthic
autotrophs such as seagrasses, macroalgae, and benthic microalgae (BMA) often
dominate production. In many cases, as nutrient loading increases, the contribution from
ephemeral macroalgae, phytoplankton, and epiphytes increases, whereas the importance
of slow-growing perennial macrophytes such as seagrass decreases (Sand-Jensen &
Borum 1991, Valiela et al. 1992, Duarte 1995, Hauxwell et al. 2001, Valiela & Cole
2002). For example, in Waquoit Bay, MA, ephemeral populations of green (Cladophora)

4
and red (Gracilaria) macroalgae replaced Zostera marina seagrass when nutrient
(nitrogen) loading increased six-fold (Hauxwell et al. 2003). The mechanisms underlying
this shift in autotrophic community structure relate to differences among plant types in
nutrient uptake and growth strategies (Sand-Jensen & Borum 1991, Nielsen et al. 1996).
BMA often contribute significantly to primary production within these shallow systems;
however, their role as community structures shift in response to nutrient over-enrichment
is not well understood.
The deleterious effects of macroalgae are not limited to replacement of
seagrasses. When present in dense accumulations, macroalgal blooms have been
associated with decreased diversity and biomass within the faunal and fish communities
(Holmquist 1997, Hauxwell et al. 1998, Raffaelli 2000, Bowen & Valiela 2001, Deegan
et al. 2002), which limits food available for upper trophic levels (i.e. birds, predatory fish,
epibenthic crustaceans; Raffaelli 2000). Dense blooms have also interfered with
recreational and commercial activities in coastal bays, as macroalgae can foul trawl nets,
reduce waterway access, clog boat motors, and create beach debris (Raffaelli et al. 1998).
A shift to macroalgal dominance is of important biogeochemical consequence as well,
since coastal bays are hypothesized to function as a nutrient filter (McGlathery et al.
2007). The lagoons remove, transform, and retain nutrients, thereby buffering the
immediate effects of external nutrient loading on water quality. This function is
facilitated primarily by autotrophs because a significant fraction of nutrients, regardless
of the level of eutrophication, passes through the autotrophic community (Sand-Jensen &
Nielsen 2004). Macroalgae may potentially impact this filtering role directly by taking
up, storing, and releasing nutrients and indirectly by competing with other autotrophs for

5
limiting resources (i.e. light, nutrients), thereby altering their role in the estuarine filter.
The mechanisms by which increased eutrophication and the related shift to macroalgal
dominance may impact the ability of lagoons to act as filters are currently unknown. My
dissertation research aims to describe the influence of benthic macroalgae on nutrient
cycling in temperate coastal bays in order to understand how increased nutrient loading
(and the dominance of ephemeral macroalgae) might influence the ability of a shallow
photic system to function as nutrient filters.
Benthic algae and nutrient cycling
A common symptom of eutrophication in shallow coastal bays is proliferation of
ephemeral macroalgae, which often grow through a “boom-and-bust” cycle; biomass
peaks in spring and then precipitously declines in mid- to late-summer, likely because
high temperatures and self-shading negatively affect algal productivity (Peckol & Rivers
1995, McGlathery et al. 1997, Valiela et al. 1997, Bintz et al. 2003, Brush & Nixon
2003). These blooms, which can attain biomass up to 10 kg wet weight m-2 (Morand &
Briand 1996), have been described in a variety of temperate and tropical locations (Harlin
& Thornemiller 1981, Lapointe 1989, Lavery & Mccomb 1991, Sfriso et al. 1992, Valiela
et al. 1997, Goshorn et al. 2001, McGlathery et al. 2001, Villares & Carballeira 2003).
Macroalgae may directly and indirectly affect the ability of coastal bays to serve as
nutrient filters by regulating the flows of carbon (C) and nitrogen (N) through the system,
whether through uptake, storage, release, transformation, or competition with other
autotrophs.

6
Macroalgae are extremely efficient at nutrient uptake and can store a significant
fraction of nutrients (Thybo-Christesen et al. 1993, McGlathery et al. 1996, Pedersen et
al. 2004). In Waquoit Bay, MA, macroalgal stored N was of the same magnitude as the
annual N load from the watershed (Valiela et al. 1997). Thybo-Christesen and colleagues
(1993) found that macroalgae in a shallow Danish bay took up ~95% of available N and
85% of available phosphorus. The ability of macroalgae to take up and store nutrients in
excess of their growth demands is so effective that waters of heavily loaded coastal
systems can actually appear oligotrophic (low nutrient, low chlorophyll concentrations),
when macroalgae are present (Thybo-Christesen et al. 1993, Peckol et al. 1994). Due to
the capabilities of macroalgae to efficiently sequester nutrients and to grow in dense
accumulations, it is expected that ephemeral macroalgae may compete with BMA for
nutrients and/or light (Valiela et al. 1997, McGlathery et al. 2001, Tyler et al. 2003).
BMA and autotrophic bacteria (e.g. cyanobacteria) are limited by bottom-up
forcings such as light and nutrients (Hillebrand & Sommer 2000, Stutes et al. 2006) as
well as top-down control by grazers; however, light availability is thought to be the
primary factor regulating BMA community growth (Heip et al. 1995). Macroalgae have
been shown to “self-shade;” light is attenuated within the layers of an algal mat (Peckol
& Rivers 1996), affecting overall mat metabolism (Brush & Nixon 2003). Self-shading
has been suggested as a possible cause for mid-summer macroalgal mat crashes that have
been observed in numerous systems (e.g. Sfriso et al. 1992, McGlathery et al. 2001).
Thus, shading of plants such as seagrass below dense macroalgal mats has been
suggested as a mechanism by which macroalgal blooms have contributed to global

7
seagrass declines (Hauxwell et al. 2001). It is also likely that shading of the sediment
surface by macroalgae will reduce BMA production.
Since macroalgae reside at the sediment surface, they can potentially influence
nutrients available at the sediment-water interface, a zone of intense biogeochemical
activity, mediated by autotrophic and heterotrophic microbes. However, to date, few
studies have focused directly on the influence of macroalgae on nutrient cycling within
the sediment microbial community. Benthic flux studies have revealed that macroalgae
play a major role regulating nutrient cycling at the sediment surface. For example,
McGlathery and colleagues (2001) used dissolved inorganic carbon (DIC) fluxes to
document that BMA production increased following a macroalgal decline, suggesting
competition between macroalgae and BMA, possibly for light and/or nutrients. Dalsgaard
(2003) measured lower denitrification rates in the presence of macroalgae, presumably
because macroalgae out-competed sediment denitrifiers for water column nitrate. Tyler
and colleagues (2003) found that macroalgal uptake resulted in an uncoupling of
sediment-water column interactions by controlling the exchange of dissolved inorganic
nitrogen (DIN) as well as dissolved organic nitrogen (DON) between the sediments and
water column. While measurements of benthic fluxes provide information about the net
results of processes occurring at the sediment-water interface, it has been difficult to
further describe the microbial “black box” within the sediments using flux data alone.
My work builds upon these studies to more explicitly track C and N within the
sediments. In Chapter 3, I examined the influence of benthic micro- and macroalgae on
C and N storage within the sediments, and in Chapter 4, I directly tracked the uptake and
cycling of C and N by BMA and sediment bacteria in the presence and absence of living

8
macroalgae. At the sediment-water interface of these shallow systems, nutrients in the
water column as well as the sediment porewater are available for uptake by benthic
autotrophs. Thus, for the experiment that I describe in Chapters 3 and 4, I designed an
experimental apparatus that allowed the introduction of dissolved nutrients
simultaneously via the surface water and porewater. In Chapter 2, I describe the
“perfusionator,” an innovative apparatus that allows continual long-term perfusion of
sediment porewater with dissolved tracers in a mesocosm or a field setting.
Fate of macroalgal biomass
By definition, ephemeral macroalgal blooms cannot serve as a permanent
reservoir for C and N. Consequently, understanding the fate of macroalgal C and N
following a die-off, rather than the uptake of the nutrients alone, is critical when
evaluating nutrient cycling processes within coastal bays. Studies of macroalgal bloom
decay have demonstrated rapid breakdown of biomass, resulting in release of both
inorganic and organic nutrients to the water column (Buchsbaum et al. 1991, Tyler et al.
2001, Castaldelli et al. 2003, Garcia-Robledo et al. 2008), supporting phytoplankton and
bacterial metabolism (Sfriso et al. 1992, Valiela et al. 1997, McGlathery et al. 2001,
Nedergaard et al. 2002).
Fewer studies have focused on macroalgal decay within the sediments
(Nedergaard et al. 2002, Lomstein et al. 2006, Rossi 2007, Garcia-Robledo et al. 2008),
where heterotrophic bacterial densities are significantly higher than in the water column
(Deming & Baross 1993, Schmidt et al. 1998, Ducklow 2000). In addition, most of the

9
sediment studies have been conducted in low or no light environments even though light
is typically available to shallow sediments where macroalgal die-offs occur, and sediment
biogeochemistry is largely affected by BMA activity (Underwood & Kromkamp 1999).
While nutrients associated with senescent macroalgal blooms are recycled and can have a
positive feedback on phytoplankton production in the water column, nutrients released
during macroalgal decay in the sediments may support BMA and bacterial production,
which intercept the return of nutrients to the overlying water column. If shallow-water
sediments, thus, behave as a nutrient “filter” the response by phytoplankton may be
reduced, and benthic production could effectively buffer the system from further
eutrophication. In Chapter 5, I tracked macroalgal C and N after a simulated macroalgal
die-off in order to better quantify the input and retention of macroalgae-associated
nutrients in the sediments.
Approach
In order to determine how ephemeral macroalgal blooms altered sediment organic
matter (C, N pools), I used a number of geochemical tools to distinguish the various
organic matter sources to the sediments. Stable isotopes and biomarkers are tools that
can be used separately or in combination to study the cycling of organic matter. Natural
abundance levels of stable isotopes are useful for discriminating between sources in
systems characterized by a limited number of sources, each with distinct stable isotopic
signatures (e.g. Cloern et al. 2002). Deliberate addition of stable isotope labels is another
approach for following the flow of specific sources through transformation pathways. In

10
this approach, a substrate that is highly enriched in the heavier isotope is added to the
system. This “label” is then tracked through various pools to quantify the flow of the
label through the system. Laboratory and field-based isotope label additions have lent
insight into a variety of nutrient cycling processes (e.g. Bronk et al. 1994, Middelburg et
al. 2000, Naldi & Wheeler 2002, Tobias et al. 2003, Veuger et al. 2007). I used stable
isotope tracers in Chapter 2 to test the performance of the perfusionator apparatus at
delivering dissolved tracers to the microbial community living at the sediment surface
and in Chapters 4 and 5 to track C and N uptake into bulk sediments.
Biomarkers are organic compounds that have source specificity due to inherent
structural characteristics and, like stable isotopes, often allow resolution between organic
matter sources (Killops & Killops 1993). Lipids, a class of biomarkers that includes fatty
acids and sterols, have been used in a number of systems to determine sediment organic
matter sources over various temporal and spatial scales (e.g. Canuel & Martens 1993,
Yunker & Macdonald 1995, Zimmerman & Canuel 2000, Schefuss et al. 2004).
Phospholipid-linked fatty acids (PLFA) are particularly useful for studying active
microbial populations because they are a component of both bacterial and eukaryotic cell
walls and they represent viable organic matter since they turn over rapidly after cell death
(Parkes 1987). Hydrolyzable amino acids (HAA), a class of organic compounds found in
proteins, are often used to describe the degradation state of organic matter (Dauwe &
Middelburg 1998); however, their application as specific biomarkers is limited due to low
source specificity. A noted exception is that amino acids can be present as D- and L-
stereoisomers, and D-AA can be used as bacterial biomarkers since they are only

11
produced by bacteria. In Chapter 3, I combined bulk and molecular-level (biomarker)
analyses to characterize the sediment organic matter of my experimental system.
Compound-specific isotope analysis (CSIA), measuring the isotopic composition
of a particular biomarker, is perhaps one of the most powerful geochemical tools
available to unambiguously trace C and N through a system. CSIA is commonly used in
microbial ecology because it provides the best tool for tracing C and N into microbial
biomarkers (Bouillon & Boschker 2006); quantitative separation of bacteria and BMA
from sediments is otherwise impossible. Deliberately adding isotopic tracers and
following them into biomarkers affords the possibility to directly link microbial identity
(biomarker) with activity (isotope assimilation). CSIA of PLFA, and recently, HAA,
have allowed for explicit tracking of C and N into specific pools within the sediment
microbial community (Boschker & Middelburg 2002, Veuger et al. 2005, Veuger et al.
2007). I applied the same methodology to my experiments presented in Chapters 4 and 5
to measure the uptake and cycling of C and N by the sediment microbial community.
Study Sites
This study focused primarily on Hog Island Bay, Virginia, a coastal lagoon
located along the Delmarva Peninsula, within the Virginia Coast Reserve, a Long-Term
Ecological Research site. The coastal bays along the Delmarva Peninsula are typical of
temperate lagoons along the U.S. coast. They are shallow, on average less than 2 m deep
at mean low water, and are characterized by benthic autotrophs such as seagrass,
macroalgae, and BMA (Goshorn et al. 2001, McGlathery et al. 2001, Volkman et al.

12
2008). The coastal lagoons of the Delmarva Peninsula exist along a eutrophication
gradient (Giordano et al. Submitted), with greater development and agriculture
contributing to elevated nutrient loads in the northern lagoons compared to the southern
lagoons. Hog Island Bay is located at the less degraded end of that gradient, with lower
nutrient (N) loadings (14 kg N ha-1 y-1; Anderson et al. In press) due to less development
(Stanhope et al. 2009). As a result, macroalgae are present locally and only dominant
during brief portions of the year (McGlathery et al. 2001). In chapter 5, as a contrast to
Hog Island Bay, sediments and macroalgae were also collected from Isle of Wight Bay,
Maryland, located at the more degraded end of the eutrophication gradient, with N loads
of 65 kg N ha-1 y-1 (Boynton et al. 1996) due to extensive development within its
watershed and inputs from the highly impacted St. Martin’s River (Wazniak et al. 2004).
As a result, ephemeral macroalgal blooms are present in high densities in Isle of Wight
Bay, and it ranks among Maryland’s more degraded lagoons (Wazniak et al. 2004).

13
Literature Cited
Anderson IC, Stanhope JW, Hardison AK, McGlathery KJ (In press) Sources and fates of nitrogen in Virginia Coastal Bays. In: Kennish MJ, Paerl HW (eds) Coastal Lagoons: Critical Habitats of Environmental Change. Taylor and Francis
Bintz JC, Nixon SW, Buckley BA, Granger SL (2003) Impacts of temperature and nutrients on coastal lagoon plant communities. Estuaries 26:765-776
Boschker HTS, Middelburg JJ (2002) Stable isotopes and biomarkers in microbial ecology. FEMS Microbiology Ecology 40:85-95
Bouillon S, Boschker HTS (2006) Bacterial carbon sources in coastal sediments: a cross-system analysis based on stable isotope data of biomarkers. Biogeosciences 3:175-185
Bowen JL, Valiela I (2001) The ecological effects of urbanization of coastal watersheds: historical increases in nitrogen loads and eutrophication of Waquoit Bay estuaries. Canadian Journal of Fish and Aquatic Science 58:1489-1500
Boynton WR, Hagy JD, Murray L, Stokes C, Kemp WM (1996) A comparative analysis of eutrophication patterns in a temperate coastal lagoon. Estuaries 19:408-421
Bronk DA, Glibert PM, Ward BB (1994) Nitrogen Uptake, Dissolved Organic Nitrogen Release, and New Production. Science 265:1843-1846
Brush MJ, Nixon SW (2003) Biomass layering and metabolism in mats of the macroalga Ulva lactuca L. Estuaries 26:916-926
Buchsbaum R, Valiela I, Swain T, Dzierzeski M, Allen S (1991) Available and refractory nitrogen in detritus of coastal vascular plants and macroalgae. Marine Ecology Progress Series 72:131-143
Canuel EA, Martens CS (1993) Seasonal-Variations in the Sources and Alteration of Organic-Matter Associated with Recently-Deposited Sediments. Organic Geochemistry 20:563-577
Castaldelli G, Welsh DT, Flachi G, Zucchini G, Colombo G, Rossi R, Fano EA (2003) Decomposition dynamics of the bloom forming macroalga Ulva rigida C. Agardh determined using a C-14-carbon radio-tracer technique. Aquatic Botany 75:111-122
Cloern JE (2001) Our evolving conceptual model of the coastal eutrophication problem. Marine Ecology Progress Series 210:223-253

14
Cloern JE, Canuel EA, Harris D (2002) Stable carbon and nitrogen isotope composition of aquatic and terrestrial plants of the San Francisco Bay estuarine system. Limnology and Oceanography 47:713-729
Dalsgaard T (2003) Benthic primary production and nutrient cycling in sediments with benthic microalgae and transient accumulation of macroalgae. Limnology and Oceanography 48:2138-2150
Dauwe B, Middelburg JJ (1998) Amino acids and hexosamines as indicators of organic matter degradation state in North Sea sediments. Limnology and Oceanography 43:782-798
Deegan LA, Wright A, Ayvazian SG, Finn JT, Golden H, Rand Merson R, Harrison J (2002) Nitrogen loading alters seagrass ecosystem structure and support of higher trophic levels. Aquatic Conservation: Marine and Freshwater Ecosystems 12:193-212
Deming JW, Baross JA (1993) The Early Diagenesis of Organic Matter: Bacterial Activity. In: Engel MH, Macko SA (eds) Organic Geochemistry. Plenum Press, New York, p 119-144
Duarte CM (1995) Submerged Aquatic Vegetation in Relation to Different Nutrient Regimes. Ophelia 41:87-112
Ducklow H (2000) Bacterial Production and Biomass in the Oceans. In: Kirchman DL (ed) Microbial Ecology of the Oceans. Wiley-Liss, Inc., New York, p 85-120
Garcia-Robledo E, Corzo A, de Lomas JG, van Bergeijk SA (2008) Biogeochemical effects of macroalgal decomposition on intertidal microbenthos: a microcosm experiment. Marine Ecology-Progress Series 356:139-151
Giordano JCP, Brush MJ, Anderson IC (Submitted) Extending the Delmarva eutrophication gradient into Virginia's coastal lagoons: watershed modeling and nitrogen source tracking. Estuaries and Coasts
Goshorn D, McGinty M, Kennedy C, Jordan C, Wazniak C, Schwenke K, Coyne K (2001) An examination of benthic macroalgae communities as indicators of nutrients in middle atlantic coastal estuaries -- Maryland component Final Report 1998-1999, Maryland Department of Natural Resources, Annapolis, MD
Harlin MM, Thornemiller M (1981) Nutrient enrichment of seagrass beds in a Rhode Island coastal lagoon. Marine Biology 65:221.
Hauxwell J, Cebrian J, Furlong C, Valiela I (2001) Macroalgal canopies contribute to eelgrass (Zostera marina) decline in temperate estuarine ecosystems. Ecology 82:1007-1022

15
Hauxwell J, Cebrian J, Valiela I (2003) Eelgrass Zostera marina loss in temperate estuaries: relationship to land-derived nitrogen loads and effect of light limiataion imposed by algae. Marine Ecology Progress Series 247:59-73
Hauxwell J, McClelland J, Behr PJ, Valiela I (1998) Relative importance of grazing and nutrient controls of macroalgal biomass in three temperate shallow estuaries. Estuaries 21:347-360
Heip C, Goosen NK, Herman P, Kromkamp JC, Middelburg JJ, Soetaert K (1995) Production and consumption of biological particles in temperate tidal estuaries. Oceanography and Marine Biology Annual Reviews 33
Hillebrand H, Sommer U (2000) Marine microbenthic community structure regulated by nitrogen loading and grazing pressure. Marine Ecology Progress Series 204:27-38
Holmquist JG (1997) Disturbance and gap formation in a marine benthic mosaic: influence of shifting macroalgal patches on seagrass structure and mobile invertebrates. Marine Ecology-Progress Series 158:121-130
Howarth RW, Anderson D, Cloern JE, Elfring C, Hopkinson C, Lapointe B, Malone T, Marcus N, McGlathery KJ, Sharpley A, Walker D (2000) Nutrient pollution of coastal rivers, bays, and seas. Issues in Ecology 7:1-14
Killops SD, Killops VJ (1993) An Introduction to Organic Geochemistry, Vol. John Wiley & Sons, Inc., New York
Lapointe BE (1989) Macroalgal Production and Nutrient Relations in Oligotrophic Areas of Florida Bay. Bulletin of Marine Science 44:312-323
Lavery PS, Mccomb AJ (1991) Macroalgal Sediment Nutrient Interactions and Their Importance to Macroalgal Nutrition in a Eutrophic Estuary. Estuarine Coastal and Shelf Science 32:281-295
Lomstein BA, Guldberg LB, Neubauer ATA, Hansen J, Donnelly A, Herbert RA, Viaroli P, Giordani G, Azzoni R, de Wit R, Finster K (2006) Benthic decomposition of Ulva lactuca: A controlled laboratory experiment. Aquatic Botany 85:273-283
McGlathery K, Sundback K, Anderson I (2007) Eutrophication in shallow coastal bays and lagoons: the role of plants in the coastal filter. Marine Ecology-Progress Series 348:1-18.
McGlathery KJ, Anderson IC, Tyler AC (2001) Magnitude and variability of benthic and pelagic metabolism in a temperate coastal lagoon. Marine Ecology-Progress Series 216:1-15

16
McGlathery KJ, Krause-Jensen D, Rysgaard S, Christensen PB (1997) Patterns of ammonium uptake within dense mats of the filamentous macroalga Chaetomorpha linum. Aquatic Botany 59:99-115
McGlathery KJ, Pedersen MF, Borum J (1996) Changes in intracellular nitrogen pools and feedback controls on nitrogen uptake in Chaetomorpha linum (chlorophyta). Journal of Phycology 32:393-401
Middelburg JJ, Barranguet C, Boschker HTS, Herman PMJ, Moens T, Heip CHR (2000) The fate of intertidal microphytobenthos carbon: An in situ C-13-labeling study. Limnology and Oceanography 45:1224-1234
Morand P, Briand X (1996) Excessive growth of macroalgae: A symptom of environmental disturbance. Botanica Marina 39:491-516
Naldi M, Wheeler PA (2002) N-15 measurements of ammonium and nitrate uptake by Ulva fenestrata (chlorophyta) and Gracilaria pacifica (rhodophyta): Comparison of net nutrient disappearance, release of ammonium and nitrate, and N-15 accumulation in algal tissue. Journal of Phycology 38:135-144
Nedergaard RI, Risgaard-Petersen N, Finster K (2002) The importance of sulfate reduction associated with Ulva lactuca thalli during decomposition: a mesocosm approach. Journal of Experimental Marine Biology and Ecology 275:15-29
Nielsen SL, Enriquez S, Duarte CM, SandJensen K (1996) Scaling maximum growth rates across photosynthetic organisms. Functional Ecology 10:167-175
Nixon SW (1995) Coastal Marine Eutrophication - a Definition, Social Causes, and Future Concerns. Ophelia 41:199-219
NRC (2000) National Research Council. Clean coastal waters: understanding and reducing the effects of nutrient pollution, Vol. National Academy Press, Washington, DC
Parkes RJ (1987) Analysis of microbial communities within sediments using biomarkers. In: Hetcher M, Gray RTG, Jones JG (eds) Ecology of Microbial Communities. Cambridge University Press, Cambridge, p 147-177
Peckol P, Demeoanderson B, Rivers J, Valiela I, Maldonado M, Yates J (1994) Growth, Nutrient-Uptake Capacities and Tissue Constituents of the Macroalgae Cladophora-Vagabunda and Gracilaria-Tikvahiae Related to Site-Specific Nitrogen Loading Rates. Marine Biology 121:175-185
Peckol P, Rivers JS (1995) Physiological-Responses of the Opportunistic Macroalgae Cladophora-Vagabunda (L) Vandenhoek and Gracilaria-Tikvahiae (Mclachlan) to Environmental Disturbances Associated with Eutrophication. Journal of Experimental Marine Biology and Ecology 190:1-16

17
Peckol P, Rivers JS (1996) Contribution by macroalgal mats to primary production of a shallow embayment under high and low nitrogen-loading rates. Estuarine Coastal and Shelf Science 43:311-325
Pedersen MF, Nielsen SL, Banta GT (2004) Interactions between vegetation and nutrient dynamics in coastal marine ecosystems: An introduction. In: Nielsen SL, Banta GT, Pedersen MF (eds) Estuarine Nutrient Cycling: The Influence of Primary Producers. Kluwer, Dordrecht
Raffaelli D (2000) Interactions between macro-algal mats and invertebrates in the Ythan estuary, Aberdeenshire, Scotland. Helgoland Marine Research 54:71-79
Raffaelli DG, Raven JH, Poole LJ (1998) Ecological impact of green macroalgal blooms. Oceanography and Marine Biology - an Annual Review 36
Rossi F (2007) Recycle of buried macroalgal detritus in sediments: use of dual-labelling experiments in the field. Marine Biology 150:1073-1081
Sand-Jensen K, Borum J (1991) Interactions among phytoplankton, periphyton, and macrophytes in temperate freshwaters and estuaries. Aquatic Botany 41:137-175
Sand-Jensen K, Nielsen SL (2004) Estuarine Primary Producers. In: Nielsen SL, Banta GT, Pedersen M (eds) Estuarine Nutrient Cycling: The Influence of Primary Producers. Kluwer Academic Publishers, Netherlands, p 17-57
Schefuss E, Versteegh GJM, Jansen JHF, Damste JSS (2004) Lipid biomarkers as major source and preservation indicators in SE Atlantic surface sediments. Deep-Sea Research Part I-Oceanographic Research Papers 51:1199-1228
Schmidt JL, Deming JW, Jumars PA, Keil RG (1998) Constancy of bacterial abundance in surficial marine seciments. Limnology and Oceanography 43:976-982
Sfriso A, Pavoni B, Marcomini A, Raccanelli S, Orio AA (1992) Particulate Matter Deposition and Nutrient Fluxes onto the Sediments of the Venice Lagoon. Environmental Technology 13:473-483
Stanhope JW, Anderson IC, Reay WG (2009) Base flow nutrient discharges from lower Delmarva Peninsula watersheds of Virginia. Journal of Environmental Quality 38:2070-2083
Stutes AL, Cebrian J, Corcoran AA (2006) Effects of nutrient enrichment and shading on sediment primary production and metabolism in eutrophic estuaries. Marine Ecology-Progress Series 312:29-43
Thybo-Christesen M, Rasmussen MB, Blackburn TH (1993) Nutrient Fluxes and Growth of Cladophora-Sericea in a Shallow Danish Bay. Marine Ecology-Progress Series 100:273-281

18
Tobias CR, Cieri M, Peterson BJ, Deegan LA, Vallino J, Hughes J (2003) Processing watershed-derived nitrogen in a well-flushed New England estuary. Limnology and Oceanography 48:1766-1778
Tyler AC, McGlathery KJ, Anderson IC (2001) Macroalgae mediation of dissolved organic nitrogen fluxes in a temperate coastal lagoon. Estuarine Coastal and Shelf Science 53:155-168
Tyler AC, McGlathery KJ, Anderson IC (2003) Benthic algae control sediment-water column fluxes of organic and inorganic nitrogen compounds in a temperate lagoon. Limnology and Oceanography 48:2125-2137
Underwood GJC, Kromkamp J (1999) Primary production by phytoplankton and microphytobenthos in estuaries. Advances in Ecological Research, Vol 29 29:93-153
Valiela I, Cole ML (2002) Comparative evidence that salt marshes and mangroves may protect seagrass meadows from land-derived nitrogen loads. Ecosystems 5:92-102
Valiela I, Foreman K, Lamontagne M, Hersh D, Costa J, Peckol P, Demeoandreson B, Davanzo C, Babione M, Sham CH, Brawley J, Lajtha K (1992) Couplings of Watersheds and Coastal Waters - Sources and Consequences of Nutrient Enrichment in Waquoit Bay, Massachusetts. Estuaries 15:443-457
Valiela I, McClelland J, Hauxwell J, Behr PJ, Hersh D, Foreman K (1997) Macroalgal blooms in shallow estuaries: Controls and ecophysiological and ecosystem consequences. Limnology and Oceanography 42:1105-1118
Veuger B, Eyre BD, Maher D, Middelburg JJ (2007) Nitrogen incorporation and retention by bacteria, algae, and fauna in a subtropical intertidal sediment: An in situ N-15-labeling study. Limnology and Oceanography 52:1930-1942
Veuger B, Middelburg JJ, Boschker HTS, Houtekamer M (2005) Analysis of N-15 incorporation into D-alanine: A new method for tracing nitrogen uptake by bacteria. Limnology and Oceanography-Methods 3:230-240
Villares R, Carballeira A (2003) Seasonal variation in the concentrations of nutrients in two green macroalgae and nutrient levels in sediments in the Rias Baixas (NW Spain). Estuarine Coastal and Shelf Science 58:887-900
Volkman JK, Revill AT, Holdsworth DG, Fredericks D (2008) Organic matter sources in an enclosed coastal inlet assessed using lipid biomarkers and stable isotopes. Organic Geochemistry 39:689-710
Wazniak C, Hall M, Cain C, Wilson D, Jesien R, Thomas J, Carruthers T, dennison W (2004) State of the Maryland Coastal Bays, Maryland Department of Natural Resources, Annapolis, MD

19
Yunker MB, Macdonald RW (1995) Composition and Origins of Polycyclic Aromatic-Hydrocarbons in the Mackenzie River and on the Beaufort Sea Shelf. Arctic 48:118-129
Zimmerman AR, Canuel EA (2000) A geochemical record of eutrophication and anoxia in Chesapeake Bay sediments: anthropogenic influence on organic matter composition (vol 69, pg 117, 2000). Marine Chemistry 72:77-77

20
CHAPTER 2: AN EXPERIMENTAL APPARATUS FOR LABORATORY AND
FIELD-BASED PERFUSION OF SEDIMENT POREWATER WITH DISSOLVED
TRACERS
Amber Hardison1, Craig Tobias2, Jennifer Stanhope1, Elizabeth Canuel1, Iris Anderson1
Submitted to Estuaries and Coasts, September 2009
1Virginia Institute of Marine Sciences
College of William and Mary
P.O. Box 1346
Gloucester Point, VA 23062
2Department of Marine Sciences
University of Connecticut
Groton, CT 06340

21
Abstract
The water-sediment interface is a dynamic zone where the benthic and pelagic
environments are linked through exchange and recycling of organic matter and nutrients.
However, it is often difficult to measure rate processes in this zone. To that end, we
designed an experimental apparatus for continuous and homogenous perfusion of
sediment porewater with dissolved conservative (SF6, Rhodamine WT dye) and isotopic
(H13CO3- and 15NH4
+) tracers to study nitrogen and carbon cycling by the sediment
microbial community of shallow illuminated sediments. The perfusionator consists of a
60 cm I.D. x 60 cm height cylinder that includes a reservoir for porewater at the base of
the sediment column. Porewater amended with conservative and stable isotopic tracers
was pumped through a mixing reservoir and upward through the overlying sediments.
We tested the perfusionator in a laboratory setting, as part of an outdoor mesocosm array,
and buried in coastal sediments. Conservative and isotopic tracers demonstrated that the
porewater tracers were distributed homogenously through the sediment column in all
settings. The perfusionator was designed to introduce dissolved stable isotope tracers,
but is capable of delivering any dissolved ionic, organic, or gaseous constituent. We see
potentially wide application of this technique in the aquatic and marine sciences in
laboratory and field settings.
Key Words: stable isotopes, mesocosms, porewater advection, water-sediment interface, sediment column

22
Introduction
Shallow coastal systems are characterized by sediment-water exchange between benthic
and pelagic compartments. Understanding the physical and biological mechanisms
responsible for this exchange is critical for describing how these ecosystems currently
function and predicting how their function may change in response to future
environmental change. Porewater within subtidal sediments contains a suite of dissolved
substances (e.g. nutrients, organic matter, gases, toxins, salts, metals) that can play a
critical role in regulating metabolic processes taking place within the sediments and
resultant fluxes to the overlying water. Sediment porewater characterization has been the
focus of research for decades, and recently developed technologies (e.g. micro-electrodes,
-optodes, and –biosensors; see Stockdale et al. 2009, Reimers 2007, for recent reviews)
now allow for routine analysis of micro-scale spatial and temporal heterogeneity of
dissolved substances within the sediments, often with minimal sediment disturbance.
However, in order to evaluate the role that dissolved porewater constituents play in
sediment biogeochemical processes, explicit tracing of solutes/nutrients by experimental
manipulation must be accomplished to identify mechanisms underlying observed profiles
and fluxes.
A number of laboratory and field-based methods have been applied to alter the
concentrations of dissolved substances in porewaters and/or to introduce tracers. Direct
introduction of dissolved solutes to sediments in the laboratory have most often involved
amended slurries (Parkes et al. 1993; Trimmer et al. 2003; Veuger et al. 2005) or direct
syringe injections of tracer into small sediment cores (Anderson et al. 2003; Boschker et

23
al. 1998; Bühring et al. 2006). Field-based introduction of tracers to the sediments have
included one-time surface spray application (Middelburg et al. 2000) or syringe injections
(Veuger et al. 2006, 2007) into intertidal sediments at low tide. When possible (e.g. with
nutrients, iron, organic matter), the solutes have been added as particulates that are
sprinkled onto or buried within the sediment surface and subsequently dissolve (Armitage
et al. 2006; Enoksson 1993; Franke et al. 2006; Mutchler et al. 2004). While suitable for
certain studies of nutrient cycling and trophic transfer, these methods offer a number of
challenges. Slurries, for example, disrupt naturally occurring physical, chemical, and
biological gradients in the sediments, which may confound interpretation of results.
Injection into sediment cores or addition of particulate material directly to the sediment
surface likely results in patchy distribution of the dissolved substances within the
porewater and function only as a short-term amendment. Spray-on or syringe injections
into sediments provide reasonable measurements of rates operating on short timescales in
laboratory or field studies involving intertidal sediments, but they are not amenable to use
in subtidal systems, because sediments are never exposed.
As an alternative, introduction of dissolved constituents by advection of amended
porewater through sediment cores (columns) has been applied in numerous physical and
biogeochemical studies (Girguis et al. 2005; McGlathery et al. 1998; Polerecky et al.
2005; Rao et al. 2007). With this technique, the dissolved constituents are likely more
homogenously distributed in the sediment porewaters than the previous techniques allow,
but this approach is limited to small-scale core studies. Further, the unidirectional flow
through the sediments in the laboratory may not best represent the complex circulation

24
patterns present in some systems, which is essential for maintaining reactive redox
interfaces (Huettel et al. 1996; Janssen et al. 2005; Reimers et al. 2004). This study builds
on past designs of sediment advection columns to create a versatile apparatus that
delivers porewater tracer through sediments at expanded spatial and temporal scales for
the purpose of examining sediment biogeochemical cycles.
The purpose of this study was to focus on the microbial community living at the
sediment-water interface of shallow subtidal sediments. This complex community of
autotrophic (e.g. benthic microalgae, BMA) and heterotrophic (e.g. bacteria) organisms
can assimilate nutrients and organic matter from surface water and porewater sources
(Cahoon 1999; MacIntyre et al. 1996; Veuger et al. 2007). Developing mechanistic
models of benthic-pelagic coupling in this zone depends on identifying sources of carbon
(C) and/or nitrogen (N) for sediment autotrophs and heterotrophs, and tracking the
processing and recycling through those compartments. Because it is difficult to separate
microbial biomass from the sediment matrix, recent studies have adopted the use of stable
isotopes incorporated into microbial biomarkers as a tool for tracking nutrients
supporting sediment microbial production in the BMA and bacterial compartments
(Boschker et al. 1998; Boschker and Middelburg 2002; Tobias et al. 2003). Tracking C
and N uptake from the water column by sediment microbes using isotopes has been
accomplished by a variety of approaches including laboratory core incubations
(Dornblaser et al. 1994; Jönsson 1991; Nielsen 1992) and small (Hughes et al. 2000;
Kaldy et al. 2006) and large-scale (Gribsholt et al. 2007; Tobias et al. 2003a) field
studies. However, porewater is also an important source of dissolved nutrients and

25
organic matter that support sediment microbes, and quantifying the exchange of C and N
between porewater and the sediment microbial community is a key step towards
understanding ecosystem functions of shallow sediments. Given the methodological
challenges posed by existing porewater manipulation techniques, we developed an
approach to more accurately address microbial uptake of porewater substrates. Our
approach involves perfusing intact sediments with isotopically-labeled porewater,
resulting in continuous, uniform introduction of labeled constituents to the sediment
microbial community. This approach provides a novel method for addition of dissolved
tracers via the porewater. To address the need for larger-scale laboratory and field
experiments, we used a large mesocosm, which provided a balance between more
realistic experimental conditions and our need to contain the isotopic tracers to achieve
adequate enrichment of target pools. Here we describe the “perfusionator”, an innovative
apparatus that allows continual long-term perfusion of sediment porewater with dissolved
tracers in a mesocosm or a field setting.
Methods
Perfusionator Design
The perfusionator was fabricated from a cylindrical translucent fiberglass tank (60 cm
diameter x 60 cm height; Solar Components, Inc.) with a false bottom (Fig. 1). At the
base of the tank was a 23-L reservoir for storage of feed water, or, seawater amended
with dissolved tracers. This reservoir was capped by a false bottom, and sediment and

26
water were added above the false bottom. Feed water was stored in an external tank and
supplied to the reservoir through a standpipe. Water from the reservoir was subsequently
perfused up through the sediment column, providing a mechanism for delivery of
dissolved constituents to the water-sediment interface.
The false bottom was a perforated (0.64 cm hole diameter) PVC disc (0.32 cm thick)
covered with silt mesh (Geotextile, 50 US Standard sieve opening) which provided a
filter through which only water and dissolved constituents could pass. The false bottom
was supported by seven 10.2 cm tall columns of 7.6 cm I.D. PVC pipe, perforated to
enable water circulation within the reservoir. The seal between the false bottom and the
tank walls was made water-tight by sandwiching the edge of the perforated plastic disc
inside a ring of flexible insulation pipe foam (1.6 cm I.D. x 6.4 cm O.D.) before pressing
the disc into place. This seal was also lined with non-toxic 100% silicone sealant above
and below the disc/foam junction with the wall.
Seawater amended with dissolved tracers (isotopically-labeled nutrients: ammonium as
(15NH4)2SO4; bicarbonate as NaH13CO3) was continuously introduced into the
perfusionator reservoir from an external source via a PVC standpipe (1.3 cm I.D.) which
extended ~125 cm vertically from the false bottom. The bottom of the standpipe was
connected by an elbow joint to porous PVC pipe (1.3 cm I.D.; 2.5 mm screen) situated on
the floor of the reservoir. The porous PVC was configured in a cross-shape to distribute
the feed water across the length of the tank, allowing for controlled introduction of feed
water into the reservoir (Fig. 1). All PVC joints were sealed with Teflon tape and PVC

27
glue. Depending on the experimental requirements, the rate of feed water delivery into
the standpipe could be regulated via a variety of methods such as gravimetric flow, a
medical grade IV dripper, or a peristaltic pump. Before adding sediments to the tank, we
found that it was essential to fill the perfusionator reservoir and cross-pipe completely
with seawater to avoid trapping air inside the perfusionator which would subsequently be
pumped through the sediments.
To ensure adequate mixing of the feed water within the reservoir before perfusion
through the sediments, an electric-powered mini-jet pump (Aquatic Ecosystems, Inc.)
was installed to circulate the reservoir water. In case of pump failure, a second mini-jet
pump was included, and the pumps were alternated every three days. This minimized the
potential impact of a broken pump since pumps could not be replaced without disruption
of the sediments during the experiment. The mini-pumps were encased in 7.6 cm I.D.
PVC wellscreen (2.5 mm screen) closed on both ends except at the output nozzle with
Cap Plugs and wrapped in silt mesh to minimize any sediment introduction through the
intake, which would decrease the lifetime of the pumps.
Perfusionator testing
We conducted a series of tests to determine the effectiveness of the perfusionator at
delivering dissolved tracers homogenously through the sediment porewater. We used
both conservative (Rhodamine WT dye (RWT), sulfur hexafluoride (SF6)) and non-

28
conservative (H13CO3-, 15NH4
+) tracers in a laboratory setting, an outdoor mesocosm
array, and in subtidal sediments in the field.
Laboratory
We tested the perfusionator system in the laboratory initially to ensure homogenous
introduction of the feed water into the sediments by tracking RWT dye as it flowed
through the perfusionator from an external feed tank. RWT is a fluorescent dye that is
used commonly as a hydrodynamic surface water tracer (Lin et al. 2003; Shiau et al.
1993; Smart and Laidlaw 1977). The perfusionator was filled with rinsed all purpose
play sand to a depth of 16 cm. The RWT dye solution was introduced to the
perfusionator reservoir by an IV dripper at a drip rate equivalent to 8.5 L porewater day-1,
or a porewater residence time of ~2.7 days. Porewater (5 mL per sample) was collected
from each of nine locations across the sediment surface over six days. The sampling
locations were divided into “edge” and “center” positions to account for edge effects that
could result from a leaky seal at the false bottom-wall interface. Each location was
sampled at 2 depths (6 cm and 15 cm below the sediment surface) using a stainless steel
push-point sampler (2 cm screen; MHE Products) connected to a peristaltic pump (6 mL
min-1). Surface water samples were also collected each time porewater was sampled.
Samples were collected in glass culture tubes, covered with Parafilm and refrigerated
until analysis.
Outdoor mesocosm array

29
The second application of the perfusionator was a stable isotope tracer experiment set up
in a flow-through outdoor mesocosm array located at the Virginia Institute of Marine
Science (VIMS) Eastern Shore Lab in Wachapreague, Virginia. We tested the
effectiveness of the perfusionator at delivering dissolved tracers homogenously to the
sediment surface using both conservative (SF6) and non-conservative (H13CO3-, 15NH4
+)
tracers. The perfusionators were filled with sediments (fine sand) to a depth of 15 cm.
Sediments were collected using multiple sediment cores from a shallow subtidal field site
in Hog Island Bay, VA, and then transferred directly to the perfusionators, taking care to
minimize disturbance of the natural vertical sediment horizons. The sediments contained
macrofauna such as worms and clams as indicated by the presence of burrows, siphons,
tubes, and fecal pellets. The perfusionators were placed in water baths under a large
greenhouse frame covered with 30% shade cloth to regulate temperature and light
conditions. They were connected to a flow-through, filtered (1 µm) seawater system and
were allowed to equilibrate for two weeks before beginning the experiment. Feed water
was pumped from an adjacent creek, through a series of sand, bag (10 µm), and cartridge
(5 and 1 µm) filters, amended with NaH13CO3 and (15NH4)2SO4 dissolved in deionized
water, and homogenized in a mixing chamber before being pumped through the standpipe
into the perfusionator reservoir at a rate of ~15 L day-1, or a porewater residence time of
~1.8 days. Fine-scale control of the flow rate into each perfusionator was achieved using
an IV dripper located at each stand pipe that was calibrated daily. The water column
above the sediments was also connected to the flow-through filtered seawater system and
was stirred continuously with a mini-jet pump to keep the water column well mixed and

30
prevent buildup of artificial gradients. The mesocosm array consisted of 24
perfusionators all receiving isotope tracer (15N and 13C) divided amongst several
experimental treatments. We do not present the full results of our experimental
manipulations here, but instead focus on the effectiveness of the perfusionator design in
delivering tracer through the sediments via porewater.
Sulfur hexafluoride (SF6), 15NH4+, and H13CO3
- were supplied to the feed water by
dedicated metering pumps. SF6 is an inert gas, detectable at very low concentrations and
often used as a physical gas exchange and water mass tracer (Emery and Thomson 2001;
Watson and Ledwell 1988). Because gas exchange is trivial within sediments, the SF6
proved a reliable conservative tracer for tracking the perfusion of porewater. The
distribution of SF6 concentrations in porewater was used to assess the homogeneity of
tracer distribution in the sediments. Porewater SF6 was measured once in four of the 24
perfusionators. The SF6 solution was prepared as described in Tobias et al. (2009).
Briefly, the SF6 tracer solution was prepared in a 40-L Tedlar (SKC Inc.) plastic sample
bag that was floated in a tub of water to provide thermal stability. First, the bag was
filled approximately half way by pumping in 20 L deionized water with a peristaltic
pump, and the remaining air headspace was forced out of the bag through a port at the top
of the bag until no air headspace remained. Then the headspace was refilled with
approximately 10 L of pure SF6 that was transferred to the bag from a pressurized tank.
The mixture was agitated repeatedly and allowed to equilibrate for approximately 24
hours before the tracer experiment began, thereby creating a solution nearly saturated
with SF6 at 1 atm pressure. The SF6-saturated (~0.25 – 0.30 mmol L-1) tracer solution

31
was pumped using a metering pump through Norprene tubing into the perfusionator feed
water line at a constant rate of 1 mL min-1. Feed water flow past the point of mixing
ranged from 300 – 500 ml min-1 generating an SF6 concentration delivered to the
mesocosm on the order of 500 nM. After 2 days of SF6 introduction to the feed lines,
sediment porewater was sampled simultaneously at 10 grid locations across the sediment
surface at a depth of 5 cm using stainless steel push-point samplers (2 cm screen)
connected to a peristaltic pump (2-3 mL min-1) into N2-sparged serum vials.
Isotopic tracers ((15NH4)2SO4 and NaH13CO3) were added from separate stock solutions
to the perfusionator feed water continuously for two weeks. This enrichment phase was
followed by a four week period of unlabeled NaHCO3 and (NH4)2SO4 addition. Surface
sediments (0-1 cm) from three mesocosms were sampled for bulk isotope analysis using
an acrylic core (5.7 cm I.D.) before beginning the isotope additions (control), during the
isotope additions (Days 1, 3, 7, 14), and after stopping the isotope additions (Days 21,
42). Samples were stored at -80ºC in pre-combusted glass jars until analysis. A different
region of the sediment surface was sampled each day to avoid re-sampling any sediments.
Field deployment
The final application of the perfusionator was in the field. We buried four perfusionators
at a sandy, shallow (~0.5 m water depth at mean low water) subtidal site in the York
River adjacent to VIMS (Fig. 2). We tested the effectiveness of the perfusionator at
delivering dissolved tracers homogenously to the sediment surface using the same

32
conservative (SF6) and non-conservative (H13CO3-, 15NH4
+) tracers that were applied to
the mesocosm experiment described above. Each perfusionator was placed in a hole in
the sediments that was created using a suction sampler. The perfusionators were filled
with sediments (sand, ~10 cm deep) collected from the site and allowed to equilibrate for
20 days before beginning the experiment. To minimize disruption of surface water
movement over the sediment surface, the wall of the perfusionator (Fig. 1) was shortened
to 25cm for the field application such that only ~5 cm of the wall extended above the
sediment-water interface. The feed water was supplied from a porewater well that was
installed adjacent to the buried perfusionators at approximately the same depth as the
perfusionator reservoir. Porewater from the well was pumped (dotted gray lines, Fig. 2)
with a peristaltic pump to a mixing chamber on the shore (~20 m distance) where isotopic
and SF6 tracers were added, as described in the outdoor mesocosm array experiment. The
tracer-amended porewater (feed water) was then pumped (solid black lines, Fig. 2) back
to the buried perfusionators, where it was introduced through the standpipe to the
perfusionator reservoir. The feed water pumping rate was ~29 L day-1; or a porewater
residence time of ~0.15 day. Flow rates into the perfusionators were controlled using a
peristaltic pump that was calibrated daily. Tracer addition occurred for 12 days. During
the tracer period, translucent fiberglass lids were secured with rebar stakes on top of the
perfusionator walls to minimize hydrodynamic disturbance. The lids, however, were
perforated to allow for water exchange during that period. The lids from two of the
perfusionators were removed at the end of the addition period while the other two lids
remained in place to assess the effect of hydraulic energy on the retention of isotopes
within the sediments.

33
On the final day of tracer addition, porewater SF6 was sampled simultaneously at 10 grid
locations across the sediment surface at a depth of 5 cm using stainless steel push-point
samplers (2 cm screen) connected to a peristaltic pump as performed in the mesocosm
study.
Surface sediments (0-1 cm) were sampled for bulk isotope analysis using an acrylic core
(5.7 cm I.D.) before beginning the isotope additions (control), during the addition phase
(Days 7, 12), and after stopping the isotope additions (Days 14, 19, 26, 33, 42). Samples
were stored in pre-combusted glass jars at -80ºC until analysis. As done in the mesocosm
study, a different region of the sediment surface was sampled each day to avoid re-
sampling any sediments. In addition to the sediment samples, porewater samples were
taken for measurement of 15N-isotopic enrichment of NH4+. Porewater was collected
from ~6 cm depth at five locations across the sediment surface using stainless steel push
point samplers (2 cm screen; MHE products) connected to a peristaltic pump (~10 mL
min-1). The sub-samples from each mesocosm were filtered through 2.7 mm GFD and
0.7 mm GFF filters, composited, and stored in a high density polyethylene bottle at -20°C
until analysis.
Analytical Methods
RWT concentrations were measured using a Shimadzu UV-1601 UV-Visible
Spectrophotometer (absorption wavelength = 550 nm; Shiau et al. 1993; Smart and

34
Laidlaw 1977). A calibration curve was prepared using different proportions of the feed
water mixed with deionized water and used to determine sample RWT concentrations.
Concentrations were expressed as percent of the feed water (source) concentration, which
was designated as 100%. Two-sample T-tests were used to test for differences in RWT
concentration by depth (6 vs. 15 cm; α = 0.05) and by horizontal sampling position
(central vs. edge; α = 0.05). SF6 concentrations were measured with a Shimadzu 8A gas
chromatograph fitted with an electron capture detector, a packed molecular sieve 5A
column, and using N2 carrier gas. Sample SF6 peaks were calibrated against serial
dilutions of a 1ppm SF6 standard, and SF6 concentrations were calculated from the ideal
gas law and sample volumes.
For bulk isotope measurements, sediments were freeze-dried, ground and homogenized,
acidified with 10% HCl to remove inorganic C (Hedges and Stern 1984), and analyzed
for 13C/12C and 15N/14N using an elemental analyzer coupled to an isotope ratio mass
spectrometer (EA-IRMS; Thermo Delta V Plus). Isotopic values are presented as delta
values (δ13C or δ15N) in units of per mil (‰) relative to Vienna Pee Dee Belemnite
(VPDB, C) and air (N) standards:
δX = [Rsample / Rstandard – 1]*1000 (1)
where X is either 15N or 13C, R = 15N/14N or 13C/12C. For porewater δ15N-NH4+ analysis,
NH4+ was trapped using an alkaline diffusion acid trap according to Holmes et al. 1998.
Pre-combusted GFD (1 cm) filter discs were acidified with 2M KHSO4 and sandwiched

35
between two 2 mm polypropylene filters. The acid filter sandwich and approximately
0.5g MgO were added to a porewater volume sufficient to contain 2 mmoles N as NH4+.
The sample was diffused for 1 week, and the sandwich dried in a dessicator containing
high concentration H2SO4 for 48 hours. The GFD discs were wrapped in tin capsules, and
analyzed for 15N/14N using the EA-IRMS.
Results & Discussion
Laboratory testing
During the lab-based Rhodamine test, RWT first appeared in porewater sampled 15 cm
below the sediment surface on Day 1 (0.7 ± 0.3% of source solution; Fig. 3; error
represents 1 SE) and increased through the final sampling day (57 ± 2%). RWT was
subsequently detected at 6 cm on Day 4 (16 ± 4%), although at lower concentrations than
at 15 cm (45 ± 4%) on that day, confirming that deeper sediments had been exposed
longer to reservoir water than the shallow sediments. Concentrations at 6 cm continued
to increase through the final sampling day (31 ± 7%). Concentrations at 15 cm were
consistently higher than at 6 cm throughout the experiment (p < 0.05; df = 89). No dye
was measurable in the surface water until the final day. The sampling locations were
distributed to account for edge effects that could result from a leaky seal at the false
bottom-wall interface (see inset, Fig. 3). There were no significant differences between
“edge” and “central” sampling positions for either depth (p > 0.05, df = 41 for 6 cm and p
> 0.05, df = 48 for 15 cm; see inset, Fig. 3), which suggested that the seal along the false

36
bottom and tank wall edge was water-tight. No additional “hot spots” of dye were
apparent, indicating relatively even distribution throughout the sediments. RWT dye has
limited use as a conservative tracer in sediments due to losses from sorption to sediments,
photochemical degradation, or microbial decomposition (Lin et al. 2003). In our lab-
based perfusionator test, we used rinsed play sand, which we assumed had negligible
organic content, so we expected minor losses due to sorption and decomposition,
although some sorption may have accounted for the higher concentrations at 15 cm
compared with 6 cm and delayed appearance in the water column. While sorption and
photodegradation limit the use of RWT for estimating transport parameters in natural
systems, these processes were minimized in our laboratory test and did not lessen the
utility of using RWT for assessing homogenous dispersal of tracer under controlled
conditions. RWT was not used in the subsequent perfusionator tests in natural settings.
Mesocosm testing
In the outdoor mesocosm array test, we used 24 perfusionators for a 58-day experiment
that investigated sediment microbial uptake and retention of dissolved inorganic nutrients
from water column and porewater sources using stable isotope tracers. With a few
exceptions, the perfusionators worked well. Four of the 24 false bottoms were breached
by overlying sediment, rendering the perfusionators unusable, and 2 of the 48 mini-jet
pumps were faulty by the end of the experiment. More precise fitting of the false bottom
into the tank will correct the likelihood of a failure, and our perfusionator design

37
minimized the effect of a broken pump within the reservoir by alternating between two
pumps every three days.
Subsurface SF6 distributions measured 5 cm below the sediment surface are shown in
Figure 4 as contour plots for each perfusionator. Mean concentrations of SF6 varied
between perfusionators (45 ± 9, 90 ± 13, 67 ± 13, 189 ± 29, nM for tanks a, b, c, d,
respectively; error represents SE, n = 10); however, the within-tank variability was
similar among tanks (CV = 61, 46, 62, 49 %, respectively). Within-tank distribution of
tracer was heterogeneous, but values were generally within a factor of 2-3. We identified
the location of the standpipe for each perfusionator in Figure 4 to assess whether the
standpipes leaked, which would be indicated by localized maxima in SF6 concentrations
centered around the standpipes. The absence of “hot spots” suggests that leaking or other
influences from the standpipe, edge, or biotubes were minimal.
For the mesocosm array experiment, non-conservative tracers (H13CO3-, 15NH4
+)
introduced through the porewater were incorporated into the sediment microbial
community as indicated by enrichments in bulk surface sediment δ15N and δ13C (Fig. 5).
δ15N values increased throughout the label addition period, reached a maximum of 20086
± 3665 ‰ by Day 14, and declined until Day 42 (11502 ± 1842). The high levels of 15N
were necessary because of a concurrent study that was trying to track N into the large and
exchangeable N2 fraction. δ13C values were lower than δ15N but followed similar
patterns (r2 = 0.97). δ13C values increased throughout the label addition period, reached a
maximum of 1601 ± 251 ‰ by Day 14 and declined until Day 42 (679 ± 91 ‰). The

38
isotopic enrichment trajectories show the incorporation of isotopic label during the tracer
portion (through Day 14) of the experiment, and the dilution of the isotopic label after the
isotopically-labeled NH4+ and HCO3
- were replaced with unlabelled stock (after Day 14).
Together, the conservative (SF6) and non-conservative (isotopic) tracers demonstrated
that the perfusionator provided a reliable approach for distributing dissolved tracers via
the porewater throughout the sediment column in a laboratory or mesocosm setting. The
SF6 and isotopic tests were conducted using sediments (fine sand) collected from the field
and transferred directly to the mesocosm chamber. The sediments collected from the field
remained relatively intact during placement in the mesocosms and included organic and
inorganic components typical of estuarine sediments (e.g. macro- and meiofauna, BMA,
bacteria, shell fragments). The SF6 distributions showed some heterogeneity horizontally
across the sediments, but concentrations within a mesocosm varied within a factor of 2-3,
which was quite low considering the naturally-occurring heterogeneity of the sediments
(Fig. 4). Despite the presence of worm tubes and clams, no channeling was evident.
Absolute SF6 concentrations between tanks differed by a factor of 4 even though each
tank received SF6 from the same feed line. We attribute these differences to three
possible sources of variability: 1) variable exposure of the feed water solution containing
SF6 to air in the standpipe and the feed lines, leading to re-equilibration of the SF6
solution with air, 2) small differences in the flow rates at each stand pipe which would
translate into logarithmic changes in gas exchange (especially gases such as SF6 that are
very insoluble; see Tobias et al. (2009) and references therein) and 3) changes in SF6
solubility associated with diel temperature variability of the feed water reservoir. Given

39
the highly insoluble nature of SF6 and the presence of a headspace in the standpipe, these
between-tank differences are not unexpected, and the SF6 provides a worst-case
representation for subsurface heterogeneity of tracer.
The incorporation of the isotopic tracers into the surface sediments suggested a more
homogenous delivery of inorganic tracers than the SF6 might indicate. Active uptake of
C and N by the microbial community at the sediment surface caused the isotopic
enrichment of the bulk sediments to increase steadily throughout the labeling period. The
enrichment trajectories, and between-mesocosm variation in sediment enrichments on the
order of ~ 30%, indicate consistent delivery of the isotopic tracers to the surface
sediments. Further, active uptake and cycling of the introduced tracers by the sediment
microbial community was demonstrated by the retention of label in the bulk sediments
following the end of the isotopic addition period (Day 14). Some variability (CV ~ 30%)
between replicates at any given time point was evident, which could be attributed to
natural heterogeneity of the microbial community processing the C and N, and/or
disproportionate delivery of the tracers to each replicate. Because variability over time
was larger than variability at a given time point, any inconsistencies associated with the
tracer delivery were small relative to the overall enrichment patterns that we observed
over time due to autotrophic/heterotrophic uptake and recycling.
The perfusionator allowed us continuously add the isotope tracer for two weeks, which
provided ample opportunity for the target pools to become enriched at detectable levels.
Overall, these tracer tests demonstrate the utility of the perfusionator as a system for

40
delivering dissolved constituents continuously and homogenously through the sediments
via the porewater in mesocosm-based experiments, within the limitations of mesocosm
studies (Carpenter 1996; 1999; Drenner and Mazumder 1999; Huston 1999; Short 1995).
Field deployment
The field deployment was the ultimate test for the perfusionator because of its exposure
to in situ conditions. Not only did we use natural, heterogenous sediments as in the
mesocosm test, but we also maintained dynamic physical exchange with turbulent surface
waters and used porewater as the feed water to which the tracers were added (Fig. 2). We
applied the same conservative (SF6) and non-conservative (15NH4+, H13CO3
-) tracers as in
the mesocosm experiment to assess the effectiveness of the field deployment. SF6
distributions at 5 cm below the sediment surface for the field deployment are presented as
contour plots for each perfusionator (Fig. 6). Mean concentrations for each perfusionator
were similar (627 ± 76, 595 ± 74, 650 ± 91, 590 ± 195 nM for perfusionators a, b, c, d,
respectively; error represents SE, n = 10). Within-chamber variability was similar among
perfusionators a, b, and c (CV = 38, 39, 44%), however replicate d was more variable
(CV = 104%). We believe the high variability in perfusionator d reflects unintentional
collection of surface water with some of the porewater sippers, which would have
resulted in artificially low SF6 concentrations at those locations since the atmosphere-
equilibrated surface water contains no SF6. This was verified by increased concentrations
of dissolved oxygen measured in split samples run on the IRMS for gas isotopes used in a
concurrent study (data not presented here). Accordingly, the SF6 tracer distribution for

41
tank d likely did not accurately reflect the porewater distribution. On the other hand,
within-tank distributions of tracer for tanks a, b, and c were within a factor of 2, which
was similar to the variability observed in the mesocosm array experiment. The location
of the standpipe was indicated for each perfusionator to assess for leakage from the
standpipe as described for the mesocosm experiment (Fig. 6). The absence of “hot spots”
suggests that leaking or other influences from the standpipe, edge, or biotubes were
minimal.
For the bulk sediment isotopic values, we were unable to identify differences between the
perfusionators that were covered vs. uncovered following the labeling period, so the
average values of all four perfusionators are presented as mean ± SE (Fig. 7). Unlike the
SF6 data, the bulk sediment isotopic enrichments for perfusionator d were consistent with
the other three perfusionators, which further suggests that sampling error caused the
differences we observed in the SF6 data, rather than a failure of the perfusionator.
Generally, the patterns of isotope uptake during the labeling period and loss during the
post-labeling period were similar for the mesocosm array and the field deployment tests,
although the isotopic enrichments were lower in the field experiment (Fig. 7). δ15N
values increased throughout the label addition period, reached a maximum of 599 ± 84 ‰
by Day 12, decreased during the post-labeling period to 150 ± 20 ‰ on Day 19 and
remained at this level through Day 42. Similar to the mesocosm experiment, δ13C values
were lower than δ15N but followed similar patterns (r2 = 0.83). δ13C values increased
throughout the label addition period, reached a maximum of 38.9 ± 22 ‰ by Day 12,

42
decreased during the post-labeling period to -9.75 ± 1.4 ‰ on Day 19, and remained
steady through Day 42.
For the field deployment, we also measured δ15N enrichments of porewater NH4+ (Fig.
8). Unlike the SF6 measurements, which showed the within-perfusionator dissolved tracer
distribution for one day (Day 12), δ15N of porewater NH4+ were measured throughout the
experiment, so we were able to track changes over time in NH4+ isotopic enrichments
encountered by the sediment microbial community. In general, δ15N-NH4+ showed the
same patterns as the bulk sediments, although NH4+ was more enriched than bulk
sediments in 15N. Throughout the labeling period, δ15N increased, peaked on Day 7 at
20273 ± 2310 ‰ and decreased once the labels were turned off to 2084 ± 607 ‰ on Day
42. Porewater δ15N-NH4+ peaked on Day 7, just before the end of the labeling period
when the bulk sediment isotopic enrichments peaked. Between-perfusionator variability
was low, with CV varying from 5 to 36%. Once again, perfusionator d was similar to a,
b, and c, suggesting a sampling error caused the high variability in SF6 values in
perfusionator d rather than a failure of the perfusionator. Based on the bulk sediment and
NH4+ δ15N data, we estimated conservatively that less than 5% of the sediment 15N
enrichment could have been due to residual 15N from porewater NH4+.
As in the mesocosm array test, delivery of conservative and isotopic tracers was
successful in the field test perfusionators. While more involved logistically than the
mesocosm experiments, the field experiment had some important advantages. First, by
supplying tracer to the circulating porewater system (Fig. 2), we avoided potential

43
artifacts associated with introducing oxygenated water into the subsurface. Second,
because overlying surface water was exchanged almost instantaneously, no tracer could
accumulate in overlying water and serve as a labeled substrate to the sediments from
“above.” Our mesocosm array could be adapted to account for both of these potential
artifacts and remains a suitable design for many experimental manipulations. However,
the last and critical advantage the field deployment offered was maintenance of the
dynamic nature of the porewater and resuspension in a natural setting, which was not
possible in a mesocosm setting. The perfusionators were buried at an active shallow
subtidal site where, over the course of the experiment, tidal strengths varied across four
neap-spring tidal cycles (tidal ranges from 0.51 to 0.97 m) and daily maximum wind
speeds ranged from 4.8 to 16.7 meters per second (NOAA 2008). Thus, the field labeling
via sediment porewater provided a more robust and environmentally meaningful design
for testing our experimental questions regarding the N and C uptake dynamics of benthic
microbes strictly from a sediment source.
The isotopic enrichment levels were exceptionally consistent between replicates in the
field experiment (Fig. 7), and replication was better than that achieved in the mesocosm
array experiment (Fig. 5). Again, as observed in the mesocosm experiment, the SF6 maps
show a variable picture of tracer delivery to any given region of sediment (Fig. 6). We
believe that the subsurface variation in SF6 for the field perfusionators reflected a
snapshot of a temporally dynamic subsurface rather than an inability of the perfusionator
system to evenly distribute dissolved tracer. A highly uneven tracer delivery could not
have yielded the smooth isotope trajectories in the sediments. Wave action and tidal

44
pumping were actively moving the porewater (and dissolved tracers) within the
sediments, and they were sufficiently strong to move isotopically-labeled particles deeper
into the sediments. This movement was likely transient in strength and direction (Huettel
et al. 2003) and occurred over sufficiently short timescales such that the sediments in
different locations encountered a temporally-smoothed average tracer delivery. This
smoothing likely increased the similarities in bulk sediment isotope trajectories (both
rising and falling) between perfusionators (Fig. 7). Even though we induced upward flow,
the sediment column was not exposed strictly to unidirectional plug flow, which has been
critiqued in previous advective sediment column studies for not characterizing porewater
movement in situ (Huettel et al. 1996; Janssen et al. 2005).
Because of the dynamics in these sediments, composite sampling (rather than point
sampling) of the dissolved porewater pools would likely provide a better indication of the
average concentrations to which the sediments were exposed. Composite sampling of
perfusionator porewater likely explained the low variability in isotopic enrichments of
NH4+ (Fig. 8). Even so, the porewater samples represented only a snapshot in time of a
dynamic environment and likely differed from the average porewater conditions to which
the sediments were exposed. This likely contributed to the premature peak in porewater
δ15N-NH4+ on Day 7, prior to the end of the isotope addition period on Day 12, when the
bulk sediment δ15N values peaked. Compared to the porewater, solid phase isotopic
uptake provides a more integrated representation of the isotopic environment.
Nevertheless, the perfusionator appears to be an effective means by which to study
responses of solid sediment phases to experimental manipulation. The approach can be

45
applied to a wide range of shallow sediments to provide in situ tracing of biological and
physical processing of dissolved substances that is not possible in a setting isolated from
the field.
Applications and limitations
The perfusionator offers some important advantages over alternative methods for
introducing dissolved constituents to the sediments. First, it provides more control over
solute concentrations, isotopic enrichments, and solute distribution than other available
amendment methods (e.g. PVC diffusers, fertilizer pellets; Mutchler et al. 2004). Second,
we were able to attain a homogenous solute distribution over a large sediment volume,
which maximizes the sediments available for sampling while minimizing the influence of
wall artifacts associated with mesocosms (Carpenter 1996). Also, it allows addition of
amended feedwater for an extended period of time, enabling us to measure slower rate
processes than are studied in typical core experiments (Anderson et al. 2003; Bühring et
al. 2006), and although not studied here, tracer incorporation into higher trophic levels.
Lastly, in the field deployment, we avoid artifacts associated with unidirectional flow
which is common to traditional porewater advection studies that utilize sediment columns
(Huettel et al. 1996; Reimers et al. 2004).
Our system would be suitable for biogeochemical studies investigating redox chemistry
or manipulation of other dissolved porewater constituents such as trace metals, toxins,
salts, gases, or nutrients in a setting which allows porewater advection. For example, the

46
perfusionator would be an ideal system with which to study the effects of extracellular
polymeric substances (EPS) excreted by BMA on sediment stability (Tolhurst et al. 2002)
or an investigation of seagrass tolerance to trace metal-contaminated groundwater
(Marín-Guirao et al. 2005). Additionally, the perfusionator can be used with amended or
unamended feed water. Finally, with a simple modification, it can be run as a
diffusionator rather than a perfusionator by circulating tracer within the perfusionator
reservoir and pumping to a waste output in the reservoir.
The perfusionator may not be suitable for every sediment system. The primary
limitations relate to sediment grain size and permeability. Vertical advective flow of
porewater would be limited in very fine grained sediments (mud, silt) with low
permeability. Upward flow of porewater through the sediments was controlled by head
pressure or a peristaltic pump operating at a low setting in the current design of the
perfusionator. Low-pressure control of flow would likely be insufficient with low-
permeability sediments, as back-pressure would build up and restrict flow. Another
sediment limitation that should be considered in future applications of the perfusionator is
the use of highly bioturbated sediments, which could channelize and disrupt controlled
porewater introduction measures. Application of the perfusionator to fine-grained
sediments or highly bioturbated sediments would require additional testing and
optimization.
In the appropriate environment, the perfusionator provides a new tool for introducing
dissolved tracers to the porewater for extended timescales. There are potentially wide

47
applications for the perfusionator in the aquatic and marine sciences, including
laboratory, mesocosm, or field settings.
Acknowledgments
This research was supported by the National Science Foundation (VCR-LTER project
DEB 0080381 and DEB 0621014; DEB Ecosystems 0542645 to VIMS and 0542635 to
UNCW) and the Environmental Protection Agency (STAR FP916722010). The EPA has
not officially endorsed this publication and the views expressed herein may not reflect the
views of the EPA. This work would not have been possible without the help of M.
Luckenbach, S. Fate, and R. Bonniwell at the VIMS ESL as well as H. Walker, D.
Maxey, J. Adamo, S. Salisbury, E. Lerberg, C. Smith, and E. Ferer at VIMS. We are also
grateful to K. Duernberger at UNCW for assistance in the lab.

48
References
Anderson, I.C., K.J.M. McGlathery, and C. Tyler. 2003. Microbial mediation of ‘reactive’ nitrogen transformations in a temperate lagoon. Marine Ecology Progress Series 246:73–84. Armitage, A.R., T.A. Frankovich, and J.W. Fourqurean. 2006. Variable responses within epiphytic and benthic microalgal communities to nutrient enrichment. Hydrobiologia 569:423-435. Boschker, H.T.S., S.C. Nold, P. Wellsbury, D. Bos, W. de Graaf, R. Pel, R.J. Parkes and T.E. Cappenberg. 1998. Direct linking of microbial populations to specific biogeochemical processes by 13C-labelling of biomarkers. Nature 392:801-805. Boschker, H.T.S. and J.J. Middelburg. 2002. Stable isotopes and biomarkers in microbial ecology. FEMS Microbiology Ecology 40:85-95. Bühring, S.I., S. Ehrenhauss, A. Kamp, L. Moodley, and U. Witte. 2006. Enhanced benthic activity in sandy sublittoral sediments: Evidence from 13C tracer experiments. Marine Biology Research 2:120-129. Cahoon, L.B. 1999. The role of benthic microalgae in neritic ecosystems. Oceanography and Marine Biology 37:47-86. Carpenter, S.R. 1996. Microcosm experiments have limited relevance for community and ecosystem ecology. Ecology 77:677-680. Carpenter, S.R. 1999. Microcosm experiments have limited relevance for community and ecosystem ecology: Reply. Ecology 80:1085-1088. Drenner, R.W. and A. Mazumder 1999. Microcosm experiments have limited relevance for community and ecosystem ecology: Comment. Ecology 80:1081-1085. Dornblaser, M., A.E. Giblin, B. Fry, and B.J. Peterson. 1994. Effects of sulfate concentration in the overlying water on sulfate reduction and sulfur storage in lake sediments. Biogeochemistry 24:129-144. Emery, W.J. and R.E. Thomson. 2001. Data Analysis Methods in Physical Oceanography, 2nd and Revised Edition. San Diego: Elsevier. Enoksson, V. 1993. Nutrient recycling by coastal sediments - Effects of added algal material. Marine Ecology-Progress Series 92:245-254.

49
Franke, U., L. Polerecky, E. Precht and M. Huettel. 2006. Wave tank study of particulate organic matter degradation in permeable sediments. Limnology and Oceanography 51:1084-1096. Girguis P.R., A.E. Cozen, and E.F. DeLong. 2005. Growth and population dynamics of anaerobic methane-oxidizing archaea and sulfate-reducing bacteria in a continuous-flow bioreactor. Applied and Environmental Microbiology 71:3725-3733. Gribsholt B., E. Struyf, A. Tramper, L. De Brabandera, N. Brion, S. Van Damme, F. Meire, F. Dehairs, J.J. Middelburg, and H.T.S. Boschker. 2007. Nitrogen assimilation and short term retention in a nutrient-rich tidal freshwater marsh - a whole ecosystem 15N enrichment study. Biogeosciences 4:11-26. Hedges, J. and J. H. Stern. 1984. Carbon and nitrogen determinations of carbonate-containing solids. Limnology and Oceanography 29:657–663. Holmes, R.M., J.W. McClelland, D.M. Sigman, B. Fry, and B.J. Peterson. 1998. Measuring 15N-NH4
+ in marine, estuarine, and fresh waters: An adaptation of the ammonia diffusion method for samples with low ammonium concentrations. Marine Chemistry 60:235-243. Hughes, J.D., L.A. Deegan, B.J. Peterson, R.M. Holmes, and B. Fry. 2000. Nitrogen flow through the food web in the oligohaline zone of a New England estuary. Ecology 81:433-452. Huettel, M. H. Roy, E. Precht, and S. Ehrenhauss. 2003. Hydrodynamical impact on biogeochemical processes in aquatic sediments. Hydrobiologia 494:231-236. Huettel, M., and A. Rusch. 2000. Transport and degradation of phytoplankton in permeable sediments. Limnology and Oceanography 45:534-539. Huettel, M., W. Ziebis, and S. Forster. 1996. Flow-induced uptake of particulate matter in permeable sediments. Geochimica Cosmochimica Acta 62:613-631. Huston, M.A. 1999. Microcosm experiments have limited relevance for community and ecosystem ecology: Synthesis of comments. Ecology 80:1088-1089. Janssen, F., M. Huettel, and U. Witte. 2005. Pore-water advection and solute fluxes in permeable marine sediments (II): Benthic respiration at three sandy sites with different permeabilities (German Bight, North Sea). Limnology and Oceanography 50:779-792. Jönsson, B. 1991. A 14C-incubation technique for measuring microphytobenthic primary productivity in intact sediment cores. Limnology and Oceanography 36:1485-1492.

50
Kaldy, J.E., P.M. Eldridge, L.A. Cifuentes, and W.B. Jones. 2006. Utilization of DOC from seagrass rhizomes by sediment bacteria: 13Ctracer experiments and modeling. Marine Ecology Progress Series 317:41–55. Lin, A.Y.C., J. F. Debroux, J. A. Cunningham and M. Reinhard. 2003. Comparison of rhodamine WT and bromide in the determination of hydraulic characteristics of constructed wetlands. Ecological Engineering 20:75-88. MacIntyre, H.L., R.J. Geider, and D.C. Miller. 1996. Microphytoenthos: The ecological role of the “Secret Gardent” of unvegetated, shallow-water marine habitats. I. Distribution, abundance, and primary production. Estuaries 19:186-201. Marín-Guirao, L., A.M. Atucha, J.L. Barba, E.M. López, and A.J. García Fernández. 2005. Effects of mining wastes on a seagrass ecosystem: metal accumulation and bioavailability, seagrass dynamics and associated community structure. Marine Environmental Research 60: 317-337. McGlathery, K.J., N. Risgaard-Petersen, and P.B. Christensen. 1998. Temporal and spatial variation in nitrogen fixation activity in the eelgrass Zostera marine rhizosphere. Marine Ecology-Progress Series 168:245-258. Middelburg, J.J., C. Barranguet, H.T.S. Boschker, P.M.J. Herman, T. Moens, and C.H.R. Heip. 2000. The fate of intertidal microphytobenthos carbon: An in situ 13C-labeling study. Limnology and Oceanography 45:1224-1234. Mutchler, T., M.J. Sullivan, and B. Fry. 2004. Potential of 14N isotope enrichment to resolve ambiguities in coastal trophic relationships. Marine Ecology Progress Series 266:27-33. Nielsen, L.P. 1992. Denitrification in sediment determined from nitrogen isotope pairing. FEMS Microbiology Ecology 86:357-362. NOAA 2008. Meteorological Station at Yorktown USCG Training Center, VA. Station ID 8637689. http://www.co-ops.nos.noaa.gov/data_menu.shtml?stn=8637689%20Yorktown%20Uscg%20Training%20Center,%20VA&type=Meteorological+Observations. Accessed 23 September 2009. Parkes, R.J., N. J. E. Dowling, D. C. White, R. A. Herbert and G. R. Gibson. 1993. Characterization of sulfate-reducing bacterial-populations within marine and estuarine sediments with different rates of sulfate reduction. FEMS Microbiology Ecology 102:235-250. Polerecky, L., U. Franke, U. Werner, B. Grunwald, and D. de Beer. 2005. High spatial resolution measurements of oxygen consumption rates in permeable sediments. Limnology and Oceanography: Methods 3:75-85.

51
Rao, A.M.F., M.J. McCarthy, W.S. Gardner, and R.A. Jahnke. 2007. Respiration and denitrification in permeable continental shelf deposits on the South Atlantic Bight: Rates of carbon and nitrogen cycling from sediment column experiments. Continental Shelf Research 27:1801-1819. Reimers, C.E. 2007. Applications of microelectrodes to problems in chemical oceanography. Chemical Reviews 107:590-600. Reimers, C.E., H.A. Stecher III, G.L, Taghon, C.M. Fuller, M. Huettel, A. Rusch, N. Ryckelynck, and C. Wild. 2004. In situ measurements of advective solute transport in permeable shelf sands. Continental Shelf Research 24:183-201. Shiau, B.J., D.A. Sabatini and J.H. Harwell. 1993. Influence of Rhodamine WT Properties on Sorption and Transport in Subsurface Media. Ground Water 31:913-920. Short, F.T., D.M. Burdick and J.E. Kaldy. 1995. Mesocosm experiments quantify the effects of eutrophication on eelgrass, Zostera marina. Limnology and Oceanography 40:740-749. Smart, P.L. and I.M.S. Laidlaw. 1977. An evaluation of some fluorescent dyes for water tracing. Water Resources Research 13:15–33. Stockdale, A., W. Davison, and H. Zhang. 2009. Micro-scale biogeochemical heterogeneity in sediments: A review of available technology and observed evidence. Earth-Science Reviews 92:81-97. Tobias, C.R., J.K. Bohlke, J.W. Harvey, E. Busenberg. 2009. A simple technique for continuous measurement of time-variable gas transfer in surface waters. Limnology and Oceanography-Methods 7:185-195. Tobias, C.R., M. Cieri, B.J. Peterson, L.A. Deegan, J. Vallino, and J. Hughes. 2003a. Processing watershed-derived nitrogen in a well-flushed New England estuary. Limnology and Oceanography 48:1766-1778. Tobias, C., A. Giblin, J. McClelland, J. Tucker, and B. Peterson. 2003b. Sediment DIN fluxes and preferential recycling of benthic microalgal nitrogen in a shallow macrotidal estuary. Marine Ecology Progress Series 257:25-36. Tolhurst, T.J., G. Gust, and D.M. Paterson. 20002. The influence of extracellular polymeric substance (EPS) on cohesive sediment stability. In Fine Sediment Dynamics in the Marine Environment, eds. J.C. Winterwerp and C. Kranenburg, 409-425. Elsevier Science B.V..

52
Trimmer, M. J. C. Nicholls, and B. Deflandre. 2003. Anaerobic Ammonium Oxidation Measured in Sediments along the Thames Estuary, United Kingdom. Applied and Environmental Microbiology 69:6447-6454. Veuger, B., J.J. Middelburg, H.T.S. Boschker, and M. Houtekamer. 2005. Analysis of 15N incorporation into D-alanine: A new method for tracing nitrogen uptake by bacteria. Limnology and Oceanography: Methods 3:230-240. Veuger, B., D. van Oevelen, H.T.S. Boschker, and J.J. Middelburg. 2006. Fate of peptidoglycan in an intertidal sediment: An in situ 13C-labeling study. Limnology and Oceanography 51:1572-1580. Veuger, B., B.D. Eyre, D. Maher, and J.J. Middelburg. 2007. Nitrogen incorporation and retention by bacteria, algae, and fauna in a subtropical intertidal sediment: An in situ 15N-labeling study. Limnology and Oceanography 52:1930-1942. Watson, A.J. and J.R. Ledwell. 1988. Purposefully released tracers. Philosophical Transactions of the Royal Society of London A 325:189-200.

53
Figure 2-1. Perfusionator diagram.
The perfusionator reservoir, located at the bottom of the mesocosm tank, holds porewater
that is pumped up through the sediment column. The porewater is introduced (e.g. via an
IV dripper) through a PVC standpipe, which is connected to a porous pipe that feeds the
reservoir. A mini-jet pump circulates the reservoir water to ensure that it is well mixed.
Note that the figure is not drawn to scale.

54

55
Figure 2-2. Plumbing schematic for field deployment.
a) Plan view and b) cross section of circulating porewater system. Porewater from the
porewater well located in the subtidal zone (dotted lines), was pumped to the shore where
it was amended with isotopic and SF6 tracers in a mixing chamber. Porewater with
tracers (solid lines) was pumped back to the subtidal zone and into each perfusionator
through a PVC standpipe.

56

57
Figure 2-3. Rhodamine WT concentrations for the laboratory test of the
perfusionator.
The y-axis represents RWT concentrations as % of source solution, which was 100%.
RWT concentrations were measured in the water column (dashed line, triangles; n =1),
and in the sediments at 6 cm (squares, dotted lines) and 15 cm (circles, solid lines)
depths. Sediments were sampled in both center (C) and edge (E) positions, according to
inset in diagram. Open symbols correspond to center positions (mean ± SE; n = 5),
closed symbols correspond to edge positions (mean ± SE; n = 4).

58

59
Figure 2-4. SF6 concentrations during outdoor mesocosm array experiment.
Plan view of individual perfusionators (a-d). Contour plots show SF6 concentrations
(nM) at 5 cm sediment depth. Star denotes location of standpipe within each mesocosm.
Square grid shows 10 sampling positions.

60

61
Figure 2-5. Bulk sediment isotopic enrichments for surface sediments (0-1 cm)
during outdoor mesocosm array experiment.
Solid lines (closed symbols) indicate δ15N and dotted lines (open symbols) indicate δ13C.
Symbols represent average values ± 1 SE (n = 2). Vertical dotted grey line at Day 15
indicates the end of the isotope addition period. A δ15N value of 10,000 ‰ is 3.89
atom% 15N, and δ13C of 1000 is 2.19 atom% 13C.

62

63
Figure 2-6. SF6 concentrations during field deployment of the perfusionator.
Plan view of 4 (a-d) individual perfusionators. Contour plots show SF6 concentrations
(nM) at 5 cm sediment depth. Star denotes location of standpipe within each mesocosm.
Square grid shows 10 sampling positions.

64

65
Figure 2-7. Bulk sediment isotopic enrichments for surface sediments (0-1 cm)
during the field deployment of the perfusionator.
Solid lines (closed symbols) indicate δ15N and dotted lines (open symbols) indicate δ13C.
Symbols represent average values ± 1 SE (n = 4). Vertical dotted grey line at Day 12
indicates the end of the isotope addition period.

66

67
Figure 2-8. Isotopic enrichment (δ15N) for porewater NH4+ during the field
deployment of the perfusionator.
Symbols represent average values ± 1 SE (n = 4). Vertical dotted grey line at Day 12
indicates the end of the isotope addition period.

68

69
CHAPTER 3: BENTHIC ALGAE DETERMINE SEDIMENT ORGANIC
MATTER COMPOSITION IN SHALLOW PHOTIC SEDIMENTS
Hardison, A.K.
Canuel, E.A.
Anderson, I.C.
Tobias, C.R.
Veuger, B.

70
Abstract
Sediment organic matter in shallow coastal systems performs important ecosystem
functions such as providing food for infauna and epifauna, aiding in sediment stability,
and providing storage for carbon and nutrients. Sediment organic matter composition
may be affected by the dominant primary producer, which has been shown to be sensitive
to changes in nutrient loading to shallow systems. We investigated the influence of
microphytobenthos (MPB) and benthic macroalgae on sediment organic matter quantity
and quality in an experimental system using bulk and molecular level (total hydrolyzable
amino acids, THAA; phospholipid linked fatty acids, PLFA) analyses. Over the course
of the 42-day experiment, MPB activity in light treatment increased total organic carbon
(TOC) and total nitrogen (TN) by 173 and 141%, respectively, compared to the dark
treatment. THAA comprised a substantial fraction of sediment organic matter (~16% of
TOC, 35% of TN) and followed bulk accumulation patterns. Mole percent composition
of the THAA pool indicated that sediment in light treatments were composed of more
labile organic material while dark sediment organic matter was more degraded, with
higher proportions of Glycine and D-alanine. PLFA content, which made up ~1% of
TOC and represented viable biomass, contained high levels of algal fatty acids in light
treatments, particularly those derived from diatoms. MPB activity increased the lability
of sediment organic matter, which likely resulted in the observed increases in bacterial
PLFA concentrations in light treatments. Macroalgae were added to half of the light
treatments and grew to 410 ± 102 gdw m-2 by Day 42. Macroalgae decreased sediment
organic matter buildup, with TOC and TN increasing by only 130 and 94%, respectively,

71
compared to light treatments without macroalgae, likely as a result of shading, and
thereby reducing production of benthic microalgae. The presence of macroalgae
decreased sediment organic matter lability as well, which resulted in diminished buildup
of bacterial biomass. By the final day of the experiment, PCA analyses suggested that
sediment composition in treatments with macroalgae were more similar to dark
treatments and less similar to light treatments without macroalgae. Overall benthic
micro- and macroalgae fundamentally altered sediment organic matter quality and
quantity, which has important ecological consequences in these systems.

72
Introduction
Shallow coastal bays make up approximately 13% of the world’s coastline, are
among the most highly productive ecosystems on earth, and are distinctly vulnerable to
effects from the growing problem of nutrient over-enrichment due to increased human
activities (“cultural eutrophication”) (Nixon, 1995; NRC, 2000; Pedersen et al., 2004).
One consequence of nutrient loading to many of these systems has been a shift in primary
producer community structure. Because much of the sediments exists within the euphotic
zone, benthic autotrophs typically dominate production in these bays. Observations from
a number of systems have shown that as nutrient loading increases, ephemeral
macroalgae, phytoplankton, and epiphytes increase, while slow-growing perennial
macrophytes such as seagrass decrease (Duarte, 1995; Hauxwell et al., 2001; Sand-
Jensen & Borum, 1991; Valiela et al., 1992). For example, in Waquoit Bay, MA,
ephemeral populations of green (Cladophora) and red (Gracilaria) macroalgae replaced
Zostera marina seagrass when nutrient loadings increased six-fold (Hauxwell et al.,
2003). The mechanisms underlying this shift in community structure relate to differences
among plant types in nutrient uptake and growth strategies (Nielsen et al., 1996; Sand-
Jensen & Borum, 1991). Microphytobenthos (MPB), including benthic microalgae and
cyanobacteria, often contribute significantly to primary production within these shallow
systems; however, their response as the autotrophic community structure shifts in the face
of nutrient over-enrichment is not well understood.
Through structure, physiology, and growth, the dominant plants in a
community greatly affect both the physical and biological conditions of a system,

73
including overall community structure (Heck et al., 2003; Norkko, 1998; Orth et al.,
1984), ecosystem processes such as nutrient cycling (Risgaard-Petersen, 2003; Tyler et
al., 2001), and hydrologic conditions (Fonseca & Calahan, 1992; Jumars et al., 2001;
Paterson & Black, 1999). For example, the presence of ephemeral macroalgae often
leads to episodic anoxia and increased sulfide concentrations (Krause-Jensen et al., 1999;
Sfriso et al., 1992), which negatively affect fish and benthic fauna, as well as other
autotrophs (Gray et al., 2002; Hauxwell et al., 2003; Norkko et al., 2000; Raffaelli et al.,
1998; Sundback & McGlathery, 2005). Macroalgae also affect other primary producers
directly through shading and/or competition for nutrients. Because of their location at
the sediment surface or floating just above the sediments, macroalgae may decrease light
availabile for MPB, thereby decreasing or possibly inhibiting MPB production (Sundback
& McGlathery, 2005; Tyler et al., 2003; Valiela et al. 1997), although, some MPB
communities show evidence of photo-acclimation to low-light environments and are not
affected by shading by overlying macroalgal mats (Sundback & McGlathery, 2005;
Sundback et al., 1996). In addition to light, macroalgae may out-compete MPB for water
column nutrients, particularly when MPB are nutrient-limited, which often occurs in
sandy sediments in warm months (Sundback & McGlathery, 2005; Nilsson et al., 1991).
Shifts in plant community structure have also been linked to changes in sediment
composition (Benoy & Kalff, 1999; Kenworthy et al., 1982), which in turn could affect
ecosystem services like nutrient cycling and secondary production. For example,
macrophyte canopies enhance accumulation of fine, organic-rich particles compared with
unvegetated sediments (Benoy & Kalff, 1999; Gacia et al., 2002). Sediment organic
matter consists of material from a variety of living and non-living sources and performs

74
important ecosystem functions such as providing food for infauna and epifauna, aiding in
sediment stability (e.g. extrapolymeric substances produced by benthic microalgae
(Wolfstein et al., 2002)), and providing temporary or permanent storage for carbon (C)
and nutrients. While sources contributing to sediment organic matter vary by system,
microbial biomass often contributes a significant fraction of sediment organic matter in
shallow systems (Bouillon & Boschker, 2006; Canuel & Martens, 1993; Volkman et al.,
2008). Specifically, MPB may be a particularly good source of labile organic matter,
which may support bacterial production (Middelburg et al., 2000; Volkman et al., 2008).
The objectives of this study were to examine the influence of MPB on sediment
organic matter quality and quantity, and to describe how the MPB contribution to
sediment organic matter changes in the presence of a macroalgal bloom. Because gross
measurements of sediment organic matter (e.g. total organic carbon, total nitrogen) do not
provide information on source or availability, we combined bulk and molecular-level
analyses to more accurately characterize the sediment organic matter of a shallow coastal
bay. Specific organic compounds (biomarkers) were used to attribute organic matter to
different sources (e.g. Boschker et al., 1999; Canuel et al., 1995; Volkman et al., 2008).
Methods
Site description Sediments and macroalgae were collected from Hog Island Bay,
Virginia (HIB; Fig. 1), which is located along the Delmarva Peninsula and part of the
Virginia Coast Reserve, a Long-Term Ecological Research (LTER) site. HIB is a
shallow coastal lagoon (< 2 m deep at mean low water), typical of temperate lagoons

75
along the U.S. East coast and is dominated by benthic autotrophs (McGlathery et al.,
2001; Thomsen et al., 2006). Macroalgae are present throughout the lagoon in low to
moderate densities (Thomsen et al., 2006); however, we collected sediments and
macroalgae from mid-lagoon shoal sites where localized blooms of macroalgae have
previously developed and dominated benthic production during warmer months
(McGlathery et al., 2001; Thomsen et al., 2006). Throughout the rest of the year when
macroalgal biomass was low, MPB dominated (Anderson et al., 2003; McGlathery et al.,
2001).
Experimental design A flow-through mesocosm array was set-up at the Virginia
Institute of Marine Science (VIMS) Eastern Shore Laboratory (ESL) in Wachapreague,
VA. In preparation for this experiment, we designed and tested an experimental
apparatus that allowed for addition of nutrients simultaneously via surface water (SW)
and porewater (PW). Nutrients in shallow coastal bays commonly enter through the SW
(e.g. runoff and atmospheric deposition) and/or PW (e.g. groundwater and sediment
remineralization), thus, it was important for our study, which focused on the community
living at the sediment-water interface, to include nutrients from both sources. Discussion
of the design and testing of the perfusionator can be found in Hardison et al. (Submitted).
The “perfusionator” consisted of a 60 cm I.D. x 60 cm height translucent fiberglass
cylinder that included a reservoir for PW at the base of the sediment column. Twelve
mesocosms were filled to a depth of ~15 cm with intact sediments extruded from cores
collected from the shoal field site in May 2007 (Fig. 1). At the ESL, the perfusionators
were placed in shallow water baths under 30% shade cloth to control temperature and

76
light. The water column above the sediments was connected to a flow-through seawater
system supplied with filtered seawater from the adjacent creek (1 µm) and was stirred
continuously with a mini-jet pump to keep the water column well mixed. Once
connected to the experimental system, the mesocosms equilibrated for two weeks before
beginning the experiment.
Our experiment consisted of an incomplete factorial design made up of two
factors, each with two levels: 1) Light (ambient vs. dark), and 2) Macroalgae (presence
vs. absence of live macroalgae). All factors were crossed with the exception of the dark
+ macroalgae treatment, since, for logistical purposes, only light treatments received a
macroalgal addition. Each treatment had n = 4.
For the nutrient additions, a peristaltic pump was used to add (NH4)2SO4 and
NaHCO3 solutions to each mesocosm simultaneously via the SW and PW. NH4+ was
added at a rate to achieve 25 µM above background levels (2-4 µM) in mesocosm SW
and at approximate PW background levels (200-300 µM). HCO3- was added at a rate to
achieve enrichment of 0.25 mM above dissolved inorganic C (DIC) background in SW
(~2.5 mM) and at approximate PW background levels (~2.5 mM). Feed water was drawn
from a creek adjacent to the ESL, pumped through a series of sand, bag (10 µm),
cartridge (5 and 1 µm), and ultraviolet filters, and amended with HCO3- and NH4
+ in a
mixing chamber before delivery to each perfusionator. SW additions were delivered
gravimetrically directly to the perfusionator water column at a rate of ~43 L day-1, or a
SW residence time of ~2 days. Fine-scale control of the SW flow rate at each mesocosm
was achieved using IV drippers that were calibrated daily. PW additions were delivered
gravimetrically through a standpipe into the perfusionator reservoir located below the

77
sediment column at a rate of ~15 L day-1, or a porewater residence time of ~1.8 days.
Fine scale control of the PW flow rate into each perfusionator was achieved using an IV
dripper located at each standpipe, which was also calibrated daily.
Macroalgae (Gracilaria vermiculophylla) were collected live from HIB in May
2007 and returned to the laboratory. The algae were cleaned of epiphytes and epifauna,
rinsed with 0.7 µm filtered seawater, and placed in aquaria inside a greenhouse. Filtered
(0.7 µm) seawater was added to each tank and kept aerated while the algae were starved
for 10 days before addition to the mesocosm. Macroalgae were “starved” to ensure
depletion of internal stored nutrients and rapid uptake of the nutrients once in the
mesocosms. Live macroalgae were added to half of the light treatments in densities
observed naturally (124.8 ± 1.6 gdw m-2; McGlathery et al., 2001; Thomsen et al., 2006).
Sampling Nutrient and macroalgal additions began on Day 0. The mesocosms were
sampled prior to the additions to capture baseline conditions, and on Days 1, 3, 7, 14, 16,
21, 29 and 42. At each sampling, surface sediments (0-1 cm) were collected using two
acrylic cores (5.7 cm I.D.) and reserved for bulk (total organic C (TOC), total nitrogen
(TN)), amino acid, and fatty acid analyses. Sediments from both cores were combined in
pre-combusted glass jars, immediately frozen at -4ºC, and frozen at -80ºC within 3 days.
The remaining sediment in the cores was placed carefully back into the holes in the
mesocosm sediments. Sediments were also collected for chlorophyll a concentrations
using a cut-off syringe (1.1 cm I.D.). Samples were sectioned into 0-0.3 cm and 0.3-1.0
cm horizons, placed into 15 mL centrifuge tubes, immediately frozen at -4ºC, and

78
analyzed within 1 month. A different region of the sediment surface was sampled each
day to avoid artifacts associated with re-sampling.
Macroalgae were removed from each mesocosm, patted dry, and weighed for a
biomass estimate on Days 7, 14, 21, 29, and 42. Wet mass was converted to dry mass
using percent water estimates (72%) from G. vermiculophylla collected in the field, and
dry mass values were normalized to the mesocosm sediment surface area (0.29 m2). The
live macroalgae were kept in seawater from the respective mesocosms and returned as
quickly as possible to avoid desiccation.
Bulk analyses Samples were analyzed for benthic chlorophyll a concentrations according
to a modification of the method of Lorenzen (1967; Pinckney et al., 1994). The sediment
pellet was sonicated in 90% acetone, vortexed and extracted for 24 h at -4ºC. The
supernatant was passed through a 0.45 µm filter and read on a Shimadzu UV-1601 UV
Visible spectrophotometer (λ = 665, 750 nm). Chlorophyll a concentrations (mg m-2)
were calculated according to the equations in Lorenzen (1967). Chlorophyll a
concentrations for the 0-0.3 and 0.3-1.0 cm sections were summed to obtain
concentrations for 0-1 cm.
For bulk sediment TOC and TN measurements, sediments were freeze-dried,
ground and homogenized, acidified to remove inorganic C (Hedges & Stern, 1984), and
analyzed for TOC and TN using a Costech ECS 4010 elemental analyzer.
Total hydrolyzable amino acids Hydrolyzable amino acids (HAA) were analyzed on a
subset of the sediment samples according to the method presented in Veuger et al. (2005).

79
Freeze dried sediment (1 g) was rinsed with 2N HCl and Milli-Q water to remove
dissolved amino acids. The sediment pellet was then hydrolyzed with 6N HCl at 110ºC
for 20 h. Following purification by cation exchange chromatography, amino acids were
derivatized with isopropanol and pentafluoropropionic anhydride and further purified by
solvent extraction. Concentrations of the derivatized D- and L-amino acids were
measured by gas chromatography on a HP 6890 GC. The sum of concentrations of all
amino acids analyzed will be referred to as total hydrolyzable amino acids (THAA).
Phospholipid linked fatty acids Total fatty acids were analyzed on a subset of the
sediment samples according to a modified Bligh and Dyer (1959) method (Canuel et al.,
2007; Poerschmann & Carlson, 2006). Wet sediments (~12 g) were extracted using an
accelerated solvent extractor system (Dionex ASE 200) adapted for in-cell silica gel
chromatography. Each sample was extracted twice on the ASE: neutral lipids were
collected following extraction with a 9:1 (v:v) hexane:acetone mixture at 50ºC, then polar
lipids were collected following extraction with a 8:2 (v:v) methanol:chloroform solution
at 80ºC. Neutral and polar lipid fractions were saponified using KOH-CH3OH for 2h at
110ºC. Saponified samples were then extracted under basic and acidic conditions. The
acid-extracted fractions were methylated with BF3-CH3OH to form fatty acid methyl
esters (FAME). The neutral FAME included neutral and glycolipids while the polar
FAME represented the phospholipid-linked fatty acids (PLFA). FAME concentrations
were measured by gas chromatography with flame ionization detection (GC-FID, DB-5
column, HP 5890) and quantified using methyl heneicosanoate as an internal standard.
Peak identities were verified using reference standards as well as coupled gas

80
chromatography mass spectrometry interfaced to a mass selective detector operated in
electron impact mode (HP 6890, GC-MSD). Fatty acids are designated A:BωC, where
A is the total number of carbon atoms, B is the number of double bonds, and C is the
position of the first double bond from the aliphatic ‘‘ω’’ end of the molecule. The
prefixes ‘‘i’’ and ‘‘a’’ refer to iso- and anteiso- methyl branched fatty acids (see Canuel
et al., 1997 and references therein).
Data analysis We applied repeated measures analysis of variance (ANOVA) to examine
the effects of light (ambient vs. dark), macroalgae (presence vs. absence) and time (day)
on the sediment parameters using the Mixed procedure in SAS 9.1 (SAS Institute Inc.,
Cary, NC). In all models, a compound symmetry error structure was used to model the
within-subject covariance structure. Analysis of individual THAA and PLFA were
conducted on mole percent abundance and concentration, respectively. Results presented
use Type III sum of squares from the ANOVA model. Unless otherwise noted, values
presented are means ± 1 SE for 4 replicates.
We performed principal components analysis (PCA; Minitab 15 software) to aid
in evaluating relationships between treatments and response variables. PCA is used to
simplify a dataset by identifying a small set of variables that accounts for a large portion
of data variance. PCA were run with data from Days 1 and 42 to explore changes in
PLFA (ng FA gdw-1) and THAA (mole %) composition over the experiment. All THAA
(11 compounds) and a sub-set of PLFA (9 compounds) representing all major fatty acid
classes were used in the analyses. Prior to PCA, each dataset was normalized to total
concentration to correct for differences in concentrations between samples (Yunker et al.,
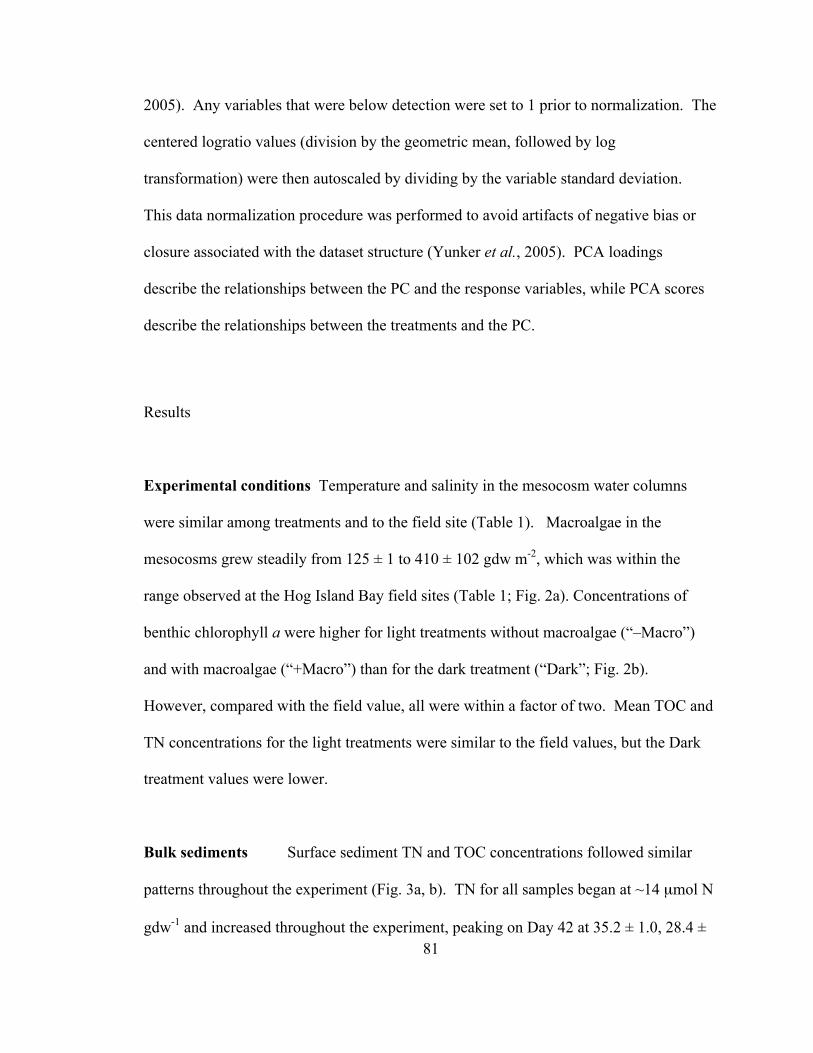
81
2005). Any variables that were below detection were set to 1 prior to normalization. The
centered logratio values (division by the geometric mean, followed by log
transformation) were then autoscaled by dividing by the variable standard deviation.
This data normalization procedure was performed to avoid artifacts of negative bias or
closure associated with the dataset structure (Yunker et al., 2005). PCA loadings
describe the relationships between the PC and the response variables, while PCA scores
describe the relationships between the treatments and the PC.
Results
Experimental conditions Temperature and salinity in the mesocosm water columns
were similar among treatments and to the field site (Table 1). Macroalgae in the
mesocosms grew steadily from 125 ± 1 to 410 ± 102 gdw m-2, which was within the
range observed at the Hog Island Bay field sites (Table 1; Fig. 2a). Concentrations of
benthic chlorophyll a were higher for light treatments without macroalgae (“–Macro”)
and with macroalgae (“+Macro”) than for the dark treatment (“Dark”; Fig. 2b).
However, compared with the field value, all were within a factor of two. Mean TOC and
TN concentrations for the light treatments were similar to the field values, but the Dark
treatment values were lower.
Bulk sediments Surface sediment TN and TOC concentrations followed similar
patterns throughout the experiment (Fig. 3a, b). TN for all samples began at ~14 µmol N
gdw-1 and increased throughout the experiment, peaking on Day 42 at 35.2 ± 1.0, 28.4 ±

82
5.0, and 19.8 ± 3.1 µmol N gdw-1 for –Macro, +Macro, and Dark treatments,
respectively. TOC increased from ~144 µmol C gdw-1 to 404.0 ± 20.6, 340.7 ± 67.0, and
248.6 ± 40.2 µmol C gdw-1 for –Macro, +Macro, and Dark treatments, respectively. Both
TN and TOC showed significant Light, Macroalgae, and Time effects (Table 2). –Macro
(light) treatment had highest TN and TOC concentrations, Dark was the lowest, and
+Macro was intermediate. C:N ratios remained relatively constant over time and
displayed no significant light or macroalgae effects (Fig. 3c; Table 2). C:N ratios across
treatments over the experiment averaged 10.7 ± 0.2.
Benthic chlorophyll a content was highly variable over time, but generally
showed the same patterns as sediment organic content (Fig. 2b). Between Day 0 and Day
42, concentrations for the –Macro treatment increased from 28.1 to 101.8 ± 34.2 mg Chl
a m-2, +Macro increased from 8.4 to 85.7 ± 60.4 mg m-2, and the Dark treatment
remained unchanged, with a mean across all samples of 11.9 ± 4.1 mg m-2. –Macro was
significantly higher than Dark (Table 2). Because of high variability between-
mesocosms within a treatment, +Macro treatments were not significantly different than –
Macro treatments.
Total Hydrolyzable Amino Acids (THAA) THAA concentrations showed similar
patterns to sediment organic content (Fig. 4a). Concentrations for all treatments
increased from ~4 µmol AA gdw-1 on Day 0 to 14.0 ± 1.3, 8.4 ± 1.1, and 6.8 ± 1.1 µmol
AA gdw-1 on Day 21 for –Macro, +Macro, and Dark treatments, respectively.
Concentrations remained steady through Day 42. –Macro had highest concentrations,
Dark was lowest, and +Macro was intermediate (Fig. 4a, Table 2). THAA-C made up

83
approximately ~14% of TOC for both light treatments and 12% of TOC for Dark
treatments, and THAA-N made up approximately 39 and 33% of TN for light and dark
treatments, respectively.
Concentrations of four selected individual amino acids are presented as mole
percentages in Figure 5; however, data for all 11 amino acids analyzed are presented in
Table 3. Across all treatments, glycine (Gly) was the most abundant amino acid, making
up approximately 25% of THAA, followed by L-alanine (L-Ala) and aspartine (Asp), L-
glutamic acid (L-Glu), proline (Pro), threonine + valine (Thr + Val), leucine (Leu), lysine
(Lys), isoleucine (Ile) and phenylalanine (Phe), and D-alanine (D-Ala). Most amino
acids showed a significant light effect, with the exception of Pro, L-Glu, and Phe (Table
2). Mole percentages of Leu, L-Ala, Thr+Val, Ile, and Lys were higher for –Macro than
Dark, while Gly, D-Ala and Asp were higher in the Dark treatment (Fig. 5a, b, c). The
only amino acid to display a significant macroalgae effect was Lys, for which mole
percentages were higher in –Macro treatments (Fig. 5d).
Phospholipid linked fatty acids (PLFA) PLFA concentrations followed patterns
similar to those of sediment organic content (Fig. 4b). –Macro had highest
concentrations, Dark was lowest, and +Macro was intermediate (Fig. 4b, Table 2.)
PLFA-C made up a variable fraction of TOC over the course of the experiment. The
Dark treatment was lowest, decreasing from 0.6 to 0.3 ± 0.03% of TOC from Days 0 to
42. Both light treatments began at 1.6% of TOC and generally decreased over time. By
Day 42, –Macro was highest, at 1.2 ± 0.3% of TOC, while +Macro ended at 0.6 ±
0.002% of TOC.

84
Groups of PLFA showed the same concentration patterns over time as total PLFA
(Fig. 6a, b; Table 2). Saturated fatty acids (SAT) were the most abundant group, making
up ~ 50% of total PLFA, followed generally by monounsaturated (MUFA; ~30%),
polyunsaturated (PUFA; 15%), and branched fatty acids (BrFA; ~5%). PUFA and BrFA
are displayed (Fig. 6a, b); however SAT and MUFA followed similar patterns. All
groups showed a significant light effect, with concentrations in -Macro exceeding Dark
(Table 2). In addition, all groups except BrFA showed a significant macroalgae effect,
with higher concentrations in the –Macro treatments.
Algal-specific fatty acids varied between treatments and over time as well (Fig.
6c-g)). Concentrations of 20:4ω6 and 20:5ω6 (diatoms; Fig. 6c, d; Volkman et al.,
1989), 18:2ω6 (diatoms, possibly green algae, cryptophytese; Fig. 6e; Volkman et al.,
1989), 18:4 (possibly cyanobacteria; Fig. 6f; Cook et al., 2004a), and 22:6ω3 (diatoms,
possibly dinoflagellates; Fig. 6g; Dijkman & Kromkamp, 2006) followed similar
patterns. All were significantly higher in the -Macro treatment than Dark. Among light
treatments, all except 18:2ω6 were higher in –Macro treatments (Table 2). 18:2ω6
showed no significant macroalgae effect. Generally, C20 PUFA were more abundant than
C18 PUFA, although their relative abundances, as demonstrated by the ratios of
20:5w3/18:2w6, shifted over time (Fig. 6h). For light treatments, this ratio decreased
from 5.7 to 1.9 ± 0.5 (–Macro) and 0.8 ± 0.3 (+Macro) from Day 0 to 42. BrFA,
representing bacterial-specific fatty acids (sum of i14:0, i15:0, a15:0, i16:0, i17:0, a17:0;
Boschker et al., 2000; Kaneda, 1991), were also more concentrated in light treatments,
but showed no significant macroalgae effect (Table 2; Fig. 6b).

85
Factor analysis PCA provided a summary of changes in sediment composition
between treatments and over time. PC1 and PC2 explained 39.9 and 21.0% of the
variance in PLFA composition, respectively (Fig. 7a, b). Both light treatments grouped
closely on Day 1, with more positive scores on PC1 than the Dark treatment (Fig. 7a).
Scores along PC2 were similar among treatments on Day 1. In contrast, the treatments
were separated along both PC1 and PC2 on Day 42. On Day 42, both light treatments
had lower scores on PC1 than Day 1; +Macro had lower scores on PC1 than –Macro, and
Dark was most negative. The variables 14:0, 16:0, 20:5ω3, and 16:1ω7 had the most
positive loadings on PC1 while BrFA and 18:2w6 had the most negative loadings (Fig.
7b). By Day 42, the treatments were also distributed along PC2. The Dark treatment had
the lowest PC2 score, –Macro was the highest, and +Macro was intermediate. BrFA had
negative PC1 and PC2 loadings, similar to Dark treatment scores on Day 42, while algal
FA tended to have more positive loadings on PC2.
In a separate analysis of THAA, PC1 and PC2 explained 36.2 and 25.0% of the
variance in THAA composition, respectively (Fig. 7c, d). Scores along both PC were
similar among treatments on Day 1, grouping near zero, but diverged by Day 42 (Fig.
7c). By Day 42, the scores on both PC for the Dark treatment remained near Day 1
values, but both light treatments shifted towards more positive scores along PC1. The
light treatments were also separated along PC2 on Day 42. –Macro had negative scores
for PC2 while +Macro was positive. Mole percentages of Leu and Ile had the most
positive loadings on PC1 while Gly and D-Ala were the most negative (Fig. 7d). Lys had
positive PC1 and negative PC2 loadings, similar to scores for –Macro on Day 42.

86
Discussion
Benthic micro- and macroalgae play an important role in system metabolism within
shallow coastal bays. However, their independent and interactive influences on sediment
organic matter are not well understood. In this study, we demonstrated that changes in
autotrophic community structure that often result from excess nutrient loading can
strongly influence sediment organic matter quality and quantity, which will ultimately
affect its lability and turnover in the system.
Role of microphytobenthos To isolate the influence of MPB on sediment organic
matter, we compared –Macro (ambient light) with the Dark treatment in our experimental
system. Almost every sediment parameter we measured showed a clear light-dark
difference, demonstrating the significant influence of MPB on sediment organic matter
(Table 2). The quantity of sediment organic matter increased in –Macro, as demonstrated
by bulk and molecular-level analyses. On a bulk scale, more sediment organic matter
(TOC, TN) accumulated in ambient –Macro treatments compared with Dark treatments.
By Day 42, TOC and TN in –Macro increased from baseline values by 173 and 141%,
respectively, compared to only 77 and 39% in the Dark. These light-dark differences
were clearly related to the activity of MPB. Chlorophyll a concentrations, which can be
considered a proxy for MPB biomass, were higher in the –Macro treatment than in the
Dark, indicating that MPB were not present and/or active in the Dark treatments.
Similarly, light-dark differences in THAA and PLFA concentrations indicated
that the presence of MPB altered sediment organic matter composition as well. By Day

87
42, THAA increased from background levels by 180% in –Macro treatments compared to
14% in the Dark. Similarly, PLFA increased by 200% from background values in –
Macro treatments and actually decreased by 27% in the Dark. Across treatments, THAA
made up a substantial fraction of sediment organic matter (~30-40% of TN and 12-20%
of TOC), similar to the concentration range found during other studies in shallow marine
systems (Cook et al., 2007; Veuger et al., 2006). Since HAA are common amino acids
found in proteins, which are abundant in all organisms, THAA included living material.
THAA also likely included non-living (detrital) material because HAA have been shown
to remain in sediments after cell death (Dauwe & Middelburg, 1998; Pantoja & Lee,
2003; Veuger et al., 2006). PLFA, on the other hand, made up a smaller fraction of TOC
(~1%), but represent only viable microbial organic matter because PLFA turnover rapidly
after cell death (Parkes, 1987). Therefore, build up of THAA represented living biomass
and detrital buildup while PLFA represented living biomass buildup alone.
Analysis of the PLFA composition lent insight into the composition of the
microbial community that developed in the –Macro and Dark treatments. Not only did
PUFA, a general algal indicator, increase over time in the light, but PLFA specific to
different microalgal communities also showed different patterns over time. For example,
20:5ω3, which is specific to diatoms (Volkman et al., 1989), was the most abundant
PUFA, suggesting that diatoms were the dominant algal class within the surface
sediments, which is consistent with surveys of microalgal community composition in
temperate systems (MacIntyre et al., 1996; Welker et al., 2002). 22:6ω3, which was
present in lower concentrations than 20:5ω3, is also found in diatoms (Dijkman &
Kromkamp, 2006), as well as dinoflagellates (Volkman et al., 1989), which do not often

88
contribute significantly to sediment microalgal communities (Barranguet et al., 1997).
Other algae that may have been present according to PLFA were green algae (18:2w6;
Volkman et al., 1989) and possibly cyanobacteria (18:4; Cook et al., 2004b), both of
which have been shown to seasonally dominate MPB communities in intertidal sediments
(Barranguet et al., 1997; Pinckney et al., 1995). However, both of these C18 PUFA can
also be present in diatoms, cryptophytes, and dinoflagellates (at trace levels) (Caron et
al.; Viso & Marty, 1993), so we cannot say for certain if green algae and cyanobacteria
were present. Over the course of the experiment, there may have been shifts in the algal
community structure, as demonstrated by changes in the ratio of 20:5ω3/18:2ω6. As this
ratio decreased over time, green algae may have been contributing more to sediment
organic matter relative to diatoms than on Day 1. Previous work has linked changes in
algal community structure with changes in nutrient limitation (Pinckney et al., 1995;
Sommer, 1996) and temperature (Tilman et al., 1986). Neither temperatures nor N
availability varied over the experiment; however, changes in other nutrients (e.g. silica,
phosphorus) may have resulted in the potential shifts in algal composition that we
observed. Algal species compositions can also change in response to top-down forces
such as the feeding preferences of grazers (Duffy & Harvilicz, 2001). These shifts were
not drastic, however. At the end of the experiment, when C18 PUFA were most
concentrated, C20 PUFA were still more abundant, suggesting that diatoms were the
dominant algal class in this study. It is not unexpected that sediment organic matter in
the –Macro light treatment increased relative to the Dark since dark systems would be
dependent on chemautotrophy as a source of new organic matter (or advection of an
external source in the field). The significance of our experiment is that we were able to

89
quantify the contribution of MPB to sediment organic matter and to characterize the
changes in sediment organic matter that result from MPB production. Our results are
consistent with previous studies, which have investigated the influence of the amount of
light, rather than the presence or absence of light, on sediment organic matter. For
example, Spivak and colleagues (2007) observed increased sediment TOC and TN
concentrations in an experimental seagrass system in treatments that received 69% more
light than their shaded treatments. They also observed increased contributions of fatty
acids derived from plant and algal sources with increased light, consistent with our PLFA
results.
Our work further demonstrates that the lability of sediment organic matter
changed as a result of MPB activity in the light. On a bulk level, TN was higher for the –
Macro treatment, which suggests that the sediment organic matter in the light was more
labile (available for degradation) than in the dark because N is generally the limiting
element in temperate marine systems. This may have been due to lower levels of THAA
in the dark; THAA contributed a smaller proportion of N to TN compared with the –
Macro treatments. On the molecular level, changes in THAA composition also indicated
changes in organic matter lability. The mole percentages of Leu and Ile were higher
while Gly was lower in -Macro. Dauwe and Middelburg (1998) developed a degradation
index based on amino acid composition, and found that mole percentages of Gly
increased and Leu and Ile decreased with increasing degradation. They suggested that
selective preservation of structural compounds versus preferential breakdown of cell
plasma material explained the contrasting behavior of the individual molecules. The fact
that the Dark treatment followed the patterns predicted by this degradation index suggests

90
that detrital material rather than newly produced biomass (e.g. by bacteria) was the
dominant source of sediment organic matter in the Dark treatment. Increases in total
THAA and PLFA concentrations are also consistent with increased organic matter
lability. High contributions of THAA to sediment organic matter and the general
susceptibility of N-containing amino acids to microbial mineralization make THAA a
potentially major source of inorganic N in sediments (Pantoja & Lee, 2003). Similarly,
fatty acids, particularly PUFA, are considered labile and make up an important
component of energy flow in benthic food webs (Canuel et al., 1995; Canuel & Martens,
1996; Sun et al., 1997).
These changes in sediment organic matter quantity and quality in turn further
shaped the sediment microbial community. The presence of labile sediment organic
matter increased bacterial production in the –Macro light treatment by providing more
substrate for bacteria. Bacterial specific PLFA concentrations were higher in the light,
suggesting build up of heterotrophic bacterial biomass within the sediments. Bacterial
PLFA increased in the Dark treatments for the first two weeks of the experiment, but then
decreased for the remainder of the experiment, ending on Day 42 below initial values.
This suggested that bacteria used up available labile organic matter in the Dark
treatments by Day 14. Previous studies have suggested that bacterial and MPB activities
may be coupled in a number of ways. First, bacteria can directly decompose detrital
MPB material, as has been observed in numerous studies (Cook et al., 2007; Veuger et
al., 2007). Second, benthic microalgae, particularly diatoms, excrete exopolymeric
substances (EPS) that aid in sediment stability and/or motility (Smith & Underwood,
1998; Taylor & Paterson, 1998; Welker et al., 2002), which also may serve as a substrate

91
for bacteria (Goto et al., 2001; Middelburg et al., 2000). Lack of bacterial biomass
buildup in the Dark treatments, in the absence of photosynthesizing-MPB, suggests that
organic matter substrate became limiting after the pool of labile organic matter in the
sediments was exhausted.
Overall, MPB fundamentally altered the sediments in this shallow photic system.
They produced labile organic matter that supported an active heterotrophic bacterial
community and increased C and N storage in the sediments. We likely observed higher
MPB and bacterial abundances relative to the field because the mesocosm system
removed some predation pressure and resuspension. However, our objectives were to
compare treatments and assess the differences due to the presence of MPB. Thus, we
present these changes as estimates of the potential influence of MPB on sediment organic
matter.
Role of benthic macroalgae Our second objective was to observe the influence of a
macroalgal bloom on sediment organic matter. MPB are limited by bottom-up forcings
such as light and nutrients (Hillebrand & Sommer, 2000; Stutes et al., 2006) as well as
top-down control by grazers. However, light availability is thought to be the primary
factor regulating MPB community growth (Heip et al., 1995; Spivak et al., 2007; Stutes
et al., 2006). Macroalgae have been shown to “self shade;” light is attenuated within the
layers of an algal mat (Krause-Jensen et al., 1996; Peckol & Rivers, 1996), affecting
overall mat metabolism (Brush & Nixon, 2003; Krause-Jensen et al., 1996). Self-shading
has been suggested as a possible cause for mid-summer macroalgal mat crashes that have
been observed in numerous systems (McGlathery et al., 2001; Sfriso et al., 1992). Thus,

92
light available to plants below macroalgal mats (e.g. seagrass) will also be reduced due to
shading by macroalgae and is suggested as a mechanism by which macroalgal blooms
have contributed to global seagrass declines (Hauxwell et al., 2001). It is therefore likely
that shading of the sediment surface by macroalgae may also reduce MPB activity
(Sundback & McGlathery, 2005). Macroalgae were added to the mesocosms at densities
observed in Hog Island Bay as well as other shallow coastal bays, and their final densities
(4-fold increase) were within the range of more eutrophied lagoons (Hauxwell et al.,
2001; McGlathery et al., 2001; Pregnall & Rudy, 1985; Sfriso et al., 1992). Our
intensive sampling throughout the experiment allowed us to track changes between the
light treatments with and without macroalgae as the macroalgal bloom developed. We
were able to not only detect changes in many of the sediment parameters that suggested
that the presence of macroalgae influenced sediment organic matter, but we were also
able to detect the timing of those changes relative to the increase in macroalgal density.
Numerous sediment parameters suggested that macroalgae affected sediment
organic matter quantity. TOC, TN, THAA, and PLFA concentrations were all lower in
+Macro treatments compared to –Macro treatments. By Day 42, organic matter
accumulation in +Macro treatments was intermediate between the –Macro and Dark
treatments. TOC, TN, and THAA increased from background values by 130, 94, and
97%, respectively. PLFA, on the other hand, increased until ~Day 14 and then decreased
15% from initial values by Day 42, similar to the Dark treatments.
Molecular-level analyses also indicated that the Macroalgae treatment affected the
composition of sediment organic matter. Total PUFA, and individual algal PLFA
concentrations were lower in +Macro treatments indicating that macroalgae limited MPB

93
production. Like total PLFA, not all individual algal PLFA showed a significant
macroalgae treatment effect even though concentrations on Day 42 were lower in +Macro
versus –Macro. This was likely due to the similar trajectories followed by both light
treatments for the first ~14 days of the experiment, which was then followed by divergent
trajectories for the treatments with and without macroalgae. After Day 14, concentrations
of organic matter parameters in +Macro treatments were lower than –Macro treatments.
These changes over time likely related to the macroalgal density within the mesocosms.
By Day 14, macroalgal biomass was ~300 gdw m-2. According to a study by Krause-
Jensen and colleagues (1996), this is the estimated value above which macroalgae
completely block light reaching MPB. After this critical density in our experiment, MPB
production decreased and sediment organic matter built up more slowly in +Macro
treatments. Even if macroalgal biomass had remained below 300 gdw m-2, chronic
shading by macroalgae would have likely decreased MPB metabolism, as has been
observed in studies investigating the effects of shading on MPB metabolism (Stutes et al.,
2006; Sundback & McGlathery, 2005). In the field, unattached macroalgae may be more
motile than in our study; however, the degree of motility will depend on system-specific
factors such as the degree of eutrophication, how widespread the macroalgal bloom is,
and the depth and fetch of the system. It is not uncommon in eutrophied systems for
macroalgal blooms to reach densities above 300 gdw m-2 and persist for days to weeks
(see Sundback & McGlathery, 2005 and references therein), which is sufficiently long,
according to our results, to negatively affect MPB metabolism.
As with our light-dark comparison, the presence of macroalgae also changed the
quality of sediment organic matter. Concentrations of PLFA in +Macro treatments

94
remained level after Day 14, and the fraction of TOC from PLFA-C actually decreased,
suggesting that production of labile organic matter slowed down compared to the –Macro
treatment. The mole fraction of Lys was also lower in +Macro treatments with values
that were similar to the Dark treatment. Lys makes up a large fraction of THAA in
macroalgae and bacteria (5-15%) (Cowie & Hedges, 1992), so a lower concentration in
sediment THAA likely indicated decreased microbial activity. Additional studies suggest
that Lys is selectively degraded due to its simple structure and high N content (Cowie &
Hedges, 1992). As a result of changes in sediment organic matter quantity and
composition, the heterotrophic bacterial community differed in treatments with
macroalgae. Bacterial PLFA concentrations were lower in treatments with macroalgae
by Day 42; however, there was not a significant macroalgae effect across treatments.
Again, as with total PLFA, we attribute this to the similarity between light treatments at
lower macroalgal densities.
Synthesis PCA results summarized the changes in the dominant controls on sediment
organic matter on Day 1 versus Day 42. On Day 1, light influenced PLFA composition,
promoting development of more algal fatty acids in both light treatments than in the
Dark. Because the macroalgae had only been present for 1 day, there were no significant
macroalgae differences. THAA composition did not yet differ between any treatments.
By Day 42, after macroalgal biomass had increased by 4-fold, all treatments existed
along a gradient of PLFA and THAA composition. Sediment composition in +Macro
treatments shifted away from –Macro treatments towards the Dark treatments, with less
influence from algal PLFA and the more labile amino acids (e.g. Leu, Ile) and more

95
influence from bacterial PLFA and less labile amino acids (e.g. Gly, D-Ala). In both
light treatments, we also observed shifts in MPB community composition by Day 42. On
Day 1, 20:5ω3 was the most prominent algal PUFA, and by Day 42, algae producing
18:2ω6 contributed relatively more to algal PLFA than on Day 1.
Overall, MPB fundamentally altered sediment organic matter quality and
quantity; however, the role of MPB as a source of labile sediment organic matter was
significantly diminished due to shading by macroalgae. The potential ecological
consequences of decreased MPB production are numerous. For example, biogeochemical
processes such as denitrification are affected by diel variations in oxygen related to MPB
metabolism as well as competition with MPB for dissolved N (An & Joye, 2001;
Rysgaard et al., 1995). In addition, MPB are a nutrient-rich food source for numerous
faunal grazers (Miller et al., 1996) and to heterotrophic bacteria (Banta et al., 2004).
Sediment stability is also enhanced by the presence of benthic diatoms that produce EPS
(Tolhurst et al., 2002). Lastly, macroalgae likely decreased retention of C and N in MPB
and bacterial biomass in surface sediments, which diminished a potentially important sink
for C and N in these systems (McGlathery et al., 2007). Our results demonstrate that
shading by macroalgae significantly altered sediment organic matter properties that
influence ecosystem processes, and chronic shading by dense macroalgal blooms will
likely result in surface sediments that more closely resemble sediments outside of the
euphotic zone.

96
Literature Cited
An, S., Joye, S.B., (2001) Enhancement of coupled nitrification-denitrification by benthic photosynthesis in shallow estuarine sediments. Limnology and Oceanography, 46(1), 62-74.
Anderson, I.C., McGlathery, K.J., Tyler, A.C., (2003) Microbial mediation of 'reactive' nitrogen transformations in a temperate lagoon. Marine Ecology Progress Series, 246, 73-84.
Banta, G.T., Pedersen, M.F., Nielsen, S.L., (2004) Decomposition of marine primary producers: Consequences for nutrient recycling and retention in coastal ecosystems. In: S.L. Nielsen, G.T. Banta, M.F. Pedersen (Eds.), Estuarine Nutrient Cycling: The Influence of Primary Producers (Ed. by S.L. Nielsen, G.T. Banta, M.F. Pedersen), pp. 187-216. Kluwer Academic Publishers, Netherlands.
Barranguet, C., Herman, P.M.J., Sinke, J.J., (1997) Microphytobenthos biomass and community somposition studied by pigment biomarkers: importance and fate in the carbon cycle of a tidal flat. Journal of Sea Research, 38, 59-70.
Benoy, G.A., Kalff, J., (1999) Sediment accumulation and Pb burdens in submerged macrophyte beds. Limnology and Oceanography, 44, 1081-1090.
Bligh, E.G., Dyer, W.J., (1959) A Rapid Method of Total Lipid Extraction and Purification. Canadian Journal of Biochemistry and Physiology, 37(8), 911-917.
Boschker, H.T.S., Brouwer, J.F.C.d., Cappenberg, T.E., (1999) The contribution of macrophyte-derived organic matter to microbial biomass in salt-marsh sediments: Stable carbon isotope analysis of microbial biomarkers. Limnology and Oceanography, 44(2), 309-319.
Boschker, H.T.S., Wielemaker, A., Schaub, B.E.M., Holmer, M., (2000) Limited coupling of macrophyte production and bacterial carbon cycling in the sediments of Zostera spp. meadows. Marine Ecology Progress Series, 203, 181-189.
Bouillon, S., Boschker, H.T.S., (2006) Bacterial carbon sources in coastal sediments: a cross-system analysis based on stable isotope data of biomarkers. Biogeosciences, 3, 175-185.
Brush, M.J., Nixon, S.W., (2003) Biomass layering and metabolism in mats of the macroalga Ulva lactuca L. Estuaries, 26(4A), 916-926.
Canuel, E.A., Cloern, J.E., Ringelberg, D.B., Guckert, J.B., Rau, G.H., (1995) Molecular and isotopic tracers used to examine sources of organic matter and its

97
incorporation into the food webs of San Francisco Bay. Limnology and Oceanography, 40(1), 67-81.
Canuel, E.A., Freeman, K.H., Wakeham, S.G., (1997) Isotopic compositions of lipid biomarker compounds in estuarine plants and surface sediments. Limnology and Oceanography, 42(7), 1570-1583.
Canuel, E.A., Martens, C.S., (1993) Seasonal-Variations in the Sources and Alteration of Organic-Matter Associated with Recently-Deposited Sediments. Organic Geochemistry, 20(5), 563-577.
Canuel, E.A., Martens, C.S., (1996) Reactivity of recently deposited organic matter: Degradation of lipid compounds near the sediment-water interface. Geochimica et Cosmochimica Acta, 60(10), 1793-1806.
Canuel, E.A., Spivak, A.C., Waterson, E.J., Duffy, J.E., (2007) Biodiversity and food web structure influence short-term accumulation of sediment organic matter in an experimental seagrass system. Limnology and Oceanography, 52(2), 590-602.
Caron, B., et al. (1996) Status of the VIRGO experiment. Nuclear Physics B, 107-109.
Cook, P.L.M., Butler, E.C.V., Eyre, B.D., (2004a) Carbon and nitrogen cycling on intertidal mudflats of a temperate Australian estuary. I. Benthic metabolism. Marine Ecology-Progress Series, 280, 25-38.
Cook, P.L.M., Revill, A.T., Clementson, L.A., Volkman, J.K., (2004b) Carbon and nitrogen cycling on intertidal mudflats of a temperate Australian estuary. III. Sources of organic matter. Marine Ecology-Progress Series, 280, 55-72.
Cook, P.L.M., Veuger, B., Boer, S., Middelburg, J.J., (2007) Effect of nutrient availability on carbon and nitrogen incorporation and flows through benthic algae and bacteria in near-shore sandy sediment. Aquatic Microbial Ecology, 49, 165-180.
Cowie, G.L., Hedges, J.I., (1992) Sources and Reactivities of Amino-Acids in a Coastal Marine-Environment. Limnology and Oceanography, 37(4), 703-724.
Dauwe, B., Middelburg, J.J., (1998) Amino acids and hexosamines as indicators of organic matter degradation state in North Sea sediments. Limnology and Oceanography, 43(5), 782-798.
Dijkman, N.A., Kromkamp, J.C., (2006) Phospholipid-derived fatty acids as chemotaxonomic markers for phytoplankton: application for inferring phytoplankton composition. Marine Ecology-Progress Series, 324, 113-125.
Duarte, C.M., (1995) Submerged Aquatic Vegetation in Relation to Different Nutrient Regimes. Ophelia, 41, 87-112.

98
Duffy, J.E., Harvilicz, A.M., (2001) Species-specific impacts of grazing, amphipods in an eelgrass-bed community. Marine Ecology-Progress Series, 223, 201-211.
Fonseca, M.S., Calahan, J.A., (1992) A preliminary evaluation of wave attenuation by four species of seagrass. Estuarine Coastal and Shelf Science, 25, 565-576.
Gacia, E., Duarte, C.M., Middelburg, J.J., (2002) Carbon and nutrient deposition in a Mediterranean seagrass (Posidonia oceanica) meadow. Limnology and Oceanography, 47(1), 23-32.
Goto, N., Mitamura, O., Terai, H., (2001) Biodegradation of photosynthetically produced
extracellular organic carbon from intertidal benthic algae. Journal of Experimental Marine Biology and Ecology, 257(1), 73-86.
Gray, J.S., Wu, R.S., Or, Y.Y., (2002) Effects of hypoxia and organic enrichment on the coastal marine environment. Marine Ecology Progress Series, 238, 249-279.
Hardison, A.K., Tobias, C.R., Stanhope, J.W., Canuel, E.A., Anderson, I.C., (Submitted) An experimental apparatus for laboratory and field-based perfusion of sediment porewater with dissolved tracers. Estuaries and Coasts.
Hauxwell, J., Cebrian, J., Furlong, C., Valiela, I., (2001) Macroalgal canopies contribute to eelgrass (Zostera marina) decline in temperate estuarine ecosystems. Ecology, 82(4), 1007-1022.
Hauxwell, J., Cebrian, J., Valiela, I., (2003) Eelgrass Zostera marina loss in temperate estuaries: relationship to land-derived nitrogen loads and effect of light limiataion imposed by algae. Marine Ecology Progress Series, 247, 59-73.
Heck, K.L., Hays, G., Orth, R.J., (2003) Critical evaluation of the nursery role hypothesis for seagrass meadows. Marine Ecology Progress Series, 253, 123-136.
Hedges, J.I., Stern, J.H., (1984) Carbon and Nitrogen Determinations of Carbonate-Containing Solids. Limnology and Oceanography, 29(3), 657-663.
Heip, C., Goosen, N.K., Herman, P., Kromkamp, J.C., Middelburg, J.J., Soetaert, K., (1995) Production and consumption of biological particles in temperate tidal estuaries. Oceanography and Marine Biology Annual Reviews, 33(1-150).
Hillebrand, H., Sommer, U., (2000) Marine microbenthic community structure regulated by nitrogen loading and grazing pressure. Marine Ecology Progress Series, 204, 27-38.
Jumars, P.A., Eckman, J.E., Koch, E., (2001) Macroscopic animals and plants in benthic flows. In: B.P. Boudreau, B.B. Jorgensen (Eds.), The benthic boundary layer (Ed. by B.P. Boudreau, B.B. Jorgensen), pp. 320-347. Oxford University Press.

99
Kaneda, T., (1991) Iso-Fatty and Anteiso-Fatty Acids in Bacteria - Biosynthesis, Function, and Taxonomic Significance. Microbiological Reviews, 55(2), 288-302.
Kenworthy, W.J., Zieman, J.C., Thayer, G.W., (1982) Evidence for the influence of seagrasses on the benthic nitrogen cycle in a coastal plain estuary near Beaufort, North Carolina (USA). Oecologia, 54, 152-158.
Krause-Jensen, D., Christensen, P.B., Rysgaard, S., (1999) Oxygen and nutrient dynamics within mats of the filamentous macroalga Chaetomorphalinum Estuaries, 22, 31-38.
Krause-Jensen, D., McGlathery, K., Rysgaard, S., Christensen, P.B., (1996) Production within dense mats of the filamentous macroalga Chaetomorpha linum in relation to light and nutrient availability. Marine Ecology-Progress Series, 134(1-3), 207-216.
Lorenzen, C.J., (1967) Determination of Chlorophyll and Pheo-Pigments - Spectrophotometric Equations. Limnology and Oceanography, 12(2), 343-&.
MacIntyre, H.L., Geider, R.J., Miller, D.C., (1996) Microphytobenthos: The ecological role of the ''secret garden'' of unvegetated, shallow-water marine habitats .1. Distribution, abundance and primary production. Estuaries, 19(2A), 186-201.
McGlathery, K.J., Anderson, I.C., Tyler, A.C., (2001) Magnitude and variability of benthic and pelagic metabolism in a temperate coastal lagoon. Marine Ecology-Progress Series, 216, 1-15.
McGlathery, K.J., Sundback, K., Anderson, I.C., (2007) Eutrophication in shallow coastal bays and lagoons: the role of plants in the coastal filter. Marine Ecology-Progress Series, 348, 1-18.
Middelburg, J.J., Barranguet, C., Boschker, H.T.S., Herman, P.M.J., Moens, T., Heip,
C.H.R., (2000) The fate of intertidal microphytobenthos carbon: An in situ C-13-labeling study. Limnology and Oceanography, 45(6), 1224-1234.
Miller, D.C., Geider, R.J., MacIntyre, H.L., (1996) Microphytobenthos: The ecological role of the ''secret garden'' of unvegetated, shallow-water marine habitats .2. Role in sediment stability and shallow-water food webs. Estuaries, 19(2A), 202-212.
Nielsen, S.L., Enriquez, S., Duarte, C.M., SandJensen, K., (1996) Scaling maximum growth rates across photosynthetic organisms. Functional Ecology, 10(2), 167-175.
Nilsson, P., Jonsson, B., Swanberg, I.L., Sundback, K., (1991) Response of a Marine Shallow-Water Sediment System to an Increased Load of Inorganic Nutrients. Marine Ecology-Progress Series, 71(3), 275-290.

100
Nixon, S.W., (1995) Coastal Marine Eutrophication - a Definition, Social Causes, and Future Concerns. Ophelia, 41, 199-219.
Norkko, A., (1998) The impact of loose-lying algal mats and predation by the brown shrimp Crangon crangon (L.) on infaunal prey dispersal and survival. Journal of Experimental Marine Biology and Ecology, 221, 99-116.
Norkko, J., Bonsdorff, E., Norkko, A., (2000) Drifting algal mats as an alternative habitat for benthic invertebrates: species-specific responses to a transient resource. Journal of Experimental Marine Biology and Ecology, 248, 79-104.
NRC, (2000) National Research Council. Clean coastal waters: understanding and reducing the effects of nutrient pollution. National Academy Press, Washington, DC.
Orth, R.J., Heck, K.L., van Montfrans, J., (1984) Faunal components in seagrass beds: a review of the influence of plant structure and prey characteristics on predator-prey relationships. Estuaries, 7, 339-250.
Pantoja, S., Lee, C., (2003) Amino acid remineralization and organic matter lability in Chilean coastal sediments. Organic Geochemistry, 34(8), 1047-1056.
Parkes, R.J., (1987) Analysis of microbial communities within sediments using biomarkers. In: M. Hetcher, R.T.G. Gray, J.G. Jones (Eds.), Ecology of Microbial Communities (Ed. by M. Hetcher, R.T.G. Gray, J.G. Jones), pp. 147-177. Cambridge University Press, Cambridge.
Paterson, D.M., Black, K.S., (1999) Water flow, sediment dynamics, and benthic biology. Advances in Ecological Research, 29, 155-193.
Peckol, P., Rivers, J.S., (1996) Contribution by macroalgal mats to primary production of a shallow embayment under high and low nitrogen-loading rates. Estuarine Coastal and Shelf Science, 43(3), 311-325.
Pedersen, M.F., Nielsen, S.L., Banta, G.T., (2004) Interactions between vegetation and nutrient dynamics in coastal marine ecosystems: An introduction. In: S.L. Nielsen, G.T. Banta, M.F. Pedersen (Eds.), Estuarine Nutrient Cycling: The Influence of Primary Producers (Ed. by S.L. Nielsen, G.T. Banta, M.F. Pedersen). Kluwer, Dordrecht.
Pinckney, J., Paerl, H.W., Fitzpatrick, M., (1995) Impacts of Seasonality and Nutrients on Microbial Mat Community Structure and Function. Marine Ecology-Progress Series, 123(1-3), 207-216.
Pinckney, J., Papa, R., Zingmark, R., (1994) Comparison of High-Performance Liquid-Chromatographic, Spectrophotometric, and Fluorometric Methods for

101
Determining Chlorophyll a Concentrations in Estuarine Sediments. Journal of Microbiological Methods, 19(1), 59-66.
Poerschmann, J., Carlson, R., (2006) New fractionation scheme for lipid classes based on "in-cell fractionation" using sequential pressurized liquid extraction. Journal of Chromatography A, 1127(1-2), 18-25.
Pregnall, A.M., Rudy, P.P., (1985) Contribution of green macroalgal mats (Enteromorpha spp.) to seasonal production in an estuary. Marine Ecology Progress Series, 24, 167-176.
Raffaelli, D.G., Raven, J.H., Poole, L.J., (1998) Ecological impact of green macroalgal blooms. Oceanography and Marine Biology - an Annual Review, 36(97-125).
Risgaard-Petersen, (2003) Coupled nitrification-denitrification in autotrophic and heterotrophic estuarine sediments: On the influence of benthic microalgae. Limnol. Oceanogr., 48(1), 93-105.
Rysgaard, S., Christensen, P.B., Nielsen, L.P., (1995) Seasonal-Variation in Nitrification and Denitrification in Estuarine Sediment Colonized by Benthic Microalgae and Bioturbating Infauna. Marine Ecology-Progress Series, 126(1-3), 111-121.
Sand-Jensen, K., Borum, J., (1991) Interactions among phytoplankton, periphyton, and macrophytes in temperate freshwaters and estuaries. Aquatic Botany, 41, 137-175.
Sfriso, A., Pavoni, B., Marcomini, A., Raccanelli, S., Orio, A.A., (1992) Particulate Matter Deposition and Nutrient Fluxes onto the Sediments of the Venice Lagoon. Environmental Technology, 13(5), 473-483.
Smith, D.J., Underwood, G.J.C., (1998) Exopolymer production by intertidal epipelic diatoms. Limnology and Oceanography, 43(7), 1578-1591.
Sommer, U., (1996) Nutrient competition experiments with periphyton from the Baltic Sea. Marine Ecology-Progress Series, 140(1-3), 161-167.
Spivak, A.C., Canuel, E.A., Duffy, J.E., Richardson, J.P., (2007) Top-down and bottom-up controls on sediment organic matter composition in an experimental seagrass ecosystem. Limnology and Oceanography, 52(6), 2595-2607.
Stutes, A.L., Cebrian, J., Corcoran, A.A., (2006) Effects of nutrient enrichment and shading on sediment primary production and metabolism in eutrophic estuaries. Marine Ecology-Progress Series, 312, 29-43.
Sun, M.Y., Wakeham, S.G., Lee, C., (1997) Rates and mechanisms of fatty acid degradation in oxic and anoxic coastal marine sediments of Long Island Sound, New York, USA. Geochimica et Cosmochimica Acta, 61(2), 341-355.

102
Sundback, K., McGlathery, K.J., (2005) Interactions between benthic macro- and microalgae in the marine environment. In: E. Kristensen, J.E. Kostka, R.H. Haese (Eds.), Interactions between macro- and microorganisms in marine sediments. (Ed. by E. Kristensen, J.E. Kostka, R.H. Haese). American Geophysical Union.
Sundback, K., Nilsson, P., Nilsson, C., Jonsson, B., (1996) Balance between autotrophic and heterotrophic components and processes in microbenthic communities of sandy sediments: A field study. Estuarine Coastal and Shelf Science, 43(6), 689-706.
Taylor, I.S., Paterson, D.M., (1998) Microspatial variation in carbohydrate concentrations
with depth in the upper millimetres of intertidal cohesive sediments. Estuarine Coastal and Shelf Science, 46, 359-370.
Thomsen, M.S., McGlathery, K.J., Tyler, A.C., (2006) Macroalgal distribution patterns in a shallow, soft-bottom lagoon, with emphasis on the nonnative Gracilaria vermiculophylla and Coldium fragile. Estuaries and Coasts, 29(3), 465-473.
Tilman, D., Kiesling, R., Sterner, R., Kilham, S.S., Johnson, F.A., (1986) Green, Bluegreen and Diatom Algae - Taxonomic Differences in Competitive Ability for Phosphorus, Silicon and Nitrogen. Archiv Fur Hydrobiologie, 106(4), 473-485.
Tolhurst, T.J., Gust, G., Paterson, D.M., (2002) The influence of an extracellular polymeric substance (EPS) on cohesive sediment stability. In: J.C. Winterwerp, C. Kranenburg (Eds.), Fine Sediment Dynamics in the Marine Environment (Ed. by J.C. Winterwerp, C. Kranenburg). Elsevier, San Diego.
Tyler, A.C., McGlathery, K.J., Anderson, I.C., (2001) Macroalgae mediation of dissolved organic nitrogen fluxes in a temperate coastal lagoon. Estuarine Coastal and Shelf Science, 53(2), 155-168.
Tyler, A.C., McGlathery, K.J., Anderson, I.C., (2003) Benthic algae control sediment-water column fluxes of organic and inorganic nitrogen compounds in a temperate lagoon. Limnology and Oceanography, 48(6), 2125-2137.
Valiela, I., Foreman, K., Lamontagne, M., Hersh, D., Costa, J., Peckol, P., Demeoandreson, B., Davanzo, C., Babione, M., Sham, C.H., Brawley, J., Lajtha, K., (1992) Couplings of Watersheds and Coastal Waters - Sources and Consequences of Nutrient Enrichment in Waquoit Bay, Massachusetts. Estuaries, 15(4), 443-457.
Valiela, I., McClelland, J., Hauxwell, J., Behr, P.J., Hersh, D., Foreman, K., (1997) Macroalgal blooms in shallow estuaries: Controls and ecophysiological and ecosystem consequences. Limnology and Oceanography, 42(5), 1105-1118.

103
Veuger, B., Eyre, B.D., Maher, D., Middelburg, J.J., (2007) Nitrogen incorporation and retention by bacteria, algae, and fauna in a subtropical intertidal sediment: An in situ N-15-labeling study. Limnology and Oceanography, 52(5), 1930-1942.
Veuger, B., Middelburg, J.J., Boschker, H.T.S., Houtekamer, M., (2005) Analysis of N-15 incorporation into D-alanine: A new method for tracing nitrogen uptake by bacteria. Limnology and Oceanography-Methods, 3, 230-240.
Veuger, B., van Oevelen, D., Boschker, H.T.S., Middelburg, J.J., (2006) Fate of peptidoglycan in an intertidal sediment: An in situ C-13-labeling study. Limnology and Oceanography, 51(4), 1572-1580.
Viso, A.C., Marty, J.-C., (1993) Fatty acids from 28 marine microalgae. Phytochemistry, 34, 1521-1533.
Volkman, J.K., Jeffrey, S.W., Nichols, P.D., Rogers, G.I., Garland, C.D., (1989) Fatty-Acid and Lipid-Composition of 10 Species of Microalgae Used in Mariculture. Journal of Experimental Marine Biology and Ecology, 128(3), 219-240.
Volkman, J.K., Revill, A.T., Holdsworth, D.G., Fredericks, D., (2008) Organic matter sources in an enclosed coastal inlet assessed using lipid biomarkers and stable isotopes. Organic Geochemistry, 39, 689-710.
Welker, C., Sdrigotti, E., Covelli, S., Fagan, J., (2002) Microphytobenthos in the Gulf of Trieste (Northern Adriatic Sea): Relationship with Labile Sedimentary Organic Matter and Nutrients. Estuarine, Coastal and Shelf Science, 55, 259-273.
Wolfstein, K., de Brouwer, J.F.C., Stal, L.J., (2002) Biochemical partitioning of photosynthetically fixed caarbon by benthic diatoms during short-term incubatiions at different irradiances. Mar Ecol Prog Ser, 245, 21-31.
Yunker, M.B., Belicka, L.L., Harvey, H.R., Macdonald, R.W., (2005) Tracing the inputs and fate of marine and terrigenous organic matter in Arctic Ocean sediments: A multivariate analysis of lipid biomarkers. Deep-Sea Research II, 52, 3478-3508.

104
Table 3-1: Parameters measured concurrently at Hog Island Bay field sites and in
mesocosms.
Field samples were taken at shoal sites on three dates while mesocosm experiment was
being conducted. Mesocosm values are means of daily means across all time steps.
Values are mean (SE) for field (n = 5) and mesocosm treatments (n = 9).
Parameter Field -Macro +Macro Dark Temperature (°C) 24.1 (1.6) 23.6 (2.9) 23.9 (2.9) 23.7 (2.8) Salinity (psu) 31.4 (0.6) 31.6 (1.3) 31.5 (1.3) 31.0 (1.0) Macroalgal density (gdw m-2) 59.2 (30.7) n/a 278.6 (31.4) n/a range 0 - 355 n/a 124 - 513 n/a Benthic chlorophyll a (mg m-2) 24.9 (7.1) 74.1 (9.7) 59.5 (7.2) 11.9 (1.6) Sediment TOC (mmol C gdw-1) 185.4 (32.3) 302.9 (23.3) 232.6 (15.3) 208.6 (21.1) Sediment TN (mmol N gdw-1) 22.3 (3.1) 28.2 (1.9) 22.8 (1.0) 18.1 (1.5)

105
Table 3-2: Results of two-factor repeated measures ANOVA.
ANOVA used to test for differences in Light, Macroalgae over time for various sediment
organic matter variables. Significant p values (< 0.05) are indicated in bold.
LIGHT MACROALGAE TIME
df F p df F p df F p TN 9 31.97 0.0003 9 8.73 0.0161 61 9.24 <0.0001 TOC 9 13.5 0.0051 9 7.61 0.0222 61 12.39 <0.0001 C:N 9 2.35 0.1598 9 2.77 0.1302 61 6.02 <0.0001 BCHLA 9 27.65 0.0005 9 0.83 0.3849 61 0.43 0.8325 THAA 8 29.94 0.0006 8 6.25 0.0369 38 4.57 0.0020 %THAA/TN 8 21.59 0.0017 8 4.62 0.0638 38 20.45 <0.0001 %THAA/TOC 8 12.83 0.0072 8 0.71 0.4249 38 24.76 <0.0001 %GLY 8 13.31 0.0065 8 0.07 0.7947 38 2.19 0.0759 %LGLU 8 0.05 0.8316 8 0.04 0.8561 38 1.95 0.1093 %LEU 8 113.11 <0.0001 8 0.08 0.7868 38 4.48 0.0026 %DALA 8 41.44 0.0002 8 0.3 0.6000 38 2.45 0.0508 %LALA 8 6.45 0.0347 8 0.19 0.6736 38 5.03 0.0012 %THR+VAL 8 8.4 0.0199 8 0.33 0.579 38 2.55 0.0438 %ILE 8 36.36 0.0003 8 0.71 0.425 38 8.29 <0.0001 %PRO 8 0.37 0.5583 8 2.64 0.1428 38 2.02 0.0975 %ASP 8 7.94 0.0226 8 3.13 0.1148 38 5.67 0.0005 %PHE 8 0.01 0.9235 8 0.06 0.8177 38 0.58 0.7173 %LYS 8 12 0.0085 8 10.17 0.0128 38 1.83 0.1312 PLFA 9 209.95 <0.0001 9 54.28 <0.0001 34 1.85 0.1424 %PLFA/TOC 65.84 <0.0001 9 5.18 0.0489 34 3.98 0.0094 SatFA 9 98.43 <0.0001 9 23.01 0.001 34 1.15 0.3552 MUFA 9 202.87 <0.0001 9 46.09 <0.0001 34 1.72 0.1559 PUFA 9 59.19 <0.0001 9 19.17 0.0018 34 1.24 0.3121 BrFA 9 17.01 0.0026 9 3.75 0.0848 34 5.37 0.0010 16:1ω7 9 36.25 0.0002 9 6.07 0.0359 34 1.59 0.1882 18:2ω6 9 19.03 0.0018 9 3.02 0.1162 34 3.11 0.0204 18:4 9 23.47 0.0009 9 7.66 0.0218 34 0.73 0.6094 20:4ω6 9 14.34 0.0043 9 6.32 0.0331 34 1.33 0.2753 20:5ω3 9 109.42 <0.0001 9 27.53 0.0005 34 1.97 0.1088 22:6ω3 9 47.14 <0.0001 9 12.12 0.0069 34 2.25 0.072 20:5/18:2 9 27.52 0.0005 9 1.99 0.1916 34 7.35 <0.0001

106
Tab
le 3
-3 C
ompo
sitio
n as
mol
e pe
rcen
t for
indi
vidu
al a
min
o ac
ids o
f TH
AA
.
Val
ues r
epre
sent
mea
n (S
E), n
= 4
.
Trea
tmen
t Day
D
-Ala
L-
Ala
Th
r+V
al
Gly
Ile
Le
u Pr
o A
sp
L-G
lu
Phe
Lys
-Mac
ro
-1
0.92
(0.0
1)
13.5
5 (0
.36)
6.
89 (0
.01)
26
.49
(0.9
7)
3.46
(0.0
6)
6.03
(0.0
3)
7.89
(0.0
3)
15.6
2 (0
.04)
12
.03
(0.0
6)
1.87
(1.2
9)
5.26
(0.1
0)
1
0.84
(0.0
4)
14.4
9 (0
.09)
6.
71 (0
.25)
26
.51
(0.8
1)
3.44
(0.1
) 6.
35 (0
.18)
7.
53 (0
.13)
14
.13
(0.2
6)
11.8
7 (0
.29)
2.
69 (0
.11)
5.
44 (0
.15)
3 0.
82 (0
.09)
13
.59
(0.7
4)
6.83
(0.2
6)
23.6
2 (1
.46)
3.
17 (0
.11)
7.
13 (0
.38)
7.
46 (0
.43)
16
.05
(1.4
3)
12.3
6 (0
.62)
3.
23 (0
.28)
5.
75 (0
.74)
7 0.
69 (0
.03)
14
.76
(0.2
6)
7.38
(0.4
0)
24.5
7 (1
.44)
3.
74 (0
.25)
7.
06 (0
.56)
8.
44 (0
.65)
13
.40
(0.3
) 11
.38
(1.1
9)
2.77
(0.2
5)
5.80
(0.3
6)
14
0.
70 (0
.03)
15
.56
(0.3
9)
7.46
(0.3
4)
23.4
6 (0
.61)
4.
12 (0
.12)
7.
94 (0
.24)
8.
04 (0
.36)
11
.88
(1.2
2)
11.3
4 (0
.44)
3.
26 (0
.14)
6.
24 (0
.42)
21
0.58
(0.0
4)
14.0
1 (0
.69)
7.
40 (0
.26)
22
.15
(1.2
0)
3.88
(0.0
7)
7.49
(0.1
6)
8.24
(0.3
4)
13.3
8 (0
.81)
13
.29
(0.8
8)
3.13
(0.1
0)
6.44
(0.4
8)
42
0.
71 (0
.04)
14
.82
(0.3
5)
7.62
(0.1
7)
22.6
5 (0
.46)
4.
10 (0
.08)
7.
88 (0
.18)
7.
73 (0
.23)
13
.85
(0.5
6)
11.5
1 (0
.42)
3.
21 (0
.11)
5.
93 (0
.47)
+
Mac
ro
-1
0.92
(0.0
1)
13.5
5 (0
.36)
6.
89 (0
.01)
26
.49
(0.9
7)
3.46
(0.0
6)
6.03
(0.0
3)
7.89
(0.0
3)
15.6
2 (0
.04)
12
.03
(0.0
6)
1.87
(1.2
9)
5.26
(0.1
0)
1
0.80
(0.0
0)
14.1
8 (0
.16)
6.
53 (0
.15)
24
.66
(0.0
5)
3.54
(0.0
1)
6.65
(0.0
1)
7.49
(0.1
2)
15.2
1 (0
.13)
12
.57
(0.2
3)
2.92
(0.0
9)
5.46
(0.0
4)
3
0.70
(0.0
6)
13.2
9 (0
.27)
6.
77 (0
.18)
24
.86
(0.7
9)
3.61
(0.1
5)
8.04
(0.1
4)
6.78
(1.6
7)
16.2
3 (2
.34)
11
.95
(0.5
7)
3.25
(0.3
2)
4.52
(1.2
6)
7
0.75
(0.0
2)
15.6
3 (0
.48)
6.
50 (0
.92)
24
.65
(0.2
1)
3.55
(0.0
6)
7.15
(0.0
6)
8.10
(0.1
1)
13.4
3 (0
.87)
11
.91
(0.5
7)
3.00
(0.1
6)
5.34
(0.1
1)
14
0.
82 (0
.05)
15
.35
(0.1
2)
7.49
(0.2
3)
25.1
4 (1
.25)
3.
67 (0
.03)
6.
94 (0
.31)
7.
75 (0
.04)
13
.49
(0.1
5)
11.2
0 (0
.50)
2.
89 (0
.11)
5.
25 (0
.15)
21
0.60
(0.0
4)
14.2
3 (0
.50)
7.
93 (0
.11)
21
.46
(0.4
4)
4.20
(0.0
7)
8.29
(0.0
2)
7.75
(0.1
4)
14.2
0 (1
.07)
12
.41
(0.3
5)
3.33
(0.1
4)
5.60
(0.1
5)
42
0.
79 (0
.09)
13
.59
(0.1
3)
7.55
(0.0
3)
22.9
1 (0
.54)
3.
53 (0
.08)
7.
13 (0
.30)
6.
95 (0
.15)
16
.94
(0.3
0)
12.2
8 (0
.30)
3.
17 (0
.16)
5.
14 (0
.43)
D
ark
-1
0.90
(0.0
1)
13.1
9 (0
.36)
6.
90 (0
.01)
25
.52
(0.9
7)
3.52
(0.0
6)
6.00
(0.0
3)
7.91
(0.0
3)
15.5
8 (0
.04)
11
.97
(0.0
6)
3.16
(1.2
9)
5.36
(0.1
0)
1
0.90
(0.0
1)
14.1
1 (0
.09)
6.
65 (0
.20)
26
.21
(0.7
4)
3.42
(0.1
1)
6.16
(0.0
6)
7.67
(0.1
9)
14.7
7 (0
.49)
11
.83
(0.3
2)
3.21
(0.1
1)
5.08
(0.1
5)
3
0.74
(0.1
5)
11.4
5 (2
.08)
5.
77 (0
.70)
22
.21
(2.6
1)
2.91
(0.1
0)
6.39
(0.1
9)
7.34
(0.3
2)
21.2
2 (2
.92)
14
.61
(2.1
7)
3.24
(1.0
3)
4.11
(0.4
1)
7
0.97
(0.0
3)
14.5
9 (0
.24)
7.
28 (0
.14)
25
.43
(0.4
1)
3.43
(0.1
1)
6.44
(0.1
8)
8.01
(0.2
1)
13.7
8 (0
.55)
11
.39
(0.8
1)
2.88
(0.0
7)
5.79
(0.2
8)
14
1.
00 (0
.05)
15
.04
(0.2
9)
6.36
(0.7
3)
27.4
8 (0
.67)
3.
37 (0
.12)
6.
21 (0
.30)
7.
90 (0
.19)
13
.64
(0.7
3)
10.6
4 (0
.44)
2.
78 (0
.18)
5.
60 (0
.20)
21
0.94
(0.0
6)
13.3
0 (0
.37)
6.
86 (0
.27)
26
.53
(0.3
9)
3.55
(0.2
1)
6.23
(0.1
0)
8.40
(0.4
8)
14.5
2 (0
.75)
11
.53
(0.3
2)
2.78
(0.1
3)
5.37
(0.1
6)
42
1.
03 (0
.04)
13
.40
(0.4
3)
7.20
(0.0
9)
26.1
0 (0
.52)
3.
47 (0
.11)
6.
88 (0
.24)
7.
23 (0
.43)
14
.77
(0.9
3)
11.1
7 (0
.38)
3.
30 (0
.22)
5.
45 (0
.26)

107
Figure 3-1. Study site.
Sediments and macroalgae were collected from a mid-lagoon shoal site in Hog Island
Bay, Virginia, located along the Delmarva Peninsula, USA. Hog Island Bay is part of the
Virginia Coast Reserve, a Long-Term Ecological Research (LTER) site.

108

109
Figure 3-2. Macroalgal biomass (a) and benthic chlorophyll a concentrations for
surface (0-1 cm) sediments (b).
Treatments shown are light with macroalgae (“+Macro”; solid lines, filled symbols), light
without macroalgae (“-Macro”; solid lines, open symbols), and dark without macroalgae
(“Dark”; dotted lines with filled symbols). Values are mean ± SE (n = 4).

110

111
Figure 3-3. Total nitrogen (a) and total organic carbon (b) concentrations and C/N
(c) in surface (0-1 cm) sediments.
Values are mean ± SE (n = 4).

112
a
b
c

113
Figure 3-4. THAA (a) and total PLFA (b) concentrations in surface (0-1 cm)
sediments.
Values are mean ± SE (n = 4).

114

115
Figure 3-5. Composition as mole percent of THAA for select HAA.
a) Glycine, b) Lysine, c) Leucine, and d) D-alanine. Note scale differences between
graphs. Values are mean ± SE (n = 4).

116
Day

117
Figure 3-6. Concentrations of select algal and bacterial PLFA.
Items (a) through (g) are in units of ng FA gdw-1. Item (h) is unitless since it is a ratio of
concentrations. Values are mean ± SE (n = 4).

118

119
Figure 3-7. Score and loading results for PC1 and PC2 from PCA analyses.
Scores (a) and loadings (b) for PLFA data and scores (c) and loadings (d) for THAA data
are shown. Filled symbols in the score plots represent Day 1 observations and open
symbols represent Day 42. Treatments are +Macro (triangles), -Macro (squares) and
Dark (circles). Error bars represent standard error.

120

121
CHAPTER 4: CARBON AND NITROGEN DYNAMICS IN SHALLOW PHOTIC
SYSTEMS: INTERACTIONS BETWEEN MACRO- AND MICROALGAL
COMMUNITIES
Hardison, A.K.
Canuel, E.A.
Anderson, I.C.
Tobias, C.R.
Veuger, B.
Formatted for submission to Limnology and Oceanography.

122
Acknowledgments
This research was supported by the National Science Foundation (VCR-LTER project
DEB 0080381 and DEB 0621014; DEB Ecosystems 0542645 to VIMS and 0542635 to
UNCW) and the Environmental Protection Agency (STAR FP916722010). The EPA has
not officially endorsed this publication and the views expressed herein may not reflect the
views of the EPA. This work would not have been possible without the help of M.
Luckenbach, S. Fate, and R. Bonniwell at the VIMS ESL as well as H. Walker, D.
Maxey, S. Salisbury, E. Lerberg, L. Palomo, C. Smith, and E. Ferer at VIMS. We are
also grateful to K. Duernberger at UNCW and M. Houtekamer at NIOO for assistance in
the lab.

123
Abstract
Sediments in shallow coastal bays are sites of intense biogeochemical cycling facilitated
by a complex microbial consortium. Unlike deeper coastal environments, much of the
benthos in shallow coastal bays is illuminated, and consequently, benthic autotrophs such
as macroalgae and benthic microalgae play an integral role in nutrient cycling. These
systems are prone to eutrophication due to nutrient loading from anthropogenic activities.
Macroalgal blooms are considered a symptom of eutrophication, but their influence on
sediment nutrient cycling dynamics is not fully understood. The objective of this study
was to track carbon (C) and nitrogen (N) uptake into the sediments in the presence and
absence of macroalgae. We used a dual stable isotope tracer approach in combination
with compound-specific isotope analyses of hydrolzable amino acids (HAA) and
phospholipid-linked fatty acids (PLFA) to quantify the uptake and retention of C and N
within the bulk sediment, benthic microalgal, and bacterial pools. Stable isotope tracers
(15NH4+ and H13CO3
-) were added to the mesocosms via the surface water or pore water
for the first 14 days of the 42-day experiment. Sediments exposed to ambient light/dark
cycles rapidly took up label from both sources and retained the label for ~4 weeks after
isotope additions ended. Benthic microalgae dominated sediment uptake of 13C and 15N,
initially accounting for 100% of total uptake. Over time, heterotrophic bacterial uptake
became relatively more important, increasing from 0% on Day 1 to 30-40% on Day 42,
indicating a close coupling between benthic microalgal and bacterial production. In
macroalgae treatments, macroalgae grew at a rate of ~5% day-1, and reached final
densities over 500 gdw m-2. 13C and 15N were sequestered by macroalgae, but sediment

124
13C and 15N uptake decreased by ~40% compared to treatments without macroalgae. This
was likely due to shading of the sediment surface by macroalgae, thereby decreasing
benthic microalgal production, which in turn decreased bacterial production, as indicated
by lower 13C and 15N labeling of bacterial biomarkers. Overall, the sediments serve as a
sink for C and N through uptake and retention by the microbial community. This may
play an important role in buffering the effects of increased nutrient loading; however,
uptake of C and N by ephemeral macroalgae coupled with decreased uptake and retention
of C and N by the sediments may ultimately accelerate nutrient cycling within the
system, providing a positive feedback to eutrophication.

125
Introduction
In shallow coastal systems where the majority of the sediment surface exists
within the euphotic zone, benthic primary producers such as seagrass, macroalgae, and
benthic microalgae, often dominate nutrient cycling dynamics (McGlathery et al. 2004;
Sand-Jensen and Borum 1991). Benthic plants serve as a sink for nutrients through
uptake and immobilization and also indirectly affect nutrient cycles by changing the
chemical and physical environment (Pedersen et al. 2004). Shallow bays are particularly
vulnerable to nutrient enrichment because of their position along the coast, where human
populations and associated anthropogenic nutrient loadings are rapidly increasing (NRC
2000). It has been hypothesized that increased nutrient loading may result in shifts in
autotrophic community structure, but related shifts in biogeochemical cycles are less
clear (McGlathery et al. 2007).
Macroalgal blooms represent a symptom of eutrophication in many shallow
systems worldwide (Hauxwell et al. 2001; Lavery et al. 1991; McGlathery et al. 2007;
Sfriso et al. 1992; Wazniak et al. 2007). The deleterious effects of macroalgae have been
studied extensively, and include replacement of seagrass (Deegan et al. 2002; Hauxwell
et al. 2001), as well as decreased diversity and biomass within the faunal and fish
communities (Bowen and Valiela 2001; Holmquist 1997), which may translate to
decreased food availability for upper trophic levels (Raffaelli 2000). However, the
influence of these blooms on biogeochemical cycles is less clear. Macroalgae directly
affect nutrient cycles by immobilizing nutrients, often in excess of their growth demands

126
(Peckol et al. 1994). Indeed, in eutrophied systems with large amounts of macroalgal
biomass, water quality often appears good because macroalgae are so efficient at
removing nutrients from the water column (Valiela et al. 1997). Since they reside at the
sediment surface, macroalgae have the potential to influence nutrient cycling at the
sediment-water interface, a zone of intense biogeochemical activity, mediated by
autotrophic and heterotrophic microbes. However, to date, few studies have focused
directly on the effect of macroalgae on the sediment microbial community. Benthic flux
studies have revealed that macroalgae play a major role regulating nutrient cycling at the
sediment surface. For example, McGlathery and colleagues (2001) used dissolved
inorganic carbon (DIC) fluxes to document that benthic microalgal production increased
following a macroalgal die-off, suggesting competition between macroalgae and benthic
microalgae, possibly for light and/or nutrients. Tyler and colleagues (2003) found that
macroalgal uptake resulted in an uncoupling of sediment-water column processes by
controlling the exchange of dissolved inorganic nitrogen (DIN) as well as dissolved
organic nitrogen (DON) between the sediments and water column. Dalsgaard (2003)
measured lower denitrification rates in the presence of macroalgae, presumably because
macroalgae out-competed sediment denitrifiers for water column nitrate. Conversely,
Krause-Jensen and colleagues (1999) showed similar denitrification rates between bare
and macroalgal-covered sediments, but that the oxic/anoxic interface (and hence the zone
of nitrification-denitrification) was moved from the sediments up into the macroalgal
mat. Thus, while benthic fluxes have been able to generate information about the net
results of processes occurring at the sediment-water interface, it has been difficult to
further describe the microbial “black box” within the sediments using flux data alone.

127
We conducted this study to explicitly track carbon (C) and nitrogen (N) uptake
into sediment microbial pools in the presence and absence of macroalgae. At the
sediment-water interface, nutrients in the water column (from e.g. from run-off,
atmospheric deposition) as well as the sediment porewater (from e.g. groundwater,
benthic remineralization of organic matter) are available for uptake by benthic
autotrophs; thus, we designed an experimental apparatus that allowed us to introduce
dissolved nutrients via surface water and porewater so that we could assess differences in
uptake by the macroalgal and microbial communities (Hardison et al. Submitted-b). We
used a dual stable isotope tracer approach in combination with compound-specific
isotope analyses of microbial biomarkers (hydrolyzable amino acids and phospholipid-
linked fatty acids) to track C and N into bulk sediments, sediment microbial pools and
macroalgae.
Methods
Site description -- Sediments and macroalgae were collected from Hog Island
Bay, Virginia (HIB) (Fig. 1), located along the Delmarva Peninsula, and part of the
Virginia Coast Reserve, a Long-Term Ecological Research (LTER) site. HIB is a
shallow coastal lagoon (< 2 m deep at mean low water), typical of temperate lagoons
along the U.S. East coast and is dominated by benthic autotrophs (McGlathery et al.
2001; Thomsen et al. 2006). Macroalgae are present seasonally throughout the lagoon in
low to moderate densities (Thomsen et al. 2006); however, we collected sediments and
macroalgae from mid-lagoon shoal sites where localized blooms of macroalgae have

128
previously developed and dominated benthic production during the warmer months
(McGlathery et al. 2001; Thomsen et al. 2006). Throughout the rest of the year when
macroalgal biomass was low, benthic microalgae dominate (Anderson et al. 2003;
McGlathery et al. 2001).
Experimental design -- A flow-through mesocosm array was assembled at the
Virginia Institute of Marine Science (VIMS) Eastern Shore Laboratory (ESL) in
Wachapreague, VA. In preparation for this experiment, we designed and tested an
experimental apparatus that allowed for addition of nutrients simultaneously via surface
water (SW) and porewater (PW). The “perfusionator” consisted of a 60 cm I.D. x 60 cm
high translucent fiberglass cylinder that includes a reservoir for porewater at the base of
the sediment column. Discussion of the design and performance of the perfusionator can
be found in Hardison et al. (Submitted-b). Twelve perfusionators were filled to a depth
of ~15 cm with intact sediments extruded from cores taken at a mid-lagoon field site
(Shoal) in May 2007 (Fig. 1). Care was taken not to transfer any macroalgae or visible
macrofauna to the mesocosms. At the ESL, the perfusionators were placed in shallow
water baths under 30% shade cloth to control temperature and light. The water column
above the sediments was connected to a flow-through seawater system, supplied with
filtered seawater from the adjacent creek (1 µm) and was stirred continuously with a
mini-jet pump to keep the water column well mixed. Once connected to the experimental
system, the mesocosms were allowed to equilibrate for two weeks before beginning the
experiment.

129
Our experiment consisted of an incomplete factorial design made up of three
factors, each with two levels: 1) Light (ambient vs. dark), 2) Isotope delivery source (via
the SW or PW), and 3) Macroalgae (presence vs. absence of live macroalgae). All factors
were crossed with the exception of the dark + macroalgae treatment, since, for logistical
purposes, only light treatments received a macroalgal addition. Each treatment was run in
duplicate.
For the nutrient additions, nutrients were added to each mesocosm simultaneously
via the SW and PW. However, for each treatment, isotopically-labeled nutrients were
only delivered via one source (i.e. for the PW treatment, isotopically labeled nutrients
were added through the PW and unlabeled nutrients were added through the SW). A
peristaltic pump was used to add (15NH4)2SO4 (25% 15N) and NaH13CO3 (99% 13C)
solutions to the SW treatments, with a target isotopic enrichment of the NH4+-N pool of
25 at% and DIC of 9 at%. For the PW treatments, (15NH4)2SO4 (50% 15N) and
NaH13CO3 (99% 13C) were pumped to achieve 30% 15N enrichment of NH4+-N and 9%
13C enrichment of DIC in sediment PW. Unlabeled nutrients were added at the same rates
as the isotopically labeled nutrients to the corresponding mesocosms. Isotopes were
added for the first 14 days of the 42-day experiment. For the remainder of the
experiment (i.e. the “post-labeling” period), unlabeled nutrients were added via the SW
and PW for all treatments. Feed water was drawn from a creek adjacent to the ESL,
pumped through a series of sand, bag (10 µm), and cartridge (5 and 1 µm) filters, exposed
to ultraviolet light to kill bacteria, and amended either with H13CO3- + 15NH4
+ or
unlabeled HCO3- + NH4
+ in a mixing chamber before delivery to each perfusionator. SW
additions were delivered directly to the perfusionator water column gravimetrically at a

130
rate of ~43 L day-1, or a SW residence time of ~2 days. Fine-scale control of the SW
flow rate at each mesocosm was achieved using IV drippers, which were calibrated daily.
PW additions were delivered through a standpipe into the perfusionator reservoir located
below the sediment column at a rate of ~15 L day-1, or a porewater residence time of ~1.8
days. Fine scale control of the PW flow rate into each perfusionator was achieved using
an IV dripper located at each standpipe, which was also calibrated daily.
Macroalgae (Gracilaria vermiculophylla), collected live from HIB in May 2007,
were returned to the laboratory, cleaned of epiphytes and epifauna, rinsed with 0.7 µm
filtered seawater, and placed in aquaria inside a greenhouse. Filtered (0.7 µm) seawater
was added to each aquarium and kept aerated while the algae were starved for 10 days
before addition to the mesocosms. Macroalgae were “starved” to ensure depletion of
internal stored nutrients and rapid uptake of the nutrients once in the mesocosms. Live
macroalgae were added to the light + macroalgae treatments in densities observed
naturally (124.8 ± 1.6 gdw m-2; McGlathery et al. 2001; Stanhope et al. 2009; Thomsen et
al. 2006).
Sampling -- Nutrient and macroalgal additions began on Day 0, and isotopes were
added through Day 14. The mesocosms were sampled prior to the additions to capture
baseline conditions, on Days 1, 3, 7, and 14 during the isotope-labeling period, and on
Days 16, 21, 29 and 42, during the post-labeling period. At each sampling, surface
sediments (0-1 cm) were collected using two acrylic cores (5.7 cm I.D.) and reserved for
bulk (total organic C (TOC), total N (TN)), amino acid, and fatty acid analyses.
Sediments from both cores were combined in pre-combusted glass jars, immediately

131
frozen at -4ºC, and frozen at -80ºC within 3 days. The remaining sediment in the cores
was placed carefully back into the holes in the mesocosm sediments. Sediments were
also collected for chlorophyll a concentrations using a cut-off syringe (1.1 cm I.D.).
Samples were sectioned into 0-0.3 cm and 0.3-1.0 cm horizons, placed into 15 mL
centrifuge tubes, immediately frozen at -4ºC, and analyzed within 1 month. A different
region of the sediment surface was sampled each day to avoid artifacts associated with re-
sampling.
Macroalgae were removed from each mesocosm, patted dry, and weighed on
Days 7, 14, 21, 29, and 42. Wet mass was converted to dry mass using percent water
determined (72%) from G. vermiculophylla collected in the field, and dry mass values
were normalized to the mesocosm sediment surface area (0.29 m2). Before addition to
the mesocosms and when weighed for determination of growth, a small piece of
macroalgal biomass was removed and reserved at -4ºC for isotopic analysis. The live
macroalgae were kept in seawater from the respective mesocosms and returned as quickly
as possible to avoid desiccation.
Bulk analyses -- Samples were analyzed for benthic chlorophyll a concentrations
according to a modification of the method of Lorenzen (1967; Pinckney et al. 1994). The
sediment pellet was sonicated in 90% acetone, vortexed and extracted for 24 h at -4ºC.
The supernatant was passed through a 0.45 µm filter and read on a Shimadzu UV-1601
UV Visible spectrophotometer (λ = 665, 750 nm). Chlorophyll a concentrations (mg m-
2) were calculated according to the equations in Lorenzen (1967). Chlorophyll a

132
concentrations for the 0-0.3 and 0.3-1.0 cm sections were summed to obtain
concentrations for 0-1 cm.
For bulk sediment TOC, TN, and isotopic measurements, sediments were freeze-
dried, ground and homogenized, acidified to remove inorganic C (Hedges and Stern
1984), and analyzed for 13C and 15N using elemental analyzer coupled to a Thermo Delta
V Plus isotope ratio mass spectrometer (EA-IRMS). Samples of macroalgae were dried
at 40ºC, homogenized, and analyzed for 13C and 15N using the same EA-IRMS. Stable
isotope ratios for carbon (R= 13C/12C) and nitrogen (R=15N/14N) were used to calculate δ-
values:
δX (‰) = [(Rsample / Rstandard) -1] × 1000 (1)
where X = 13C or 15N. Standards were expressed relative to international standards
Vienna Pee Dee Belemnite (VPDB) and atmospheric N2 for 13C- and 15N analyses,
respectively. δX was used to calculate atom% X, which was used to calculate excess X
(absolute amount of incorporated 13C or 15N):
at%X =
[100 × Rstandard × ((δXsample / 1000) + 1)] / [1 + Rstandard × ((δXsample / 1000) + 1)] (2)
excess X (nmol X gdw-1) = [(at%Xsample - at%Xcontrol)/ 100] × [concentrationsample] (3)

133
where concentrations were expressed in moles C or N relative to sediment or macroalgal
dry weight. The control (unlabeled) samples were collected before the isotopic additions.
Total hydrolyzable amino acids -- Hydrolyzable amino acids (HAA) were
analyzed on a subset of the sediment samples according to the method presented in
Veuger et al. (2005). Freeze dried sediment (1 g) was rinsed with 2N HCl and Milli-Q
water to remove dissolved amino acids. The sediment pellet was then hydrolyzed with
6N HCl at 110ºC for 20 h. Following purification by cation exchange chromatography,
amino acids were derivatized with isopropanol and pentafluoropropionic anhydride and
further purified by solvent extraction. Concentrations and stable isotope ratios for carbon
(R= 13C/12C) and nitrogen (R=15N/14N) of the derivatized D- and L-amino acids were
measured by gas chromatography combustion isotope ratio mass spectrometry (GC-c-
IRMS), on a HP 6890 GC with a Thermo type III combustion interface and a Thermo
Delta Plus IRMS. δ-and at%X values were calculated according to equations 1 and 2,
and used to calculate excess X according to equation 3, where concentration is AA
concentrations expressed in moles C or N relative to sediment dry weight. Carbon
isotopic values of amino acids were corrected for the C atoms added during derivatization
using a mass balance approach following Veuger et al. (2006). The sum of
concentrations of, and/or excess label incorporated in, all amino acids analyzed will be
referred to as total hydrolysable amino acids (THAA). The ratio of excess 13C or 15N
incorporation into D-alanine (D-Ala), a bacterial specific amino acid, relative to L-
alanine (L-Ala), an amino acid made by all organisms, was calculated as:

134
D/L-Ala ratio (D/L-Ala) = (excess X in D-Ala) / (excess X in L-Ala) (4)
where X is 13C or 15N. During hydrolysis, some racemization of L-Ala to D-Ala takes
place, resulting in a D/L-Ala value of ~0.017 (Veuger et al. 2007b). We corrected values
of excess isotope in D-Ala for this racemization according to Veuger et al. (2007a),
whereas values of D/L-Ala were left uncorrected. Instead, the D/L-Ala value of 0.017
will be indicated graphically in our results (Veuger et al. 2007b). We estimated the
bacterial contribution to total 13C or 15N incorporation according to Veuger (2007a):
Bacterial contribution (%) =
[(excess X D/L-Ala – 0.017) / (bacterial D/L-Ala – 0.017)] x 100% (5)
where X is 13C or 15N. Bacterial D/L-Ala represents the D/L-Ala abundance ratio for
bacteria. The upper bound of the ratio ranges from 0.05 for Gram negative (G-) bacteria
to 0.1 for Gram positive (G+) bacteria and cyanobacteria (Veuger et al. 2007b). Previous
work suggests that G+ bacteria are more prominent in deeper (anaerobic) sediments
(Moriarty and Hayward 1982). Since our study used sandy photic sediments, we
assumed that the contribution from G+ bacteria was negligible. Additionally,
photosynthetic pigment analyses conducted on sediments from the mesocosms suggested
that cyanobacterial contributions to the microbial community were minimal (M. Waters,
pers. comm.). As a result, we further assumed that contribution from cyanobacteria to
the D/L-Ala ratio of the total microbial community was negligible and estimated the
bacterial D/L-Ala ratio for our sediments to be 0.05. The lower bound of D/L-Ala, when

135
bacteria do not take up any label, is 0.017, which represents abiotic racemization of L-
Ala (Veuger et al. 2007b). Thus, excess 13C and 15N D/L-Ala ratio values should fall
between these upper (0.05) and lower (0.0017) limits, with higher values indicating a
higher bacterial contribution to the total label uptake since only bacteria incorporate label
into D-Ala.
Phospholipid linked fatty acids -- Total fatty acids were analyzed on a subset of
the sediment samples according to a modified Bligh and Dyer (1959) method (Canuel et
al. 2007; Poerschmann and Carlson 2006). Wet sediments (~12 g) were extracted using
an accelerated solvent extractor system (Dionex ASE 200) adapted for in-cell silica gel
chromatography. Each sample was extracted twice on the ASE: neutral lipids were
collected following extraction with a 9:1 (v:v) hexane:acetone mixture at 50ºC, then polar
lipids were collected following extraction with a 8:2 (v:v) methanol:chloroform solution
at 80ºC. Neutral and polar lipid fractions were saponified using KOH-CH3OH for 2h at
110ºC. Saponified samples were then extracted under basic and acidic conditions. The
acid-extracted fractions were methylated with BF3-CH3OH to form fatty acid methyl
esters (FAME). The neutral FAME included neutral and glycolipids while the polar
FAME represented the phospholipid-linked fatty acids (PLFA). FAME concentrations
were measured by gas chromatography with flame ionization detection (GC-FID, DB-5
column, HP 5890) and quantified using methyl heneicosanoate as an internal standard.
Peak identities were verified using reference standards as well as coupled gas
chromatography mass spectrometry (HP 6890 GC-MSD). Fatty acids are designated
A:BωC, where A is the total number of C atoms, B is the number of double bonds, and C

136
is the position of the first double bond from the aliphatic ‘‘ω’’ end of the molecule. The
prefixes ‘‘i’’ and ‘‘a’’ refer to iso- and anteiso- methyl branched fatty acids (see Canuel
et al. 1997 and references therein). Stable C isotope ratios (R= 13C/12C) for PLFA were
measured at NIOO using a Thermo GC-c-IRMS system composed of a Trace GC Ultra
gas chromatograph (BPX70 column) coupled to a Delta Plus Advantage IRMS through a
GC/C-III interface. These isotope values were used to calculate δ13C (Eq. 1) and at%13C
(Eq. 2). Excess 13C was calculated according to equation 3, where concentrations were
FAME concentrations expressed in moles C relative to dry weight sediment. Actual
PLFA isotopic values were derived from the FAME isotopic compositions by correcting
for the isotopic composition of the C added during derivatization using a mass balance
approach.
We analyzed 13C uptake into total PLFA as well as specific groups of PLFA.
Excess 13C in polyunsaturated fatty acids (PUFA: C20:5ω3, C20:4ω6, C22:5ω3, C22:5ω6)
represented uptake into benthic microalgal biomass (Volkman et al. 1998) while excess
13C in branched odd fatty acids (BrFA: iso- and anteiso- branched C13:0, C15:0, C17:0,
C19:0) represented heterotrophic bacterial uptake (Boschker et al. 2000; Perry et al. 1979).
The ratio of excess 13C in BrFA relative to the sum of BrFA and PUFA (bacteria-to-algae
ratio, BAR) was calculated as:
BAR = (excess 13C in BrFA) / (excess 13C in BrFA + excess 13C in PUFA) (6)
This ratio ranges from 0 to 1, where 0 represents 100% benthic microalgal (0% bacterial)
uptake and 1 represents 0% benthic microalgal (100% bacterial) uptake of label.

137
Data analysis -- We applied repeated measures analysis of variance (ANOVA) to
examine the effects of isotope delivery source (PW vs. SW), light (ambient vs. dark),
macroalgae (presence vs. absence) and time (day) on the sediment parameters using the
Mixed procedure in SAS 9.1 (SAS Institute Inc., Cary, NC). In all models, a first-order
ante-dependence error structure (Kenward 1987) was used to model the within-subject
covariance structure. Unless otherwise noted, values presented are means ± 1 SE for 2
replicates.
Results
Macroalgae and Bulk Sediments -- Macroalgal growth was nearly linear
throughout the experiment, increasing from ~125 gdw m-2 on Day 0 to 308 and 513 gdw
m-2 on Day 42 for SW and PW, respectively (Fig. 2a). This represented an average
growth rate of 5-6% day-1. There were no differences in macroalgal biomass between
SW and PW treatments throughout the experiment, except for a trend on Day 42 when
SW was greater than PW (n = 1 for that day only; Table 1; Fig. 2a). For both SW and
PW treatments, excess 13C in macroalgae increased throughout the labeling period,
peaked on Day 14 or 21, and decreased through Day 42 (Fig. 2b). There was not a
significant isotope source difference, although there was a trend of SW values exceeding
PW values. Excess 15N in macroalgae also became enriched throughout the labeling
period, peaked on Day 21, and decreased through Day 42 (Fig. 2c). Again, there was not

138
a significant isotope source difference, although there was a trend of PW values generally
exceeding SW values.
Averaged across time steps, total organic carbon (TOC) and total nitrogen (TN)
concentrations in sediment were 248 ± 13 µmol C gdw-1 and 23 ± 1 µmol N gdw-1,
respectively (SE; n = 36 treatment means). All treatments began with similar benthic
chlorophyll a content (14.8 ± 4.5 mg chla m-2); however, throughout the experiment,
benthic chlorophyll a concentrations in dark mesocosms became significantly lower than
ambient light (Fig. 3, Table 1). There was no significant Macroalgae effect among light
treatments. Overall, benthic chlorophyll a increased in the light treatments, although
with high variability.
Excess 13C and 15N in bulk sediments are presented in Figure 4. In both SW and
PW treatments, the ambient light treatments were more enriched than the dark treatments
(Table 1), reaching levels well above natural abundance (max δ13C ~2000‰ and δ15N
~20000‰ vs. background δ13C ~ -20‰ and δ15N ~10‰). Excess 13C in light treatments
increased during the labeling period, peaked during the post-labeling period on Day 21,
and then decreased through Day 42 (Fig. 4a,b). Among the light treatments, excess 13C
in treatments with macroalgae were significantly lower than treatments without
macroalgae (Fig. 4a,b; Table 1). The same patterns were observed for excess 15N in both
SW and PW treatments: light treatments were more enriched than dark treatments, and
treatments with macroalgae were less enriched than treatments without macroalgae (Fig.
4c,d; Table 1). For 13C and 15N, we calculated uptake rates (nmol X gdw-1 day-1) during
the labeling period as the slopes for changes in excess label (X = 13C or 15N) on Days 1
through Day 21, when the highest enrichments were measured. Similarly, we calculated

139
loss rates (nmol X gdw-1 day-1) during the post-labeling period as the slopes for changes
in excess label from Days 21 through 42. Uptake rates were higher for light treatments
than dark (Table 2). Within a treatment, rates of 13C and 15N uptake into bulk sediments
during the labeling period generally exceeded loss rates, which were often small or not
significantly different from zero (p > 0.05). Uptake rates were highest for light
treatments without macroalgae.
PLFA -- Across all sampling days, PLFA made up a constant fraction of TOC: 1.1
± 0.3 and 0.3 ± 0.1% of TOC across light and dark treatments, respectively (n = 20
treatment means for light, n = 10 for dark). Excess 13C in total PLFA followed patterns
similar to bulk sediments (Fig. 5a,b). In both SW and PW treatments, ambient light
treatments were more enriched than the dark (Fig. 5a,b; Table 1). Among the light
treatments, excess 13C in mesocosms with macroalgae were significantly lower than
treatments without macroalgae (Fig. 5a,b, Table 1). As with the bulk sediments, we
calculated uptake and loss rates of 13C-PLFA. Most uptake and loss rates for PLFA were
not significantly different from zero (p > 0.05), due to high variability between replicates.
Excess 13C in specific groups of fatty acids provided insight into the microbial
groups within the sediments responsible for the label incorporation. Excess 13C in PUFA,
which represented BMA uptake, showed patterns similar to total PLFA, displaying both
light and macroalgae effects (Fig. 5c,d; Table 1). Excess 13C in BrFA, which represented
bacterial uptake, also showed patterns similar to total PLFA (Fig. 5e,f). In both SW and
PW treatments, light treatments were more enriched than dark treatments (Fig. 5e,f;
Table 1). There was no significant macroalgae difference; however, treatments without

140
macroalgae were generally higher than those with macroalgae, following the same trend
as total PLFA and PUFA (Table 1). To compare the relative uptake between bacterial
and BMA communities in the light treatments, we used the bacteria-to-algae ratio (BAR;
Fig. 6a,b). For both SW and PW, BMR increased throughout the experiment. There
were no significant differences in BAR between light treatments with and without
macroalgae (Table 1).
THAA -- Across all sampling days, THAA made up 33 ± 6 and 26 ± 6% of TN
and 14 ± 2 and 10 ± 1% of TOC in ambient light and dark treatments, respectively (SE; n
= 20 treatment means for light, n = 10 for dark). Excess 13C and 15N in THAA showed
the same general patterns as bulk sediment and PLFA, displaying both Light and
Macroalgae effects (Fig. 7; Table 1). Uptake and loss rates were calculated for THAA as
described above for bulk sediments. Uptake rates were higher for light treatments than
dark, and within a treatment, rates of 13C and 15N uptake exceeded loss rates, which were
often small or not significantly different from zero (p > 0.05) (Table 2). As with bulk
sediments, uptake rates were highest for light treatments without macroalgae.
Excess 13C and 15N in D-Ala, a bacterial biomarker, showed the same general
patterns as the THAA (Fig. 8). There was a significant light effect for both 13C and 15N
(Fig. 8; Table 1), although, among the light treatments, there was a significant
macroalgae effect for 15N but not 13C (Table 1). However, for both SW and PW,
treatments without macroalgae were generally higher than those with macroalgae,
following the same trend as bulk sediments, PLFA, and THAA. To compare the relative
uptake between bacterial and BMA communities in the light treatments, we used the ratio

141
of excess 13C or 15N in D-Ala to L-Ala (D/L-Ala; Fig. 9). For 13C and 15N, in both SW
and PW, D/L-Ala increased throughout the experiment. We estimated bacterial
contribution to total label incorporation according to Equation 5. For 13C, there was an
increase over the course of the experiment from 0 to 15% bacterial uptake for SW and 0
to 30% bacterial uptake for PW (Fig. 9a,b, right axes). For 15N, this represented an
increase from 0 to 28% bacterial uptake for SW and 0 to 54% bacterial uptake for PW
(Fig. 9c, d). There were no significant differences between light treatments with and
without macroalgae (Table 1).
Discussion
Macroalgal nutrient uptake -- Macroalgal growth rates of ~5-6% day-1 in the
mesocosms were within the range of rates reported for Gracilaria spp. in temperate
systems similar to HIB (Marinho-Soriano et al. 2006; Navarro-Angulo and Robledo
1999; Raikar et al. 2001; Yokoya et al. 1999). Growth was constant throughout the
labeling and post-labeling periods because nutrients were continuously added throughout
the experiment. Addition of isotopically-labeled nutrients allowed us to track 13C and 15N
into macroalgal biomass, which provided insight into macroalgal nutrient uptake patterns
which we could not have learned by monitoring growth rates alone. For example,
regardless of whether isotopes were delivered via SW or PW, macroalgae took up 13C
and 15N, suggesting that macroalgae used C and N from both sources. This is consistent
with previous studies showing that macroalgae can take up nutrients from the water
column as well as those released from the sediments (McGlathery et al. 1997; Sundback

142
et al. 2003; Thybo-Christesen et al. 1993; Tyler et al. 2001). Continued isotopic
enrichments of macroalgal tissue following the end of the isotope addition period
provides additional insight into nutrient cycling dynamics within a macroalgal mat. 13C
and 15N enrichments in macroalgae peaked on Day 21, one week after the isotopes were
turned off. Since the flushing rates of the SW and PW were approximately 2 days,
isotopes in the surface water or released from the sediments were available for
macroalgal uptake for a couple of days before being flushed out. However, continued
enrichment of macroalgal tissue for a week or more following the end of the isotope
addition may also have reflected recycling of 13C and 15N within the mat, as observed in
previous studies (Krause-Jensen et al. 1999; McGlathery et al. 1997; Thybo-Christesen et
al. 1993). Thybo-Christesen and colleagues (1993) measured large and frequent changes
in nutrients, oxygen, pH, and temperature within the layers of a mat, which, they
suggested, behave almost as a closed system. Following Day 21, 13C and 15N content in
macroalgal tissue decreased, likely reflecting dilution by unlabeled C and N as
macroalgae continued to grow and take up nutrients. By Day 42, the isotopic content of
the macroalgae had not yet returned to background levels, indicating storage of the label
as biomass, and suggesting that macroalgae act as a temporary sink (at least 4 weeks) for
C and N, which is in agreement with other studies (Thybo-Christesen et al. 1993,
McGlathery et al. 1996, Pedersen et al. 2004).
Macroalgae served as a sink for C and N during our experiment, just as in field
studies, where macroalgal blooms have grown to well over 500 gdw m-2 (Hauxwell et al.
2001; McGlathery et al. 2001; Sfriso et al. 1992). It is important to note that the
experiment was conducted during the peak growing season for macroalgae in Hog Island

143
Bay (McGlathery et al. 2001; Tyler et al. 2001), where the macroalgal population often
displays a precipitous decline in mid- to late-summer, similar to other coastal lagoons
(Astill and Lavery 2001; Sfriso et al. 1992; Thornemiller et al. 1983; Valiela et al. 1992).
Thus, in nature, macroalgae may only store C and N temporarily. Once the bloom begins
to decline, dissolved organic matter and inorganic nutrients are released to the water
column, fueling bacterial and phytoplankton production (Castaldelli et al. 2003;
McGlathery et al. 2001; Nedergaard et al. 2002; Tyler et al. 2001). Our recent work also
suggests that up to 50% of macroalgal biomass may be transferred to the sediments
following die-off of a bloom, supporting sediment heterotrophic bacteria and benthic
microalgal production (Hardison et al. Submitted-a). In systems that experience the most
extreme macroalgal die-offs, hypoxic or anoxic conditions may develop in the water and
sediments, further disrupting nutrient cycling and organic matter decomposition (Astill
and Lavery 2001; Sfriso et al. 1992; Sundback et al. 1990).
Macroalgal-benthic microalgal interactions --In shallow systems where light
reaches the sediment surface, benthic microalgae have been shown to play a central role
in regulating nutrient cycling at the sediment-water interface (Anderson et al. In press;
McGlathery et al. 2004; Pedersen et al. 2004); we measured multiple parameters that
suggest that they were active in our mesocosms as well. Benthic chlorophyll a
concentrations and label enrichments in bulk sediments in ambient light treatments were
significantly higher than in the dark. This indicates that H13CO3- and 15NH4
+ uptake into
bulk sediments in the light was dominated by benthic microalgae. Further, excess 13C and
15N in THAA and excess 13C in total PLFA also showed a strong dependence on light.

144
Label enrichment in these pools represents uptake by the microbial community, including
both autotrophic and heterotrophic organisms. The strong light-dependence of 13C and
15N uptake into these pools indicates the importance of autotrophic (benthic microalgal)
uptake and/or recycling by heterotrophic organisms of autotrophic production.
Additionally, elevated excess 13C in benthic microalgal fatty acids (C20, C22 PUFA)
provided the most direct evidence that benthic microalgae were fixing 13C. Finally, the
ratios of excess 13C in branched fatty acids to algal fatty acids (BAR) and excess 13C and
15N in D-Ala to L-Ala (D/L-Ala) were low, suggesting that total label incorporation was
dominated by benthic microalgae rather than bacteria in this study. We will discuss the
change in these ratios over time and the role of bacterial label incorporation in the next
section.
Excess 13C and 15N in bulk sediments, THAA, and total PLFA were lower in
treatments with macroalgae, suggesting that macroalgae limited benthic microalgal C and
N uptake. The most specific biomarkers for benthic microalgae were the PUFA, which
showed less 13C enrichment in the treatments with macroalgae. While there was no
significant effect of macroalgae on benthic chlorophyll a concentrations in the surface
sediments, benthic chlorophyll a concentrations are not necessarily a direct indication of
benthic microalgal productivity, as pigment levels can vary depending on light
availability, nutrient concentration, and algal species (Agusti et al. 1994). Macroalgae
growing above the sediment surface have the capacity to compete with BMA for
nutrients and/or reduce the amount of light available to microalgae (shading) (Sundback
and McGlathery 2005 and references therein). Because we were supplying nutrients
simultaneously via the SW and PW, neither C nor N was likely limiting in our treatments,

145
although benthic micro- and macroalgae may have competed for other nutrients such as
phosphorus (Valiela et al. 1997). Further, in the treatments with macroalgae, we
observed labeling of both macroalgae and benthic microalgae regardless of isotope
source. Thus, macroalgae were not sequestering all of the label in the SW treatments
thereby preventing benthic microalgal uptake of that label. Similarly, benthic microalgae
did not intercept all of the labeled nutrients in the PW treatments thereby preventing
uptake by macroalgae.
As a result, we believe the primary mechanism by which macroalgae limited
benthic microalgal productivity was through shading. Indeed, macroalgal growth is often
sufficiently dense to self-shade the layers of the mat nearest the sediment surface (Brush
and Nixon 2003; McGlathery et al. 1997); thus they must limit the amount of light
reaching benthic microalgae. Krause-Jensen and colleagues (1996) estimated complete
shading of benthic microalgae to occur at macroalgal densities above 300 gdw m-2. In
our experiment, macroalgae attained biomasses of 300 gdw m-2 by Day 14, suggesting
that benthic microalgal productivity may have been diminished during the first two weeks
of the experiment and reduced, or possibly shut down, for the remainder of the
experiment as macroalgae continued to grow through Day 42. Our results are consistent
with those of Tyler and colleagues (2003) who found sediments underlying macroalgal
mats to be net heterotrophic. On average, macroalgal densities in Hog Island Bay are less
than 300 gdw m-2; however, localized blooms greater than 300 gdw m-2 have been
observed (McGlathery et al. 2001). Moreover, the densities attained during this
experiment are within the range of those observed in more eutrophic coastal systems
(Hauxwell et al. 2001; Sfriso et al. 1992; Wazniak et al. 2007). Whether through nutrient

146
or light competition, macroalgae clearly reduced benthic microalgal productivity, thereby
diminishing retention of C and N as benthic microalgal biomass.
Algal-bacterial interactions -- Macroalgal and microalgal growth in coastal
systems are closely linked, as discussed previously, due to shading by macroalgae. Our
results further suggest that sediment bacteria and algal growth are closely coupled in
these systems. The direct negative influence of macroalgae on benthic microalgal
production likely translated to diminished bacterial production as well. As with benthic
microalgal biomarkers, 13C and 15N label incorporation into bacterial biomarkers (D-Ala
and BrFA) was strongly light-dependent and was diminished in the presence of
macroalgae. Excess 13C values in PUFA and bacterial biomarkers were linearly related
(BrFA: r2 = 0.60, p < 0.0001; D-Ala: r2 = 0.52, p < 0.0001), suggesting that labeling of
benthic microalgae and bacteria tracked one another, which supports the observation
from numerous studies that bacteria rely on benthic microalgal production (Cook et al.
2007; Middelburg et al. 2000; Veuger et al. 2007a). Benthic microalgal and bacterial
production are thought to be closely coupled in shallow photic systems and can be linked
in at least three ways. First, because benthic microalgal turnover is on the order of days
(Middelburg et al. 2000; Sundback et al. 1996), bacteria can directly recycle benthic
microalgal biomass, resulting in transfer of benthic microalgal 13C and 15N to bacteria.
Second, benthic microalgae have been shown to exude over 50% of C fixed as
extrapolymeric substances (EPS), which can serve as a substrate for bacterial production
(Evrard et al. 2008; Goto et al. 2001; Smith and Underwood 2000). Benthic microalgal
EPS would be 13C-labeled as long as benthic microalgae were fixing H13CO3-. Since

147
EPS is N-poor, bacteria would likely have to take up 15NH4+ directly to meet their
metabolic needs (Cook et al. 2007; Goldman and Dennett 2000; Williams 2000). This
would also result in 13C and 15N labeling of bacterial biomass. Lastly, bacterial
remineralization of 13C- and 15N-labeled BMA material results in release of inorganic 13C
and 15N that can be subsequently taken-up by BMA (Anderson et al. 2003).
To further illustrate the coupling between bacteria and benthic microalgae in this
system, we analyzed the ratios of excess 13C in the BAR and excess 13C and 15N in D/L-
Ala in the ambient light treatments. Changes in these ratios over time illustrated changes
in the relative contributions of benthic microalgae and bacteria to total label uptake. The
ratios were low throughout the labeling period, indicating dominance by benthic
microalgae, began to increase around Day 21, and reached their highest levels on Day 42.
This increase corresponded to relatively more label uptake into bacterial biomass,
suggesting that 13C and 15N first passed through the benthic microbial community before
being taken up by bacteria. This is corroborated by findings of Middelburg and
colleagues (2000) and Evrard and colleagues (2008), suggesting rapid and direct transfer
of 13C from benthic microalgae to bacteria in intertidal and subtidal sediments,
respectively. While macroalgae affected absolute label uptake into the various microbial
pools, they did not affect either BAR or the D/L-Ala ratios, suggesting that the relative
contribution to total uptake from bacteria and benthic microalgae remained unchanged in
the presence of macroalgae. The shuttling of C and N back-and-forth between benthic
microalgae and bacteria likely increased retention in the sediments and accounted for the
slower rates of isotope loss in the bulk sediments, and THAA, compared with the rates of
uptake during the labeling period (Table 2). These results further suggest that

148
macroalgae may reduce overall retention of C and N in sediments by reduction of benthic
microalgal production, which, in turn, reduced bacterial production.
Nutrient retention and eutrophication -- Previous work corroborates the results of
our experiment showing that benthic macroalgae are a sink for C and N in shallow
coastal systems (McGlathery et al. 2004; Pedersen et al. 2004). In our experiment,
isotopic labels persisted in the bulk sediments for at least four weeks after the isotope
additions ended, suggesting that the sediments also serve as a sink for C and N. We
suggest that this is facilitated by the sediment microbial community. To determine the
size of the macroalgae sink relative to the sediments, we calculated the total label (either
13C or 15N) sequestered by the macroalgal blooms within each mesocosm, and compared
that with the total label taken up into bulk sediments across the sediment surface (0-1cm;
0.29 m-2) of each mesocosm (Table 3). In treatments with macroalgae, label “storage” in
macroalgal biomass was always higher than in bulk sediments. Further, in most cases for
treatments without macroalgae, total label stored in sediments was less than total label
sequestered by macroalgae, so macroalgae represented a large, albeit temporary, C and N
sink in these systems. As previously discussed, label uptake into sediments with
macroalgae was diminished relative to treatments without macroalgae. This reduction in
C and N uptake into sediments, averaged across all days and treatments, was ~ 40%
(range 10-85%), which clearly has important ecological consequences.
The ephemeral nature of macroalgal blooms distinguishes them from other
benthic autotrophs. Macroalgae are efficient at taking up nutrients diffusing from the
sediments or the water column, are capable of luxury uptake, and can accumulate in large

149
blooms during warmer months (Hauxwell et al. 2003; McGlathery et al. 1997;
McGlathery et al. 1996; Pavoni et al. 1992). However, once macroalgae decline or die,
their nutrients are re-released to the water column, where they can support phytoplankton,
including harmful algal blooms, and bacterial metabolism (McGlathery et al. 2001; Sfriso
et al. 1992; Tyler et al. 2003). In contrast to macroalgae, retention within the sediment
microbial pool would be expected to be a more stable sink. Sequestration of nutrients
within sediment microbial biomass may remove nutrients from the water column, and the
close coupling between benthic microalgae and bacteria may effectively retain those
nutrients within the sediments during times of the year that are favorable for
phytoplankton blooms. Thus, shunting nutrients through macroalgae rather than benthic
microalgae will likely provide a positive feedback to eutrophication, whereas, the
sediment microbial community may play an important role in buffering the effects of
increased nutrient loading. This role is likely diminished in the presence of macroalgae.
Literature Cited
Agusti, S., S. Enriquez, H. Frostchristensen, K. Sand-Jensen, and C. M. Duarte. 1994. Light-Harvesting among Photosynthetic Organisms. Functional Ecology 8: 273-279.
Anderson, I. C., K. J. McGlathery, and A. C. Tyler. 2003. Microbial mediation of 'reactive' nitrogen transformations in a temperate lagoon. Marine Ecology Progress Series 246: 73-84.
Anderson, I. C., J. W. Stanhope, A. K. Hardison, and K. J. McGlathery. In press. Sources and fates of nitrogen in Virginia Coastal Bays. In M. J. Kennish and H. W. Paerl [eds.], Coastal Lagoons: Critical Habitats of Environmental Change. Taylor and Francis.

150
Astill, H., and P. S. Lavery. 2001. The dynamics of unattached benthic macroalgal accumulations in the Swan-Canning Estuary. Hydrological Processes 15: 2387-2399.
Bligh, E. G., and W. J. Dyer. 1959. A Rapid Method of Total Lipid Extraction and Purification. Canadian Journal of Biochemistry and Physiology 37: 911-917.
Boschker, H. T. S., A. Wielemaker, B. E. M. Schaub, and M. Holmer. 2000. Limited coupling of macrophyte production and bacterial carbon cycling in the sediments of Zostera spp. meadows. Marine Ecology Progress Series 203: 181-189.
Bowen, J. L., and I. Valiela. 2001. The ecological effects of urbanization of coastal watersheds: historical increases in nitrogen loads and eutrophication of Waquoit Bay estuaries. Canadian Journal of Fish and Aquatic Science 58: 1489-1500.
Brush, M. J., and S. W. Nixon. 2003. Biomass layering and metabolism in mats of the macroalga Ulva lactuca L. Estuaries 26: 916-926.
Canuel, E. A., K. H. Freeman, and S. G. Wakeham. 1997. Isotopic compositions of lipid biomarker compounds in estuarine plants and surface sediments. Limnology and Oceanography 42: 1570-1583.
Canuel, E. A., A. C. Spivak, E. J. Waterson, and J. E. Duffy. 2007. Biodiversity and food web structure influence short-term accumulation of sediment organic matter in an experimental seagrass system. Limnology and Oceanography 52: 590-602.
Castaldelli, G. and others 2003. Decomposition dynamics of the bloom forming macroalga Ulva rigida C. Agardh determined using a C-14-carbon radio-tracer technique. Aquatic Botany 75: 111-122.
Cook, P. L. M., B. Veuger, S. Boer, and J. J. Middelburg. 2007. Effect of nutrient availability on carbon and nitrogen incorporation and flows through benthic algae and bacteria in near-shore sandy sediment. Aquatic Microbial Ecology 49: 165-180.
Dalsgaard, T. 2003. Benthic primary production and nutrient cycling in sediments with benthic microalgae and transient accumulation of macroalgae. Limnology and Oceanography 48: 2138-2150.
Deegan, L. A. and others 2002. Nitrogen loading alters seagrass ecosystem structure and support of higher trophic levels. Aquatic Conservation: Marine and Freshwater Ecosystems 12: 193-212.
Evrard, V., P. L. M. Cook, B. Veuger, M. Huettel, and J. J. Middelburg. 2008. Tracing carbon and nitrogen incorporation and pathways in the microbial community of a photic subtidal sand. Aquatic Microbial Ecology 53: 257-269.

151
Goldman, J. C., and M. R. Dennett. 2000. Growth of marine bacteria in batch and continuous culture under carbon and nitrogen limitation. Limnology and Oceanography 45: 789-800.
Goto, N., O. Mitamura, and H. Terai. 2001. Biodegradation of photosynthetically produced extracellular organic carbon from intertidal benthic algae. Journal of Experimental Marine Biology and Ecology 257: 73-86.
Hardison, A. K., E. A. Canuel, I. C. Anderson, and B. Veuger. Submitted-a. Fate of macroalgae in benthic systems: Carbon and nitrogen cycling within the microbial community. Marine Ecology Progress Series.
Hardison, A. K., C. R. Tobias, J. W. Stanhope, E. A. Canuel, and I. C. Anderson. Submitted-b. An experimental apparatus for laboratory and field-based perfusion of sediment porewater with dissolved tracers. Estuaries and Coasts.
Hauxwell, J., J. Cebrian, C. Furlong, and I. Valiela. 2001. Macroalgal canopies contribute to eelgrass (Zostera marina) decline in temperate estuarine ecosystems. Ecology 82: 1007-1022.
Hauxwell, J., J. Cebrian, and I. Valiela. 2003. Eelgrass Zostera marina loss in temperate estuaries: relationship to land-derived nitrogen loads and effect of light limiataion imposed by algae. Marine Ecology Progress Series 247: 59-73.
Hedges, J. I., and J. H. Stern. 1984. Carbon and Nitrogen Determinations of Carbonate-Containing Solids. Limnology and Oceanography 29: 657-663.
Holmquist, J. G. 1997. Disturbance and gap formation in a marine benthic mosaic: influence of shifting macroalgal patches on seagrass structure and mobile invertebrates. Marine Ecology-Progress Series 158: 121-130.
Kenward, M. G. 1987. A Method for Comparing Profiles of Repeated Measurements. Applied Statistics-Journal of the Royal Statistical Society Series C 36: 296-308.
Krause-Jensen, D., P. B. Christensen, and S. Rysgaard. 1999. Oxygen and nutrient dynamics within mats of the filamentous macroalga Chaetomorphalinum Estuaries 22: 31-38.
Krause-Jensen, D., K. McGlathery, S. Rysgaard, and P. B. Christensen. 1996. Production within dense mats of the filamentous macroalga Chaetomorpha linum in relation to light and nutrient availability. Marine Ecology-Progress Series 134: 207-216.
Lavery, P. S., R. J. Lukatelich, and A. J. McComb. 1991. Changes in the Biomass and Species Composition of Macroalgae in a Eutrophic Estuary. Estuarine Coastal and Shelf Science 33: 1-22.

152
Lorenzen, C. J. 1967. Determination of Chlorophyll and Pheo-Pigments - Spectrophotometric Equations. Limnology and Oceanography 12: 343-&.
Marinho-Soriano, E., W. S. C. Moreira, and M. A. A. Carneiro. 2006. Some aspects of the growth of Gracilaria birdiae (Gracilariales, Rhodophyta) in an estuary in northeast Brazil. Aquaculture International 14: 327-336.
McGlathery, K., K. Sundback, and I. Anderson. 2004. The Importance of Primary Producers for Benthic Nitrogen and Phosphorus Cycling, p. 231-261. In S. L. Nielsen, G. T. Banta and M. Pedersen [eds.], Estuarine Nutrient Cycling: The Influence of Primary Producers. Kluwer Academic Publishers.
McGlathery, K. J., I. C. Anderson, and A. C. Tyler. 2001. Magnitude and variability of benthic and pelagic metabolism in a temperate coastal lagoon. Marine Ecology-Progress Series 216: 1-15.
McGlathery, K. J., D. Krause-Jensen, S. Rysgaard, and P. B. Christensen. 1997. Patterns of ammonium uptake within dense mats of the filamentous macroalga Chaetomorpha linum. Aquatic Botany 59: 99-115.
McGlathery, K. J., M. F. Pedersen, and J. Borum. 1996. Changes in intracellular nitrogen pools and feedback controls on nitrogen uptake in Chaetomorpha linum (chlorophyta). Journal of Phycology 32: 393-401.
McGlathery, K. J., K. Sundback, and I. C. Anderson. 2007. Eutrophication in shallow coastal bays and lagoons: the role of plants in the coastal filter. Marine Ecology-Progress Series 348: 1-18.
Middelburg, J. J., C. Barranguet, H. T. S. Boschker, P. M. J. Herman, T. Moens, and C. H. R. Heip. 2000. The fate of intertidal microphytobenthos carbon: An in situ C-13-labeling study. Limnology and Oceanography 45: 1224-1234.
Moriarty, D. J. W., and A. C. Hayward. 1982. Ultrastructure of Bacteria and the Proportion of Gram-Negative Bacteria in Marine-Sediments. Microbial Ecology 8: 1-14.
Navarro-Angulo, L., and D. Robledo. 1999. Effects of nitrogen source, N : P ratio and N-pulse concentration and frequency on the growth of Gracilaria cornea (Gracilariales, Rhodophyta) in culture. Hydrobiologia 399: 315-320.
Nedergaard, R. I., N. Risgaard-Petersen, and K. Finster. 2002. The importance of sulfate reduction associated with Ulva lactuca thalli during decomposition: a mesocosm approach. Journal of Experimental Marine Biology and Ecology 275: 15-29.
NRC. 2000. National Research Council. Clean coastal waters: understanding and reducing the effects of nutrient pollution. National Academy Press.

153
Pavoni, B., A. Marcomini, A. Sfriso, R. Donazzolo, and A. A. Orio. 1992. Changes in an Estuarine Ecosystem - the Lagoon of Venice as a Case-Study. Acs Symposium Series 483: 287-305.
Peckol, P., B. Demeoanderson, J. Rivers, I. Valiela, M. Maldonado, and J. Yates. 1994. Growth, Nutrient-Uptake Capacities and Tissue Constituents of the Macroalgae Cladophora-Vagabunda and Gracilaria-Tikvahiae Related to Site-Specific Nitrogen Loading Rates. Marine Biology 121: 175-185.
Pedersen, M. F., S. L. Nielsen, and G. T. Banta. 2004. Interactions between vegetation and nutrient dynamics in coastal marine ecosystems: An introduction. In S. L. Nielsen, G. T. Banta and M. F. Pedersen [eds.], Estuarine Nutrient Cycling: The Influence of Primary Producers. Kluwer.
Perry, G. J., J. K. Volkman, R. B. Johns, and H. J. Bavor. 1979. Fatty-Acids of Bacterial Origin in Contemporary Marine-Sediments. Geochimica et Cosmochimica Acta 43: 1715-1725.
Pinckney, J., R. Papa, and R. Zingmark. 1994. Comparison of High-Performance Liquid-Chromatographic, Spectrophotometric, and Fluorometric Methods for Determining Chlorophyll a Concentrations in Estuarine Sediments. Journal of Microbiological Methods 19: 59-66.
Poerschmann, J., and R. Carlson. 2006. New fractionation scheme for lipid classes based on "in-cell fractionation" using sequential pressurized liquid extraction. Journal of Chromatography A 1127: 18-25.
Raffaelli, D. 2000. Interactions between macro-algal mats and invertebrates in the Ythan estuary, Aberdeenshire, Scotland. Helgoland Marine Research 54: 71-79.
Raikar, S. V., M. Iima, and Y. Fujita. 2001. Effect of temperature, salinity and light intensity on the growth of Gracilaria spp. (Gracilariales, Rhodophyta) from Japan, Malaysia and India. Indian Journal of Marine Sciences 30: 98-104.
Sand-Jensen, K., and J. Borum. 1991. Interactions among phytoplankton, periphyton, and macrophytes in temperate freshwaters and estuaries. Aquatic Botany 41: 137-175.
Sfriso, A., B. Pavoni, A. Marcomini, S. Raccanelli, and A. A. Orio. 1992. Particulate Matter Deposition and Nutrient Fluxes onto the Sediments of the Venice Lagoon. Environmental Technology 13: 473-483.
Smith, D. J., and G. J. C. Underwood. 2000. The production of extracellular carbohydrates by estuarine benthic diatoms: The effects of growth phase and light and dark treatment. Journal of Phycology 36: 321-333.

154
Stanhope, J. W., I. C. Anderson, and W. G. Reay. 2009. Base flow nutrient discharges from lower Delmarva Peninsula watersheds of Virginia. Journal of Environmental Quality 38: 2070-2083.
Sundback, K., B. Jonsson, P. Nilsson, and I. Lindstrom. 1990. Impact of Accumulating Drifting Macroalgae on a Shallow-Water Sediment System - an Experimental-Study. Marine Ecology-Progress Series 58: 261-274.
Sundback, K., V. Enoksson, W. Graneli, and K. Pettersson. 1991. Influence of sublittoral
microphytobenthos on the oxygen and nutrient flux between sediment and water: a laboratory continuous-flow study. Marine Ecology Progress Series 74: 263-279.
Sundback, K. and others 2003. Importance of benthic nutrient regeneration during
initiation of macroalgal blooms in shallow bays. Marine Ecology-Progress Series 246: 115-126.
Sundback, K., P. Nilsson, C. Nilsson, and B. Jonsson. 1996. Balance between autotrophic and heterotrophic components and processes in microbenthic communities of sandy sediments: A field study. Estuarine Coastal and Shelf Science 43: 689-706.
Thomsen, M. S., K. J. McGlathery, and A. C. Tyler. 2006. Macroalgal distribution patterns in a shallow, soft-bottom lagoon, with emphasis on the nonnative Gracilaria vermiculophylla and Coldium fragile. Estuaries and Coasts 29: 465-473.
Thornemiller, B., M. M. Harlin, G. B. Thursby, M. M. Bradycampbell, and B. A. Dworetzky. 1983. Variations in the Distribution and Biomass of Submerged Macrophytes in 5 Coastal Lagoons in Rhode-Island, USA. Botanica Marina 26: 231-242.
Thybo-Christesen, M., M. B. Rasmussen, and T. H. Blackburn. 1993. Nutrient Fluxes and Growth of Cladophora-Sericea in a Shallow Danish Bay. Marine Ecology-Progress Series 100: 273-281.
Tyler, A. C., K. J. McGlathery, and I. C. Anderson. 2001. Macroalgae mediation of dissolved organic nitrogen fluxes in a temperate coastal lagoon. Estuarine Coastal and Shelf Science 53: 155-168.
---. 2003. Benthic algae control sediment-water column fluxes of organic and inorganic nitrogen compounds in a temperate lagoon. Limnology and Oceanography 48: 2125-2137.
Valiela, I. and others 1992. Couplings of Watersheds and Coastal Waters - Sources and Consequences of Nutrient Enrichment in Waquoit Bay, Massachusetts. Estuaries 15: 443-457.

155
Valiela, I., J. McClelland, J. Hauxwell, P. J. Behr, D. Hersh, and K. Foreman. 1997. Macroalgal blooms in shallow estuaries: Controls and ecophysiological and ecosystem consequences. Limnology and Oceanography 42: 1105-1118.
Veuger, B., B. D. Eyre, D. Maher, and J. J. Middelburg. 2007a. Nitrogen incorporation and retention by bacteria, algae, and fauna in a subtropical intertidal sediment: An in situ N-15-labeling study. Limnology and Oceanography 52: 1930-1942.
Veuger, B., J. J. Middelburg, H. T. S. Boschker, and M. Houtekamer. 2005. Analysis of N-15 incorporation into D-alanine: A new method for tracing nitrogen uptake by bacteria. Limnology and Oceanography-Methods 3: 230-240.
---. 2007b. Update of "Analysis of N-15 incorporation into D-alanine: A new method for tracing nitrogen uptake by bacteria" (Veuger et al. 2005, Limnol. Oceanogr. Methods 3: 230-240). Limnology and Oceanography-Methods 5: 192-194.
Veuger, B., D. van Oevelen, H. T. S. Boschker, and J. J. Middelburg. 2006. Fate of peptidoglycan in an intertidal sediment: An in situ C-13-labeling study. Limnology and Oceanography 51: 1572-1580.
Volkman, J. K., S. M. Barrett, S. I. Blackburn, M. P. Mansour, E. L. Sikes, and F. Gelin. 1998. Microalgal biomarkers: A review of recent research developments. Organic Geochemistry 29: 1163-1179.
Wazniak, C. E., M. R. Hall, T. J. B. Carruthers, B. Sturgis, W. C. Dennison, and R. J. Orth. 2007. Linking water quality to living resources in a mid-Atlantic lagoon system, USA. Ecological Applications 17: S64-S78.
Williams, P. J. l. B. 2000. Heterotrophic bacteria and the dynamics of dissolved organic material, p. 153-200. In D. L. Kirchman [ed.], Microbial Ecology of the Oceans. Wiley-Liss, Inc.
Yokoya, N. S., H. Kakita, H. Obika, and T. Kitamura. 1999. Effects of environmental factors and plant growth regulators on growth of the red alga Gracilaria vermiculophylla from Shikoku Island, Japan. Hydrobiologia 399: 339-347.

156
Table 4-1: Results of two-factor repeated measures ANOVA.
Repeated measures ANOVA was used to test for differences in isotope delivery source,
macroalgae, and light over time for isotopic enrichments (13C or 15N) of various sediment
pools. Significant p values (< 0.05) are indicated in bold.
Parameter Isotope Isotope delivery Macroalgae Light Day df F p df F p df F p df F p BULK 15N 6 23.9 0.0027 6 20.2 0.0042 6 63.6 0.0002 54 19.1 < 0.0001 13C 6 2.86 0.1416 6 14.8 0.0085 6 77.5 0.0001 54 22.6 < 0.0001 THAA 15N 5 10.5 0.0231 5 14.3 0.0128 5 37.9 0.0016 32 29.3 < 0.0001 13C 5 2.03 0.2135 5 10.2 0.0242 5 52.3 0.0008 33 50.2 < 0.0001 DALA 15N 5 9.98 0.0251 5 9.13 0.0293 5 25.1 0.0041 32 26.0 < 0.0001 13C 5 0.73 0.4331 5 5.36 0.0684 5 41.3 0.0014 33 46.0 < 0.0001 D/L-Ala 15N 5 0.66 0.4543 5 0.47 0.5243 5 183.7 < 0.0001 31 25.7 < 0.0001 13C 5 14.6 0.0124 5 0.64 0.4593 -- -- -- 27 28.1 < 0.0001 MACRO 15N 2 3.63 0.1972 6 21.4 0.0011 13C 2 3.57 0.1993 6 0.97 0.4861 PLFA 13C 6 2.45 0.1684 6 8.34 0.0278 6 15.1 0.0081 30 30.7 < 0.0001 BrFA 13C 6 3.30 0.1190 6 4.50 0.0782 6 13.5 0.0105 30 19.1 < 0.0001 PLFA 13C 6 0.95 0.3679 6 23.0 0.0030 6 54.7 0.0003 30 63.1 < 0.0001 BMR 13C 6 0.16 0.7014 6 0.56 0.4829 6 67.0 0.0002 30 29.6 < 0.0001 Chl a -- 6 3.06 0.1306 6 2.00 0.2070 6 42.5 0.0006 55 5.74 <0.0001

157
Tab
le 4
-2:
Upt
ake
and
loss
rat
es fo
r la
bel i
nto
bulk
, TH
AA
, and
PL
FA.
Val
ues a
re m
ean
(SE)
, n =
2. U
ptak
e ra
tes (
nmol
X g
dw-1
day-1
) wer
e ca
lcul
ated
as t
he sl
ope
of e
xces
s lab
el (X
= 13
C o
r 15N
) fro
m
Day
s 1 -
21.
Loss
rate
s (nm
ol X
gdw
-1 da
y-1)
wer
e ca
lcul
ated
as t
he sl
ope
of e
xces
s lab
el fr
om D
ays 2
1 –
42.
Slop
es w
ith si
gnifi
cant
p va
lues
(p <
0.0
5) a
re re
pres
ente
d in
bol
d.
B
ULK
TH
AA
PL
FA
13
C
15N
13
C
15N
13
C
Trea
tmen
t R
ate
slop
e r2
slop
e r2
slop
e r2
slop
e r2
slop
e r2
Dar
k U
ptak
e 6.
35 (1
.41)
0.
67
6.04
(1.9
2)
0.50
2.
09 (0
.58)
0.
62
3.05
(0.9
0)
0.59
0.
033
(0.0
31)
0.17
Lo
ss
-0.2
3 (2
.72)
0.
00
-1.6
3 (2
.23)
0.
12
-0.4
05 (1
.26)
0.
05
-1.0
5 (1
.48)
0.
20
-0.0
105
(0.0
23)
0.10
Lig
ht +
Mac
ro U
ptak
e 10
4 (3
2.4)
0.
51
50.7
(13.
2)
0.60
28
.4 (1
2.3)
0.
64
22.2
(10.
3)
0.61
1.
40 (1
.74)
0.
25
Lo
ss
-10.
1 (5
6.0)
0.
01
-12.
0 (2
2.9)
0.
08
-14.
0 --
-1
0.9
--
-1.5
6 --
Ligh
t NoM
acro
Upt
ake
296
(60)
0.
71
109
(21)
0.
74
79.1
(15.
5)
0.77
61
.7 (1
1.9)
0.
77
6.53
(1.9
6)
0.65
Pore Water Lo
ss
-119
(32)
0.
78
-37.
1 (1
0.9)
0.
74
-36.
6 (6
.9)
0.93
-2
4.8
(3.2
) 0.
97
-7.0
1 (1
.77)
0.
89
Dar
k U
ptak
e 6.
74 (1
.31)
0.
73
3.66
(0.8
2)
0.67
2.
65 (0
.40)
0.
84
2.13
(0.4
4)
0.77
0.
203
(0.2
80)
0.08
Lo
ss
-3.8
1 (2
.16)
0.
44
-2.6
6 (1
.28)
0.
52
-1.7
9 (0
.50)
0.
87
-1.5
2 (0
.57)
0.
78
-0.0
712
(0.0
334)
0.
82
Lig
ht +
Mac
ro U
ptak
e 22
1 (4
3)
0.73
26
.8 (7
.56)
0.
56
53.2
(17.
8)
0.56
15
.2 (3
.8)
0.70
2.
02 (3
.42)
0.
06
Lo
ss
-138
(78)
0.
52
-13.
1 (1
1.8)
0.
29
-27.
2 (3
3.4)
0.
40
-5.6
5 (1
0.2)
0.
24
-1.2
9 (2
.38)
0.
23
Ligh
t NoM
acro
Upt
ake
305
(36)
0.
88
43.3
(3.5
) 0.
94
83.3
(7.2
) 0.
94
22.5
(1.9
) 0.
94
6.40
(2.8
8)
0.45
Surface Water Lo
ss
-143
(68)
0.
52
-14.
0 (1
3.2)
0.
22
-39.
1 (1
0.3)
0.
88
-6.5
7 (4
.89)
0.
47
-5.2
4 (1
.18)
0.
91

158
Table 4-3: Isotope inventory in macroalgae and sediments.
Total label (15N or 13C) in macroalgal bloom and surface sediments (0-1 cm) of entire
mesocosm (0.29 m2) for surface water and porewater treatments across 4 days. % Red.
refers to the percent reduction (decrease) in total label in surface sediments for treatments
with macroalgae versus without macroalgae.
15N (mmol 15N mesocosm-1) 13C (mmol 13C mesocosm-1)
Sediment Sediment
Day Macro No Macro +Macro
% Red.
Macro No Macro +Macro
% Red.
7 3.67 (0.21) 1.43 (0.14) 0.77 (0.34) 46 52.3 (5.2) 10.4 (1.4) 8.72 (4.4) 16
14 2.75 (0.86) 2.99 (0.31) 1.82 (0.17) 39 73.0 (13.2) 24.0 (4.6) 15.9 (3.9) 29
21 6.14 (0.25) 4.03 (0.52) 2.73 (1.02) 32 76.3 (19.4) 27.6 (2.0) 19.6 (6.23) 30
Surf
ace
Wat
er
42 3.37 (1.27) 2.72 (0.62) 1.56 43 42.0 (18.7) 13.7 (2.6) 7.51 45
7 1.68 (1.23) 2.22 (1.04) 1.98 (0.59) 11 12.2 (4.1) 4.82 (2.16) 4.36 (0.35) 10
14 6.50 (2.86) 8.29 (2.60) 1.99 (1.25) 76 42.9 (19.0) 24.8 (7.3) 3.34 (1.62) 85
21 17.8 (6.1) 9.12 (0.42) 4.33 (1.22) 53 65.2 (15.2) 24.1 (1.0) 8.76 (3.41) 65
Pore
Wat
er
42 18.7 (2.1) 5.67 (0.74) 3.17 44 60.0 (5.4) 13.0 (2.1) 7.60 43

159
Figure 4-1. Map of study site.
Sediments and macroalgae were collected from a mid-lagoon shoal site in Hog Island
Bay, Virginia, located along the Delmarva Peninsula, USA. Hog Island Bay is part of the
Virginia Coast Reserve, a Long-Term Ecological Research (LTER) site.

160

161
Figure 4-2. Macroalgal biomass and isotopic enrichment.
Biomass (a) and excess 13C (b) and 15N (c) in surface water (closed symbols) and pore
water (open symbols) treatments. The grey shaded area indicates the isotope addition
period. Values are mean ± SE (n = 2).

162
a
b
c

163
Figure 4-3. Benthic chlorophyll a concentrations in a) Surface Water and b) Pore
Water treatments.
Treatments shown are light with macroalgae (solid lines, filled symbols), light without
macroalgae (solid lines, open symbols), and dark without macroalgae (dotted lines with
filled symbols). Baseline samples were taken 4 days prior to adding the nutrients and
macroalgae. Values are mean ± SE (n = 2).

164

165
Figure 4-4. Bulk sediment isotopes.
Excess 13C (a ,b) and 15N (c, d) in bulk sediments in Surface Water (a, c) and Pore Water
(b, d) treatments. Values are mean ± SE (n = 2).

166

167
Figure 4-5. PLFA isotopic enrichments.
Excess 13C in total PLFA (a, b), C20 and C22 polyunsaturated fatty acids (PUFA; c, d), and
branched odd fatty acids (BrFA; e, f) for Surface Water (a, c, e) and Pore Water (b, d, f)
treatments. Values are mean ± SE (n = 2).

168

169
Figure 4-6. The PLFA bacteria-to-algae (BAR) and D/L-Ala ratios.
BAR is the ratio of excess 13C in branched odd fatty acids (BrFA) to the sum of BrFA
and polyunsaturated fatty acids (BrFA + PUFA) for light mesocosms in a) Surface Water
and b) Pore Water treatments. The ratio of excess 13C (c, d) and 15N (e, f) in D-alanine/L-
alanine (D/L-Ala) for light mesocosms in Pore Water (c, e) and Surface Water (d, f)
treatments. The dashed horizontal lines in c-f represent the racemization background
(0.017). Values on the right y-axes correspond to estimates of bacterial and algal
contribution to total label incorporation. Values are mean ± SE (n = 2).

170

171
Figure 4-7. THAA isotopic enrichments.
Excess 13C (a ,b) and 15N (c, d) in total hydrolyzable amino acids (THAA) in Surface
Water (a, c) and Pore Water (b, d) treatments. Values are mean ± SE (n = 2).

172

173
Figure 4-8. D-alanine isotopic enrichments.
Excess 13C (a ,b) and 15N (c, d) in D-alanine (D-Ala) in surface water (a, c) and pore
water (b, d) treatments. Values are mean ± SE (n = 2).
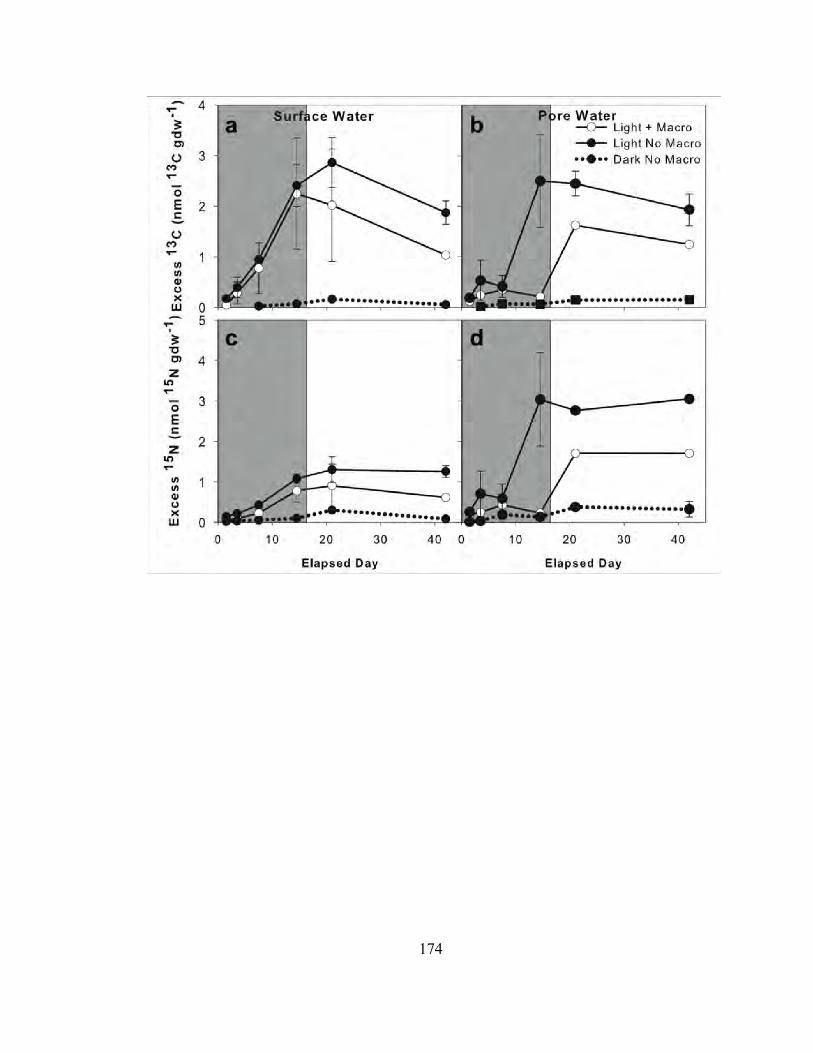
174

175
CHAPTER 5: FATE OF MACROALGAE IN BENTHIC SYSTEMS: CARBON
AND NITROGEN CYCLING WITHIN THE MICROBIAL COMMUNITY
Amber K. Hardison1*, Elizabeth A. Canuel1, Iris C. Anderson1, Bart Veuger2
1. Virginia Institute of Marine Science, College of William and Mary, P.O. Box 1346,
Gloucester Point, VA 23062
2. Netherlands Institute of Ecology, Center for Estuarine and Marine Ecology, P.O. Box
140, 4400 AC Yerseke, The Netherlands
Submitted to Marine Ecology Progress Series in October, 2009.
* Corresponding author. Email: [email protected]

176
ABSTRACT
High nutrient loading to coastal bays is often accompanied by the presence of bloom-
forming macroalgae, which take-up and sequester large amounts of carbon (C) and
nitrogen (N) while growing. This pool is temporary, however, as nuisance macroalgae
exhibit a bloom and die-off cycle, influencing the biogeochemical functioning of these
systems in unknown ways. The objective of this work was to trace the C and N from
senescing macroalgae into relevant sediment pools. A macroalgal die-off event was
simulated by the addition of freeze-dried macroalgae (Gracilaria spp.), pre-labeled with
stable isotopes (13C and 15N), to sediment mesocosms. The isotopes were traced into bulk
sediments and partitioned into benthic microalgal (BMA) and bacterial biomass using
microbial biomarkers to quantify the uptake and retention of macroalgal C and N. Bulk
sediments took up label immediately following the die-off, and macroalgal C and N were
retained in the sediments for >2 weeks. Approximately 6 to 50% and 2 to 9% of
macroalgal N and C, respectively, were incorporated into the sediments. Label from the
macroalgae appeared in both bacterial and BMA biomarkers, suggesting that efficient
shuttling of macroalgal C and N between these communities may serve as a mechanism
for retention of macroalgal nutrients within the sediments.
Keywords: stable isotopes, macroalgae, benthic microalgae, bacteria, biomarker, coastal
eutrophication.

177
INTRODUCTION
Macroalgal blooms are increasingly recognized as a symptom of eutrophication in
shallow coastal systems worldwide (Duarte 1995, Valiela et al. 1997). Their proliferation
has been linked to increased nutrient loadings (Hauxwell et al. 2001, Bintz et al. 2003),
and in many systems macroalgae have replaced slower-growing seagrasses and perennial
macrophytes (Duarte 1995, Valiela et al. 1997, Hauxwell et al. 2001, Bintz et al. 2003,
McGlathery et al. 2007). In temperate systems blooms usually develop in spring and
collapse in mid- to late-summer, when high temperatures and self-shading negatively
affect algal productivity (Peckol & Rivers 1995, McGlathery et al. 1997, Brush & Nixon
2003, Higgins et al. 2008). The deleterious effects these blooms have on the surrounding
system while alive and following die-off have been studied extensively (e.g. Sfriso et al.
1992, Raffaelli 2000, Hauxwell et al. 2001, Cummins et al. 2004, Nuzzi & Waters 2004).
Blooms can attain biomasses up to 10 kg wet weight m-2 (Gordon & Mccomb
1989, Pavoni et al. 1992, Valiela et al. 1992, Morand & Briand 1996, Astill & Lavery
2001). While growing, macroalgae take-up and sequester significant quantities of
nutrients, often at similar magnitudes to nutrient loading, thereby serving effectively as a
nutrient “filter” (Thybo-Christesen et al. 1993, 1996, Valiela et al. 1997, McGlathery et
al. 2001, Pedersen et al. 2004). However, these blooms are not long-lived and, therefore,
do not serve as a permanent nutrient reservoir. Although the fate of senescent macroalgal
biomass is not fully known, it likely greatly impacts nutrient cycling dynamics within
these systems.

178
Studies of macroalgal bloom decay have demonstrated rapid breakdown of
biomass, resulting in release of both inorganic and organic nutrients to the water column
(Buchsbaum et al. 1991, Tyler et al. 2001, Castaldelli et al. 2003, Garcia-Robledo et al.
2008), supporting phytoplankton and bacterial metabolism (Sfriso et al. 1992,
Nedergaard et al. 2002). Fewer studies have focused on macroalgal decay within the
sediments (Nedergaard et al. 2002, Lomstein et al. 2006, Rossi 2007, Garcia-Robledo et
al. 2008), where heterotrophic bacterial densities are significantly higher than in the water
column (Deming & Baross 1993, Schmidt et al. 1998, Ducklow 2000). In addition, most
of the sediment studies have been conducted in low or no light environments even though
light is typically available to shallow sediments where macroalgal die-offs occur and
sediment biogeochemistry is largely affected by benthic microalgal (BMA) activity
(Underwood & Kromkamp 1999). While nutrients associated with senescent macroalgal
blooms are recycled and can have a positive feedback on phytoplankton production in the
water column, nutrients released during macroalgal decay in the sediments may support
benthic microalgal (BMA) and bacterial production, which could intercept the return of
nutrients to the overlying water column. If shallow-water sediments, thus, behave as a
nutrient “filter” the response by phytoplankton may be reduced, and benthic production
could effectively buffer the system from further eutrophication. In order to better
constrain the input and retention of macroalgae-associated nutrients in the sediments, we
used a dual stable isotope labeling approach to track macroalgal carbon (C) and nitrogen
(N) into bulk sediments and the sediment microbial community after a simulated
macroalgal die-off.

179
METHODS
Site description Sediments and macroalgae were collected from two lagoons
along the Delmarva Peninsula, USA: Hog Island Bay, Virginia (HIB) and Isle of Wight
Bay, Maryland (IWB; Fig. 1). These bays are typical of temperate lagoons along the U.S.
East Coast. Both are shallow, on average less than 2 m deep at mean low water, and are
characterized by ephemeral macroalgal blooms (Goshorn et al. 2001, McGlathery et al.
2001, Thomsen et al. 2006); however, there are important differences between the
lagoons. External loading of nutrients (N) to HIB (14 kg N ha-1 y-1; Anderson et al. In
press) is lower than for IWB (65 kg N ha-1 y-1; Boynton et al. 1996), and as a result,
macroalgal densities in HIB are lower and only dominant at select sites during brief
portions of the year (this study, Boynton et al. 1996, Goshorn et al. 2001, McGlathery et
al. 2001, Stanhope et al. 2009).
Experimental design A flow-through mesocosm array was set-up at the Virginia
Institute of Marine Science (VIMS) Eastern Shore Laboratory (ESL) in Wachapreague,
VA. Each mesocosm (0.61 m diameter x 0.61 m height) was constructed of translucent
fiberglass to allow maximum light penetration (87% visual light transmission; Solar
Components Corp.). Three mesocosms were filled with sediments from each lagoon in
June 2006 to a depth of ~20 cm using intact sediments extruded from cores taken at the
field sites. Care was taken not to include any macroalgae or visible macrofauna in the
collected cores. At the ESL, the mesocosms were placed in shallow water baths under
30% shade cloth to control temperature and light. Ambient, filtered (10 µm) seawater,

180
pumped from the creek adjacent to the ESL, was delivered gravimetrically to each
mesocosm at a rate that achieved a water column flushing time of ~2 days, similar to the
flushing time observed at the study sites (Oertel 2001). The water column was circulated
using mini-jet pumps (Aquatic Ecosystems, Inc.) secured on the inner tank wall ~18 cm
above the sediment surface to avoid sediment resuspension. The mesocosms were
equilibrated for two weeks before beginning the experiment. Water column temperature
and salinity were measured in each mesocosm throughout the experiment using a YSI
datasonde.
Macroalgae (Gracilaria spp.) were collected from both lagoons in May 2006 and
returned to the laboratory for isotopic labeling. The macroalgae were cleaned of
epiphytes and epifauna, rinsed with 0.7 µm filtered seawater, and placed in separate
aquaria inside a greenhouse. Filtered (0.7 µm) seawater was added to each tank and
aerated during labeling. The algae were starved for 10 days and then fertilized daily for
14 days with a solution containing 50 at% 15N-NH4+ (as NH4Cl) and 98 at% 13C-HCO3
-
(as NaHCO3). Rates of N and C addition were estimated to sustain tissue N at 3% and C
at 25% of dry weight with a growth rate of 5% day-1 following the procedure of Tyler and
McGlathery (2006). To insure that phosphorus (P) was not limiting, P was added to
provide a 10:1 ratio of N:P. At the end of the labeling period, the algae were rinsed with
filtered (0.7 µm) seawater, patted dry, and freeze-dried intact. The final isotopic
enrichments of the dead macroalgae were approximately 30 at% 15N and 9 at% 13C.
After the mesocosm equilibration period, the intact, isotopically-labeled, freeze-dried
algae were added to the surface of sediments in corresponding mesocosms from HIB or
IWB, at ambient densities observed in each system (HIB: 84 gdw m-2; IWB: 184 gdw m-

181
2; Table 1). The intact macroalgae settled to the sediment surface, but retained some
buoyancy for the first few days due to the gentle water circulation; after the second day,
macroalgae were no longer visible.
Sediment sampling The mesocosms were sampled one day prior to the
macroalgal additions to capture baseline conditions (Day 0) and on Days 1, 2, 7, and 14
after the additions. At each sampling, surface sediments (0-1 cm), collected using two
acrylic cores (5.7 cm I.D.), were reserved for bulk (total organic C (TOC), total N (TN)),
amino acid, and fatty acid analyses. Sediments from both cores were combined in pre-
combusted glass jars, immediately frozen at -4ºC, and frozen at -80ºC within 3 days. The
remaining sediment in the cores was placed carefully back into the holes in the mesocosm
sediments. Surface sediments (0-1 cm) from a third acrylic core were collected and
processed immediately for determination of bulk density and organic and water contents.
Sediments were also collected for chlorophyll a concentrations using a cut-off syringe
(1.1 cm I.D.). Samples were sectioned into 0-0.3 cm and 0.3-1.0 cm horizons, placed into
15 mL centrifuge tubes, immediately frozen at -4ºC, and analyzed within 1 month. A
different region of the sediment surface was sampled each time to avoid re-sampling any
sediments.
Bulk sediment analyses Sediments for percent water and organic matter (OM)
were processed immediately. A known volume of sediment was weighed, dried at 40ºC
and re-weighed for water content and bulk density. The dried sediments were combusted
for 4 h at 500ºC to obtain ash-free dry weight (AFDW). Samples were analyzed for

182
benthic chlorophyll a concentrations according to a modification of the method of
Lorenzen (1967, Pinckney et al. 1994). The sediment pellet was sonicated in 90%
acetone, vortexed and extracted for 24 h at -4ºC. The supernatant was passed through a
0.45 µm filter and read on a Shimadzu UV-1601 UV Visible spectrophotometer (λ = 665,
750 nm). Chlorophyll a concentrations (mg m-2) for the 0-0.3 and 0.3-1.0 cm sections
were calculated according to the equations in Lorenzen (1967) and added to obtain
concentration for 0-1 cm.
For bulk sediment TOC, TN, and isotopic measurements, sediments were freeze-
dried, ground and homogenized, acidified with 10% HCl to remove inorganic C (Hedges
& Stern 1984), and analyzed for 13C/12C and 15N/14N using a PDZ Europa ANCA-GSL
elemental analyzer interfaced to a PDZ Europa 20-20 isotope ratio mass spectrometer
(Sercon Ltd., Cheshire, UK; EA-IRMS) at the University of California at Davis Stable
Isotope Facility. Stable isotope ratios for C (R= 13C/12C) and N (R=15N/14N) were used to
calculate δ-values in units of per mil (‰):
δX (‰) = [(Rsample / Rstandard) -1] × 1000 (1)
where X = 13C or 15N. Samples were expressed relative to international standards Pee Dee
Belemnite (PDB, C) and atmospheric N. δX was used to calculate atom% X, which was
used to calculate excess X (absolute amount of incorporated 13C or 15N):
at%X =
[100 × Rstandard × ((δXsample / 1000) + 1)] / [1 + Rstandard × ((δXsample / 1000) + 1)] (2)

183
excess X (nmol X gdw-1) = [(at%Xsample - at%Xcontrol)/ 100] × [concentrationsample] (3)
where, concentrations were expressed in moles C or N relative to sediment dry weight.
The control (unlabeled) samples were collected on Day 0, before macroalgae were added
to the mesocosms.
Hydrolyzable amino acids Hydrolyzable amino acids (HAAs) were extracted
and analyzed according to the method presented in Veuger et al. (2005). Freeze dried
sediment (1 g) was rinsed with 2N HCl and Milli-Q water to remove dissolved amino
acids. The sediment pellet was then hydrolyzed with 6N HCl at 110ºC for 20 h.
Following purification by cation exchange chromatography, amino acids were derivatized
with isopropanol and pentafluoropropionic anhydride and further purified by solvent
extraction. Concentrations and stable isotope ratios for C (R= 13C/12C) and N
(R=15N/14N) of the derivatized D- and L-amino acids were measured at the Netherlands
Institute of Ecology (NIOO) by gas chromatography combustion isotope ratio mass
spectrometry (GC-c-IRMS), on a HP 6890 GC (Chirasil L-Val column) with a Thermo
type III combustion interface and a Thermo Delta Plus IRMS. δ-and at% X values were
calculated according to equations 1 and 2 and used to calculate excess X according to
equation 3, where concentrations were AA concentrations expressed in moles C or N
relative to sediment dry weight. Carbon isotopic values of amino acids were corrected
for the C atoms added during derivatization using a mass balance approach following

184
(Veuger et al. 2006). The sum of concentrations of, and/or excess label incorporated in,
all amino acids analyzed will be referred to as total hydrolyzable amino acids (THAA).
The ratio of excess 13C or 15N incorporation into D-alanine (D-Ala), a bacterial-specific
amino acid, relative to L-alanine (L-Ala), an amino acid made by all organisms, was
calculated as:
D/L-Ala ratio (D/L-Ala) = (excess X in D-Ala) / (excess X in L-Ala) (4)
where X was 13C or 15N. During hydrolysis some racemization of L-Ala to D-Ala takes
place, resulting in a D/L-Ala value of ~0.017 (Veuger et al. 2007b). We corrected values
of excess isotope in D-Ala for this racemization according to Veuger et al. (2007a),
whereas values of D/L-Ala have been left uncorrected. Instead, the D/L-Ala value of
0.017 will be indicated graphically in our results (Veuger et al. 2007b). We estimated the
bacterial contribution to total 13C or 15N incorporation according to Veuger (2007a):
Bacterial contribution (%) =
[(excess X D/L-Ala – 0.017) / (bacterial D/L-Ala – 0.017)] x 100% (5)
where X was 13C or 15N. Bacterial D/L-Ala represents the D/L-Ala abundance ratio for
bacteria. The upper bound of the ratio ranges from 0.05 for Gram negative (G-) bacteria
to 0.1 for Gram positive (G+) bacteria and cyanobacteria (Veuger et al. 2007b). Previous
work suggests that G+ bacteria are more prominent in deeper (anaerobic) sediments

185
(Moriarty & Hayward 1982). Since our study used sandy photic sediments, we assumed
that the contribution from G+ bacteria was negligible. Additionally, photosynthetic
pigment analyses conducted on sediments from the HIB field sites suggested that
cyanobacterial contribution to the microbial community was negligible (M. Waters, pers.
comm.). As a result, we further assumed that their contribution to the D/L-Ala ratio of
the total microbial community was negligible, and we estimated the bacterial D/L-Ala
ratio for our sediments to be 0.05. This will also be indicated graphically in our results.
The lower bound of D/L-Ala, when bacteria do not take up any label, is 0.017, which
represents abiotic racemization of L-Ala (Veuger et al. 2007b). Thus, excess 13C and 15N
D/L-Ala ratio values should fall between these upper and lower limits, with higher values
indicating a higher bacterial contribution to the total label uptake since only bacteria
incorporate label into D-Ala.
Phospholipid linked fatty acids Total fatty acids were analyzed according to a
modified Bligh and Dyer (1959) method (Poerschmann & Carlson 2006, Canuel et al.
2007). Wet sediments (~12 g) were extracted using an accelerated solvent extractor
system (Dionex ASE 200) adapted for in-cell silica gel chromatography. Each sample
was extracted twice on the ASE: neutral lipids were collected following extraction with a
9:1 (v:v) hexane:acetone mixture at 50ºC; then polar lipids were collected following
extraction with a 8:2 (v:v) methanol:chloroform solution at 80ºC. Neutral and polar lipid
fractions were saponified using KOH-CH3OH for 2h at 110ºC. Saponified samples were
then extracted under basic and acidic conditions. The acid-extracted fractions were
methylated with BF3-CH3OH to form fatty acid methyl esters (FAME). The neutral

186
FAME included neutral and glycolipids while the polar FAME represented the
phospholipid-linked fatty acids (PLFA). FAME concentrations were measured by gas
chromatography with flame ionization detection (GC-FID, DB-5 column, HP 5890) and
quantified using methyl heneicosanoate as an internal standard. Peak identities were
verified using reference standards as well as coupled gas chromatography mass
spectrometry (GC-MSD, HP 6890). Fatty acids are designated A:BωC, where A is the
total number of carbon atoms, B is the number of double bonds, and C is the position of
the first double bond from the aliphatic ‘‘ω’’ end of the molecule. The prefixes ‘‘i’’ and
‘‘a’’ refer to iso- and anteiso- methyl branched fatty acids (see Canuel et al. 1995 and
references therein). Stable C isotope ratios (R= 13C/12C) for PLFA were measured at
NIOO by Thermo GC/C-IRMS system composed of a Trace GC Ultra gas chromatograph
(BPX70 column) coupled to a Delta Plus Advantage IRMS through a GC/C-III interface
and were used to calculate δ13C (Eq. 1) and at%13C (Eq. 2). Excess 13C was calculated
according to equation 3, where concentrations were FAME concentrations expressed in
moles C relative to dry weight. Actual PLFA isotopic values were derived from the
FAME isotopic compositions by correcting for the isotopic composition of the C added
during derivatization using a mass balance approach.
Field monitoring Concurrent with the mesocosm experiment, we conducted field
measurements of various water column and sediment parameters at the sediment
collection sites within each lagoon on two sampling dates. Triplicate measurements of
water temperature and salinity were taken using a YSI datasonde during each sampling.
Triplicate samples for sediment percent OM and benthic chlorophyll a concentrations

187
were also collected and measured as described above for the mesocosm experiment. We
also monitored macroalgal biomass from May through October 2006. Macroalgae
samples (n = 3) were collected at multiple sites across HIB (n = 9) and IWB (n = 5), by
randomly tossing a cylinder (0.42 m I.D.) and collecting the total biomass contained
within the cylinder. The algae was dried at 40ºC and normalized to the cylinder area for
biomass (gdw m-2). The triplicate biomass values for each site were averaged to obtain a
site biomass estimate. Since this experiment was designed to simulate a die-off event
following a bloom, we report the ranges over the growing season of maximum biomass
estimates for each site as well as the mean ± SE for all sites within each lagoon (Table 1).
Data analysis We applied repeated measures analysis of variance (ANOVA) to
examine the effects of lagoon (Hog Island Bay vs. Isle of Wight Bay) and time (Days 0,
1, 2, 7, 14) on the sediment parameters using the Mixed procedure in SAS 9.1 (SAS
Institute Inc., Cary, NC). In all models, a first-order ante-dependence error structure
(Kenward 1987) was used to model the within-subject covariance structure. We present
results from the type III test of fixed effects from the ANOVA model. To further explain
the effects of time, post-hoc contrasts were used to compare the isotopic enrichment
parameters for Days 1 and 2 with Days 7 and 14. Unless otherwise noted, mesocosm
values presented are means ± 1 SE for 3 replicates.
RESULTS
Field and experimental conditions

188
Temperatures and salinities in the mesocosms were similar to values measured at
the field sites during June (Table 1). Between-lagoon differences in organic content and
benthic chlorophyll a concentrations in mesocosm sediments were also similar to those
observed at the field sites (Table 1). The surface (0-1 cm) sediment organic content
within HIB mesocosms was approximately twice as high as in IWB. These values
represent mean ± SE (n = 15) over five sampling days, since sediment OM did not
accumulate in either treatment over the course of the experiment (Table 2). In addition,
benthic chlorophyll a concentrations were lower at HIB in the surface (0-1 cm) sediments
than at IWB (Table 1). Again, these values represent mean ± SE (n = 15) since benthic
chlorophyll a did not accumulate in either treatment over the experiment (Table 2).
Similarly, organic content at the field sites was higher in HIB while benthic chlorophyll a
concentrations were higher in IWB (Table 1). Peak macroalgal biomass from May
through October 2006 ranged across the field sites from 0 to 192 and 29 to 538 gdw m-2
for HIB (n = 9) and IWB (n = 5), respectively (Table 1). The biomass of dead
macroalgae added to the mesocosms fell within these ranges; approximately twice as
much algae was added to the IWB treatments to reflect the higher macroalgal densities
there.
Bulk isotopes
All sediment pools displayed similar isotopic enrichment patterns. Excess 13C
and 15N in bulk sediments (0-1 cm) are presented in Figure 2. 13C appeared in

189
mesocosms from both lagoons immediately following the addition of macroalgae (Day 1;
22.03 ± 0.29 and 62.76 ± 21.91 nmol 13C gdw-1 for HIB and IWB, respectively) and
excess 13C values were similar on Day 2. Individual replicates (not shown) peaked on
either Day 7 or Day 14, which accounted for the large variance associated with the means
for those days. Nevertheless, post-hoc contrasts indicated that excess 13C values were
significantly higher on Days 7 and 14 than on Days 1 and 2 (Table 3; Fig. 2a). Excess
15N followed the same pattern as 13C: label first appeared on Day 1 (28.94 ± 5.96 and
79.61 ± 36.27 nmol 15N gdw-1 for HIB and IWB, respectively), and values peaked on
either Day 7 or 14. Again, post-hoc contrasts showed higher excess 15N on Days 7 and
14 than Days 1 and 2 (Table 3, Fig. 2b). There were no significant lagoon differences in
either excess 13C or 15N for bulk sediments (Table 3). Maximum isotopic enrichments
were well above natural abundance levels (δ13C ~200‰, δ15N > 4000‰ relative to -14
and ~40‰ for δ13C and δ15N, respectively). Given the maximum isotopic enrichments for
each mesocosm and the masses of 13C and 15N that were added to each mesocosm as
macroalgal material, we estimated that 6.4 ± 1.4 and 35.1 ± 10.3% of the added
macroalgal 13C and 15N were incorporated into the sediments (0-1 cm) for HIB. In IWB,
2.9 ± 0.9 and 8.8 ± 2.1% of the macroalgal 13C and 15N were incorporated into the
sediments.
Hydrolyzable amino acids
All biomarker concentrations were normalized to sediment TOC to account for
the differences in organic content between HIB and IWB. THAA concentrations were

190
3.22 and 3.74 µmol AA mgOC-1 on Day 0 for HIB and IWB, respectively and decreased
slightly over the course of the experiment; there were no significant lagoon differences
(Table 2). THAA represented a stable fraction of the sediment organic content,
comprising ~13% of the TOC and ~30% of the TN. Excess 13C and 15N in the THAA
pool (summed excess 13C and 15N in the individual amino acids) were lower than in the
bulk pool, but displayed similar patterns, showing enrichments well above natural
abundance; for THAA, maximum values of δ13C > 500‰ and δ15N > 6000‰, whereas
background values were ~ -15 and 20‰ for δ13C and δ15N, respectively. Excess 13C
appeared in both lagoons immediately following the macroalgal addition (Day 1; 10.34 ±
1.43 and 26.10 ± 13.46 nmol 13C gdw-1 for HIB and IWB, respectively) and peaked on
either Day 7 or 14 (Fig. 3a). Excess 15N followed the same pattern as 13C: label first
appeared on Day 1 (13.80 ± 2.87 and 35.73 ± 12.02 nmol 15N gdw-1 for HIB and IWB,
respectively), and values peaked on either Day 7 or 14 (Fig. 3b). There were no
significant lagoon differences for excess 13C or 15N in THAA; however there were
significant time effects. Post-hoc contrasts indicated that excess 13C and 15N on Days 7
and 14 were significantly higher than on Days 1 and 2 (Table 3; Fig. 3a,b). Across all
sampling days, excess 13C and 15N in THAA accounted for approximately 40% of excess
13C and 15N in bulk sediments, although, the 13C and 15N accounted for a greater fraction
of the 13C and 15N in bulk sediment on Days 1 and 2 than on Days 7 and 14 (Tables 3, 4).
Excess 13C and 15N in individual amino acids provided additional information
about the fate of macroalgal C and N within the sediment microbial pool. Excess 13C
(corrected for hydrolysis-induced racemization) appeared in D-Ala, a bacterial-specific
amino acid, on Day 1 for both bays (HIB: 0.05 ± 0.01; IWB: 0.05 ± 0.02 nmol 13C gdw-

191
1) and peaked on Day 7 or 14 (Fig. 3c; Table 3). Similarly, 15N appeared on Day 1 (HIB:
0.06 ± 0.03; IWB: 0.08 ± 0.04 nmol 15N gdw-1) and peaked on Day 7 or 14 (Fig. 3d;
Table 3). While the absolute values for excess 13C and 15N were low on Days 1 and 2 and
increased throughout the experiment, the proportion of excess 13C and 15N in the bulk
sediment pool that appeared in D-Ala was highest on Days 1 and 2 and then decreased
through Day 14 (Tables 3, 4).
Additionally, the ratio of excess isotope (either 13C or 15N) in D-Ala to L-Ala
(D/L-Ala, not corrected for hydrolysis-induced racemization), a common amino acid
found in all organisms, indicated the relative importance of bacterial uptake to total label
uptake (Veuger 2005; Fig. 4). The values for excess 13C and 15N in D/L-Ala showed
similar patterns (Fig. 4a,b). Excess 13C in D/L-Ala peaked in mesocosms for both bays
on Day 1 (HIB: 0.053 + 0.006; IWB: 0.042 + 0.007) and decreased by Day 14 (HIB:
0.031 ± 0.005; IWB: 0.029 ± 0.002; Fig 4a). This represented a decrease from Day 1 to
Day 14 from ~100 to 41% bacterial 13C incorporation for HIB and 77 to 36% for IWB
(Fig. 4a, right axis). Excess 15N in D/L-Ala peaked on Day 1 (HIB: 0.044 ± 0.008; IWB:
0.033 ± 0.005) and decreased by Day 14 (0.028 ± 0.003 for HIB; 0.027 ± 0.0004)). This
represented a decrease from Day 1 to Day 14 from ~100 to 33% bacterial 15N
incorporation for HIB and 49 to 32% for IWB (Fig. 4b, right axis). Even though excess
13C D/L-Ala in HIB showed a trend of being higher than IWB, the treatments were not
significantly different; however, excess 15N in D/L-Ala was significantly higher for
sediments from HIB than IWB (Table 3, Fig. 4).
Phospholipid linked fatty acids

192
Total PLFA concentrations, normalized to sediment TOC, remained steady
throughout the experiment, and sediments from both lagoons had similar concentrations
(~15 mg PLFA mg OC-1; Table 2). PLFA represented ~1% of the sediment TOC for HIB
and IWB. Excess 13C in total PLFA were lower than in bulk and THAA pools, but
followed a similar pattern. Label first appeared on Day 1 (HIB: 0.77 ± 0.03; IWB: 2.14 ±
1.34 nmol 13C gdw-1) and peaked on Day 7 or 14 (Fig. 5a). There were no lagoon effects,
but excess 13C values were significantly lower on Days 1 and 2 than on Days 7 and 14
(Table 3; Fig. 5a). Over the course of the experiment, excess 13C in PLFA consistently
accounted for ~3% of excess 13C in bulk sediments for both lagoons (Tables 3, 4). Linear
regressions of excess 13C in PLFA with excess 13C in THAA showed good agreement (r2
= 0.72, p = 0.001 HIB; r2 = 0.96, p < 0.001 IWB) suggesting that microbial biomarkers in
each compound class tracked one another.
Excess 13C in groups of individual PLFA provided additional information about
the importance of specific sediment microbial pools in the cycling of macroalgal C and
N. Excess 13C appeared in branched odd fatty acids (BrFA: summed excess 13C in iso-
and anteiso- C13:0, C15:0, C17:0, and C19:0), representative of heterotrophic bacterial
biomass (Perry et al. 1979), on Day 1 for both bays (HIB: 0.03 ± 0.02; IWB: 0.12 ± 0.04
nmol 13C gdw-1) and peaked on Day 7 or 14 (Fig. 5b; Table 3). Values of excess 13C in
BrFA were linearly related to excess 13C in D-ala, another bacterial-specific biomarker (r2
= 0.95, p < 0.0001 HIB; r2 = 0.93, p < 0.0001 IWB). Excess 13C also appeared in
polyunsaturated fatty acids (PUFA: summed excess 13C in C20:4, C20:5, C22:5, and C22:6),
representative of algal biomass (Volkman et al. 1998), on Day 1 (HIB: 0.03 ± 0.01;

193
IWB: 0.06 ± 0.04 nmol 13C gdw-1) and peaked on Day 7 or 14 (Fig. 5c; Table 3).
Overall, 13C enrichments in PUFA were lower than for BrFA. Linear regressions of
excess 13C in BrFA and PUFA suggested that this trend was consistent across all time
points and the fatty acid groups showed good agreement (r2 = 0.92, p < 0.0001 HIB; r2 =
0.86, p < 0.0001 IWB).

194
DISCUSSION
We conducted this experiment to simulate the die-off of a macroalgal bloom, an
annual event common to many coastal lagoons worldwide (Sfriso et al. 1992, Valiela et
al. 1997). We selected field sites within two lagoons representative of coastal bays along
the east coast of the United States for collecting sediment and macroalgae. Both sites had
sandy sediments, were ~1 m deep at mean low water and were exposed to similar light
levels. Although the organic content of the sediments differed significantly between the
bays, the values still fell within a relatively narrow range of 0.6 – 3.8%, typical of many
coastal bays. Differences in benthic chlorophyll a concentrations in the mesocosms,
which were consistent with differences in the field, were more pronounced than organic
content and likely influenced the processing of macroalgal 13C and 15N in the sediments.
Since this experiment investigated the fate of dead macroalgae, we freeze-dried
the macroalgae prior to adding it to the mesocosms. Most macroalgal decomposition
studies have used frozen macroalgae (Buchsbaum et al. 1991, Nedergaard et al. 2002,
Castaldelli et al. 2003, Garcia-Robledo et al. 2008) or buried live macroalgae (Franke et
al. 2006, Rossi 2007); however, we did not freeze the macroalgae for logistical purposes,
and we did not feel that burial of the algae in the sediments adequately represented the
natural die-off process. Numerous phytoplankton fate studies have used freeze-dried
material (Moodley et al. 2000, Aberle & Witte 2003, Witte et al. 2003). After one week,
macroalgae were no longer visible in our mesocosms, indicating that all of the
macroalgae was degraded, remineralized, or respired (either in the water column or

195
sediments), so we are confident that freeze-drying was appropriate for the purposes of our
study.
Label incorporation into bulk sediments
Previous studies have shown that some decomposition of macroalgae occurs in
the water column, resulting in release of inorganic and organic nutrients, consumption of
dissolved oxygen, and release of toxic sulfides. These processes have been associated
with phytoplankton blooms, fish and other faunal kills as well as seagrass declines
(Buchsbaum et al. 1991, Sfriso et al. 1992, Hauxwell et al. 2001, Nedergaard et al. 2002,
Cummins et al. 2004). The fate of macroalgal biomass deposited to the sediments,
however, is less clear. Our bulk sediment isotope data suggest that a fraction of
macroalgal-derived 13C and 15N appeared in the sediments; however, less label appeared
in IWB than in HIB sediments, and less 13C appeared than 15N for both lagoons. In HIB,
maximum values of ~6 and 35% of macroalgal 13C and 15N were observed in the
sediments. In IWB ~3 and 9% of macroalgal 13C and 15N were incorporated into the
sediments. We were careful not to include visible macroalgal fragments in our samples,
so labeling in the sediments should have represented either detrital (macroalgal) POM or
DOM or transfer of 13C and 15N to other active pools within the sediments, rather than
direct sampling of macroalgal fragments. This is further supported by the uncoupling of
13C and 15N transferred to the sediments, which suggests that macroalgal C and N were
transferred disproportionately. We believe that these stoichiometric and lagoonal
differences in C and N transfer were related to microbial processes, as discussed below.

196
Sediments showed immediate enrichment in macroalgal 13C and 15N (Day 1),
which increased over the course of the experiment. While the general trends were
similar, replicates were variable suggesting heterogeneity within and/or across
mesocosms. Some showed highest enrichments on Day 7; others did not peak until Day
14. This variability likely resulted from patchiness associated with the bloom deposition
in our mesocosms or heterogeneity in the sediment microbial communities. Similar
patchiness has been observed in field studies (Holmquist 1997, Sfriso & Marcomini
1999, McGlathery et al. 2001). Despite the observed variability, our statistical analyses
confirmed that bulk isotopic enrichments at the end of the experiment (Days 7, 14) were
higher than at the beginning of the experiment (Days 1, 2) for both lagoons,
demonstrating accumulation and retention of macroalgal 13C and 15N in the sediments
following the simulated die-off.
Patterns of 13C and 15N enrichment in THAA and PLFA tracked the bulk sediment
enrichments. These pools showed immediate isotopic enrichment on Day 1 and peak
enrichments on Days 7 and 14. The labeled THAA and PLFA in sediments collected on
Days 1 and 2 likely represented rapid uptake by microbes, although some microscopic
macroalgal detritus may have remained after removal of all visible fragments. The
isotopically-labeled PLFA observed in the sediments on Days 7 and 14 most likely
represented living microbial biomass given rapid rates of PLFA turnover (Parkes 1987).
THAA on Days 7 and 14 may have included macroalgal detritus, but we observed no
visible fragments of macroalgae by then, suggesting that the biomass had been
decomposed.

197
Bacterial incorporation of macroalgal label
Overall, a smaller fraction of macroalgal 13C appeared in the bulk sediments than
15N for both lagoons. This is consistent with expected preferential uptake of N by the
microbial community since N is typically the element limiting microbial production and,
therefore, likely to be taken up efficiently, while C is relatively easily lost by respiration.
More directly, the isotopic enrichments of specific amino acids and fatty acids provided
an explicit indication of the communities in the sediments that were taking up macroalgal
13C and 15N. Enrichment of D-Ala and BrFA clearly demonstrated transfer of macroalgal
label to bacterial biomass through decomposition. The correlations between excess 13C
in D-Ala and BrFA provided strong evidence for bacterial 13C uptake, corroborating their
use as two independent proxies for bacterial biomass. Appearance of the labels on Day 1
showed an immediate response by bacteria to the addition of fresh OM. This rapid
response has been shown in previous studies investigating decomposition of macroalgae
(Buchsbaum et al. 1991, Nedergaard et al. 2002, Castaldelli et al. 2003, Franke et al.
2006). For example, just minutes after macroalgae were added to sediments, Franke and
others (2006) measured oxygen consumption rates nearly 18 times higher in sediments
with macroalgae than in nearby sediments without macroalgae. While others have
investigated metabolic responses to the addition of macroalgae, our study is the first to
demonstrate explicitly the incorporation of macroalgal C and N into sediment bacterial
biomass following a simulated die-off event.
Not only did the bacteria in our study respond rapidly to the addition of
macroalgal biomass, but the bacterial biomarkers also showed prolonged enrichment of

198
13C and 15N throughout the two-week experiment. The prolonged enrichment of bacterial
biomarkers may reflect incorporation into a refractory pool after cell death, which
accumulated in the sediments. However, the PLFA were not likely part of the detrital
pool given the rapid turnover of PLFA after cell death (Parkes 1987, Veuger et al. 2006),
and at the timescale of our experiment, we believe accumulation of labeled detrital
(bacterial) amino acids was negligible (Veuger et al. 2006). Instead, we believe the
continued enrichment of the bacterial biomarkers on Days 7 and 14 is consistent with
microbially-mediated decomposition of macroalgae. The isotopic labels could persist
even longer in the sediments if recycling of macroalgal detritus by bacteria was coupled
with BMA metabolism (next section). Regardless of the mechanism(s) responsible for
the high isotopic enrichments in the bacterial pool, macroalgal 13C and 15N clearly
persisted in the sediments for >2 weeks following the simulated die-off.
Interestingly, there were no significant between-lagoon differences in excess
isotope levels in bulk, THAA, or PLFA even though twice as much dead macroalgae was
added to the IWB mesocosms. We believe that the lower relative enrichments in IWB
may be explained by slower decomposition rates. The rates and extent of decomposition
are influenced by a variety of environmental, biological, and physical factors (Wakeham
& Canuel 2006). In addition to differences in the amount of macroalgal biomass added to
the treatments, the distinguishing characteristic of the lagoon treatments was the
sediments, and by default, perhaps the microbial communities within the sediments. It is
possible that the IWB bacteria that processed the macroalgal biomass may have been
limited in a way that the HIB bacteria were not. For example, some studies have
determined hydrolysis to be the rate-limiting step in decomposition (Arnosti 2004 and

199
references therein), either because hydrolysis rates are slow or because the organism
required to produce a specific enzyme to break down specific macromolecules are absent
or in low abundance. Regardless of the mechanism responsible for limiting retention of
macroalgal 13C and 15N in IWB sediments, this difference could profoundly affect
system-wide nutrient cycling. Since macroalgae in both lagoon treatments had visibly
disappeared within days following the additions, more macroalgal decomposition likely
took place in the IWB water column, which could promote phytoplankton growth and
further eutrophication of the system.
Bacterial-BMA coupling
The ratio of isotopic enrichments in D/L-Ala provides information on the relative
contribution of bacteria and algae to total label incorporation. High values of D/L-Ala
indicate a larger contribution from bacteria relative to algae, while the minimum value
(0.017) corresponds to zero bacterial uptake, or 100% algal label. Excess 13C and 15N in
D/L-Ala was highest for both lagoons on Days 1 and 2 and then decreased throughout the
experiment (Fig. 4), suggesting that algae contributed relatively more to total label uptake
over time. Because we cannot exclude the possibility that macroalgal detritus may have
contributed to the labeled L-Ala pools on Day 14, we estimated maximum contributions
from BMA by Day 14 of ~60% of microbial 13C uptake and ~68% of microbial 15N
uptake (Fig. 4a,b, right axes). The D/L-Ala ratios for IWB were consistently lower than
for HIB until they converged on Day 14, indicating a proportionately lower bacterial
contribution to total microbial uptake in IWB. This difference was corroborated by

200
benthic chlorophyll a levels in IWB, which were 4- to 5-times the levels in HIB,
indicating a larger BMA population in IWB. The fact that these differences were present
on Day 1 suggested the likelihood that BMA directly took up remineralized nutrients
resulting from bacterial decomposition from the water column and/or that label was
rapidly transferred from sediment bacterial to BMA. Lastly, 13C enrichment in C20 and
C22 PUFA provided a direct indication of label incorporation by BMA. We observed an
initial labeling of the PUFA pool followed by a peak on Day 7 or 14. All of the known
BMA-specific fatty acids are also present in many genera of macroalgae, including
Gracilaria (Dembitsky et al. 1991, Khotimchenko 2005). Therefore, the C20 PUFA that
we used may have represented macroalgal detritus on Days 1 and 2. However, given the
low excess 13C in PUFA on days 1 and 2 (Fig. 5c) as well as rapid PLFA turnover rates,
the PUFA on Days 7 and 14 most likely represented living BMA rather than macroalgae.
Together, these biomarkers supported incorporation of macroalgal 13C and 15N into BMA
biomass.
In figure 6, we propose the mechanisms underlying the relationship between
BMA, sediment bacteria, and macroalgal detritus in our experimental system. Results
from this experiment suggest that macroalgal biomass was decomposed and taken up by
heterotrophic bacteria in the surface sediments as dissolved organic matter (DOM).
Bacteria incorporated some of the 13C and 15N into biomass and mineralized the
remainder into the sediment pore water as DI13C and DI15N. Bacteria may have also re-
incorporated DI15N if the N content of the DOM substrate was insufficient to meet the
bacterial metabolic demands (Goldman & Dennett 2000, Veuger et al. 2007a). BMA
incorporated DI13C and DI15N from the pore water as well as the overlying water column,

201
where macroalgal detritus was also decomposing. BMA have also been shown to take up
dissolved organic N directly (Nilsson & Sundback 1996). To complete the cycle,
bacteria then recycled labeled BMA detritus and/or extrapolymeric substances (EPS)
exuded by the BMA (Smith & Underwood 1998, Middelburg et al. 2000, Veuger et al.
2007a, Evrard et al. 2008). Good agreement between bacterial and BMA fatty acids
supports a tight coupling between these communities (r2 = 0.93 and 0.92 for HIB and
IWB), although, bacteria have also been shown to recycle nutrients independent of BMA
by reincorporating their own degradation products (Veuger 2006, 2007a). Overall, once
the macroalgal biomass is hydrolyzed to DOM, it is effectively shuttled back and forth
between bacteria and BMA in organic and inorganic forms. This efficient recycling of
13C and 15N has been observed in other studies (Middelburg et al. 2000, Veuger et al.
2007a). Numerous studies have shown BMA production to be limited when live
macroalgae are present in dense accumulations, presumably due to light limitation at the
sediment surface (Astill & Lavery 2001, McGlathery et al. 2001, Hardison et al. In Prep).
However, our results suggest that once the light limitation is relieved after macroalgae
die, 5 to 9% of C and 6 to 50% of N originally present as macroalgal biomass is
transferred to the sediments and “stored” (temporarily) as microbial biomass. Even
though macroalgal distributions may be patchy, the work of Franke and colleagues
(2006) has shown that the effects of a macroalgal die-off may be expansive in the
sediments of some systems. In their study, macroalgal-DOM was distributed well
beyond the deposition location in systems that experienced advective flow, fueling
heterotrophic bacteria throughout the sediments.

202
Summary and implications for eutrophied systems
The extent to which sediments act as a sink for macroalgal C and N depends
largely on the amount of biomass transferred to the sediments as well as recycling
processes within the sediments. In our experiment, less than half of the macroalgae was
incorporated into the sediments from HIB, and even less for sediments from IWB. The
isolation of our mesocosms from the hydrodynamic regime typically found in the
environment may have biased the amount of macroalgal biomass that was transferred to
the sediments relative to what occurs in the environment. On the one hand, we may have
overestimated transfer of macroalgal material to the sediments if wave and tidal action
disperse the macroalgal detritus and decrease deposition onto the sediment surface. On
the other hand, our estimate may have been conservative if hydrodynamic mixing of the
sediment surface entrains macroalgae into the sediments. In either case, it is clear from
other laboratory and field studies that some fraction of macroalgae associated with
blooms is transferred to the sediments following die-off (Sfriso et al. 1992, Lomstein et
al. 2006, Garcia-Robledo et al. 2008). We suggest that further research investigating the
influence of hydrodynamic forcings and sediment resuspension on macroalgal
decomposition in the sediments is warranted. Nevertheless, our study suggests that
uptake and recycling of C and N by BMA and bacteria within the sediments may serve as
a temporary reservoir for a fraction of the C and N that was previously stored as
macroalgal biomass. While bacteria are the primary agents of decomposition of the
macroalgae, BMA intercept the return of nutrients to the water column, thereby
diminishing phytoplankton uptake and a positive feedback to further eutrophication.

203
ACKNOWLEDGEMENTS
This research was supported by the National Science Foundation (VCR-LTER
project DEB 0080381 and DEB 0621014; DEB Ecosystems 0542645 to I.C.A. and
E.A.C.), the European Association of Organic Geochemists (Shell Travel Award to
A.K.H.) and the Environmental Protection Agency (STAR FP916722010 to A.K.H.).
The EPA has not officially endorsed this publication and the views expressed herein may
not reflect the views of the EPA. This work would not have been possible without the
help of M. Luckenbach, S. Fate, and R. Bonniwell at the VIMS ESL, J. Stanhope, H.
Walker, B. Neikirk, E. Lerberg, C. Funkey, P. Littreal, and R. Bushnell at VIMS, and M.
Houtekamer and P. v. Rijswijk at NIOO.

204
LITERATURE CITED
Aberle N, Witte U (2003) Deep-sea macrofauna exposed to a simulated sedimentation event in the abyssal NE Atlantic: in situ pulse-chase experiments using C-13-labelled phytodetritus. Marine Ecology-Progress Series 251:37-47
Anderson IC, Stanhope JW, Hardison AK, McGlathery KJ (In press) Sources and fates of nitrogen in Virginia Coastal Bays. In: Kennish MJ, Paerl HW (eds) Coastal Lagoons: Critical Habitats of Environmental Change. Taylor and Francis
Arnosti C (2004) Speed bumps and barricades in the carbon cycle: substrate structural effects on carbon cycling. Marine Chemistry 92:263-273
Astill H, Lavery PS (2001) The dynamics of unattached benthic macroalgal accumulations in the Swan-Canning Estuary. Hydrological Processes 15:2387-2399
Bintz JC, Nixon SW, Buckley BA, Granger SL (2003) Impacts of temperature and nutrients on coastal lagoon plant communities. Estuaries 26:765-776
Bligh EG, Dyer WJ (1959) A Rapid Method of Total Lipid Extraction and Purification. Canadian Journal of Biochemistry and Physiology 37:911-917
Boynton WR, Hagy JD, Murray L, Stokes C, Kemp WM (1996) A comparative analysis of eutrophication patterns in a temperate coastal lagoon. Estuaries 19:408-421
Brush MJ, Nixon SW (2003) Biomass layering and metabolism in mats of the macroalga Ulva lactuca L. Estuaries 26:916-926
Buchsbaum R, Valiela I, Swain T, Dzierzeski M, Allen S (1991) Available and refractory nitrogen in detritus of coastal vascular plants and macroalgae. Marine Ecology Progress Series 72:131-143
Canuel EA, Freeman KH, Wakeham SG (1995) Seasonal-Changes in the Sources of Organic-Matter Delivered to a Coastal Sediment - a Gc-Irms Approach. Abstracts of Papers of the American Chemical Society 210:70-Geoc
Canuel EA, Spivak AC, Waterson EJ, Duffy JE (2007) Biodiversity and food web structure influence short-term accumulation of sediment organic matter in an experimental seagrass system. Limnology and Oceanography 52:590-602
Castaldelli G, Welsh DT, Flachi G, Zucchini G, Colombo G, Rossi R, Fano EA (2003) Decomposition dynamics of the bloom forming macroalga Ulva rigida C. Agardh determined using a C-14-carbon radio-tracer technique. Aquatic Botany 75:111-122

205
Cummins SP, Roberts DE, Zimmerman KD (2004) Effects of the green macroalga Enteromorpha intestinalis on macrobenthic and seagrass assemblages in a shallow coastal estuary. Marine Ecology-Progress Series 266:77-87
Dembitsky VM, Pechenkinashubina EE, Rozentsvet OA (1991) Glycolipids and Fatty-Acids of Some Seaweeds and Marine Grasses from the Black-Sea. Phytochemistry 30:2279-2283
Deming JW, Baross JA (1993) The Early Diagenesis of Organic Matter: Bacterial Activity. In: Engel MH, Macko SA (eds) Organic Geochemistry. Plenum Press, New York, p 119-144
Duarte CM (1995) Submerged Aquatic Vegetation in Relation to Different Nutrient Regimes. Ophelia 41:87-112
Ducklow H (2000) Bacterial Production and Biomass in the Oceans. In: Kirchman DL (ed) Microbial Ecology of the Oceans. Wiley-Liss, Inc., New York, p 85-120
Evrard V, Cook PL, Veuger B, Huetel M, Middelburg J (2008) Tracing carbon and nitrogen incorporation and pathways in the microbial community of a photic subtidal sand. Aquatic Microbial Ecology 53:257-269
Franke U, Polerecky L, Precht E, Huettel M (2006) Wave tank study of particulate organic matter degradation in permeable sediments. Limnology and Oceanography 51:1084-1096
Garcia-Robledo E, Corzo A, de Lomas JG, van Bergeijk SA (2008) Biogeochemical effects of macroalgal decomposition on intertidal microbenthos: a microcosm experiment. Marine Ecology-Progress Series 356:139-151
Goldman JC, Dennett MR (2000) Growth of marine bacteria in batch and continuous culture under carbon and nitrogen limitation. Limnology and Oceanography 45:789-800
Gordon DM, Mccomb AJ (1989) Growth and Production of the Green-Alga Cladophora-Montagneana in a Eutrophic Australian Estuary and Its Interpretation Using a Computer-Program. Water Research 23:633-645
Goshorn D, McGinty M, Kennedy C, Jordan C, Wazniak C, Schwenke K, Coyne K (2001) An examination of benthic macroalgae communities as indicators of nutrients in middle atlantic coastal estuaries -- Maryland component Final Report 1998-1999, Maryland Department of Natural Resources, Annapolis, MD
Hardison AK, Anderson IC, Canuel EA, Tobias C, Veuger B (In Prep) Carbon and nitrogen dynamics in shallow photic systems: Interactions between macro- and microalgal communities.

206
Hauxwell J, Cebrian J, Furlong C, Valiela I (2001) Macroalgal canopies contribute to eelgrass (Zostera marina) decline in temperate estuarine ecosystems. Ecology 82:1007-1022
Hedges JI, Stern JH (1984) Carbon and Nitrogen Determinations of Carbonate-Containing Solids. Limnology and Oceanography 29:657-663
Higgins SN, Hecky RE, Guildford SJ (2008) The collapse of benthic macroalgal blooms in response to self-shading. Freshwater Biology 53:2557-2572
Holmquist JG (1997) Disturbance and gap formation in a marine benthic mosaic: influence of shifting macroalgal patches on seagrass structure and mobile invertebrates. Marine Ecology-Progress Series 158:121-130
Kenward MG (1987) A Method for Comparing Profiles of Repeated Measurements. Applied Statistics-Journal of the Royal Statistical Society Series C 36:296-308
Khotimchenko SV (2005) Lipids from the marine alga Gracilaria verrucosa. Chemistry of Natural Compounds 41:285-288
Lomstein BA, Guldberg LB, Neubauer ATA, Hansen J, Donnelly A, Herbert RA, Viaroli P, Giordani G, Azzoni R, de Wit R, Finster K (2006) Benthic decomposition of Ulva lactuca: A controlled laboratory experiment. Aquatic Botany 85:273-283
Lorenzen CJ (1967) Determination of Chlorophyll and Pheo-Pigments - Spectrophotometric Equations. Limnology and Oceanography 12:343-&
McGlathery KJ, Anderson IC, Tyler AC (2001) Magnitude and variability of benthic and pelagic metabolism in a temperate coastal lagoon. Marine Ecology-Progress Series 216:1-15
McGlathery KJ, Krause-Jensen D, Rysgaard S, Christensen PB (1997) Patterns of ammonium uptake within dense mats of the filamentous macroalga Chaetomorpha linum. Aquatic Botany 59:99-115
McGlathery KJ, Pedersen MF, Borum J (1996) Changes in intracellular nitrogen pools and feedback controls on nitrogen uptake in Chaetomorpha linum (chlorophyta). Journal of Phycology 32:393-401
McGlathery KJ, Sundback K, Anderson IC (2007) Eutrophication in shallow coastal bays and lagoons: the role of plants in the coastal filter. Marine Ecology-Progress Series 348:1-18
Middelburg JJ, Barranguet C, Boschker HTS, Herman PMJ, Moens T, Heip CHR (2000) The fate of intertidal microphytobenthos carbon: An in situ C-13-labeling study. Limnology and Oceanography 45:1224-1234

207
Moodley L, Boschker HTS, Middelburg JJ, Pel R, Herman PMJ, de Deckere E, Heip CHR (2000) Ecological significance of benthic foraminifera: C-13 labelling experiments. Marine Ecology-Progress Series 202:289-295
Morand P, Briand X (1996) Excessive growth of macroalgae: A symptom of environmental disturbance. Botanica Marina 39:491-516
Moriarty DJW, Hayward AC (1982) Ultrastructure of Bacteria and the Proportion of Gram-Negative Bacteria in Marine-Sediments. Microbial Ecology 8:1-14
Nedergaard RI, Risgaard-Petersen N, Finster K (2002) The importance of sulfate reduction associated with Ulva lactuca thalli during decomposition: a mesocosm approach. Journal of Experimental Marine Biology and Ecology 275:15-29
Nilsson C, Sundback K (1996) Amino acid uptake in natural microphytobenthic assemblages studied by microautoradiography. Hydrobiologia 332:119-129
Nuzzi R, Waters RM (2004) Long-term perspective on the dynamics of brown tide blooms in Long Island coastal bays. Harmful Algae 3:279-293
Oertel GF (2001) Hypsographic, hydro-hypsographic and hydrological analysis of coastal bay environments, Great Machipongo Bay, Virginia. Journal of Coastal Research 17:775-783
Parkes RJ (1987) Analysis of microbial communities within sediments using biomarkers. In: Hetcher M, Gray RTG, Jones JG (eds) Ecology of Microbial Communities. Cambridge University Press, Cambridge, p 147-177
Pavoni B, Marcomini A, Sfriso A, Donazzolo R, Orio AA (1992) Changes in an Estuarine Ecosystem - the Lagoon of Venice as a Case-Study. Acs Symposium Series 483:287-305
Peckol P, Rivers JS (1995) Physiological-Responses of the Opportunistic Macroalgae Cladophora-Vagabunda (L) Vandenhoek and Gracilaria-Tikvahiae (Mclachlan) to Environmental Disturbances Associated with Eutrophication. Journal of Experimental Marine Biology and Ecology 190:1-16
Pedersen MF, Nielsen SL, Banta GT (2004) Interactions between vegetation and nutrient dynamics in coastal marine ecosystems: An introduction. In: Nielsen SL, Banta GT, Pedersen MF (eds) Estuarine nutrient cycling: The influence of primary producers. Kluwer Academic Publishers, p 1-16
Perry GJ, Volkman JK, Johns RB, Bavor HJ (1979) Fatty-Acids of Bacterial Origin in Contemporary Marine-Sediments. Geochimica et Cosmochimica Acta 43:1715-1725

208
Pinckney J, Papa R, Zingmark R (1994) Comparison of High-Performance Liquid-Chromatographic, Spectrophotometric, and Fluorometric Methods for Determining Chlorophyll a Concentrations in Estuarine Sediments. Journal of Microbiological Methods 19:59-66
Poerschmann J, Carlson R (2006) New fractionation scheme for lipid classes based on "in-cell fractionation" using sequential pressurized liquid extraction. Journal of Chromatography A 1127:18-25
Raffaelli D (2000) Interactions between macro-algal mats and invertebrates in the Ythan estuary, Aberdeenshire, Scotland. Helgoland Marine Research 54:71-79
Rossi F (2007) Recycle of buried macroalgal detritus in sediments: use of dual-labelling experiments in the field. Marine Biology 150:1073-1081
Schmidt JL, Deming JW, Jumars PA, Keil RG (1998) Constancy of bacterial abundance in surficial marine seciments. Limnology and Oceanography 43:976-982
Sfriso A, Marcomini A (1999) Macrophyte production in a shallow coastal lagoon. Part II: Coupling with sediment, SPM and tissue carbon, nitrogen and phosphorus concentrations. Marine Environmental Research 47:285-309
Sfriso A, Pavoni B, Marcomini A, Raccanelli S, Orio AA (1992) Particulate Matter Deposition and Nutrient Fluxes onto the Sediments of the Venice Lagoon. Environmental Technology 13:473-483
Smith DJ, Underwood GJC (1998) Exopolymer production by intertidal epipelic diatoms. Limnology and Oceanography 43:1578-1591
Stanhope JW, Anderson IC, Reay WG (2009) Base flow nutrient discharges from lower Delmarva Peninsula watersheds of Virginia. Journal of Environmental Quality 38:2070-2083
Thomsen MS, Gurgel CFD, Fredericq S, McGlathery KJ (2006) Gracilaria vermiculophylla (Rhodophyta, Gracilariales) in Hog Island Bay, Virginia: A cryptic alien and invasive macroalga and taxonomic correction. Journal of Phycology 42:139-141
Thybo-Christesen M, Rasmussen MB, Blackburn TH (1993) Nutrient Fluxes and Growth of Cladophora-Sericea in a Shallow Danish Bay. Marine Ecology-Progress Series 100:273-281
Tyler AC, McGlathery KJ (2006) Uptake and release of nitrogen by the macroalgae Gracilaria vermiculophylla (Rhodophyta). Journal of Phycology 42:515-525

209
Tyler AC, McGlathery KJ, Anderson IC (2001) Macroalgae mediation of dissolved organic nitrogen fluxes in a temperate coastal lagoon. Estuarine Coastal and Shelf Science 53:155-168
Underwood GJC, Kromkamp J (1999) Primary production by phytoplankton and microphytobenthos in estuaries. Advances in Ecological Research, Vol 29 29:93-153
Valiela I, Foreman K, Lamontagne M, Hersh D, Costa J, Peckol P, Demeoandreson B, Davanzo C, Babione M, Sham CH, Brawley J, Lajtha K (1992) Couplings of Watersheds and Coastal Waters - Sources and Consequences of Nutrient Enrichment in Waquoit Bay, Massachusetts. Estuaries 15:443-457
Valiela I, McClelland J, Hauxwell J, Behr PJ, Hersh D, Foreman K (1997) Macroalgal blooms in shallow estuaries: Controls and ecophysiological and ecosystem consequences. Limnology and Oceanography 42:1105-1118
Veuger B, Eyre BD, Maher D, Middelburg JJ (2007a) Nitrogen incorporation and retention by bacteria, algae, and fauna in a subtropical intertidal sediment: An in situ N-15-labeling study. Limnology and Oceanography 52:1930-1942
Veuger B, Middelburg JJ, Boschker HTS, Houtekamer M (2005) Analysis of N-15 incorporation into D-alanine: A new method for tracing nitrogen uptake by bacteria. Limnology and Oceanography-Methods 3:230-240
Veuger B, Middelburg JJ, Boschker HTS, Houtekamer M (2007b) Update of "Analysis of N-15 incorporation into D-alanine: A new method for tracing nitrogen uptake by bacteria" (Veuger et al. 2005, Limnol. Oceanogr. Methods 3: 230-240). Limnology and Oceanography-Methods 5:192-194
Veuger B, van Oevelen D, Boschker HTS, Middelburg JJ (2006) Fate of peptidoglycan in an intertidal sediment: An in situ C-13-labeling study. Limnology and Oceanography 51:1572-1580
Volkman JK, Barrett SM, Blackburn SI, Mansour MP, Sikes EL, Gelin F (1998) Microalgal biomarkers: A review of recent research developments. Organic Geochemistry 29:1163-1179
Wakeham SG, Canuel EA (2006) Degradation and preservation of organic matter in marine seciments. In: Volkman JK (ed) Handbook of Environmental Chemistry, Vol 2, Part N. Springer-Verlag, p 295-321
Witte U, Aberle N, Sand M, Wenzhofer F (2003) Rapid response of a deep-sea benthic community to POM enrichment: an in situ experimental study. Marine Ecology-Progress Series 251:27-36

210
Table 5-1: Environmental parameters measured in the field and in the mesocosms.
Except for peak macroalgal biomass, field values were combined for 2 sampling dates in
June 2006 at 3 sites in each lagoon (n = 6). Mesocosm values are presented as the mean
(± SE) across all 5 sampling days during experiment (n = 15). Peak macroalgal biomass
values for the field correspond to the maximum biomass measured from May through
October 2006 at multiple sites across HIB (n = 9) and IWB (n = 5). Mesocosm values
correspond to the mass of freeze-dried, labeled macroalgae added to each mesocosm (n =
3).
Field Mesocosm Parameter HIB IWB HIB IWB
Temperature (°C) 28.3 (0.1) 28.6 (0.2) 22.2 (1.2) 23.0 (1.2) Salinity (psu) 31.3 (0.01) 29.3 (0.08) 30.1 (0.7) 29.9 (0.7) Sediment organic matter (%) 2.59 (0.77) 0.77 (0.10) 2.01 (0.18) 1.04 (0.07)
Chlorophyll a (mg Chl a m-2) 56.2 (14.5) 89.5 (19.7) 267 (3) 109 (7) Peak Macroalgal Biomass (gdw m-2) - Range 0 -192 29 - 538 n/a n/a - Mean (SE) 52 (24) 176 (98) 83 (2) 183 (2)

Tab
le 5
-2:
Bul
k se
dim
ent c
hara
cter
izat
ion
para
met
ers a
nd st
atis
tical
res
ults
from
rep
eate
d m
easu
res A
NO
VA
.
Val
ues f
or b
ulk
sedi
men
t par
amet
ers a
s mea
n (±
SE)
, n=3
. P
valu
es a
re in
dica
ted
for r
epea
ted
mea
sure
s AN
OV
A u
sed
to te
st fo
r
diff
eren
ces i
n la
goon
s ove
r tim
e fo
r var
ious
sedi
men
t poo
ls. S
igni
fican
t p v
alue
s are
indi
cate
d in
bol
d.
Exp
erim
enta
l Day
A
NO
VA
Pa
ram
eter
L
agoo
n 0
1 2
7 14
la
goon
tim
e in
tera
ctio
n
Org
anic
mat
ter
HIB
1.
82 (0
.48)
2.
52 (0
.70)
1.
84 (0
.11)
1.
75 (0
.31)
2.1
2 (0
.22)
(%
) IW
B
1.20
(0.2
6)
0.93
(0.2
1)
0.96
(0.0
4)
0.89
(0.1
2) 1
.22
(0.1
4)
0.00
08
0.67
08
0.69
58
Chl
orop
hyll a
H
IB
15.0
(2.5
) 29
.0 (3
.4)
28.1
(8.6
) 29
.0 (6
.8)
33.7
(8.6
)
(mg
Chl
a m
-2)
IWB
93
.7 (7
.7)
108
(24)
11
2 (2
1)
110
(4)
124
(16)
0.
0010
0.
3187
0.
9870
THA
A
HIB
3.
44
3.95
(0.7
0)
2.29
(0.0
4)
1.91
(0.1
7) 2
.24
(0.1
1)
(mm
ol A
A m
gOC
-1)
IWB
3.
74
3.28
(0.2
8)
2.90
(0.1
5)
2.16
(0.1
3) 2
.35
(0.2
7)
0.70
74
0.00
23
0.35
91
PLFA
H
IB
14.5
(5.4
) 13
.9 (3
.6)
9.13
(1.7
8)
19.7
(1.5
) 14
.9 (1
.9)
(mg
PLFA
mgO
C-1
) IW
B
15.7
(2.3
) 11
.9 (0
.7)
14.2
(3)
13.9
(1.2
) 19
.5 (5
.0)
0.70
33
0.18
93
0.42
35

212
Table 5-3: Statistical results for repeated measures ANOVA of isotopic
enrichments.
Results of two-factor repeated measures ANOVA used to test for differences in lagoons
over time for isotopic enrichments (13C or 15N) of various sediment pools and percent
enrichment of select sediment pools out of the bulk sediment enrichment. Results for the
post-hoc contrast for Days 1 and 2 versus Days 7 and 14 are shown to the right. One
outlier has been removed from the IWB 15N THAA analyses (Day 2) which accounts for
the reduced degrees of freedom for that treatment. Significant p values are indicated in
bold.
lagoon time interaction
Post-hoc contrast: Days 1 & 2 vs. 7 & 14
Parameter Isotope df F p df F p df F p df F p 13C 4 0.01 0.9163 12 6.98 0.0057 12 3.29 0.0580 12 19.16 0.0009 Bulk
Sediments 15N 4 0.42 0.5532 12 5.76 0.0112 12 0.8 0.5168 12 15.61 0.0019 13C 4 0.25 0.6460 12 3.68 0.0434 12 1.57 0.2487 12 10.37 0.0074 THAA 15N 4 0.92 0.3921 11 3.63 0.0485 11 1.56 0.2542 11 9.93 0.0092 13C 4 1.14 0.3461 12 2.21 0.1399 12 1.03 0.4147 12 5.16 0.0424 D-Ala 15N 4 2.76 0.1721 11 1.98 0.1755 11 1.05 0.4086 11 4.89 0.0492 13C 4 5.92 0.0718 12 5.49 0.0132 12 1.21 0.3473 12 15.7 0.0019 D/L-Ala 15N 4 7.72 0.0499 11 17.83 0.0002 11 5.25 0.0171 11 16.21 0.0020
PLFA 13C 4 0.79 0.4247 11 3.32 0.0605 11 1.06 0.4037 11 6.93 0.0233 Bacterial FA 13C 4 1.11 0.3507 11 3.39 0.0575 11 1.08 0.3961 11 5.83 0.0344 Algal FA 13C 4 0.68 0.4566 11 6.84 0.0072 11 1.61 0.2426 11 17.11 0.0017
13C 4 6.38 0.0649 12 2.86 0.0815 12 0.57 0.6474 12 5.62 0.0353 THAA/Bulk (%) 15N 4 1.35 0.3102 11 7.8 0.0046 11 0.3 0.8255 11 19.83 0.0010
13C 4 13.48 0.0214 12 13.08 0.0004 12 3.03 0.0712 12 33.01 <0.0001 D-Ala/Bulk (%) 15N 4 6.29 0.0662 11 16.59 0.0002 11 3.64 0.0483 11 15.59 0.0023 PLFA/Bulk (%)
13C 4 0.58 0.4905 11 1.65 0.2338 11 1.55 0.2569 11 0.96 0.3476

213
Table 5-4. Fraction (%) of excess isotope (13C or 15N) in THAA, D-Ala, and PLFA
out of excess isotope in bulk sediment.
Values are presented as the mean (± SE), n = 3, for each lagoon on each experimental
day.
Experimental Day Parameter Lagoon Isotope 1 2 7 14
THAA/Bulk (%) HIB 13C 47.1 (7.1) 51.0 (4.5) 26.4 (7.6) 50.9 (12.5)
15N 47.7 (1.5) 56.1 (9.1) 33.8 (5.1) 39.1 (2.7)
IWB 13C 37.1 (6.5) 38.9 (10.3) 30.3 (5.4) 31.3 (5.5)
15N 49.3 (8.3) 42.1 (10.9) 30.7 (2.5) 33.2 (4.7) D-Ala/Bulk (%) HIB 13C 0.21 (0.05) 0.14 (0.03) 0.04 (0.01) 0.06 (0.03)
15N 0.19 (0.07) 0.23 (0.03) 0.07 (0.01) 0.05 (0.01)
IWB 13C 0.08 (0.01) 0.06 (0.03) 0.02 (0.01) 0.04 (0.01)
15N 0.10 (0.02) 0.10 (0.04) 0.03 (0.01) 0.04 (0.01) PLFA/BULK (%) HIB 13C 3.46 (0.17) 2.94 (0.57) 3.53 (0.97) 4.89 (3.79)
IWB 13C 2.85 (1.01) 3.43 (1.09) 3.05 (0.59) 0.22 (0.01))

214
Figure 5-1. Study sites.
Sediments and macroalgae were collected from two coastal lagoons: Hog Island Bay,
VA and Isle of Wight Bay, MD. Dark grey shaded areas indicate the watersheds of each
lagoon. Hog Island Bay is located within the LTER Virginia Coast Reserve.

215

216
Figure 5-2. Bulk sediment isotopic enrichments for HIB (solid lines) and IWB
(dotted lines).
Values are reported as mean ± 1 SE (n = 3) for (a) excess 13C and (b) excess 15N.

217

218
Figure 5-3. Amino acid isotopic enrichments for HIB (solid line) and IWB (dotted
line).
Values are mean ± 1 SE (n = 3) for excess (a) 13C and (b) 15N for THAA and (c) excess
13C and (d) 15N for D-Ala.

219

220
Figure 5-4. The ratio of excess 13C (a) or 15N (b) in D-Ala/L-Ala.
Values are mean ± 1 SE (n = 3) for HIB (solid lines) and IWB (dotted lines). The dashed
horizontal gray lines represent the racemization background (0.017). The solid horizontal
gray lines represent bacterial D/L-Ala abundance ratio (0.05). Values on the right y-axes
correspond to estimates of bacterial contribution to total label incorporation.

221

222
Figure 5-5. PLFA isotopic enrichments.
Values are mean ±1 SE (n = 3) for excess 13C in (a) total PLFA, (b) BrFA, which
represent heterotrophic bacteria, and (c) PUFA, which represent algae for HIB (solid
lines) and IWB (dotted lines).
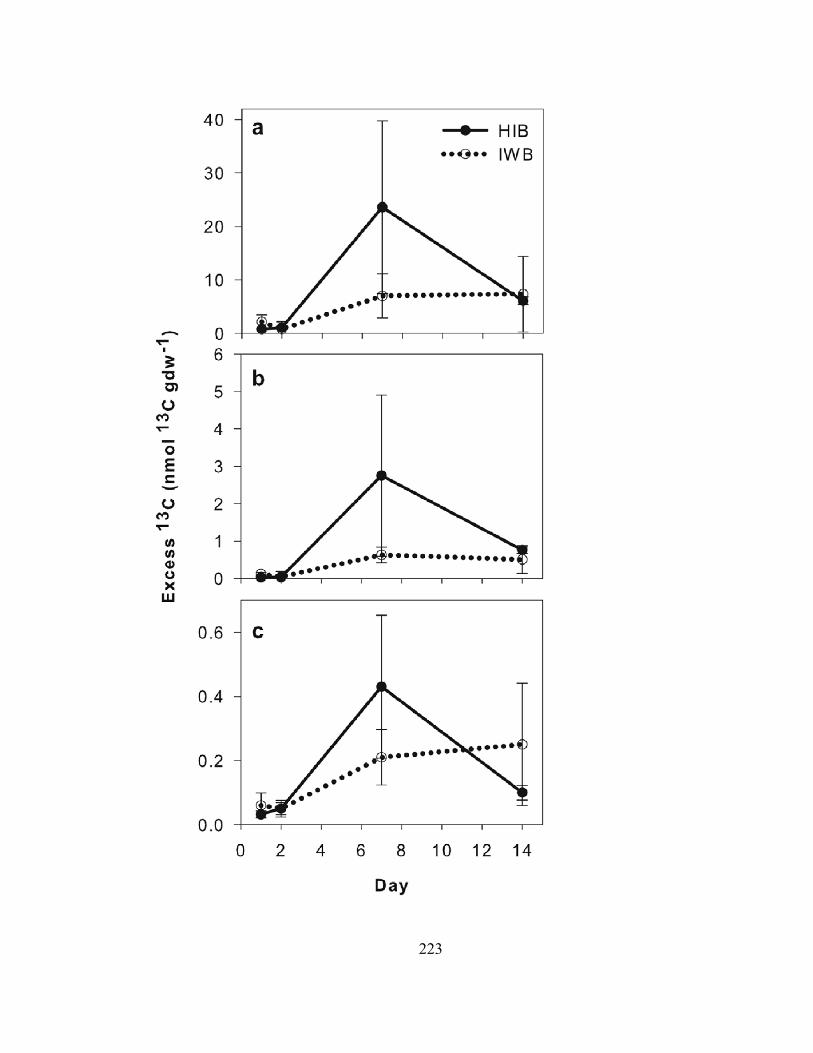
223

224
Figure 5-6. Proposed mechanism for microbial processing of dead macroalgal
biomass within the sediments.

225

226
CHAPTER 6: SYNTHESIS

227
Ephemeral macroalgae are becoming more prevalent in coastal systems as a
consequence of increased nutrient loading (Hauxwell et al. 2001; Sfriso et al. 1992;
Wazniak et al. 2004), but their influence on sediment C and N cycling is not yet fully
understood (McGlathery et al. 2007). In particular, their effect on C and N cycling within
the sediment microbial community has not been studied directly, although flux studies
indirectly suggest significant consequences result from the presence of macroalgae
(Corzo et al. 2009; Dalsgaard 2003; McGlathery et al. 2001; Tyler et al. 2003). Thus, the
objective of this work was to quantify the effects of living and dead macroalgae on
sediment C and N cycling. Utilizing stable isotopic tracers and organic biomarkers,
results from this work demonstrate that interactions between benthic macroalgae and the
sediment microbial community fundamentally alter sediment nutrient cycling and its
feedbacks to the overlying water column in shallow coastal systems. As a consequence,
benthic autotrophs can act as a positive- or negative- feedback to eutrophication.
Figure 1 synthesizes the findings of this dissertation project by depicting the
interactions between ephemeral macroalgae, benthic microalgae (BMA), and sediment
bacteria over the typical bloom-and-die-off cycle of ephemeral macroalgae in shallow
coastal systems. BMA play a particularly important role in regulating nutrient cycling in
shallow coastal bays (Anderson et al. In press; McGlathery et al. 2004; Pedersen et al.
2004). Their location at the sediment-water interface allows them to intercept nutrients
that would otherwise be released to the water column where they can potentially fuel
phytoplankton blooms (Anderson et al. 2003). As a result, sediments where BMA are
productive may serve as an important sink for nutrients, thereby buffering these systems
from further eutrophication. This dissertation demonstrated that BMA used nutrients

228
from both the porewater and surface water to build biomass, thereby increasing the
amount and lability of sediment organic matter, which in turn increased bacterial
production. However, when macroalgal biomass was high, BMA production was
substantially limited, likely as a result of shading, or possibly nutrient competition.
Indeed, macroalgal growth is often sufficiently dense to self-shade the layers of the mat
nearest the sediment surface (Brush and Nixon 2003; McGlathery et al. 1997); thus
macroalgae likely limit the amount of light reaching BMA. Diminished BMA production
resulted in lower sediment bacterial production as well. Although BMA were responsible
for initial immobilization of the inorganic C and N that were added, heterotrophic
bacteria became increasingly important over time. Incorporation of isotopic label into
biomarkers for BMA initially and then into bacteria provided clear evidence for shuttling
of C and N between BMA and bacteria, which corroborates findings of other studies that
demonstrate coupling between these communities (Cook et al. 2007; Middelburg et al.
2000; Veuger et al. 2007). Although others have shown that BMA may act to retain
nutrients in sediments (Anderson et al. 2003; Sundback and Miles 2000), demonstration
of the shuttle between BMA and bacteria provides a mechanism that explains the
prolonged retention (at least 4 weeks) of the isotopic tracers in the sediments after the
isotope additions ended. Further, bacteria may act as a conduit for longer-term storage of
C and N through production and accumulation of more recalcitrant forms of organic
matter (e.g. peptidoglycan; (McCarthy et al. 1998; Veuger et al. 2006). Thus, by
decreasing BMA production, macroalgae reduced overall retention of C and N in
sediments by the microbial community thereby diminishing the role of the sediments in
the ‘coastal filter’ (McGlathery et al. 2007).

229
Although macroalgae stored significant quantities of C and N while growing, thus
serving as a nutrient sink, this retention was only temporary. Once macroalgae decline or
die, macroalgae become a source of nutrients as their nutrients are re-released to the
water column, where they can support phytoplankton, including harmful algal blooms,
and bacterial metabolism (Castaldelli et al. 2003; McGlathery et al. 2001; Sfriso et al.
1992; Tyler et al. 2003). In contrast to macroalgae, retention within the sediment
microbial pool would be expected to be a more stable sink. Sequestration of nutrients
within sediment microbial biomass may remove nutrients from the water column, and the
close coupling between BMA and bacteria may effectively retain and/or transform those
nutrients within the sediments during times of the year that are favorable for
phytoplankton blooms. Results from this dissertation also showed that following the
simulated macroalgal die-off, 6 to 50% and 2 to 9% of macroalgal N and C, respectively,
were incorporated into the surface sediments. Bacteria responded immediately to the
pulse of organic matter and were the primary agents of decomposition of the macroalgae.
However, BMA intercepted the return of nutrients to the water column. Once again, the
close coupling between bacteria and BMA was demonstrated. In this experiment, some
of the macroalgal-derived C and N was retained as microbial biomass within the
sediments for at least 2 weeks following the macroalgal die-off. The importance of this
potential sink will depend largely on the amount of biomass transferred to the sediments,
which will depend on the hydrodynamics of the system as well as the influence of grazers
(Duffy and Harvilicz 2001; Hauxwell et al. 1998).
Our mesocosm experiments allowed us to assess the mechanisms underlying
nutrient cycling dynamics within the sediment microbial community in the presence and

230
absence of macroalgae and will contribute to our ability to predict the response of coastal
bays to increased nutrient loading. This dissertation stresses the importance of coupling
between BMA and sediment bacteria, which may serve to enhance nutrient retention
within the sediments. Further, results from this dissertation provide new insights about
sediment microbial community responses to ephemeral macroalgal blooms. Macroalgae
diminish the role of BMA, which will in turn decrease retention of nutrients within the
sediments. Once macroalgae die, some nutrients will be transferred to the sediments and
stored within the microbial community, but this storage will be largely system-specific.
These results indicate that macroalgae substantially influence nutrient cycling within
these systems and should be incorporated into models predicting the effects of nutrient
loading to shallow water ecosystems. Further work is needed to apply the findings from
this work to the field. Preliminary work conducted during testing of the field-based
perfusionator (Chapter 2) demonstrated C and N storage in surface sediments even when
influenced by wave action and tidal pumping. More detailed field studies that include
uptake by sediment microbes and the influence of macroalgae, as well as effects of
hydrodynamic regime and upper trophic levels are warranted.
Literature Cited
Anderson, I. C., K. J. McGlathery, and A. C. Tyler. 2003. Microbial mediation of 'reactive' nitrogen transformations in a temperate lagoon. Marine Ecology Progress Series 246: 73-84.
Anderson, I. C., J. W. Stanhope, A. K. Hardison, and K. J. McGlathery. In press. Sources and fates of nitrogen in Virginia Coastal Bays. In M. J. Kennish and H. W. Paerl [eds.], Coastal Lagoons: Critical Habitats of Environmental Change. Taylor and Francis.

231
Brush, M. J., and S. W. Nixon. 2003. Biomass layering and metabolism in mats of the macroalga Ulva lactuca L. Estuaries 26: 916-926.
Castaldelli, G. and others 2003. Decomposition dynamics of the bloom forming macroalga Ulva rigida C. Agardh determined using a C-14-carbon radio-tracer technique. Aquatic Botany 75: 111-122.
Cook, P. L. M., B. Veuger, S. Boer, and J. J. Middelburg. 2007. Effect of nutrient availability on carbon and nitrogen incorporation and flows through benthic algae and bacteria in near-shore sandy sediment. Aquatic Microbial Ecology 49: 165-180.
Corzo, A., S. A. van Bergeijk, and E. Garcia-Robledo. 2009. Effects of green macroalgal blooms on intertidal sediments: net metabolism and carbon and nitrogen contents. Marine Ecology-Progress Series 380: 81-93.
Dalsgaard, T. 2003. Benthic primary production and nutrient cycling in sediments with benthic microalgae and transient accumulation of macroalgae. Limnology and Oceanography 48: 2138-2150.
Duffy, J. E., and A. M. Harvilicz. 2001. Species-specific impacts of grazing, amphipods in an eelgrass-bed community. Marine Ecology-Progress Series 223: 201-211.
Hauxwell, J., J. Cebrian, C. Furlong, and I. Valiela. 2001. Macroalgal canopies contribute to eelgrass (Zostera marina) decline in temperate estuarine ecosystems. Ecology 82: 1007-1022.
Hauxwell, J., J. McClelland, P. J. Behr, and I. Valiela. 1998. Relative importance of grazing and nutrient controls of macroalgal biomass in three temperate shallow estuaries. Estuaries 21: 347-360.
McCarthy, M. D., J. I. Hedges, and R. Benner. 1998. Major bacterial contribution to marine dissolved organic nitrogen. Science 281: 231-234.
McGlathery, K., K. Sundback, and I. Anderson. 2004. The Importance of Primary Producers for Benthic Nitrogen and Phosphorus Cycling, p. 231-261. In S. L. Nielsen, G. T. Banta and M. Pedersen [eds.], Estuarine Nutrient Cycling: The Influence of Primary Producers. Kluwer Academic Publishers.
McGlathery, K. J., I. C. Anderson, and A. C. Tyler. 2001. Magnitude and variability of benthic and pelagic metabolism in a temperate coastal lagoon. Marine Ecology-Progress Series 216: 1-15.
McGlathery, K. J., D. Krause-Jensen, S. Rysgaard, and P. B. Christensen. 1997. Patterns of ammonium uptake within dense mats of the filamentous macroalga Chaetomorpha linum. Aquatic Botany 59: 99-115.

232
McGlathery, K. J., K. Sundback, and I. C. Anderson. 2007. Eutrophication in shallow coastal bays and lagoons: the role of plants in the coastal filter. Marine Ecology-Progress Series 348: 1-18.
Middelburg, J. J., C. Barranguet, H. T. S. Boschker, P. M. J. Herman, T. Moens, and C. H. R. Heip. 2000. The fate of intertidal microphytobenthos carbon: An in situ C-13-labeling study. Limnology and Oceanography 45: 1224-1234.
Pedersen, M. F., S. L. Nielsen, and G. T. Banta. 2004. Interactions between vegetation and nutrient dynamics in coastal marine ecosystems: An introduction. In S. L. Nielsen, G. T. Banta and M. F. Pedersen [eds.], Estuarine Nutrient Cycling: The Influence of Primary Producers. Kluwer.
Sfriso, A., B. Pavoni, A. Marcomini, S. Raccanelli, and A. A. Orio. 1992. Particulate Matter Deposition and Nutrient Fluxes onto the Sediments of the Venice Lagoon. Environmental Technology 13: 473-483.
Sundback, K., and A. Miles. 2000. Balance between denitrification and microalgal incorporation of nitrogen in microtidal sediments, NE Kattegat. Aquatic Microbial Ecology 22: 291-300.
Tyler, A. C., K. J. McGlathery, and I. C. Anderson. 2003. Benthic algae control sediment-water column fluxes of organic and inorganic nitrogen compounds in a temperate lagoon. Limnology and Oceanography 48: 2125-2137.
Veuger, B., B. D. Eyre, D. Maher, and J. J. Middelburg. 2007. Nitrogen incorporation and retention by bacteria, algae, and fauna in a subtropical intertidal sediment: An in situ N-15-labeling study. Limnology and Oceanography 52: 1930-1942.
Veuger, B., D. van Oevelen, H. T. S. Boschker, and J. J. Middelburg. 2006. Fate of peptidoglycan in an intertidal sediment: An in situ C-13-labeling study. Limnology and Oceanography 51: 1572-1580.
Wazniak, C. and others 2004. State of the Maryland Coastal Bays. Maryland Department of Natural Resources.

233
Figure 6-1. Conceptual diagram summarizing macroalgal and sediment microbial
interactions in a shallow coastal system.

234
spring summer fall
Sediment SINK Macroalgae SINK Macroalgae SOURCE

235
APPENDIX A: CHAPTER 2 SF6 DATA (nM)
x coord y coord M1 M4 M11 M13 M-A M-B M-C M-D-10 10 71 50 254 156 531 545 193 0
0 10 58 67 356 22 981 581 710 010 10 27 16 147 13 794 758 615 291
-15 0 81 93 185 84 821 761 416 1329-5 0 24 141 182 101 622 612 806 15005 0 80 151 267 53 518 885 455 519
15 0 42 100 103 46 247 885 1104 0-10 -10 13 78 49 73 708 200 830 63
0 -10 5 124 238 54 261 364 974 132410 -10 49 84 106 65 791 363 397 877
Mesocosm experiment Field deployment

236
APPENDIX B: CHAPTER 2 STABLE ISOTOPE DATAMesocosm Experiment
Timestep Day Meso Treatment Macro Light/Dark Iso Sourceδ15N (permil)
δ13C (permil)
T-1M -1 2 MLS*NON-LABELED 10.225 -19.814T-1M -1 6 NDP*NON-LABELED 12.451 -19.5041.5M 1.5 7 MLP MAC LIGHT PW 2268.425 83.0141.5M 1.5 16 NLP NO MAC LIGHT PW 2188.79 152.1171.5M 1.5 25 NLP NO MAC LIGHT PW 2188.79 152.1171.5M 1.5 26 MLP MAC LIGHT PW 2450.853 102.455T3.5M 3.5 7 MLP MAC LIGHT PW 2957.216 226.151T3.5M 3.5 16 NLP NO MAC LIGHT PW 1452.233 191.738T3.5M 3.5 25 NLP NO MAC LIGHT PW 7786.91 739.438T3.5M 3.5 26 MLP MAC LIGHT PW 1688.009 134.33T7.5M 7.5 7 MLP MAC LIGHT PW 4448.689 349.586T7.5M 7.5 16 NLP NO MAC LIGHT PW 5211.722 363.389T7.5M 7.5 25 NLP NO MAC LIGHT PW 6896.931 522.921T7.5M 7.5 26 MLP MAC LIGHT PW 9984.583 814.252T14.5M 14.5 7 MLP MAC LIGHT PW 3603.332 237.644T14.5M 14.5 16 NLP NO MAC LIGHT PW 15597.53 1293.859T14.5M 14.5 25 NLP NO MAC LIGHT PW 24574.42 1907.376T14.5M 14.5 26 MLP MAC LIGHT PW 11448.23 650.046T2P 16.5 7 MLP MAC LIGHT PW 11064.41 636.396T2P 16.5 16 NLP NO MAC LIGHT PW 9749.595 847.266T2P 16.5 25 NLP NO MAC LIGHT PW 24703.92 1841.123T2P 16.5 26 MLP MAC LIGHT PW 19723.81 1339.425T6.5P 21 7 MLP MAC LIGHT PW 12589.04 772.029T6.5P 21 16 NLP NO MAC LIGHT PW 20545.93 1536.179T6.5P 21 25 NLP NO MAC LIGHT PW 11594.35 850.741T6.5P 21 26 MLP MAC LIGHT PW 13273.6 1044.088T14.5P 29 7 MLP MAC LIGHT PW 12571.79 815.316T14.5P 29 16 NLP NO MAC LIGHT PW 16769.88 1201.164T14.5P 29 25 NLP NO MAC LIGHT PW 23662.39 1655.104T14.5P 29 26 MLP MAC LIGHT PW 18535.12 1372.452T27.5P 42 7 MLP MAC LIGHT PW 9743.583 633.23T27.5P 42 16 NLP NO MAC LIGHT PW 9256.693 567.418T27.5P 42 25 NLP NO MAC LIGHT PW 13769.52 789.995

237
APPENDIX B: CHAPTER 2 STABLE ISOTOPE DATAField deployment
PW NH4+
Meso Day δ15N (permil) δ13C (permil) δ15N (permil)M1 1 16.643 -24.583 139.506M2 1 16.205 -19.814 204.171M3 1 136.624 -14.92 n.s.M4 1 12.347 -20.82 54.11M1 7 901.641 60.456 26617.192M2 7 196.172 -15.823 19498.311M3 7 91.275 -17.762 19443.31M4 7 413.093 -3.503 15532.915M1 12 688.847 34.62 15386.636M2 12 394.456 4.927 15671.179M3 12 12.379 -18.831 13255.232M4 12 713.491 92.126 n.s.M1 14 462.868 14.149 n.s.M2 14 535.022 23.822 n.s.M3 14 303.019 -3.187 n.s.M4 14 319.76 2.582 n.s.M1 19 153.55 -8.737 9897.11M2 19 166.954 -8.189 7271.462M3 19 597.257 23.957 7785.117M4 19 100.905 -13.491 125718M1 26 240.003 1.496 5425.252M2 26 125.72 -13.307 4354.915M3 26 314.421 -1.377 1580.354M4 26 100.37 -11.339 6181.5M1 33 241.702 2.461 4884.275M2 33 180.976 -8.413 3464.583M3 33 178.504 -8.566 5.062M4 33 266.247 4.178 6083.615M1 42 148.777 -12.989 3324.244M2 42 96.444 -13.837 1108.494M3 42 157.627 -11.021 979.132M4 42 198.619 -3.824 2924.228
bulk sediments

238
APPENDIX C: CHAPTER 2 RHODAMINE DATAPlan view of mesocosm with RWT sampling locations
Date Time SiteDepth (cm)
conc550 (%)
20-Apr 9:00 A 6 0.0020-Apr 15:00 A 6 0.5621-Apr 9:00 A 6 0.0021-Apr 15:00 A 6 0.2524-Apr 10:00 A 6 15.6825-Apr 14:00 A 6 45.0020-Apr 9:00 A 15 1.4820-Apr 15:00 A 15 0.0021-Apr 9:00 A 15 2.7221-Apr 15:00 A 15 11.3624-Apr 10:00 A 15 52.4025-Apr 14:00 A 15 51.4820-Apr 9:00 B 6 0.0020-Apr 15:00 B 6 0.0021-Apr 9:00 B 6 0.0021-Apr 15:00 B 6 0.2524-Apr 10:00 B 6 18.1525-Apr 14:00 B 6 11.6720-Apr 9:00 B 15 2.1020-Apr 15:00 B 15 1.4821-Apr 9:00 B 15 0.0021-Apr 15:00 B 15 0.2524-Apr 10:00 B 15 41.2925-Apr 14:00 B 15 59.8120-Apr 9:00 C 6 0.8720-Apr 15:00 C 6 2.1021-Apr 9:00 C 6 0.0021-Apr 15:00 C 6 0.0024-Apr 10:00 C 6 2.7225-Apr 14:00 C 6 43.1520-Apr 9:00 C 15 3.0320-Apr 15:00 C 15 0.0021-Apr 9:00 C 15 0.0021-Apr 15:00 C 15 0.8724-Apr 10:00 C 15 54.2525-Apr 14:00 C 15 51.4820-Apr 9:00 D 6 0.0020-Apr 15:00 D 6 0.0021-Apr 9:00 D 6 0.5621-Apr 15:00 D 6 0.2524-Apr 10:00 D 6 38.5225-Apr 14:00 D 6 3.3420-Apr 9:00 D 15 4.26
I F H G
E
D
C
B
A X
dye delivery pipe

239
20-Apr 15:00 D 15 1.4821-Apr 9:00 D 15 0.0021-Apr 15:00 D 15 0.0024-Apr 10:00 D 15 49.3225-Apr 14:00 D 15 57.6520-Apr 9:00 E 6 0.5620-Apr 15:00 E 6 0.2521-Apr 9:00 E 6 0.0021-Apr 15:00 E 6 0.0024-Apr 10:00 E 6 3.0325-Apr 14:00 E 6 24.0120-Apr 9:00 E 15 3.3420-Apr 15:00 E 15 1.1821-Apr 9:00 E 15 0.0021-Apr 15:00 E 15 0.0024-Apr 10:00 E 15 24.9425-Apr 14:00 E 15 51.7920-Apr 9:00 F 6 0.0020-Apr 15:00 F 6 0.8721-Apr 9:00 F 6 0.0021-Apr 15:00 F 6 0.0024-Apr 10:00 F 6 34.2025-Apr 14:00 F 6 51.1720-Apr 9:00 F 15 2.4120-Apr 15:00 F 15 0.0021-Apr 9:00 F 15 0.2521-Apr 15:00 F 15 8.2724-Apr 10:00 F 15 60.1225-Apr 14:00 F 15 53.6420-Apr 9:00 G 6 0.0020-Apr 15:00 G 6 0.0021-Apr 9:00 G 6 0.0021-Apr 15:00 G 6 0.0024-Apr 10:00 G 6 15.6825-Apr 14:00 G 6 44.0720-Apr 9:00 G 15 0.5620-Apr 15:00 G 15 0.8721-Apr 9:00 G 15 0.2521-Apr 15:00 G 15 2.4124-Apr 10:00 G 15 26.4825-Apr 14:00 G 15 57.0320-Apr 9:00 H 6 0.0020-Apr 15:00 H 6 0.0021-Apr 9:00 H 6 1.7921-Apr 15:00 H 6 0.0024-Apr 10:00 H 6 16.9125-Apr 14:00 H 6 7.6620-Apr 9:00 H 15 1.18

240
20-Apr 15:00 H 15 2.1021-Apr 9:00 H 15 0.0021-Apr 15:00 H 15 0.0024-Apr 10:00 H 15 41.9125-Apr 14:00 H 15 57.6520-Apr 9:00 I 6 0.0020-Apr 15:00 I 6 0.8721-Apr 9:00 I 6 0.0021-Apr 15:00 I 6 0.0024-Apr 10:00 I 6 2.1025-Apr 14:00 I 6 52.7120-Apr 9:00 I 15 0.0020-Apr 15:00 I 15 1.1821-Apr 9:00 I 15 6.7321-Apr 15:00 I 15 25.8624-Apr 10:00 I 15 53.0225-Apr 14:00 I 15 74.6219-Apr 15:00 W 0 0.8720-Apr 9:00 W 0 0.0020-Apr 15:00 W 0 0.0021-Apr 9:00 W 0 0.0021-Apr 15:00 W 0 0.0024-Apr 10:00 W 0 0.0025-Apr 14:00 W 0 1.7919-Apr 15:00 6 1.1819-Apr 15:00 15 0.87

241
APP
EN
DIX
D:
CH
APT
ER
3 B
UL
K, T
HA
A D
ATA
Tim
este
pD
ayM
eso
Trea
tmen
t
TN (u
mol
N g
dw-1)
TOC
(um
ol
C g
dw-1)
C:N
Ben
thic
[Chl
a]
(mg
m-2)
Mac
ro b
iom
ass
(gdw
m-2)
THA
A (u
mol
AA
gdw
-1)
THA
A/T
N
(%)
T-1M
-12
MLS
*NO
N-L
AB
ELED
14.5
914
8.06
10.1
58.
4312
5.52
4.19
32.1
4T-
1M-1
4N
LS*N
ON
-LA
BEL
ED28
.10
T-1M
-16
ND
P*N
ON
-LA
BEL
ED14
.24
140.
099.
8412
.64
4.01
31.5
8T-
1M-1
7M
LP12
1.75
T-1M
-110
MLS
127.
17T-
1M-1
26M
LP12
6.52
1.5M
1.5
2M
LS23
.24
222.
929.
5967
.43
1.5M
1.5
4N
LS28
.42
290.
8410
.23
49.1
710
.26
40.5
91.
5M1.
56
ND
P14
.32
143.
1310
.00
9.83
3.97
31.0
81.
5M1.
57
MLP
25.1
725
8.98
10.2
943
.55
7.21
32.1
71.
5M1.
510
MLS
14.9
615
0.91
10.0
888
.50
4.47
33.3
51.
5M1.
511
NLS
16.3
917
1.77
10.4
863
.21
4.97
34.1
01.
5M1.
512
ND
S15
.85
191.
9512
.11
37.9
34.
6732
.92
1.5M
1.5
14N
DS
13.8
614
1.46
10.2
129
.50
4.10
32.9
61.
5M1.
516
NLP
23.0
726
1.74
11.3
547
.76
7.05
34.0
11.
5M1.
518
ND
P9.
4290
.51
9.61
19.6
72.
8934
.29
1.5M
1.5
25N
LP23
.07
261.
7411
.35
80.0
712
.47
60.7
51.
5M1.
526
MLP
16.4
914
0.80
8.54
77.2
6T3
.5M
3.5
2M
LS20
.28
185.
829.
1674
.45
9.99
55.4
6T3
.5M
3.5
4N
LS20
.19
203.
3210
.07
91.3
111
.26
63.5
9T3
.5M
3.5
6N
DP
15.3
716
7.10
10.8
77.
027.
2352
.42
T3.5
M3.
57
MLP
19.4
220
6.49
10.6
335
.12
8.51
47.6
5T3
.5M
3.5
10M
LS18
.43
178.
709.
6950
.57
7.18
43.8
4T3
.5M
3.5
11N
LS17
.00
189.
4411
.15
43.5
58.
0553
.38
T3.5
M3.
512
ND
S12
.39
117.
829.
519.
836.
2456
.07
T3.5
M3.
514
ND
S13
.86
133.
679.
645.
624.
3033
.13
T3.5
M3.
516
NLP
17.1
017
5.63
10.2
742
.14
8.48
55.4
7

242
T3.5
M3.
518
ND
P10
.50
96.9
89.
235.
625.
1754
.05
T3.5
M3.
525
NLP
20.4
421
3.53
10.4
554
.79
9.12
49.8
8T3
.5M
3.5
26M
LP13
.27
92.0
06.
9312
2.22
T7.5
M7.
52
MLS
26.9
927
4.54
10.1
744
.95
210.
719.
1838
.43
T7.5
M7.
54
NLS
16.8
016
1.36
9.60
30.9
05.
5937
.61
T7.5
M7.
56
ND
P15
.61
187.
8412
.03
7.02
4.59
32.9
6T7
.5M
7.5
7M
LP22
.01
254.
5611
.56
18.2
619
9.48
7.26
36.2
8T7
.5M
7.5
10M
LS20
.29
187.
489.
2481
.48
202.
125.
9032
.67
T7.5
M7.
511
NLS
23.3
223
9.24
10.2
688
.50
7.78
37.6
4T7
.5M
7.5
12N
DS
13.7
214
1.61
10.3
37.
024.
0533
.49
T7.5
M7.
514
ND
S13
.86
133.
679.
6415
.45
3.71
30.3
3T7
.5M
7.5
16N
LP16
.02
163.
3010
.20
96.9
34.
4131
.32
T7.5
M7.
518
ND
P19
.95
206.
9110
.37
9.83
5.53
31.3
8T7
.5M
7.5
25N
LP33
.65
302.
158.
9871
.64
11.5
238
.71
T7.5
M7.
526
MLP
18.5
513
3.28
7.19
73.0
518
8.02
T14.
5M14
.52
MLS
22.9
319
6.37
8.56
54.7
926
8.70
8.89
43.8
9T1
4.5M
14.5
4N
LS24
.48
231.
929.
4789
.91
9.85
45.5
4T1
4.5M
14.5
6N
DP
37.8
343
3.79
11.4
721
.07
10.7
431
.07
T14.
5M14
.57
MLP
14.3
115
6.64
10.9
432
.31
300.
284.
2833
.56
T14.
5M14
.510
MLS
27.6
128
1.30
10.1
987
.10
251.
908.
1533
.32
T14.
5M14
.511
NLS
28.3
634
3.85
12.1
291
.31
8.57
34.7
5T1
4.5M
14.5
12N
DS
31.6
737
8.26
11.9
418
.26
8.70
30.9
9T1
4.5M
14.5
14N
DS
16.0
518
8.89
11.7
79.
834.
0028
.03
T14.
5M14
.516
NLP
26.7
531
6.63
11.8
468
.83
8.02
34.0
7T1
4.5M
14.5
18N
DP
16.8
921
6.15
12.8
019
.67
3.64
24.3
9T1
4.5M
14.5
25N
LP33
.46
397.
9011
.89
43.5
512
.20
41.1
9T1
4.5M
14.5
26M
LP20
.45
174.
158.
5247
.76
247.
08T2
P16
.52
MLS
25.2
225
0.29
9.92
81.4
8T2
P16
.54
NLS
32.5
336
5.56
11.2
415
.45
T2P
16.5
6N
DP
14.2
317
3.09
12.1
611
.24
T2P
16.5
7M
LP25
.27
248.
489.
8364
.62

243
T2P
16.5
10M
LS19
.75
207.
7510
.52
36.5
2T2
P16
.511
NLS
23.6
318
0.25
7.63
94.1
2T2
P16
.512
ND
S16
.17
166.
8210
.32
21.0
7T2
P16
.514
ND
S15
.00
154.
5210
.30
11.2
4T2
P16
.516
NLP
26.6
928
5.31
10.6
953
.38
T2P
16.5
18N
DP
16.3
918
0.18
10.9
99.
83T2
P16
.525
NLP
29.6
831
6.99
10.6
813
6.26
T2P
16.5
26M
LP24
.59
264.
4110
.75
56.1
9T6
.5P
212
MLS
31.5
033
4.61
10.6
247
.76
336.
369.
6034
.77
T6.5
P21
4N
LS38
.19
418.
2310
.95
91.3
112
.13
36.2
9T6
.5P
216
ND
P17
.59
226.
3512
.87
4.21
4.33
27.5
5T6
.5P
217
MLP
31.9
036
2.15
11.3
556
.19
324.
479.
6434
.17
T6.5
P21
10M
LS21
.50
228.
7110
.64
66.0
228
9.82
5.87
30.9
6T6
.5P
2111
NLS
41.5
144
3.94
10.6
910
6.76
13.8
337
.85
T6.5
P21
12N
DS
32.1
739
3.45
12.2
314
.05
8.64
30.1
8T6
.5P
2114
ND
S23
.10
280.
8512
.16
0.00
5.80
28.2
3T6
.5P
2116
NLP
34.5
638
4.16
11.1
251
.98
12.3
040
.33
T6.5
P21
18N
DP
35.0
547
3.63
13.5
10.
008.
6227
.63
T6.5
P21
25N
LP54
.23
626.
7711
.56
51.9
817
.85
37.5
8T6
.5P
2126
MLP
17.0
311
8.99
6.99
57.6
028
9.56
T14.
5P29
2M
LS24
.74
232.
819.
4198
.33
384.
76T1
5.5P
294
NLS
21.2
721
2.96
10.0
125
.29
T14.
5P29
6N
DP
18.3
420
6.18
11.2
41.
40T1
5.5P
297
MLP
36.7
140
0.81
10.9
222
.48
398.
54T1
4.5P
2910
MLS
20.1
418
5.74
9.22
99.7
431
3.15
T15.
5P29
11N
LS39
.45
364.
269.
2325
5.67
T14.
5P29
12N
DS
12.2
713
8.78
11.3
17.
02T1
5.5P
2914
ND
S10
.49
115.
4011
.00
7.02
T14.
5P29
16N
LP26
.63
285.
2210
.71
51.9
8T1
5.5P
2918
ND
P16
.50
202.
8912
.29
16.8
6T1
4.5P
2925
NLP
24.5
426
8.01
10.9
251
.98

244
T15.
5P29
26M
LP14
.07
149.
1610
.60
42.1
433
7.12
T27.
5P42
4N
LS34
.71
380.
4910
.96
54.7
912
.19
39.8
1T2
7.5P
426
ND
P26
.06
332.
2212
.75
15.4
55.
8725
.35
T27.
5P42
7M
LP23
.35
273.
7111
.72
25.2
951
2.59
7.07
33.9
9T2
7.5P
4210
MLS
33.4
040
7.75
12.2
114
6.10
307.
959.
3931
.78
T27.
5P42
11N
LS34
.02
358.
0010
.52
122.
2212
.22
40.7
9T2
7.5P
4212
ND
S13
.90
169.
7312
.21
18.2
63.
1525
.50
T27.
5P42
14N
DS
15.1
419
0.53
12.5
90.
003.
4425
.79
T27.
5P42
16N
LP38
.22
436.
0211
.41
189.
6412
.43
36.6
8T2
7.5P
4218
ND
P24
.09
302.
0012
.54
8.43
5.78
26.8
8T2
7.5P
4225
NLP
33.8
744
1.64
13.0
440
.74
10.0
533
.93

245
THA
A/T
OC
(%
)D
-Ala
L-A
laTh
r+Va
lG
lyIle
Leu
Pro
Asp
Glu
Phe
PLFA
(mg
FA g
dw-1)
NEU
T (m
g
FA g
dw-1)
Tota
l FA
(mg
FA g
dw-1)
PLFA
/TO
C
(%)
11.7
80.
9313
.90
6.88
27.4
73.
406.
067.
8615
.66
12.0
90.
5939
943.
9830
989.
8570
933.
831.
62
12.4
30.
9013
.19
6.90
25.5
23.
526.
007.
9115
.58
11.9
73.
1614
067.
6210
320.
5824
388.
200.
61
2937
4.30
6287
3.19
9224
7.50
0.79
14.9
70.
9414
.56
6.96
27.9
73.
326.
207.
2813
.42
11.4
22.
4541
827.
9746
948.
3388
776.
300.
8712
.04
0.88
14.1
17.
2026
.10
3.63
6.15
7.78
14.4
111
.59
3.32
6002
.33
8031
.38
1403
3.71
0.25
12.1
10.
8013
.95
6.74
24.7
33.
566.
637.
6615
.39
12.2
42.
7938
156.
7062
939.
2110
1095
.91
0.89
12.8
40.
8014
.40
6.32
24.5
93.
526.
667.
3215
.03
12.8
93.
0623
608.
8532
728.
6856
337.
530.
9412
.64
0.76
14.7
16.
6924
.19
3.74
6.88
7.35
14.2
112
.68
2.95
1980
9.03
6213
7.84
8194
6.87
0.69
10.3
80.
9114
.03
6.26
27.3
53.
546.
158.
1013
.83
11.2
73.
0695
81.7
486
30.9
118
212.
650.
3012
.33
0.89
14.3
66.
4527
.23
3.14
6.02
7.64
14.7
011
.72
2.99
9545
.91
8991
.17
1853
7.09
0.41
11.4
10.
7914
.41
6.01
27.1
03.
356.
157.
6814
.67
11.8
22.
7953
490.
1247
883.
4710
1373
.59
1.23
13.9
60.
9213
.93
6.68
24.1
63.
376.
327.
1816
.13
12.7
43.
4768
82.9
971
76.1
914
059.
180.
4620
.42
0.86
14.2
77.
1626
.80
3.37
6.17
7.81
14.2
311
.54
2.57
5546
6.39
5980
6.80
1152
73.1
91.
2822
241.
1527
553.
1649
794.
310.
9523
.90
0.56
13.7
56.
7623
.95
3.73
8.09
8.50
13.3
812
.12
3.38
24.8
50.
5911
.98
6.18
22.4
82.
916.
507.
7616
.32
13.5
53.
9118
.90
0.89
11.9
66.
6323
.99
3.17
6.56
8.05
18.4
312
.58
2.94
17.4
20.
8112
.68
7.12
26.6
83.
267.
742.
9321
.62
13.0
02.
5517
.88
0.74
13.4
36.
4223
.95
3.84
8.29
8.91
13.7
010
.73
3.81
18.3
30.
8114
.80
6.99
26.5
83.
206.
948.
3312
.84
11.0
52.
8122
.73
0.80
13.6
26.
6525
.63
2.96
6.26
7.51
17.2
111
.67
2.95
15.0
20.
305.
473.
7114
.43
2.72
6.82
6.50
29.8
821
.06
6.03
20.7
60.
8714
.90
6.72
25.3
53.
106.
837.
4615
.30
11.5
62.
76
Mol
%

246
22.1
50.
9614
.76
6.10
24.7
92.
795.
937.
3119
.36
13.1
31.
0519
.32
1.00
12.6
87.
4420
.07
3.45
8.25
6.28
19.7
313
.30
3.46
14.6
30.
7216
.71
7.83
24.6
53.
407.
288.
2311
.65
11.5
72.
7367
707.
1781
161.
2714
8868
.44
1.48
15.6
00.
7014
.63
7.81
21.5
93.
767.
167.
4213
.88
14.6
33.
1249
133.
9447
641.
3896
775.
311.
8210
.60
0.94
13.8
77.
1225
.15
3.27
5.99
7.65
14.5
813
.69
2.70
1014
8.84
6167
.45
1631
6.29
0.32
12.2
20.
7414
.85
4.41
24.2
33.
627.
067.
8415
.12
13.1
93.
3553
680.
6166
189.
2611
9869
.87
1.26
13.7
00.
7915
.35
7.24
25.0
93.
627.
098.
2313
.51
10.9
72.
9239
358.
9354
344.
9993
703.
921.
2614
.22
0.76
15.3
37.
4525
.18
3.62
7.22
8.23
12.7
511
.22
2.94
6939
9.08
1233
04.3
019
2703
.38
1.74
12.4
40.
9714
.78
7.38
25.1
73.
206.
347.
8314
.48
11.0
12.
8293
32.7
284
29.2
917
762.
010.
4012
.18
0.90
14.8
07.
6224
.78
3.68
6.59
7.96
13.8
510
.97
3.04
1190
1.57
9935
.19
2183
6.76
0.53
12.1
30.
7114
.10
8.02
23.2
34.
418.
297.
8013
.94
10.7
52.
9932
850.
1947
620.
7280
470.
911.
2111
.55
1.06
14.9
27.
0126
.62
3.55
6.85
8.60
12.2
19.
882.
9622
188.
3012
853.
1335
041.
430.
6615
.99
0.60
14.9
66.
2328
.30
3.18
5.59
10.3
213
.03
8.94
2.01
6041
8.63
1168
53.4
217
7272
.05
1.20
3208
6.79
5572
4.45
8781
1.24
1.45
20.1
90.
7615
.57
7.61
22.5
23.
727.
657.
6713
.58
12.2
53.
0959
319.
6210
0107
.63
1594
27.2
51.
8118
.95
0.73
14.8
17.
5722
.53
3.83
7.51
7.56
14.3
812
.46
3.01
4316
5.42
9094
8.66
1341
14.0
91.
1210
.14
0.88
14.8
04.
2228
.31
3.34
6.02
7.66
15.3
211
.77
2.46
3037
0.62
1303
7.27
4340
7.89
0.41
11.6
80.
9415
.10
6.98
27.5
23.
696.
457.
7713
.15
10.2
72.
9410
314.
6641
359.
4451
674.
100.
4012
.61
0.75
15.3
97.
8725
.38
3.59
6.72
7.82
13.7
411
.08
2.66
3862
8.42
6247
4.05
1011
02.4
80.
8311
.27
0.64
14.9
88.
1922
.32
4.13
7.57
7.30
13.4
611
.47
3.11
8841
4.13
9698
9.79
1854
03.9
11.
559.
811.
1115
.05
7.51
27.1
63.
265.
777.
5014
.13
10.7
02.
5226
095.
2811
899.
6437
994.
920.
428.
921.
0315
.82
6.68
28.7
03.
175.
968.
3011
.90
9.64
2.91
7288
.17
8599
.50
1588
7.67
0.23
11.2
40.
7515
.98
6.56
24.7
74.
418.
498.
769.
2210
.33
3.64
4046
4.84
9095
2.47
1314
17.3
10.
777.
360.
9814
.48
7.03
25.7
43.
717.
108.
1313
.19
10.4
23.
2388
03.3
972
96.9
516
100.
340.
2413
.60
0.68
16.4
67.
5324
.20
4.13
8.18
8.55
10.4
611
.10
3.28
4293
2.38
8576
5.36
1286
97.7
40.
6526
920.
7853
932.
5480
853.
320.
93

247
13.0
10.
6615
.34
8.17
22.4
14.
328.
268.
0411
.92
11.6
73.
3443
716.
0449
472.
8693
188.
910.
7913
.31
0.49
12.2
16.
6519
.63
4.02
7.76
9.04
15.1
814
.30
3.08
8982
5.93
7044
0.32
1602
66.2
51.
298.
300.
8412
.65
6.09
26.5
14.
196.
429.
7612
.90
11.8
73.
0452
21.5
767
45.4
411
967.
010.
1412
.11
0.62
13.4
07.
7720
.67
4.23
8.28
7.49
16.1
613
.08
3.03
5064
3.77
4993
0.80
1005
74.5
70.
8411
.71
0.51
13.9
57.
8621
.31
4.06
8.32
7.72
14.5
312
.48
3.61
1967
5.02
3264
1.49
5231
6.52
0.52
13.8
00.
6615
.54
7.81
24.5
73.
947.
598.
5311
.55
11.0
13.
0382
794.
7783
456.
8416
6251
.61
1.12
9.36
1.05
14.2
26.
9527
.43
3.26
6.14
8.38
13.9
710
.62
2.58
1468
5.13
7681
.27
2236
6.40
0.23
8.90
1.02
13.5
67.
0526
.65
3.40
5.98
7.73
14.7
411
.51
2.96
1426
0.08
9880
.82
2414
0.91
0.31
14.6
20.
5413
.99
7.74
20.6
33.
887.
607.
4514
.18
15.0
13.
4295
321.
1245
284.
1014
0605
.22
1.49
7.90
0.83
12.7
67.
3725
.53
3.37
6.39
7.71
16.4
612
.09
2.52
1385
5.04
3784
7.82
5170
2.86
0.17
12.6
80.
6314
.32
7.41
23.7
83.
687.
017.
9612
.61
12.8
22.
9785
724.
4932
379.
6311
8104
.12
0.82
2025
2.38
1667
5.67
3692
8.05
1.02

248
14.3
90.
6615
.87
8.00
21.8
74.
087.
967.
3913
.78
11.9
03.
1011
8239
.07
7716
0.38
1953
99.4
51.
897.
571.
0314
.68
7.01
27.3
73.
376.
436.
8814
.17
10.1
63.
3012
696.
9563
54.0
219
050.
970.
2311
.53
0.88
13.4
67.
5822
.37
3.61
7.44
6.79
17.2
412
.59
3.32
2710
9.65
2028
8.87
4739
8.52
0.60
10.1
80.
7013
.72
7.53
23.4
53.
456.
837.
1016
.64
11.9
83.
0140
626.
6136
036.
1576
662.
760.
6015
.38
0.61
14.3
67.
6621
.84
3.88
7.74
7.32
15.0
912
.34
3.23
5055
6.01
5808
5.76
1086
41.7
70.
858.
200.
9213
.03
7.28
24.8
63.
567.
076.
2416
.07
11.9
33.
8710
211.
9473
09.1
717
521.
110.
357.
951.
0312
.94
7.42
26.3
43.
757.
468.
2112
.40
11.1
13.
2566
10.9
873
49.7
113
960.
690.
2112
.67
0.79
14.4
87.
6523
.43
4.20
7.49
8.30
14.1
111
.41
3.00
1121
01.2
491
597.
7520
3698
.98
1.54
8.27
1.13
12.9
57.
0825
.84
3.22
6.55
7.59
16.4
411
.48
2.80
1130
4.29
9599
.39
2090
3.69
0.23
10.2
20.
7614
.57
7.15
23.4
64.
228.
337.
9212
.40
10.4
03.
5243
679.
8246
511.
3290
191.
150.
59

249
APP
EN
DIX
E:
CH
APT
ER
3 P
LFA
DAT
AC
once
ntra
tions
in n
g FA
gdw
-1
Tim
este
pM
ESO
12:0
i13
a13
13:0
i14
14:1
w9
14:1
w7
14:0
i15
a15
15:1
15:0
16:4
*16
:3*
16:2
*T-
1M4
85.2
10.
000.
0055
.94
168.
3536
.94
0.00
2123
.36
357.
6137
3.46
602.
9442
68.1
70.
000.
0042
7.47
T-1M
1258
.85
19.0
723
.98
34.2
016
1.99
0.00
0.00
561.
2932
2.12
376.
0643
.30
397.
340.
000.
0023
5.04
T1.5
M2
88.2
819
.20
21.3
156
.31
142.
0933
.01
0.00
1492
.48
275.
8024
7.59
383.
5131
57.8
80.
0069
.59
276.
63T1
.5M
421
2.50
56.5
225
.64
61.0
320
6.03
46.9
00.
0026
18.9
932
5.47
327.
7832
4.23
3166
.71
0.00
0.00
482.
83T1
.5M
60.
000.
0025
.05
0.00
77.2
50.
000.
0022
6.73
146.
9718
0.30
19.4
118
8.11
0.00
0.00
99.8
6T1
.5M
713
0.69
32.7
330
.53
82.6
119
7.91
71.4
50.
0019
79.5
531
7.15
305.
3738
1.15
3441
.56
0.00
0.00
318.
35T1
.5M
1016
7.36
30.1
220
.14
38.7
313
8.23
27.1
10.
0013
79.1
725
8.97
269.
5622
1.98
1782
.18
0.00
0.00
238.
28T1
.5M
1135
.49
0.00
0.00
0.00
0.00
0.00
0.00
1221
.80
138.
0312
7.34
0.00
1937
.88
0.00
0.00
191.
25T1
.5M
1278
.02
35.4
215
.72
24.7
112
5.89
0.00
0.00
366.
4723
7.17
261.
1770
.74
258.
120.
0016
.69
154.
79T1
.5M
1446
.48
17.7
10.
0019
.70
95.9
413
.09
0.00
342.
1219
6.11
213.
8621
.24
216.
910.
0012
.41
141.
23T1
.5M
1620
1.20
53.8
225
.58
68.3
118
8.03
47.4
10.
0038
96.9
435
6.69
327.
1147
4.85
4143
.52
0.00
0.00
536.
29T1
.5M
1849
.13
16.6
60.
0014
.22
67.1
80.
000.
0026
4.08
157.
0217
0.99
35.9
716
4.63
0.00
0.00
86.7
9T1
.5M
2544
.05
27.9
00.
0059
.75
193.
4935
.90
0.00
2820
.32
476.
9943
2.11
473.
4147
83.5
00.
000.
0048
7.53
T1.5
M26
46.7
40.
000.
0028
.61
85.8
60.
000.
0014
18.6
517
0.04
163.
3814
8.61
1356
.84
0.00
0.00
157.
77T7
.5M
212
9.50
0.00
37.4
566
.13
187.
1356
.83
0.00
5690
.26
559.
5333
4.34
252.
8622
67.8
20.
000.
0040
7.65
T7.5
M4
96.9
40.
000.
0088
.58
0.00
0.00
0.00
2439
.97
468.
5332
7.43
545.
9750
71.9
90.
0023
3.24
0.00
T7.5
M6
57.6
118
.55
30.0
025
.47
128.
4418
.20
0.00
406.
5426
0.97
267.
8825
.47
251.
660.
000.
0017
1.93
T7.5
M7
103.
450.
0028
.46
73.1
716
5.19
59.2
50.
0040
26.8
847
4.75
309.
3228
2.27
3054
.53
0.00
0.00
305.
40T7
.5M
1079
.10
0.00
0.00
39.0
513
0.99
34.8
40.
0032
88.5
231
8.22
243.
0816
4.11
1255
.48
0.00
51.0
125
3.57
T7.5
M11
94.3
421
.83
0.00
62.2
410
3.29
39.2
923
.43
6665
.58
274.
5120
5.06
0.00
1134
.81
0.00
0.00
0.00
T7.5
M12
97.2
729
.30
15.7
725
.13
102.
690.
000.
0032
9.81
231.
9921
8.95
54.0
424
2.35
0.00
15.1
614
4.73
T7.5
M14
74.0
323
.62
23.9
130
.64
103.
7426
.72
19.4
648
3.05
227.
2822
1.30
21.5
029
7.75
0.00
0.00
212.
02T7
.5M
1693
.47
31.8
70.
0051
.57
166.
3352
.66
0.00
1924
.21
376.
0233
2.43
376.
2123
76.3
50.
000.
0030
0.93
T7.5
M18
138.
9566
.77
0.00
35.8
821
3.08
0.00
0.00
563.
1945
2.10
412.
8010
7.55
323.
800.
0045
.03
283.
70T7
.5M
2565
.76
25.0
40.
0036
.99
108.
7747
.56
19.2
063
54.7
535
2.71
194.
950.
0015
45.8
70.
000.
000.
00T7
.5M
2646
.32
0.00
0.00
36.4
011
1.06
0.00
0.00
2269
.56
328.
1322
1.67
109.
1810
42.0
20.
0037
.56
294.
07T1
4.5M
215
4.80
43.4
10.
0070
.47
164.
2959
.86
17.3
443
54.1
185
2.82
365.
7814
3.52
1818
.42
0.00
231.
4450
5.45
T14.
5M4
103.
3930
.43
0.00
55.7
419
2.41
50.1
40.
0025
03.8
058
4.76
329.
9227
8.83
2484
.06
0.00
393.
2955
7.68
T14.
5M6
163.
4445
.03
32.1
634
.63
330.
210.
000.
0012
93.0
568
8.91
753.
938.
2787
7.62
0.00
0.00
406.
28T1
4.5M
724
.40
11.3
40.
0019
.71
89.4
012
.14
0.00
473.
4321
5.65
212.
4969
.66
551.
470.
0014
0.13
86.2
9

250
T14.
5M10
72.4
726
.80
10.2
635
.78
171.
9333
.86
0.00
2621
.75
485.
9234
0.02
85.8
476
0.16
0.00
164.
9740
1.63
T14.
5M11
107.
6729
.43
57.3
380
.25
225.
7286
.11
30.0
557
27.1
982
1.75
401.
3018
5.01
2345
.44
0.00
93.2
044
5.97
T14.
5M12
127.
0841
.41
28.6
440
.43
198.
5524
.62
0.00
1319
.86
394.
2140
6.24
126.
8560
6.54
0.00
0.00
269.
67T1
4.5M
1432
.18
0.00
0.00
18.0
780
.48
0.00
0.00
258.
4717
6.73
204.
0242
.93
216.
690.
000.
0010
8.28
T14.
5M16
102.
6022
.69
35.1
780
.23
176.
3763
.35
0.00
2266
.47
441.
8829
8.86
361.
4836
45.3
90.
000.
0037
5.00
T14.
5M18
43.6
516
.89
0.00
24.0
610
3.56
12.9
20.
0036
1.43
241.
2624
9.21
69.3
323
0.65
0.00
128.
1072
.47
T14.
5M25
64.6
040
.81
0.00
46.3
818
6.38
49.9
10.
0027
06.7
361
9.88
339.
1517
3.22
1538
.75
0.00
296.
1937
3.01
T14.
5M26
76.0
726
.91
35.0
939
.74
169.
5140
.20
0.00
1954
.18
535.
5929
9.48
33.9
190
4.18
0.00
0.00
346.
53T6
.5P
217
2.00
62.3
90.
0065
.54
289.
9357
.67
0.00
2537
.87
1059
.12
492.
1241
6.86
2574
.27
0.00
215.
5940
3.18
T6.5
P4
258.
9110
9.74
0.00
133.
0143
1.13
157.
100.
0055
51.7
814
96.2
280
6.68
572.
6445
01.4
20.
0026
2.05
837.
72T6
.5P
642
.80
16.0
40.
0016
.43
78.1
612
.75
0.00
225.
4218
3.69
166.
559.
0011
6.08
0.00
0.00
94.8
0T6
.5P
718
5.84
85.7
50.
0010
8.59
394.
1686
.33
0.00
2529
.37
1113
.49
658.
3042
2.86
3361
.60
0.00
225.
6451
9.83
T6.5
P10
72.1
134
.54
0.00
37.8
414
2.44
41.2
40.
0011
95.9
640
5.43
275.
9511
7.29
925.
690.
000.
0025
9.94
T6.5
P11
188.
6279
.19
0.00
100.
7735
6.78
121.
190.
0051
47.0
411
44.8
860
6.10
356.
2435
99.5
60.
0020
1.13
515.
83T6
.5P
1211
1.03
34.7
419
.18
46.3
918
1.50
25.3
30.
0064
8.66
436.
6243
8.26
56.3
438
6.39
0.00
0.00
240.
11T6
.5P
1494
.72
0.00
25.1
732
.43
147.
450.
000.
0046
9.40
285.
4930
7.86
25.8
824
3.34
0.00
0.00
173.
79T6
.5P
1618
2.07
0.00
65.8
212
2.75
218.
0711
8.62
0.00
7090
.37
879.
3257
9.75
0.00
6607
.17
0.00
0.00
0.00
T6.5
P18
77.2
10.
000.
000.
0019
1.20
0.00
0.00
667.
1241
1.07
455.
480.
0039
7.45
0.00
245.
560.
00T6
.5P
2590
.51
0.00
55.4
877
.95
242.
4653
.22
0.00
3590
.75
964.
8870
0.22
0.00
5024
.41
0.00
222.
4112
25.9
3T6
.5P
2684
.67
0.00
69.7
542
.78
123.
5531
.19
0.00
956.
9139
4.41
220.
4214
0.27
988.
700.
0099
.59
226.
29T2
7.5P
496
3.51
129.
7134
.97
115.
8852
8.14
104.
3241
.59
7555
.47
2092
.58
882.
3839
3.18
1904
.63
0.00
159.
7788
4.84
T27.
5P6
35.0
316
.11
18.1
126
.68
151.
3615
.36
0.00
514.
9830
4.85
319.
6544
.32
380.
520.
000.
0021
7.44
T27.
5P7
357.
8964
.04
0.00
60.3
429
0.30
42.0
10.
0011
51.3
180
9.38
524.
5014
7.99
910.
010.
000.
0036
9.65
T27.
5P10
384.
6948
.59
0.00
63.8
727
4.90
49.3
30.
0019
40.2
670
8.89
573.
7421
8.32
1558
.99
0.00
0.00
377.
35T2
7.5P
1120
5.42
86.9
70.
0013
7.53
345.
5663
.26
0.00
2061
.40
1015
.17
631.
4124
1.07
3973
.68
0.00
0.00
472.
55T2
7.5P
1235
.92
16.8
10.
0022
.72
105.
130.
000.
0033
6.73
261.
4124
9.18
15.5
023
5.45
0.00
0.00
151.
32T2
7.5P
1430
.67
0.00
0.00
22.3
692
.17
0.00
0.00
271.
3519
4.48
215.
4541
.50
222.
150.
000.
0012
2.99
T27.
5P16
516.
7887
.32
28.9
833
6.90
413.
9010
4.21
40.0
662
59.7
511
38.9
272
8.99
1332
.89
1809
6.44
0.00
0.00
531.
00T2
7.5P
1870
.23
56.8
90.
000.
0016
2.75
0.00
0.00
379.
8725
4.19
271.
1190
.24
239.
000.
000.
0017
1.69
T27.
5P25
254.
9671
.55
114.
4216
3.98
232.
6277
.89
24.5
328
22.4
874
4.84
463.
5775
.41
1894
.82
0.00
0.00
448.
42

251
i16
16:1
w9
16:1
w7
16:1
w5
16:0
10M
e17b
ri1
7a1
717
:117
:018
:3w
618
:418
:2w
618
:3w
318
:1w
9cis
301.
8215
1.02
7298
.66
226.
9489
18.8
011
2.03
137.
9410
9.49
2036
.41
588.
7217
8.18
394.
0443
1.35
0.00
1061
.58
68.9
011
3.25
1205
.94
125.
8621
95.0
913
0.08
101.
6011
7.72
337.
3420
5.63
16.8
356
.90
243.
320.
0047
8.85
323.
070.
0044
76.3
716
4.42
6334
.72
139.
3116
9.78
77.8
114
30.6
058
1.46
109.
4523
2.14
386.
610.
0061
2.05
417.
070.
0069
18.3
120
9.42
1003
7.09
235.
7220
2.86
113.
5113
59.9
349
3.70
191.
9841
0.22
704.
820.
0011
55.9
225
.91
64.2
658
0.63
53.8
996
1.73
66.8
846
.91
56.9
914
6.16
84.1
60.
0016
.29
113.
760.
0023
9.63
309.
5712
3.86
5179
.63
176.
2483
47.9
715
3.86
128.
3110
8.08
1520
.55
549.
8716
0.09
242.
0144
7.47
0.00
1500
.56
208.
0910
8.00
4153
.91
132.
7655
17.1
593
.79
86.1
689
.09
804.
2428
1.16
131.
9917
2.00
683.
830.
0073
5.64
220.
7277
.04
4095
.39
101.
3149
69.9
442
.55
52.2
337
.42
658.
5626
1.61
154.
9816
5.74
202.
250.
0045
4.42
40.5
291
.42
830.
2783
.10
1428
.13
95.0
087
.49
85.2
123
1.99
161.
4313
.26
21.2
530
4.64
0.00
401.
1760
.66
75.2
889
2.41
76.8
914
14.8
178
.26
66.2
673
.52
207.
0815
1.60
12.0
742
.44
206.
280.
0042
5.77
471.
0311
8.42
1062
4.65
281.
4114
011.
1619
4.94
120.
5310
2.49
1834
.08
547.
6326
7.69
621.
7296
6.83
0.00
1390
.67
31.8
742
.71
622.
1746
.44
1062
.95
90.4
661
.47
56.4
212
9.12
82.4
136
.14
27.3
518
1.74
0.00
320.
7135
2.68
156.
4486
87.5
831
1.41
1427
3.81
190.
8330
4.41
194.
7222
85.4
382
0.85
281.
1739
5.77
748.
660.
0014
48.0
516
7.93
45.8
242
99.8
910
5.40
6818
.05
53.3
158
.24
50.5
659
1.10
211.
1115
6.67
161.
1127
9.12
0.00
653.
4146
9.12
451.
2015
116.
1837
2.08
2145
6.82
176.
1515
8.75
105.
7210
45.9
750
9.81
381.
2163
9.20
942.
440.
0012
46.6
811
08.8
372
96.7
835
7.55
0.00
1032
3.53
162.
3726
4.81
1873
.28
521.
0280
8.32
161.
3240
9.74
868.
780.
0018
46.9
469
.57
90.6
411
44.7
088
.37
1545
.81
118.
6271
.94
79.8
123
9.07
148.
7026
.04
44.6
814
6.44
0.00
348.
3345
7.36
131.
2411
173.
0828
4.80
1712
6.78
108.
9212
4.46
90.8
413
15.6
250
7.31
237.
1741
9.81
687.
740.
0010
34.3
357
7.99
167.
1099
78.3
324
2.59
1190
4.31
121.
5999
.71
79.0
664
6.65
302.
5427
6.99
246.
3779
4.99
0.00
697.
8812
43.6
90.
0021
271.
2726
9.77
1986
4.86
77.3
598
.04
74.8
153
6.04
300.
5110
23.5
456
0.36
1326
.32
0.00
1378
.69
50.4
980
.25
919.
2175
.07
1405
.00
87.1
984
.22
79.4
424
0.76
150.
570.
0033
.20
436.
900.
0042
8.50
52.1
310
6.94
1172
.43
113.
3817
60.5
783
.50
75.4
378
.20
305.
8816
8.49
17.6
447
.59
238.
500.
0087
8.72
317.
5223
5.34
5761
.10
202.
3285
89.1
713
8.44
116.
7611
2.70
1315
.30
404.
3013
4.15
309.
5560
1.95
0.00
787.
1077
.36
118.
8615
52.7
612
3.16
2293
.65
152.
1420
7.22
195.
8940
5.34
411.
120.
0089
.79
500.
570.
0072
4.17
0.00
1134
.20
1679
3.68
158.
6817
368.
9724
.96
89.9
653
.70
478.
9328
0.14
758.
8448
1.03
985.
060.
0012
02.5
951
2.77
103.
5371
17.9
819
5.80
9337
.36
81.8
579
.01
65.4
954
4.62
261.
2529
6.73
278.
2558
1.80
0.00
669.
9071
3.96
0.00
1306
5.81
323.
4016
882.
7815
2.56
220.
9872
6.13
159.
7545
3.43
424.
7141
0.24
1176
.16
0.00
1570
.23
308.
3125
3.35
7793
.72
266.
5110
654.
3512
9.26
163.
8394
.06
1351
.86
527.
4516
9.93
387.
4284
0.42
0.00
1148
.52
153.
3518
3.08
2517
.13
240.
5354
28.8
736
5.30
258.
3928
1.52
760.
6352
4.25
50.7
297
.99
619.
620.
0016
57.4
158
.71
0.00
1330
.87
81.2
021
10.2
910
6.77
94.7
565
.94
385.
8814
6.85
0.00
117.
4121
6.25
0.00
288.
58

252
211.
190.
0083
71.2
623
0.56
1199
5.93
142.
3115
7.96
97.0
242
9.93
251.
8026
7.24
261.
2974
4.53
0.00
781.
6450
0.62
460.
7719
697.
3556
4.58
2681
5.66
252.
7321
4.00
167.
1028
4.89
733.
6174
2.78
925.
5816
82.7
60.
0021
56.2
621
0.13
108.
7932
32.8
416
7.67
4759
.51
192.
1621
1.29
142.
7243
3.42
390.
6886
.37
120.
2664
4.96
0.00
873.
5222
.29
0.00
697.
4856
.14
1032
.42
85.6
356
.95
69.4
417
4.10
106.
0820
.66
23.8
596
.54
0.00
302.
2431
1.25
129.
7662
32.1
923
3.69
1028
1.04
130.
2517
2.05
86.4
519
00.5
666
4.22
216.
1526
3.26
698.
190.
0010
42.7
30.
000.
0088
3.02
105.
0813
73.9
111
3.89
75.8
129
.06
185.
7714
8.75
0.00
22.4
293
.77
0.00
393.
8546
8.38
201.
4187
54.1
128
6.31
1226
3.06
124.
7416
6.39
102.
3997
4.46
422.
3521
5.87
299.
4175
2.90
0.00
1096
.80
487.
3313
1.25
5554
.92
213.
5660
19.7
714
9.88
145.
4585
.43
595.
5824
9.82
183.
0017
6.27
660.
290.
0065
0.65
562.
9745
0.86
5939
.77
414.
4995
22.6
918
3.80
345.
2111
3.62
1446
.06
643.
2612
6.57
317.
8657
3.22
0.00
1047
.23
1054
.51
979.
2014
149.
4896
3.84
2395
9.28
320.
4656
8.74
228.
0224
47.1
313
03.8
026
1.58
700.
5611
84.9
50.
0022
79.3
826
.90
0.00
610.
6248
.98
896.
4088
.98
55.7
346
.25
87.2
797
.48
0.00
0.00
73.7
30.
0017
8.24
695.
3339
1.13
7104
.61
517.
0510
747.
4319
3.83
358.
3314
3.20
1939
.15
918.
6117
6.97
316.
2759
1.08
0.00
1268
.23
277.
3916
4.52
2802
.38
142.
3249
28.1
110
4.98
153.
5375
.08
476.
0226
3.55
70.0
811
9.17
321.
310.
0051
9.99
1235
.33
188.
4216
591.
5111
20.8
223
081.
4627
1.30
370.
4117
7.99
1888
.77
789.
7835
0.80
671.
7799
0.24
0.00
1496
.22
93.6
869
.38
1568
.83
163.
0024
06.7
221
7.63
135.
3011
7.57
352.
5025
5.40
0.00
0.00
179.
980.
0052
3.35
49.5
770
.38
1092
.18
78.1
217
93.5
315
5.28
153.
3410
7.28
191.
2625
2.95
381.
8132
.90
172.
820.
0047
1.65
1712
.06
0.00
1866
5.52
632.
9722
368.
8619
5.06
388.
120.
0040
27.4
511
05.9
472
9.73
578.
2016
22.8
80.
0037
00.5
10.
0018
04.6
919
1.46
0.00
2480
.64
175.
4212
6.27
243.
4911
1.26
243.
990.
000.
0024
8.36
0.00
767.
9969
1.28
0.00
1231
0.54
603.
0918
262.
8837
6.39
440.
9523
8.07
3396
.36
1311
.65
332.
5664
3.58
1353
.04
0.00
4076
.69
190.
5018
9.02
2396
.22
168.
0040
52.1
210
5.40
113.
5167
.07
718.
9235
9.35
69.7
480
.49
314.
260.
0012
44.5
120
5.78
997.
3861
28.0
773
1.51
2740
7.06
299.
4260
5.51
279.
8812
35.7
792
6.24
2810
.94
3053
.40
5545
.24
0.00
7695
.39
61.5
694
.23
1076
.49
104.
6420
01.1
314
7.22
129.
6710
2.74
312.
9620
9.70
23.0
150
.01
211.
030.
0038
0.31
277.
5520
8.04
2568
.22
246.
6945
59.4
816
2.45
247.
1815
7.61
629.
7045
3.04
74.2
819
3.41
1983
.67
0.00
1418
.08
437.
3733
8.36
4669
.05
288.
0279
79.7
715
9.76
264.
2219
2.96
1170
.87
583.
2288
.99
207.
2318
36.3
70.
0015
59.1
632
1.35
190.
9574
17.6
936
1.73
1085
8.72
208.
3332
2.03
163.
8423
87.3
376
5.32
206.
9235
7.29
1089
.18
0.00
1664
.64
31.3
70.
0083
1.73
69.0
414
39.4
116
2.58
86.2
383
.40
169.
2317
4.42
41.1
30.
0014
5.52
0.00
417.
7031
.48
48.0
467
6.57
67.6
110
92.9
481
.99
58.5
667
.82
173.
4510
5.24
0.00
19.3
310
8.89
0.00
234.
3157
9.04
555.
5015
313.
6460
1.34
2333
6.39
280.
5448
6.81
0.00
9777
.81
2031
.87
461.
1177
0.31
2192
.00
0.00
2495
.18
37.9
261
.46
803.
5173
.53
1685
.71
140.
7787
.63
91.6
617
0.92
185.
000.
0028
.61
214.
770.
0039
5.68
228.
2024
9.30
3847
.45
331.
1891
58.6
216
6.05
257.
2413
8.44
1184
.84
790.
6010
8.00
791.
1162
4.89
0.00
3439
.05

253
18:2
w3
18:1
w9t
18:1
w7
18:1
w5
18:0
10M
e19b
ri1
9*a1
9*19
:1*
19:0
i.s.
20:5
w6
20:4
w6
20:5
w3
20:3
w6
20:4
w3
20:2
*0.
0096
1.46
79.4
50.
0011
39.4
042
.92
34.6
139
.29
30.3
114
6.74
0.00
488.
8224
38.1
252
.74
41.1
589
.35
0.00
698.
2768
.13
0.00
1054
.45
27.1
425
.82
16.9
126
.42
129.
010.
0030
2.29
501.
710.
000.
0013
2.55
0.00
795.
1160
.57
23.7
689
9.19
48.9
633
.76
28.7
229
.44
362.
190.
0054
6.22
1932
.35
78.8
680
.57
112.
430.
0010
45.9
211
1.47
36.7
612
13.0
198
.55
75.4
573
.06
52.6
440
4.30
0.00
480.
7622
39.9
878
.46
116.
5324
2.56
0.00
332.
8732
.68
0.00
464.
840.
000.
0024
.98
16.1
858
.97
0.00
122.
8822
3.66
0.00
0.00
81.4
50.
0012
91.1
413
8.72
65.9
214
76.3
410
3.96
100.
0210
5.15
34.0
634
6.14
0.00
523.
7219
44.8
085
.52
86.7
732
8.95
0.00
725.
4186
.17
32.6
391
7.05
31.5
040
.83
21.0
322
.52
128.
740.
0034
4.35
1216
.42
43.6
525
.76
67.6
10.
0044
9.58
0.00
0.00
455.
7634
.70
0.00
0.00
16.0
086
.08
0.00
294.
8613
96.4
649
.53
48.1
249
.39
0.00
556.
5349
.11
24.0
858
9.89
12.1
334
.75
19.4
321
.20
122.
560.
0019
5.83
307.
480.
000.
0059
.06
0.00
606.
9855
.37
20.8
577
0.38
35.2
820
.37
23.9
719
.71
103.
200.
0024
1.25
587.
4119
.71
14.6
811
0.70
0.00
1133
.41
86.6
832
.41
1068
.29
81.6
339
.10
30.3
139
.73
205.
870.
0077
6.39
3522
.13
82.2
710
9.22
45.1
90.
0047
2.55
69.9
558
.51
462.
440.
0026
.82
31.7
115
.62
96.6
40.
0013
0.15
307.
130.
000.
0072
.70
0.00
1633
.22
144.
2355
.29
1585
.20
77.2
537
.24
77.6
857
.27
273.
040.
0091
4.55
3238
.48
135.
4923
8.44
627.
500.
0057
6.44
38.1
90.
0051
0.91
30.5
80.
0046
.87
0.00
69.3
80.
0065
9.96
1276
.30
215.
8830
.95
30.6
50.
0017
96.5
298
.55
38.1
916
14.1
270
.61
31.3
641
.29
47.1
326
4.95
0.00
1075
.70
3995
.26
169.
6916
2.86
184.
550.
0021
08.1
70.
0024
5.97
1733
.05
125.
7490
.06
104.
290.
0024
8.81
0.00
593.
8930
01.2
80.
0049
.23
296.
460.
0061
3.16
48.3
215
.16
535.
3323
.71
0.00
22.0
039
.42
168.
250.
0024
7.56
469.
0320
.53
13.2
669
.30
0.00
1472
.69
102.
3137
.48
1220
.33
46.7
232
.30
42.6
339
.08
247.
940.
0077
6.17
2757
.05
99.0
392
.32
97.3
00.
0095
8.73
52.5
10.
0080
5.58
0.00
0.00
25.7
029
.60
152.
090.
0059
5.06
1788
.16
95.3
156
.22
67.8
90.
0013
03.3
210
0.89
92.5
313
65.4
218
6.95
0.00
23.9
319
.22
135.
150.
0017
12.0
444
85.4
326
9.16
161.
1346
.92
0.00
574.
1347
.07
15.9
257
1.96
14.1
734
.94
15.6
523
.19
212.
020.
0018
5.54
308.
800.
000.
0031
.30
0.00
746.
3021
.26
0.00
787.
840.
000.
000.
0028
.02
254.
180.
0026
9.56
547.
580.
000.
0026
.20
0.00
963.
5173
.74
31.5
385
3.24
61.2
30.
0054
.63
0.00
235.
410.
0046
2.33
1922
.36
52.7
558
.80
37.1
30.
0011
38.6
197
.83
46.8
712
80.4
758
.02
57.9
475
.44
56.4
741
3.82
0.00
1172
.93
2040
.47
83.7
665
.28
141.
030.
0014
14.7
079
.57
40.5
689
0.04
80.1
60.
000.
0022
.59
65.2
20.
0016
38.6
143
63.8
825
6.50
178.
5035
.25
0.00
1055
.26
58.4
20.
0068
0.37
41.2
60.
0041
.56
24.3
017
3.79
0.00
729.
9423
38.9
699
.31
55.4
010
6.60
0.00
2528
.73
46.7
217
.87
2255
.98
0.00
40.3
126
.56
67.2
415
2.71
0.00
1088
.29
3092
.19
185.
1817
3.42
248.
500.
0017
72.3
327
.60
0.00
1214
.55
0.00
32.1
123
.31
49.4
713
1.65
0.00
784.
4126
90.2
811
8.21
121.
7865
.84
0.00
1610
.86
279.
2616
4.51
2204
.17
154.
980.
000.
000.
0030
1.94
0.00
438.
7254
3.77
44.0
669
.20
335.
580.
0042
8.41
16.1
10.
0042
0.98
0.00
10.0
111
.55
15.2
362
.72
0.00
183.
7145
1.76
19.7
617
.30
30.4
3

254
0.00
1333
.02
23.5
70.
0010
42.0
40.
0027
.70
19.9
133
.08
162.
400.
0070
8.70
1915
.29
132.
1392
.41
86.9
30.
0026
91.9
490
.24
596.
5622
95.6
50.
0064
2.88
29.8
141
.79
497.
130.
0012
06.6
029
43.1
430
7.60
150.
7911
89.2
90.
0013
69.2
485
.57
28.8
414
67.2
164
.36
58.3
947
.38
51.4
119
2.46
0.00
751.
1117
79.2
654
.78
77.6
135
.84
0.00
403.
9941
.09
197.
9847
6.82
0.00
17.3
544
.09
14.6
013
1.81
0.00
134.
9021
3.30
0.00
0.00
105.
950.
0016
11.9
987
.74
24.0
012
29.8
60.
0026
.67
17.2
440
.22
245.
920.
0088
0.27
2343
.39
163.
4414
0.71
130.
300.
0050
5.08
0.00
0.00
542.
590.
0014
.97
15.6
227
.77
105.
7819
5.57
194.
2035
5.73
0.00
0.00
108.
630.
0021
46.3
735
.14
0.00
1248
.73
0.00
44.1
327
.94
85.7
817
2.78
0.00
840.
2723
29.5
314
5.08
106.
5795
.98
0.00
1397
.96
13.2
213
.37
699.
590.
0026
.56
27.2
355
.55
306.
930.
0073
4.52
1738
.13
97.0
060
.97
138.
580.
0025
56.3
051
.29
0.00
1767
.36
0.00
0.00
0.00
123.
0221
8.05
0.00
1142
.41
2276
.39
87.8
90.
0037
0.19
0.00
5211
.78
0.00
0.00
3305
.92
0.00
0.00
113.
7611
7.81
442.
170.
0016
52.2
144
15.5
811
4.61
154.
4554
6.96
0.00
341.
950.
000.
0045
6.65
0.00
0.00
0.00
20.5
596
.71
0.00
84.5
613
6.18
0.00
0.00
54.6
30.
0029
54.5
80.
000.
0021
91.2
20.
000.
000.
0015
9.99
250.
090.
0014
27.6
431
35.3
490
.84
72.0
045
7.89
0.00
957.
910.
000.
0094
0.75
0.00
0.00
0.00
37.8
412
6.51
0.00
602.
1210
86.4
547
.56
0.00
136.
570.
0036
59.6
00.
000.
0028
56.8
411
0.80
0.00
0.00
0.00
278.
680.
0014
94.3
344
63.1
322
8.91
181.
4126
92.2
40.
0098
9.63
0.00
0.00
881.
3155
.78
37.7
224
.52
58.7
114
5.46
0.00
359.
4647
6.46
0.00
0.00
167.
250.
0062
6.10
67.9
917
9.35
980.
1824
.93
38.7
522
5.51
38.2
823
9.90
0.00
185.
6426
0.64
0.00
0.00
464.
070.
0035
40.8
978
.43
0.00
2362
.02
493.
090.
000.
0098
.46
105.
180.
0030
96.6
073
86.3
237
3.54
114.
0718
4.65
0.00
863.
070.
000.
0087
6.77
0.00
0.00
0.00
46.3
823
8.49
0.00
301.
0141
3.39
0.00
0.00
0.00
0.00
4789
.15
159.
180.
0031
45.6
023
4.03
0.00
0.00
184.
2644
0.41
0.00
2641
.19
6501
.71
277.
2737
4.82
222.
640.
0011
92.4
70.
000.
0091
2.71
21.6
30.
000.
0068
.01
128.
640.
0074
6.82
1181
.73
98.6
927
.55
101.
010.
0050
69.4
340
0.64
128.
9553
99.3
30.
0076
.40
75.6
817
5.04
340.
320.
0011
111.
7765
54.1
310
43.0
036
7.89
941.
400.
0055
0.24
70.0
332
.36
724.
7727
.85
22.4
76.
7734
.34
172.
310.
0025
1.95
266.
6416
.49
36.0
171
.82
0.00
1520
.96
156.
4956
.75
1278
.05
0.00
32.4
737
.45
77.2
319
7.10
0.00
815.
0298
0.68
58.4
631
.23
136.
690.
0020
10.5
123
8.85
96.8
420
21.2
90.
0085
.46
73.2
962
.68
221.
200.
0014
10.5
820
22.6
611
6.13
110.
5336
8.89
0.00
2356
.82
202.
7578
.78
1768
.54
0.00
33.2
210
5.89
77.5
215
8.24
0.00
1498
.90
2948
.86
160.
2410
8.65
303.
690.
0051
6.43
0.00
0.00
563.
8921
.34
0.00
21.8
439
.56
258.
170.
0016
3.90
181.
110.
000.
0011
6.82
0.00
363.
8737
.22
0.00
511.
540.
000.
000.
0017
.31
113.
090.
0014
8.92
180.
890.
000.
0051
.63
0.00
3038
.28
212.
7866
.97
2268
.99
0.00
90.4
334
8.58
96.6
134
2.25
0.00
2930
.84
6038
.93
313.
1824
2.01
201.
690.
0059
5.97
80.8
327
.07
1062
.92
25.8
426
.17
33.4
239
.17
245.
830.
0019
9.08
232.
040.
000.
0010
6.68
0.00
2356
.95
79.8
440
.16
1910
.99
77.7
30.
000.
0014
0.13
186.
480.
0011
97.1
423
90.8
513
7.69
105.
8811
7.03

255
20:3
w3
20:1
w9
20:1
w7
20:1
w5
20:0
i.s.
21:0
i.s.
22:6
w6*
22:6
w3
22:5
w6*
22:5
w3*
22:2
*22
:1w
922
:1w
7*22
:023
:0 i.
s.24
:167
.05
167.
5814
2.72
0.00
1132
.49
3086
.58
62.1
452
3.43
0.00
105.
6347
.78
32.1
724
.39
517.
7912
69.5
952
.85
60.0
283
.10
0.00
0.00
1090
.05
1880
.87
35.4
816
0.26
56.9
370
.35
47.3
00.
0018
.25
475.
5613
27.4
872
.94
80.2
323
5.41
44.7
40.
0098
3.02
2197
.17
57.1
444
8.24
62.4
413
9.00
64.8
363
.59
40.9
439
7.54
1379
.09
107.
9655
.84
218.
6894
.18
0.00
1395
.08
1409
.38
64.5
853
4.46
154.
9319
4.93
400.
9655
.18
28.7
166
0.64
1662
.70
579.
4423
.76
45.9
60.
000.
0038
0.93
2852
.35
0.00
61.7
20.
000.
0091
.23
0.00
0.00
146.
2661
0.01
0.00
53.0
021
3.77
118.
270.
0011
61.1
918
14.3
954
.79
568.
7736
9.30
220.
4053
1.57
54.9
325
.58
514.
9017
34.5
664
2.82
41.2
911
4.15
61.2
30.
0061
9.55
1560
.17
36.3
626
7.07
70.0
087
.80
46.5
929
.24
0.00
315.
0011
25.9
110
0.40
0.00
95.9
50.
000.
0029
4.74
1909
.79
0.00
342.
0127
.62
83.7
028
.66
87.5
819
.19
193.
2251
7.90
0.00
32.4
274
.70
0.00
0.00
766.
8613
26.2
225
.47
110.
6147
.18
59.7
829
.64
0.00
0.00
311.
0094
1.38
53.6
152
.66
147.
730.
000.
0051
3.18
1885
.08
41.7
325
8.32
46.7
677
.21
107.
220.
000.
0022
4.62
695.
9017
5.97
70.7
819
3.18
203.
380.
0010
55.0
825
27.6
190
.62
714.
0793
.49
196.
3069
.47
59.7
121
.92
499.
5198
0.33
156.
0616
.36
37.8
10.
000.
0026
5.01
2164
.90
17.5
883
.79
70.0
575
.40
89.8
90.
000.
0012
5.90
913.
6013
7.12
0.00
338.
3412
3.61
0.00
1682
.04
2730
.84
139.
1291
9.50
137.
1833
2.91
78.1
742
.19
40.0
077
6.52
1860
.76
73.9
736
.24
200.
3573
.26
0.00
380.
7720
59.1
534
.36
249.
8538
.65
75.3
719
.62
20.1
90.
0019
9.29
708.
8251
.48
82.9
831
1.17
166.
060.
0099
7.00
2615
.95
106.
8993
5.32
137.
5424
7.80
66.5
265
.60
40.0
560
0.31
1020
.89
69.9
10.
0034
9.07
0.00
0.00
656.
6956
29.9
40.
0010
96.1
017
7.64
307.
0324
2.54
240.
730.
0051
4.12
1657
.09
337.
5833
.94
77.4
30.
000.
0077
3.58
1715
.92
0.00
160.
6528
.12
44.3
341
.08
0.00
13.7
531
6.13
877.
350.
0073
.60
294.
840.
000.
0087
7.52
3013
.76
71.3
066
8.21
103.
4620
7.03
60.9
966
.39
52.1
150
0.80
1148
.00
63.0
748
.99
231.
0315
4.03
0.00
702.
4028
09.6
750
.36
274.
1955
.33
103.
370.
000.
000.
0036
8.85
1023
.31
80.9
10.
0034
3.56
0.00
272.
2138
7.76
1293
.22
0.00
673.
2790
.60
210.
9136
.69
55.5
735
.91
239.
2338
1.02
0.00
31.6
666
.53
0.00
0.00
594.
7513
16.8
425
.72
99.3
130
.72
38.5
716
.62
0.00
0.00
257.
4393
3.42
38.4
351
.90
78.6
10.
000.
0079
0.85
2216
.60
39.0
615
9.46
42.4
378
.20
41.7
80.
0015
.37
315.
2111
98.2
40.
0067
.19
240.
3984
.72
0.00
851.
0131
72.4
952
.70
527.
5161
.06
149.
1729
.79
50.8
929
.66
405.
7712
59.0
240
.72
607.
8026
3.63
0.00
0.00
1739
.57
3380
.72
161.
7650
7.63
91.1
713
8.17
220.
160.
0021
8.60
687.
8714
02.9
940
5.73
0.00
464.
660.
0026
3.64
363.
4914
19.2
10.
0066
4.87
62.2
821
0.66
48.6
50.
0027
.89
220.
9332
1.96
0.00
48.5
126
8.99
0.00
0.00
422.
9424
22.6
773
.79
495.
7664
.34
131.
7334
.43
40.6
722
.24
209.
6687
2.18
63.3
110
9.64
415.
9287
.74
0.00
481.
6414
24.6
510
2.58
647.
7882
.45
381.
1120
9.63
125.
1597
.90
405.
3897
9.49
70.7
717
8.27
0.00
283.
280.
0066
2.72
1645
.24
105.
1571
5.72
107.
6529
3.96
69.4
411
9.70
85.0
052
3.61
980.
8310
9.72
83.2
616
0.12
0.00
0.00
2473
.28
2231
.22
0.00
61.5
925
4.63
172.
2240
8.21
0.00
22.1
192
8.31
1081
.15
0.00
22.6
30.
0052
.41
0.00
517.
3012
50.4
421
.53
111.
0621
.50
55.3
620
.25
59.7
014
.81
239.
6593
3.20
0.00

256
56.1
615
0.16
0.00
0.00
991.
4012
44.0
186
.45
421.
5279
.19
164.
2546
.27
27.8
035
.65
488.
8511
29.6
574
.27
68.6
036
3.54
133.
130.
0010
25.6
923
10.3
212
7.39
655.
3933
4.47
481.
6118
42.4
646
.92
70.1
329
76.5
812
10.0
310
5.13
74.6
417
2.82
76.5
20.
0018
06.7
813
02.5
410
5.51
772.
2711
8.01
134.
1420
7.18
0.00
121.
5361
7.27
1076
.22
249.
4419
.46
60.3
40.
000.
0048
4.80
1359
.11
16.9
970
.67
38.5
235
.22
161.
770.
000.
0018
9.58
914.
1425
9.16
123.
7623
1.06
0.00
0.00
852.
7011
51.9
684
.26
563.
9789
.62
248.
4336
.56
61.9
834
.35
444.
1387
1.10
76.2
70.
0083
.45
0.00
0.00
568.
0341
65.9
843
.24
137.
9827
.92
39.7
628
.70
10.5
30.
0026
1.64
1095
.54
61.1
513
7.13
302.
5771
.59
0.00
722.
3323
95.6
286
.73
511.
2389
.03
269.
0958
.26
51.6
554
.12
424.
6760
2.67
55.9
150
.24
144.
280.
000.
0070
7.55
1717
.80
76.4
630
2.80
85.0
217
2.46
40.7
526
.05
29.2
426
1.17
801.
3551
.59
0.00
382.
1011
4.68
0.00
887.
0243
12.9
912
4.68
578.
9812
4.73
204.
3889
.48
30.4
242
.73
600.
6594
2.91
220.
080.
0086
4.47
252.
060.
0018
51.9
210
118.
6318
4.04
1114
.82
206.
4640
0.08
215.
870.
0013
2.08
1744
.74
1752
.12
314.
080.
0045
.81
0.00
0.00
486.
1612
38.5
814
.08
48.2
613
.27
18.8
522
.82
0.00
0.00
204.
5669
9.42
0.00
0.00
313.
870.
000.
0012
13.1
658
11.8
917
0.11
841.
6716
1.92
308.
6154
.23
0.00
47.7
271
7.80
1609
.88
58.7
70.
0020
4.62
0.00
0.00
508.
5242
53.9
549
.22
227.
6143
.41
100.
990.
000.
0029
.70
322.
3613
01.5
580
.41
0.00
0.00
507.
000.
0013
20.4
588
95.7
817
1.83
796.
7214
4.78
502.
5866
.64
0.00
59.6
781
4.52
1218
.89
0.00
0.00
174.
060.
000.
0013
20.6
015
86.0
446
.80
155.
7858
.07
74.8
633
.61
0.00
16.3
660
5.32
1260
.42
0.00
33.7
690
.05
0.00
0.00
1096
.07
1645
.09
25.6
388
.64
73.9
877
.97
558.
490.
000.
0059
7.91
1329
.04
572.
6642
8.02
583.
610.
0012
8.59
515.
0833
41.9
720
0.56
1332
.41
192.
2755
4.16
52.4
297
.38
43.5
744
2.39
958.
460.
000.
0025
7.96
0.00
0.00
1293
.30
6221
.35
0.00
121.
030.
000.
000.
0042
.71
0.00
506.
5813
87.6
194
.30
420.
9686
4.28
0.00
123.
1321
74.0
438
38.6
928
9.01
1847
.49
234.
3679
0.08
119.
9610
6.34
116.
7011
00.0
285
3.75
0.00
67.6
913
1.11
0.00
0.00
410.
7429
19.3
579
.29
405.
7364
.06
127.
7835
.33
0.00
24.2
225
7.78
1025
.95
0.00
1152
.78
0.00
473.
9569
1.67
1715
.13
2682
.50
1599
.59
1496
.93
283.
0043
4.18
249.
9021
3.96
76.9
115
45.5
419
43.6
913
60.5
436
.21
49.2
90.
000.
0013
49.3
223
03.3
031
.15
95.6
639
.78
38.7
238
.49
29.1
820
.92
549.
5515
21.0
10.
0083
.33
144.
010.
000.
0012
00.4
239
00.2
910
1.93
322.
9681
.86
109.
8611
9.02
32.1
60.
0066
0.16
1634
.48
120.
6511
7.33
236.
590.
000.
0016
48.6
833
56.7
715
9.22
604.
2920
8.31
262.
3231
5.58
183.
1840
.81
736.
2715
14.6
784
.29
132.
4226
7.66
0.00
0.00
1157
.21
4289
.96
190.
7882
6.42
144.
9424
2.00
143.
7555
.43
0.00
658.
2516
91.8
311
2.68
0.00
104.
050.
000.
0081
2.46
2032
.05
20.9
569
.63
29.8
60.
0046
.00
0.00
15.8
631
4.79
1581
.99
0.00
19.0
550
.37
0.00
0.00
522.
0615
79.7
818
.59
66.0
20.
000.
0073
.29
0.00
0.00
210.
8610
40.8
484
.14
259.
3541
9.60
192.
550.
0015
53.1
435
63.5
432
0.14
1287
.31
187.
5738
7.38
69.2
120
9.93
64.3
790
1.15
1596
.17
209.
5425
.99
80.7
20.
000.
0011
50.7
326
32.5
125
.81
93.2
652
.47
55.9
286
.58
0.00
0.00
426.
1110
94.5
515
1.60
220.
4021
3.44
0.00
0.00
1379
.30
2408
.94
126.
4410
81.9
510
8.73
215.
8545
.84
25.3
231
.93
842.
0577
7.23
0.00

257
24:0
25:0
26:0
27:0
28:0
29:0
30:0
31:0
32:0
Tota
lSa
t FA
'sM
ono
Uns
atPo
lyun
sat
Br F
A's
% S
at F
A's
865.
1412
3.19
514.
8776
.92
365.
4766
.23
304.
590.
000.
0039
943.
9820
013.
7812
905.
4353
47.2
316
77.5
450
.10
793.
0112
9.14
547.
8693
.50
450.
2589
.74
399.
700.
000.
0014
067.
6274
85.6
233
14.7
019
18.9
813
48.3
353
.21
617.
9286
.35
355.
7559
.87
262.
7251
.92
226.
290.
000.
0029
374.
3014
668.
7085
41.9
946
76.7
214
86.9
049
.94
895.
4611
8.41
543.
0295
.82
415.
0319
7.88
349.
500.
000.
0041
827.
9721
078.
8012
319.
8463
53.8
220
75.5
150
.39
190.
4626
.53
235.
5828
.35
139.
8531
.90
134.
430.
0012
5.88
6002
.33
2984
.82
1556
.72
834.
5962
6.19
49.7
377
8.62
102.
7944
7.95
73.5
630
7.79
293.
6026
2.11
0.00
0.00
3815
6.70
1878
9.90
1160
1.92
5935
.50
1829
.38
49.2
449
0.33
69.1
028
5.59
44.2
117
2.96
32.9
70.
000.
000.
0023
608.
8511
492.
9774
05.6
434
73.0
012
37.2
448
.68
262.
9735
.15
195.
1237
.54
170.
7224
.15
141.
290.
0012
3.80
1980
9.03
1006
6.45
6055
.02
3034
.56
653.
0050
.82
483.
1977
.34
330.
4458
.40
225.
4976
.15
197.
010.
000.
0095
81.7
446
65.7
925
39.0
913
78.1
199
8.74
48.6
929
7.57
42.3
217
6.68
27.4
811
1.00
22.0
189
.90
0.00
0.00
9545
.91
3953
.55
2756
.07
1972
.06
864.
2241
.42
759.
1086
.29
398.
8472
.68
311.
5128
8.70
284.
740.
000.
0053
490.
1226
638.
4316
777.
3781
62.4
519
11.8
749
.80
203.
2435
.06
210.
3835
.74
131.
1831
.01
116.
280.
000.
0068
82.9
929
88.6
320
05.3
411
95.0
769
3.95
43.4
212
44.2
817
6.37
730.
6011
3.32
537.
4910
2.52
451.
690.
000.
0055
466.
3928
520.
2815
934.
2386
74.4
623
37.4
151
.42
296.
4035
.96
155.
8122
.51
86.8
20.
000.
000.
000.
0022
241.
1511
187.
7068
04.1
734
22.5
182
6.77
50.3
010
74.3
910
6.87
488.
7075
.00
361.
4770
.63
313.
300.
000.
0067
707.
1734
825.
1521
212.
4495
35.6
021
33.9
951
.43
666.
050.
0049
5.04
327.
9331
9.35
160.
200.
0027
6.48
0.00
4913
3.94
2332
1.54
1384
9.79
7437
.26
4525
.35
47.4
730
.03
73.9
734
8.16
64.8
130
2.65
65.8
527
1.64
59.9
527
4.12
1014
8.84
4778
.42
2810
.59
1516
.89
1042
.94
47.0
891
2.51
99.5
042
4.81
65.2
530
3.42
57.6
725
8.08
0.00
0.00
5368
0.61
2873
4.50
1643
7.03
6656
.59
1852
.49
53.5
364
6.18
76.3
633
5.47
53.6
820
9.35
40.3
616
1.67
0.00
0.00
3935
8.93
1956
6.48
1343
8.31
4757
.79
1596
.35
49.7
136
6.08
40.1
119
2.74
29.8
212
4.84
27.2
910
9.57
23.6
111
0.50
6939
9.08
3075
1.55
2576
3.55
1059
6.34
2287
.63
44.3
140
1.31
72.4
729
6.71
58.8
823
7.96
53.1
920
6.55
0.00
0.00
9332
.72
4406
.59
2608
.16
1398
.24
919.
7347
.22
486.
2077
.68
333.
3360
.88
267.
5156
.05
247.
360.
0025
9.35
1190
1.57
5705
.95
3582
.13
1771
.92
841.
5747
.94
565.
3175
.65
315.
2952
.34
213.
5441
.40
168.
080.
000.
0032
850.
1916
129.
6910
277.
0547
67.3
816
76.0
749
.10
878.
1914
0.48
697.
7312
3.75
600.
6511
8.21
516.
810.
000.
0022
188.
3088
10.7
453
26.3
361
49.2
419
01.9
839
.71
316.
7730
.25
167.
1729
.33
127.
3912
.04
110.
560.
0098
.82
6041
8.63
2765
5.78
2217
3.47
9684
.16
905.
2145
.77
360.
2335
.43
174.
7424
.74
102.
610.
0081
.93
0.00
0.00
3208
6.79
1466
2.61
1027
4.20
5667
.18
1482
.80
45.7
083
7.29
66.2
933
0.90
61.4
321
4.53
46.5
919
3.72
0.00
0.00
5931
9.62
2814
6.12
1884
1.35
9068
.76
3263
.39
47.4
578
6.73
78.6
740
1.99
58.6
525
9.68
50.2
119
2.33
192.
330.
0043
165.
4220
087.
5413
620.
4975
99.4
318
57.9
646
.54
1167
.50
151.
8881
2.31
24.5
577
8.81
248.
9964
1.97
137.
6469
9.04
3037
0.62
1611
7.06
7681
.09
3585
.87
2986
.60
53.0
741
9.15
64.9
027
7.96
46.4
619
2.47
38.9
814
1.01
0.00
0.00
1031
4.66
5167
.72
2766
.31
1515
.37
865.
2650
.10

258
994.
9411
6.44
537.
2019
.53
394.
9374
.85
291.
100.
000.
0038
628.
4219
697.
7611
647.
7156
28.9
816
53.9
850
.99
1225
.13
134.
4866
9.09
147.
8451
1.94
107.
0439
1.86
0.00
0.00
8841
4.13
4426
9.43
2769
1.14
1319
7.65
3255
.92
50.0
781
0.80
122.
7953
3.04
89.2
939
1.76
158.
2231
0.65
0.00
0.00
2609
5.28
1174
5.14
7193
.14
5231
.59
1925
.42
45.0
125
8.60
41.7
824
7.81
36.7
014
8.34
28.9
610
8.40
0.00
34.1
372
88.1
732
35.0
622
50.0
510
46.1
075
6.97
44.3
978
7.81
79.2
035
5.91
48.9
722
9.90
41.5
50.
000.
000.
0040
464.
8420
257.
2812
189.
2363
57.3
116
61.0
250
.06
389.
9247
.74
150.
4060
.45
234.
8624
.58
0.00
212.
7649
.27
8803
.39
4156
.66
2354
.86
1448
.49
843.
3847
.22
575.
8255
.05
269.
7542
.51
174.
4233
.73
0.00
0.00
0.00
4293
2.38
1986
6.55
1438
0.17
6606
.27
2079
.39
46.2
744
4.83
51.6
122
4.38
30.0
613
4.72
27.8
80.
000.
000.
0026
920.
7811
118.
0090
13.3
348
63.0
019
26.4
541
.30
1269
.52
100.
5850
6.94
92.8
235
7.86
82.3
732
2.58
61.4
60.
0043
716.
0420
677.
7713
355.
9666
35.5
430
46.7
747
.30
2142
.93
189.
2691
2.63
0.00
0.00
0.00
0.00
0.00
0.00
8982
5.93
4400
3.69
2855
0.81
1225
1.93
5019
.51
48.9
931
1.17
51.3
220
6.11
0.00
18.5
00.
000.
000.
000.
0052
21.5
726
42.9
313
71.1
956
1.18
646.
2750
.62
1549
.71
140.
7973
6.11
0.00
0.00
0.00
0.00
0.00
0.00
5064
3.77
2318
7.06
1535
0.03
8550
.04
3556
.64
45.7
855
7.74
63.6
925
9.23
0.00
0.00
0.00
0.00
0.00
0.00
1967
5.02
9567
.00
5608
.78
3064
.44
1434
.80
48.6
314
89.1
314
2.85
769.
650.
000.
000.
000.
000.
000.
0082
794.
7738
980.
2226
068.
6313
472.
3442
73.5
947
.08
946.
8214
6.64
556.
120.
0041
.29
70.6
60.
000.
000.
0014
685.
1371
02.7
640
51.4
117
92.3
717
38.5
948
.37
720.
7011
2.45
528.
1979
.33
386.
1484
.81
329.
290.
000.
0014
260.
0867
05.3
835
29.0
825
30.1
514
95.4
747
.02
767.
4590
.21
327.
7752
.89
249.
1749
.25
214.
540.
0019
5.17
9532
1.12
4222
8.03
3178
1.79
1684
5.82
4465
.48
44.3
072
2.66
56.8
00.
0064
.24
325.
3946
.30
0.00
277.
800.
0013
855.
0467
42.9
641
79.8
013
29.3
516
02.9
348
.67
1376
.76
155.
4078
5.85
144.
2774
3.84
149.
7670
7.86
151.
6068
1.65
8572
4.49
3750
0.76
2683
8.43
1749
7.02
3888
.28
43.7
546
.28
59.0
634
0.25
54.7
327
9.24
54.3
523
3.93
0.00
193.
3020
252.
3889
16.1
563
73.6
837
26.0
612
36.4
944
.03
1321
.39
154.
7083
0.99
92.0
172
0.83
88.9
239
5.08
0.00
0.00
1182
39.0
749
421.
5926
082.
9737
688.
7650
45.7
541
.80
898.
0614
7.93
597.
0793
.72
439.
1683
.13
371.
010.
0077
.09
1269
6.95
7149
.53
2848
.88
1424
.41
1274
.13
56.3
110
99.8
612
4.29
518.
2677
.42
354.
5371
.03
0.00
0.00
0.00
2710
9.65
1167
5.67
7433
.01
5462
.07
2538
.91
43.0
712
89.0
316
5.56
713.
5514
6.13
420.
6474
.81
276.
700.
000.
0040
626.
6118
354.
7811
295.
4682
05.7
927
70.5
945
.18
1050
.72
125.
2858
1.25
77.1
835
2.31
54.2
634
7.43
0.00
0.00
5055
6.01
2301
7.31
1556
5.28
8826
.61
3146
.81
45.5
357
8.35
107.
2358
3.86
111.
0052
0.24
109.
6443
3.47
88.0
537
2.15
1021
1.94
6027
.32
2195
.91
966.
2310
22.4
859
.02
287.
0843
.11
182.
5131
.36
127.
2420
.25
106.
370.
000.
0066
10.9
832
65.0
417
94.3
880
9.60
741.
9649
.39
1516
.93
171.
2967
0.56
96.8
441
6.43
76.4
429
7.66
0.00
0.00
1121
01.2
456
994.
4434
847.
5616
192.
0240
67.2
250
.84
631.
5695
.47
444.
5180
.92
340.
7930
8.56
301.
700.
000.
0011
304.
2962
52.3
426
27.6
012
92.9
011
31.4
655
.31
1157
.61
116.
5361
7.69
149.
2443
9.40
95.9
342
4.29
96.6
741
1.65
4367
9.82
2134
7.52
1230
3.40
7720
.22
2308
.69
48.8
7

259
% M
ono
Uns
at%
Pol
yuns
at%
Br F
A's
BrO
dd F
APU
FA (3
+)%
BrO
dd F
A%
PUFA
(3+)
SCFA
LCFA
TAR
FA18
PUFA
Bos
hker
Bac
t32
.31
13.3
94.
2012
07.3
643
51.2
73.
0210
.89
1112
7.37
2834
.19
0.25
1003
.57
1280
.70
23.5
613
.64
9.58
1160
.48
1260
.76
8.25
8.96
2815
.23
2978
.77
1.06
317.
0599
7.20
29.0
815
.92
5.06
1062
.25
3836
.22
3.62
13.0
679
15.4
820
58.3
60.
2672
8.19
1049
.12
29.4
515
.19
4.96
1534
.57
4522
.66
3.67
10.8
112
868.
5832
75.7
60.
2513
07.0
113
87.8
225
.94
13.9
010
.43
548.
0944
8.30
9.13
7.47
1188
.47
1059
.24
0.89
130.
0446
3.10
30.4
115
.56
4.79
1385
.16
4309
.16
3.63
11.2
910
458.
2127
81.3
10.
2784
9.56
1268
.72
31.3
714
.71
5.24
941.
1824
36.6
93.
9910
.32
7063
.69
1410
.16
0.20
987.
8396
1.02
30.5
715
.32
3.30
432.
2825
63.0
22.
1812
.94
6227
.24
1183
.96
0.19
522.
9748
6.09
26.5
014
.38
10.4
288
3.48
829.
979.
228.
6618
72.6
317
59.0
20.
9433
9.15
713.
8528
.87
20.6
69.
0572
5.33
1406
.64
7.60
14.7
418
03.4
199
1.56
0.55
260.
7962
1.94
31.3
715
.26
3.57
1332
.20
6544
.68
2.49
12.2
418
109.
3027
01.3
70.
1518
56.2
314
29.5
429
.13
17.3
610
.08
611.
5676
3.96
8.89
11.1
013
76.1
688
8.77
0.65
245.
2349
7.02
28.7
315
.64
4.21
1819
.13
6732
.61
3.28
12.1
417
138.
1841
32.8
00.
2414
25.6
115
99.5
030
.59
15.3
93.
7257
2.98
2935
.35
2.58
13.2
082
83.4
379
6.80
0.10
596.
9062
5.41
31.3
314
.08
3.15
1515
.19
7934
.45
2.24
11.7
227
276.
5930
90.6
80.
1119
62.8
516
48.6
628
.19
15.1
49.
2134
16.5
160
29.4
76.
9512
.27
1286
0.43
2759
.17
0.21
1439
.85
1904
.80
27.6
914
.95
10.2
889
3.49
1088
.14
8.80
10.7
220
09.9
518
07.3
10.
9021
7.16
775.
1730
.62
12.4
03.
4512
58.4
055
05.1
62.
3410
.26
2125
7.12
2622
.04
0.12
1344
.73
1508
.93
34.1
412
.09
4.06
887.
3736
41.3
52.
259.
2515
271.
9318
91.9
10.
1213
18.3
513
22.7
937
.12
15.2
73.
3096
2.48
9186
.41
1.39
13.2
426
624.
7912
63.7
90.
0529
10.2
119
27.4
427
.95
14.9
89.
8581
1.63
768.
698.
708.
2418
32.0
915
84.4
90.
8647
0.10
651.
1830
.10
14.8
97.
0773
3.24
1253
.43
6.16
10.5
323
17.6
621
03.5
70.
9130
3.73
625.
7031
.28
14.5
15.
1012
24.0
937
97.5
83.
7311
.56
1060
6.85
1837
.37
0.17
1045
.65
1266
.05
24.0
127
.71
8.57
1678
.32
5003
.77
7.56
22.5
529
95.7
937
63.6
91.
2659
0.36
1253
.17
36.7
016
.03
1.50
821.
4886
15.1
91.
3614
.26
2378
9.48
1113
.27
0.05
2224
.94
735.
9932
.02
17.6
64.
6285
8.98
4650
.27
2.68
14.4
911
653.
2498
9.34
0.08
1156
.78
1232
.05
31.7
615
.29
5.50
2428
.55
6929
.02
4.09
11.6
821
391.
6921
56.1
30.
1020
11.1
121
43.5
731
.55
17.6
14.
3013
87.6
860
66.0
53.
2114
.05
1326
1.54
2544
.20
0.19
1397
.76
1443
.00
25.2
911
.81
9.83
2580
.22
1816
.17
8.50
5.98
6885
.37
5591
.01
0.81
768.
3322
05.6
726
.82
14.6
98.
3972
8.49
1162
.15
7.06
11.2
726
08.1
214
20.5
80.
5433
3.66
592.
36

260
30.1
514
.57
4.28
1307
.91
4349
.61
3.39
11.2
614
690.
1529
17.8
30.
2012
73.0
612
32.6
431
.32
14.9
33.
6826
16.3
380
37.1
52.
969.
0932
650.
5261
63.9
60.
1933
51.1
320
39.6
427
.56
20.0
57.
3815
86.7
940
73.9
56.
0815
.61
6206
.46
3033
.82
0.49
851.
5912
94.6
930
.87
14.3
510
.39
654.
2057
3.56
8.98
7.87
1323
.08
1094
.32
0.83
141.
0552
4.61
30.1
215
.71
4.10
1231
.26
5117
.27
3.04
12.6
512
650.
1119
87.4
70.
1611
77.6
013
16.1
126
.75
16.4
59.
5875
6.71
1144
.92
8.60
13.0
117
78.9
914
31.6
30.
8011
6.20
594.
0333
.49
15.3
94.
8414
65.4
453
26.1
13.
4112
.41
1503
4.39
1575
.96
0.10
1268
.18
1648
.93
33.4
818
.06
7.16
1331
.62
3676
.86
4.95
13.6
680
50.0
211
74.6
60.
1510
19.5
615
05.1
230
.55
15.1
86.
9722
56.2
751
99.4
85.
1611
.89
1223
2.56
3394
.78
0.28
1017
.65
2455
.44
31.7
813
.64
5.59
3643
.62
9466
.44
4.06
10.5
429
769.
9849
89.5
60.
1721
47.0
937
88.5
326
.26
10.7
512
.38
557.
2531
5.20
10.6
76.
0411
64.6
279
1.67
0.68
73.7
345
5.31
30.3
116
.88
7.02
2552
.90
6927
.01
5.04
13.6
813
462.
6331
44.4
10.
2310
84.3
228
61.2
728
.51
15.5
87.
2910
49.5
123
46.6
15.
3311
.93
6196
.18
1203
.01
0.19
510.
5611
01.2
131
.49
16.2
75.
1627
60.6
792
07.3
93.
3311
.12
2841
7.12
3216
.15
0.11
2012
.81
3343
.08
27.5
912
.21
11.8
415
17.3
411
71.4
210
.33
7.98
3166
.42
2366
.85
0.75
179.
9811
50.0
724
.75
17.7
410
.49
1323
.62
1160
.98
9.28
8.14
2357
.65
2838
.83
1.20
587.
5385
8.36
33.3
417
.67
4.68
2601
.16
1498
5.87
2.73
15.7
229
641.
3023
88.8
50.
0829
30.8
134
67.6
330
.17
9.59
11.5
714
11.7
310
80.9
910
.19
7.80
3224
.97
1999
.78
0.62
248.
3610
57.7
531
.31
20.4
14.
5430
10.0
214
575.
453.
5117
.00
2194
4.14
5997
.01
0.27
2329
.18
2758
.02
31.4
718
.40
6.11
992.
1930
49.1
74.
9015
.06
5093
.70
1518
.91
0.30
464.
4992
8.87
22.0
631
.88
4.27
4476
.52
3006
7.38
3.79
25.4
335
926.
0451
49.4
60.
1411
409.
5741
09.5
122
.44
11.2
210
.03
1095
.43
885.
628.
636.
9825
51.1
432
56.7
31.
2828
4.04
907.
4527
.42
20.1
59.
3720
35.0
928
53.0
37.
5110
.52
6068
.67
2905
.56
0.48
2251
.36
2058
.23
27.8
020
.20
6.82
2106
.91
5307
.59
5.19
13.0
610
304.
7238
22.6
80.
3721
32.5
922
33.7
530
.79
17.4
66.
2225
66.8
868
17.4
35.
0813
.48
1312
5.55
3246
.69
0.25
1653
.39
2516
.24
21.5
09.
4610
.01
902.
8050
6.57
8.84
4.96
1812
.06
3218
.77
1.78
186.
6564
7.08
27.1
412
.25
11.2
261
8.31
452.
819.
356.
8513
94.9
710
08.7
80.
7212
8.22
570.
7931
.09
14.4
43.
6331
90.5
813
198.
122.
8511
.77
3011
2.92
4147
.31
0.14
3423
.41
3073
.63
23.2
411
.44
10.0
198
7.68
713.
188.
746.
3121
35.8
126
29.6
11.
2324
3.38
806.
8028
.17
17.6
75.
2920
33.8
464
84.0
44.
6614
.84
1223
6.06
4351
.06
0.36
1524
.00
1749
.07

261
%SC
FA%
LCFA
%18
PUFA
%B
oshk
erB
act
27.8
67.
102.
513.
2120
.01
21.1
72.
257.
0926
.95
7.01
2.48
3.57
30.7
77.
833.
123.
3219
.80
17.6
52.
177.
7227
.41
7.29
2.23
3.33
29.9
25.
974.
184.
0731
.44
5.98
2.64
2.45
19.5
418
.36
3.54
7.45
18.8
910
.39
2.73
6.52
33.8
65.
053.
472.
6719
.99
12.9
13.
567.
2230
.90
7.45
2.57
2.88
37.2
43.
582.
682.
8140
.29
4.56
2.90
2.43
26.1
75.
622.
933.
8819
.80
17.8
12.
147.
6439
.60
4.88
2.51
2.81
38.8
04.
813.
353.
3638
.36
1.82
4.19
2.78
19.6
316
.98
5.04
6.98
19.4
717
.67
2.55
5.26
32.2
95.
593.
183.
8513
.50
16.9
62.
665.
6539
.37
1.84
3.68
1.22
36.3
23.
083.
613.
8436
.06
3.63
3.39
3.61
30.7
25.
893.
243.
3422
.67
18.4
12.
537.
2625
.29
13.7
73.
235.
74

262
38.0
37.
553.
303.
1936
.93
6.97
3.79
2.31
23.7
811
.63
3.26
4.96
18.1
515
.01
1.94
7.20
31.2
64.
912.
913.
2520
.21
16.2
61.
326.
7535
.02
3.67
2.95
3.84
29.9
04.
363.
795.
5927
.98
7.77
2.33
5.62
33.1
45.
552.
394.
2222
.30
15.1
61.
418.
7226
.58
6.21
2.14
5.65
31.4
96.
112.
595.
6034
.32
3.88
2.43
4.04
21.5
616
.12
1.23
7.83
16.5
319
.91
4.12
6.02
31.1
02.
513.
073.
6423
.28
14.4
31.
797.
6325
.60
7.00
2.72
3.22
25.1
57.
502.
294.
5930
.38
4.36
9.65
3.48
20.0
925
.65
2.24
7.15
22.3
910
.72
8.30
7.59
25.3
69.
415.
255.
5025
.96
6.42
3.27
4.98
17.7
431
.52
1.83
6.34
21.1
015
.26
1.94
8.63
26.8
63.
703.
052.
7418
.89
23.2
62.
157.
1428
.01
9.96
3.49
4.00

263
APP
EN
DIX
F:
CH
APT
ER
4 B
UL
K, T
HA
A IS
OTO
PE D
ATA
Uni
ts a
re n
mol
13C
(or 15
N) g
dw-1.
Day
Mes
oTr
eatm
Bul
k15N
Bul
k13C
Dal
a15N
THA
A15
ND
Lala
15N
Dal
a13C
THA
A13
CD
Lala
13C
Mac
ro15
NM
acro
13C
1.5
2M
LS52
.87
467.
641.
54
NLS
112.
0558
0.43
0.16
66.4
40.
020.
2114
0.51
0.01
1.5
6N
DP
3.31
1.10
0.03
1.40
0.01
2.07
1.5
7M
LP19
1.95
268.
190.
1873
.80
0.02
0.12
59.4
10.
021.
510
MLS
37.6
122
5.73
0.06
21.4
50.
020.
0537
.43
0.01
1.5
11N
LS11
7.13
645.
800.
1362
.75
0.01
0.13
80.5
00.
011.
512
ND
S7.
284.
280.
034.
050.
060.
015.
721.
514
ND
S4.
673.
600.
022.
490.
050.
014.
221.
516
NLP
169.
7245
3.13
0.16
76.2
60.
020.
1372
.55
0.01
1.5
18N
DP
12.3
16.
360.
022.
610.
050.
013.
611.
525
NLP
169.
7245
3.13
0.36
151.
820.
020.
2514
5.65
0.01
1.5
26M
LP13
5.81
173.
373.
52
MLS
108.
7713
74.1
60.
1580
.74
0.01
0.50
408.
200.
013.
54
NLS
161.
7412
85.8
70.
2714
9.57
0.02
0.60
423.
840.
013.
56
ND
P11
.14
3.88
0.03
6.62
0.05
0.03
7.15
3.5
7M
LP19
2.80
511.
120.
2510
5.32
0.02
0.25
117.
550.
023.
510
MLS
19.1
414
9.67
0.03
13.3
00.
020.
0758
.38
0.01
3.5
11N
LS10
4.18
753.
380.
1789
.53
0.01
0.19
182.
370.
013.
512
ND
S7.
758.
320.
036.
230.
040.
017.
623.
514
ND
S15
.73
16.2
50.
002.
553.
516
NLP
83.4
737
4.01
0.14
67.9
90.
010.
1394
.59
0.01
3.5
18N
DP
18.7
814
.18
0.04
9.98
0.03
0.02
10.9
00.
013.
525
NLP
526.
3716
23.0
81.
2734
5.29
0.03
0.94
442.
290.
023.
526
MLP
75.2
914
2.80
7.5
2M
LS26
1.94
3102
.10
0.34
139.
410.
021.
2767
1.75
0.01
6342
7.91
9413
48.7
97.
54
NLS
305.
6321
03.2
50.
3715
3.40
0.02
0.96
572.
670.
027.
56
ND
P34
.21
19.0
60.
0715
.79
0.03
0.02
9.28
0.02
7.5
7M
LP32
7.38
945.
270.
4316
5.81
0.02
0.35
182.
830.
0279
46.9
113
9798
.36
7.5
10M
LS10
1.99
1010
.09
0.12
41.6
60.
020.
2822
0.84
0.01
5902
1.16
8046
18.3
97.
511
NLS
370.
1227
83.0
80.
4921
3.33
0.02
0.94
571.
530.
01

264
7.5
12N
DS
26.2
327
.55
0.07
13.3
60.
040.
0413
.33
0.03
7.5
14N
DS
15.7
316
.25
0.04
6.61
0.04
0.01
8.16
0.02
7.5
16N
LP27
8.38
628.
950.
2311
9.33
0.02
0.20
131.
280.
017.
518
ND
P16
0.00
86.9
10.
3061
.65
0.03
0.11
36.3
20.
027.
525
NLP
769.
6516
45.4
90.
9434
2.63
0.02
0.63
323.
680.
027.
526
MLP
607.
7611
11.9
953
373.
0229
8756
.10
14.5
2M
LS46
8.14
4678
.03
1.06
285.
270.
033.
3414
66.5
50.
0224
293.
5076
8348
.79
14.5
4N
LS63
3.46
4573
.14
1.19
397.
250.
022.
8215
45.7
20.
0214
.56
ND
P17
.19
6.51
0.07
7.91
0.06
0.03
10.3
40.
0214
.57
MLP
172.
8540
5.80
0.23
77.9
80.
020.
2196
.76
0.02
4183
8.01
2743
70.2
314
.510
MLS
389.
1128
32.8
70.
5018
3.06
0.02
1.15
593.
110.
0249
489.
1611
7976
8.83
14.5
11N
LS77
7.41
6740
.35
0.97
357.
420.
021.
9911
16.1
50.
0214
.512
ND
S49
.95
89.5
40.
1524
.58
0.04
0.11
38.0
10.
0214
.514
ND
S22
.80
43.0
50.
059.
370.
040.
0414
.88
0.02
14.5
16N
LP13
43.3
041
39.4
21.
8863
6.86
0.02
1.58
795.
790.
0214
.518
ND
P92
.95
99.0
30.
2035
.68
0.04
0.10
28.9
40.
0314
.525
NLP
2568
.09
7580
.88
4.19
1472
.53
0.02
3.41
1864
.19
0.02
14.5
26M
LP76
4.43
1169
.01
1305
85.1
586
3112
.55
16.5
2M
LS0.
2943
56.3
416
.54
NLS
702.
7448
74.4
716
.56
ND
P82
.34
85.5
616
.57
MLP
914.
1816
34.1
916
.510
MLS
462.
8727
62.4
916
.511
NLS
604.
8337
80.1
116
.512
ND
S53
.79
83.1
716
.514
ND
S15
.01
24.1
416
.516
NLP
854.
7324
73.8
316
.518
ND
P16
1.11
136.
2116
.525
NLP
2288
.79
5835
.80
16.5
26M
LP15
40.0
435
74.8
821
.02
MLS
883.
7860
92.5
31.
4442
5.52
0.02
3.13
1451
.36
0.02
6547
8.64
5836
67.9
621
.04
NLS
828.
6560
36.1
30.
9842
7.18
0.02
2.37
1528
.84
0.02
21.0
6N
DP
127.
3210
7.88
0.31
63.4
10.
040.
1135
.57
0.03
21.0
7M
LP13
06.5
528
69.9
21.
7161
4.34
0.02
1.62
747.
060.
0212
3597
.66
5316
93.2
921
.010
MLS
402.
6231
54.4
30.
3717
8.73
0.02
0.91
640.
530.
0170
025.
5911
3816
5.83

265
21.0
11N
LS10
74.0
869
68.7
01.
6256
7.02
0.02
3.35
1836
.48
0.02
21.0
12N
DS
110.
9217
5.34
0.35
57.2
20.
040.
1663
.56
0.02
21.0
14N
DS
79.3
615
0.25
0.25
39.2
40.
050.
1750
.92
0.03
21.0
16N
LP22
48.2
459
33.1
32.
7312
20.8
10.
022.
2015
91.3
40.
0121
.018
ND
P14
7.04
155.
010.
4583
.41
0.04
0.18
65.0
30.
0321
.025
NLP
2052
.36
5456
.09
2.80
1167
.20
0.02
2.69
1415
.19
0.02
21.0
26M
LP73
3.50
1263
.19
2847
15.9
595
7420
.82
29.0
2M
LS61
9.87
3504
.55
6389
4.02
7723
71.7
529
.04
NLS
393.
0422
54.8
929
.06
ND
P13
3.62
104.
7529
.07
MLP
1501
.42
3348
.37
1241
70.2
147
5762
.66
29.0
10M
LS50
6.46
2596
.09
4342
7.36
5529
41.1
429
.011
NLS
1066
.57
4735
.59
29.0
12N
DS
56.1
098
.26
29.0
14N
DS
22.0
339
.56
29.0
16N
LP14
32.1
434
69.0
929
.018
ND
P14
9.26
165.
5929
.025
NLP
1819
.43
4449
.82
29.0
26M
LP83
1.39
2064
.89
1510
89.1
950
2715
.87
42.0
4N
LS49
3.59
2615
.43
1.11
283.
950.
031.
6471
1.32
0.02
42.0
6N
DP
41.1
755
.77
0.13
21.9
00.
050.
0719
.68
0.03
42.0
7M
LP74
7.31
1791
.52
1.71
383.
350.
041.
2445
2.13
0.03
1313
55.1
045
9299
.15
42.0
10M
LS36
6.97
1770
.19
0.62
183.
490.
031.
0347
4.12
0.02
3809
6.71
5424
39.7
142
.011
NLS
788.
2738
51.8
61.
4043
4.46
0.03
2.10
1013
.88
0.02
42.0
12N
DS
48.8
910
2.25
0.12
24.1
60.
040.
0827
.71
0.03
42.0
14N
DS
19.4
144
.50
0.05
8.37
0.05
0.03
12.4
20.
0342
.016
NLP
1164
.18
2568
.05
3.09
610.
440.
041.
6162
0.72
0.03
42.0
18N
DP
170.
0119
8.92
0.52
80.7
60.
050.
2363
.71
0.04
42.0
25N
LP15
11.2
335
78.5
23.
0273
4.83
0.03
2.25
848.
910.
03

266
APPENDIX G: CHAPTER 4 PLFA ISOTOPE DATAUnits are nmol 13C gdw-1
4 12 2 4 6 7 10 11 1212:0 0.00 0.01 0.03 0.00 0.02 0.01 0.00i13a13 0.00 0.00 0.00 0.00 0.0013:0 0.01 0.01 0.00 0.01 0.00 0.00i14 0.01 0.02 0.00 0.02 0.01 0.0014:1w9 0.00 0.00 0.0014:1w7 0.00 0.00 0.00 0.0014:0 0.00 0.00 1.35 3.67 0.01 0.59 0.56 1.70 0.01i15 0.00 0.00 0.03 0.04 0.00 0.02 0.02 0.02 0.00a15 0.00 0.00 0.01 0.03 0.00 0.01 0.01 0.01 0.0015:1 0.00 0.04 0.03 0.00 0.02 0.01 0.00 0.0015:0 0.00 0.00 0.42 1.12 0.00 0.83 0.13 0.69 0.0016:4*16:3* 0.02 0.0016:2*i16 0.00 0.00 0.19 0.24 0.00 0.04 0.04 0.15 0.0016:1w916:1w7 -0.02 0.00 4.59 10.49 0.02 2.04 1.97 5.99 0.0316:1w5 0.00 0.00 0.10 0.19 0.00 0.04 0.04 0.09 0.0016:0 -0.01 0.00 6.47 14.00 0.03 3.31 3.00 7.59 0.0310Me17br 0.04 0.08 0.00 0.02 0.02 0.00i17 0.00 0.00 0.05 0.07 0.00 0.01 0.01 0.02 0.00a1717:1 0.00 0.00 0.18 0.36 0.00 0.25 0.07 0.19 0.0017:0 0.00 0.08 0.09 0.00 0.05 0.03 0.06 0.0018:3w6 0.00 0.05 0.06 0.00 0.02 0.02 0.13 0.0018:4 0.00 0.00 0.15 0.00 0.08 0.1918:2w6 0.15 0.24 0.06 0.10 0.13 0.0018:3w318:1w9cis 0.00 0.00 0.21 0.44 0.00 0.13 0.12 0.26 0.0018:2w318:1w9t 0.00 0.00 0.24 0.32 0.00 0.11 0.08 0.17 0.0118:1w718:1w518:0 0.00 0.00 0.19 0.32 0.00 0.08 0.08 0.16 0.0010Me19br 0.00 0.01 0.01 0.00 0.00 0.01 0.00i19* 0.00 0.01 0.00 0.00a19*19:1* 0.00 0.00 0.01 0.00 0.00 0.00 0.00 0.0019:0 i.s. 0.00 0.00 0.02 0.02 0.00 0.01 0.01 0.02 0.0020:5w620:4w6 0.00 0.00 0.16 0.13 0.00 0.06 0.07 0.19 0.0020:5w3 -0.01 0.00 0.97 1.69 0.00 0.33 0.30 1.10 0.0020:3w6 0.03 0.01 0.0320:4w3 0.00 0.00 0.03 0.05 0.01 0.0320:2*20:3w320:1w9 0.00 0.00 0.04 0.04 0.00 0.01 0.01 0.03 0.00
T-1M T1.5M

267
20:1w7 0.00 0.02 0.03 0.00 0.01 0.01 0.00 0.0020:1w520:0 i.s. 0.00 0.00 0.06 0.15 0.00 0.03 0.03 0.06 0.0021:0 i.s. 0.00 0.00 0.03 0.04 0.00 0.01 0.02 0.03 0.0022:6w6*22:6w3 0.00 0.00 0.10 0.14 0.00 0.03 0.02 0.10 0.0022:5w6*22:5w3* 0.00 0.00 0.02 0.04 0.00 0.01 0.01 0.02 0.0022:2* 0.00 0.01 0.04 0.00 0.01 0.00 0.01 0.0022:1w922:1w7*22:0 0.00 0.00 0.07 0.12 0.00 0.02 0.02 0.03 0.0023:0 i.s. 0.00 0.00 0.02 0.04 0.00 0.01 0.02 0.03 0.0024:1 0.00 0.02 0.04 0.00 0.03 0.00 0.0024:0 0.00 0.00 0.13 0.10 0.00 0.05 0.03 0.05 0.0025:026:0 0.00 0.00 0.02 0.03 0.00 0.01 0.01 0.02 0.00
Total -0.04 0.01 16.25 34.28 0.07 8.26 6.88 19.17 0.10Sat FA's -0.01 0.00 8.74 19.47 0.04 4.98 3.86 10.31 0.05Mono Unsat -0.02 0.00 5.45 11.93 0.03 2.64 2.31 6.74 0.04Polyunsat -0.01 0.00 1.71 2.39 0.00 0.53 0.60 1.92 0.00Br FA's 0.00 0.00 0.35 0.48 0.00 0.12 0.11 0.20 0.01% Sat FA's 26.05 38.82 53.80 56.81 53.82 60.23 56.12 53.78 52.59% Mono Unsat 55.37 38.49 33.57 34.81 39.22 31.94 33.65 35.16 39.90% Polyunsat 17.79 19.32 10.49 6.96 4.88 6.42 8.69 10.03 0.48% Br FA's 0.79 3.38 2.14 1.41 2.08 1.40 1.54 1.04 7.03BrOdd FA 0.00 0.00 0.15 0.22 0.00 0.06 0.06 0.05 0.00PUFA (3+) -0.01 0.00 1.55 2.11 0.00 0.46 0.50 1.78 0.00%BrOdd FA 0.71 3.29 0.94 0.66 1.21 0.75 0.83 0.28 4.55%PUFA (3+) 17.79 19.32 9.52 6.15 5.18 5.52 7.25 9.30 1.38SCFA -0.01 0.00 7.83 17.69 0.04 3.91 3.56 9.29 0.04LCFA 0.00 0.00 0.22 0.25 0.00 0.08 0.07 0.10 0.00TARFA 0.07 0.28 0.03 0.01 -0.01 0.02 0.02 0.01 0.0418PUFA 0.00 0.00 0.35 0.29 0.00 0.08 0.19 0.45 0.00BoshkerBact 0.00 0.00 0.23 0.32 0.00 0.08 0.07 0.17 0.01%SCFA 31.00 34.49 48.21 51.61 49.89 47.35 51.78 48.47 42.48%LCFA 2.12 9.51 1.34 0.73 -0.45 1.02 0.96 0.54 1.89%18PUFA 1.32 0.85 2.16 0.86 0.22 0.98 2.81 2.34 -0.82%BoshkerBact 0.92 3.80 1.43 0.94 1.79 0.97 1.05 0.91 5.99C20 PUFA 1.13 1.81 0.00 0.39 0.37 1.29 0.00c20+c22pufa 3+ -0.01 0.00 1.32 2.05 0.00 0.44 0.40 1.47 0.00%c20+c22pufa3+ 16.46 18.47 8.12 5.98 4.96 5.27 5.82 7.65 1.31BAR 0.09 0.10 0.19 0.12 0.10 0.03 0.77

268
14 16 18 25 26 2 4 6 7 10 110.00 0.01 0.00 0.06 0.00 0.03
0.00 0.00 0.00 0.000.00 0.01 0.00 0.07 0.00 0.010.00 0.01 0.00 0.00 0.00 0.03
0.00 0.00 0.00 0.00 0.030.01 2.85 0.01 2.60 1.08 18.67 6.23 0.07 4.16 8.04 20.670.00 0.03 0.00 0.05 0.03 0.84 0.58 0.01 0.25 0.22 0.450.00 0.02 0.00 0.03 0.02 0.25 0.20 0.00 0.11 0.08 0.260.00 0.06 0.08 0.000.00 1.92 0.00 1.32 0.42 2.75 6.26 0.01 2.09 0.58 2.26
0.00 0.00
0.00 0.14 0.00 0.15 0.06 0.89 2.30 0.00 0.31 0.69 3.45
0.02 8.39 0.02 8.74 4.03 50.42 1.06 0.29 11.80 25.09 66.460.00 0.16 0.00 0.23 0.08 0.00 0.01 0.26 0.450.01 11.61 0.02 14.81 5.37 73.81 29.04 0.26 18.85 30.40 59.520.00 0.09 0.00 0.11 0.00 0.150.00 0.04 0.00 0.14 0.03 0.35 0.27 0.00 0.09 0.12 0.24
0.00 0.67 0.00 0.67 0.23 1.66 0.58 0.01 0.88 0.40 1.220.00 0.15 0.00 0.24 0.81 0.71 0.00 0.32 0.17 0.640.00 0.09 0.00 0.80 0.18 0.00 0.36 2.720.00 0.32 0.30 0.11 1.73 0.01 0.36 0.44 1.630.00 0.28 0.15 2.50 0.57 1.37 3.78
0.00 0.44 0.00 0.63 0.26 2.75 2.10 0.02 0.71 0.91 2.97
0.00 0.27 0.01 0.44 0.21 3.65 3.79 0.04 1.07 1.17 2.80
0.00 0.21 0.00 0.34 0.15 2.57 1.77 0.01 0.60 0.79 2.380.00 0.02 0.00 0.02 0.12 0.09 0.00 0.410.00 0.01 0.00
0.00 0.01 0.00 0.01 0.08 0.00 0.03 0.040.00 0.02 0.00 0.05 0.02 0.32 0.15 0.00 0.09 0.08 0.23
0.00 0.25 0.00 0.34 0.20 2.39 0.72 0.02 0.58 0.84 5.370.00 1.59 0.00 1.56 0.58 10.52 7.21 0.05 2.23 3.14 13.83
0.03 0.08 0.39 0.07 0.14 0.780.00 0.04 0.10 0.08 0.00 0.07 0.45
0.00
0.00 0.05 0.07 0.06 0.54 0.34 0.00 0.17 0.21 0.83
T1.5M T7.5M

269
0.00 0.05 0.00 0.00 0.00 0.19
0.00 0.09 0.00 0.22 0.07 1.30 0.48 0.00 0.30 0.29 0.650.00 0.05 0.00 0.12 0.05 0.92 0.36 0.00 0.17 0.23 0.98
0.00 0.17 0.00 0.19 0.04 1.30 1.54 0.01 0.30 0.17 1.38
0.00 0.04 0.00 0.07 0.34 0.32 0.00 0.10 0.07 0.420.00 0.01 0.00 0.02 0.23 0.00 0.03 0.06
0.00 0.07 0.00 0.12 0.03 0.72 0.61 0.00 0.15 0.20 0.330.00 0.05 0.00 0.11 0.04 0.55 0.30 0.00 0.14 0.34 0.43
0.01 0.00 0.01 0.11 0.00 0.03 0.000.00 0.09 0.00 0.20 0.05 1.19 0.51 0.00 0.35 0.39 0.52
0.00 0.03 0.00 0.11 0.02 0.30 0.14 0.00 0.10 0.11 0.21
0.05 30.21 0.07 33.58 13.29 182.34 67.21 0.82 46.52 77.05 196.110.02 16.94 0.04 19.75 7.12 100.82 45.39 0.36 26.63 40.72 86.530.03 10.11 0.03 10.87 4.87 59.10 7.97 0.36 14.91 28.45 74.360.00 2.81 0.00 2.57 1.16 19.97 10.28 0.08 4.23 6.60 30.410.00 0.35 0.01 0.39 0.13 2.45 3.57 0.02 0.75 1.29 4.81
45.95 56.08 54.46 58.81 53.59 55.29 67.53 43.39 57.24 52.84 44.1251.82 33.45 37.91 32.38 36.65 32.41 11.86 44.35 32.05 36.92 37.92-4.99 9.31 -0.23 7.66 8.75 10.95 15.30 9.79 9.09 8.56 15.517.22 1.15 7.86 1.16 1.01 1.34 5.31 2.46 1.62 1.67 2.450.00 0.20 0.00 0.24 0.07 1.55 1.26 0.01 0.45 0.57 1.370.00 2.52 0.00 2.55 1.02 17.47 10.05 0.08 3.63 5.22 26.575.73 0.67 5.33 0.71 0.54 0.85 1.88 1.81 0.96 0.74 0.70
-2.55 8.35 0.50 7.61 7.64 9.58 14.95 9.73 7.81 6.78 13.550.02 14.47 0.03 17.42 6.45 92.48 35.33 0.33 23.01 38.46 80.190.00 0.19 0.00 0.44 0.10 2.21 1.26 0.00 0.61 0.70 1.06
-0.01 0.01 0.04 0.03 0.02 0.02 0.04 0.00 0.03 0.02 0.010.00 0.69 0.00 0.30 0.26 5.03 0.18 0.01 0.93 2.17 8.130.00 0.20 0.01 0.23 0.11 1.97 3.09 0.01 0.66 1.03 4.16
38.25 47.90 43.82 51.87 48.53 50.72 52.57 40.07 49.46 49.92 40.89-0.23 0.62 1.90 1.30 0.75 1.21 1.87 0.12 1.30 0.91 0.54-1.53 2.27 0.09 0.89 1.95 2.76 0.27 0.82 2.00 2.82 4.146.21 0.65 7.60 0.69 0.80 1.08 4.60 1.76 1.42 1.33 2.120.00 1.84 0.00 1.90 0.78 12.91 7.93 0.06 2.80 3.98 19.190.00 2.12 0.00 2.25 0.90 14.94 9.86 0.07 3.27 4.43 22.22
-2.42 7.00 0.41 6.72 6.80 8.19 14.68 8.91 7.04 5.75 11.331.80 0.07 0.91 0.08 0.07 0.08 0.11 0.16 0.11 0.10 0.05

270
11 rerun 12 14 16 18 25 25 rerun 26 2 4 60.01 0.00 0.02 0.01 0.14 0.10 0.00
0.00 0.00 0.000.00 0.00 0.02 0.00 0.08 0.07 0.000.01 0.00 0.04 0.01 0.21 0.29 0.00
0.000.04 0.00 0.02 0.03 0.00
21.17 0.04 0.02 2.79 0.08 16.02 16.59 5.02 15.00 7.80 0.020.39 0.01 0.00 0.15 0.03 0.55 0.48 0.26 2.29 1.39 0.000.19 0.01 0.00 0.08 0.03 0.23 0.16 0.14 0.59 0.45 0.00
0.00 0.01 0.002.27 0.02 0.01 2.16 0.03 2.02 1.95 0.83 4.33 4.66 0.00
0.00 0.00 0.00
3.63 0.00 0.00 0.20 0.00 0.00 0.00 0.71 1.46 0.74 0.00
67.82 0.14 0.13 10.93 0.57 44.23 46.90 17.68 47.23 25.43 0.040.01 0.00 0.23 0.03 0.38 0.43 0.96 0.75 0.01
59.99 0.11 0.09 16.66 0.42 47.38 49.22 24.26 59.03 34.27 0.040.00 0.00 0.09 0.01 0.32 0.23 0.00
0.22 0.00 0.00 0.08 0.01 0.21 0.16 0.14 0.52 0.36 0.000.01
1.09 0.01 0.00 0.98 0.04 0.88 0.64 0.75 0.33 2.43 0.000.54 0.00 0.00 0.25 0.04 0.52 0.32 0.36 0.93 0.95 0.002.63 0.00 0.00 0.09 0.00 1.76 1.57 0.59 0.95 0.46 0.001.66 0.00 1.20 1.17 0.56 1.09 1.00 0.003.92 0.01 0.00 0.35 2.47 2.50 1.28 3.25 2.04
2.98 0.01 0.01 0.53 0.03 2.62 2.61 1.13 3.37 2.77 0.00
2.73 0.03 0.03 0.69 0.17 2.79 2.50 1.46 6.92 5.23 0.01
2.22 0.01 0.01 0.41 0.07 1.68 1.46 0.91 4.21 2.78 0.010.37 0.00 0.00 0.03 0.16 0.00 0.00 0.00
0.06
0.00 0.00 0.00 0.04 0.04 0.12 0.11 0.000.18 0.00 0.00 0.05 0.01 0.12 0.04 0.20 0.20 0.19 0.00
5.56 0.00 0.00 0.28 0.03 3.83 3.56 1.20 3.09 2.10 0.0014.26 0.01 0.01 2.16 0.08 10.06 10.20 3.59 10.30 8.58 0.000.79 0.60 0.61 0.17 0.48 0.310.44 0.04 0.40 0.39 0.09 0.33
0.00
0.74 0.00 0.00 0.13 0.94 0.69 0.36 0.91 0.00 0.00
T7.5M T14.5M

271
0.00 0.00 0.00 0.06 0.00 0.00 0.23 0.81 0.00
0.46 0.00 0.00 0.18 0.02 0.58 0.40 0.43 0.64 0.80 0.000.24 0.00 0.00 0.20 0.01 0.57 0.16 0.39 0.52 0.48 0.00
1.42 0.00 0.00 0.28 0.02 1.04 1.03 0.41 1.26 1.62 0.000.18
-0.15 0.00 0.06 0.00 0.33 0.32 0.12 0.83 0.660.06 0.00 0.00 0.01 0.00 0.07 0.07 0.03 0.31 0.11 0.00
0.28 0.00 0.00 0.14 0.01 0.26 0.20 0.16 0.71 0.99 0.000.15 0.01 0.00 0.24 0.01 0.25 0.09 0.30 0.36 0.69 0.000.00 0.00 0.00 0.01 0.00 0.00 0.08 0.16 0.000.41 0.01 0.00 0.14 0.01 0.37 0.29 0.32 1.42 1.14 0.00
0.14 0.01 0.00 0.05 0.01 0.15 0.09 0.13 0.27 0.40 0.00
197.97 0.47 0.35 40.14 1.80 142.86 146.12 63.15 173.20 111.58 0.1687.01 0.21 0.14 22.65 0.69 68.40 70.14 31.99 86.11 53.15 0.0875.39 0.19 0.18 13.56 0.86 51.53 53.75 21.85 60.15 37.70 0.0730.77 0.02 0.02 3.27 0.13 21.77 21.43 8.05 21.55 17.21 0.004.80 0.04 0.01 0.67 0.11 1.15 0.81 1.26 5.39 3.52 0.01
43.95 44.67 39.86 56.41 38.37 47.88 48.00 50.66 49.72 47.63 48.8138.08 41.05 52.20 33.78 47.89 36.07 36.79 34.61 34.73 33.79 42.9215.54 5.02 5.34 8.15 7.49 15.24 14.66 12.74 12.44 15.43 1.402.42 9.27 2.59 1.66 6.25 0.81 0.55 1.99 3.11 3.16 6.881.17 0.03 0.01 0.43 0.09 1.15 0.81 0.54 3.71 2.49 0.01
26.79 0.02 0.02 2.91 0.13 19.23 18.85 6.73 17.99 15.06 0.000.59 6.71 2.09 1.07 5.28 0.81 0.55 0.86 2.14 2.23 5.04
13.53 3.66 4.73 7.25 7.08 13.46 12.90 10.66 10.39 13.50 2.3681.15 0.16 0.12 19.48 0.51 63.39 65.81 29.28 74.16 42.17 0.070.82 0.01 0.00 0.34 0.03 0.78 0.58 0.62 2.40 2.52 0.000.01 0.08 0.01 0.02 0.06 0.01 0.01 0.02 0.03 0.06 -0.028.21 0.01 0.00 0.43 0.00 5.43 5.25 2.43 5.28 3.50 0.004.20 0.04 0.01 0.46 0.08 0.78 0.65 1.12 4.55 2.87 0.01
40.99 34.43 33.79 48.51 28.48 44.37 45.04 46.36 42.82 37.79 42.900.42 2.85 0.30 0.85 1.76 0.55 0.40 0.97 1.38 2.26 -0.704.15 1.29 0.99 1.08 0.00 3.80 3.59 3.84 3.05 3.14 0.182.12 8.15 2.20 1.15 4.44 0.55 0.44 1.77 2.63 2.57 6.05
19.82 0.02 0.01 2.44 0.11 13.89 13.76 4.80 13.39 10.68 0.0022.50 0.02 0.02 2.82 0.13 16.27 16.11 5.59 15.95 13.60 0.0011.37 3.66 4.36 7.04 7.08 11.39 11.02 8.85 9.21 12.19 2.180.04 0.65 0.31 0.13 0.43 0.06 0.04 0.07 0.17 0.14 0.68

272
7 10 11 12 14 16 18 25 26 2 40.02 0.09 0.01 0.05 0.19 0.27
0.01 0.03 0.00 0.00 0.000.01 0.08 0.00 0.02 0.05 0.14
0.03 0.11 0.02 0.13 0.01 0.12 0.47 0.630.00 0.00
0.03 0.00 0.000.56 7.88 16.58 1.74 0.01 5.29 0.06 8.35 6.72 6.90 9.840.10 0.77 1.45 0.07 0.01 0.58 0.02 1.16 0.99 2.88 3.190.06 0.30 0.51 0.03 0.00 0.25 0.02 0.38 0.23 0.78 1.16
0.02 0.00 0.020.34 0.83 3.63 0.12 0.00 7.19 0.03 2.54 0.93 1.28 5.50
0.02 0.25 0.74 0.08 0.00 0.40 0.00 1.03 1.22 1.27 1.50
1.79 28.65 65.50 5.38 0.14 15.73 0.28 30.97 24.10 16.76 23.060.07 0.58 0.14 0.00 0.47 0.04 0.76 0.57 0.90 1.503.33 42.69 86.76 5.86 0.09 27.42 0.25 42.82 22.29 24.94 41.300.05 0.23 0.07 0.00 0.18 0.01 0.25 0.370.05 0.29 0.06 0.00 0.28 0.01 0.30 0.17 0.55 0.77
0.000.17 0.57 0.43 0.08 0.00 3.31 1.44 0.48 1.19 2.850.07 0.35 0.97 0.07 0.00 1.08 0.02 0.67 0.24 0.71 1.84
0.48 1.11 0.03 0.38 0.00 0.55 0.25 0.27 0.560.59 1.55 0.52 0.74 0.391.70 3.81 0.31 1.48 2.00 2.31
0.16 1.56 4.15 0.21 0.01 2.00 0.03 2.74 1.41 2.05 3.59
0.33 3.06 5.23 0.33 0.03 3.23 0.08 6.00 4.02 6.66 10.78
0.26 2.03 4.02 0.20 0.01 1.96 0.04 2.73 1.08 2.42 4.480.01 0.00 0.00 0.00 0.00
0.03 0.00 0.00
0.01 0.06 0.05 0.02 0.00 0.06 0.00 0.17 0.07 0.17 0.140.02 0.16 0.47 0.03 0.00 0.17 0.01 0.21 0.23 0.23 0.43
0.13 1.46 2.56 0.22 0.00 1.73 0.01 2.06 1.83 2.45 3.050.48 5.02 6.98 0.83 0.01 5.10 0.03 6.46 4.32 5.71 7.81
0.53 0.32 0.22 0.150.03 0.26 0.12
0.40 0.04 0.00 0.36 0.01 0.59 0.21 0.66 1.27
T14.5M T6.5P

273
0.04 0.00 0.02 0.00 0.00 0.00 0.00 0.21 0.46
0.10 0.56 1.09 0.10 0.00 0.55 0.01 0.88 0.30 0.77 1.600.08 0.34 1.41 0.05 0.00 0.27 0.01 0.55 0.18 1.20 1.27
0.05 0.63 0.87 0.09 0.00 0.78 0.01 0.77 0.36 0.86 1.23
0.02 0.22 0.62 0.03 0.00 0.39 0.40 0.23 0.29 0.450.01 1.16 0.03 0.00 0.05 0.00 0.03 0.11 0.20
0.07 0.41 2.06 0.05 0.00 0.43 0.01 0.48 0.15 0.76 2.580.08 0.36 0.62 0.04 0.00 0.29 0.01 0.17 0.11 0.53 0.52
0.03 0.08 0.00 0.03 0.25 0.250.12 0.91 1.37 0.08 0.00 0.80 0.01 0.57 0.45 2.06 2.45
0.07 0.26 0.49 0.07 0.00 0.20 0.01 0.15 0.09 0.34 0.55
8.40 101.89 213.57 16.42 0.33 82.61 1.00 116.84 75.75 84.55 133.764.82 55.36 115.87 8.21 0.13 44.53 0.43 58.31 32.02 39.66 68.952.58 34.48 75.80 6.28 0.18 25.25 0.43 42.67 30.91 28.85 43.890.69 10.09 19.21 1.57 0.01 11.00 0.05 12.98 10.05 9.85 13.290.31 1.96 2.70 0.35 0.01 1.83 0.08 2.87 2.76 6.19 7.62
57.39 54.33 54.25 50.03 37.63 53.90 42.73 49.91 42.27 46.90 51.5530.72 33.84 35.49 38.23 54.31 30.56 43.51 36.52 40.81 34.13 32.818.16 9.90 8.99 9.59 4.23 13.32 5.48 11.11 13.27 11.65 9.943.72 1.92 1.26 2.14 3.84 2.22 8.29 2.46 3.64 7.33 5.700.26 1.59 1.96 0.25 0.01 1.31 0.07 1.84 1.42 4.46 5.500.68 8.39 14.23 1.24 0.01 9.47 0.05 10.99 7.71 9.74 13.093.09 1.56 0.92 1.53 3.71 1.58 7.26 1.57 1.88 5.28 4.118.09 8.23 6.66 7.55 4.06 11.46 5.37 9.40 10.18 11.51 9.793.89 50.58 103.34 7.62 0.10 32.80 0.32 51.17 29.07 32.04 51.420.25 1.58 3.91 0.19 0.00 1.43 0.03 1.19 0.68 3.17 5.580.07 0.03 0.04 0.02 0.03 0.04 0.08 0.02 0.02 0.10 0.110.00 2.77 6.47 0.34 0.00 2.39 0.00 3.29 2.95 0.27 0.560.22 1.44 2.70 0.20 0.01 1.36 0.06 2.58 2.56 5.39 6.48
46.37 49.64 48.39 46.44 31.30 39.70 31.65 43.80 38.37 37.89 38.443.02 1.55 1.83 1.16 0.80 1.73 2.59 1.02 0.90 3.75 4.170.00 2.72 3.03 2.08 0.00 2.89 0.00 2.81 3.89 0.32 0.422.59 1.41 1.26 1.22 2.99 1.64 5.93 2.21 3.38 6.38 4.840.61 6.47 9.55 1.06 0.01 6.83 0.05 8.52 6.15 8.16 10.860.68 7.32 11.58 1.21 0.01 8.57 0.05 9.70 7.07 9.46 12.548.09 7.19 5.42 7.35 4.06 10.37 5.37 8.30 9.34 11.19 9.370.28 0.16 0.12 0.17 0.48 0.12 0.58 0.14 0.16 0.31 0.30

274
6 7 10 11 12 14 16 18 25 26 40.11 0.04 0.02 0.01 0.23 0.05 0.05 0.27
0.00 0.00 0.00 0.06 0.030.07 0.02 0.01 0.080.33 0.13 0.02 0.31 0.03 0.23 0.42
0.00 0.00 0.00 0.030.00 0.00 0.00 0.00 0.00
0.04 3.11 2.12 12.19 0.12 0.07 16.80 0.14 6.18 1.43 3.360.02 1.24 0.56 2.77 0.05 0.03 1.67 0.07 1.52 0.62 2.090.01 0.55 0.21 1.00 0.03 0.02 0.84 0.07 0.64 0.17 0.78
0.00 0.000.01 2.73 0.42 4.88 0.03 0.01 11.85 0.05 5.01 0.48 1.47
0.00 0.17
0.00 0.77 0.33 2.90 0.01 0.00 4.20 0.00 1.14 0.25 0.16
0.30 9.12 5.52 41.19 0.69 0.58 44.81 0.06 23.23 3.98 4.810.01 0.75 0.19 2.97 0.04 0.01 1.40 0.00 0.90 0.22 0.600.18 13.92 8.56 54.71 0.52 0.35 53.92 0.42 34.03 6.09 12.18
0.15 0.09 0.03 0.03 0.190.01 0.35 0.18 0.79 0.02 0.01 0.85 0.02 0.60 0.12 0.49
0.01 0.00 0.030.01 1.52 0.28 2.90 7.35 3.57 0.38 0.890.01 0.80 0.22 1.38 0.02 0.01 2.00 0.03 1.64 0.29 0.720.00 0.23 0.09 0.97 0.00 1.78 0.72 0.16 2.20
1.57 0.00 1.28 1.14 0.10 1.002.40 3.79 2.30 0.37 1.32
0.01 1.23 0.66 3.14 0.04 0.03 7.29 0.06 6.61 1.60 2.47
0.08 4.15 1.62 9.76 0.21 0.11 8.04 0.16 10.05 2.28 3.50
0.03 1.82 1.42 5.86 0.07 0.05 4.29 0.07 5.46 1.25 1.940.00 0.00 0.23 0.00 0.00 1.27 0.33 0.01
0.00 0.00 0.00
0.00 0.15 0.04 0.00 0.01 0.00 0.15 0.01 0.20 0.07 0.100.00 0.14 0.08 0.40 0.01 0.01 0.14 0.01 0.31 0.09 0.16
0.01 1.62 0.90 3.92 0.04 0.01 6.89 0.03 5.75 0.95 3.970.01 4.46 1.93 11.29 0.09 0.02 19.46 0.05 15.48 1.90 3.38
0.10 0.06 0.52 0.84 0.51 0.10 0.450.41 0.26 0.72 0.18
0.51 8.90 0.02 0.44
0.00 0.24 0.00 1.25 0.03 1.71 0.15 0.00
T6.5P T27.5P

275
0.00 0.00 0.00 0.00 0.00 0.00 0.00 0.00 0.26
0.00 0.43 0.26 1.57 0.03 0.02 0.57 0.03 1.03 0.19 0.580.00 0.56 0.20 1.26 0.02 0.01 0.45 0.03 0.48 0.15 0.30
0.00 0.90 0.24 1.24 0.02 0.00 2.53 0.01 4.19 0.51 0.67
0.00 0.27 0.09 0.86 0.01 0.00 1.57 0.12 0.210.00 0.04 0.00 0.00 0.08 0.00 0.15 0.02 0.09
0.00 0.41 0.25 0.93 0.02 0.01 0.55 0.02 1.03 0.18 1.120.00 0.55 0.43 0.60 0.03 0.00 0.28 0.04 0.26 0.21 0.350.00 0.03 0.00 0.00 0.01 0.00 0.480.00 1.12 0.42 1.79 0.03 0.01 0.96 0.04 0.95 0.04 0.70
0.00 0.25 0.09 0.55 0.03 0.00 0.16 0.00 0.23 0.10 0.29
0.73 52.79 26.93 181.99 2.19 1.38 207.11 1.42 137.85 24.23 53.310.26 24.33 13.58 82.27 0.86 0.53 90.76 0.77 54.58 9.91 22.130.41 16.94 8.55 59.96 0.99 0.74 70.31 0.32 46.26 8.71 13.100.02 8.13 3.31 32.09 0.18 0.04 36.91 0.09 32.53 4.39 13.920.04 3.40 1.50 7.68 0.16 0.07 9.14 0.24 4.47 1.23 4.15
36.12 46.08 50.42 45.21 39.57 38.18 43.82 54.13 39.60 40.88 41.5255.65 32.09 31.73 32.94 45.24 53.60 33.95 22.57 33.56 35.93 24.582.45 15.39 12.28 17.63 8.07 3.11 17.82 6.02 23.60 18.12 26.115.78 6.43 5.57 4.22 7.12 5.11 4.41 17.28 3.24 5.06 7.790.04 2.30 1.04 4.78 0.13 0.07 4.63 0.21 3.09 0.97 3.580.02 7.58 3.31 20.79 0.16 0.04 33.03 0.09 30.08 4.00 12.075.55 4.35 3.84 2.63 6.07 4.89 2.23 14.95 2.24 4.01 6.712.41 14.36 12.28 11.42 7.11 2.93 15.95 6.02 21.82 16.51 22.640.22 17.13 10.73 66.89 0.66 0.43 70.94 0.56 40.26 7.57 15.800.01 1.77 0.77 3.27 0.08 0.02 1.67 0.06 2.21 0.32 2.120.03 0.10 0.07 0.05 0.13 0.04 0.02 0.11 0.05 0.04 0.130.00 0.23 0.09 4.94 0.00 0.00 6.86 0.00 4.16 0.63 4.530.04 2.89 1.23 6.66 0.10 0.05 7.02 0.18 3.54 1.04 3.45
29.43 32.45 39.83 36.76 29.99 31.44 34.25 39.31 29.21 31.23 29.651.00 3.36 2.87 1.79 3.88 1.22 0.81 4.24 1.60 1.31 3.970.00 0.44 0.35 2.71 0.00 0.14 3.31 0.00 3.02 2.59 8.495.02 5.47 4.58 3.66 4.40 3.93 3.39 12.35 2.56 4.28 6.470.02 6.08 2.83 15.21 0.13 0.03 26.34 0.08 21.23 2.85 7.350.02 7.35 3.21 18.25 0.16 0.04 29.97 0.09 28.22 3.58 8.862.41 13.92 11.93 10.03 7.11 2.79 14.47 6.02 20.47 14.76 16.630.70 0.23 0.24 0.19 0.46 0.63 0.12 0.71 0.09 0.20 0.23

276
6 7 10 11 12 14 16 18 250.00 0.07 0.09 0.15 0.00 0.01 0.13
0.00 0.00 0.00 0.00 0.110.00 0.03 0.03 0.00 0.080.00 0.17 0.18 0.02 0.00 0.06 0.01 0.16
0.080.00 0.00 0.00 0.010.03 1.01 1.75 2.29 0.02 0.06 2.250.02 0.89 0.71 1.94 0.03 0.01 0.13 0.04 1.080.01 0.44 0.38 0.87 0.02 0.01 0.05 0.03 0.450.00 0.000.01 0.72 0.70 2.46 0.00 0.02 1.37
0.00 0.25 0.35 0.40 0.00 0.00 0.05 0.00 0.24
0.15 2.85 5.76 6.75 0.28 0.09 5.18 0.32 4.670.02 0.25 0.26 0.43 0.01 0.01 0.12 0.02 0.340.12 4.93 8.12 9.49 0.23 0.07 3.79 0.30 9.510.01 0.13 0.09 0.00 0.020.01 0.24 0.19 0.31 0.01 0.00 0.04 0.01 0.26
0.010.01 0.49 0.61 1.70 0.01 0.00 0.67 0.890.01 0.39 0.34 0.72 0.00 0.02 0.650.00 0.06 0.21 0.01 0.00 0.07 0.200.00 0.32 0.00 0.57
0.61 0.60 0.82 0.64
0.01 0.69 0.76 1.39 0.03 0.01 0.20 0.03 2.75
0.07 1.46 1.50 3.08 0.08 0.03 0.49 0.11 3.33
0.02 0.81 0.92 1.83 0.04 0.01 0.17 0.06 1.610.00 0.00 0.00 0.00 0.00 0.00 0.050.00 0.00
0.00 0.05 0.03 0.07 0.00 0.00 0.01 0.00 0.130.00 0.10 0.07 0.11 0.01 0.00 0.01 0.01 0.11
0.01 0.98 1.53 1.64 0.01 0.02 1.510.01 1.05 1.99 2.79 0.02 0.01 0.63 0.02 2.65
0.140.00 0.10 0.10
0.01 0.01 0.01
0.00 0.12 0.15 0.27 0.01 0.00 0.03 0.23
T27.5P

277
0.00 0.00 0.00 0.00 0.00 0.00 0.02 0.00
0.01 0.35 0.43 0.50 0.01 0.00 0.02 0.04 0.530.01 0.21 0.17 0.54 0.01 0.00 0.01 0.02 0.23
0.00 0.16 0.36 0.59 0.01 0.00 0.09 0.00 0.71
0.00 0.12 0.18 0.150.00 0.04 0.08 0.08 0.00 0.00 0.00 0.00 0.03
0.00 0.28 0.27 0.36 0.01 0.00 0.02 0.01 0.650.00 0.18 0.21 0.23 0.01 0.00 0.01 0.02 0.240.00 0.05 0.03 0.05 0.00 0.00 0.01 0.000.00 0.57 0.65 0.78 0.01 0.00 0.02 0.02 1.00
0.00 0.16 0.18 0.19 0.00 0.00 0.00 0.02 0.23
0.52 19.98 28.70 42.46 0.84 0.29 11.87 1.19 38.710.19 9.00 13.05 18.28 0.29 0.11 4.00 0.52 17.480.26 5.96 9.10 13.82 0.43 0.15 6.72 0.49 12.350.02 2.91 4.66 6.85 0.04 0.02 0.81 0.06 6.540.05 2.12 1.89 3.51 0.07 0.02 0.33 0.12 2.34
36.36 45.02 45.46 43.05 34.92 36.55 33.74 43.92 45.1450.13 29.81 31.69 32.54 51.72 50.19 56.63 41.11 31.904.05 14.57 16.25 16.14 4.58 5.88 6.82 4.73 16.909.45 10.60 6.60 8.27 8.77 7.38 2.82 10.24 6.060.04 1.70 1.37 3.11 0.06 0.02 0.22 0.11 1.950.02 2.26 3.99 5.96 0.03 0.02 0.80 0.05 5.888.39 8.49 4.78 7.33 6.62 6.45 1.86 8.93 5.033.96 11.29 13.90 14.04 3.60 5.68 6.70 3.79 15.180.15 6.02 9.97 11.93 0.23 0.08 3.79 0.36 11.890.00 1.02 1.09 1.33 0.02 0.00 0.04 0.06 1.880.02 0.17 0.11 0.11 0.08 0.06 0.01 0.15 0.160.00 0.68 0.60 1.34 0.01 0.00 0.07 0.00 1.410.03 1.75 1.61 3.20 0.07 0.02 0.29 0.08 1.92
28.60 30.14 34.73 28.09 27.82 28.23 31.94 30.66 30.710.61 5.09 3.81 3.14 2.14 1.68 0.38 4.63 4.850.46 3.39 2.07 3.15 0.75 0.19 0.60 0.00 3.646.62 8.76 5.62 7.54 7.76 5.97 2.48 6.73 4.970.01 2.03 3.51 4.44 0.02 0.01 0.63 0.04 4.150.02 2.19 3.99 5.44 0.02 0.02 0.72 0.05 5.113.50 10.97 13.90 12.81 2.85 5.50 6.10 3.79 13.190.68 0.43 0.26 0.34 0.65 0.53 0.22 0.70 0.25

278
APP
EN
DIX
H:
CH
APT
ER
5 B
UL
K, T
HA
A IS
OTO
PE D
ATA
Uni
ts a
re n
mol
13C
or 15
N g
dw-1
Day
Pool
Bul
k 15
NB
ulk
13C
Dal
a 15
NTH
AA
15
ND
/L-A
la
15N
Dal
a 13
CTH
AA
13
CD
/L-A
la
13C
THA
A/
BU
LK15
NTH
AA
/ B
ULK
13C
DA
LA/
BU
LK15
ND
ALA
/ B
ULK
13C
PLFA
/ B
ULK
13C
1H
133
.15
21.5
00.
1116
.75
0.06
0.06
13.1
60.
0650
.51
61.2
30.
320.
291
H3
17.1
722
.51
0.03
8.07
0.04
0.02
9.30
0.04
46.9
741
.33
0.16
0.11
3.30
1H
536
.48
22.0
70.
0316
.59
0.03
0.05
8.57
0.06
45.4
638
.81
0.09
0.23
3.63
1I2
151.
2810
5.67
0.15
56.8
90.
040.
1052
.83
0.04
37.6
149
.99
0.10
0.09
4.50
1I4
53.5
449
.02
0.03
35.0
30.
020.
0315
.60
0.03
65.4
231
.84
0.06
0.06
1.00
1I6
34.0
133
.61
0.05
15.2
70.
040.
039.
880.
0644
.91
29.3
90.
140.
093.
062
H1
16.4
625
.16
0.05
11.0
70.
050.
0210
.56
0.04
67.2
441
.95
0.29
0.09
1.90
2H
335
.14
38.2
50.
0822
.09
0.04
0.05
20.8
50.
0562
.86
54.5
10.
220.
143.
092
H5
68.9
938
.01
0.13
26.3
20.
050.
0721
.43
0.05
38.1
556
.37
0.19
0.19
3.85
2I2
58.3
887
.97
0.08
30.9
00.
040.
0629
.09
0.04
52.9
333
.06
0.13
0.07
1.18
2I4
68.0
917
.65
0.04
21.2
60.
030.
0210
.40
0.04
31.2
258
.93
0.06
0.11
1.64
2I6
27.3
232
.30
0.00
7.98
0.02
24.7
10.
013.
227
H1
251.
9920
7.97
0.17
91.5
30.
030.
1065
.16
0.03
36.3
231
.33
0.07
0.05
4.01
7H
311
99.4
211
37.1
71.
0749
3.69
0.03
0.43
413.
000.
0341
.16
36.3
20.
090.
044.
937
H5
263.
2539
4.88
0.15
63.2
60.
040.
0845
.18
0.04
24.0
311
.44
0.06
0.02
1.67
7I2
76.6
596
.16
0.04
19.6
80.
030.
0320
.24
0.04
25.6
721
.05
0.05
0.04
3.19
7I4
649.
6576
7.97
0.12
217.
730.
020.
0923
0.29
0.02
33.5
229
.99
0.02
0.01
1.97
7I6
72.5
265
.34
0.01
23.7
90.
020.
0126
.00
0.02
32.8
039
.80
0.01
0.02
3.99
14H
111
98.6
192
9.53
0.49
523.
110.
020.
1539
6.64
0.02
43.6
442
.67
0.04
0.02
1.72
14H
371
.34
58.3
80.
0324
.49
0.03
0.03
20.2
30.
0334
.33
34.6
40.
040.
042.
2914
H5
84.4
029
.20
0.07
33.1
90.
030.
0422
.01
0.04
39.3
275
.37
0.08
0.13
3.11
14I2
316.
8429
6.49
0.11
85.5
90.
030.
0872
.16
0.03
27.0
124
.34
0.03
0.03
1.36
14I4
69.3
139
.02
0.04
29.3
50.
030.
0216
.45
0.03
42.3
442
.15
0.06
0.06
2.56
14I6
942.
8412
13.6
10.
3628
5.39
0.03
0.25
332.
270.
0230
.27
27.3
80.
040.
021.
41

279
APPENDIX I: CHAPTER 5 PLFA ISOTOPE DATAUnits are nmol 13C gdw-1
Day 1 1 1 1 1 1 2 2Component Meso-H1 H3 H5 I2 I4 I6 H1 H312:0 0.01 0.00 0.00 0.00 0.00 0.00 0.0013:0 0.01 0.00 0.00 0.00i14 0.06 0.00 0.00 0.01 0.00 0.00 0.0014:1w914:1w714:0 0.44 0.08 0.08 0.29 0.02 0.08 0.03 0.11i15 0.38 0.01 0.03 0.13 0.04 0.02 0.01 0.02a15 0.17 0.00 0.01 0.03 0.02 0.03 0.00 0.0115:115:0 0.22 0.02 0.02 0.07 0.03 0.01 0.03 0.0316:4*16:3*16:2* 0.01 0.01 0.00 0.01 0.00 -0.01 -0.01 0.00i16 0.13 0.00 0.01 0.05 0.01 0.01 0.0016:1w916:1w7 0.61 0.18 0.14 0.54 0.11 0.07 0.10 0.2216:1w516:0 2.27 0.34 0.41 2.75 0.16 0.65 0.28 0.6310Me17br 0.00 0.00 0.00i17 0.05 0.00 0.01 0.03 0.01 0.01 0.00 0.01a17 0.02 0.00 0.01 0.0017:1 0.07 0.01 0.00 0.09 0.03 0.01 0.0217:0 0.06 0.00 0.00 0.04 0.00 0.00 0.00 0.0118:418:3w6 0.01 0.00 0.01 0.00 0.0018:2w6 0.03 0.00 -0.01 0.06 0.00 0.01 0.00 0.0018:3w318:1w9cis 0.09 0.01 0.00 0.09 0.01 0.07 0.00 0.0018:2w318:1w9t 0.03 0.01 0.01 0.08 0.01 -0.01 0.0118:1w7 0.02 0.00 0.00 0.01 0.00 0.00 0.00 0.0118:1w518:0 0.10 0.02 0.02 0.19 0.01 0.02 0.01 0.0310Me19bri19*a19*19:1*19:0 i.s. 0.00 0.00 0.00 0.00 0.00 0.00 0.00 0.0020:5w620:4w6 0.02 0.00 0.01 0.03 0.00 0.01 0.00 0.0120:5w3 0.03 0.01 0.03 0.07 0.01 0.01 0.02 0.0320:3w6 0.02 0.0020:4w3 0.00 0.00 0.0020:2*20:3w320:1w9 0.00 0.00 0.00 0.02 0.0020:1w720:1w520:0 i.s. 0.02 0.01 0.01 0.03 0.01 0.00 0.01 0.0221:0 i.s. 0.00 0.00 0.00 0.01 0.00 0.00 0.00 0.0122:6w6*22:6w3 0.03 0.00 0.00 0.02 0.00 0.00 0.00 0.01

280
22:5w6*22:5w3* 0.00 0.00 0.01 0.0022:2*22:1w9 0.00 0.0022:1w7*22:0 0.02 0.01 0.01 0.03 0.00 0.00 0.01 0.0123:0 i.s. 0.00 0.00 0.00 0.01 0.00 0.00 0.00 0.0024:1 0.00 0.00 0.01 0.0024:0 0.04 0.01 0.01 0.04 0.01 0.01 0.01 0.02Total 4.94 0.74 0.80 4.75 0.49 1.03 0.48 1.18Sat FA's 3.16 0.48 0.55 3.42 0.23 0.77 0.37 0.83Mono Unsat 0.82 0.21 0.16 0.85 0.16 0.15 0.09 0.26Polyunsat 0.15 0.03 0.03 0.22 0.02 0.02 0.01 0.05Br FA's 0.81 0.02 0.05 0.26 0.08 0.08 0.01 0.04% Sat FA's 64.03 65.11 69.12 72.03 47.26 75.26 77.03 70.33% Mono Unsat 16.68 28.27 19.82 17.87 33.16 14.72 19.59 21.98% Polyunsat 2.97 4.38 4.22 4.59 4.07 2.11 2.15 4.16% Br FA's 16.32 2.24 6.84 5.51 15.51 7.91 1.23 3.53BrOdd FA 0.62 0.01 0.05 0.20 0.07 0.07 0.01 0.04PUFA (3+) 0.12 0.02 0.04 0.15 0.01 0.02 0.02 0.05%BrOdd FA 12.52 1.81 6.03 4.12 13.51 6.87 1.24 3.27%PUFA (3+) 2.34 3.14 5.28 3.06 2.86 1.95 3.61 4.09SCFA 2.72 0.42 0.50 3.04 0.18 0.73 0.31 0.74LCFA 0.06 0.02 0.02 0.08 0.01 0.01 0.02 0.02BoshkerBact 0.76 0.02 0.05 0.24 0.07 0.07 0.01 0.04PUFA (20, 22 3+) 0.10 0.02 0.04 0.13 0.01 0.02 0.02 0.05%SCFA 55.02 57.02 61.84 64.05 36.47 71.08 65.24 62.64%LCFA 1.25 2.10 2.25 1.65 1.76 0.76 3.73 1.93%BoshkerBact 15.38 2.56 6.49 5.06 14.69 6.33 1.84 3.61%PUFA2022 2.05 2.82 5.28 2.75 2.38 1.99 3.61 4.09TARFA 0.02 0.04 0.04 0.03 0.05 0.01 0.06 0.03BrODD/PUFA2022 6.10 0.64 1.14 1.50 5.67 3.45 0.34 0.80BrODD + PUFA 0.72 0.03 0.09 0.33 0.08 0.09 0.02 0.09%16:1w7c 12.28 23.92 18.08 11.35 22.30 6.65 20.09 18.56%205w3 0.67 1.96 3.32 1.45 2.07 0.84 3.28 2.75%20:4w6 0.35 0.35 1.40 0.64 0.02 0.80 0.63 0.75BoshkBact/(Boschk+PUFA) 0.88 0.48 0.55 0.65 0.86 0.76 0.34 0.47PLFA/Bulk 0.23 0.03 0.04 0.04 0.01 0.03 0.02 0.03PLFA/Bulk (%) 22.96 3.30 3.63 4.50 1.00 3.06 1.90 3.09BrODD/Bulk (%) 2.87 0.06 0.22 0.19 0.13 0.21 0.02 0.10BrODD/BrODD+PUFA 0.86 0.39 0.53 0.60 0.85 0.78 0.25 0.44BrODD/20:5w3+BrODD 0.95 0.48 0.64 0.74 0.87 0.89 0.27 0.54BrODD/16:1w7+BrODD 0.50 0.07 0.25 0.27 0.38 0.51 0.06 0.15XS 13C BrODD/C16 0.33 0.06 0.13 0.09 0.46 0.10 0.03 0.07XS 13C PUFA2022/C16 0.04 0.06 0.10 0.05 0.08 0.03 0.06 0.08BrODD/SCFA 0.23 0.03 0.10 0.06 0.37 0.10 0.02 0.05PUFA/SCFA 0.04 0.05 0.09 0.04 0.07 0.03 0.06 0.0714+16:1w7+20:5w3 1.08 0.27 0.25 0.89 0.14 0.16 0.14 0.36

281
2 2 2 2 7 7 7 7 7 7 14 14H5 I2 I4 I6 H1 H3 H5 I2 I4 I6 H1 H3
0.00 0.03 0.00 0.00 0.02 0.13 0.01 0.01 0.04 0.01 0.01 0.000.00 0.01 0.01 0.04 0.01 0.01 0.02 0.00 0.000.00 0.04 0.00 0.00 0.03 0.52 0.07 0.04 0.07 0.03 0.03 0.01
0.17 0.30 0.02 0.06 0.69 4.76 0.42 0.14 1.07 0.14 0.14 0.080.03 0.23 0.01 0.04 0.21 4.50 0.48 0.23 0.32 0.16 0.24 0.040.01 0.17 0.01 0.02 0.11 1.52 0.19 0.19 0.15 0.16 0.12 0.02
0.06 0.23 0.03 0.03 0.34 0.99 0.39 0.15 0.35 0.06 0.11 0.09
0.000.02 0.00 0.00 0.00 0.02 0.02 0.00 0.03 0.000.01 0.03 0.00 0.00 0.05 0.96 0.17 0.04 0.09 0.03 0.03 0.02
0.29 0.38 0.07 0.17 0.94 4.07 0.70 0.21 1.23 0.20 0.21 0.140.03 0.04 0.01
0.53 2.05 0.08 0.51 4.66 30.93 2.70 1.52 8.73 1.37 0.65 0.400.03 0.01 0.00
0.01 0.07 0.00 0.01 0.02 0.89 0.13 0.04 0.07 0.03 0.02 0.010.00 0.00 0.01 0.01 0.15 0.05 0.03 0.50 0.020.02 0.21 0.02 0.04 0.11 0.32 0.13 0.05 0.03 0.03 0.05 0.030.02 0.11 0.00 0.01 0.11 0.45 0.13 0.05 0.15 0.03 0.03 0.03
0.00 0.00 0.01 0.01 0.11 0.03 0.00 0.02 0.00 0.000.01 0.04 0.00 0.00 0.01 0.22 0.03 0.01 0.03 0.00
0.03 0.15 0.01 0.07 0.29 0.87 0.08 0.06 0.48 0.05 0.03 0.02
0.04 0.23 0.11 1.03 0.09 0.01 0.31 0.01 0.16 0.090.02 0.00 0.01 0.04 0.19 0.03 0.02 0.04 0.01
0.06 0.16 0.00 0.02 0.23 1.30 0.21 0.10 0.45 0.08 0.06 0.060.02 0.00 0.01
0.00-0.01 0.05 0.00 0.00 -0.02 0.00 0.00 0.00 0.00 0.00 0.01
0.02 0.03 0.00 0.01 0.01 0.14 0.05 0.01 0.06 0.01 0.01 0.020.05 0.05 0.01 0.01 0.10 0.35 0.19 0.04 0.14 0.04 0.05 0.04
0.11 0.02 0.060.00 0.01 0.03 0.00 0.02
0.02
0.01 0.01 0.02 0.01 0.04 0.00
0.04 0.17 0.00 0.01 0.06 0.30 0.06 0.02 0.14 0.02 0.02 0.010.00 0.03 0.00 0.00 0.00 0.04 0.03 0.01 0.02 0.00 0.00 0.01
0.01 0.01 0.00 0.00 0.03 0.24 0.07 0.01 0.05 0.02 0.01 0.01

282
0.00 0.01 0.00 0.02 0.02 0.00 0.01 0.01 0.00 0.010.00 0.00 0.02
0.00 0.02
0.01 0.05 0.00 0.00 0.06 0.36 0.07 0.02 0.16 0.02 0.02 0.020.00 0.04 0.00 0.00 0.00 0.05 0.00 0.01 0.00 0.00 0.01 0.03
0.02 0.02 0.14 0.01 0.01 0.11 0.01 0.010.01 0.09 0.00 0.01 0.09 0.66 0.08 0.05 0.25 0.05 0.04 0.011.46 4.76 0.29 1.04 8.33 56.01 6.59 3.07 15.12 2.61 2.10 1.200.87 3.03 0.14 0.65 6.21 39.62 4.01 2.04 11.22 1.77 1.07 0.690.41 1.01 0.11 0.28 1.51 6.62 1.07 0.38 2.26 0.32 0.50 0.300.12 0.14 0.02 0.04 0.17 1.24 0.43 0.09 0.43 0.09 0.08 0.100.06 0.58 0.02 0.07 0.44 8.53 1.09 0.56 1.21 0.43 0.46 0.10
59.44 63.68 49.15 62.17 74.57 70.74 60.81 66.45 74.20 67.83 50.69 57.4728.08 21.18 36.54 27.29 18.09 11.81 16.21 12.42 14.95 12.09 23.75 25.37
8.10 2.86 7.08 3.57 2.09 2.22 6.51 2.90 2.84 3.61 3.82 8.554.37 12.28 7.23 6.97 5.25 15.23 16.46 18.24 8.00 16.48 21.74 8.600.05 0.46 0.02 0.06 0.35 7.06 0.85 0.48 1.04 0.36 0.38 0.070.09 0.09 0.01 0.03 0.16 1.01 0.38 0.07 0.36 0.09 0.08 0.073.63 9.63 6.82 6.23 4.24 12.60 12.88 15.64 6.89 13.94 18.17 6.025.98 1.95 5.13 3.13 1.93 1.80 5.83 2.39 2.40 3.56 3.81 5.830.70 2.38 0.10 0.57 5.36 35.82 3.12 1.67 9.84 1.52 0.80 0.480.03 0.15 0.00 0.01 0.16 1.01 0.15 0.07 0.41 0.07 0.05 0.030.07 0.47 0.02 0.07 0.44 7.68 0.94 0.51 0.68 0.39 0.42 0.080.08 0.09 0.01 0.02 0.15 0.90 0.36 0.07 0.34 0.09 0.08 0.07
47.65 49.98 34.47 55.14 64.35 63.97 47.32 54.36 65.06 58.36 38.00 39.901.73 3.04 1.66 1.17 1.88 1.81 2.33 2.15 2.70 2.79 2.45 2.544.98 9.80 7.26 6.58 5.32 13.71 14.30 16.58 4.50 15.04 20.12 6.825.68 1.95 3.97 2.02 1.81 1.60 5.39 2.24 2.23 3.41 3.72 5.830.04 0.06 0.05 0.02 0.03 0.03 0.05 0.04 0.04 0.05 0.06 0.060.64 4.95 1.72 3.08 2.35 7.86 2.39 6.99 3.09 4.09 4.88 1.030.14 0.55 0.03 0.09 0.50 7.95 1.20 0.55 1.38 0.45 0.46 0.14
19.87 7.87 24.09 16.11 11.31 7.26 10.62 6.79 8.11 7.64 10.17 11.453.70 0.97 3.54 1.29 1.24 0.62 2.90 1.27 0.95 1.40 2.29 3.301.03 0.56 0.43 0.84 0.17 0.25 0.77 0.39 0.36 0.57 0.64 1.290.47 0.83 0.65 0.76 0.75 0.90 0.73 0.88 0.67 0.82 0.84 0.540.04 0.05 0.02 0.03 0.04 0.05 0.02 0.03 0.02 0.04 0.00 0.023.85 5.42 1.64 3.22 4.01 4.93 1.67 3.19 1.97 3.99 0.23 2.050.14 0.52 0.11 0.20 0.17 0.62 0.21 0.50 0.14 0.56 0.04 0.120.39 0.83 0.63 0.75 0.70 0.89 0.70 0.87 0.76 0.80 0.83 0.510.50 0.91 0.66 0.83 0.77 0.95 0.82 0.92 0.88 0.91 0.89 0.650.15 0.55 0.22 0.28 0.27 0.63 0.55 0.70 0.46 0.65 0.64 0.340.14 0.23 0.26 0.13 0.10 0.25 0.35 0.33 0.08 0.29 0.65 0.210.16 0.05 0.14 0.04 0.03 0.03 0.13 0.05 0.04 0.07 0.12 0.180.08 0.19 0.20 0.11 0.07 0.20 0.27 0.29 0.11 0.24 0.48 0.150.12 0.04 0.12 0.04 0.03 0.03 0.11 0.04 0.03 0.06 0.10 0.150.51 0.72 0.10 0.24 1.74 9.18 1.31 0.39 2.44 0.38 0.40 0.26

283
14 14 14 14H5 I2 I4 I6
0.00 0.00 0.03 0.010.00 0.00 0.02 0.000.02 0.00 0.07 0.01
0.28 0.02 2.19 0.190.13 0.03 0.65 0.130.06 0.02 0.36 0.03
0.34 0.05 0.70 0.03
0.02 0.01 0.19 0.01
0.42 0.06 2.24 0.180.03 0.01 0.14 0.011.42 0.19 10.36 1.220.01 0.04 0.010.02 0.01 0.20 0.02
0.11 0.03 0.51 0.030.07 0.02 0.28 0.02
0.01 0.00 0.070.02 0.01 0.17
0.06 0.02 1.07 0.09
0.22 0.07 1.21 0.21
0.12 0.03 0.93 0.110.01 0.00 0.05 0.01
0.03
0.02 0.01 0.08 0.00
0.02 0.01 0.20 0.010.09 0.03 0.35 0.05
0.02 0.01 0.14 0.01
0.03 0.02 0.14 0.030.01 0.00 0.09 0.03
0.02 0.01 0.05 0.01

284
0.01 0.00 0.04 0.000.01 0.01 0.00
0.03 0.01 0.15 0.030.02 0.01 0.07 0.020.00 0.00 0.07 0.010.04 0.01 0.23 0.053.62 0.71 22.75 2.482.31 0.34 14.90 1.650.86 0.21 5.39 0.540.17 0.07 0.88 0.070.28 0.08 1.58 0.21
63.92 48.80 65.48 66.7723.66 30.34 23.68 21.944.78 9.36 3.89 3.017.63 11.50 6.95 8.290.21 0.06 1.23 0.180.15 0.05 0.70 0.075.87 8.75 5.42 7.114.10 7.24 3.07 2.921.70 0.22 12.58 1.410.07 0.02 0.39 0.080.24 0.06 1.27 0.170.14 0.05 0.63 0.07
47.10 30.55 55.30 56.822.06 3.29 1.70 3.036.52 9.01 5.60 6.953.94 6.98 2.78 2.920.04 0.11 0.03 0.051.49 1.25 1.95 2.440.36 0.11 1.87 0.25
11.71 9.19 9.84 7.252.46 3.71 1.52 1.860.69 1.61 0.88 0.590.62 0.56 0.67 0.700.12 0.00 0.58 0.00
12.39 0.24 58.30 0.200.73 0.02 3.16 0.010.60 0.56 0.66 0.710.70 0.70 0.78 0.790.33 0.49 0.36 0.500.17 0.34 0.12 0.140.10 0.26 0.06 0.060.12 0.29 0.10 0.130.08 0.23 0.05 0.050.80 0.11 4.77 0.41