list of tables · web viewlist of tables5 abbreviations6 acknowledgements6 1introduction7 1.2...
TRANSCRIPT

Logo Logo
Population Health AtlasFrankston Mornington Peninsula
Primary Care Partnership and
Frankston-Mornington Peninsula Medicare Local
Prepared by Professor Helen Keleher
1st edition
July 2012
/tt/file_convert/5ab6ed4c7f8b9a6e1c8e492f/document.docx 1

ContentsList of tables.................................................................................................................5
Abbreviations................................................................................................................6
Acknowledgements......................................................................................................6
1 Introduction.............................................................................................................7
1.2 Purpose of review............................................................................................7
1.3 Scope..............................................................................................................8
1.4 Review limitations............................................................................................8
1.5 Indicators.........................................................................................................8
1.5.1 Health status indicators............................................................................9
1.5.2 Community wellbeing...............................................................................9
1.6 Definitions........................................................................................................9
1.6.1 Social determinants of health...................................................................9
1.6.2 Health inequalities and health inequities................................................10
2 FMPML/FMPPCP catchment...............................................................................12
2.1 Characteristics...............................................................................................12
2.2 Demographics of catchment..........................................................................13
2.3 Life expectancy.............................................................................................14
2.4 Services.........................................................................................................14
2.5 Population projections...................................................................................16
2.6 Diversity.........................................................................................................17
2.7 Summary.......................................................................................................18
3 Small area social and economic data...................................................................19
3.1 SEIFA and IRSED.........................................................................................19
3.2 Employment/unemployment..........................................................................21
3.3 Housing and household income....................................................................22
2

3.3.1 Household income by quartile................................................................23
3.4 Social housing...............................................................................................25
3.5 Homelessness...............................................................................................25
3.6 Educational attainment/early school leaving.................................................26
3.6.1 Health literacy.........................................................................................27
3.7 Crime, safety and violence............................................................................28
3.8 Child protection reports.................................................................................29
3.9 Adolescent crime...........................................................................................30
3.10 Electronic gaming machine (EGM) expenditure..........................................30
3.11 Summary.....................................................................................................31
4 Child health..........................................................................................................32
4.1 Children in jobless families............................................................................32
3.12 AEDI............................................................................................................33
3.12.1 AEDI Mornington Peninsula Shire........................................................34
3.12.2 AEDI City of Frankston.........................................................................34
3.13 Child health vital statistics...........................................................................35
3.13.1 Immunization status of children February 2012...................................37
3.14 Low birth-weight babies...............................................................................37
3.15 Summary.....................................................................................................38
4 Adolescent health.................................................................................................39
4.2 Adolescent demographics.............................................................................39
4.3 Teenage pregnancy and safe sex.................................................................39
4.4 Alcohol and other drugs................................................................................39
4.5 Smoking........................................................................................................40
4.6 Physical health..............................................................................................40
5 Adult health in the FMPML/PCP catchment.........................................................42
5.1 Health behaviours.........................................................................................42
5.2 Chronic conditions.........................................................................................43
5.3 Sexually transmitted diseases.......................................................................49
5.4 Mental health.................................................................................................50
5.4.1 Suicide and self-harm injuries................................................................52
6 Ageing..................................................................................................................53
6.1 Ageing population and projections................................................................53
6.2 Aged care......................................................................................................54
7 Indicators..............................................................................................................56
/tt/file_convert/5ab6ed4c7f8b9a6e1c8e492f/document.docx 3
7.2 Recommendations........................................................................................57
Appendix 1 Summary of FMPPCP reviews 2006-2012.............................................58
References.................................................................................................................59
List of tables 5
Abbreviations................................................................................................................6
Acknowledgements......................................................................................................6
1 Introduction.............................................................................................................7
1.2 Purpose of review............................................................................................7
1.3 Scope..............................................................................................................8
1.4 Review limitations............................................................................................8
1.5 Indicators.........................................................................................................8
1.5.1 Health status indicators............................................................................9
1.5.2 Community wellbeing...............................................................................9
1.6 Definitions........................................................................................................9
1.6.1 Social determinants of health...................................................................9
1.6.2 Health inequalities and health inequities................................................10
2 FMPML/FMPPCP catchment...............................................................................12
2.1 Characteristics...............................................................................................12
2.2 Demographics of catchment..........................................................................13
2.3 Life expectancy.............................................................................................13
2.4 Services.........................................................................................................14
2.5 Population projections...................................................................................16
2.6 Diversity.........................................................................................................17
2.7 Summary.......................................................................................................18
3 Small area social and economic data...................................................................19
3.1 SEIFA and IRSED.........................................................................................19
3.2 Employment/unemployment..........................................................................21
3.3 Housing and household income....................................................................22
3.3.1 Household income by quartile................................................................23
3.4 Social housing...............................................................................................25
3.5 Homelessness...............................................................................................25
3.6 Educational attainment/early school leaving.................................................26
3.6.1 Health literacy.........................................................................................27
3.7 Crime, safety and violence............................................................................28
4

3.8 Child protection reports.................................................................................29
3.9 Adolescent crime...........................................................................................30
3.10 Electronic gaming machine (EGM) expenditure..........................................30
4 Child health..........................................................................................................32
4.1 Children in jobless families............................................................................32
4.2 AEDI..............................................................................................................33
4.2.1 AEDI Mornington Peninsula Shire..........................................................34
4.2.2 AEDI City of Frankston...........................................................................34
4.3 Child health vital statistics.............................................................................35
4.3.1 Immunization status of children February 2012.....................................37
4.4 Low birth-weight babies.................................................................................37
4.5 Summary.......................................................................................................38
5 Adolescent health.................................................................................................39
5.2 Adolescent demographics.............................................................................39
5.3 Teenage pregnancy and safe sex.................................................................39
5.4 Alcohol and other drugs................................................................................39
5.5 Smoking........................................................................................................40
5.6 Physical health..............................................................................................40
6 Adult health in the FMPML/PCP catchment.........................................................42
6.1 Health behaviours.........................................................................................42
6.2 Chronic conditions.........................................................................................43
6.3 Sexually transmitted diseases.......................................................................49
6.4 Mental health.................................................................................................50
6.4.1 Suicide and self-harm injuries................................................................52
7 Ageing..................................................................................................................53
7.1 Ageing population and projections................................................................53
7.2 Aged care......................................................................................................54
8 Indicators..............................................................................................................56
8.2 Recommendations........................................................................................57
Appendix 1 Summary of FMPPCP reviews 2006-2012.............................................58
References.................................................................................................................59
List of tables
/tt/file_convert/5ab6ed4c7f8b9a6e1c8e492f/document.docx 5
Table 1: Frankston and Mornington Peninsula Shire SLAs / postcodes 12Table 2: Population of Aboriginal people in the catchment 13Table 3: Age distribution in the FMPML/PCP catchment (2010) 15Table 4: Population projections by LGA 16Table 5: Population projections by SLA 16Table 7: Top 8 countries of birth in FMPPCP catchment 18Table 8: SLA SEIFA rankings in the FMPML 20Table 9: Small areas by SEIFA in the catchment 21Table 10: Employment participation and unemployment rates for small areas 22Table 11: Characteristics of housing in the catchment 22Table 12: Income quartiles by suburbs and areas 24Table 13: Social housing in FMPPCP/ML catchment 25Table 14: Educational attainment in the catchment 27Table 14: Crime and safety 28Table 16: City of Frankston EGM expenditure 30Table 17: Children under 15 yrs in jobless families (2006) 32Table 18: Child health vital statistics 36Table 19: Immunisation status for the catchment, February 2012 37Table 20: Low birth weight babies (2006-2008) 37Table 21: Self-reported health behaviours 2011 42Table 22: Estimates of chronic disease and risk factors 2007-8 – synthetic predictions
45Table 23: Avoidable deaths 0-74 yrs – Cancer 47Table 25: Deaths from suicide and self-harm injuries 2003-2007 52Table 26: Growth in older age groups 2011-2026 53Table 27: Allocation of aged care places to LGAs 54Table 28: Aged care places by SLA in the FMP catchment 55
Abbreviations
FMPML Frankston-Mornington Peninsula Medicare Local
FMPPCP Frankston Mornington Peninsula Primary Care Partnership
MSD Melbourne Statistical District
n.d. not dated
PGPN Peninsula General Practice Network
6

AcknowledgementsThis Frankston-Mornington Peninsula Population Health Atlas was auspiced
jointly by the Frankston-Mornington Peninsula Medicare Local (FMPML) and the
Frankston-Mornington Peninsula Primary Care Partnership (FMPPCP).
/tt/file_convert/5ab6ed4c7f8b9a6e1c8e492f/document.docx 7

1 IntroductionThe Frankston-Mornington Peninsula Primary Care Partnership (FMPPCP) was
formed in 2002 and includes 38 member agencies. The FMPPCP is a partnership of
health and community service providers who are committed to strengthening the
planning, coordination and delivery of services designed to improve outcomes for
people using health and community support services.
The Frankston-Mornington Peninsula Medicare Local was formed in January 2012
after a successful submission by a consortium of the Peninsula General Practice
Network, Frankston City, Frankston Mornington Peninsula PCP, Monash University,
Mornington Peninsula Shire, Peninsula Health and the Royal District Nursing Service
(RDNS). Both the Victorian Primary Care Partnership (PCP) Strategy and the
Australian Medicare Local Strategy (which began in 2011) are major reforms in the
way services are delivered in the primary care and community support services
sector in the catchment. One of the first joint tasks of FMPPCP and the FMPML has
been to produce this single catchment synthesis of population health evidence into a
Population Health Atlas.
1.2 Purpose of reviewThe purpose of this Frankston-Mornington Peninsula Population Health Atlas is to
compile social, economic and health data about the Frankston-Mornington Peninsula
catchment. There is emphasis in this Atlas on data that informs understanding about
equity issues in the catchment, because equity is a key concern of primary health
care systems and services. The data is interpreted to reveal social and health
inequities, gaps in knowledge, and in future work, this data will underpin analysis of
the opportunities and capacity available to tackle current and emerging issues.
The Population Health Atlas is intended to inform the various plans developed by
agencies in the catchment with responsibility for service delivery. The Atlas is built on
information from a range of sources including the Medicare Locals Social Health
Atlasi, adolescent health surveys, the Australian Early Development Index,
Community Indicators Victoria, and local reports. The information in this Atlas
provides a body of evidence about local population health and the social issues that
underpin health issues.
8

1.3 Scope There are a number of health data reports and population statistics compiled for the
FMPPCP, Peninsula Health, City of Frankston and Mornington Peninsula Shire
(Appendix 1). Additional data was sought from Department of Planning and
Community Development (DPCD) population projections, Department of Education
and Early Childhood Development on Child and Adolescent Health Profiles from the
Victorian Child and Adolescent Monitoring System (VCAMS), Department of Health
(DH) reports, and Department of Human Services (DHS) mental health service
reports. The most recent health status data has been sourced including the Medicare
Locals Social Health Atlasi and the Victorian Department of Health 2011 Local
Government Area profilesii.
Population health data is primarily available at LGA level but effort was made to draw
together information at small area level either by town/suburb, Statistical Local Area
(SLA) or Collector District (CD) because small area data is more sensitive than LGA
level data.
The review does not document Burden of Disease data because the last available
data set is from 2001. The BoD data is available in the Frankston City Council Health
and Wellbeing Plan 2009-2013, and the Peninsula Health Integrated Ambulatory
Care Plan but has not been used in this Atlas because it is out of data.
1.4 Review limitationsa) Census data from 2011 has been included where available on early release
from the ABS.
b) Collection of new primary data was not in the scope of this review.
c) Very little specific data about Aboriginal people is available at either LGA or
SLA level but what is available has been included in this Atlas.
d) There are gaps in information at small area level.
e) The Atlas is not intended to document characteristics of the service system.
1.5 Indicators Indicators for population health are drawn from the domains of health status and
wellbeing, health care system performance, and community wellbeing. Indicators are
developed for a range of purposes such as planning and evaluation although some
/tt/file_convert/5ab6ed4c7f8b9a6e1c8e492f/document.docx 9

indicators are more sensitive than others for assessing equity, effectiveness and
efficiency.
1.5.1 Health status indicatorsHealth status indicators are life expectancy, infant and child health, health priority
areas, risk factors, and disease ratesiii.
1.5.2 Community wellbeing There is growing interest in community indicators across governments and
communities. Community Indicators Victoria is the body of work which assesses
community wellbeing at LGA level in Victoria, and provides indicator measures for
five major domains of community wellbeing:
Social Healthy, safe and inclusive communities;
Economic Dynamic, resilient local economies
Environmental Sustainable built and natural environments
Democratic Culturally rich and vibrant communities
Cultural Democratic and engaged communities
Each domain has a series of indicators, for which data is obtained by self-report. CIV
data is also limited by the lack of small area sensitivity in the data.
1.6 DefinitionsThe purpose of health systems is to create health and reduce health inequities. This
Atlas is informed by the social determinants of health - that is, there is a focus on the
population-level social conditions that are known to lead to illness and disease. The
data framework for this Atlas is examined through a ‘lens’ of health inequity and the
social determinants of health. These concepts are briefly explained here to establish
common understandings.
1.6.1 Social determinants of healthThe social determinants of health (SDH) are the social, environmental, political and
cultural conditions in which people are born, grow, live, work and ageiv as well as
those factors in society that create, maintain, or diminish, the health of individuals
and populations. In other words, determinants of health and illness can be
understood as the pathways to health and equity/inequity and provide the context in
10

which individuals’ behaviours, health and well-being arise. Key social determinants
include:
The social-health gradient – the distribution of wealth and poverty in areas is
closely related to illness and disease patterns
Education and literacy – levels of education are closely related to health and
illness patterns
Early childhood – a strong predictor of health status in later life
Housing/shelter – both the affordability of housing and the availability of
affordable housing are pre-requisites of good health
Gender and discrimination including violence – violence against women
causes a higher burden of disease than obesity, smoking and alcohol
combined
Employment/Unemployment – access to sufficient economic resources for the
pre-requisites of health is critical for good health
Working conditions – exposure to health-damaging conditions
Social inclusion and social support – having family, friends and networks of
support as well as feeling included rather than on the margins of society, are
influential determinants of good health
Food security – fresh, affordable and accessible food is a pre-requisite of
health
Transport – access to affordable transport is essential for access to services.
1.6.2 Health inequalities and health inequitiesHealth inequalities are the measurable differences between population groups by
measures such as sex, age, or geographic location.
Health inequities are those health inequalities that result from social, economic, and
geographic influences that are avoidable, unjust and unfairv. Social inequities are an
underlying determinant of health inequitiesvi.
The striking inequities that exist between groups in the population are consistent with
evidence built up over a number of years in Australia to illustrate the causes of poor
health. The challenge for policy makers, health practitioners and governments is to
find ways to address these health inequitiesvii.
/tt/file_convert/5ab6ed4c7f8b9a6e1c8e492f/document.docx 11

2 FMPML/FMPPCP catchment
2.1 Characteristics The FMPML/FMPPCP catchment is a mixed urban and semi-rural area stretching
from Seaford, Carrum and Frankston, about an hours travel from the Melbourne
CBD, to the Mornington Peninsula. The total area is about 850 square kilometres
comprising five Statistical Local Areas (SLA). Table 1 sets out the postcodes for the
five SLAs.
Table 1: Frankston and Mornington Peninsula Shire SLAs / postcodes
Frankston (C) WestFrankston 3199Frankston North 3200Frankston South
Seaford 3198Skye 3977
Frankston (C) East Carrum Downs 3201 Langwarrin 3910Langwarrin South 3911
Mornington Peninsula Shire West Mount Eliza 3930 Mornington 3931
Mount Martha 3934
Mornington Peninsula Shire South
Cape Schanck, Boneo, Fingal 3939 Rosebud, Rosebud South, Rosebud West 3940Dromana, Arthurs Seat, Safety Beach 3936 McCrae 3938
Portsea 3944Sorrento 3943Blairgowrie 3942Rye, Tootgarook, St Andrews Beach 3941Gunnamatta 3941
Mornington Peninsula Shire East
Somers 3927Flinders 3929Merricks North, Merricks Beach Balnarring, Balnarring North 3926 Red Hill, Red Hill South 3937
Baxter 3911Somerville, Pearcedale 3912Hastings, Hastings West, Tuerong 3915 Merricks, Shoreham, Point Leo 3916Bittern, Bittern West 3918Crib Point, Stony Point 3919HMAS Cerberus 3920
The catchment for the FMPPCP and the FMPML (ML209) is the same, covering two
Victorian Local Government Areas (LGAs): the City of Frankston and the Mornington
Peninsula Shire (MPS). The combined population for the two LGAs in 2010 was
280,700viii comprising 130,462 residents in the City of Frankston, and 150,238 in the
Mornington Peninsula Shire. The growth rate for the City of Frankston was 1.7 per
cent averaged for the period 2005-2010 and for MPS the growth rate was 1.5 per
cent. The growth rate for Victoria in the same period was 1.9 per centviii.
12

2.2 Demographics of catchment
2.2.1 Aboriginal and Torres Strait Islander populations in the catchmentIn 2006, Aboriginal and Torres Strait Islander people make up 0.5 per cent of the
total population, which is lower than the percentage of Aboriginal persons in Victoria
(0.6%).
At the 2011 census, the number of Aboriginal people in the catchment increased by
598 persons (from 1,387 in 2006 to 1,985 in 2011). Victoria’s Aboriginal and Torres
Strait Islander population was 37,695 persons, an increase of 7,667 from the 2006
census. This represents a growth rate of 4.7% per annum. In 2011, Aboriginal people
comprised 0.7% of Victoria’s total population, compared with 0.6% at the 2006
census.
Table 2: Population of Aboriginal people in the catchment
2006 2011
% increase/decre
ase
Local Gov. AreaPopulati
on
Percentage of State
Population
Percentage of State In LGA
Of state
Mornington Peninsula (S) 637 2.1% 973 2.6% 52.7% 0.5%Frankston (C) 750 2.5% 1012 2.7% 34.9% 0.2%Total Victoria 30028 100.0% 37695 100.0% 25.5% 0.0%Source: ABS, Population data 2011 census
Table 3 sets out the distribution of the population by major age-groups. Key features
of the population demographics include the following:
Overall, the catchment has similar proportions to Australian averages at
ages below 65 years - 16.9% of the population is aged over 65 years
which is higher than for Victoria-wide (13.8%);
All age groups 60 years and over have higher proportions in the catchment
than the Victorian average;
Across the catchment, there are slightly more children 0-14 yrs of age than
people aged 65+ years of age;
32 per cent of the population is aged less than 25 years and 23 per cent
are under 17 years of age;
/tt/file_convert/5ab6ed4c7f8b9a6e1c8e492f/document.docx 13

13.2% were aged 10–19 years.
2.3 Life expectancyLife expectancy in 2011 in the Mornington Peninsula is 79.8 for males and 83.5 for
females.
Life expectancy in 2011 in Frankston is 79.3 for males, and 80.0 for females (Victoria
80.3 males/84.4 females).
2.4 Services The supply of GPs in 2011 was 92 per 1000 population in Frankston and 1.04 in the
Mornington Peninsulaii. However, the geographic spread of the catchment and
general practices suggests that they may not always located in the areas of greatest
need.
14

Table 3: Age distribution in the FMPML/PCP catchment (2010)SLA name 0-4 5-9 10-14 15-19 20-24 25-29 30-34 35-30 40-44 45-49 50-54 55-59 60-64 65-69 70-74 75-79 80-84 85%
Frankston (C) - East
3,762
(7.4%
)
3,589
(7.1%
)
3,973
(7.8%
)
3,975
(7.8%
)
3,529
(6.9%
)
3.519
(6.9%
)
3,771
(7.4%
)
50,79
5
(8.5%
)
50,79
5
(8.2%
)
50,79
5
(7.7%
)
3,198
(6.3%
)
2,585
(5.1%
)
2,137
(4.2%
)
1,566
(3.5%
)
1,074
(2.1%
)
769
(1.5%
)
535
(1.1%
)
389
(0.8%
)
Frankston (C) - West
4,945
(6.2%
)
4,142
(5.2%
)
4,404
(5.5%
)
5,357
(6.7%
)
6,067
(7.6%
)
5,344
(6.7%
)
5,113
(6.4%
)
79,66
7
(6.9%
)
79,66
7
(6.7%
)
79,66
7
(6.9%
)
5,437
(6.8%
)
4,736
(5.9%
)
4,818
(6.0%
)
3,711
(4.7%
)
3,116
(3.9%
)
2,370
(3.0%
)
1,877
(2.4%
)
1,877
(2.4%
)
Mornington P'sula (S) - East
2,696
(6.7%
)
2,634
6.5%)
2,625
(6.5%
)
3,307
(8.2%
)
3,214
(7.9%
)
2,367
(5.8%
)
2.343
(5.8%
)
40,49
3
(6.5%
)
40,49
3
(6.8%
)
40,49
3
(7.2%
)
2,799
(6.9%
)
2,516
(6.2%
)
2,278
(5.6%
)
1,794
(4.4%
)
1,303
(3.2%
)
1,045
(2.6%
)
541
(1.3%
)
541
(1.3%
)
Mornington P'sula (S) - South
2,482
(4.9%
)
2,456
(4.8%
)
2,516
(5.0%
)
2,648
(5.2%
)
2,329
(4.6%
)
2,114
(4.2%
)
2,334
(4.6%
)
50,73
8
(5.9%
)
50,73
8
(5.7%
)
50,73
8
(6.0%
)
3,239
(6.4%
)
3,296
(6.5%
)
4,020
(7.9%
)
3,874
(7.6%
)
3,353
(6.6%
)
2,725
(5.4%
)
2,058
(4.1%
)
2,058
(4.1%
)
Mornington P'sula (S) – West
3,571
(6.1%
)
3,917
(6.6%
)
4,074
(6.5%
)
3,990
(6.8%
)
3,020
(5.1%
)
2,662
(4.5%
)
2,757
(4.7%
)
59,00
7
(7.1%
)
59,00
7
(7.0%
)
59,00
7
(7.1%
)
3,821
(6.6%
)
3,772
(6.4%
)
4,016
(6.8%
)
3,254
(5.5%
)
2,510
(4.3%
)
2,025
(3.4%
)
1,474
(2.5%
)
1,474
(2.5%
)
Frankston - Mornington
6.2% 6% 6.3% 6.9% 6.5% 5.7% 5.8% 7.0% 6.9% 7.0% 6.6% 5.8% 6.2% 5.1% 4.0% 3.2% 2.3% 2.3%
/tt/file_convert/5ab6ed4c7f8b9a6e1c8e492f/document.docx 15

Peninsula
Total for ML
17,456
34,330
17,592
19,277
18,159
16,006
16,318
19,360
19,264
19,558
18,494
16,905
17,269
14,199
11,356
8,934 7,206 6,339
Victoria 6.4% 5.9% 6.1% 6.6% 7.6% 7.6% 7.0% 7.3% 7.1% 7/0% 6.9% 5.8% 5.4% 4.0% 3.2% 2.6% 2.1% 1.9%
Source: Medicare Locals Atlas Data 2011, PHIDU
16

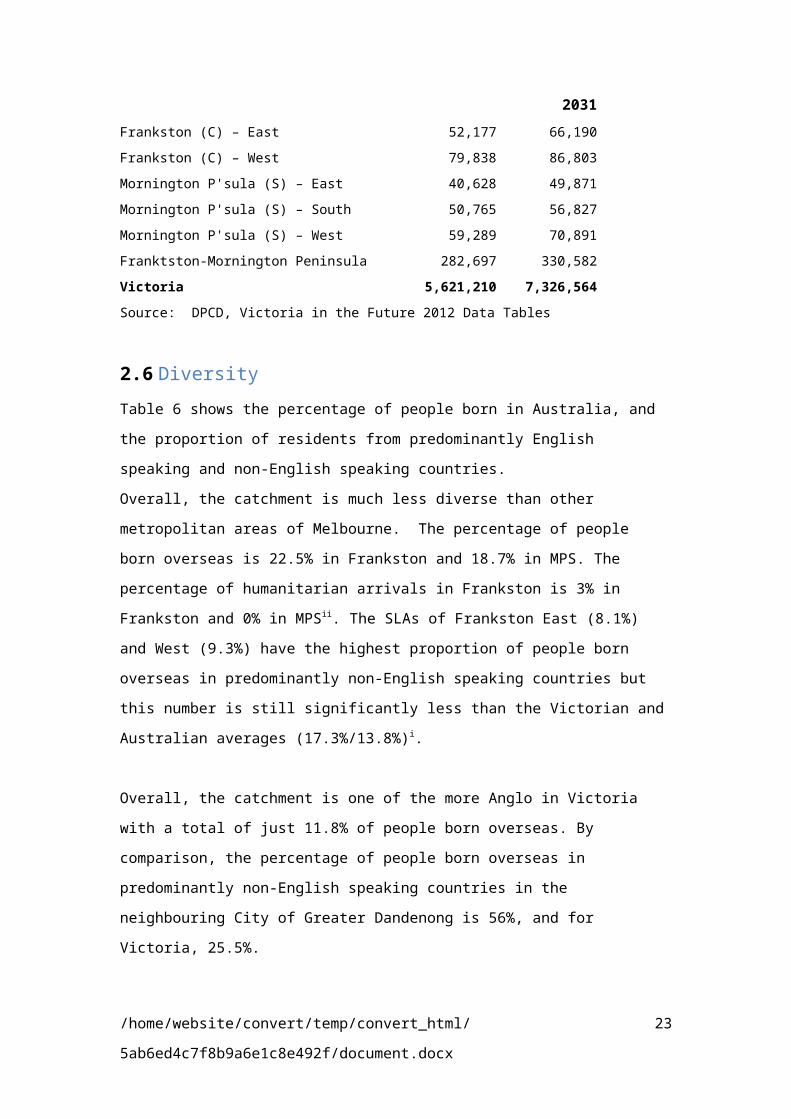
2.5 Population projectionsTable 4 illustrates population projections from 2011 to 2031 by LGA based on DPCD
information. Table 5 shows population projects by SLA. The data shows modest
population growth overall with an expected drop in the numbers of children and
adolescents in the 20 year period of the projections. However, significant growth is
expected in the 65+ yrs age groups in the Mornington Peninsula Shire.
Table 4: Population projections by LGA
LGA Pop 2011 Pop 2021
Pop 2031
Annual % change 2011-2031
% Aged under 20 years
% Aged 65 years or older
2011 2031 2011 2031
Frankston132,000 144,900 153,000 1.4 26 23.3 13.4 13.7
Morningto
n
Peninsula
150,700 164,400 177,600 1.7 24.2 20.2 20.7 29
Victoria 5,621,210 6,500,653
7,326,564 1.1%
Source: DPCD, Victoria in the Future 2012 Data Tables
Table 5: Population projections by SLA
Estimated Resident Population (ERP) 2011 2031Frankston (C) – East 52,177 66,190
Frankston (C) – West 79,838 86,803
Mornington P'sula (S) – East 40,628 49,871
Mornington P'sula (S) – South 50,765 56,827
Mornington P'sula (S) – West 59,289 70,891
Franktston-Mornington Peninsula 282,697 330,582
Victoria 5,621,210 7,326,564
Source: DPCD, Victoria in the Future 2012 Data Tables
/tt/file_convert/5ab6ed4c7f8b9a6e1c8e492f/document.docx 17

2.6 DiversityTable 6 shows the percentage of people born in Australia, and the proportion of
residents from predominantly English speaking and non-English speaking countries.
Overall, the catchment is much less diverse than other metropolitan areas of
Melbourne. The percentage of people born overseas is 22.5% in Frankston and
18.7% in MPS. The percentage of humanitarian arrivals in Frankston is 3% in
Frankston and 0% in MPSii. The SLAs of Frankston East (8.1%) and West (9.3%)
have the highest proportion of people born overseas in predominantly non-English
speaking countries but this number is still significantly less than the Victorian and
Australian averages (17.3%/13.8%)i.
Overall, the catchment is one of the more Anglo in Victoria with a total of just 11.8%
of people born overseas. By comparison, the percentage of people born overseas in
predominantly non-English speaking countries in the neighbouring City of Greater
Dandenong is 56%, and for Victoria, 25.5%.
Table 6: Birthplace and NES residents
SLA name Australian
born
People born
overseas in
predominantly
English speaking
countries
People born
overseas in
predominantly non-
English speaking
countries
Frankston (C) – East 74.0% 10.8% 8.1%
Frankston (C) – West 70.6% 12.7% 9.3%
Mornington P'sula (S) – East 78.6% 10.7% 4.0%
Mornington P'sula (S) – South 73.2% 9.0% 6.5%
Mornington P'sula (S) – West 73.4% 14.5% 5.9%
Total ML209 73.4% 11.8% 7.1%
Victoria 70% 17% 6.4%
Source: Medicare Locals Atlas Data 2011, PHIDU
Of the residents in the catchment from predominantly non-English speaking
countries, the main countries of origin are Germany (0.7%), Netherlands (0.7%), Italy
(0.6%) and Greece (0.4%). Table 7 shows the top 8 countries of origin for each SLA.
18

Table 7: Top 8 countries of birth in FMPPCP catchment
SLA name Germany
Nether-
lands
Italy Greece
Philippines
India China
Malaysia
Frankston (C) - East 204
(0.5%)
374
(0.7%)
202
(0.5%
)
93
(0.2%)
262
(0.6%)
274
(0.6%
)
48
(0.1%
)
64
(0.1%)
Frankston (C) – West 603
(0.8%)
463
(0.9%)
406
(0.5%
)
312
(0.4%)
306
(0.4%)
380
(0.5%
)
286
(0.4%
)
149
(0.2%)
Mornington P'sula (S) - East
210
(0.6%)
283
(0.6%)
111
(0.3%
)
28
(0.1%)
66
(0.2%)
57
(0.2%
)
22
(0.1%
)
37
(0.1%)
Mornington P'sula (S) - South
260
(0.6%)
331
(0.8%)
656
(1.4%
)
369
(0.8%)
87
(0.2%)
45
(0.1%
)
40
(0.1%
)
34
(0.1%)
Mornington P'sula (S) – West
388
(0.7)
361
(0.7%)
246
(0.5%
)
142
(0.3%)
67
(0.1%)
94
(0.2%
)
122
(0.1%
)
105
(0.2%)
Total ML209
1,665 (0.7)
1,812(0.7%)
1,621(0.6%
)944
(0.4%)788
(0.3%)
850(0.3%
)
518(0.2%
)389
(0.2%)
Victoria 0.6% 0.5% 1.7% 1.1% 0.5% 1.1% 1.1% 0.6%
Source: Medicare Locals Atlas Data 2011, PHIDU
2.7 SummaryIn the Mornington Peninsula Shire, population growth since 2000 has been average,
but projected growth to 2022 is lower than average. Persons age 45 plus are over-
represented in the population, particularly persons 65+ in the population. The rate of
private health insurance is higher than average,
In the City of Frankston, population growth since 2000 was similar to that for the rest of the
state but is projected to slow somewhat through to 2022. Frankston’s population is distributed
across age groups representative of the state average. The population is primarily Anglo, and
much less diverse than other areas of Victoria.
/tt/file_convert/5ab6ed4c7f8b9a6e1c8e492f/document.docx 19

3 Small area social and economic data
3.1 SEIFA and IRSEDix
SEIFA is a suite of four summary measures that have been created from 2006
Census information. The indexes can be used to explore different aspects of socio-
economic conditions by geographic areas. For each index, every geographic area in
Australia is given a SEIFA number which shows how disadvantaged that area is
compared with other areas in Australia.
Each index summarises a different aspect of the socio-economic conditions of people
living in an area. They each summarise a different set of social and economic
information. The indexes provide more general measures of socio-economic status
than is given by measuring income or unemployment alone, for example.
The four indexes in SEIFA 2006 are:
Index of Relative Socio-economic Disadvantage (IRSED): is derived from
Census variables related to disadvantage, such as low income, low
educational attainment, unemployment, and dwellings without motor vehicles.
Index of Relative Socio-economic Advantage and Disadvantage (IRSAD): a continuum of advantage (high values) to disadvantage (low
values) which is derived from Census variables related to both advantage and
disadvantage, like household with low income and people with a tertiary
education.
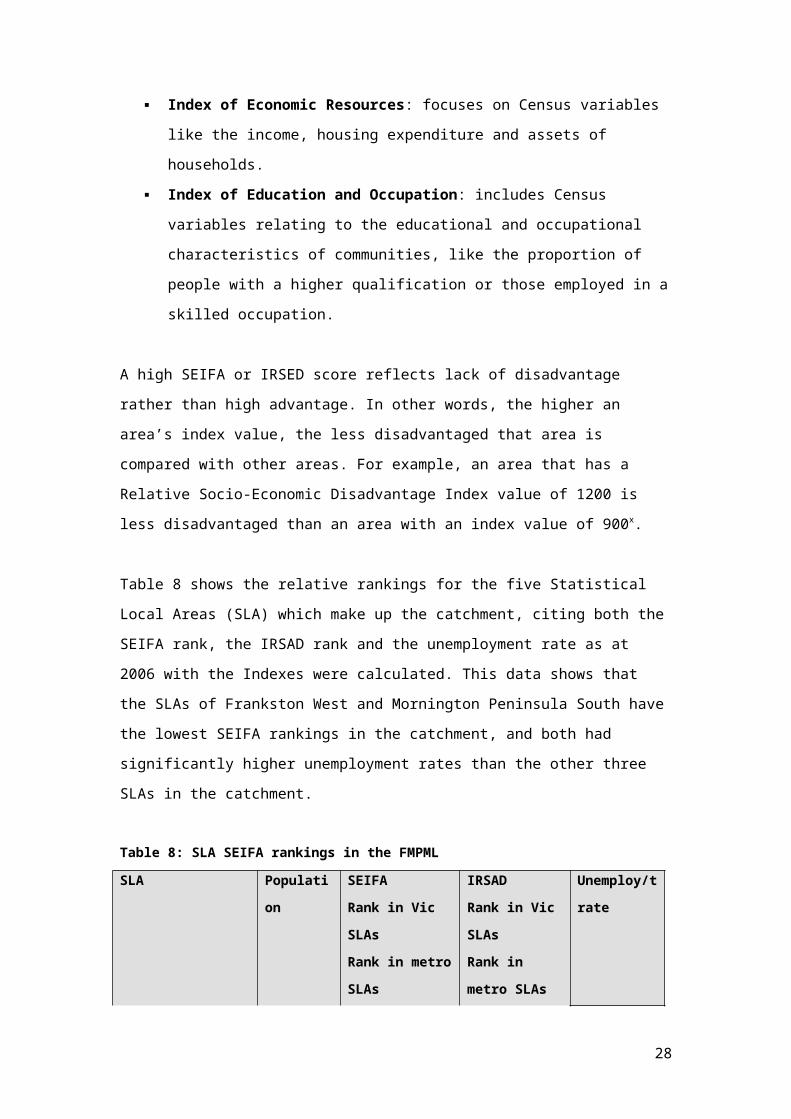
Index of Economic Resources: focuses on Census variables like the
income, housing expenditure and assets of households.
Index of Education and Occupation: includes Census variables relating to
the educational and occupational characteristics of communities, like the
proportion of people with a higher qualification or those employed in a skilled
occupation.
A high SEIFA or IRSED score reflects lack of disadvantage rather than high
advantage. In other words, the higher an area’s index value, the less disadvantaged
that area is compared with other areas. For example, an area that has a Relative
Socio-Economic Disadvantage Index value of 1200 is less disadvantaged than an
area with an index value of 900x.
20

Table 8 shows the relative rankings for the five Statistical Local Areas (SLA) which
make up the catchment, citing both the SEIFA rank, the IRSAD rank and the
unemployment rate as at 2006 with the Indexes were calculated. This data shows
that the SLAs of Frankston West and Mornington Peninsula South have the lowest
SEIFA rankings in the catchment, and both had significantly higher unemployment
rates than the other three SLAs in the catchment.
Table 8: SLA SEIFA rankings in the FMPML
SLA Population
SEIFARank in Vic SLAsRank in metro SLAs
IRSADRank in Vic SLAsRank in metro SLAs
Unemploy/t rate
Mornington P'sula (S) - East
39,388 1,016.20
80/204
54.79
989.53
76/204
59/79
5.5%
Mornington P'sula (S) - South
50,241 988.78
120/204
63/79
964.36
110/204
67/79
8.3%
Mornington P'sula (S) – West
58,399 1,064.84
24/204
21/79
1,060.63
34/204
31/79
3.3%
Frankston (C) - East 51,787 1,026.60
61/204
45/79
1,000.73
65/204
55/79
6%
Frankston (C) - West 78,678 978.55
137/204
67/79
969.82
98/204
65/79
9%
Source: ABS 2006
Table 9 provides the Socio-Economic Index for Areas (SEIFA) ranked by suburb in
the catchment. The SEIFA is derived from weighted data that is used to calculate
scores to Census Collector District (CD) level.
/tt/file_convert/5ab6ed4c7f8b9a6e1c8e492f/document.docx 21

Table 9: Small areas by SEIFA in the catchment
Small Area (most-least disadvantaged) SEIFAFrankston North 832
Hastings 902.5
Frankston Central 921
Seaford 947
Rosebud - Rosebud West - McCrae - Boneo - Fingal - Cape Schanck 952.1
Rye - Tootgarook - St Andrews Beach 982.4
Baxter - Pearcedale 989.5
Dromana-Safety Beach 997.5
Mornington - Moorooduc - Tuerong 1015.7
Bittern - Crib Point 1017.8
Mornington Peninsula Shire 1026.2
Somerville 1037.0
Tyabb 1040.0
Portsea - Sorrento – Blairgowrie 1049.2
Balnarring - Balnarring Beach - Merricks - Merricks Beach – Somers 1077.0
Mount Martha 1086.0
Green Wedge 1088.5
Red Hill - Red Hill South - Merricks North - Main Ridge - Arthurs Seat 1089.2
Flinders - Shoreham - Point Leo 1102.2
Mount Eliza 1110.1
HMAS Cerberus 1117
Source: ABS id profiles for City of Frankston and Mornington Peninsula Shire
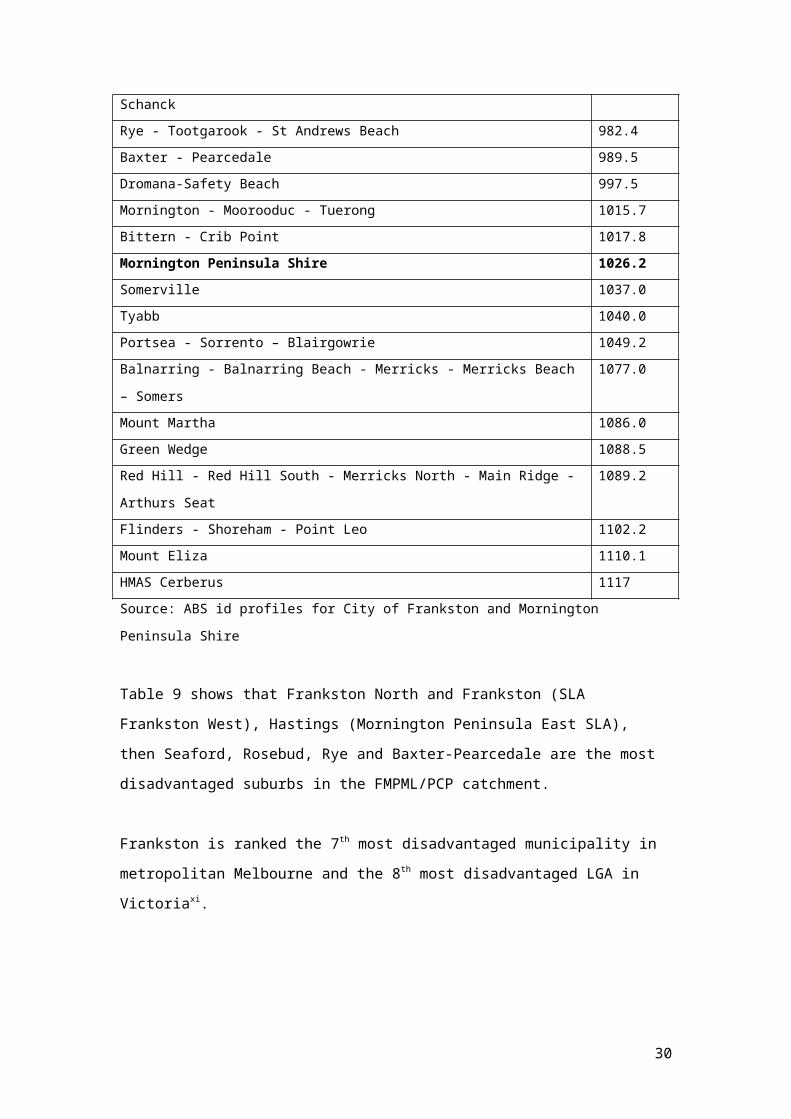
Table 9 shows that Frankston North and Frankston (SLA Frankston West), Hastings
(Mornington Peninsula East SLA), then Seaford, Rosebud, Rye and Baxter-
Pearcedale are the most disadvantaged suburbs in the FMPML/PCP catchment.
Frankston is ranked the 7th most disadvantaged municipality in metropolitan
Melbourne and the 8th most disadvantaged LGA in Victoriaxi.
3.2 Employment/unemployment Participation in employment and unemployment vary widely across the catchment
with the highest unemployment rates in Frankston North, Rosebud West and
Hastings. Table 10 shows that small areas in the catchment that have higher
22
unemployment rates than the Victorian average (5.0%). Overall, the unemployment
rate for the City of Frankston in 2011 was 6.5%, and for MPS, the rate was 4.6%
(Victoria 5.0%)ii.
Table 10: Employment participation and unemployment rates for small areas
Small area Participation rate Unemployment rate
Frankston Nth 53.8% 13.2%
Rosebud West 36.2% 10.9%
Hastings 57.5% 9%
Frankston Central 61.6% 7.7%
Rosebud 47.8% 7.2%
Seaford 63.3% 6.9%
Rye 54.2% 6.6%
Baxter 70% 6.6%
Victoria-wide 5.6%
Source: DPCD Suburbs in Time; id Profiles
3.3 Housing and household income Table 11 shows that Frankston has a lower proportion of affordable rental housing
than the MPS, a higher proportion of families who are welfare dependent, and a
higher percentage of lone parent families. Food security is higher in across the
catchment than for Victoria.
Table 11: Characteristics of housing in the catchment
Indicator Frankston Mornington Peninsula
Victoria
Percentage of households with housing costs greater than 40% of income
10% 8.7% 9.0%
Percentage of rental housing that is affordable
16.9% 25.7% 20.4%
Percentage of low income/welfare dependant families with children
12.2% 8.9% 9.0%
Percentage of population with food insecurity
8.6% 8.7% 6.0%
Percentage of households with income less than $650 per week
32.0% 34.8% 30.6%
Percentage of families headed by one parent/female
20.4%/84.2%
14.9%/83.2%
15.4%/83.5%
Source: Victorian Department of Health 2011 Local Government Area profiles
/tt/file_convert/5ab6ed4c7f8b9a6e1c8e492f/document.docx 23

3.3.1 Household income by quartile The distribution of income across income quartiles demonstrates the concentration of
wealth and disadvantage in each enumerated area of the catchment. Income data
collected by the Census include not only wages and salaries but other income
sources such as shares, government benefits and superannuation. Comparing
median incomes for local government areas (LGAs) is one way of looking at spatial
patterns. Concentrations of public housing stock or high numbers of retirees in
particular locations may lower the median income of these areas.
The data and income levels in Table 12 compare income quartiles in the decade
1996-2006. The data shows the shift of higher income residents towards some areas
(Mt Eliza, Sorrento, Portsea) and increasing concentrations of low-income residents
in other areas (Frankston, Seaford, Rosebud, Rosebud West, Rye and Hastings,
Baxter, Dromana and Safety Beach).
Note that the Melbourne Statistical Division is the comparator, at 25% for each
quartile (ie the four income groups are evenly distributed across the MSD). The
average Australian income was $46,904 in 2008-09 and the average Victorian
income (excluding government pensions and allowances) was $45,246.
The percentage of people on low incomes in Frankston North, Frankston,
Hastings, Baxter-Piercedale, and Tyabb has increased. In other words, these
areas have become more concentrated with low-income households.
Rosebud West: 81% of people are living on the lowest-second lowest income
quartile;
Frankston North: 77.2% of people are on the lowest-second lowest income
quartile;
Rosebud: 72% of the population is on the lowest-second lowest income
Hastings: 69% of households are on the lowest-second lowest income
quartile.
Dromana/Safety Beach: 68.6% of people are on the lowest-second lowest
income quartile.
24

Table 12: Income quartiles by suburbs and areas
1st quartile 2nd quartile 3rd quartile 4th quartileHousehold income
Nil-$2974
7
Nil - $1608
1
$29748-
$56088
$17720 -
$33335
$56089-
$94661
$33336 -
$55918
$94622+
$87528 +
2006 1996 2006 1996 2006 1996 2006 1996
Frankston Nth 43.3% 42% 33.9% 17.6% 19.8% 5.2% 6.4%
Hastings 39% 32% 30% 32% 21% 23% 10% 13%
Frankston
Central
32% 28% 30% 27% 24% 25% 14% 19%
Frankston
South
22.6% 22.1% 25.8% 26.8% 24.7% 24.7% 26.9% 26.3%
Seaford 30% 29% 30% 29% 25% 26% 15% 17%
Rosebud 43% 45% 29% 31% 19% 16% 9% 9%
Rosebud West 50% 51% 31% 30% 15% 16% 5% 6%
Rye 36% 40% 32% 32% 21% 20% 12% 8%
Area 14: Rye - Tootgarook -St Andrews Beach
25.7% 27.4% 26.6% 39.1% 24.2% 22.2% 13.4% 11.4%
Hastings 39% 32% 30% 32% 21% 23% 10% 13%
Baxter-Pearcedale
24% 17% 31% 28% 28% 32% 17% 23%
Dromana-Safety Beach
36.7% 43.3% 30.9v 30.3% 21.8% 16.9% 10.7% 9.5%
Mornington 29% 32% 28% 29% 23% 22% 19% 17%
Area 8:Mornington/Moor-ooduc/Tuerong
22% 23.8% 30.4% 31.7% 26.1% 24.8% 21.4% 19.7%
Bittern-Crib Pt 25.1% 26.6% 27.7% 26% 27.3% 25.2% 20% 22.2%
Somerville 22.4% 19.5% 26% 27.3% 30.8% 30.5% 20.9% 22.8%
Tyabb 20% 19% 29% 27% 32% 29% 19% 24%
Area 1: BalnarringMerricks-Somers
21.2% 23% 26.1% 26.8% 25.4% 23.4% 27.2% 26.8%
Sorrento 28% 37% 27% 37% 17% 21% 28% 15%
Area 11: Portsea – Sorrento-Blairgowrie
36.1% 41.2% 27.8% 29.9% 18.6% 18.4% 17.5% 10.6%
/tt/file_convert/5ab6ed4c7f8b9a6e1c8e492f/document.docx 25

Mt Eliza 15 25 20 21.4 25 21.3 41 32.3
Mount Martha 22.1 21.6 24.8 26.3 25.1 24.3 27.9 27.8
Red Hill - Arthurs Seat
22.1 20.8 21.7 26.2 25.1 24 31.1 28.9
Area 5: Flinders-Shoreham - Point Leo
22.6 23.5 24.7 26 24.4 25 28.2 25.4
Source: DPCD Suburbs in Time
3.4 Social housingPoor health is associated with social housing. Areas where social housing is more
concentrated is an indicator that there is also more concentrated social
disadvantaged, and where services are most needed.
Table 13 shows the number of government rentals for small areas as a percentage of
total housingxii. Note that the MSD average for government rentals for the period was
4.5%. The overall rate of social housing as a percentage of all dwellings is 2.3% for
the MPS and 4.1% for Frankstonii.
Table 13: Social housing in FMPPCP/ML catchment
Suburb Number % Total dwellingsFrankston North 255 11 15,887
Hastings 276 10 2,755
Frankston Central 537 4 14,629
Seaford 261 4 6,783
Rosebud 121 2 4,859
Rosebud West 32 2 2,109
Rye 15 0 3,807
Mornington 375 4 8,605
Baxter 19 3 743
Dromana 23 1 2,159
Tyabb 3 0 510
Source: DPCD, Suburbs in Time
Table 13 shows that the suburbs of Frankston North and Hastings have the highest
proportion of social housing, but Frankston Central has the highest number of social
housing. Mornington has more social housing properties than Frankston North. In
26

2010, there were reported to be about 2500 Frankston local families waiting for social
housingxiii.
3.5 HomelessnessShelter is a pre-requisite of health, and homelessness is therefore, significantly
related to health outcomes. Affordable, appropriate, and adequate housing is argued
to have a marked impact on people’s health, their access to labour markets, and
many other benefitsxiv. Homeless people tend to gravitate towards areas where more
welfare and food relief services are provided. Homelessness numbers are difficult to
count. Undercounting is likely because of the transient nature of homelessness and
the difficulty of counting people who are sleeping rough or ‘sofa-surfing’.
In the City of Frankston at the 2006 census, the estimated number of homeless
people in 2006 was estimated at 775. Across the Frankston-Dandenong Corridor,
there were 1530 homeless people at a rate of 40 per 10,000. This rate is higher than
the Inner City Ring, which estimated there were 5047 homeless people (38 per
10,000); and the number in the Outer City Ring was estimated at 4501 homeless
people (28 per 10,000).
One-fifth (19 per cent) of the homeless in Victoria were teenagers aged 12 to 18
(mainly on their own); 14 per cent of the homeless were children under 12 who were
with one or both parents; 12 per cent were aged 19-24 yrs.
Across Victoria, homeless men outnumbered homeless women, 55 to 45 per cent but
there were more females in the 12-18 age group and roughly equal numbers of
males and females in the 19-24 and under-12 age groups. However, from age 25
onwards men typically outnumber women, about 60 per cent to 40 per centxv.
3.6 Educational attainment/early school leavingTable 14 shows that the educational attainment of the catchment is lower than in
Melbourne as a whole:
Young people aged 15 and over were more likely to have left school at Year 10
or below (36.8% Frankston; 35.5% Mornington Peninsula), compared with the
MSD (27.9%).
Year 12 completion rates were comparatively low (35.8% Frankston and 36.8%
Mornington Peninsula, compared with 48.6% MSD).
/tt/file_convert/5ab6ed4c7f8b9a6e1c8e492f/document.docx 27
Young people living in Frankston were less likely to hold any post-school
qualifications (50.1%) than those on the Mornington Peninsula (46.1%) and
MSD residents (45.9%)xvi.
There is a higher prevalence of disengagement from school at year 10 in
Frankston North, Frankston Central, Karingal and Seaford East. In 2006,
22% of Frankston North teenagers reported disengagement from school at
year 8xvii.
Frankston has higher rates of disengagement (ie no involvement in work or
study) of young men and women aged 15 - 24 in employment or education
(estimated at 14.8%) than the rest of Victoria (10.7%)xviii. Frankston has lower
educational attainment than comparative metropolitan areas and many
workers are employed in work that is vulnerable to economic downturns.
Youth disengagement has negative health and social consequences including
low health literacy, social exclusion, poor mental health and higher risks of
teenage pregnancy as well as violence and crime.
Across the catchment, Aboriginal fulltime participation in secondary school
(62.1%) is higher than the Victorian and Australian averages but participation
in further education is lower (10.4%) than the Victorian average (14.6%) i.
Table 14: Educational attainment in the catchment
Indicator Frankston Mornington Peninsula
Victoria
Full-time equivalent students 20,639 23,464 859,200Percentage of year 9 students who attain national minimum standards in reading
91.9% 94.6% 92.3%
Percentage of year 9 students who attain national minimum standards in writing
87.6% 91.0% 89.4%
Percentage of year 9 students who attain national minimum standards in numeracy
94% 96.2% 94.4%
Percentage who did not complete year 12
60.1% 58.6% 51.3%
Percentage completed higher education qualification
26.0% 31.2% 43.2%
Percentage of students attending government school
76.7% 68.8% 63.7%
Source: Victorian Department of Health 2011 Local Government Area profiles
28

3.6.1 Health literacyHealth literacy levels are thought to more accurately predict health status than
education level, income, ethnic background, or any other socio-demographic
variablexix. Health literacy is a compilation of reading, writing, numeracy and problem
solving skills as well as self-report data on health status. Health literacy is closely
related to general literacy and education levels (Table 13). ABS data shows that in
Australia:
57% of the population have a health literacy level that is less than optimal for
health maintenance;
43% have a health literacy level that is adequate, and
6% are rated as having a high health literacy levelxx.
People with low literacy experience difficulty understanding and using health
information and health services. This means there is an imbalance between the skills
of people and the demands of the health care system as people seek access to
services and the information they need to make informed health-care decisions.
Addressing health literacy through health information and clinical encounters is
therefore, critical to transforming health care quality and to achieving better health
outcomesxxi.
3.7 Crime, safety and violence Crime affects health in a number of ways, directly, indirectly and by influences on the
health care system. Crime affects health:
Directly, eg through violence, injury, rape and other offences against the
person.
Indirectly, through the psychological and physical consequences of
injury, victimisation and isolation because of fear. These effects persist
across time.
As a determinant of illness, along with poverty and other inequalities,
which increase the burden of ill-health on those communities least able
to cope.
By reducing the effectiveness of our health care systems through
violence against staff, damage to patients and property, and revenue
lost in replacement, liability/risk, repair and security.
By preventable health burdens, such as alcohol-related crime, motor
vehicle incidents and drug dependencyxxii.
/tt/file_convert/5ab6ed4c7f8b9a6e1c8e492f/document.docx 29
In 2010, there were 11,517 reported crimes in Frankston. In 2011, the total
number of reported crimes was 11,009, which is a rate 1.3 greater than the
crime rate in Victoria during this period.
In 2010, there were 8221 reported crimes in the Mornington Peninsula, and
8389 in 2011, which is a rate of 0.8 of the Victoria rate during this period.
Table 14: Crime and safety
Indicator Frankston Mornington Peninsula
Victoria
Family incidents per 1,000 population 12.5 6.7 7.4
Drug usage and possession offences per 1,000 population
2.3 1.4 1.9
Total offences per 1,000 population 88.4 52.9 64.7
Percentage who feel safe on street alone after dark
57.1% 64.3% 58.9%
Source: Victorian Department of Health 2011 Local Government Area profiles
The impact on the burden of disease on women of intimate partner violence is more
than the impact of alcohol, overweight and tobacco combinedxxiii. The impact of
violence on children is well documented as having the potential for lifelong health
consequences, particularly on mental health.
Frankston City is ranked top of all metropolitan LGAs for incidences of family
violence, and the 3rd highest in the whole of Victoria. Per 100,000 people, the
average rate of family violence in the Melbourne Metropolitan region was 622
for 2009/2010 while the Frankston average was almost double at 1147 for the
same period (up from 1102 in 2006-7)xxiv.
Mornington Peninsula has the 10th highest rate (in raw data), and when
population data is factored in, it has the 27th highest rate in Victoria of family
violence incidencesxxv.
3.8 Child protection reports Frankston North has a very high proportion of child protection notifications at
a rate of 11.9 per population for 1,000xxvi.
Rates of child abuse substantiations in Frankston North are double that of the
SMR overall.
Hastings has the highest rate of child protection notifications and re-
30

notifications in the MPS xxvii and triple the child protection substantiations than
the SMR overall.
In 2009 - 2010, the rate of child protection substantiations for adolescents
across Frankston was 6.9 per 1000 adolescents. This was greater than the
rate across Victoria (4.4 per 1000 adolescents);
In 2009 - 2010, the rate of child protection substantiations in the Mornington
Peninsula Shire was 4.8 per 1000 adolescents. This was greater than the rate
across Victoria (4.4 per 1000 adolescents).
3.9 Adolescent crime In 2009 - 2010, 18.7 per 1000 adolescents in Mornington Peninsula were
victims of a reported crime. This was greater than the rate across Victoria (17.5
per 1000 adolescents);
In 2009 - 2010, 69.3 per 1000 adolescents in Mornington Peninsula were
alleged offenders of crime. Of the 1050 alleged offences committed by an
adolescent in Mornington Peninsula, 17.5 per cent were crimes against the
person and 70.2 per cent were crimes against property;
In 2009 - 2010, 24.4 per 1000 adolescents in Frankston were victims of a
reported crime. This was greater than the rate across Victoria (17.5 per 1000
adolescents);
In 2009 - 2010, 114.1 per 1000 adolescents in Frankston were alleged
offenders of crime. Of the 1603 alleged offences committed by an adolescent in
Frankston, 13.4 per cent were crimes against the person and 76.6 per cent
were crimes against property.
3.10 Electronic gaming machine (EGM) expenditureTable 16 shows the EGM expenditure for the two LGAs in the catchment. Note that
EGM expenditure is defined as total losses by players, and is updated in June each
year by the Victorian Department of Justice.
Table 16: City of Frankston EGM expenditurexxviii
Frankston FY 2007/2008 FY 2008/2009 FY 2009/2010 FY 2010/2011
Hotels at 30 June 6 6 6 6
Clubs at 30 June 4 4 4 4
Expenditure $71,434,982.29 $73,857,640.29 $68,927,253.44 $69,950,584.46
EGMs at 30 June 583 591 596 596
/tt/file_convert/5ab6ed4c7f8b9a6e1c8e492f/document.docx 31

EGMs per 1000 adults
5.94
Expenditure/adult $697
Victorian average $613
Mornington Peninsula Shire EGM dataxxix
MPS FY 2007/2008 FY 2008/2009 FY 2009/2010 FY 2010/2011
Hotels at 30 June 12 12 12 11
Clubs at 30 June 7 6 6 6
Expenditure $84,645,644.61 $86,604,558.10 $80,949,275.2 $83,220,508.82
EGMs at 30 June 850 842 842 826
EGMs per 1000 adults
7.09
Expenditure/adult $714
Victorian average $613
The Victoria-wide expenditure per adult in 2010-2011 was $613, and there were 6.19
EGMs per 1000 adults.
The City of Frankston has fewer machines per adult population than the state
average but the expenditure per adult is higher.
The Mornington Peninsula Shire has more machines than the state average,
and the expenditure is also higher.
The total losses across the catchment to EGMs in 2010-2011, was
$153,171,092.
3.11SummaryThe socio-economic data shows that there are small areas that can be called ‘hot-
spots’ of disadvantage which warrant close attention in health service and program
delivery. Key issues are that over 20% of families have one parent, the highest
percentage in the state. Child protection issues in Frankston are one of the highest in
Victoria. Gambling machine losses are higher than the state average.
The proportion of low-income individuals and households across the catchment is
slightly below average, but there is a higher than average level of housing stress, and
percentages of affordable rental housing are relatively low.
32

4 Child healthThe social gradient in health is most apparent in the data about children. There is a
strong correlation between the most disadvantaged areas of the catchment and
children’s health status, and socio-economic wellbeing. There is a need to document
the extent of early childhood intervention services for vulnerable children in the
catchment, community paediatrician services, pre-school attendance and dental/oral
health of children.
4.1 Children in jobless families
Children growing up in jobless households lack the role model of a working
adult – a factor often identified as affecting educational and future labour
market achievements of children…one of the two most important factors which
can contribute to child poverty is whether or not children are living with parents
who are joblessxxx,xxxi.
The importance of an indicator that counts the number of children living in jobless
families is recognised by the ABS. Parental joblessness may contribute to child social
exclusion and also has an adverse impact on children’s health. Family joblessness
puts children at a higher risk of mental health and development problems, and can
create further social problems such as violence in familiesxxxii. Table 17 shows the
numbers of children under 15 yrs in jobless families.
Table 17: Children under 15 yrs in jobless families (2006)
SLA Number of children in jobless families 2006
Number of children in jobless Aboriginal families 2006
Single parent families with children under 15 yrs
Jobless families with children under 15 yrs/per cent of total families
Risk of children in jobless families 2006
Frankston (C) East
1094 17 1,293 616(10.6%)
11.24%
Frankston (C) West
2483 61 2,366 1,478(20.4%)
20.86%
Mornington P'sula (S) – East
997 25 967 554(13.3%)
14.2%
Mornington P'sula (S) – South
1013 23 1,001 597(16.3%)
16.72%
Mornington P'sula (S) – West
850 18 1,039 482(8.7%)
10.07%
/tt/file_convert/5ab6ed4c7f8b9a6e1c8e492f/document.docx 33

Total 6437 6,666(9.9%)
14.1%
Victoria 13.8% 8.0% 13.7%Source: Medicare Local Social Atlas 2011, NATSEM SLA risk quintilesxxxiii
The number of children under the age of 15 years in jobless families in the catchment
was above 18%. The risk rate for children under 15 years of age being in a jobless
family is highest in the SLAs of Frankston West and Mornington while Frankston
West has the highest actual number of children living in jobless familiesxxxiii.
3.12AEDI
The early child period is considered to be the most important developmental
phase throughout the lifespan...what happens to the child in the early years is
critical for the child’s developmental trajectory and lifecoursexxxiv
This section reports on the Australian Early Development Index (AEDI) for Frankston
and Mornington Peninsula. The AEDI is a population measure of children’s
development as they enter school. Based on the scores from a teacher-completed
checklist, the AEDI measures five areas, or domains, of early childhood
development:
physical health and wellbeing;
social competence;
emotional maturity;
language and cognitive skills (school-based);
communication skills and general knowledge.
The AEDI is a reliable measure of how young children are developing in different
communities. Like a census, it involves collecting information to help create a
snapshot of early childhood development across Australia. Overall in Australia, 23.6
per cent of children are developmentally vulnerable on one or more domain/s.
Overall in Australia, 11.8 per cent of children are developmentally vulnerable on two
or more domains. There are higher proportions of children living in the most socio-
economically disadvantaged communities who are developmentally vulnerable on
each of the AEDI domains.
34

3.12.1 AEDI Mornington Peninsula Shirexxxv
The AEDI for the MPS when children were surveyed in 2009 comprised 34 schools
and 1438 children The MPS AEDI survey included 6 (0.3%) Aboriginal Australian
children, 45 (2.5%) of children who were born overseas, and 32 (1.8%) who speak a
language other than English at home. Data was obtained from schools in all
postcodes in the MPS. Overall in Mornington Peninsula, 23.3 per cent of children
were developmentally vulnerable on one or more domain/s of the AEDI and 10.6 per
cent were developmentally vulnerable on two or more domains.
The areas of concern in the MPS are:
Tootgarook - 46.4% of children who were developmentally vulnerable on
one or more domains and 32.1% of children who were developmentally
vulnerable on two or more domains.
Hastings - 46% of children who were developmentally vulnerable on one or
more domains and 23.8% of children who were developmentally vulnerable
on two or more domains.
Somers - 20% of children who were developmentally vulnerable on two or
more domains.
Somerville - 13% of children who were developmentally vulnerable on two
or more domains.
3.12.2 AEDI City of Frankstonxxxvi
The AEDI for Frankston was completed across 86 primary schools and 1,489
children in their first year of full-time school in 2009. The areas included were Carrum
Downs, Frankston, Frankston North, Frankston South, Langwarrin/Langwarrin South,
Seaford, Skye. The survey included 13 (0.9%) Aboriginal Australian children, 79
(5.3%) children who were born overseas, and 66 (4.4%) who speak a language other
than English at home.
The areas of concern in Frankston are:
North Frankston - of the 54 children surveyed, 100 per cent were
developmentally vulnerable on all five domains.
Frankston - 25.1% of children were developmentally vulnerable on one or
more domain/s of the AEDI and 14.7% who were developmentally
vulnerable on two or more domains.
/tt/file_convert/5ab6ed4c7f8b9a6e1c8e492f/document.docx 35

Carrum -19.1% of children were developmentally vulnerable on two or
more domains.
Skye -16.3% of children were developmentally vulnerable on two or more
domains.
A total of 139 (9.3%) children had attended an early intervention program but much
more needs to be known about the type of early intervention available, to what extent
children’s needs are being met by those programs and what gaps exist.
3.13Child health vital statisticsChild health vital statistics include infant mortality, child mortality and immunisation
status. Data from the 2011 Medicare Atlas are only available from 2007-8. Up to date
immunisation data is available from the Australian Childhood Immunisation Register
– the most recent data for immunisation status of children is shown in Table 19.
Table 18 (2007-8) shows that by SLA:
the immunisation status of children was lowest in the SLAs of Mornington
Peninsula South and West;
In the period 2003-08, infant deaths were significantly higher in the SLA of
Mornington Peninsula South than the Victorian and Australian rates;
In the period 2003-2007, child mortality (under 5 yrs) was significantly higher
in the SLA of Mornington Peninsula South than the Victorian and Australian
rates.
36
Table 18: Child health vital statistics
Immunization status of children September 2007 Infant deaths 2003-2008
(per 1,000 live births)Child mortality under 5 yrs 2003-07
SLAChildren fully immunised at
12 to <15 mths
Children at 12 to <15 months
% children immunised
Infant deaths Births Av
annual IDR
Deaths of children under five yrs of age
Children under five years of age
Avannual rate/
100,000
Frankston (C) - East 203 217 93.5 17 3,487 4.9 18 3,474 103.6
Frankston (C) - West 243 263 92.4 26 4,503 5.8 27 4,312 125.2
Mornington P'sula (S) -
East 115 124 92.7 12 2,403 5.0 12 2,448 98.0Mornington P'sula (S) -
South 121 143 84.6 23 2,252 10.2 24 2,304 208.4Mornington P'sula (S) -
West 161 183 88.0 14 2,965 4.7 17 3,294 103.2ML209 843 930 90.6 92 15,610 5.9 98 15,832 123.8
Victoria ML total 7,269 1,293,465 112.4 1,494 328,670 4.5 1,723 319,702 107.8
Australia 68,386 74,931 91.3 68,386 74,931 91.3 7,269 1,293,465 112.4Source: Australia Medicare Local Data 2011, PHIDU
/tt/file_convert/5ab6ed4c7f8b9a6e1c8e492f/document.docx 37

3.13.1 Immunization status of children February 2012The Australian Childhood Immunisation Register for February 2012 data is shown in
Table 19. Data from 2007-8 (Table 18) and 2011 (Table 19) shows that rates of
immunisation across the catchment have improved since 2007. In 2011, the
Peninsula General Practice Network ranked 31 of 113 Divisions nationwide for
immunisation status of children, and the two Local Governments are also important
providers of immunisation services.
Table 19: Immunisation status for the catchment, February 2012
Age range (months)
Number of children
% of children Number fully immunised
% fully immunised
0 to < 4 901 3.5 874 97.0
4 to <12 2339 9.0 2108 90.1
12 to < 18 1763 6.8 1500 85.1
18 to <48 9397 36.3 8844 94.1
48 to <84 11493 44.4 10274 89.4
Overall 25893 100.0 23600 91.1
Source: Australian Childhood Immunisation Register 2012
3.14Low birth-weight babiesLow birth weight rates include babies both live born and still-born weighing less
than 2500 grams at birthxlix. Table 20 shows that Frankston East and West had the
highest rates of low birth weight babies in the catchment, which are significantly
higher than the rates for Australia and Victoria for this indicator. Over the catchment,
665 babies were born with low birth weight.
Table 20: Low birth weight babies (2006-2008)
SLALow birth weight
babiesBirth
s% low birth weight
babiesFrankston (C) - East 179 2,276 7.9
Frankston (C) - West 232 3,129 7.4
Mornington P'sula (S) -
East 76 1,464 5.2
Mornington P'sula (S) -
South 92 1,425 6.5
Mornington P'sula (S) -
West 86 1,810 4.8
ML209 665 10,10 6.6
38

4
Australia 6.5
Victoria 6.6
Source: Australia Medicare Local Data 2011, PHIDU
3.15SummaryThe data on children in the FMPML/PCP catchment is consistent with the social
gradient. Key issues for children are the rates of child protection in the City of
Frankston; the numbers of low-birth weight babies in the City of Frankston which are
higher than the Victorian average; the number of developmentally vulnerable children
in Frankston North, Frankston, Carrum and Skye, as well as Hastings, Tootgarook,
Somers and Somerville.
/tt/file_convert/5ab6ed4c7f8b9a6e1c8e492f/document.docx 39

4 Adolescent healthThis section draws on the Adolescent Community Profiles prepared by the Victorian
Department of Education and Early Childhood Development. The Profiles draw on
data on outcomes for children compiled through the Victorian Child and Adolescent
Monitoring System (VCAMS)xxxvii.
4.2 Adolescent demographicsDemographics are set out in Table 3. In summary:
An estimated 14,047 adolescents aged 10 to 17 reside in Frankston,
representing 10.9 per cent of the area's total population;
Based on DPCD projections, the population aged 10 to 17 years in
Frankston is expected to increase by 5.1 per cent from 13,928 in 2006 to
14,636 by 2026xxxviii;
An estimated 15,157 adolescents aged 10 to 17 reside in Mornington
Peninsula, representing 10.2 per cent of the area's total population.
Based on DPCD projections, the population aged 10 to 17 years in
Mornington Peninsula is expected to decrease by 7.2 per cent from 15,290
in 2006 to 14,183 by 2026xxxix;
4.3 Teenage pregnancy and safe sex In 2008, the rate of babies born to teenage women in Frankston was 16.4 per
1000 women aged 15 to 19 years. This was greater than the rate in Victoria
(10.6 per 1000 teenage women) and double the rate of the Mornington
Peninsula Shire.
In 2008, the rate of babies born to teenage women in Mornington Peninsula
was 8.4 per 1000 women aged 15 to 19 years. This was lower than the rate in
Victoria (10.6 per 1000 teenage women)xl.
In 2009, 63.5 per cent of sexually active adolescents surveyed in Mornington
Peninsula reported that they practiced safe sex by using a condom. This was
higher than, but not significantly different to that reported across Victoria (58.1
per cent);
4.4 Alcohol and other drugs In 2009, 47.3 per cent of adolescents aged 12 to 14 surveyed in Mornington
40

Peninsula had ever consumed alcohol, while 25.3 per cent had consumed
alcohol in the past 30 days. Among older adolescents aged 15 to 17 years, the
proportions were significantly higher, with 74.0 per cent having ever consumed
alcohol and 55.9 per cent having done so in the last 30 days;
In 2009, 6.7 per cent of adolescents aged 12 to 14 years in Mornington
Peninsula had tried marijuana, 7.0 per cent had sniffed glue or chromed and
0.0 per cent had tried another form of illegal drugs. Among older adolescents
aged 15 to 17 years in Mornington Peninsula, 12.5 per cent had tried
marijuana, 7.1 per cent had sniffed glue or chromed and 3.7 per cent had tried
another form of illegal drugs;
In 2009, 54.5 per cent of adolescents aged 12 to 14 surveyed in Frankston, had
ever consumed alcohol, while 24.2 per cent had consumed alcohol in the past
30 days. Among older adolescents aged 15 to 17 years, the proportions were
significantly higher, with 75.0 per cent having ever consumed alcohol and 50.1
per cent having done so in the last 30 days;
In 2009, 2.7 per cent of adolescents aged 12 to 14 years in Frankston had tried
marijuana, 10.1 per cent had sniffed glue or chromed and 0.5 per cent had tried
another form of illegal drugs. Among older adolescents aged 15 to 17 years in
Frankston, 19.4 per cent had tried marijuana, 5.3 per cent had sniffed glue or
chromed and 3.6 per cent had tried another form of illegal drugs.
4.5 Smoking In 2009, 14.7 per cent of adolescents aged 12 to 14 years in Mornington
Peninsula and 34.3 per cent of older adolescents (aged 15 to 17 years),
reported that they had smoked cigarettes;
In 2009, 16.7 per cent of adolescents aged 12 to 14 years in Frankston and
43.9 per cent of older adolescents (aged 15 to 17 years), reported that they
had smoked cigarettes. Self-reported smoking rates are higher for males than
females and are significantly higher in Frankston than then MPS (Table 20).
4.6 Physical health Fewer teenagers (20.7%) reported eating the minimum recommended serves
of fruit and vegetables each day compared to the adolescent population of
Victoria;
16.3 per cent of adolescents surveyed in Mornington Peninsula did the
/tt/file_convert/5ab6ed4c7f8b9a6e1c8e492f/document.docx 41

recommended amount of physical activity every day. This was higher than, but
not significantly different to the proportion reported across Victoria (12.3 per
cent);
In 2009, 12.6 per cent of adolescents in Frankston reported eating the
minimum recommended serves of fruit and vegetables each day. This was
lower than the proportion reported across Victoria (19.0 per cent);
In 2009, 11.2 per cent of adolescents surveyed in Frankston did the
recommended amount of physical activity every day. This was lower than, but
not significantly different to the proportion reported across Victoria (12.3 per
cent);
In 2009, 70.2 per cent of adolescents in Frankston felt that they could access
dental health services if needed which means that about 29.2% of
adolescents did not feel that they could access dental health services if
needed. (Victorian proportions 78.3/21.7per cent)xli.
42

5 Adult health in the FMPML/PCP catchmentAdult health indicators are commonly measured in terms of disease rates for
respiratory illness (asthma and COPD), cardiovascular disease and diabetes as well
as risk factors particularly smoking, nutrition, alcohol, and physical activity.
5.1 Health behavioursTable 21 summaries health behaviours provided through the Victorian Population
Health Survey and reported by the Department of Healthii.
Table 21: Self-reported health behaviours 2011
Indicator Frankston Mornington Peninsula
Victoria
Percentage of persons 18+ who are current smokers
24.1% 23.7% 19.1%
Percentage of females 18+ who are current smokers
23.3% 22.5% 16.9%
Percentage of males 18+ who are current smokers
24.2% 23.1% 21.4%
Percentage of 15 to 17 year olds who reported they had smoked cigarettes
19.2% 12.8% n/a
Percentage of persons at risk of short-term harm from alcohol consumption
12.2% 16.8% 10.2%
Percentage of 15 to 17 year olds who drank alcohol in the last 30 days
50.1% 55.9% n/a
Percentage of females who do not meet fruit and vegetable dietary guidelines
46.7% 40.1% 41.9%
Percentage of males who do not meet fruit and vegetable dietary guidelines
59.8% 56.1% 54.8%
Percentage of females who do not meet physical activity guidelines
27.5% 28.2% 27.2%
Percentage of males who do not meet physical activity guidelines
30.9% 30.7% 27.5%
Percentage of adolescents who adopt sun smart behaviours
1.2% 4.6% n/a
Percentage of infants fully breastfed at three months
44.2% 50.9% 51.2%
Percentage of children fully immunised at 24–27 months
93.3% 92.9% 93.1%
Breast cancer screening participation 54.1% 58.1% 55.9%
Cervical cancer screening participation 59.9% 66.6% 63.1%
Source: Victorian Department of Health (2012) Mornington Peninsula (S) and Frankston (C) 2011 Local Government Area Profiles.
Smoking rates, alcohol consumption, and Sun-Smart behaviours among adolescents
are of particular note and indicate potential areas for prevention and health
promotion.
/tt/file_convert/5ab6ed4c7f8b9a6e1c8e492f/document.docx 43

5.2 Chronic conditions Table 22 presents avoidable risk factor data by SLA. The data shows the
following:
Smoking rates are higher than the Victorian average in many parts of the
LGA, and deaths from lung cancer are higher than the Victorian average;
smoking cessation among low-income communities is therefore, a priority.
Rates of male smokers are higher than Victorian and Australian rates, in four
of five SLAs in the catchment (Frankston East, Frankston West, Mornington
Peninsula East, and Mornington Peninsula West), with Mornington Peninsula
South have the highest rates. Males in Mornington Peninsula South have the
highest rate of 25.5%.
Rates of risky alcohol consumption are higher across the catchment than the
Victorian average rate;
The rates of Type 2 diabetes are slightly higher than the Victorian Medicare
Local and Australian rates;
People with at least one of the four major health risk factors is highest in
Frankston West and Mornington Peninsula South.
The rates of circulatory system disease are higher across the whole
catchment than for Victoria and Australia, and are highest in Frankston West
and Frankston East SLAs;
o The rates of high cholesterol are slightly higher in the Mornington
Peninsula South SLA;
o The rates of hypertensive disease are higher than rates for Victoria
and Australia across the catchment but are highest in Frankston East
and Mornington Peninsula East SLAs;
Rates of asthma are about the same as Victoria and Australian rates;
Rates of COPD are slightly higher across the catchment than the Victorian
and Australian rates, particularly in Frankston West;
Rates of musculoskeletal disease and arthritis are about the same as
Victorian and Australian rates;
Table 23 shows cancer rates by SLA in the catchment:
Rates of death from colorectal cancer are significantly higher than
Victorian and Australian rates in Frankston East and slightly higher in
Frankston West;
44

Rates of death from lung cancer are significantly higher than Victorian and
Australian rates in Frankston East and Frankston West, and slightly
higher in Mornington Peninsula South and Mornington Peninsula East.
/tt/file_convert/5ab6ed4c7f8b9a6e1c8e492f/document.docx 45
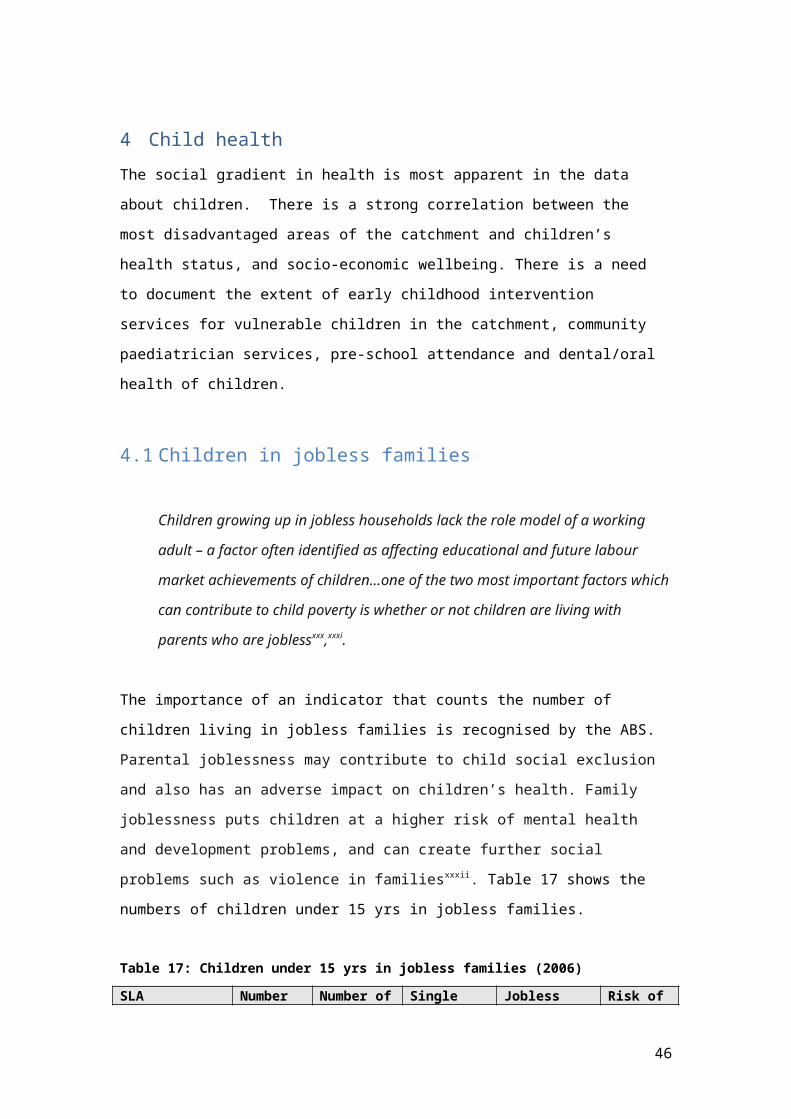
Table 22: Estimates of chronic disease and risk factors 2007-8 – synthetic predictions
2007-8 Type 2 diabetes High cholesterol Circulatory system disease Hypertensive disease
SLA Number Rate/
100
SR Number Rate/100 SR Number Rate/100 SR Number Rate/100 SR
Frankston (C) - East 1,175 3.3 96 1,938 5.2 92 6,662 17.8 111 4,062 11.4 124
Frankston (C) - West 3,031 3.5 102 4,717 5.5 99 15,381 18.0 112 9,202 10.6 115
Mornington P'sula (S) - East 1,243 3.3 96 2,010 5.3 94 6,655 17.6 110 4,158 11.0 119
Mornington P'sula (S) - South 2,678 3.4 101 4,145 5.7 103 12,913 17.6 110 8,278 10.6 115
Mornington P'sula (S) - West 2,118 3.1 91 3,547 5.4 96 10,622 16.2 101 6,313 9.3 101ML209 10,245 3.3 98 16,357 5.5 98 52,233 17.4 109 32,012 10.4 113
Victoria ML total 184,759 3.4 100 291,386 5.4 97 934,903 17.2 108 556,660 10.3 111
Australia 721,276 3.4 100 1,179,909 5.6 100 3,383,308 16.0 100 1,945,801 9.2 100
2007-8 Asthma COPD Musculoskeletal system diseases Arthritis
SLA Number Rate /100 SR Number Rate / 100 SR Number Rate/ 100 SR Number Rate / 100 SR
Frankston (C) - East 4,424 9.3 95 936 2.3 98 12,213 29.7 99 5,381 14.5 97
Frankston (C) - West 7,524 9.7 100 2,073 2.5 108 25,081 30.5 101 12,912 15.1 102
Mornington P'sula (S) - East 3,797 9.7 100 896 2.4 103 11,425 30.2 100 5,546 14.7 99
Mornington P'sula (S) - South 4,765 9.8 101 1,589 2.4 104 19,213 30.7 102 10,968 15.0 101
Mornington P'sula (S) - West 5,327 9.5 98 1,381 2.2 96 18,054 29.6 98 9,375 14.3 96ML209 25,837 9.6 99 6,875 2.4 102 85,985 30.2 100 44,182 14.8 99
Victoria ML total 490,980 9.1 94 121,532 2.2 97 1,612,391 29.9 99 789,092 14.6 98Australia 2,049,713 9.7 100 490,043 2.3 100 6,346,445 30.1 100 3,135,108 14.9 100
46

2007-8 Male current smokers 18 yrs +
Female current smokers 18 yrs +
Alcohol consumption at levels considered to be a high
risk to health (synthetic prediction), persons aged 18
+ yrs
People with at least one of four health risk factors - smoking, harmful use of alcohol, physical inactivity, obesity - 18 + yrs
SLA Number Rate /100 SR Number Rate / 100 SR Number Rate/ 100 SR Number Rate / 100 SR
Frankston (C) - East 4,342 24.6 110 3,754 20.5 113 1,882 5.4 100 18,328 54.4 97
Frankston (C) -
West 6,984 24.5 109 6,262 20.7 114 3,213 5.4 101 34,702 57.1 102
Mornington P'sula
(S) - East 3,428 24.0 107 2,928 20.2 111 1,602 5.5 102 15,312 53.2 95
Mornington P'sula
(S) - South 4,071 25.5 114 3,565 20.1 111 1,940 5.5 103 23,172 57.2 102
Mornington P'sula
(S) - West 3,610 19.4 87 3,503 16.7 92 2,088 5.2 97 20,912 48.8 87
ML209 3,754 20.5 113 20,012 19.7 108 10,725 5.4 100 112,426 54.4 97
Victoria ML total 444,875 21.9 98 444,875 21.9 98 192,671 4.7 87 2,226,958 53.7 96
Australia 1,779,203 22.4 100 1,495,094 18.2 100 866,057 5.4 100 9,025,496 55.9 100
Source: Australia Medicare Local Data 2011, PHIDU
2007-8 Obese males 18+ years (synthetic prediction)
Obese females 18+ years (synthetic prediction)
Males in normal weight range 18+ years (synthetic
prediction)
Females in normal weight range 18+ years (synthetic
prediction)
/tt/file_convert/5ab6ed4c7f8b9a6e1c8e492f/document.docx 47

SLA Number Rate
/100SR
Number Rate
/100SR
Frankston (C) - East 2,898 17.4 89 2,958 17.4 106 5,202 31.3 101 6,014 34.3 88
Frankston (C) - West 6,069 20.7 106 5,404 17.0 104 8,244 28.2 91 10,813 34.9 90
Mornington P'sula (S) - East 2,510 17.4 89 2,552 17.4 106 4,548 31.2 100 4,919 34.4 88
Mornington P'sula (S) - South 4,041 25.5 105 3,738 17.0 103 5,283 28.6 92 6,820 34.8 89
Mornington P'sula (S) - West 3,402 20.7 84 3,202 13.7 84 6,495 33.2 107 8,815 40.8 105
ML209 18,929 18.8 96 17,853 16.4 100 29,773 30.3 97 37,381 35.9 92Victoria ML total 355,824 21.6 110 330,289 16.9 97
Australia 19.6 100 16.4 100
Source: Australia Medicare Local Data 2011, PHIDU
Table 23: Avoidable deaths 0-74 yrs – Cancer
2007-8 Avoidable deaths 0-74 yrs:Colorectal cancer
Avoidable deaths 0-74 yrs:Lung cancer
Avoidable deaths 0-74 yrs:Cancer
SLANumber
Average annual rate per 100,000 Number
Average annual rate per 100,000 Number
Average annual rate per 100,000
Frankston (C) - East 23 15.7 39 27.4 111 74.3
Frankston (C) - West 48 12.0 100 24.8 286 71.9
Mornington P'sula (S) - East 17 9.9 42 24.7 109 63.8
Mornington P'sula (S) - South 33 8.8 87 22.6 238 65.5
Mornington P'sula (S) - West 25 8.2 61 19.7 169 56.0
ML209 146 10.4 329 23.3 74.3
Victoria ML total 10,487 10.9 20,534 21.4 59,476 62.0
48

Australia 2,693 11.3 4,916 20.6 59,476 62.0
Table 24: Chronic diseases – mental health
2007-8
Males with mental and behavioural problems (synthetic projection)
Males with mood (affective) problems
(synthetic prediction)
Females with mental and behavioural
problems (synthetic projection)
Females with mood (affective) problems
(synthetic prediction)
High or very high psychological distress (K-10) (synthetic prediction)persons aged 18 yrs or
over
NumberRate per
100Number
Rate per 100
NumberRate per
100Number
Rate per 100
NumberRate per
100
Frankston (C) - East 2,207 9.6 2,207 9.6 2,705 11.6 2,705 11.6 4,071 11.9
Frankston (C) - West 4,175 11.1 4,175 11.1 5,133 12.9 5,133 12.9 7,947 13.1
Mornington P'sula (S) - East 1,942 10.0 1,942 10.0 2,279 12.0 2,279 12.0 3,407 11.8
Mornington P'sula (S) - South 2,666 11.4 2,666 11.4 3,149 12.7 3,149 12.7 5,040 13.0
Mornington P'sula (S) - West 2,475 9.4 2,475 9.4 3,238 11.4 3,238 11.4 4,398 10.5
ML 209 13,466 10.4 13,466 10.4 16,504 12.2 16,504 12.2 24,864 12.2
Victoria ML total 159,807 6.0 315,687 11.6 227,149 8.4 934,903 17.2 496,473 12.0
Australia 1,055,826 10.1 631,987 6.0 1,253,930 11.8 899,328 8.5 1,891,727 11.7
/tt/file_convert/5ab6ed4c7f8b9a6e1c8e492f/document.docx 49

5.3 Sexually transmitted diseasesIn 2011, Chlamydia was the most reported notifiable infection in Australia. Chlamydia
diagnoses have tripled in the past 10 years. In women aged 15 years and over, 502
per 100 000 were diagnosed with the infection in 2011, compared to 152 per 100 000
in 2001. For men, 366 per 100 000 were diagnosed in 2011 compared to 106 in
2001. Chlamydia was the most frequently reported notifiable condition in Australia,
with 79,833 new notifications in 2011xlii. In the 12 months to 1 April 2012 in the City of
Frankston and the Mornington Peninsula Shire, the rates for sexually transmitted
infections were:
Chlamydia infections in 2011:
: Frankston: 563 new cases at a rate of 457.3/100,000 people.
MPS: 485 new cases at a rate of 340.2/100,000 people.
The rate for Victoria in 2011 was is 349.5/100,000. The rate for
Australia is 361.8/100,000xlii,xliii.
The rate for the Southern Metropolitan Region is 399.9/100,000
people.
The rate for Chlamydia is nearly seven times the rate of gonorrhoea, which is the
next most frequently reported notifiable STI.
Gonococcal infections in 2011:
Frankston: 23 new cases at a rate of 18.7/100,000 people.
MPS: 20 new cases at a rate of 14/0/100,000 people.
The rate for Victoria is 39.2/100,000.
The rate for the Southern Metropolitan Region is 45.1/100,000 people.
Syphilis infections in 2011:
Frankston: 2 new cases at a rate of 1.6/100,000 people.
MPS: 1 new case at a rate of 0.7/100,000 people
The rate for Victoria is 6.1/100,000.
The rate for the Southern Metropolitan Region is 7.8/100,000 people.
50

5.4 Mental healthThe prevalence of mental disorders is the proportion of people in a given population
who met the criteria for diagnosis of a mental disorder at a point in time. Of the 20%
of the population who have any 12-month mental disorder, the prevalence rates
estimated for each of the major disorder groups (Anxiety, Affective and Substance
Use) are:
Affective mood disorders, defined as Depressive Episode (4.1%), Dysthymia
(1.3%) and Bipolar Affective Disorder (1.8%);
Anxiety disorders defined as Panic Disorder (2.6%) Agoraphobia (2.8%)
Social Phobia (4.7%) Generalised Anxiety Disorder (2.7%) Obsessive-
Compulsive Disorder (1.9%) Post-Traumatic Stress Disorder (6.4%)
Nationally, women experienced higher rates of 12-month mental disorders than men
(22% compared with 18%); women experienced higher rates than men of Anxiety
(18% and 11% respectively) and Affective disorders (7.1% and 5.3% respectively).
However, men had twice the rate of Substance Use disorders (7.0% compared with
3.3% for women)xliv.
Table 24 shows available data on mental health drawing on the Medicare Locals
Social Health Atlas. Rates of poor mental health are higher than average for males
and females in Frankston (West) and Mornington Peninsula (South).
Accurate data about the prevalence of mood disorders and serious mental illness is
not available at local levels. The SMR has compiled service usage data from the
Victorian Department of Health Client Management Interface (CMI) and Quarterly
Data Collection (QDC) both of which have anomalies and problems in data collection
that affect estimates of prevalencexlv in the catchment. The data from the CMI and
QDC have been used by the SMR as a proxy for prevalence but this does not
account for people who are not accessing services. Nevertheless, based on service
usage, the SMR review estimates that the number of people diagnosed with mental
health problems has much higher prevalence in the Frankston (West) than in other
SLAs in the catchment and that services to manage serious mental illness including
dual disability are under enormous pressure. The review noted that:
There is great pressure on the Frankston hospital ED to deal with
presentations of people with serious mental health conditions
There is a need for a greater focus on carers of people living with serious
mental health conditions, and a strengthening of support for them as well as
improved communication between services and carers;
/tt/file_convert/5ab6ed4c7f8b9a6e1c8e492f/document.docx 51

Clients utilising specialist mental health services in 2009/10 were largely from
the 25 – 44 age grouping. The age group up to the age of 25 years reflects
about one third of the sub regional population yet their service utilisation
proportions reflects only about 14%;
A greater emphasis on prevention and early intervention for people at a
younger age will require more specific targeted services for the younger age
groups.
52
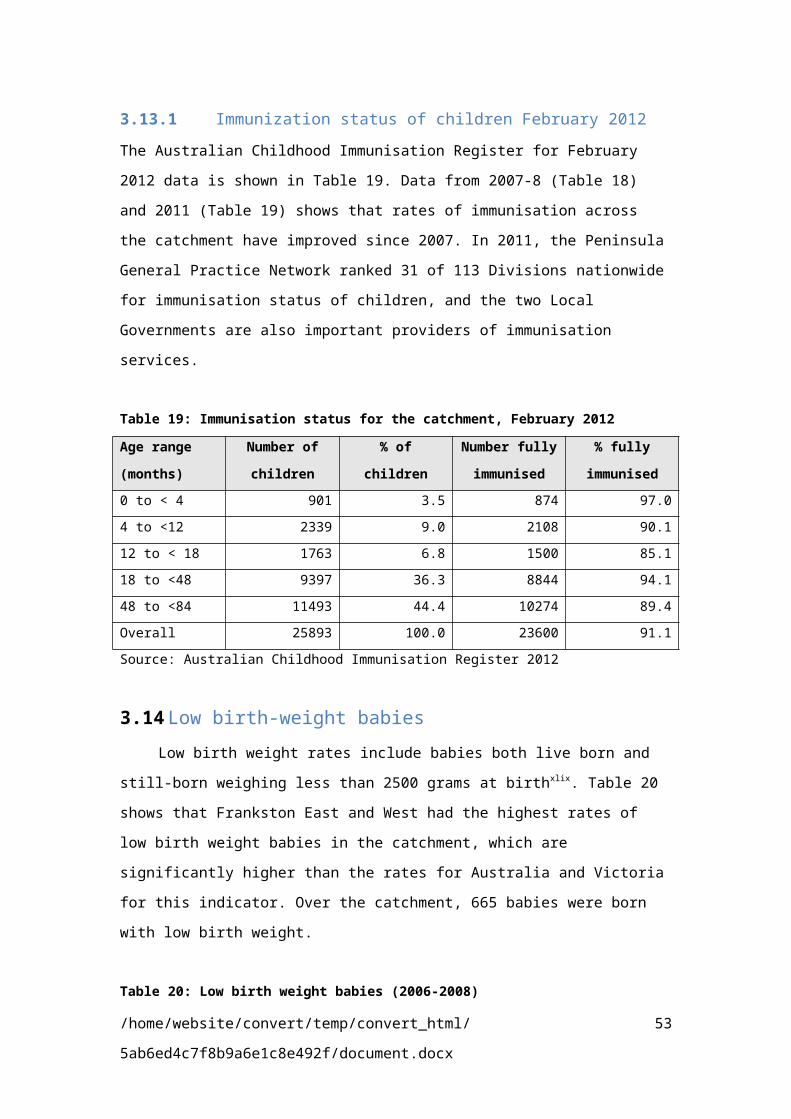
5.4.1 Suicide and self-harm injuriesSuicide is a relatively uncommon event. In 2005, suicide accounted for 1.6% of
the total number of deaths in Australiaxlvi. Table 25 shows that deaths from suicide
and self-inflicted injuries are higher than the Victorian average. The highest rates are
in Frankston West, followed by Mornington Peninsula South, then Mornington
Peninsula East. Rates in Frankston East and Mornington Peninsula West are below
the Victorian and Australia average rate.
Table 25: Deaths from suicide and self-harm injuries 2003-2007
2003-7 Avoidable deaths 0-74 yrs:Suicide and self-inflicted injuries
SLA NumberAverage annual rate
per 100,000Frankston (C) - East 19 9.4
Frankston (C) - West 58 16.2
Mornington P'sula (S) - East 22 12.8
Mornington P'sula (S) - South 28 13.4
Mornington P'sula (S) - West 17 7.1
ML209 144 12.2
Victoria ML total 9.4
Australia 58 16.2
Source: 2011 Australian Medicare Locals Atlas PHIDU
/tt/file_convert/5ab6ed4c7f8b9a6e1c8e492f/document.docx 53

6 AgeingThe Mornington Peninsula Shire is a retirement destination with a significantly
increasing ageing profile. The MPS is ranked no 1 in Victoria’s metropolitan areas,
for rates of dementia in 2010, and no 1 in projections to 2050xlvii. The two LGAs in the
catchment have the lowest proportion of CALD residents in the Victorian Southern
Metropolitan Region in their ageing and aged cohortxlviii.
Dementia in the community is a major issue for the MPS. In 2010 the MPS was
ranked no 1 in Victoria’s metropolitan areas for rates of dementia, and no 1 in
projections to 2050, and 3rd highest in terms of absolute numbers of people living
with dementia. The population of the catchment is primarily Anglo in their ageing and
aged cohorts but there is an important cohort of ageing Greek migrants in Mornington
Peninsula South.
6.1 Ageing population and projectionsThe number of people aged 65+ years in the FMPML/PCP catchment, is 48,034,
which is 17.1% of the total population (MSD average 16%). Of those, 2.6% (7.206)
are aged 80-84 and 2.3% (6,339) are aged 85+ years of agexlix.
The catchment is attractive for retirees - more than 17% of the population is currently
aged over 65 years compared to the average of 13.8% for Victoria. Table 26 shows
that between 2011-2026, the 75-79 year old age group in the catchment is expected
to experience a growth rate of 78%, and the 85+ year old age group will grow by
66%.
Table 26: Growth in older age groups 2011-2026
Age Group 2011 2026 (est) Growth
65-69 14,580 19,772 36%
70-74 11,479 17,197 50%
75-79 8,997 15,966 78%
80-84 7,226 11,031 53%
85+ 6,553 10,849 66%
Total Pop 282,697 320,572 11%
Source: Department of Planning and Communities: Victoria in the Future 2012
54

By 2031 the over 70 population will have grown by 220%, and the over 85 population
will have grown by 300% (since 2009). This will bring a very high increase in demand
from older people for access to services, transport, and social connectedness.
Rosebud West has a large number of aged care facilities and as a consequence, the
suburb has the highest percentage of persons over 75 in Melbourne and the highest
percentage of widows in Melbourne.
ABS predictions for the City of Frankston are that residents aged 60+ years will
increase by 12,000 and those aged 85+ years will increase by 1,354 (69%) by
2019xviii.
ABS predictions for the Mornington Peninsula Shire are that the 65+ yrs population of
Mornington Peninsula South is one of the most concentrated in Australia, and will
rise from 16.5% in 1999 to 36% by 2019l. This equates to 16,588 people, and will be
particularly in Mornington Peninsula East and Mornington Peninsula West SLAs.
6.2 Aged careAged care places in the catchment are below the Victorian average. Given the
population projections for the 65+ age group, this is of concern. Table 27 shows the
allocation of aged care places by LGA. Table 28 shows the allocation of aged care
places by SLA in the catchment.
Table 27: Allocation of aged care places to LGAs
Indicator Frankston Mornington Peninsula
Victoria
Percentage of persons aged 75+ who live alone
2.0% 3.1%(72.7% female)
2.2%(75.1% female)
Aged care places (high care) per 1,000 eligible population
39.7 31.7 41.7
Aged care places (low care) per 1,000 eligible population
35.8 39.5 45.8
Source: Victorian Department of Health (2012) Mornington Peninsula (S) and Frankston (C) 2011 Local Government Area Profiles
/tt/file_convert/5ab6ed4c7f8b9a6e1c8e492f/document.docx 55

Table 28: Aged care places by SLA in the FMP catchment
Residential aged care - high level
care places
High-level residential care places per 1,000
population aged 70
years and over
Residential aged care -
low level care places
Low-level residential care places per 1,000
population aged 70
years and over
Residential aged care - total places
Total residential care places
per 1,000 population
aged 70 years and
over
Number of community care places
Population aged 70
years and over
Rate per 1,000
population in
community care
Frankston (C) - East 150 54.0 72 26.0 222 80.2 0 2,767 0.0Frankston (C) - West 333 36.0 363 39.1 696 74.9 559 9,294 60.1Mornington P'sula (S) - East 95 26.0 80 22.1 175 48.4 0 3,619 0.0Mornington P'sula (S) - South 242 23.0 508 48.2 750 71.2 0 10,532 0.0Mornington P'sula (S) - West 424 56.0 292 38.3 716 93.9 60 7,623 7.9Frankston - Mornington Peninsula 1,244 37.0 1,315 38.9 2,559 75.6 619 33,835 18.3Victoria 22,920 42.0 24,907 46.3 47,291 88.0 12,640 537,449 23.5Bayide ML 2,777 45.0 2,875 46.6 5,651 91.6 1,160 61,668 18.8
Source: Australia Medicare Local Data 2011, PHIDU
56

7 IndicatorsIndicators can measure services delivered or also take into account the nature of the
services that are being delivered including the models of health service delivery.
Primary health care includes health promotion so indicator sets should also include
the nature of health promoting actions particularly to measure their efforts in reducing
inequities or increasing outcomes for marginalized or vulnerable groups and
communities.
One of the issues for setting up indicator sets in primary health care is the availability
of sufficiently sensitive and up-to-date data. Data systems are rarely compatible,
while some data stored on General Practice and Community Health Service
databases rely on manual audits of files which is a time-intensive and costly activity
that is likely to yield insufficient data to track change.
Indicators could include:
Continuous quality improvement through monitoring both quality and trends in
health service delivery over time;
The extent to which partnerships have successfully enabled greater ‘reach’ to
increase access into communities of interest;
Sustained community development for health in hard-to-reach communities
under the program areas identified as health promotion and focusing on
social-health issues that underpin risk factors.
Outcome indicators could include accomplishments in prevention for disease and
social harms, as well as access to services that aim to improve quality of life, health
and wellbeing:li
1. Improvements in immunization status for infants and children in identified
hotspots
2. Increased screening for bowel cancer
3. Improved personal health behaviours
a. Breastfeeding rates
b. Reduced smoking cessation in new mothers
c. Targeted smoking cessation programs in ‘hot spot’ communities
/tt/file_convert/5ab6ed4c7f8b9a6e1c8e492f/document.docx 57
4. Improvements to physical activity levels in conjunction with walkability
assessments across the catchment conducted by local people
5. Increased access to fresh fruit and vegetables for identified food deserts
6. Reduced incidence of sexually transmitted diseases including HIV-AIDS
7. Decreased infant mortality rates
8. Early detection of child abuse and improved child protection services
9. Early childhood intervention services
10. Screening for early childhood intervention for needed therapies to improve
school readiness
11. Improved AEDI scores in ‘hot spots’
12. Improved access to termination of pregnancy services through Peninsula
Health
13. Decrease in jobless families in identified hotspots
14. For all indicators, reductions in inequities across population sub-groups.
7.2 Recommendationsa) Develop a process for identifying priorities in conjunction with the
identification of indicator sets for selected priorities that take account of
availability and accessibility of data for measurement.
b) Update all statistics when 2011 Census data available.
c) Work with Peninsula Health to compile data on admissions to public and
private hospitals, people on a booking lists for elective surgery, those who are
clients of the Department for Families and Communities, and attendances at
a community health services and community-based services delivered in the
home (eg Domiciliary Care services, Royal District Nursing Service and Meals
on Wheels). These are services for which data necessary for the analysis at
the small area level can be obtained: such data includes the age, sex and
Statistical Local Area (SLA) of the address of usual residence of the patient or
clienti.
58

Appendix 1 Summary of FMPPCP reviews 2006-2012
/tt/file_convert/5ab6ed4c7f8b9a6e1c8e492f/document.docx 59

Document Data Comments
FMPPCP Strategic Plan Evidence Base for 2009-2012 Priorities: Community Profile
Demographics 2007:Population size inclIndigenous and CALDAEDICharacteristics at LGA level of: education, employment, income, child and family, social and cultural, aged and disability, health (BoD, VAED), services
All data can be included in evidence synthesisEducation data is by LGA – need by suburbIncome is by LGA – we need data by small area, ie. suburb or postcodeNeighbourhood Renewal data for Hastings is not includedCentreLink data (Pensions, Benefits, Public Housing) is at LGA level – needs to be at small area level
Peninsula HealthWorking Towards Integrated Ambulatory Health Care (June 2011): Population Needs Analysis
Geography, transport, urban developmentDemographics including SEIFAHealth Inequality IndicatorsChronic and complex care – service planning data
Includes SEIFA for 10 small areas with low IRSD scoresNo other data is at postcode (small area) levelFV data could/should be in tables of evidenceTalks about social inclusion but doesn’t clarify which groups at most risk of social inclusion or how that affects their access to health servicesData can be included in evidence synthesisShould the evidence synthesis talk only about inequalities or also inequities? ie,those inequalities which are unfair/unjust and amenable to change through health promotion, policy, service development etc
FMPPCPSocial Inclusion Needs Assessment 2010-2011
Survey results from member agencies on which population groups at most risk of social inclusion and barriers to social connection
If there are social inclusion needs, then there are issues of social exclusion but they are not explained. There are no responses identified from localities where the ‘hot spots’ for social exclusion are likely to be occurring.What is the relationship between ‘place’ and social exclusion in the catchment?
Department of HealthYour Health: Chief Health Officer’s report 2010
Compiles all available statewide data
All data is for Victoria-wide which is useful for comparisons with data that is specific to Frankston and the Mornington Peninsula
FMPPCPThrough the Eyes of the Client
Demographic characteristics of respondents? Not known who the respondents are, their income quartile or their place of residence
60

References
/tt/file_convert/5ab6ed4c7f8b9a6e1c8e492f/document.docx 61

i Public Health Information Development Unit , Medicare Locals Instant Atlas.
ii Victorian Department of Health (2012) Mornington Peninsula (S) and Frankston (C) 2011 Local Government Area
Profiles, Modelling, GIS and Planning Products Unit, Melbourne.iii AIHW. Health Indicators. http://www.aihw.gov.au/health-indicators/
iv Commission on Social Determinants of Health. Closing the Gap in a Generation: Health Equity through Action on the
Social Determinants of Health, Geneva, World Health Organization, 2008.v Kawachi I, Subramanian SV, Almeida-Filho N. A glossary for health inequalities. J Epidemiology and Community Health
2002: 56:647–652.vi Commission on Social Determinants of Health. Closing the Gap in a Generation: Health Equity through Action on the
Social Determinants of Health, Geneva, World Health Organization, 2008.vii Public Health Information Development Unit. A Social Health Atlas of South Australia (Third edition).
viii ABS, 2010. 3218.0 Regional Population Growth (2001-2010), Australia, 31 March 2011.
ix http://www.abs.gov.au/ausstats/[email protected]/mf/2039.0/
x ABS, 2006, Socio-Economic Indexes for Areas (SEIFA 2006) cat. no. 2033.0.55.001
xi ABS 2006, id profiles City of Frankston and Mornington Peninsula Shire.
xii ABS 2006, id profiles City of Frankston and Mornington Peninsula Shire.
xiii Frankston Leader interview with Greg Flynn 2010, SouthEast Housing Cooperative, Frankston Leader 27 Aug 2010
xiv Phibbs, P. and Thompson, S. 2011. The health impacts of housing: toward a policy-relevant research agenda, AHURI
Final Report No.173. Melbourne: Australian Housing and Urban Research Institute.xv Chamberlain C & MacKenzie D. 2009. Counting the homeless 2006: Victoria. Cat. no. HOU 203. Canberra: AIHW.
xvi Frankston Mornington Peninsula Local Learning Employment Network (FMPLLEN) 2011, School Business Community
Partnership Brokers Environmental Scan, Frankston Mornington Peninsula Local Learning Employment Network,
Mornington, Vic.xvii City of Frankston. Our Economic Environment. Municipal Public Health and Wellbeing Plan 2009-2013.
xviii Frankston City Council, Municipal Health and Wellbeing Plan 2009-2013.
xix Weiss, B. D., Mays, M. Z., Martz, W., Castro, K. M., DeWalt, D. A., Pignone, M. P., et al. (2005). Quick assessment of
literacy in primary care: The newest vital sign. [Research Support, Non-U.S. Gov't]. Annals Of family medicine, 3(6), 514-
522.xx ABS. 2009. Health Literacy. Social Trends, June 2009.
xxi Brach C, Dreyer B, Schyve P et al (2011). Attributes of a Health Literate Organization, Institute of Medicine,
Washington.xxii McManus J. 1999. Better health, lower crime: a briefing for the NHS and partner agencies. NACRO, London.
http://www.nacro.org.uk/who-we-are/xxiii VicHealth-Department of Human Services, 2004. Health Costs of Violence: measuring the burden of disease caused
by intimate partner violence. Carlton South, Victorian Health Promotion Foundation. xxiv Frankston City Council Community Safety Strategy 2012-2016
xxv Peninsula Community Legal Centre. Alarm at Rise in Family Violence, Press release May 2011; Victoria Police Online
News Centre, http://www.vicpolicenews.com.au/index.php?option=com_statistics&task=search , 16 May 2011.xxvi Community Renewal Frankston Local Action Plan 2010-2012, City of Frankston.
xxvii Regan N. 2009. The re-development of Wallaroo Child and Family Centre - supporting a local community.
Presentation to The Early Years: From Research to Policy to Practice Seminar. Best Start, Mornington Peninsula Shire.xxviiihttp://www.vcgr.vic.gov.au/CA2570C30016EEF3/MapsByName/City+of+Frankston?OpenDocument

xxixhttp://www.vcgr.vic.gov.au/CA2570C30016EEF3/MapsByName/Shire+of+Mornington+Peninsula?OpenDocument
xxx OECD (2005), Society at a Glance: OECD Social Indicators, 2005 edition, p 56.
xxxi UNICEF (2007), Children Poverty in Perspective : An Overview of Child Well-Being
in Rich Countries, Innocenti Research Centre, Florence, Italy.xxxii Miranti R, Harding A, McNamara J, Ngu VQ, Tanton R. 2010. Children with Jobless Parents: National and Small Area
Trends for Australia in the Past Decade. Aust Jnl Labour Economics Vol 13 (1), pp 27 – 47.xxxiii NATSEM. SLA risk quintiles, Jobless families. https://www.canberra.edu.au/natsem
xxxiv World Health Organization 2009 Fact Sheet No 332: http://www.who.int/mediacentre/factsheets/fs332/en/
xxxv AEDI Community Profile, Mornington Peninsula Shire March 2011. www.aedi.org.au
xxxvi AEDI Community Profile, City of Frankston March 2011. www.aedi.org.au
xxxvii Victorian Child and Adolescent Monitoring System (VCAMS)
http://www.education.vic.gov.au/about/directions/children/vcams/adolescent_Community_profiles.htmxxxviii DEECD (2010). Adolescent profile summary sheet, Frankston.
xxxix DEECD (2010). Adolescent profile summary sheet Mornington Peninsula.
xl DEECD (2010). Adolescent profile summary sheet Mornington Peninsula.
xli DEECD (2010). Adolescent profile summary sheet, Frankston.
xlii ABS (2011). Sexually Transmissable Infections. Chlamydia notifications 2001-2011. Available:
http://www.abs.gov.au/AUSSTATS/[email protected]/Lookup/4102.0Main+Features10Jun+2012. Accessed 8 July 2012.xliii NNDSS (2011). Notification Rate of Chlamydial infection, received from State and Territory health authorities
in the period of 1991 to 2011 and year-to-date notifications for 2012
http://www9.health.gov.au/cda/Source/Rpt_4.cfmxliv ABS (2007). National Survey of Mental Health And Wellbeing: Summary of Results. Cat 4326.0.
xlv Southern Region Community Mental Health Planning and Service Coordination Initiative, Frankston Mornington
Peninsula Sub Regional Status Report.xlvi Black Dog Institute (n.d.) Facts and figures about mental health and mood disorders, Prince of Wales Hospital,
Randwick NSW.xlvii Alzeimers Australia
xlviii Howe A.
xlix Medicare Locals Instant Atlas, PHIDU.
l ABS, Australian Social Trends 2002.
li Fielding J, Brownson R, Green L. 2012. Annual Review of Public Health, Vol 33, doi:10.1146/annurev-pu-33-031912-
100001