list of figures and tables - gbrmpa elibrary:...
TRANSCRIPT

Reef Rescue Marine Monitoring ProgramFinal Report of AIMS Activities 2011/12
Inshore Water Quality Monitoring
Britta SchaffelkeJohn Carleton, Paul Costello, Johnston Davidson,
Jason Doyle, Miles Furnas, Kevin Gunn, Michele Skuza, Margaret Wright, Irena Zagorskis
PRODUCED FORThe Great Barrier Reef Marine Park Authority
TownsvilleSeptember 2012

Australian Institute of Marine SciencePMB No 3Townsville MC Qld 4810
This report should be cited as:
Schaffelke B, Carleton J, Costello P, Davidson J, Doyle J, Furnas M, Gunn K, Skuza M, Wright M, Zagorskis I (2012) Reef Rescue Marine Monitoring Program. Final Report of AIMS Activities 2010/11– Inshore Water Quality Monitoring. Report for the Great Barrier Reef Marine Park Authority. Australian Institute of Marine Science, Townsville. (97 p.)
© Copyright Australian Institute of Marine Science (AIMS) 2012
All rights are reserved and no part of this document may be reproduced, stored or copied in any form or by any means whatsoever except with the prior written permission of AIMS.
DISCLAIMER
While reasonable efforts have been made to ensure that the contents of this document are factually correct, AIMS does not make any representation or give any warranty regarding the accuracy, completeness, currency or suitability for any particular purpose of the information or statements contained in this document. To the extent permitted by law AIMS shall not be liable for any loss, damage, cost or expense that may be occasioned directly or indirectly through the use of or reliance on the contents of this document.

ii

Reef Rescue MMP - Inshore water quality monitoring - Final Report 2011/12
Contents
List of Figures and Tables................................................................................................ii
Executive Summary.........................................................................................................v
1. Preface.....................................................................................................................1
2. Introduction...............................................................................................................3
3. Methods....................................................................................................................6Sample locations..........................................................................................................6Direct water sample collection, preparation and analyses...........................................8Autonomous Water Quality Loggers..........................................................................10Data analysis.............................................................................................................11
Comparison with trigger values from the GBR Water Quality Guidelines..............11Summary statistics and data presentation.............................................................12Temporal trend analysis of the Cairns Transect water quality data.......................13Interim site-specific water quality index..................................................................14
4. Results and Discussion..........................................................................................164.1 Region Reports: Wet Tropics Region.............................................................16
Cairns long-term water quality transect...........................................................264.2 Region Reports: Burdekin Region...................................................................304.3 Region Reports: Mackay Whitsunday Region.................................................374.4 Region Reports: Fitzroy Region......................................................................45
5. Conclusions............................................................................................................56
Acknowledgments.........................................................................................................63
6. References.............................................................................................................64
Appendix 1: Additional Information................................................................................72
Appendix 2: Method performance and QAQC information............................................85
Appendix 3: Retrospective calibration of WET Labs ECO FLNTUSB loggers..............91
Appendix 4: Publications and Presentations from the Program in 2011/12..................96
i

Reef Rescue MMP - Inshore water quality monitoring - Final Report 2011/12
List of Figures and Tables
Figure 1 Sampling locations of the Reef Rescue MMP inshore marine water quality task...............................................................................................................................7
Figure 2 Reef Rescue MMP water quality sampling sites in the Wet Tropics NRM Region.........................................................................................................................16
Figure 3 Summary of concentrations of chlorophyll a, particulate nitrogen, particulate phosphorus (μg L-1), suspended solids (mg L-1) and Secchi depth (m) at reef locations in the Wet Tropics Region..........................................................................................20
Figure 4 Time series of daily means of chlorophyll (green line, µg L-1) and turbidity (red line, NTU) time-series collected by ECO FLNTUSB instruments at (a) Snapper and (b) Fitzroy islands in the Wet Tropics NRM Region....................................................23
Figure 5 Time series of daily means of chlorophyll (green line, µg L-1) and turbidity (red line, NTU) time-series collected by ECO FLNTUSB instruments at (a) High and (b) Russell islands in the Wet Tropics NRM Region...................................................24
Figure 6 Time series of daily means of turbidity (red line, NTU) time-series collected by ECO FLNTUSB instruments at Dunk Island in the Wet Tropics NRM Region......25
Figure 7 Cairns Long-Term Water Quality Transect. Smooth trends over sampling years from 1989 to 2012.............................................................................................27
Figure 8 Cairns Long-Term Water Quality Transect. Smooth trends over sampling months of data from 1989 to 2012..............................................................................28
Figure 9 Reef Rescue MMP water quality sampling sites in the Burdekin NRM Region.....................................................................................................................................30
Figure 10 Summary of concentrations of chlorophyll a, particulate phosphorus, particulate nitrogen (μg L-1), suspended solids (mg L-1) and Secchi depth (m) at sampling sites in the Burdekin Region........................................................................33
Figure 11 Time series of daily means of turbidity (red line, NTU) time-series collected by ECO FLNTUSB instruments at Pelorus Island (a) and Pandora Reef (b) in the Burdekin NRM Region................................................................................................35
Figure 12 Time series of daily means of turbidity (red line, NTU) time-series collected by ECO FLNTUSB instruments at Magnetic Island in the Burdekin NRM Region.....36
Figure 13 Reef Rescue MMP water quality sampling sites in the Mackay Whitsunday NRM Region...............................................................................................................37
Figure 14 Summary of concentrations of chlorophyll a, particulate phosphorus, particulate nitrogen (μg L-1), suspended solids (mg L-1) and Secchi depth (m) at sampling sites in the Mackay Whitsunday NRM Region............................................41
Figure 15 Time series of daily means of chlorophyll (green line, µg L-1) and turbidity (red line, NTU) time-series collected by ECO FLNTUSB instruments at (a) Double Cone and (b) Daydream islands in the Mackay Whitsunday NRM Region................43
Figure 16 Time series of daily means of chlorophyll (green line, µg L-1) and turbidity (red line, NTU) time-series collected by ECO FLNTUSB instruments at Pine Island in the Mackay Whitsunday NRM Region........................................................................44
Figure 17 Reef Rescue MMP water quality sampling sites in the Fitzroy NRM Region....................................................................................................................................45
ii

Reef Rescue MMP - Inshore water quality monitoring - Final Report 2011/12
Figure 18 Summary of concentrations of chlorophyll a, particulate phosphorus, particulate nitrogen (μg L-1), suspended solids (mg L-1) and Secchi depth (m) at sampling sites in the Fitzroy NRM Region..................................................................48
Figure 19 Time series of daily means of chlorophyll (green line, µg L-1) and turbidity (red line, NTU) time-series collected by ECO FLNTUSB instruments at (a) Barren and (b) Humpy islands in the Fitzroy NRM Region............................................................50
Figure 20 Time series of daily means of chlorophyll (green line, µg L-1) and turbidity (red line, NTU) time-series collected by ECO FLNTUSB instruments at Pelican Island in the Fitzroy NRM Region..........................................................................................51
Appendix 2- Figure 1 Match-up of duplicate samples analysed for chlorophyll a by fluorometry and HPLC................................................................................................89
Appendix 2- Figure 2 Match-up of instrument readings of turbidity (NTU) from field deployments of WET Labs ECO FLNTUSB Combination Fluorometer and Turbidity Sensors with values from standard laboratory analysis of concurrently collected water samples.......................................................................................................................90
Appendix 3- Figure 1 A timeline of logger deployments and calibration status at the 14 MMP reef sites............................................................................................................95
Table 1 Sampling stations for direct water sampling (during research cruises in June 2011, September/October 2011 and February 2012) and continuous deployment of autonomous water quality instruments.........................................................................6
Table 2 Trigger values from the GBRMPA Water Quality Guidelines for the Great Barrier Reef Marine Park (GBRMPA 2010)...............................................................11
Table 3 Summary of concentrations of chlorophyll a (Chl a), particulate nitrogen (PN) particulate phosphorus (PP), all in μg L-1; suspended solids (SS, mg L-1) and Secchi depth (m) at reef and open water (*) locations in the Wet Tropics Region................21
Table 4 Cairns Long-Term Water Quality Transect. Analyses of variance assessing the significance of trends over time, by years and months........................................26
Table 5 Summary of concentrations of chlorophyll a (Chl a), particulate nitrogen (PN) particulate phosphorus (PP), all in μg L-1; suspended solids (SS, mg L-1) and Secchi depth (m) at reef locations in the Burdekin Region....................................................34
Table 6 Summary of concentrations of chlorophyll a (Chl a), particulate nitrogen (PN) particulate phosphorus (PP), all in μg L-1; suspended solids (SS, mg L-1) and Secchi depth (m) at reef locations in the Mackay Whitsunday NRM Region........................42
Table 7 Summary of concentrations of chlorophyll a (Chl a), particulate nitrogen (PN) particulate phosphorus (PP), all in μg L-1; suspended solids (SS, mg L-1) and Secchi depth (m) at reef locations in the Fitzroy Region.......................................................49
Table 8 Summary of chlorophyll (μg L-1) data from deployments of WET Labs ECO FLNTUSB Combination Fluorometer and Turbidity Sensors at 14 inshore reef sites...................................................................................................................................52
Table 9 Summary of turbidity (NTU) data from deployments of WET Labs ECO FLNTUSB Combination Fluorometer and Turbidity Sensors at 14 inshore reef site. 54
iii

Reef Rescue MMP - Inshore water quality monitoring - Final Report 2011/12
Table 10 Interim site-specific water quality index. The index aggregates scores given to four indicators in comparison to the GBR Water Quality Guidelines (GBRMPA 2010)..........................................................................................................................58
Appendix 1-Table 1 Details of deployments of WETLabs ECO FLNTUSB instruments deployed at inshore reef locations for water quality monitoring.....................................72
Appendix 1-Table 2 Log of instrument issues and failures of WET Labs ECO FLNTUSB instruments deployed at inshore reef locations for water quality monitoring........................................................................................................................................73
Appendix 1-Table 3 Annual freshwater discharge (ML) for the major GBR Catchment rivers influencing the sampling sites of the MMP Inshore Water Quality Monitoring Program.........................................................................................................................74
Appendix 1-Table 4 Concentrations of dissolved inorganic nitrogen species (µg L-1) at three sampling occasions in 2011/12............................................................................75
Appendix 1-Table 5 Concentrations of total dissolved nitrogen and particulate nitrogen (µg L-1) at three sampling occasions in 2011/12............................................................76
Appendix 1-Table 6 Concentrations of dissolved inorganic phosphorus (PO4), total dissolved phosphorus (TDP) and particulate phosphorus (PP), all in µg L-1, at three sampling occasions in 2011/12.....................................................................................77
Appendix 1-Table 7 Concentrations of dissolved organic carbon (DOC), particulate organic carbon (POC), and silicate, all in µg L-1, at three sampling occasions in 2011/12. ........................................................................................................................78
Appendix 1-Table 8 Concentrations of chlorophyll a (µg L-1) at three sampling occasions in 2011/12.....................................................................................................79
Appendix 1-Table 9 Secchi depth (m), concentrations of total suspended solids (SS, mg L-1) and salinity (dimensionless) at three sampling occasions in 2011/12.............80
Appendix 1-Table 10 Interim water quality index: Summary of four-year running means and calculation of the index...............................................................................81
Appendix 2-Table 1 Limit of detection (LOD) for analyses of marine water quality parameters..................................................................................................................85
Appendix 2-Table 2 Summary of coefficients of variation (CV, in %) of replicate measurements (N) of a standard or reference material..............................................86
Appendix 2-Table 3 Summary of average recovery of known analyte concentrations.....................................................................................................................................86
Appendix 2-Table 4 Summary of average Z-scores of replicate measurements (N) of a standard or reference material....................................................................................87
Appendix 2-Table 5 Comparison of instrument readings of wet filter blanks to actual sample readings..........................................................................................................88
iv
Reef Rescue MMP - Inshore water quality monitoring - Final Report 2011/12
Executive Summary
Introduction
Scientists and managers have realised that ongoing management of human pressures on regional and local scales, such as enhanced nutrient runoff and overfishing, is vital to provide ecosystems, including coral reefs with the maximum resilience to cope with global stressors, such as climate change. The management of water quality remains an essential requirement to ensure the long-term protection of the coastal and inshore reefs of the Great Barrier Reef (GBR). The land management initiatives under the Australian and Queensland Government's Reef Water Quality Protection Plan 2009 (Reef Plan) are key tools to improve the water quality entering the GBR and will, in the long-term, improve coastal and inshore marine water quality. Sustained long-term monitoring of the coastal and inshore GBR lagoon is fundamental to determine the status of marine water quality and long-term trends related to Reef Plan. The AIMS monitoring activities in 2011/12, carried out by the Australian Institute of Marine Science as part of the Reef Rescue Marine Monitoring Program (MMP), were an extension of activities established under previous arrangements from 2005 to 2011.
Methods
Water quality monitoring in the inshore lagoon was carried out at 14 fixed coral reef locations in four NRM regions, the Wet Tropics (N=5), Burdekin (N=3), Mackay Whitsunday (N=3) and Fitzroy regions (N=3). This included direct water sampling and analyses of a comprehensive suite of dissolved and particulate nutrients and carbon, suspended solids, chlorophyll a and salinity, as well as using state of the art sensors with long-term data logging capacity for measurements of temperature, chlorophyll and turbidity. Sampling of the longest available time series of water quality data for the Great Barrier Reef (GBR) in coastal waters between Cape Tribulation and Cairns from 1989 to the present was also continued under the MMP (N=6 fixed open water sampling locations).
The Water Quality Guidelines for the Great Barrier Reef Marine Park (GBRMPA 2010; hereafter called “the Guidelines”) were used as a framework to interpret the water quality values obtained at the 20 sampling locations and to identify areas/locations with potential water quality issues. The indicator-specific assessments of compliance with or exceedances of the Guidelines were also summarised for each site using an interim water quality index. The index aggregates the assessments of compliance (score= 0) or exceedance (score =1), as compared to the Guidelines for each of four indicators (chlorophyll; an indicator combining turbidity, suspended solids and Secchi depth; particulate nitrogen; particulate phosphorus; based on long-term means since the start of sampling each indicator to June 2012) into an overall rating for the water quality (see Table below; 0 is the lowest overall score indicating full compliance of all indicators with the Guidelines; 4 is the maximum score if all 4 indicators exceed guideline values, indicating impaired water quality). The colour scheme used is consistent with other marine condition reporting under the Paddock to Reef Monitoring, Modelling and Reporting Program and colours reflect the status of water quality: red (very poor), orange (poor), yellow (moderate), light green (good), dark green (very good).
v

Reef Rescue MMP - Inshore water quality monitoring - Final Report 2011/12
GBR-wide results
The MMP inshore water quality monitoring has now completed its 7th year and the results have improved our understanding of the spatial and temporal variability of biogeochemical and physical variables in the GBR inshore lagoon. The site-specific water quality in the inshore GBR generally shows clear gradients away from river mouths and is influenced over short time periods by flood events and sediment resuspension and over longer time periods by a complex interplay of physical forcing and biological transformation processes. Detailed results are presented for each site, grouped by NRM region.
Regional results
The site-specific monitoring has been effective in identifying regional hotspots of impaired water quality. In the summary assessment for 2012, using the interim water quality index (see Table on next page), five out of the eleven Wet Tropics locations were rated as ‘good’ or ‘very good’; three of these are located in the midshelf water body. Of the remaining sites, five were rated as ‘poor’. Dunk Island, Yorkey’s Knob and Fairlead Buoy, all locations close to river mouths that drain highly developed catchments, were consistently rated as ‘poor’ since the start of the MMP monitoring. The sites Cape Tribulation and Snapper Island in the northern Wet Tropics were only in the current year downgraded to a ‘poor’ rating, while High Island had a ‘moderate’ rating for the second year.
Of the three sites in the Burdekin Region, the water quality index of the two sites located in the midshelf water body was rated as ‘good’, while the Magnetic Island site that is closer to the mainland and to riverine influence had again a ‘poor’ rating.
The water quality at all three sites in the Mackay Whitsunday Region was again rated as ‘poor’.
In the Fitzroy Region, the most inshore location, Pelican Island had a water quality index of ‘poor’. Humpy Island was rated as ‘moderate’, while Barren Island retained its ‘very good’ rating. The interim water quality indices in this region have not changed over the last three years.
The sites that were rated as ‘poor’ had running means of chlorophyll, turbidity-related values (combining suspended solids, Secchi depth and turbidity data) and particulate phosphorus that exceeded the Guidelines.
Discussion and conclusions
A statistical analyses of the site-specific water quality data to 2011 showed significant year-to-year, seasonal and regional variability, which means that no single factor or process is influencing the water quality. The inherent seasonal differences and extreme difference in river discharges since the start of the MMP sampling are currently the main factors explaining the data variability. A similar analysis of data from the longest time series of water quality data for the GBR, the AIMS Cairns Transect (sampled since 1989) showed for the first time a significant correlation between land-use change on
vi

Reef Rescue MMP - Inshore water quality monitoring - Final Report 2011/12
the catchment (land clearing rate) and marine water quality. However, this required an acute large change on the catchment and a long water quality time series, spanning several cycles of wet, dry and average years in terms of river runoff. A longer time series for all the MMP sites will be required to disentangle any influences of land management changes under Reef Rescue and Reef Plan from the high temporal variability in the marine water quality data.
Interim site-specific water quality index. The index aggregates scores given to 4 yr running meanings of four indicators in comparison to the GBR Water Quality Guidelines (GBRMPA 2010): (i) a combined score for suspended solids concentrations in water samples, Secchi depth and turbidity measured by FLNTUSB instruments (where available*) and scores for (ii) chlorophyll, (iii) particulate nitrogen and (iv) particulate phosphorus concentrations in water samples. The colour scheme used is consistent with Paddock to Reef Reporting (see Chapter 3 for details of the assessment method): red (very poor), orange (poor), yellow (moderate), light green (good), dark green (very good). The six locations of the ‘AIMS Cairns Transect’ (open water sampling) are in italics. Grey shaded locations are in the “midshelf” water body, as designated by the GBR Water Quality Guidelines (GBRMPA 2010); all other locations are in the “open coastal” water body. See Error: Reference source not found for detailed data.
Region Site Total score 2005-08
Total score 2006-09
Total score 2007-10
Total score 2008-11
Total score 2009-12
Wet Tropics
Cape Tribulation 88 88 88 63 38Snapper Island* 83 83 83 83 33Port Douglas 88 88 88 88 88Double Island 100 88 88 88 88Green Island 100 100 100 100 100Yorkey’s Knob 25 25 25 25 25Fairlead Buoy 25 25 25 25 25Fitzroy Island* 92 92 92 92 92High Island * 67 67 67 42 42Russell Is* 100 100 100 92 92Dunk Island* 25 25 25 25 25
BurdekinPelorus Island* 92 92 67 67 67Pandora Reef* 58 92 92 92 67Magnetic Island* 0 25 33 25 25
Mackay Whitsunday
Double Cone Is.* 67 92 67 33 33
Daydream Island* 83 58 50 25 25Pine Island* 58 58 50 25 25
FitzroyBarren Island * 100 100 100 100 100Humpy Island* 67 67 42 42 42Pelican Island* 25 0 25 25 25
The broad suite of manually-sampled water quality parameters are important when interpreted in conjunction with the continuous instrumental water quality monitoring at core reef sites. The instruments currently monitor only three variables (chlorophyll fluorescence, turbidity and temperature) but over long periods at a high frequency
vii

Reef Rescue MMP - Inshore water quality monitoring - Final Report 2011/12
(every ten minutes). Chlorophyll fluorescence is considered to be a useful measure of phytoplankton biomass which, in turn, generally reflects nutrient availability. Turbidity and temperature are important physical water quality variables that influence the environmental suitability of a water body for marine biota, which in a GBR context is particularly relevant for coral reef development. Globally, all three indicators are widely used in water quality monitoring programs.
At this time, we consider the turbidity data from the instruments to provide the best description of water quality variability at our 14 core coral reef sites, with the added advantage of coverage through wet season flood events when satellite images are often not available due to cloud cover. In this report, only limited data for chlorophyll fluorescence are provided because a serious calibration problem was identified by the manufacturer and the adjustment and validation of the historical chlorophyll fluorescence data is still underway. It is expected that these QC issues will be solved by the end of 2012 and reliable data should be available to support the site-specific assessment in the future. Unfortunately many of the early chlorophyll fluorescence records from 2007-2009 will not be able to be retrospectively adjusted and are likely to be lost to the MMP.
Effective management of coastal water quality has to consider ecosystem-wide responses, cascading effects and ecological feedbacks as well as interactions with other pressures on the coastal zone. The accelerating coastal development along the GBR coast is creating an imminent management challenge. We need to better understand the complex responses and thresholds of coastal ecosystems to anthropogenic pressures, in the GBR context especially the interactions between the impact of diffuse land runoff and localised disturbance and pollution from coastal development. Programs like the MMP, while currently not considering point source/local pressures, are critical for this understanding as they allow us to measure the trajectories of change and to improve our ecosystem understanding of the coastal and inshore Great Barrier Reef.
viii

Reef Rescue MMP - Inshore water quality monitoring - Final Report 2011/12
1. Preface
The Reef Rescue Marine Monitoring Program (MMP), formerly known as Reef Water Quality Protection Plan Marine Monitoring Programme (Reef Plan MMP), was designed and developed by the Great Barrier Reef Marine Park Authority (GBRMPA) and is now funded by the Australian Government’s Reef Rescue initiative. Since 2010, the MMP has been managed by the GBRMPA. A summary of the MMP’s overall goals and objectives and a description of the sub-programs is available at: http://www.gbrmpa.gov.au/about-the-reef/how-the-reefs-managed/science-and-research/our-monitoring-and-assessment-programs/reef-rescue-marine-monitoring-program and at: http://e-atlas.org.au/content/rrmmp.
The MMP forms an integral part of the Paddock to Reef Integrated Monitoring, Modelling and Reporting Program, which is a key action of Reef Plan 2009 and is designed to evaluate the efficiency and effectiveness of implementation and report on progress towards the Reef Plan and Reef Rescue goals and targets. A key output of the Paddock to Reef Program is an annual report card, including an assessment of Reef water quality and ecosystem condition to which the MMP contributes assessments and information. The first Annual Report Card, which will serve as a baseline for future assessments, was released in August 2011 (available at www.reefplan.qld.gov.au).
The Australian Institute of Marine Science (AIMS) and the GBRMPA entered into a co-investment contract in December 2011 to provide water quality monitoring activities under the MMP for the period 2011/12.
The AIMS monitoring activities in the current contract period of the MMP are largely an extension of activities established under a previous arrangements from 2005 to 2010 and are grouped into two components:
Inshore Marine Water Quality Monitoring Inshore coral reef monitoring
The first component, the Inshore Marine Water Quality Monitoring, is reported in this Final Report, presenting the results of AIMS water quality monitoring activities over the period 01 May 2011 to 30 April 2012, with inclusion of data from the previous MMP monitoring since 2005.
Outcomes from the Inshore Coral Reef Monitoring component were reported earlier in December 2011 (Thompson et al. 2011), with the next report due in December 2012.
1

Reef Rescue MMP - Inshore water quality monitoring - Final Report 2011/12
2
Reef Rescue MMP - Inshore water quality monitoring - Final Report 2011/12
2. Introduction
Coastal areas around the world are under increasing pressure from human population growth, intensifying land use and urban and industrial development. As a result, increased loads of suspended sediment, nutrients and pollutants, such as pesticides and other chemicals, invariably enter coastal waters and lead to a decline in estuarine and coastal marine water quality. This increase in sediment, nutrients and other pollutants results in eutrophication and increased turbidity. Many tropical coastal regions are considered to be at great risk because of strong economic and population growth paired with limited environmental management. However, after decades of decline, some areas along the coasts of wealthier countries, generally in the temperate northern hemisphere, are showing signs of water quality improvements due to significant regulatory and policy intervention over the last two decades (Cloern 2001, Nixon 2009).
It is well documented in the scientific literature that sediment and nutrient loads carried by land runoff into the coastal and inshore zones of the Great Barrier Reef (GBR) have increased since European settlement (e.g., Kroon et al. 2012). This increase has been implicated in the decline of some coral reefs and seagrass meadows in these zones (reviewed in Brodie et al. 2008 and Brodie et al. 2012a). Concern about these negative effects of land runoff triggered the formulation of the Reef Water Quality Protection Plan (Reef Plan) for catchments adjacent to the GBR World Heritage Area by the Australian and Queensland governments in 2003 (Anon. 2003). The Reef Plan was revised and updated in 2009 (Anon. 2009) and has two primary goals:
immediate goal - to halt and reverse the decline in quality of water entering the Reef by 2013;
long-term goal - to ensure that by 2020 the quality of water entering the Reef from adjacent catchments has no detrimental impact on the health and resilience of the Great Barrier Reef.
Reef Plan actions also include the establishment of water quality monitoring programs extending from the paddock to the Reef (Anon. 2010) to assess the effectiveness of the Reef Plan's implementation. The MMP is an integral part of this monitoring to provide reliable physicochemical and biological data to investigate the effects of changes in inputs from the GBR catchments on marine water quality and inshore ecosystems.
Interpretation of the MMP inshore reef water quality monitoring results is supported by an understanding of the ecosystems of the GBR, their underlying biological and chemical processes and their physical drivers. This knowledge is still developing and has improved greatly over the last decade. The water-quality-related processes in the costal and inshore GBR have to be viewed in the context of the whole system, including the GBR lagoon, the adjacent coast and the neighbouring Coral Sea.
The biological productivity of the Great Barrier Reef (GBR) is sustained by nutrients (e.g. nitrogen, phosphorus, silicate, iron), which are supplied by a number of processes and sources (Furnas et al. 1997; Furnas 2003, Furnas et al. 2011). These include upwelling of nutrient-enriched subsurface water from the Coral Sea, rainwater, fixation
3

Reef Rescue MMP - Inshore water quality monitoring - Final Report 2011/12
of gaseous nitrogen by (cyano-bacteria and freshwater runoff from adjacent catchments. Land runoff is the largest source of new nutrients to the inshore GBR (Furnas 2003, Furnas et al. 2011), most of which are transported into the GBR lagoon during monsoonal flood events (Devlin and Brodie 2005, Devlin and Schaffelke 2009). However, most of the inorganic nutrients used by marine plants and bacteria on a day-to-day basis come from recycling of nutrients already within the GBR ecosystem (Furnas et al. 2005, Furnas et al. 2011).
Before the MMP, published information on water quality data in the coastal and inshore areas of the GBR lagoon was limited to a handful of local research studies (Walker and O’Donnell 1981, Schaffelke et al. 2003 and references therein, Cooper et al. 2007). However, extensive water sampling throughout the whole GBR lagoon over the last 25 years had established typical concentration ranges of nutrients, chlorophyll a and other water quality parameters and described the occurrence of persistent latitudinal, cross-shelf and seasonal variations in these concentrations (Furnas et al. 1997, Furnas 2005, Brodie et al. 2007, De’ath and Fabricius 2008). These spatio-temporal patterns were recently confirmed by an analysis of MMP data to 2011 (Schaffelke et al. 2012). Most variation was explained by the temporal variables, highlighting the extremely variable climate of the GBR region. Geographical aspects explained a smaller, albeit still significant, amount of the variation in the data.
While concentrations of most nutrients, suspended particles and chlorophyll a are normally low, water quality conditions in the coastal and inshore zones can abruptly change and nutrient levels increase dramatically for short periods following disturbance events (wind-driven re-suspension, cyclonic mixing, river flood plumes; Furnas 1989, Schaffelke et al. 2009, Devlin and Schaffelke 2009, Brodie et al. 2010). However, nutrients introduced, released or mineralised into GBR lagoon waters during these events are generally rapidly taken up by pelagic and benthic algae and microbial communities (Alongi and McKinnon 2005), sometimes fuelling short-lived phytoplankton blooms and high levels of organic production (Furnas 1989, Furnas et al. 2005). Via these processes, external nutrients from land rurnoff augment overall regional stocks of nutrients already stored in biomass or detritus (Furnas et al. 2011).
To understand the effects of land runoff on GBR coastal and inshore waters and biota, it is important to understand the fundamental processes that control the fate and impact of freshwater, sediment, nutrients and pesticides delivered from catchments into the receiving waters of the GBR lagoon. Important are the water flows, exchange rates and residence times (=”flushing time“), which are influenced by large- to meso-scale oceanographic processes. Water residence times in the GBR lagoon are still debated as different approaches have delivered very different results. Hancock et al. (2006), Wang et al. (2007) and Choukroun et al. (2010) estimate residence times of weeks, indicating a well-flushed system, while Brinkman et al. (2002) and Luick et al. (2007) estimate much longer residence times of several months. Analysis of satellite imagery of flood plumes suggest residence times in the GBR coastal and inshore zones of several weeks (Schroeder et al. 2012) and rapid episodic transport of flood-borne material into the midshelf and outer shelf reef regions (Devlin and Schaffelke 2009).
However, water residence times may not accurately reflect the period of time materials, such as sediments, nutrients and pesticides, remain in the GBR lagoon (Brodie et al.
4

Reef Rescue MMP - Inshore water quality monitoring - Final Report 2011/12
2012b). This time is not only determined by physical transport and flushing but also by other processes, such as biological uptake and transformation, sedimentation and burial, resuspension and remineralisation, which are not yet fully quantified on a whole-of-GBR scale. A recent comprehensive nutrient budget has been assembled by Furnas et al. (2011), but identified a number of data gaps and uncertainties in key ecosystem processes, such as cross-shelf mixing, nitrogen fixation and denitrification.
The whole-of-GBR hydrodynamic model, recently completed on a scale of 4-km resolution, will in the future deliver improved estimates of residence times as well as resolve trajectories and spatial distribution of major freshwater inputs (Brinkman et al. 2011). This model is the foundation for the development of sediment dynamics, biogeochemical and ecological modeling under a current multi-agency project eReefs (http://www.bom.gov.au/environment/eReefs_Infosheet.pdf), which will provide the capacity to predict changes in water quality in space and time in response to changing land use and runoff load scenarios. Data from the MMP Inshore Water Quality Monitoring have been provided to eReefs to parameterise the biogeochemical models under development.
The information gathered under the current MMP Inshore Water Quality sampling program has improved our understanding of the spatial distribution and temporal variability of water quality in the coastal and inshore GBR. This includes detailed information about the site-specific state of water quality around inshore coral reefs (this report), wide-field spatial patterns in water quality measured by remote sensing (separate report by CSIRO, not yet available at the time of writing), detailed information about water quality in flood plumes (separate report by JCU, Devlin et al. 2012) and information about herbicide levels in the inshore GBR (separate report by UQ, Bentley et al. 2012).
The key objective of this component of the MMP– ‘Inshore Marine Water Quality Monitoring’ is to:
describe spatial and temporal distributions of GBR marine water quality variables at permanent monitoring sites at selected inshore reefs and open water sites.
The data have various applications:
As a baseline and start of a long-term time series against which future change can be measured, e.g. in response to land management changes as part of the Reef Plan and Reef Rescue initiatives, but also in response to climatic events or other long-term systemic changes.
As environmental variables for correlative analyses with the biological indicators monitored as part of the MMP, such as the status of coral reef communities (see Thompson et al. 2010, Uthicke et al. 2010). The data have also supported complementary research (Fabricius et al. 2010, Fabricius et al. 2012, Fabricius et al. in press). It is anticipated that these data will be more widely used in the future as they are developing into a valuable data resource.
5

Reef Rescue MMP - Inshore water quality monitoring - Final Report 2011/12
3. Methods
In the following an overview is given of the sample collection, preparation and analytical methods. Detailed documentation of the AIMS methods used in the MMP can be found in a separate QAQC report, updated annually (GBRMPA in press), outlining e. g., the objectives and principles of analyses, step-by-step sample analysis procedures, instrument performance, data management and quality control.
Sample locations
The 14 fixed sampling locations, spanning four Natural Resource Management (NRM) regions, are congruent with the 14 ‘core’ sites of the inshore coral reef monitoring component of the MMP. Within each region, sites were selected along a gradient of exposure to runoff, largely determined as increasing distance from a river mouth in a northerly direction to reflect the predominantly northward flow of surface water forced by the prevailing south-easterly winds (Larcombe et al. 1995, Brinkman et al. 2011). At these sites, detailed manual and instrumental water sampling was undertaken (see below) as well as annual surveys of reef status (see Thompson et al. 2011). Sampling of the six open water stations of the ‘AIMS Cairns Transect’ was also continued (Table 1, Figure 1).
Table 1 Sampling stations for direct water sampling (during research cruises in June 2011, September/October 2011 and February 2012) and continuous deployment of autonomous water quality instruments (*). The six locations of the ‘AIMS Cairns Transect’ (open water stations) are in italics. Shaded cells indicate locations in the “midshelf” water body, as designated by the GBRMPA Water Quality Guidelines (GBRMPA 2010); all other locations are in the “open coastal” water body. For information, the slightly different site names of the parallel MMP inshore coral monitoring are given (Thompson et al. 2011)
NRM region Primarycatchment
Water qualitymonitoring sites
Site names of parallelcoral reef monitoring
Wet Tropics
Daintree, Barron
Cape TribulationSnapper Island * Snapper Island NorthPort DouglasDouble IslandGreen IslandYorkey’s KnobFairlead BuoyFitzroy Island * Fitzroy Island West
Russell-Mulgrave, Johnstone
High Island * High Island WestRussell Is* Frankland Group West (Russell Is)
Tully Dunk Island * Dunk Island North
BurdekinHerbert, Burdekin
Burdekin
Pelorus Island* Pelorus & Orpheus Is WestPandora Reef* Pandora ReefGeoffrey Bay, Magnetic Island * Geoffrey Bay
Mackay Whitsunday
Proserpine, Pioneer, O’Connell
Double Cone Island * Double Cone IslandDaydream Island * Daydream IslandPine Island * Pine Island
Fitzroy FitzroyBarren Island * Barren IslandHumpy Island * Humpy and Halfway IslandsPelican Island * Pelican Island
6

Reef Rescue MMP - Inshore water quality monitoring - Final Report 2011/12
Figure 1 Sampling locations of the Reef Rescue MMP inshore marine water quality task. Red symbols indicate the 14 locations where autonomous water quality instruments (temperature, chlorophyll and turbidity) were deployed and regular water sampling was undertaken. Yellow symbols are the locations of the ‘Cairns Transect’, which have been sampled by AIMS since 1989. NRM region boundaries are represented by coloured catchment areas and the black line for marine boundaries.
7
Reef Rescue MMP - Inshore water quality monitoring - Final Report 2011/12
Direct water sample collection, preparation and analyses
At each location, vertical profiles of water temperature and salinity were measured with a Conductivity Temperature Depth profiler (CTD) (Sea-Bird Electronics SBE25 or SBE19). The CTD was fitted with a fluorometer (WET Labs) and a beam transmissometer (Sea Tech, 25cm, 660nm) for concurrent chlorophyll and turbidity measurements.
Immediately following the CTD cast, discrete water samples were collected from two to three depths through the water column with Niskin bottles. Sub-samples taken from the Niskin bottles were analysed for the following species of dissolved and particulate nutrients and carbon:
ammonium= NH4, nitrite= NO2, nitrate= NO3, phosphate/filterable reactive phosphorus= PO4, silicate/filterable reactive silicon= Si(OH)4), dissolved organic nitrogen= DON, dissolved organic phosphorus= DOP, dissolved organic carbon= DOC), particulate organic nitrogen= PN, particulate phosphorus= PP, particulate organic carbon= POC.
(note that +/- signs identifying the charge of the nutrient ions were omitted for brevity).
Subsamples were also taken for analyses of suspended solids (SS) and chlorophyll a and for laboratory salinity measurements using a Portasal Model 8410A Salinometer. Temperatures were measured with reversing thermometers from at least 2 depths.
In addition to the ship-based sampling, water samples were collected by diver-operated Niskin bottle sampling, i) close to the autonomous water quality instruments (see below) and ii) within the adjacent reef boundary layer. These water samples were processed in the same way as the ship-based samples.
The sub-samples for dissolved nutrients were immediately hand-filtered through a 0.45-µm filter cartridge (Sartorius Mini Sart N) into acid-washed (10% HCl) screw-cap plastic test tubes and stored frozen (-18ºC) until later analysis ashore. Separate samples for DOC analysis were filtered, acidified with 100 μL of AR-grade HCl and stored at 4ºC until analysis. Separate sub-samples for Si(OH)4 were filtered and stored at room temperature until analysis.
Inorganic dissolved nutrients (NH4, NO2, NO3, PO4, Si(OH)4) concentrations were determined by standard wet chemical methods (Ryle et al. 1981) implemented on a segmented flow analyser (Anon. 1997) after return to the AIMS laboratories (Section 3). Analyses of total dissolved nutrients (TDN and TDP) were carried out using persulphate digestion of water samples (Valderrama 1981), which are then analysed for inorganic nutrients, as above. DON and DOP were calculated by subtracting the
8

Reef Rescue MMP - Inshore water quality monitoring - Final Report 2011/12
separately measured inorganic nutrient concentrations (above) from the TDN and TDP values.
To avoid potential contamination during transport and storage, analysis of ammonium concentrations in triplicate subsamples per Niskin bottle were also immediately carried out on board the vessel using a fluorometric method based on the reaction of ortho-phthal-dialdehyde (OPA) with ammonium (Holmes et al. 1999). These samples were analysed on fresh unfiltered seawater samples using specially cleaned glassware, because AIMS experience shows that the risk of contaminating ammonium samples by filtration, transport and storage is high. If available, the NH4 values measured at sea were used for the calculation of DIN.
Dissolved organic carbon (DOC) concentrations were measured by high temperature combustion (680ºC) using a Shimadzu TOC-5000A carbon analyser. Prior to analysis, CO2 remaining in the acidified sample water was removed by sparging with O2 carrier gas.
The sub-samples for particulate nutrients and chlorophyll a determinations were collected by vacuum filtration on pre-combusted glass-fibre filters (Whatman GF/F). Filters were wrapped in pre-combusted aluminium foil envelopes and stored at -18ºC until analyses.
Particulate nitrogen (PN) was determined by high-temperature combustion of filtered particulate matter on glass-fibre filters using an ANTEK 9000 NS nitrogen analyser (Furnas et al. 1995). The analyser was calibrated using AR Grade EDTA for the standard curve and marine sediment BCSS-1 as a control standard.
Particulate phosphorus (PP) was determined spectrophotometrically as inorganic P (PO4: Parsons et al. 1984) after digesting the particulate matter in 5% potassium persulphate (Furnas et al. 1995). The method was standardised using orthophosphoric acid and dissolved sugar phosphates as the primary standards.
The particulate organic carbon content (POC) of material collected on filters was determined by high temperature combustion (950ºC) using a Shimadzu TOC-V carbon analyser fitted with a SSM-5000A solid sample module. Filters containing sampled material were placed in pre-combusted (950ºC) ceramic sample boats. Inorganic C on the filters (e.g. CaCO3) was removed by acidification of the sample with 2M hydrochloric acid. The filter was then introduced into the sample oven (950ºC), purged of atmospheric CO2 and the remaining organic carbon was then combusted in an oxygen stream and quantified by IRGA. The analyses were standardised using certified reference materials (e.g. MESS-1).
Chlorophyll a concentrations were measured fluorometrically using a Turner Designs 10AU fluorometer after grinding the filters in 90% acetone (Parsons et al. 1984). The fluorometer was calibrated against chlorophyll a extracts from log-phase diatom cultures. The extract chlorophyll a concentrations were determined spectrophotometrically using the wavelengths and equation specified by Jeffrey and Humphrey (1975).
9

Reef Rescue MMP - Inshore water quality monitoring - Final Report 2011/12
Sub-samples for suspended solids (SS) were collected on pre-weighed 0.4 µm polycarbonate filters. SS concentrations were determined gravimetrically from the difference in weight between loaded and unloaded 0.4 µm polycarbonate filters (47 mm diameter, GE Water & Process Technologies) after the filters had been dried overnight at 60ºC.
Details about method performance and QAQC procedures are given in Appendix 2.
Autonomous Water Quality Loggers
Instrumental water quality monitoring was undertaken using WET Labs ECO FLNTUSB Combination Fluorometer and Turbidity Sensors. Details about deployment periods and description of instrument failures that led to data losses are summarised in Appendix 1-Table 1 and
Error: Reference source not found.
The ECO FLNTUSB instruments used in the MMP inshore water quality monitoring perform simultaneous in situ measurements of chlorophyll fluorescence, turbidity and temperature. The fluorometer monitors chlorophyll concentration by directly measuring the amount of chlorophyll fluorescence emission, using LEDs (centred at 455 nm and modulated at 1 kHz) as the excitation source. The fluorometer measures fluorescence from a number of chlorophyll pigments and their degradation products which are collectively referred to as “chlorophyll”, in contrast to data from the direct water sampling which specifically measures “chlorophyll a”. Optical interference, and hence an overestimation of the true “chlorophyll” concentration, can occur if fluorescent compounds in dissolved organic matter are abundant (Wright and Jeffrey 2006), for example in waters affected by flood plumes (see also Appendix 2). In the following the instrument data are referred to as “chlorophyll”, in contrast to data from the direct water sampling which measures specifically “chlorophyll a”. A blue interference filter is used to reject the small amount of red light emitted by the LEDs. The light from the sources enters the water at an angle of approximately 55–60 degrees with respect to the end face of the unit. The red fluorescence emitted (683 nm) is detected by a silicon photodiode positioned where the acceptance angle forms a 140-degree intersection with the source beam. A red interference filter discriminates against the scattered excitation light.
Turbidity is measured simultaneously by detecting the scattered light from a red (700 nm) LED at 140 degrees to the same detector used for fluorescence. The instruments were used in ‘logging’ mode and recorded a data point every 10 minutes for each of the three parameters, which was a mean of 50 instantaneous readings.
Pre- and post-deployment checks of each instrument included measurements of the maximum fluorescence response, the dark count (instrument response with no external fluorescence, essentially the ‘zero’ point) and of a dilution series of a 4000 NTU Formazin turbidity standard in a custom-made calibration chamber (see Schaffelke et al. 2007 for details on the calibration procedure). After retrieval from the field locations, the instruments were cleaned and data downloaded and converted from raw
10
Reef Rescue MMP - Inshore water quality monitoring - Final Report 2011/12
instrumental records into actual measurement units (µg L-1 for chlorophyll fluorescence, NTU for turbidity, ºC for temperature) according to standard procedures by the manufacturer. Deployment information and all raw and converted instrumental records were stored in an Oracle-based data management system developed by AIMS. Records are quality-checked using a time-series data editing software (WISKI-TV, Kisters). Instrumental data were validated by comparison with chlorophyll and suspended solid concentration obtained by analyses of water samples collected close to the instruments, which was carried out at each change-over (see Appendix 2).
In this report, only limited data for chlorophyll fluorescence are provided because a serious calibration problem was identified by the manufacturer and the adjustment and validation of the chlorophyll fluorescence data is still underway (see Appendix 3 for more details).
Data analysis
Comparison with trigger values from the GBR Water Quality GuidelinesThe Water Quality Guidelines for the Great Barrier Reef Marine Park (GBRMPA 2010) provides a useful framework to interpret the water quality values obtained at the fourteen core sampling sites and to identify areas/locations with potential water quality issues. Table 2 gives a summary of the Guidelines for five water quality variables in four cross-shelf water bodies. The MMP inshore monitoring locations are mostly located in the Open coastal water body, with four sites (Russell Is., Pelorus Is., Pandora Rf and Barren Is.) located in the Midshelf water body, which has the same Guidelines trigger values.
Table 2 Trigger values from the GBRMPA Water Quality Guidelines for the Great Barrier Reef Marine Park (GBRMPA 2010).
Water Body
ParameterEnclosed coastal
(Wet Tropics/Central Coast)Open coastal Midshelf Offshore
Chlorophyll a (μg L-1) 2.0 0.45 0.45 0.40Secchi (m) 1.0/1.5 10.0 10.0 17.0Suspended solids (mg L-1) 5.0/15.0 2.0 2.0 0.7Particulate nitrogen (μg L-1) n/a 20.0 20.0 17.0Particulate phosphorus (μg L-1) n/a 2.8 2.8 1.9
The relevant trigger values from Queensland Water Quality Guidelines (DERM 2009) are used in the GBR Guidelines for the enclosed coastal water body (Table 2). The Queensland guidelines also identify trigger values for dissolved inorganic nutrients for rivers and estuaries. In the GBR lagoon, dissolved inorganic nutrients are rapidly cycled through uptake and release by biota and are variable on very small spatial and temporal scales (Furnas et al. 2005, 2011). Due to this high variability their concentrations do neither show clear spatial patterns (De'ath 2007) nor do they clearly correlate with the responses of coral reef attributes, compared to the other water quality parameters that were included in the Guidelines and are considered to integrate nutrient availability over time (De’ath and Fabricius 2008). At present, trigger values for
11
Reef Rescue MMP - Inshore water quality monitoring - Final Report 2011/12
dissolved inorganic nutrients are not defined for the GBR lagoon. A review of the Guidelines that will consider the results of the MMP is planned to be undertaken by the GBRMPA during 2013-14.
Summary statistics and data presentationValues for water quality parameters at each station were calculated as depth-weighted means by trapezoidal integration of the data from discrete sampling depths. This included the samples collected by divers directly above the reef surface and the depth-profile station collected from the research vessel. Summary statistics over all sampling years of these depth-weighted mean values are presented as box and whisker plots (see box below for definitions and details of the box plots used).
Concentrations of the water quality constituents for which Guideline trigger values (GBRMPA 2010 are available [chlorophyll a, particulate nitrogen (PN), particulate phosphorus (PP), suspended solids (SS) and Secchi depth] are compared to these trigger values (Table 2). All available data over the sampling years 2005/06 to 2011/12 are combined for each of the 14 sampling locations and presented separately for dry and wet seasons. The dry season was defined as May to October, the wet season as November to April. The results are reported separately for each of four monitored NRM regions: the Wet Tropics, Burdekin, Mackay Whitsunday and Fitzroy NRM regions (using the marine boundaries of each NRM region, as provided by the GBRMPA). This allows the characterisation of the water quality at each site and a comparison along regional gradients, generally away from the coast. Complete water quality data for all variables (depth-weighted mean values for each station and sampling occasion) are reported in Appendix 1. At this stage of the program it is too early to analyse temporal trends of the data because the data series is too short and the direct water sampling too infrequent. A trend analysis is conducted for results of the “Cairns Transect’ (see below), which have been sampled since 1989.
Note: Outliers are defined as: >1.5-times the IQR, extreme values as >3-times the IQR
Daily averages of the chlorophyll concentrations and turbidity levels measured by the ECO FLNTUSB instruments at each of 14 locations are presented as line graphs. Annual means and medians were also calculated for each site based on the DERM
12

Reef Rescue MMP - Inshore water quality monitoring - Final Report 2011/12
“water year” (01 October to 30 September) and compared with the Guidelines. The turbidity trigger value (1.54 NTU) was derived by transforming the suspended solids trigger value in the Guidelines (2 mg L-1) using an equation based on a comparison between direct water samples and instrumental turbidity readings (see Schaffelke et al. 2009).
Temporal trend analysis of the Cairns Transect water quality dataData from the ‘Cairns Transect’, which has been regularly sampled by AIMS since 1989, is the only available long-term dataset for a comprehensive range of water quality parameters in the GBR lagoon (other than chlorophyll a, see below) with which to conduct temporal trend analyses. Water quality parameters were measured at eleven locations from 1989 – 2008. Each site was typically visited twice per year but sampling varied from none to four visits per year. From 2008/09 only six (see Figure 1) of the initial 11 sites were continued to be sampled after a statistical analysis indicated that this reduced number of stations would provide enough information for a robust time series analysis (E. Cripps, AIMS, pers. comm.).
The complete suite of water quality parameters (see above) were measured at the Cairns transect locations. For the analysis of temporal trends we have chosen a subset of six parameters, chlorophyll a (µgL-1), particulate nitrogen (PN, µgL-1), particulate phosphorus (PP, µgL-1), suspended solids (SS, mgL-1), dissolved organic nitrogen (DON, µgL-1) and dissolved organic phosphorus (DOP, µgL-1). These six parameters have shown temporal trends over sampling years in previous analysis (De’ath 2005, CRC Reef Consortium 2006, Schaffelke et al. 2007, 2008, 2009, 2010, 2011) and are the most likely parameters to show temporal trends because they are less variable over small spatial and temporal scales and are considered to integrate water column processes. The primary objective of this analysis was to assess the long-term trend of these six water quality parameters in the GBR lagoon over the observation period.
Initially, data were screened for zero values (i.e. concentrations below the detection limit). These were subsequently replaced by half the limit-of-detection values (MMP data) or half the smallest positive observed value (historical pre-MMP data). The data were then averaged across duplicates and depth because i) depth effects appeared to be small and sampling was well-balanced and ii) depth effects were not of interest in this study. Preliminary analysis of the variation between sites showed them to be also consistent over time. That is, the long-term trend for each water quality variable was similar at each site. Hence, the data were averaged over sites for subsequent analysis. Temporal trends in the six parameters were assessed using log-linear models (quasi-Poisson) with the temporal effects being decomposed into variation across years (thin plate regression splines) and within years by months (cyclical trends). The smoothness of the fitted trends was selected using cross-validation. The significance of the terms was based on F-tests. The results were presented as: (ii) tables that document the significance of the trends over time, by years and months; and (ii) graphical displays of the form of the dependency of the water quality variable on the predictors (years, months). The latter are called partial effects and are conditional on the other predictor held constant in the model. The analyses were carried out using the R statistical package (R_Development_Core_Team 2011).
13

Reef Rescue MMP - Inshore water quality monitoring - Final Report 2011/12
Interim site-specific water quality indexWe developed a simple water quality index to generate an overall assessment of water quality at each of the 20 water quality sampling locations (14 inshore reef locations with FLNTUSB instruments, 6 open water sites of the Cairns Water Quality Transect). The index is based on all available data to June 2012 using four-year running means as a compromise between having sufficient data for the assessment and the ability to show trends. We consider this index as “interim” as further research and data analyses need to be undertaken to refine, for example, the rating of exceedances beyond a simple binary compliance vs non-compliance assessments and the potential weighting of the water quality parameters. The index aggregates scores given to four indicators, in comparison with the GBR Water Quality Guidelines (GBRMPA 2010). The four indicators (or indicators groups) were:
1. Suspended solids concentration, SS, in water samples; Secchi depth; and turbidity measurements by FLNTUSB instruments, where available.
2. Chlorophyll a concentration in water samples; and chlorophyll fluorescence measurements by FLNTUSB instruments, where available*.
3. Particulate nitrogen (PN) concentrations in water samples; 4. Particulate phosphorus (PP) concentrations in water samples;
The indicators are a subset of the comprehensive suite of water quality variables measured in the MMP inshore water quality program. They have been selected because Guideline trigger values (GBRMPA 2010) are available for these measures and they can be considered as relatively robust indicators, integrating a number of bio-physical processes. Suspended solids, turbidity and Secchi depth are indicators for the clarity of the water, which is influenced by a number of oceanographic factors, such as wind, waves and tides as well as by suspended solids carried into the coastal zone by rivers (Fabricius et al., in press). Chlorophyll a concentrations/chlorophyll fluorescence are widely used as proxies for phytoplankton biomass as a measure of the productivity of a system or its eutrophication status and are considered to indicate nutrient availability (Brodie et al. 2007). Particulate nutrients (PN, PP) are a useful indicator for nutrient stocks in the water column (predominantly bound in phytoplankton and detritus as well as adsorbed to fine sediment particles) but are less affected by small-scale variability in space and time than dissolved nutrients (Furnas et al. 2005, Furnas et al. 2011).
Four-year running mean values for each of these indicators (i.e. all values from 2005-08, 2006-09, 2007-10, 2008-11, 2009-12, respectively) were converted into scores using the following decision rules:
1. Combined turbidity scorea. Suspended solids concentration:
-If the running mean was below the Guidelines, a score of 0 was given;-If the running mean was above the Guidelines, a score of 1 was given
b. Turbidity measured by FLNTUSB instruments: -If the running mean was below the Guidelines, a score of 0 was given;-If the running mean was above the Guidelines, a score of 1 was given
c. Secchi depth: -If the running mean was above the Guidelines, a score of 0 was given;
14

Reef Rescue MMP - Inshore water quality monitoring - Final Report 2011/12
-If the running mean was below the Guidelines, a score of 1 was given[Note: Secchi depth readings above the Guidelines indicate clearer water; Secchi depth increases with increasing clarity of the water.]
d. All individual indicators scores available for one site were averaged into a “combined turbidity score”.
2. Combined chlorophyll scorea. Chlorophyll a concentrations:
-If the running mean was below the Guidelines, a score of 0 was given;-If the running mean was above the Guidelines, a score of 1 was given
b. Chlorophyll measured by FLNTUSB instruments*: -If the running mean was below the Guidelines, a score of 0 was given;-If the running mean was above the Guidelines, a score of 1 was given
c. All individual indicators scores available for one site were averaged into a “combined chlorophyll score”.
3. Particulate nitrogen (PN) concentrations in water samples: -If the overall mean was below the Guidelines, a score of 0 was given;-If the overall mean was above the Guidelines, a score of 1 was given
4. Particulate phosphorus (PP) concentrations in water samples: -If the overall mean was below the Guidelines, a score of 0 was given;-If the overall mean was above the Guidelines, a score of 1 was given
The scores for the four indicators/indicator groups were added for each site to give an overall indicator score between 0 and 4 (i.e., 4 for the poorest water quality at sites where all four indicators returned the maximum score of 1, indicating non-compliance with the Guidelines).
In accordance with other GBR Report Card indicators and metric calculation processes (see Anon. 2011), the summed overall indicator score was standardised to a range from 0 to 100 such that zero is the lowest score and 100 is the highest using the equation:
Assessment score=100-(100/4*overall indicator score)
The proportional scores were converted to a “traffic light” colour scheme for reporting whereby:
• 0%-20% equates to “very poor” and is coloured red• >20%-40% equates to “poor” and is coloured orange• >40%-60% equates to “moderate” and is coloured yellow• >60%-80% equates to “good”, and is coloured light green• >80% equates to “very good” and is coloured dark green.
*Note that in this year’s assessment, data for chlorophyll fluorescence were not included because a serious calibration problem was identified by the manufacturer and the adjustment and validation of the historical chlorophyll fluorescence data is not yet completed (see Appendix 3 for more details).
15

Reef Rescue MMP - Inshore water quality monitoring - Final Report 2011/12
4. Results and Discussion
4.1 Region Reports: Wet Tropics Region
The Wet Tropics NRM Region comprises the catchments of the Daintree, Mossman, Barron, Mulgrave- Russell, Johnstone, Tully, Murray and Herbert rivers. The primary land uses in the region are sugar cane, bananas, dairy, grazing, horticulture and forestry. The region has a higher proportion of forest and National Park area than the other three regions considered in this report (Brodie et al. 2003).
Figure 2 Reef Rescue MMP water quality sampling sites in the Wet Tropics NRM Region at Snapper Island, Fitzroy Island, High Island, Russell Island and Dunk Island. Yellow symbols are the six open water sites of the AIMS Cairns Transect. Red symbols are sampling sites close to coral reefs.
©Google Earth 2009
16

Reef Rescue MMP - Inshore water quality monitoring - Final Report 2011/12
The five reef water quality sampling sites in the Wet Tropics Region are located along the coast to capture the influence of the main rivers in this region (; see Table 1 for details). There are also six additional open water sampling locations along the Cairns Transect (). Some of the major rivers in the Wet Tropics Region had annual flows above the long-term median (calculated using the earliest available data for each selected gauging station to September 2000) in the recent MMP monitoring years, while the years between 2001 and 2006 were relatively dry (Appendix 1-Table 3). Noteworthy were major flood events of the Barron in the “water years” (defined as 01 October to 30 September) of 2008 and 2011 and of the Herbert in 2009 and 2011. In 2011, all Wet Tropics rivers had above-median flow, while in the water year 2012 all river had below-median flow (Appendix 1-Table 3). For more information about flood-specific monitoring and detailed hydrographs of the GBR priority rivers see the annual report of the MMP Flood Monitoring (Devlin et al. 2012).
The results from the direct water sampling are presented as seasonal summaries over seven years of monitoring (2005/06 to 2011/12) for the water quality parameters for which Guideline trigger values were available (GBRMPA 2010) (Figure 3). Overall summary statistics over seven years of sampling are given in Table 3 for easy comparison with the GBRMPA Water Quality Guidelines and Queensland Water Quality Guidelines (Department of Environment and Resource Management 2009). Detailed results for all fifteen measured water quality variables for the sampling year 2011/12 are in Appendix 1-Table 4 to Appendix 1-Table 9.
The direct water sampling results over six years show that the water quality at the inshore reef locations in the Wet Tropics Region was mostly good, when assessed in comparison with the GBRMPA Guidelines. Values of most parameters were generally higher during the wet season and at a number of sites are above Guidelines values (Figure 3). Long-term mean concentrations of chlorophyll a, particulate nitrogen (PN), particulate phosphorus (PP) and suspended solids (SS) were within the Guidelines at the sampling locations close to the fringing reefs of Snapper, Fitzroy, and Russell islands and at the open water sites Cape Tribulation, Port Douglas, Double Island and Green Island (Table 3). Long-term means and medians of PP and SS exceeded the Guidelines at Dunk Island and at the open water sites Yorkey’s Knob and Fairlead Buoy; these three locations are relatively close to shore and to the influence of major rivers. Long-term means of chlorophyll a, but not the medians, exceeded the Guidelines at Fairlead Buoy, Dunk and High Island, indicating that a few very high values, in particular during the wet season (see Figure 3) influenced the high mean values.
All sampling locations had long-term mean Secchi depth values that were shallower than the Guideline of 10 m (Table 3), except for the Secchi readings at Green Island which have complied with the Secchi trigger value over the term of the monitoring. This site is furthest away from the coast and from river influence and has generally clear water. Overall mean Secchi values at Fitzroy, High and Russell Island have been very close to the Guideline (Table 3), indicating predominantly clear water conditions. However, the impression that all other sites have impaired water clarity is not supported by the generally compliant long-term means of SS at most sites. The SS
17

Reef Rescue MMP - Inshore water quality monitoring - Final Report 2011/12
guidelines were only exceeded at the open water sites at Yorkey’s Knob, Fairlead Buoy and the fringing reef site at Dunk Island; all these sites are in shallow water and close to river mouths. The mismatch of Secchi and SS values requires further research and it is possible that either guideline value requires future adjustment. The formulations of the guideline trigger value for Secchi depth and for SS concentrations were based on different datasets with only a subset of data having had both parameters measured concurrently (De’ath and Fabricius 2008, 2010). The instrumental water quality monitoring data confirm that the water quality at the three of the five coral reef locations in the Wet Tropics Region was good, when compared to the Guidelines.
Annual means of turbidity at Snapper and Dunk islands exceeded the turbidity Guidelines in all five years of instrumental monitoring (Table 9). Inspection of the turbidity time series at these two sites shows high variability of turbidity values throughout the year, with high values not only during periods of river floods (Figure 4 and Figure 6). At these two sites, 34-46% of the daily turbidity means in the years with sufficient data (i.e. > 300 d) were above the Guidelines (Table 9), while 8 to 18% of the daily means were also above the 5 NTU biological threshold suggested by Cooper et al. (2007, 2008), above which corals are likely to experience severe photo-physiological stress due to light limitation. The median values were mostly below the Guidelines, indicating that spikes in turbidity, very common at these two sites, caused the high annual mean values.
The mean turbidity at High Island in 2011 was just above the Guideline value (Table 9), while it was below guideline in the other four years of monitoring. The high turbidity values during the summer of 2011 were associated with the passage of Tropical Cyclone Yasi (note a peak in wind speed associated with a peak in turbidity in February 2011, Figure 5a) and with above-median discharge of the closest river, the Russell-Mulgrave River (Figure 5a, Appendix 1-Table 3).
Wind-driven resuspension is recognised as one of the major drivers of turbidity in the inshore GBR lagoon (e.g. Larcombe et al. 1995, Wolanski 2007, Orpin and Ridd 2012). An analysis of three years of turbidity data collected under this Program showed that turbidity is strongly related to wave height and, at sites with high tidal ranges such as in the Mackay Whitsunday region, to tidal forcing (Fabricius et al. in press). However, importantly, turbidity was also positively correlated with river flow at any given wave height, wave period and tidal range, with the relationship stronger at sites close to a river mouth (ibid.).
Hence, the turbidity at the monitored reef sites is likely to be influenced by a complex interplay of the regional oceanography, bathymetry, sediment quality, physical forcing and supply of fine particles. The high turbidity events observed throughout the year during strong winds are caused by resuspension of fine, clay/silt-sized, sediment particles. For example, Snapper Island is very close to the mouth of the Daintree River and Dunk Island is close to the very shallow area of Rockingham Bay, both areas that are influenced by river runoff and are prone to high turbidity due to sediment resuspension. However, it is interesting that the sediment quality directly at the reef locations is very different between these two high-turbidity sites. While Snapper Is. has a very high proportion of clay/silt sized particles with high organic carbon content, Dunk
18
Reef Rescue MMP - Inshore water quality monitoring - Final Report 2011/12
Is. has not (sediment quality data in Thompson et al. 2011). In contrast, Russell Is. has fine, organic-rich sediments (ibid.) but is a site with generally low water turbidity (Figure5). Thompson et al. (2011) suggest that the complex topography of the abundant corals and sheltered nature of the site facilitates fine sediment accumulation but at the same time reduces the resuspension of these locally available fine sediments. This emphasises that local physical and oceanographic conditions will also influence the water quality around coral reefs.
The turbidity at all five sampling locations in the Wet Tropics region showed a distinct spike in response to severe (category 5) Tropical Cyclone Yasi, which made landfall on 03 February 2011 in the Dunk Island/Mission Beach area, and slightly elevated, variable turbidity for a few weeks after the cyclone (Figure 4 to 6).
In this report, only limited data for chlorophyll fluorescence are provided because a serious calibration problem was identified by the manufacturer and the adjustment and validation of the historical chlorophyll fluorescence data is not yet completed (see Appendix 3 for more details). Only data that went through a number of quality checks are included in this report and we expect that in the next year’s report all retrospectively adjusted data (where adjustment is possible, see Appendix 3) will be included. Exhaustive data interpretation of these limited data is premature as the time series are now much shorter because some of the older deployments cannot be retrospectively adjusted, and fragmented due to some individual loggers not yet having gone through the recalibration and QAQC process.
The time series of chlorophyll fluorescence for the past 2 years of monitoring is complete only for Snapper Island (Figure 4). This site had annual mean chlorophyll fluorescence values just above the Guideline in the 2011 and 2012 water years (Table 8, note that the 2012 water year is incomplete as reporting only included values to June 2012). The direct water sampling long-term mean for chlorophyll, however, is below the Guideline (Table 3). The annual means of chlorophyll fluorescence at High and Russell islands are below the Guidelines (Table 8, note lower N due to some data gaps), which agrees with the long-term means from the direct water sampling (Table 3).
19

Reef Rescue MMP - Inshore water quality monitoring - Final Report 2011/12
Figure 3 Summary of concentrations of chlorophyll a, particulate nitrogen, particulate phosphorus (μg L-1), suspended solids (mg L-1) and Secchi depth (m) at reef locations in the Wet Tropics Region collected by direct water sampling over seven years (2005/06 to 2011/12). Dry season values (May- Oct) = shaded/green boxes, wet season (Nov-Apr) = unshaded/red boxes. See page 12 for more details about the box plot presentation. Broken lines are the GBR Water Quality Guidelines values (GBRMPA 2010).
20
Reef Rescue MMP - Inshore water quality monitoring - Final Report 2011/12
Table 3 Summary of concentrations of chlorophyll a (Chl a), particulate nitrogen (PN) particulate phosphorus (PP), all in μg L-1; suspended solids (SS, mg L-1) and Secchi depth (m) at reef and open water (*) locations in the Wet Tropics Region collected by direct water sampling over seven sampling years (2005/06 to 2011/12). Red shading indicates that overall means/medians exceeded the GBR Water Quality Guidelines values (GBRMPA 2010). N= number of sampling occasions (days).
Station Variable N Mean Median Lower quartile Upper quartile 20th percentile 80th percentile
Cape Tribulation*
Chl a (µg L-1) 17 0.40 0.34 0.27 0.53 0.25 0.54PN (µg L-1) 17 12.82 12.51 10.30 14.69 9.86 16.71PP (µg L-1) 17 2.60 2.54 2.01 3.15 1.99 3.35Secchi (m) 15 6.7 6.5 5.4 7.3 4.5 9.0SS (mg L-1) 17 1.36 1.25 0.76 1.64 0.72 1.74
Snapper Island
Chl a (µg L-1) 16 0.35 0.31 0.27 0.45 0.23 0.47PN (µg L-1) 16 12.12 11.18 9.90 13.18 9.20 14.76PP (µg L-1) 16 2.38 2.25 1.93 2.97 1.82 3.19Secchi (m) 16 5.8 5.5 4.0 7.3 4.0 7.9SS (mg L-1) 16 1.24 1.17 0.79 1.47 0.61 1.53
Port Douglas*
Chl a (µg L-1) 18 0.34 0.32 0.25 0.40 0.25 0.41PN (µg L-1) 18 12.67 12.11 10.61 14.43 10.44 14.85PP (µg L-1) 18 2.36 2.38 2.15 2.65 1.97 2.69Secchi (m) 18 6.9 7.0 5.0 9.0 5.0 9.0SS (mg L-1) 18 1.32 1.19 0.87 1.71 0.78 1.82
Double Island*
Chl a (µg L-1) 17 0.37 0.34 0.29 0.49 0.26 0.52PN (µg L-1) 17 11.53 11.59 9.64 13.17 8.74 13.36PP (µg L-1) 17 2.22 2.27 1.91 2.63 1.78 2.73Secchi (m) 16 8.1 6.8 5.0 11.5 4.6 13.4SS (mg L-1) 17 1.11 1.15 0.87 1.36 0.68 1.42
Green Island*
Chl a (µg L-1) 18 0.27 0.24 0.14 0.34 0.14 0.34PN (µg L-1) 18 9.39 9.21 7.97 10.59 7.96 10.73PP (µg L-1) 18 1.59 1.56 1.19 1.98 1.14 2.05Secchi (m) 18 13.5 13.0 10.5 16.0 10.1 16.0SS (mg L-1) 18 0.44 0.36 0.14 0.69 0.13 0.74
21

Reef Rescue MMP - Inshore water quality monitoring - Final Report 2011/12
Station Variable N Mean Median Lower quartile Upper quartile 20th percentile 80th percentile
Yorkey's Knob*
Chl a (µg L-1) 18 0.58 0.54 0.46 0.71 0.45 0.72PN (µg L-1) 18 16.55 15.83 13.63 18.45 13.59 18.93PP (µg L-1) 18 3.85 3.70 3.29 4.37 3.23 4.38Secchi (m) 18 3.8 3.0 2.5 5.0 2.5 5.4SS (mg L-1) 18 2.97 2.36 1.95 2.93 1.93 3.82
Fairlead Buoy*
Chl a (µg L-1) 18 0.53 0.45 0.38 0.64 0.37 0.66PN (µg L-1) 18 16.46 16.09 14.20 18.19 14.07 18.70PP (µg L-1) 18 4.22 3.97 3.01 5.11 3.01 5.12Secchi (m) 17 3.7 3.5 2.6 4.5 2.2 4.8SS (mg L-1) 18 3.84 2.83 1.81 5.49 1.77 5.76
Fitzroy Island
Chl a (µg L-1) 18 0.34 0.34 0.26 0.41 0.25 0.42PN (µg L-1) 18 10.92 10.76 9.08 12.33 8.98 12.46PP (µg L-1) 18 1.98 1.84 1.57 2.38 1.56 2.38Secchi (m) 18 9.0 8.8 7.5 11.0 7.3 11.0SS (mg L-1) 18 1.01 1.00 0.54 1.25 0.53 1.34
High Island
Chl a (µg L-1) 18 0.47 0.36 0.31 0.55 0.30 0.63PN (µg L-1) 18 12.27 11.86 10.02 13.12 9.76 13.88PP (µg L-1) 18 2.58 2.41 2.03 2.86 2.00 3.13Secchi (m) 18 6.7 6.3 4.0 10.0 4.0 10.2SS (mg L-1) 18 1.28 0.97 0.77 1.61 0.74 1.80
Russell Island
Chl a (µg L-1) 18 0.33 0.31 0.22 0.39 0.21 0.40PN (µg L-1) 18 10.13 9.89 9.12 11.02 8.77 11.46PP (µg L-1) 18 1.90 2.11 1.46 2.27 1.45 2.29Secchi (m) 17 9.9 9.0 7.0 12.8 6.7 13.0SS (mg L-1) 18 0.69 0.63 0.36 0.83 0.34 0.90
Dunk Island
Chl a (µg L-1) 19 0.60 0.43 0.38 0.75 0.34 0.76PN (µg L-1) 19 16.21 14.48 12.35 17.58 12.16 18.52PP (µg L-1) 19 3.55 3.26 2.34 3.91 2.31 4.67Secchi (m) 18 4.7 4.5 3.0 6.0 3.0 6.0SS (mg L-1) 19 2.65 1.43 1.30 2.36 1.29 2.69
22

Reef Rescue MMP - Inshore water quality monitoring - Final Report 2011/12
Figure 4 Time series of daily means of chlorophyll (green line, µg L-1) and turbidity (red line, NTU) time-series collected by ECO FLNTUSB instruments at (a) Snapper and (b) Fitzroy islands in the Wet Tropics NRM Region. Additional panels represent daily discharge from the Daintree (a) and Russell-Mulgrave (b) rivers (blue line, ML day -1 x 10⁴) and daily wind speeds (grey line, km h-1) from the Low Isles weather station. Horizontal green and red lines are the GBR Water Quality Guidelines values (GBRMPA 2010). Turbidity trigger value (red line) was derived by transforming the suspended solids trigger value (see Schaffelke et al. 2009). Note that only limited chlorophyll fluorescence values reported as they are undergoing a QAQC process (see Appendix 3 for details).
a
b
23
Reef Rescue MMP - Inshore water quality monitoring - Final Report 2011/12
Figure 5 Time series of daily means of chlorophyll (green line, µg L-1) and turbidity (red line, NTU) time-series collected by ECO FLNTUSB instruments at (a) High and (b) Russell islands in the Wet Tropics NRM Region. Additional panels represent daily discharge from the Russell-Mulgrave (a) and Johnstone (b) rivers (blue line, ML day-1 x 10⁴) and daily wind speeds (grey line, km h-1) from the Innisfail weather station. Other details as in Fig. 4.
a
b
24

Reef Rescue MMP - Inshore water quality monitoring - Final Report 2011/12
Figure 6 Time series of daily means of turbidity (red line, NTU) time-series collected by ECO FLNTUSB instruments at Dunk Island in the Wet Tropics NRM Region. Additional panels represent daily discharge from the Tully River (blue line, ML day-1 x 10⁴) and daily wind speeds (grey line, km h-1) from the Cardwell weather station. Other details as in Fig. 4.
25

Reef Rescue MMP - Inshore water quality monitoring - Final Report 2011/12
Cairns long-term water quality transectThe long-term time series of water quality parameters sampled since 1989 along the ‘AIMS Cairns Transect’ (see Figure 1, and Table 1 for sampling locations) was continued and the updated data were reanalysed. All six parameters showed significant long-term patterns (Table 4, Figure 7). The partial effects for the factor “Year” showed non-linear long-term trends in dissolved organic nitrogen (DON), dissolved organic phosphorus (DOP), particulate nitrogen (PN), suspended solids (SS) and chlorophyll a, while particulate phosphorus (PP) showed a linear trend of declining values over time. SS concentrations increased in the early to late 1990s, peaked around 1999 and then declined. PN concentrations were also highest around 1999, then decreased, and increased again over the last few years. Concentrations of DON and DOP peaked around 2003 and have declined since. Chlorophyll a concentrations showed multi-year fluctuations with high values at the start of the time series and again around 1999.
In addition to the long-term trends, the variables chlorophyll a and SS also had clear seasonal trends (Table 4, Figure 8). The partial effects for the factor “Months” over all sampling years showed that SS steadily increased from January to August/September and then declined. Chlorophyll a concentrations were highest during summer, from January to March/April, with a smaller secondary peak during spring, in September/October (see also Brodie et al. 2007). Variations across months were not statistically significant for the other parameters.
Table 4 Cairns Long-Term Water Quality Transect. Analyses of variance assessing the significance of trends over time, by years and months. Df= degrees of freedom, F= Variance ratio, P= probability.
Response variable Source df F Pr (>F) Deviance explained (%)Particulate nitrogen Years 6 7.198 0.0000 61.3
Months 3 2.745 0.0532Residuals 48
Particulate phosphorus Years 2 5.913 0.007 24.9Months 3 2.192 0.100Residuals 52
Suspended solids Years 2 8.886 0.0005 45.9Months 3 5.819 0.0018Residuals 47
Chlorophyll a Years 8 2.199 0.0416 48.8Months 3 6.719 0.0007Residuals 46
Dissolved organic nitrogen Years 6 3.025 0.0095 41.5Months 3 2.687 0.0569Residuals 48
Dissolved organic phosphorus
Years 4 7.653 0.00003 52.1
Months 3 1.946 0.134Residuals 50
26

Reef Rescue MMP - Inshore water quality monitoring - Final Report 2011/12
Figure 7 Cairns Long-Term Water Quality Transect. Smooth trends over sampling years from 1989 to 2012 (partial effects) for the water quality parameters dissolved organic nitrogen (µg L-1), dissolved organic phosphorus (µg L-1), particulate nitrogen (µg L-1), particulate phosphorus (µg L-1), suspended solids (mg L-1) and chlorophyll a (µg L-1). Broken lines are 95% confidence intervals.
27
Reef Rescue MMP - Inshore water quality monitoring - Final Report 2011/12
Figure 8 Cairns Long-Term Water Quality Transect. Smooth trends over sampling months of data from 1989 to 2012 (partial effects) for the water quality parameters dissolved organic nitrogen (µg L-1), dissolved organic phosphorus (µg L-1), particulate nitrogen (µg L-1), particulate phosphorus (µg L-1), suspended solids (mg L-1) and chlorophyll a (µg L-1). Broken lines are 95% confidence intervals.
28
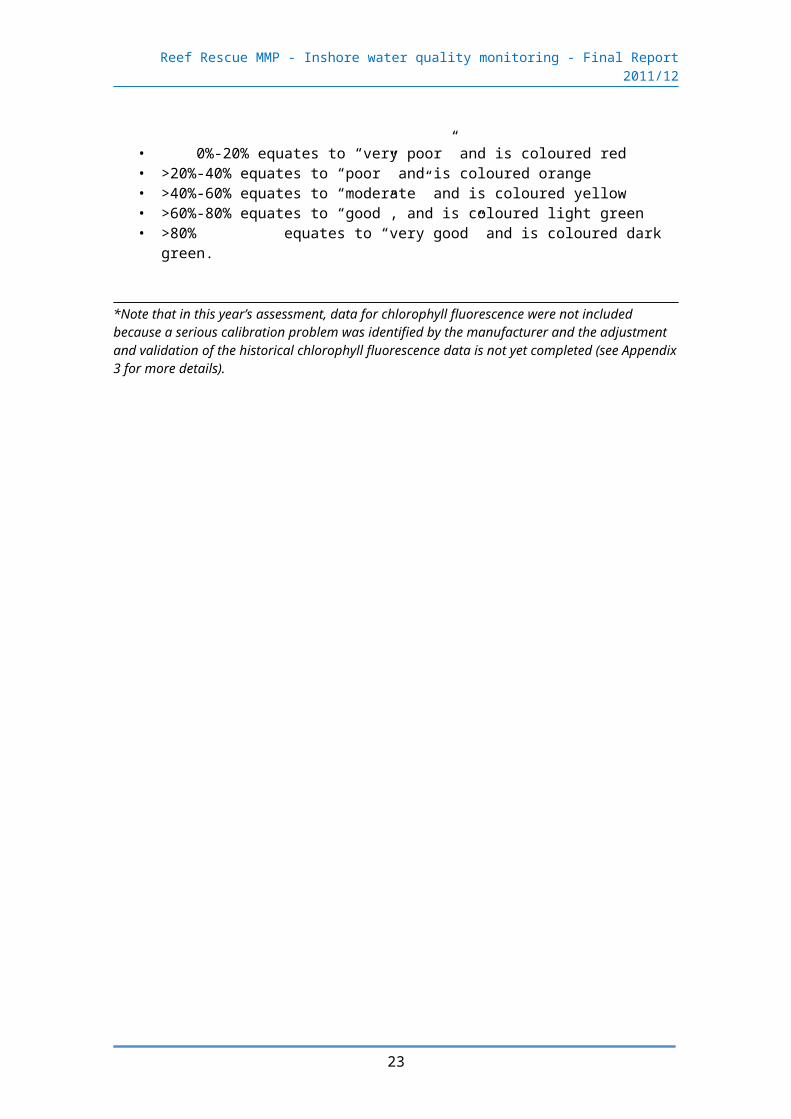
Reef Rescue MMP - Inshore water quality monitoring - Final Report 2011/12
An analysis of the factors influencing the inter-annual variation in water quality variables at sites along the Cairns Transect is now complete and in preparation for peer-review publication (Carleton et al. in prep.). Interim results were presented in Schaffelke et al. (2010) and are not repeated here. In brief, the analysis showed relationships between concentrations of water quality variables and several human-related and natural environmental factors, including: vegetation clearing rates on the adjacent catchment, increased land area under crops and periods of high rainfall and episodes of strong winds. In this data set, most of the variation was explained by the factor of month, highlighting the clear difference of water quality parameters between wet and dry seasons. Proximity to a river mouth combined with its discharge and catchment clearing rates explained approximately 15% of total variation. High land clearing rates from 1996-2001 were associated with high concentrations in the adjacent marine waters of chlorophyll a, particulate nitrogen and phosphorus, silicate and suspended solids. After 2004, land clearing was relatively low and particulate concentrations in coastal waters remained relatively constant or decreased even though there was a steady increase in wind strength and river discharge.
29

Reef Rescue MMP - Inshore water quality monitoring - Final Report 2011/12
4.2 Region Reports: Burdekin Region
The Burdekin Region is one of the two large dry tropical catchment regions adjacent to the GBR, with cattle grazing as the primary land use. There is also extensive irrigated planting of sugarcane on the floodplains of the Burdekin and Haughton rivers. Fluctuations in climate and cattle numbers greatly affect the state and nature of vegetation cover, and therefore, the susceptibility of soils to erosion, which leads to runoff of suspended sediments and associated nutrients.
The three water quality sampling sites in the Burdekin Region are located along a gradient away from the Burdekin River mouth (). There are no well-developed reefs closer to the river mouth than the southernmost sampling site at Magnetic Island.
Figure 9 Reef Rescue MMP water quality sampling sites (large red symbols) in the Burdekin NRM Region at Pelorus Island, Pandora Reef and Magnetic Island (Geoffrey Bay). The Burdekin River is south of the town of Ayr.
Burdekin River
©Google Earth 2012
30

Reef Rescue MMP - Inshore water quality monitoring - Final Report 2011/12
The Burdekin River had major flood events in 2008, 2009 and 2011, after annual flows had been below the long-term median from 2002 to 2006 (Appendix 1-Table 3). The 2011 event was the third biggest flood on record for this river, after 1974 and 1991. River flow in 2012 was almost 3-times above the long-term median, but only half the annual volume of the 2011 flood event. The sampling site at Magnetic Island is also influenced by local runoff and runoff from the Ross River and the sites at Pandora Reef and Pelorus Island by the Herbert River as well as the smaller creeks and rivers north of Townsville, i.e. the Bohle and Black rivers and Crystal Creek.
The water quality sampling sites at Pelorus Island in the Palm Islands group and, to a lesser extent, at Pandora Reef are also influenced by the Herbert River. This river also had a major flood event in 2011, the biggest event on record for this river, with discharge of more than 3-times the long-term median, while the 2012 flow was just above the long-term median (Appendix 1-Table 3). For more information about flood-specific monitoring and detailed hydrographs of the GBR priority rivers see the annual report of the MMP Flood Monitoring (Devlin et al. 2012).
The results from the direct water sampling over seven years of monitoring are presented as seasonal summary statistics for the five water quality parameters for which Guideline trigger values were available (GBRMPA 2010) (Figure 10) and as overall summary data (Table 5) for comparison with the Guidelines. Detailed results for all water quality variables for the sampling year 2011/12 are in Appendix 1-Table 4 to Appendix 1-Table 9. The summary results show that the water quality at the inshore reef locations in the Burdekin Region is generally characterised by seasonally high chlorophyll a and particulate phosphorus concentrations (Figure 10). Long-term means and medians of chlorophyll a, PP and SS exceeded the Guidelines at Magnetic Island (Table 5), and long-term Secchi depth readings did not comply with the Guidelines at all three locations. However, long-term means of the other four key water quality parameters were within the Guidelines at both Pelorus Island and Pandora Reef (Table5).
The instrumental water quality monitoring data mirrored the high concentrations of particulate water quality parameters measured in the direct water sampling, with generally high turbidity levels at Geoffrey Bay, Magnetic Island (Figure 12). All annual means and 36-50% of the daily records in each year exceeded the Guidelines (Table 9). Between 5 and 11% of daily records in each year were also above the suggested 5 NTU limit for severe coral photo-physiological stress due to light limitation (Cooper et al. 2007, 2008). In contrast, the annual turbidity means at Pelorus Island are generally below the Guidelines, while at Pandora Reef they were below Guidelines in all years except for 2011 (Table 9), which was the year of extreme weather with Cyclone Yasi and major floods affecting these sampling sites.
Most of the high turbidity spikes (> 10-20 NTU) at all three sites were associated with extreme winds events (e.g., January 2009, and Cyclone Yasi in February 2011). Relatively high turbidity remained during the following weeks, likely due to a combination of wind-driven resuspension that slowly settled out and particles entrained in flood waters from the Burdekin, Herbert and local rivers reaching the sampling locations (Figure 11, Figure 12). The extreme variability of the turbidity record indicates that Geoffrey Bay and, to a lesser extent, Pandora Reef (Figure 11, Figure 12) are
31

Reef Rescue MMP - Inshore water quality monitoring - Final Report 2011/12
regularly experiencing wind-driven resuspension events, which lead to frequent spikes throughout the year. This is despite lower proportions of fine-grained clays and silts at these two sites compared to the mean across all MMP inshore reef sites where sediment quality is monitored (Thompson et al. 2011) and an indication that these sites experience strong physical forcing by being exposed to the south-easterly tradewinds. The Pelorus Island sampling location is more protected from prevailing winds and is characterised by generally lower turbidity.
The sampling sites in the Burdekin region are very far away from the mouth of the Burdekin River (> 100 km). Only major flood events of long duration that affect the coastal and inshore water in the wider region are likely to directly influence the turbidity at these sites (see also discussion in Orpin and Ridd 2012). However, over periods of weeks to months, fine silt and clay particles and particulate nutrients remain in suspension and form organic aggregates that are carried as far as 100 km northward of the Burdekin River mouth (Bainbridge et al. 2012). During this long-distance transport, nutrients from the Burdekin River mix with many other local sources in the coastal zone and are continually taken up and released by marine organisms. This makes it difficult to trace nutrients in the marine environment back to their exact catchment sources. However, that fine sediment from the Burdekin River, over time, reaches Magnetic Island and the Palm Islands Group has been established using the analysis of trace elements in massive corals (McCulloch et al. 2003, Lewis et al. 2007). A fine sediment budget for Cleveland Bay indicates that fine sediment imported into the bay during above-median river flows would accumulate because resuspension and transport during strong trade winds only lead to limited export, while net export of fine sediments was estimated only via large sediment remobilisation during cyclones (Lambrechts et al. 2010). The sediment quality (proportion of clay and silt, organic carbon and nitrogen content) at the three MMP monitoring sites has not appreciably changed over the last six years (Thompson et al. 2011), perhaps indicating a balance of import and export and/or hydrodynamic conditions that prevent long-term accumulation of particles. If the next years of sampling are drier, i.e. less river flow into the coastal zone, we will be able to better disentangle the effects of floods and physical drivers in the control of water turbidity and also whether and how quickly the turbidity decreases over drier years under given wind and wave conditions.
In this report, no data for chlorophyll fluorescence from the sampling sites in the Burdekin Region were provided because a serious calibration problem was identified by the manufacturer and the adjustment and validation of the chlorophyll fluorescence data is not yet completed (see Appendix 3 for more details).
32

Reef Rescue MMP - Inshore water quality monitoring - Final Report 2011/12
Figure 10 Summary of concentrations of chlorophyll a, particulate phosphorus, particulate nitrogen (μg L-1), suspended solids (mg L-1) and Secchi depth (m) at sampling sites in the Burdekin Region over seven sampling years (2005/06 to 2011/12). Dry season values (May- Oct) = shaded/green boxes, wet season (Nov-Apr)= unshaded/red boxes. See page 12 for more details about the box plot presentation. Broken lines are the GBR Water Quality Guidelines values (GBRMPA 2010).
33
Reef Rescue MMP - Inshore water quality monitoring - Final Report 2011/12
Table 5 Summary of concentrations of chlorophyll a (Chl a), particulate nitrogen (PN) particulate phosphorus (PP), all in μg L-1; suspended solids (SS, mg L-1) and Secchi depth (m) at reef locations in the Burdekin Region collected by direct water sampling over seven sampling years (2005/06 to 2011/12). Red shading represents overall means or medians that exceed the GBR Water Quality Guidelines values (GBRMPA 2010). N= number of sampling occasions (days).
Station Variable N Mean Median Lower quartile Upper quartile 20th percentile 80th percentile
Pelorus Island
Chl a (µg L-1) 18 0.38 0.34 0.19 0.50 0.19 0.58PN (µg L-1) 18 11.35 10.65 8.83 13.09 8.50 13.78PP (µg L-1) 18 2.10 1.94 1.48 2.48 1.45 2.49Secchi (m) 18 7.9 8.0 7.0 9.0 6.8 9.0SS (mg L-1) 18 0.91 0.79 0.44 1.14 0.44 1.24
Pandora Reef
Chl a (µg L-1) 18 0.40 0.34 0.25 0.57 0.25 0.58PN (µg L-1) 18 12.56 11.54 10.31 14.84 10.18 15.52PP (µg L-1) 18 2.48 2.19 1.82 2.92 1.80 3.01Secchi (m) 17 7.6 7.5 5.3 9.4 4.7 10.4SS (mg L-1) 18 1.30 1.11 0.60 1.45 0.55 1.57
Magnetic Island
Chl a (µg L-1) 18 0.66 0.65 0.42 0.89 0.37 0.90PN (µg L-1) 18 17.24 16.61 13.06 18.93 12.88 19.19PP (µg L-1) 18 3.68 3.53 2.45 4.34 2.30 4.41Secchi (m) 18 4.4 3.5 3.0 5.5 2.6 5.7SS (mg L-1) 18 2.70 1.91 1.06 3.40 1.05 3.42
34

Reef Rescue MMP - Inshore water quality monitoring - Final Report 2011/12
Figure 11 Time series of daily means of turbidity (red line, NTU) time-series collected by ECO FLNTUSB instruments at Pelorus Island (a) and Pandora Reef (b) in the Burdekin NRM Region. Additional panels represent daily discharge from the Burdekin River (blue line, ML day-1 x 10⁵) and daily wind speeds (grey line, km h-1) from the Lucinda weather station. Other details as in Fig. 4.
a
b
35
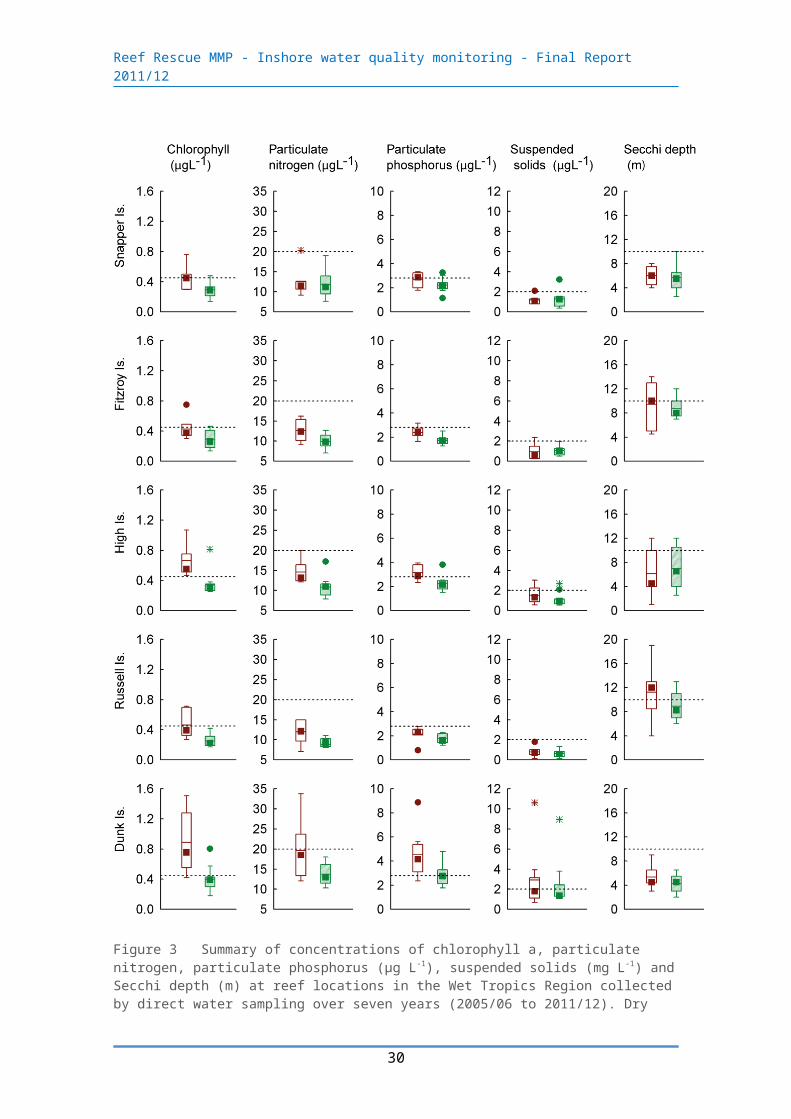
Reef Rescue MMP - Inshore water quality monitoring - Final Report 2011/12
Figure 12 Time series of daily means of turbidity (red line, NTU) time-series collected by ECO FLNTUSB instruments at Magnetic Island in the Burdekin NRM Region. Additional panels represent daily discharge from the Burdekin River (blue line, ML day-1 x 10⁵) and daily wind speeds (grey line, km h-1) from the Townsville Airport weather station. Other details as in Fig. 4.
36

Reef Rescue MMP - Inshore water quality monitoring - Final Report 2011/12
4.3 Region Reports: Mackay Whitsunday Region
The Mackay Whitsunday Region is located in the central section of the GBR and comprises four major river catchments, the Proserpine, O’Connell (both flowing into Repulse Bay), Pioneer and Plane catchments. The climate in this region is wet or mixed wet and dry and the catchment land use is dominated by agriculture, such as cropping (mainly sugarcane on coastal plains), some grazing in the upper catchments and minor urbanisation along the coast (Furnas 2003). The adjacent coastal and inshore marine areas have a large number of high continental islands with well-developed fringing reefs. Tides in the Mackay Whitsunday Region are semidiurnal and the tidal range can exceed 4 metres, which is higher than in most other inshore areas of the GBR.
Figure 13 Reef Rescue MMP water quality sampling sites in the Mackay Whitsunday NRM Region at Double Cone Island, Daydream Island and Pine Island.
©Google Earth 2012
37
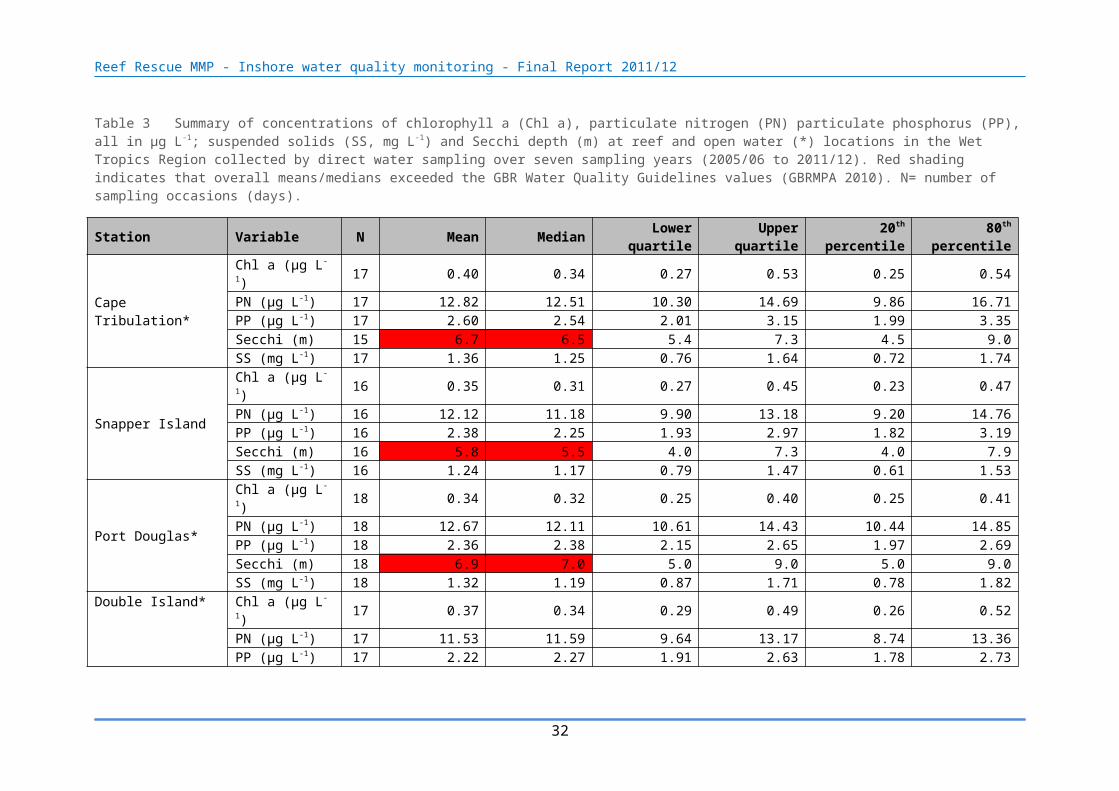
Reef Rescue MMP - Inshore water quality monitoring - Final Report 2011/12
The three sampling locations in the Mackay Whitsunday Region are located along a gradient away from the Proserpine and O’Connell rivers, both draining into Repulse Bay just south of the three sites (Figure 13). Additionally, the Pioneer River would influence the locations during major flood events. The Proserpine River had above long-term median flows during the past six years with major floods in 2008 to 2011 (Appendix 1-Table 3). The O’Connell River had above median discharge in 2008, and from 2010-2012, with a major flood in 2011. The Pioneer River had above-median discharge for the past six years with major floods in 2008 and from 2010-2012. For more information about flood-specific monitoring and detailed hydrographs of the GBR priority rivers see the annual report of the MMP Flood Monitoring (Devlin et al. 2012).
The results from the direct water sampling over five years of monitoring are presented as seasonal summary statistics (Figure 14) for the water quality parameters for which Guidelines values were available (GBRMPA 2010) and as overall summaries to compare to the Guidelines (Table 6). Detailed results for all water quality variables for the sampling year 2011/12 are in Appendix 1-Table 4 to Appendix 1-Table 9. The direct water sampling results show that water quality at the three monitored inshore reef locations in the Mackay Whitsunday Region is characterized by high long-term mean chlorophyll a concentrations and low water clarity (measured by Secchi depth) throughout the year, when compared to the Guidelines (Table 6). Chlorophyll a concentrations were especially high during the wet season (Figure 14), consistent with the seasonal cycle described in Brodie et al. (2007). However, the median values for chlorophyll a were at or above the Guideline at all three sampling sites, indicating that high values are systemic at these sites and not only driven by seasonal or episodic spikes. Long-term suspended solids means exceeded the Guideline trigger values at Pine Island and Daydream Island, while means of particulate phosphorus exceeded the Guidelines at Pine Island and were at Guideline at Daydream Island (Table 6). However, the median values for these two parameters at these two sites were below the Guideline, indicating that intermittent high values influenced the mean. Compared to last year a slight increase in most long-term means was apparent. The values of the main five water quality variables do not differ much between the three sites along the selected gradient away from the river influence, which suggests that the factors influencing the water quality in the inner Whitsunday islands act on a regional not a local scale. Cooper et al. (2007) described a distinct water quality gradient in the Whitsunday Region, however, that study included more sampling sites along a longer cross-shelf gradient, encompassing the outer Whitsunday Islands and some mid-shelf reefs, which allowed for more contrast between the sites.
The instrumental water quality monitoring data showed that annual mean chlorophyll fluorescence and turbidity broadly reflected the concentrations of chlorophyll a and suspended solids measured in the direct water sampling results and confirmed a weak gradient of turbidity at the three locations (Figure 15, Figure 16, Table 9).
In this report, only limited data for chlorophyll fluorescence are provided because a serious calibration problem was identified by the manufacturer and the adjustment and validation of the historical chlorophyll fluorescence data is not yet completed (see Appendix 3 for more details).
38
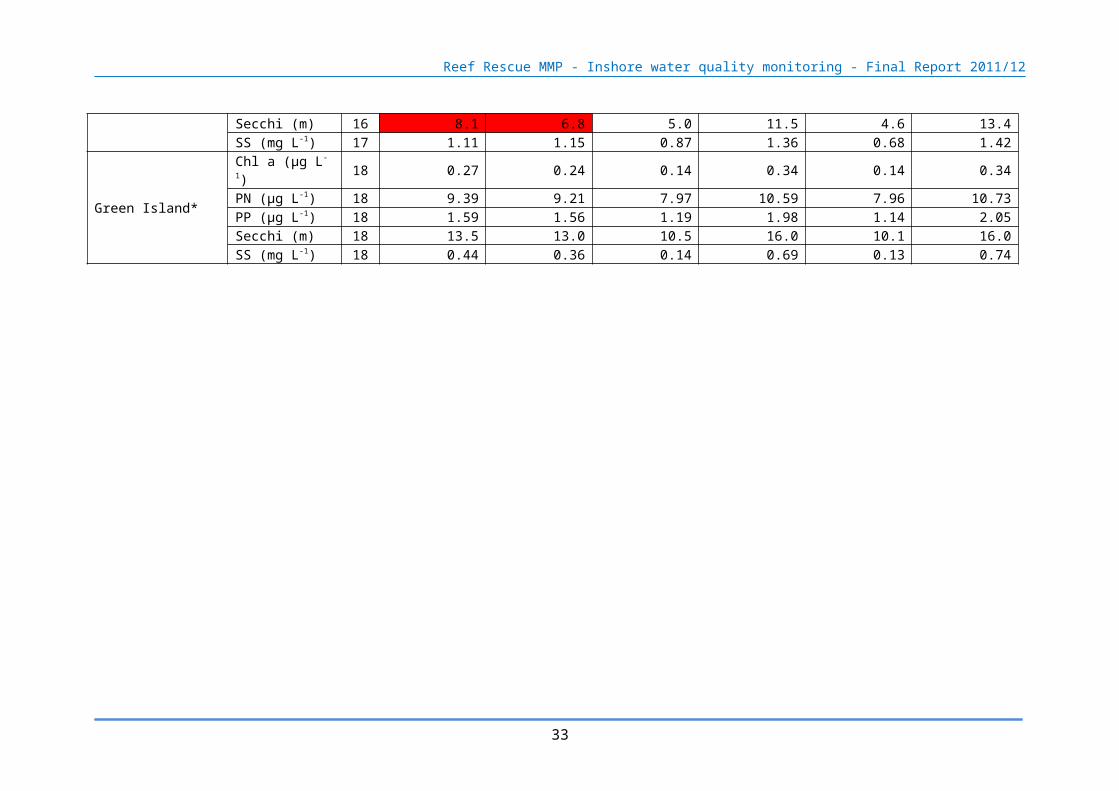
Reef Rescue MMP - Inshore water quality monitoring - Final Report 2011/12
The chlorophyll fluorescence data at hand are for the years 2011 and 2012 and confirm the results of the direct water sampling in that mean and median chlorophyll a concentrations generally exceeded the Guidelines at all three sites (at Guideline at Double Cone in 2012, Table 8).
Annual mean turbidity exceeded the Guidelines at Pine and Daydream islands in all five years of monitoring (Table 9). Median values were above the Guideline in all years at Pine Island and since 2010 at Daydream Island, indicating a systemic problem of high turbidity outside episodic events. At Pine Island, between 63 and 83% of the daily records in each year were above the Guideline trigger value, which is higher than at any other monitoring location, and 12-25 % of daily values were above the 5 NTU threshold for severe coral photo-physiological stress due to light limitation (Cooper et al. 2007, 2008). At Daydream Island, between 45 and 67% of the daily records in each year were above the Guideline trigger value, and 7-9 % of daily values were above the 5 NTU threshold Table 9). Turbidity at Double Cone exceeded the Guidelines in the 2010 water year, was at Guideline in 2011 and below the Guideline value in 2008, 2009 and 2012 (data only reported to June 2012, Table 9).
The coral reefs monitored by the MMP in the Mackay Whitsunday Region have the highest proportion of clay and silt-sized particles, organic carbon and nitrogen of all sampling regions and show a trend of increasing proportions of fine, easily resuspended, sediments over the past three years (Thompson et al. 2011). Even though all three sampling sites are surrounded by relatively deep water, wind-driven sediment resuspension is important at Pine and Double Cone islands but was not a significant driver of turbidity at Daydream Island (Fabricius et al. in press). The passage of TC Ului (Category 3, landfall 21 March 2010 at Airlie Beach) left a clear signal in the turbidity records at all three locations (Figures 17 and 18) while TC Anthony (Category 2, landfall 30 January 2011 near Bowen) and TC Yasi (Category 5, landfall 03 February 2011 close to Dunk Island, Wet Tropics) caused a lesser response in the turbidity and chlorophyll records, even though top wind speeds of 67 and 75 km h-1 were measured at the weather station at Hamilton Island on 30 January and 02 February 2011, respectively.
Local resuspension caused by the strong tidal currents in this region is significant. The high resolution (10 minute readings) turbidity records, especially at Pine and Daydream islands, showed regular increases and decreases correlated with the strong tidal flows in this region, and high turbidity values were associated with the summer king tides (data not shown; also see highly significant relationship between tidal forcing and turbidity at these three sites in Fabricius et al. in press). At all three sites, the turbidity was generally higher during the summer (Figure 15 and Figure 16) and may additionally be related to river discharge of the Proserpine and O’Connell rivers, which was mostly above median over the last six years (Appendix 1-Table 3)..
There is evidence that during major flood events, the flow of Burdekin and Fitzroy rivers can reach the Whitsunday Islands, as indicated by visualisation of movement of low salinity water from the Burdekin using the GBR 4 hydrodynamic model (Brinkman et al. 2011) and the movement of visible surface flood plumes from the Fitzroy River northward (Devlin et al. 2011). Subsurface water currents recorded at the IMOS Yongala National Reference Station have a predominately southward direction. This
39
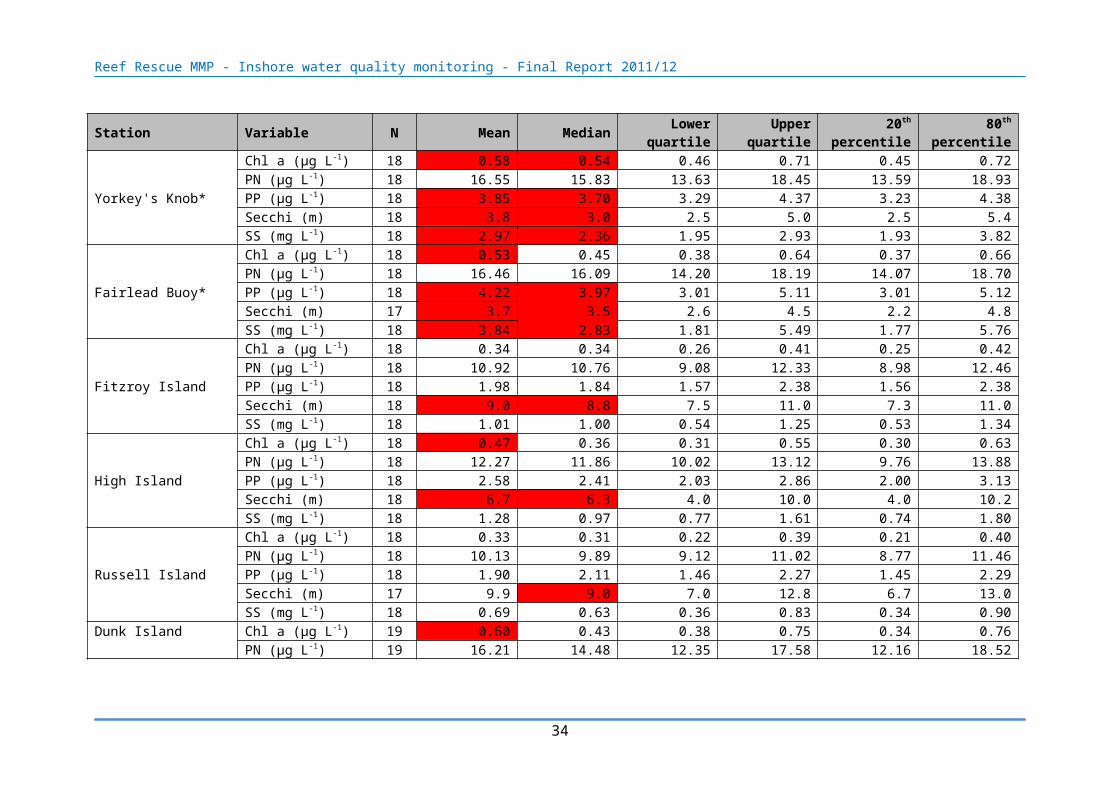
Reef Rescue MMP - Inshore water quality monitoring - Final Report 2011/12
station is in inshore open water east of Cape Bowling Green, ~40km north of the Burdekin River mouth and captures the Burdekin flood plume in large flood events. One could speculate that particles emanating from the Burdekin River, after settling out of the surface water, could be transported southward to the Whitsunday Islands perhaps as a nepheloid layer (Wolanski and Spagnol 2000). Total end-of-river loads of SS and particulate nutrients are substantially higher in the Burdekin and Fitzroy rivers than in the O’Connell and Pioneer rivers (Joo et al. 2012). If the material imported by these rivers reaches the Whitsunday Islands during major flood events it may contribute to the high concentrations of organic matter measured at the monitoring sites, as indicated by high chlorophyll concentrations and high organic matter content of the sediments. However, this remains speculation until the sediment transport and biogeochemical models are available that are currently developed by the project eReefs (http://www.bom.gov.au/environment/eReefs_Infosheet.pdf)
40

Reef Rescue MMP - Inshore water quality monitoring - Final Report 2011/12
Figure 14 Summary of concentrations of chlorophyll a, particulate phosphorus, particulate nitrogen (μg L-1), suspended solids (mg L-1) and Secchi depth (m) at sampling sites in the Mackay Whitsunday NRM Region collected by direct water sampling over seven sampling years (2005/06 to 2011/12). Dry season values (May- Oct) = shaded/green boxes, wet season (Nov-Apr) = unshaded/red boxes. See page 12 for more details about the box plot presentation. Broken lines are the GBR Water Quality Guidelines values (GBRMPA 2010).
41

Reef Rescue MMP - Inshore water quality monitoring - Final Report 2011/12
Table 6 Summary of concentrations of chlorophyll a (Chl a), particulate nitrogen (PN) particulate phosphorus (PP), all in μg L-1; suspended solids (SS, mg L-1) and Secchi depth (m) at reef locations in the Mackay Whitsunday NRM Region collected by direct water sampling over seven sampling years (2005/06 to 2011/12). Red shading represents overall means or medians that exceed the GBR Water Quality Guidelines values (GBRMPA 2010). N= number of sampling occasions (days).
Station Variable N Mean Median Lower quartile Upper quartile 20th percentile 80th percentileDouble Cone Island Chl a (µg L-1) 18 0.50 0.45 0.32 0.57 0.32 0.58
PN (µg L-1) 18 12.83 12.55 11.68 14.49 11.22 14.99PP (µg L-1) 18 2.49 2.47 1.93 2.97 1.90 3.00Secchi (m) 17 6.3 6.0 4.6 7.0 4.2 7.3SS (mg L-1) 18 1.61 1.31 0.97 2.19 0.96 2.19
Daydream Island Chl a (µg L-1) 18 0.56 0.53 0.43 0.70 0.41 0.71PN (µg L-1) 18 13.25 13.51 11.07 14.46 11.02 14.97PP (µg L-1) 18 2.80 2.40 2.14 3.12 2.09 3.14Secchi (m) 18 6.2 4.8 4.5 9.0 4.1 9.0SS (mg L-1) 18 2.51 1.80 1.40 3.21 1.35 3.53
Pine Island Chl a (µg L-1) 18 0.59 0.58 0.47 0.69 0.45 0.72PN (µg L-1) 18 13.43 13.37 11.88 14.15 11.51 15.10PP (µg L-1) 18 3.05 2.57 2.30 3.14 2.29 3.51Secchi (m) 17 5.3 5.0 3.0 7.4 2.4 7.8SS (mg L-1) 18 3.19 1.96 1.56 3.32 1.48 3.62
42

Reef Rescue MMP - Inshore water quality monitoring - Final Report 2011/12
Figure 15 Time series of daily means of chlorophyll (green line, µg L-1) and turbidity (red line, NTU) time-series collected by ECO FLNTUSB instruments at (a) Double Cone and (b) Daydream islands in the Mackay Whitsunday NRM Region. Additional panels represent daily discharge from the O’Connell River (blue line, ML day -1 x 10⁴) and daily wind speeds (grey line, km h-1) from the Hamilton Is. Airport weather station. Other details as in Fig. 4.
a
b
43
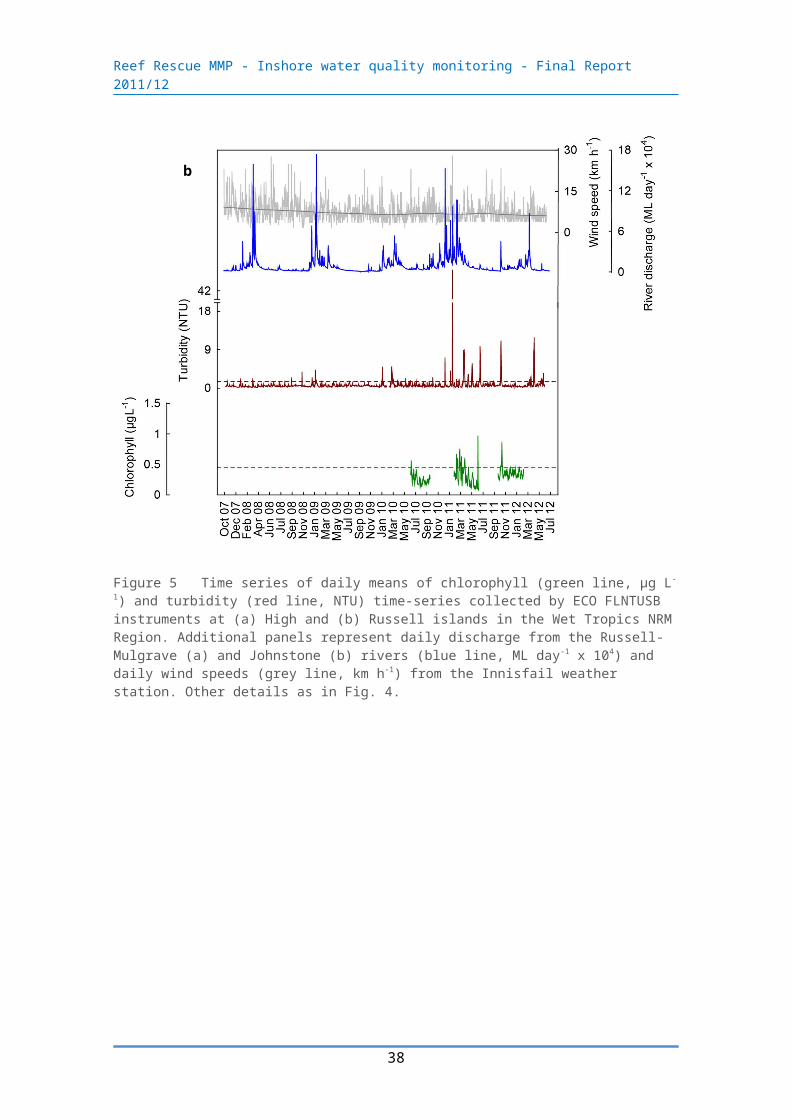
Reef Rescue MMP - Inshore water quality monitoring - Final Report 2011/12
Figure 16 Time series of daily means of chlorophyll (green line, µg L-1) and turbidity (red line, NTU) time-series collected by ECO FLNTUSB instruments at Pine Island in the Mackay Whitsunday NRM Region. Additional panels represent daily discharge from the O’Connell River (blue line, ML day-1 x 10⁴) and daily wind speeds (grey line, km h-1) from the Hamilton Is. Airport weather station. Other details as in Fig. 4.
44
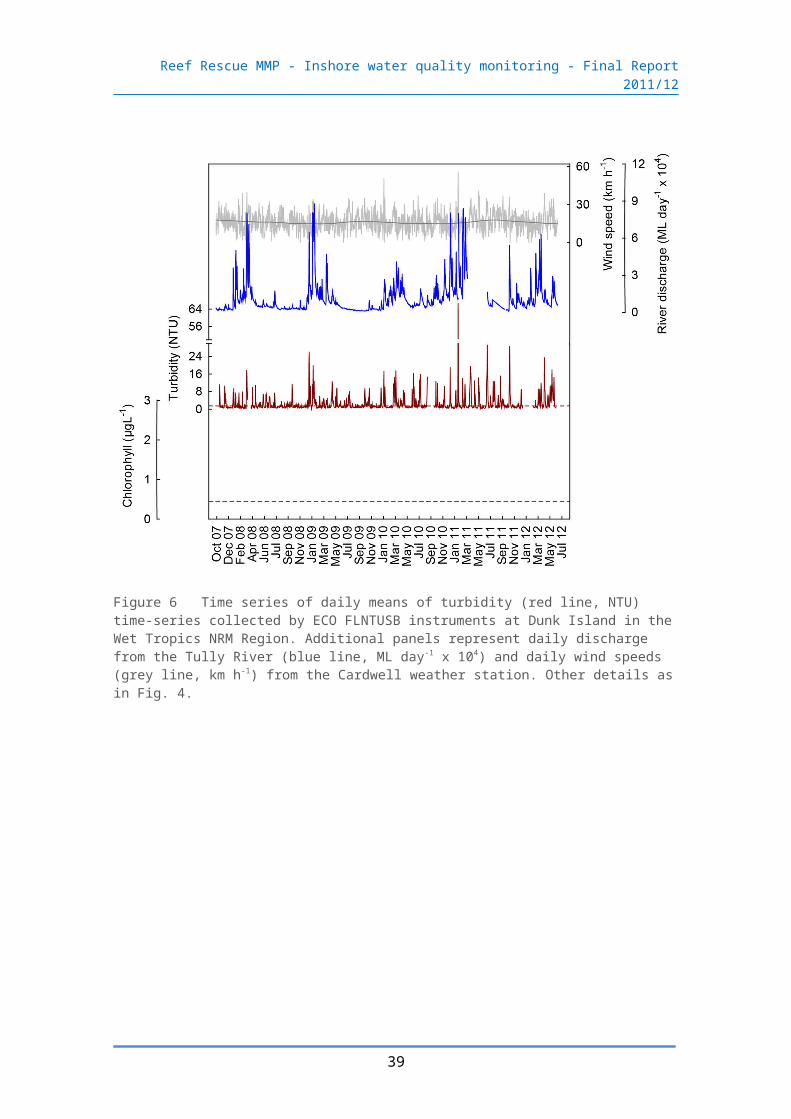
Reef Rescue MMP - Inshore water quality monitoring - Final Report 2011/12
4.4 Region Reports: Fitzroy Region
The Fitzroy NRM Region has the largest catchment area draining into the GBR. The climate is dry tropical with highly variable rainfall, high evaporation rates and prolonged dry periods, followed by infrequent major floods. By area, cattle grazing is the primary land use (Brodie et al. 2003). Fluctuations in climate and cattle numbers greatly affect the state and nature of vegetation cover, and therefore, the susceptibility of soils to erosion, which leads to runoff of suspended sediments and associated nutrients.
The three sampling locations in Keppel Bay are located on a gradient extending away from the Fitzroy River mouth (Figure 17). The Fitzroy River had three major flood events during the monitoring period; in 2008, 2010 and in 2011 which was the biggest flood on record, while in 2012 river flow was more than twice the long-term median (Appendix 1-Table 3). From 2001 to 2007, annual flows were below the long-term median.
Figure 17 Reef Rescue MMP water quality sampling sites in the Fitzroy NRM Region at Pelican Island, Humpy Island and Barren Island.
©Google Earth 2012
45

Reef Rescue MMP - Inshore water quality monitoring - Final Report 2011/12
The results from the direct water sampling over five years of monitoring are presented as seasonal summary statistics ( Figure 18) for the water quality parameters for which Guidelines trigger values were available (GBRMPA 2010) and as overall summaries to compare to the Guidelines (Table 7). Detailed results for all water quality variables in the sampling year 2011/12 are in Appendix 1-Table 4 to Appendix 1-Table 9. The direct water sampling results confirm that the water quality at the monitored inshore reef locations in the Fitzroy Region varied substantially along the gradient away from the coast and the river mouth. All water quality variables were distinctly higher, and Secchi depth lower, during the wet season (Figure 18, Appendix 1-Table 4 to Appendix 1-Table 9). At Pelican Island, the most inshore location, the long-term means of all key parameters, except for particulate nitrogen, exceeded the Guideline values. In contrast, the water quality variables at Barren Island, the location furthest offshore, were within the Guidelines. At Humpy Island, which is the intermediate site on the inshore-offshore gradient, long-term means of chlorophyll a and Secchi depth exceeded the Guidelines. At all sites, the long-term means showed a slight decrease compared to 2011.
The instrumental water quality monitoring data showed a similar pattern to the direct water sampling results with the turbidity readings confirm the clear gradient of water quality away from the Fitzroy River mouth (Figure 19 and Figure 20).
In this report, only limited data for chlorophyll fluorescence are provided because a serious calibration problem was identified by the manufacturer and the adjustment and validation of the historical chlorophyll fluorescence data is not yet completed (see Appendix 3 for more details).
Chlorophyll fluorescence data for the sites in the Fitzroy region are currently only available for Barren Island for the years 2010 to 2012. In the first two years, the annual means (N ~250 days) were below or at the Guideline value (Table 8). The 2011 annual mean of 0.45 µg L-1 included the largest flood event of the Fitzroy River on record but missed four months of data from mid-February to mid June 2011 due to an instrument failure. The median values in 2010 and 2011 are both very low and comparable to the low long-term mean concentration of chlorophyll a of 0.31 µg L-1, measured by the direct water sampling at Barren Island. The high 2012 mean is likely to be slightly biased towards higher summer value as it only includes data to June 2012 (Table 8) and the mean and median might decrease once the data for the remainder of the 2012 water year are included in the next annual report. Unfortunately, data earlier than 2009 will not be available for this site (see Appendix 3 for discussion).
The turbidity time series at Barren Island showed that the water was generally very clear, especially during the dry seasons, but that spikes occurred mostly after river flow events of the Fitzroy River (Figure 19). All annual means are far below the Guideline value (Table 9). The turbidity at Humpy Island showed higher annual means in 2010 and 2011 (Table 9) with extreme values during the wet seasons in these years (Figure 19), reflecting the extreme discharge of the Fitzroy River. However, the 2012 (incomplete) mean is again similar to the lower annual means in 2008 and 2009; all annual means are below the Guideline value. At Humpy Island, 11-26% of the daily records in each of the five monitoring years were over the Guideline, but only 1-4% of daily records also exceeded the suggested 5 NTU limit for severe coral photo-physiological stress (Cooper et al. 2007, 2008). Pelican Island had the highest turbidity
46

Reef Rescue MMP - Inshore water quality monitoring - Final Report 2011/12
of all 14 inshore GBR monitoring locations, with all annual means and medians exceeding the Guideline (Figure 20, Table 9). 44-77% of the daily records in each of the five monitoring years were over the Guideline and 22-42% of daily records at Pelican Island were also above 5 NTU.
While turbidity was generally higher during summer, and extreme during the three major flood events, Pelican Island also regularly experienced wind-driven resuspension events, leading to frequent spikes in turbidity (Figure 20; Fabricius et al. in press). While all three sampling locations are relatively exposed to the prevailing winds, Humpy and Barren islands are further offshore, surrounded by deeper water and have reefal (carbonate-rich) sediments with generally a very low proportion of clay-silt-sized particles (see Thompson et al. 2011). At these sites, wind-driven resuspension influences the turbidity (Fabricius et al. in press) but only major storms lead to very high turbidity (e.g. February 2010, see spikes in Figure 19 and Figure 20 coinciding with extreme wind). Even though the clay-silt content of the sediments at Barren Island significantly increased after the 2011 extreme flood (Thompson et al. 2011), no appreciable long-term increase in turbidity at this site was apparent. The sediment quality monitoring is part of the MMP inshore coral reef monitoring and the 2012 data are still being analysed to be reported in December 2012. As there was a general increase in fine particles across the sediments at all coral monitoring sites (Thompson et al. 2011), it will be interesting to see how quickly the sediment quality will return to baseline conditions. Webster and Ford (2010) modelled that fine river-derived sediment after major floods are retained in Keppel Bay and exported over several years by wind-driven and tidal currents.
Turbidity at Humpy and Pelican Island was higher in 2010 and 2011, likely reflecting the increased availability of fine, more easily re-supendable, sediments as well as the direct influences of the 2010 and 2011 flood plumes. Sediment-laden flood plumes associated with the 2011 record flood of the Fitzroy River reached Humpy Island at various stages during the four month-long event while Barren Island was not exposed to high SS-carrying flood plumes (see Brando et al. 2011 and Devlin et al. 2011 for detailed reporting of the 2011 record flood event; compare Figure 19 for flood signature in the turbidity records at Barren and Humpy islands).
47

Reef Rescue MMP - Inshore water quality monitoring - Final Report 2011/12
Figure 18 Summary of concentrations of chlorophyll a, particulate phosphorus, particulate nitrogen (μg L-1), suspended solids (mg L-1) and Secchi depth (m) at sampling sites in the Fitzroy NRM Region over seven sampling years (2005/06 to 2011/12). Dry season values (May- Oct) = shaded/green boxes, wet season (Nov-Apr) = unshaded/red boxes. See page 12 for more details about the box plot presentation. Broken lines are the GBR Water Quality Guidelines values (GBRMPA 2010).
48

Reef Rescue MMP - Inshore water quality monitoring - Final Report 2011/12
Table 7 Summary of concentrations of chlorophyll a (Chl a), particulate nitrogen (PN) particulate phosphorus (PP), all in μg L-1; suspended solids (SS, mg L-1) and Secchi depth (m) at reef locations in the Fitzroy Region collected by direct water sampling over seven sampling years (2005/06 to 2011/12). Red shading represents overall means or medians that exceed the GBR Water Quality Guidelines values (GBRMPA 2010).
Station Variable N Mean Median Lower quartile Upper quartile 20th percentile 80th percentile
Barren Island
Chl a (µg L-1) 18 0.31 0.25 0.18 0.36 0.18 0.38PN (µg L-1) 18 12.86 12.18 9.84 15.32 9.75 15.41PP (µg L-1) 18 2.03 1.84 1.50 2.44 1.49 2.60Secchi (m) 16 12.0 12.5 10.0 15.0 8.2 15.8SS (mg L-1) 18 0.45 0.39 0.17 0.69 0.17 0.70
Humpy Island
Chl a (µg L-1) 18 0.63 0.32 0.22 0.77 0.22 0.77PN (µg L-1) 18 14.30 12.50 10.31 16.71 9.76 16.74PP (µg L-1) 18 2.69 2.26 1.58 2.80 1.56 3.02Secchi (m) 17 9.8 10.0 7.3 11.8 5.5 12.6SS (mg L-1) 18 0.76 0.51 0.25 1.43 0.24 1.44
Pelican Island
Chl a (µg L-1) 18 0.84 0.41 0.28 0.93 0.27 0.94PN (µg L-1) 18 18.75 13.53 11.45 22.94 11.33 26.46PP (µg L-1) 18 4.35 2.89 2.68 5.66 2.52 6.21Secchi (m) 17 4.7 4.0 1.6 7.0 1.5 8.2SS (mg L-1) 18 4.00 1.81 0.79 2.41 0.77 4.02
49

Reef Rescue MMP - Inshore water quality monitoring - Final Report 2011/12
Figure 19 Time series of daily means of chlorophyll (green line, µg L-1) and turbidity (red line, NTU) time-series collected by ECO FLNTUSB instruments at (a) Barren and (b) Humpy islands in the Fitzroy NRM Region. Additional panels represent daily discharge from the Fitzroy River (blue line, ML day-1 x 10⁴) and daily wind speeds (grey line, km h-1) from the Yeppoon weather station. Other details as in Fig. 4.
a
b
50

Reef Rescue MMP - Inshore water quality monitoring - Final Report 2011/12
Figure 20 Time series of daily means of chlorophyll turbidity (red line, NTU) time-series collected by ECO FLNTUSB instruments at Pelican Island in the Fitzroy NRM Region. Additional panels represent daily discharge from the Fitzroy River (blue line, ML day-1 x 10⁴) and daily wind speeds (grey line, km h-1) from the Yeppoon weather station. Other details as in Fig. 4.
4.5 Summary of instrument monitoring results for all regions
The following two tables provide summary statistics for all 14 sites where continuous instrumental water quality monitoring by WET Labs ECOFLNTUSB instruments is undertaken. These tables are referred to in the text for the respective regions and should be considered in conjunction with the graphical depiction of the time series of chlorophyll fluorescence and turbidity collected by these instruments.
51

Reef Rescue MMP - Inshore water quality monitoring - Final Report 2011/12
Table 8 Summary of chlorophyll (μg L-1) data from deployments of WET Labs ECO FLNTUSB Combination Fluorometer and Turbidity Sensors at 14 inshore reef sites. N= number of daily means in the annual time series (based on ‘water year’, October to October); SE= standard error; “% d> trigger” refers to the percentage of days within the annual record with mean values above the chlorophyll a trigger value (0.45 µg L-1) in the GBRMPA Water Quality Guidelines for the Great Barrier Reef Marine Park (GBRMPA 2010). Red shading highlights the annual means that are above the trigger value.
NRM region Location October 2007 to September 2008 October 2008 to September 2009 October 2009 to September 2010
NAnnual mean SE
Annual median
%d >trigger N
Annual mean SE
Annual median
%d >trigger N
Annual mean SE
Annual median
%d >trigger
Wet Tropics
Snapper Is 96 0.52 0.01 0.50 72Fitzroy IsHigh IsRussell Is 98 0.25 0.01 0.22 2Dunk Is
BurdekinPelorus IsPandora RfMagnetic Is
Mackay WhitsundayDouble Cone IsDaydream IsPine Is
FitzroyBarren Is 220 0.41 0.02 0.31 38Humpy IsPelican Is
52

Reef Rescue MMP - Inshore water quality monitoring - Final Report 2011/12
Table 8 continued
NRM region Location October 2010 to September 2011 October 2011 to June 2012
NAnnual mean
SEAnnual median
%d >trigger
NAnnual mean
SEAnnual median
%d >trigger
NAnnual mean
SE
Annual median
%d >trigger
Wet Tropics
Snapper Is365 0.49
0.01 0.45 50 252 0.47 0.01 0.44 46
Fitzroy Is
High Is357 0.41
0.01 0.36 33 114 0.44 0.02 0.40 38
Russell Is139 0.30
0.01 0.27 18 138 0.36 0.01 0.34 9
Dunk Is
BurdekinPelorus IsPandora RfMagnetic Is
Mackay Whitsunday
Double Cone Is331 0.62
0.01 0.61 81 259 0.45 0.01 0.43 49
Daydream Is105 0.50
0.01 0.51 71 259 0.61 0.01 0.62 93
Pine Is223 0.61
0.01 0.61 96 124 0.58 0.01 0.58 95
FitzroyBarren Is
246 0.45
0.02 0.27 33 257 0.64 0.02 0.66 61
Humpy IsPelican Is
53

Reef Rescue MMP - Inshore water quality monitoring - Final Report 2011/12
Table 9 Summary of turbidity (NTU) data from deployments of WET Labs ECO FLNTUSB Combination Fluorometer and Turbidity Sensors at 14 inshore reef sites. N= number of daily means in the annual time series (October to September); SE= standard error; “% d> trigger” refers to the percentage of days within the annual record with mean values above the trigger values in the GBRMPA Water Quality Guidelines for the Great Barrier Reef Marine Park (GBRMPA 2010). Red shading highlights the annual means that are above the trigger value. The turbidity trigger value (1.5 NTU) was derived by transforming the suspended solids trigger value in the Guidelines (2 mg L -1) using an equation based on a comparison between direct water samples and instrumental turbidity readings (see Appendix 2). “% d> 5 NTU” refers to the percentage of days above 5 NTU, a threshold suggested by Copper et al. (2007, 2008) above which hard corals are likely to experience photo-physiological stress.
NRM region
Location October 2007 to September 2008 October 2008 to September 2009 October 2009 to September 2010
N
Annua
l
mean
SE
Annual
media
n
%d
>trigge
r
% d
>5
NTU
N
Annua
l
mean
SE
Annua
l
media
n
%d
>trigger
% d
>5
NTU
N
Annua
l
mean
SE
Annua
l
media
n
%d
>trigger
% d
>5
NTU
Wet
Tropics
Snapper Is 353 2.20 0.12 1.38 46 8 365 1.87 0.12 1.26 37 6 197 3.21 0.23 1.91 59 21
Fitzroy Is 249 0.85 0.05 0.70 6 1 173 0.89 0.10 0.70 6 1 356 0.88 0.05 0.67 9 1
High Is 356 0.81 0.03 0.67 6 1 365 0.84 0.03 0.69 8 0 365 1.20 0.07 0.78 18 3
Russell Is 357 0.49 0.01 0.42 2 0 365 0.63 0.02 0.54 4 0 352 0.71 0.03 0.52 6 1
Dunk Is 334 2.02 0.13 1.09 34 11 365 2.31 0.15 1.27 40 9 336 2.67 0.17 1.29 41 14
Burdekin
Pelorus Is 258 0.50 0.01 0.48 0 0 365 0.74 0.04 0.56 7 1 363 0.60 0.03 0.52 2 1
Pandora Rf 358 0.96 0.04 0.71 13 1 365 1.17 0.14 0.74 10 2 365 1.10 0.05 0.85 17 1
Magnetic Is 272 2.12 0.17 1.11 36 9 365 2.33 0.24 1.31 42 8 291 1.79 0.09 1.27 41 5
Mackay
Whitsund
ay
Double Cone
Is 199 1.15 0.07 0.84 17 2 273 1.42 0.07 0.99 30 2 360 1.74 0.09 1.19 40 3
Daydream Is 359 2.01 0.10 1.40 45 8 365 1.99 0.08 1.48 49 7 365 2.42 0.11 1.82 59 9
Pine Is 362 2.87 0.15 2.07 66 12 289 3.08 0.17 2.17 64 18 347 3.20 0.21 1.86 63 14
Fitzroy
Barren Is 364 0.37 0.02 0.25 2 0 333 0.46 0.03 0.25 6 0 221 0.47 0.05 0.27 4 1
Humpy Is 362 0.87 0.06 0.41 17 1 142 0.89 0.09 0.46 11 1 365 1.26 0.15 0.53 17 4
Pelican Is 363 5.08 0.36 2.15 55 33 363 3.42 0.24 1.21 44 22 365 5.50 0.50 1.60 52 28
54

Reef Rescue MMP - Inshore water quality monitoring - Final Report 2011/12
55

Reef Rescue MMP - Inshore water quality monitoring - Final Report 2011/12
Table 9 continued
NRM region
Location October 2010 to September 2011 October 2011 to June 2012
N
Annua
l
mean
SE
Annual
media
n
%d
>trigge
r
% d
>5
NTU
N
Annua
l
mean
SE
Annua
l
media
n
%d
>trigger
% d
>5
NTU
Wet
Tropics
Snapper Is 365 2.46 0.18 1.40 44 10 252 2.44 0.22 1.19 35 10
Fitzroy Is 365 1.26 0.12 0.74 16 4 253 1.99 0.15 0.95 35 10
High Is 365 1.56 0.15 0.82 21 5 250 1.23 0.12 0.66 17 3
Russell Is 365 1.14 0.15 0.54 13 4 253 0.96 0.10 0.54 10 3
Dunk Is 360 3.22 0.28 1.28 42 18 202 3.37 0.31 1.35 45 20
Burdekin
Pelorus Is 365 0.98 0.15 0.60 12 1 262 0.80 0.03 0.70 6 0
Pandora Rf 365 1.70 0.23 0.89 25 6 261 1.48 0.14 0.93 21 4
Magnetic Is 365 2.79 0.30 1.48 49 11 255 2.57 0.19 1.50 50 11
Mackay
Whitsund
ay
Double Cone
Is 365 1.50 0.05 1.26 38 2 259 1.43 0.05 1.20 34 0
Daydream Is 365 2.56 0.10 2.04 67 8 259 1.92 0.07 1.57 54 3
Pine Is 338 3.35 0.13 2.72 83 19 259 2.50 0.11 2.04 72 7
Fitzroy
Barren Is 246 0.38 0.02 0.24 2 0 257 0.26 0.01 0.22 0 0
Humpy Is 365 1.25 0.07 0.66 26 2 258 0.82 0.04 0.64 15 0
Pelican Is 226 6.75 0.60 2.10 58 36 257 5.87 0.36 3.55 77 42
56
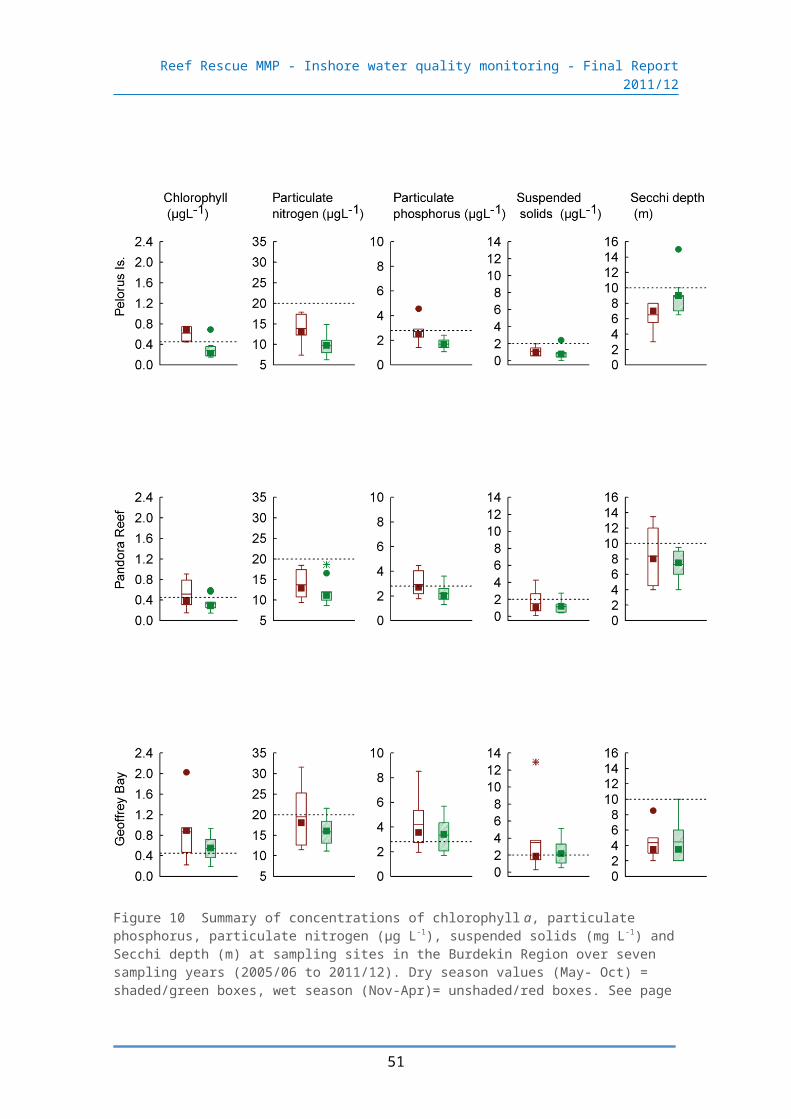
Reef Rescue MMP - Inshore water quality monitoring - Final Report 2011/12
5. Conclusions
Scientists and managers have realised that ongoing adaptive management of human pressures on regional and local scales, such as enhanced nutrient runoff and overfishing, is vital to provide corals and reef organisms with the maximum resilience to cope with global stressors, such as climate change (Bellwood et al. 2004, Marshall and Johnson 2007, Carpenter et al. 2008, Mora 2008). The management of water quality remains an essential requirement to ensure the long-term protection of the coastal and inshore reefs of the GBR. The Reef Plan and Reef Rescue initiatives have recently been re-affirmed as the key management tools to improve water quality entering the GBR and will, in the long-term, improve coastal and inshore marine water quality (UNESCO GBR Mission report: http://whc.unesco.org/en/sessions/36COM/documents, GBRMPA 2012a). However, a critical consideration are the as yet undetermined timeframes and spatial scales required to achieve reductions of river pollutant loads that will improve the resilience of inshore ecosystems in the face of a globally changing climate and other emerging pressures such as increased costal development and shipping traffic in the GBR (Brodie and Waterhouse 2012, Kroon 2012).
Sustained long-term monitoring of the coastal and inshore GBR lagoon is fundamental to determine the status of marine water quality and long-term trends related to environmental changes, including changes in response to Reef Plan and Reef Rescue actions. The MMP water quality monitoring has now completed its 7th year and the results have improved our understanding of the spatial and temporal variability of biogeochemical and physical variables in the GBR inshore lagoon. The state of water quality in the inshore GBR shows clear gradients away from river mouths (previously described in Cooper et al. 2007 and De’ath and Fabricius 2008, 2010) and is influenced over short time periods by flood events and sediment resuspension and over longer time periods by a complex interplay of physical forcing and biological transformation processes. A multivariate statistical analysis on 5 years of MMP water quality data showed significant year-to-year, seasonal and regional variability (Schaffelke et al. 2012), which means that no single factor or process can be considered in isolation. A subsequent multivariate regression model (ibid.) showed that most variation was explained by temporal factors (seasons, years and river flow), highlighting the extremely variable climate of the Great Barrier Reef region. Regional aspects (such as latitude, land use on adjacent catchments, proximity to rivers and a resuspension index) explained a smaller, albeit significant, amount of the variation in the data. Climate forecasts predict an increase in the frequency and severity of extreme events such as storms and floods in Australia (Steffen 2009) and hindcasting of rainfall using coral cores has shown that rainfall amount and variability have already significantly increased in northern Australia over the past 100 years (Lough 2011). With changing external drivers the variability of the water quality in the inshore GBR lagoon can be expected to increase in the future.
A similar analysis was carried out using data from the longest time series of water quality data for the GBR, the AIMS Cairns Transect, which has been sampled since 1989 (Carleton et al., in prep.). This analysis showed relationships between concentrations of water quality variables and several human-related and natural
57

Reef Rescue MMP - Inshore water quality monitoring - Final Report 2011/12
environmental factors, including; vegetation clearing rates on the adjacent catchment, increased land area under crops and periods of high rainfall and episodes of strong winds. In this data set, too, most variation was explained by the clear difference of water quality parameters between wet season and dry seasons. Proximity to a river mouth combined with its discharge and catchment clearing rates explained approximately 15% of total variation. High land clearing rates from 1996-2001 were associated with high concentrations in the adjacent marine waters of chlorophyll a, particulate nitrogen and phosphorus, silicate and suspended solids. After 2004, land clearing was relatively low and particulate concentrations in coastal waters remained relatively constant or decreased even though there was a steady increase in wind strength and river discharge. This is the first time that a significant correlation could be shown between land-use change on the catchment (land clearing rate) and marine water quality. However, this required an acute large change on the catchment and a long water quality time series, spanning several cycles of wet, dry and average years in terms of river runoff. A longer time series for all the MMP sites will be required to disentangle any influences of land management changes under Reef Rescue and Reef Plan from the high temporal variability in the marine water quality data.
The site-specific monitoring has been effective in identifying regional hotspots of impaired water quality. In the summary assessment for 2012, using the interim water quality index (see Table on next page), five out of the eleven Wet Tropics locations were rated as ‘good’ or ‘very good’; three of these are located in the midshelf water body. Of the remaining sites, five were rated as ‘poor’. Dunk Island, Yorkey’s Knob and Fairlead Buoy, all locations close to river mouths that drain highly developed catchments, were consistently rated as ‘poor’ since the start of the MMP monitoring. The sites Cape Tribulation and Snapper Island in the northern Wet Tropics were only in the current year downgraded to a ‘poor’ rating, while High Island had a ‘moderate’ rating for the second year. Of the three sites in the Burdekin Region, the water quality index of the two sites located in the midshelf water body was rated as ‘good’, while the Magnetic Island site that is closer to the mainland and to riverine influence had again a ‘poor’ rating. The water quality at all three sites in the Mackay Whitsunday Region was again rated as ‘poor’. In the Fitzroy Region, the most inshore location, Pelican Island had a water quality index of ‘poor’. Humpy Island was rated as ‘moderate’, while Barren Island retained its ‘very good’ rating. The interim water quality indices in this region have not changed over the last three years. The sites that were rated as ‘poor’ had running means of chlorophyll, turbidity-related values (combining suspended solids, Secchi depth and turbidity data) and particulate phosphorus that exceeded the Guidelines.
Because the state of coastal pelagic and benthic communities in the GBR responds to a wide range of physical, chemical and biological forcing factors, it is important that a comprehensive monitoring effort is able to integrate the broadest range of forcing factors into estimates of ecosystem status. The current instrumental monitoring program follows three key and directly measurable parameters (chlorophyll fluorescence, turbidity, temperature) at local scales (individual reef sites) with high temporal resolution (10 min). Chlorophyll fluorescence is considered to be a useful measure of phytoplankton biomass which, in turn, generally reflects nutrient availability. Turbidity and temperature are important physical water quality variables that influence the environmental suitability of a water body for marine biota, which in a GBR context is
58
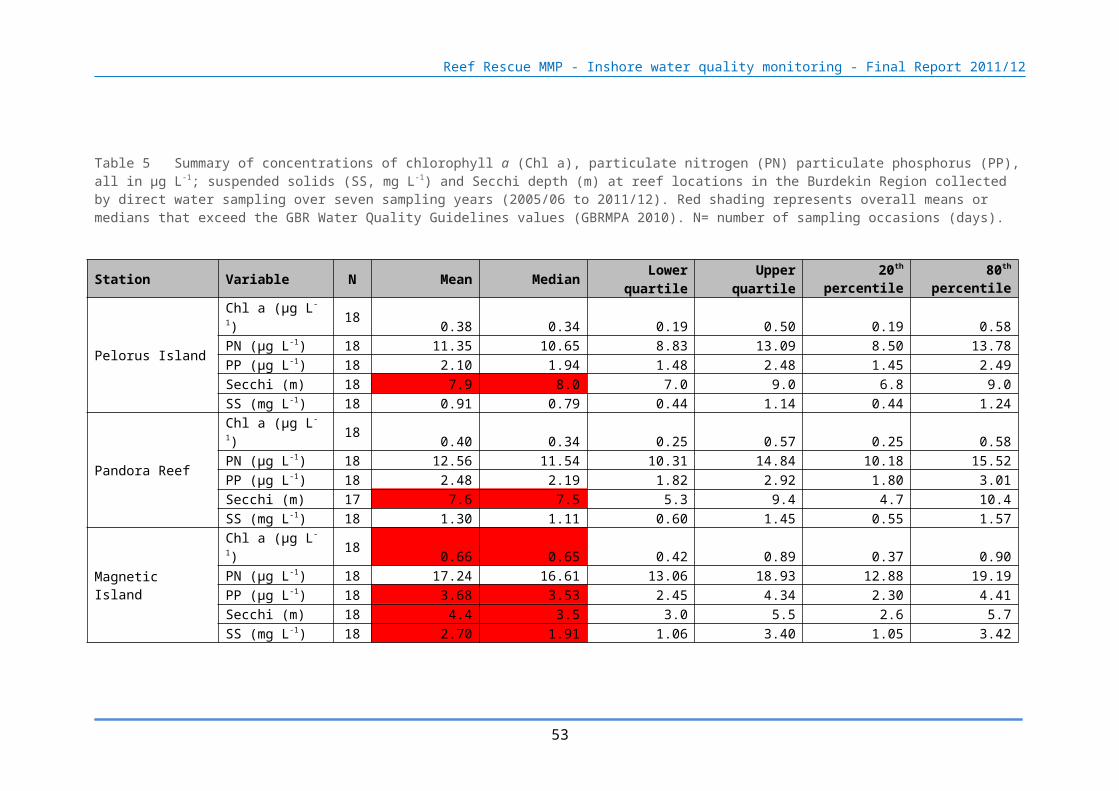
Reef Rescue MMP - Inshore water quality monitoring - Final Report 2011/12
particularly relevant for coral reef development. Globally, all three indicators are widely used in water quality monitoring programs (e.g. Bricker et al. 2003, European Community 2005, OSPAR 2005, HELCOM 2009). In assessments of eutrophication in other parts of the world additional indicators are usually included, e.g., phytoplankton productivity and species composition, oxygen concentration and abundance of benthic macrophytes (ibid.). The parallel manual sampling program of the MMP connects the instrumental measurements to the broader suite of ecosystem factors (nutrients, dissolved and suspended organic matter, suspended particulates, carbonate chemistry, etc.) that influence the health and productivity of coastal reef systems at both local and regional scales.
Table 10 Interim site-specific water quality index. The index aggregates scores given to 4-year running means of four indicators in comparison to the GBR Water Quality Guidelines (GBRMPA 2010): (i) a combined score for suspended solids concentrations in water samples, Secchi depth and turbidity measured by FLNTUSB instruments (where available*) and scores for (ii) chlorophyll, (iii) particulate nitrogen and (iv) particulate phosphorus concentrations in water samples. The colour scheme used is consistent with Paddock to Reef Reporting (see Chapter 3 for details of the assessment method): red (very poor), orange (poor), yellow (moderate), light green (good), dark green (very good). The six locations of the ‘AIMS Cairns Transect’ (open water sampling) are in italics. Grey shaded locations are in the “midshelf” water body, as designated by the GBR Water Quality Guidelines (GBRMPA 2010); all other locations are in the “open coastal” water body. See Error: Reference source not found for detailed data.
Region Site Total score 2005-08
Total score 2006-09
Total score 2007-10
Total score 2008-11
Total score 2009-12
Wet Tropics
Cape Tribulation 88 88 88 63 38Snapper Island* 83 83 83 83 33Port Douglas 88 88 88 88 88Double Island 100 88 88 88 88Green Island 100 100 100 100 100Yorkey’s Knob 25 25 25 25 25Fairlead Buoy 25 25 25 25 25Fitzroy Island* 92 92 92 92 92High Island * 67 67 67 42 42Russell Is* 100 100 100 92 92Dunk Island* 25 25 25 25 25
BurdekinPelorus Island* 92 92 67 67 67Pandora Reef* 58 92 92 92 67Magnetic Island* 0 25 33 25 25
Mackay Whitsunday
Double Cone Is.* 67 92 67 33 33
Daydream Island* 83 58 50 25 25Pine Island* 58 58 50 25 25
FitzroyBarren Island * 100 100 100 100 100Humpy Island* 67 67 42 42 42Pelican Island* 25 0 25 25 25
59

Reef Rescue MMP - Inshore water quality monitoring - Final Report 2011/12
The high-intensity sampling by the in situ loggers has greatly improved our understanding of the natural variability and range of physical and biological conditions at the 14 core reef sites. The time series produced by instrumental monitoring produce data of sufficient density to confidently apply the Guidelines (GBRMPA 2010), based on annual averages, for compliance/exceedance assessments. Continued instrumental and remotely sensed monitoring of chlorophyll and turbidity will deliver information essential for determining whether further management action may be required at individual locations or regions that continue to show high chlorophyll and turbidity levels relative to the Guidelines.
In the near future, an integrated assessment index for reporting of GBR lagoon water quality will provide a more comprehensive evaluation of the overall status of coastal and inshore waters. This two-year project commenced in late 2011 funded by the Reef Rescue R&D initiative and statistically integrates MMP water quality data from the inshore water quality monitoring, flood monitoring and remote sensing sub-programs. MMP data are also used parameterise the sediment transport and biogeochemical models currently under development by the multi-institutional project eReefs, which commenced in 2012 (http://www.bom.gov.au/environment/eReefs_Infosheet.pdf). These models will be vital to the MMP, as they will improve our understanding of the linkages between the catchment and the GBR lagoon and will allow for the creation of scenarios to estimate how and where reductions of end-of-catchment loads will affect coastal and inshore water quality.
At this stage, it is difficult to compare the results from the site-specific inshore water quality monitoring with other components of the MMP. For example, in the Wet Tropics Region the MMP herbicide monitoring program (refer to separate report, Bentley et al. 2012) has five sampling locations that are very close to the water quality sites reported here. Highest concentrations were generally found at Fitzroy Island, which has a ‘very good’ biogeochemical water quality rating in this report (see above); in contrast, Dunk Island has low herbicide concentrations while the general water quality is rated as ‘poor’. In the Burdekin Region, herbicide concentrations were generally higher at Magnetic Island than at Orpheus Island, in line with the general water quality assessment presented here. These inconsistencies highlight the complexity of water quality assessments that target pollution variables that are influenced by various processes and perhaps originate come from different sources. For example, e.g. Fitzroy Island’s high herbicide values may be from local pollution because this island is generally well-flushed by offshore water and only exposed to river runoff during extreme floods affecting the entire region.
MMP water quality compliance assessments for the first annual report card (Anon. 2011) were based only on the broad-scale monitoring using ocean colour remote sensing imagery to cover a larger area than the 20 fixed sampling locations reported here (see Brando et al. 2011 for long-term compliance data; the 2012 remote sensing report was not yet available at the time of writing). The interim water quality index presented above is useful for a more detailed assessment of specific locations, but also shows that it is difficult to compare assessments across measurement techniques used in this sub-program. A comparison between methods shows some level of disagreement. To compensate for this in a simplistic way, the interim water quality
60
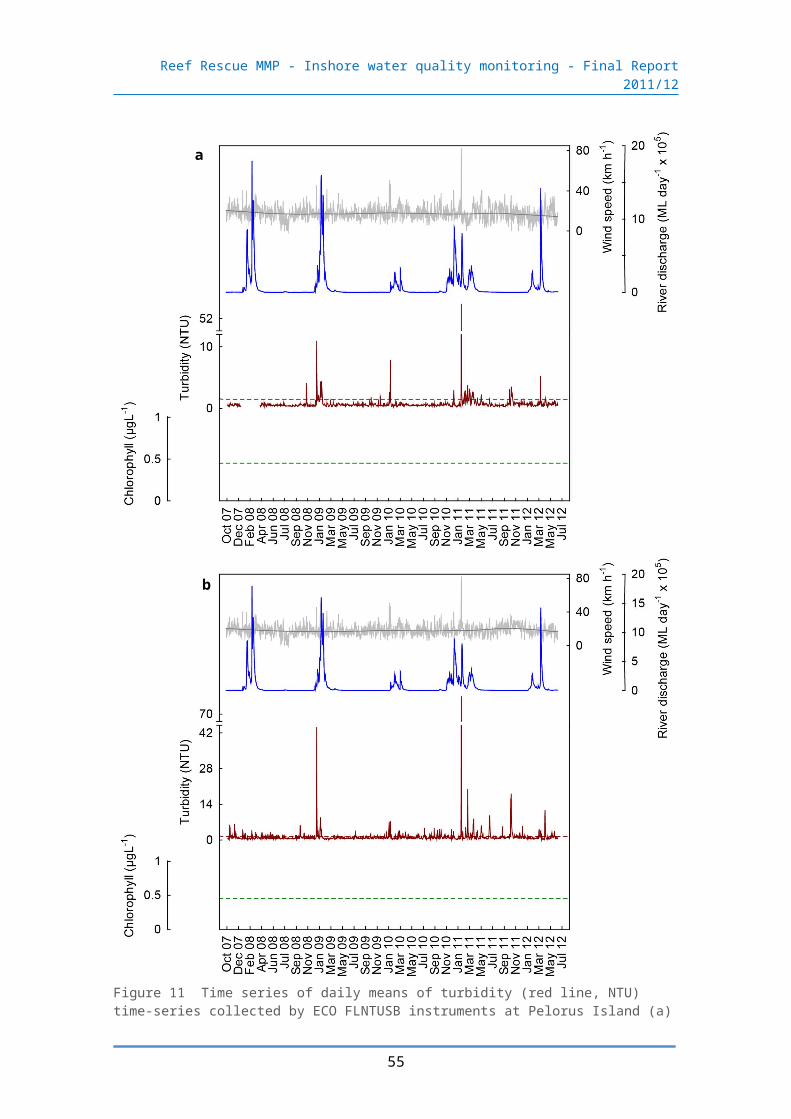
Reef Rescue MMP - Inshore water quality monitoring - Final Report 2011/12
index used an average of variables measured by different methods [(i) of the three measures of water clarity: suspended solids, turbidity and Secchi depth, and (ii) of chlorophyll a concentration and chlorophyll fluorescence (note that chlorophyll fluorescence data were not included in 2012 because of QC issues, see Appendix 3), see Error: Reference source not found for the detailed scores]. However, the final ratings of the water quality index suggest a higher rate of compliance and, hence, better water quality compared to the results of the remote sensing based assessment (Brando et al. 2011). For example, the 2011 remote sensing assessment suggest that in 2010/11 annual means of chlorophyll a were above the guideline in 93% of the area of the open coastal and 31% of the midshelf water body in the Wet Tropics Region (Brando et al. 2011). This does not agree with the site-specific assessments where most sites were within the Guidelines. At this early stage of the comparison process, the difference in outcomes is not surprising. While remote sensing data have a very broad spatial coverage there is less temporal resolution than obtained by the in situ loggers (1-2 vs 144 data points per day). Remote sensing data also measure mainly surface waters, whereas the MMP water quality instruments are deployed in 5-m depth (LAT) and the direct sampling data are collected along depth profiles. Current research is further exploring the apparent disagreements in the water quality assessments based on remote sensing and direct water sampling or instrument monitoring. The application of remote sensing data will remain useful to assess the broader water quality in the inshore GBR lagoon, however needs to be regularly validated by direct water sampling.
At this time, we consider the turbidity data from the instruments to provide the best description of water quality variability at our 14 core coral reef sites, with the added advantage of coverage through wet season flood events when satellite images are often not available due to cloud cover. The application of the site-specific water quality data to explain variability in the condition of inshore coral reef communities is an explicit aim of the MMP and emphasises the close link between this sub-program and the inshore coral monitoring sub-program (see Thompson et al. 2012). When the QC issues affecting the chlorophyll fluorescence data are solved, which is expected by the end of 2012 (see Appendix 3 for details), we look ahead to having high quality data to support the site-specific assessment in the future. Unfortunately many of the early records from 2007-2009 will not be able to be retrospectively adjusted and are likely to be lost to the MMP.
There are still very few data available from long-term and broad-scale water quality monitoring programs in other coral reef systems to compare with GBR water quality data. Water column concentrations of dissolved nutrients are much lower at GBR inshore reef sites than in Florida Bay (Boyer et al. 1999), Biscayne Bay (Florida; Caccia and Boyre 2005), the Florida Keys (Lirman and Fong 2007), La Parguera (Puerto Rico, Hertler et al. 2009) and San Andrés Island, Caribbean Colombia (Gavio et al. 2010). Chlorophyll concentrations and turbidity/suspended solids levels at our sites were similar or higher compared to Biscayne Bay (Caccia and Boyer 2005) and the Florida Keys (Lirman and Fong 2007) but lower compared to Florida Bay (Boyer et al. 1999) and Puerto Rico (Hertler et al. 2009).
We have previously investigated ratios of nutrients and carbon in GBR coastal waters (Schaffelke et al. 2008, Schaffelke et al. 2012). Low ratios of DIN to PO4
-3 indicate high
61

Reef Rescue MMP - Inshore water quality monitoring - Final Report 2011/12
levels of bio-available dissolved phosphorus relative to dissolved nitrogen, especially during the dry season. Seasonal nitrogen inputs during summer flood events are a significant water quality issue, because they support higher phytoplankton production (Furnas 2005), leading to increased chlorophyll levels. To date, it is unclear what the consequences of high PO4
-3 availability are, but it is possible that certain types of phytoplankton (e.g. N-fixing cyanobacteria, such as Trichodesmium spp.) may benefit from these conditions. Wiedenmann et al. (2012) recently showed that imbalanced nutrient availability increases the susceptibility of hard coral to thermal bleaching, rather than just high nutrient availability per se as previously speculated (Wooldridge 2009). However, in this study, DIN to PO4
-3 ratios causing the effects were about three-times above the Redfield ratio of 16:1 (Redfield 1958), leading to P-limitation in the corals. In the inshore GBR these ratios are much lower, i.e. between 1:1 in the wet season and 4:1 in the dry season, indicating nitrogen limitation of pelagic primary production (Schaffelke et al. 2012).
Ratios of carbon to nitrogen and carbon to phosphorus in the particulate fraction at the inshore monitoring sites were slightly elevated and N:P rations slightly reduced (C119:N12:P1; Schaffelke et al. 2012), compared to the Redfield ratio (C106:N16:P1) which represents an average molecular ratio of carbon, nitrogen and phosphorus in oceanic phytoplankton (Redfield 1958). GBR C:N and C:P ratios are also higher than ratios estimated from Puerto Rico (Hertler et al. 2009). However, there are so few comparative data on the stoichiometry of dissolved and particulate nutrients in tropical shelf seas waters that it is premature to conclude whether the GBR ratios are unusual. The high concentrations of particulate and dissolved organic carbon in GBR waters are most likely in the form of detritus particles and marine snow. Enhanced organic matter concentrations in marine systems can be a symptom of eutrophication (sensu Nixon 1995). Enhanced chlorophyll levels are also widely considered a symptom of eutrophication (e.g. Cloern 2001). Whether the GBR inshore lagoon is eutrophic (see Brodie et al. 2011) could only be answered by establishing robust, long-term estimates of the range of chlorophyll and organic matter concentrations along water quality gradients and by identifying the physical and biological drivers of these variables.
While persistently elevated chlorophyll values were only found at some of the core reef monitoring sites, the remote sensing results indicate that high values (relative to the Guidelines) occur widely throughout the inshore waters of the Wet Tropics and Burdekin regions. Very high levels of nutrients, chlorophyll and organic matter are measured during flood plume events and in these situations, GBR waters could be considered episodically eutrophic (Devlin and Schaffelke 2009, Devlin et al. 2012, Schaffelke et al. 2012). However, organic matter accumulation is complex, dependent on both input and transformation processes as well as hydrodynamics. We can currently only speculate how long the influence of a flood event lasts and how it is perpetuated through the food web. Results to date indicate that flood-delivered fine sediment remains in the coastal zone for long after the event, leading to recurring high turbidity events through wind-driven resuspension (Wolanski et al. 2008; Lambrechts et al. 2010; Fabricius et al. in press).
Some coastal and inshore reefs in the GBR and elsewhere show signs of degradation that are consistent with eutrophication and fine sediment accumulation (Fabricius 2005, 2011; Fabricius and De’ath 2004; Fabricius et al. 2005). Analyses of MMP data also
62

Reef Rescue MMP - Inshore water quality monitoring - Final Report 2011/12
indicated that the particulate components of water quality (suspended sediment and particulate nutrients and organic carbon) are the most important drivers of changes in inshore reef community composition (Thompson et al. 2010, Uthicke et al. 2010). The recent assessment of inshore coral reef condition under the MMP indicates that the variation of environmental conditions between years, particularly the variation of river discharges, has altered the dynamics of coral reef communities. In all regions, the incidence of coral disease has increased proportionally with the discharge of local rivers (Thompson et al. 2011). Water turbidity and the proportion of fine-grained particles in the reef sediments have also increased during the recent wet years, affecting coral growth and recruitment, most likely due to light limitation and smothering (ibid.). Whether runoff-associated pollutants such as herbicides contribute to the current stress on coral communities is unclear because most inshore reef sites are only exposed to high concentrations during major flood events (Lewis et al. 2012) while generally showing low herbicide concentrations (Bentley et al. 2012). However, little is known of the persistence of herbicides and the effect of low level chronic exposure on key inshore ecosystems such as coral reefs and seagrass meadows.
The understanding of effects of increased turbidity on a wide range of organisms is improving, with recent research showing that the behaviour and health of coral reef fishes changed in response to high concentrations of suspended solids (Wenger et al. 2011, 2012). Other authors showed that some reef communities are able to thrive and accrete in very turbid waters, e.g. Middle Reef in the Burdekin Region (Browne et al. 2010, Perry et al. 2012), but these appear to be rare examples of marginal habitats and are usually confined to very shallow depths were sufficient light is still available. MMP inshore coral reef monitoring data show significant differences in community structure with depth at the more turbid sites close to the coast, even though a number of sites have relatively high coral cover (Thompson et al. 2011). A recent review emphasises that the sensitivity of coral reefs to high turbidity and sedimentation, including the ability to recover from a sediment-related pulse disturbance, will be highly site and species-specific (Erftemeijer et al. 2012).
Effective management of coastal water quality has to consider ecosystem-wide responses, cascading effects and ecological feedbacks as well as interactions with other pressures on the coastal zone (Cloern 2001, Duarte 2009, Nixon 2009). The accelerating coastal development along the GBR coast is a current management challenge (GBRMPA 2010, DERM 2012, GBRMPA 2012b). We need to better understand the complex responses and thresholds of coastal ecosystems to anthropogenic pressures, in the GBR context, especially the interactions between the impact of diffuse land runoff and localised disturbance and pollution from coastal development. Programs like the MMP, while currently not considering point source/local pressures, are critical for this understanding as they allow us to measure the trajectories of change and to improve our ecosystem understanding of the coastal and inshore GBR.
The success (or otherwise) of the Reef Plan, the investments under Reef Rescue to improve land management and the legislated agricultural regulation under the Reef Protection Package is being assessed by the Paddock to Reef Program (Anon. 2010, Carroll et al. 2012). As part of this overarching program, the MMP focuses on measuring and assessing the condition of the receiving waters adjacent to the GBR
63

Reef Rescue MMP - Inshore water quality monitoring - Final Report 2011/12
catchments. We have to be mindful that the detection of trends following management intervention on the catchment could take years to decades as improved land management practices will take many years to become effective in reducing pollutant loads at the end of catchment (Brodie et al. 2012). Ongoing and consistent monitoring is particularly crucial in complex systems such as the inshore GBR lagoon, which is influenced by a range of factors other than land runoff, to be able to show that the marine impacts of increased loads of nutrients, sediments and pesticides will be reversed when the loads are reduced.
Acknowledgments
We thank the crew of the RV Cape Ferguson for their support during our sampling cruises and the team of the AIMS Analytical Technology laboratory for analyses of water samples for dissolved nutrients.
64

Reef Rescue MMP - Inshore water quality monitoring - Final Report 2011/12
6. References
Alongi D M, McKinnon AD (2005) The cycling and fate of terrestrially-derived sediments and nutrients in the coastal zone of the Great Barrier Reef shelf. Marine Pollution Bulletin 51:239-252.
Anon. (1997) Directory of Autoanalyser Methods, Bran and Luebbe GmbH, Norderstedt, Germany.
Anon. (2003) Reef Water Quality Protection Plan for catchments adjacent to the Great Barrier Reef World Heritage Area. The State of Queensland and Commonwealth of Australia. Queensland Department of Premier and Cabinet, Brisbane. 43 pp
Anon. (2009) Reef Water Quality Protection Plan 2009. For the Great Barrier Reef World Heritage Area and adjacent catchments. The State of Queensland and Commonwealth of Australia. Queensland Department of Premier and Cabinet, Brisbane. 30 pp. Available at www.reefplan.qld.gov.au
Anon. (2010) Paddock to Reef Integrated Monitoring, Modelling and Reporting Program Design (DRAFT). Version 12 February 2010. The State of Queensland and Commonwealth of Australia. Queensland Department of Premier and Cabinet, Brisbane. 93p
Anon. (2011) Reef Water Quality Protection Plan . First Report 2009 Baseline. The State of Queensland and Commonwealth of Australia. Queensland Department of Premier and Cabinet, Brisbane. 140 pp. Available at www.reefplan.qld.gov.au
Bainbridge ZT, Wolanski E, Álvarez-Romero JG, Lewis SE, Brodie JE (2012) Fine sediment and nutrient dynamics related to particle size and floc formation in a Burdekin River flood plume, Australia. Marine Pollution Bulletin 65: 236-248
Bellwood DR, Hughes TP, Folke C, Nyström M (2004) Confronting the coral reef crisis. Nature 429:827-833
Bentley C, Devlin M, Paxman C, Chue KL, Mueller J (2012) Pesticide monitoring in inshore waters of the Great Barrier Reef using both time-integrated and event monitoring techniques (2011 - 2012). The University of Queensland, The National Research Centre for Environmental Toxicology (Entox)
Boyer J, Fourqurean J, Jones R (1999) Seasonal and long-term trends in the water quality of Florida Bay (1989–1997). Estuaries and Coasts 22:417-430
Brando VE, Blondeau-Patissier D, Schroeder T, Dekker AG, Clementson L (2011) Reef Rescue Marine Monitoring Program: Assessment of terrestrial run-off entering the Reef and inshore marine water quality monitoring using earth observation data. Final Report for 2010/11 Activities. CSIRO, Canberra.
Bricker SB, Ferreira JG, Simas T (2003) An integrated methodology for assessment of estuarine trophic status. Ecological Modelling 169:39-60
Brinkman R, Herzfeld M, Andrewartha J, Rizwi F, Steinberg C, Spagnol S (2011) Hydrodynamics at the whole of GBR scale. AIMS Final Project Report MTSRF Project 2.5i.1, June 2011. Report to Reef and Rainforest Research Centre. Australian Institute of Marine Science, Townsville. 42 pp.
Brinkman R, Wolanski E, Deleersnijder E, McAllister F, Skirving W (2002) Oceanic inflow from the Coral Sea into the Great Barrier Reef. Estuarine, Coastal and Shelf Science 54:655-668
65

Reef Rescue MMP - Inshore water quality monitoring - Final Report 2011/12
Brodie J, Binney J, Fabricius K, Gordon I, Hoegh-Guldberg O, Hunter H, O’Reagain P, Pearson R, Quirk M, Thorburn P, Waterhouse J, Webster I, Wilkinson S (2008) Synthesis of evidence to support the Scientific Consensus Statement on Water Quality in the Great Barrier Reef. The State of Queensland (Department of the Premier and Cabinet). Published by the Reef Water Quality Protection Plan Secretariat, Brisbane. 59pp
Brodie J, De’ath G, Devlin M, Furnas MJ, Wright M (2007) Spatial and temporal patterns of near-surface chlorophyll a in the Great Barrier Reef lagoon. Marine and Freshwater Research 58: 342-353.
Brodie J, Devlin M, Haynes D, Waterhouse J (2011) Assessment of the eutrophication status of the Great Barrier Reef lagoon (Australia). Biogeochemistry 106: 281-302
Brodie JE, Kroon FJ, Schaffelke B, Wolanski EC, Lewis SE, Devlin MJ, Bohnet IC, Bainbridge ZT, Waterhouse J, Davis AM (2012a) Terrestrial pollutant runoff to the Great Barrier Reef: An update of issues, priorities and management responses. Marine Pollution Bulletin 65: 81-100
Brodie JE, McKergow LA, Prosser IP, Furnas MJ, Hughes AO, Hunter H (2003) Sources of sediment and nutrient exports to the Great Barrier Reef World Heritage Area. Australian Centre for Marine and Tropical Freshwater Research Report No. 03/11. James Cook University, Townsville
Brodie J, Schroeder T, Rohde K, Faithful J, Masters B, Dekker A, Brando V, Maughan M (2010) Dispersal of suspended sediments and nutrients in the Great Barrier Reef lagoon during river-discharge events: conclusions from satellite remote sensing and concurrent flood-plume sampling. Marine and Freshwater Research 61:651-664
Brodie J, Waterhouse J (2012) A critical review of environmental management of the ‘not so Great’ Barrier Reef. Estuarine, Coastal and Shelf Science 104–105: 1-22
Brodie J, Wolanski E, Lewis S, Bainbridge Z (2012b) An assessment of residence times of land-sourced contaminants in the Great Barrier Reef lagoon and the implications for management and reef recovery. Marine Pollution Bulletin 65: 267-279
Browne NK, Smithers SG, Perry CT (2010) Geomorphology and community structure of Middle Reef, central Great Barrier Reef, Australia: an inner-shelf turbid zone reef subject to episodic mortality events. Coral Reefs 29: 683-689
Caccia VG, Boyer JN (2005) Spatial patterning of water quality in Biscayne Bay, Florida as a function of land use and water management. Marine Pollution Bulletin 50:1416-1429
Carroll C, Waters D, Vardy S, Silburn DM, Attard S, Thorburn PJ, Davis AM,Schmidt M, Wilson B, Clark A (2012). A paddock to reef monitoring and modelling framework for the Great Barrier Reef: paddock and catchment component. Marine Pollution Bulletin 65: 136–149.
Carpenter KE, Abrar M, Aeby G, Aronson RB, Banks S, Bruckner A, Chiriboga A, Cortes J, Delbeek JC, DeVantier L, Edgar GJ, Edwards AJ, Fenner D, Guzman HM, Hoeksema BW, Hodgson G, Johan O, Licuanan WY, Livingstone SR, Lovell ER, Moore JA, Obura DO, Ochavillo D, Polidoro BA, Precht WF, Quibilan MC, Reboton C, Richards ZT, Rogers AD, Sanciangco J, Sheppard A, Sheppard C, Smith J, Stuart S, Turak E, Veron JEN, Wallace C, Weil E, Wood E (2008) One-Third of Reef-Building Corals Face Elevated Extinction Risk from Climate Change and Local Impacts. Science 321:560-563
66

Reef Rescue MMP - Inshore water quality monitoring - Final Report 2011/12
Choukroun S, Ridd PV, Brinkman R, McKinna LIW (2010) On the surface circulation in the western Coral Sea and residence times in the Great Barrier Reef. J. Geophys. Res. 115: C06013. doi:10.1029/2009JC005761.
Cloern JE (2001) Our evolving conceptual model of the coastal eutrophication problem. Marine Ecology Progress Series 210:223-253
Cooper TF, Uthicke S, Humphrey C, Fabricius KE (2007) Gradients in water column nutrients, sediment parameters, irradiance and coral reef development in the Whitsunday Region, central Great Barrier Reef. Estuarine, Coastal and Shelf Science 74:458-470.
Cooper, TF, Ridd PV, Ulstrup KE, C. Humphrey C, Slivkoff M, Fabricius KE (2008) Temporal dynamics in coral bioindicators for water quality on coastal coral reefs of the Great Barrier Reef. Marine and Freshwater Research 59:703-716.
CRC Reef Consortium (2006) Water Quality and Ecosystem Monitoring Programs–Reef Water Quality Protection Plan. Final Report August 2006 (revised November 2006). Unpublished report to the Great Barrier Reef Marine Park Authority, CRC Reef Research, Townsville. 361 p. (Appendix 138 p.)
De’ath, G. (2005). Water Quality Monitoring: from river to reef. Unpublished report to the Great Barrier Reef Marine Park Authority, CRC Reef Research, Townsville, 108 p.De'ath G (2007) The spatial, temporal and structural composition of water quality of the Great Barrier Reef and indicators of water quality. Australian Institute of Marine Science,Townsville, 59 p.
De'ath G, Fabricius KE (2008) Water Quality of the Great Barrier Reef: Distributions, Effects on Reef Biota and Trigger Values for the Protection of Ecosystem Health. Research Publication No. 89. Great Barrier Marine Park Authority, Townsville, p. 104 p
De'ath G, Fabricius KE (2010) Water quality as a regional driver of coral biodiversity and macroalgae on the Great Barrier Reef. Ecological Applications 20:840–850
Department of Environment and Resource Management (2009) Queensland Water Quality Guidelines, Version 3. 167 p. Available at www.derm.qld.gov.au. ISBN 978-0-9806986-0-2
Department of Environment and Resource Management (2012) Queensland Coastal Plan. State of Queensland (Department of Environment and Resource Management), Brisbane. 106 p.
Devlin M, Wenger A, da Silva E, Petus C, Waterhouse J, Alvarez-Romero J (2012) Reef Rescue Marine Monitoring Program: Water Quality and Flood plume Monitoring for 2011-2012 Wet Season. Great Barrier Reef. TropWater Report to the Great Barrier Reef Marine Park Authority.
Devlin M, Brodie J (2005) Terrestrial discharge into the Great Barrier Reef Lagoon: nutrient behaviour in coastal waters. Marine Pollution Bulletin 51:9-22
Devlin M, Schaffelke B (2009) Spatial extent of riverine flood plumes and exposure of marine ecosystems in the Tully coastal region, Great Barrier Reef. Marine and Freshwater Research 60:1109-1122
Devlin M, Wenger A, Waterhouse J, Romero J, Abbott B, Bainbridge Z, Lewis S (2011) Reef Rescue Marine Monitoring Program: Flood Plume Monitoring Annual Report. Incorporating results from the Extreme Weather Incident Response program, flood plume monitoring. Final Report for 2010/11 Activities. Catchment to Reef Research Group. ACTFR. James Cook University.
67

Reef Rescue MMP - Inshore water quality monitoring - Final Report 2011/12
Devlin MJ, McKinna LW, Álvarez-Romero JG, Petus C, Abott B, Harkness P, Brodie J (2012) Mapping the pollutants in surface riverine flood plume waters in the Great Barrier Reef, Australia. Marine Pollution Bulletin 65: 224-235
Duarte C (2009) Coastal eutrophication research: a new awareness. Hydrobiologia 629:263-269
Erftemeijer PLA, Riegl B, Hoeksema BW, Todd PA (2012) Environmental impacts of dredging and other sediment disturbances on corals: A review. Marine Pollution Bulletin 64: 1737-1765
European Community (2005) Water Framework Directive (WFD). Proposal for a Directive of the European Parliament and of the Council establishing a Framework for Community Action in the field of Marine Environmental Policy (Marine Strategy Directive) [SEC(2005) 1290], Brussels, 24.10.2005
Fabricius KE (2005) Effects of terrestrial runoff on the ecology of corals and coral reefs: Review and synthesis. Marine Pollution Bulletin 50:125-146.
Fabricius KE (2011) Factors determining the resilience of coral reefs to eutrophication: a review and conceptual model. In: Dubinsky Z, Stambler N (eds) Coral Reefs: An Ecosystem in Transition, Springer Press, pp 493-506
Fabricius KE, Cooper TF, Davidson J, Humphrey C, Uthicke S, LeGrand H, De’ath G, Thompson A, Schaffelke B. (2010) Bioindicators for changing water quality on inshore coral reefs of the Great Barrier Reef. Final Report for MTSRF 3.7.1.b: Marine and estuarine indicators and thresholds of concern. Report to the Marine and Tropical Sciences Research Facility. Reef and Rainforest Research Centre Limited, Cairns, 40p.
Fabricius KE, Cooper TF, Humphrey C, Uthicke S, De’ath G, Davidson J, LeGrand H, Thompson A, Schaffelke B (2012) A bioindicator system for water quality on inshore coral reefs of the Great Barrier Reef. Marine Pollution Bulletin 65: 320-332. . DOI: 10.1016/j.marpolbul.2011.09.004
Fabricius KE, De’ath G (2004) Identifying ecological change and its causes: A case study on coral reefs. Ecological Applications 14:1448-1465
Fabricius KE, De’ath G, Humphrey C, Zagorskis I, Schaffelke B (in press) Intra-annual variation in turbidity in response to terrestrial runoff on near-shore coral reefs of the Great Barrier Reef. Estuarine, Coastal and Shelf Science
Fabricius KE, Death G, McCook L, Turak E, Williams DMcB (2005) Changes in algal, coral and fish assemblages along water quality gradients on the inshore Great Barrier Reef. Marine Pollution Bulletin 51:384-396
Furnas MJ (1989) Cyclonic disturbance and a phytoplankton bloom in a tropical shelf ecosystem. In: Okaichi T, Anderson DM, Nemoto T (eds) Red Tides: Biology, Environmental Science and Toxicology. Elsevier Science Publishing Co., p 273-276
Furnas MJ (2003) Catchments and Corals: Terrestrial Runoff to the Great Barrier Reef. Australian Institute of Marine Science and Reef CRC, Townsville. 353 p
Furnas MJ (2005) Water quality in the Great Barrier Reef Lagoon: A summary of current knowledge. Chapter 3. In: Schaffelke B, Furnas M (eds) Status and Trends of Water Quality and Ecosystem Health in the Great Barrier Reef World Heritage Area. (CRC Reef, AIMS, Townsville). Unpublished Report to GBRMPA pp. 32-53
Furnas M, Alongi D, McKinnon AD, Trott L, Skuza M (2011) Regional-scale nitrogen and phosphorus budgets for the northern (14ºS) and central (17ºS) Great Barrier Reef shelf ecosystem. Continental Shelf Research 31:1967-1990
68
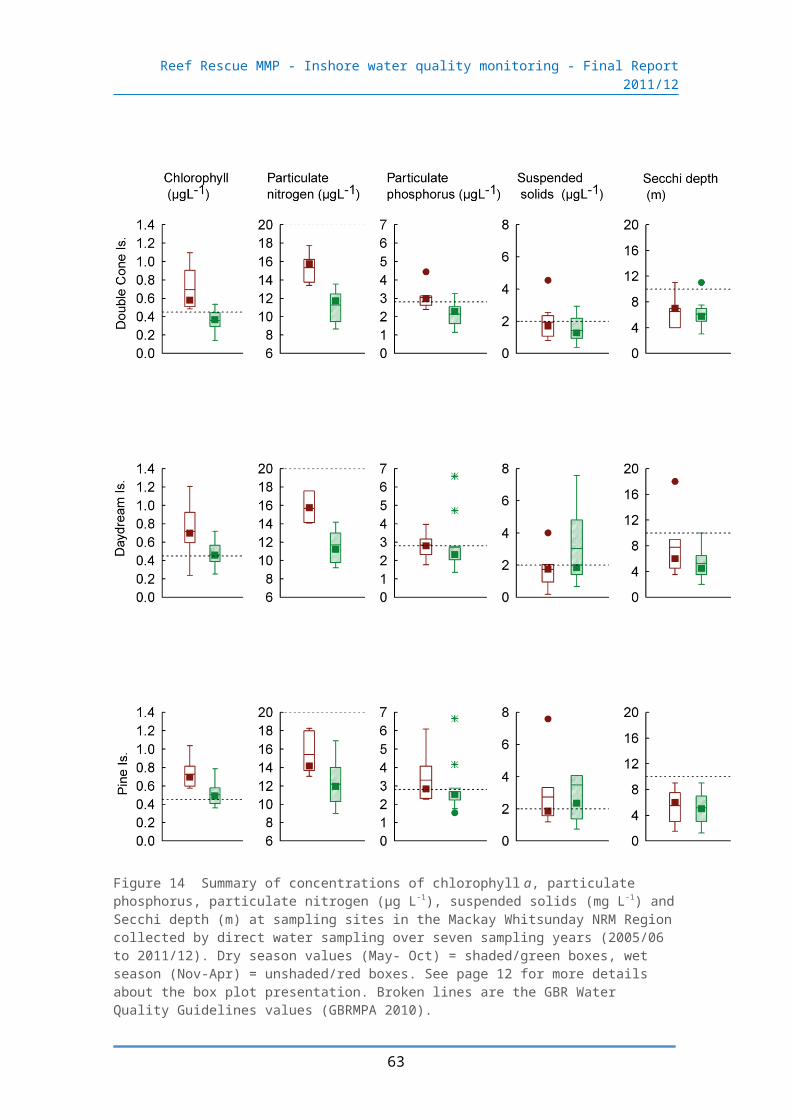
Reef Rescue MMP - Inshore water quality monitoring - Final Report 2011/12
Furnas MJ, Mitchell AW, Skuza M (1995) Nitrogen and Phosphorus Budgets for the Central Great Barrier Reef Shelf. Research Publication No. 36. Great Barrier Reef Marine Park Authority, Townsville.
Furnas MJ, Mitchell AW, Skuza M (1997) Shelf-scale nitrogen and phosphorus budgets from the central Great Barrier Reef (16-19ºS). Proceedings of the 8th International Coral Reef Symposium, Panama 1997; Vol. 1:809-814.
Furnas MJ, Mitchell AW, Skuza M, Brodie J (2005) In the other 90%: Phytoplankton responses to enhanced nutrient availability in the Great Barrier Reef lagoon. Marine Pollution Bulletin 51: 253-256.
Gavio B, Palmer-Cantillo S, Mancera JE (2010) Historical analysis (2000-2005) of the coastal water quality in San Andrés Island, SeaFlower Biosphere Reserve, Caribbean Colombia. Marine Pollution Bulletin 60:1018-1030
Great Barrier Reef Marine Park Authority (2009) Great Barrier Reef Outlook Report 2009. Great Barrier Reef Marine Park Authority, Townsville. 192 p.
Great Barrier Reef Marine Park Authority (2010) Water Quality Guidelines for the Great Barrier Reef Marine Park. Revised Edition 2010. Great Barrier Reef Marine Park Authority, Townsville. 100 p.
Great Barrier Reef Marine Park Authority (2012a) Great Barrier Reef Biodiversity Conservation Strategy 2012. Great Barrier Reef Marine Park Authority, Townsville. 33 p.
Great Barrier Reef Marine Park Authority (2012b) Great Barrier Reef Region Strategic Assessment - Terms of Reference. Great Barrier Reef Marine Park Authority, Townsville. 10 p. Available at: http://www.gbrmpa.gov.au/__data/assets/pdf_file/0010/26866/Great-Barrier-Reef-Region-Strategic-Assessment-Terms-of-Reference.pdf
Great Barrier Reef Marine Park Authority (in press) Reef Rescue Marine Monitoring Program: Quality Assurance/Quality Control Methods and Procedures. Great Barrier Reef Marine Park Authority, Townsville.
Hancock GJ, Webster IT, Stieglitz TC (2006) Horizontal mixing of Great Barrier Reef waters: Offshore diffusivity determined from radium isotope distribution. J. Geophys. Res. 111:C12019
HELCOM 2009 Eutrophication in the Baltic Sea – An integrated thematic assessment of the effects of nutrient enrichment and eutrophication in the Baltic Sea region: Executive Summary. Balt. Sea Environ. Proc. No. 115A. 19 p
Hertler H, Boettner AR, Ramírez-Toro GI, Minnigh H, Spotila J, Kreeger D (2009) Spatial variability associated with shifting land use: Water quality and sediment metals in La Parguera, Southwest Puerto Rico. Marine Pollution Bulletin 58:672-678
Holmes RM, Aminot A, Kérouel R, Hooker BA, Peterson BJ (1999) A simple and precise method for measuring ammonium in marine and freshwater ecosystems. Can. J. Fish. Aquat. Sci. 56, 1801-1808
Jeffrey, S.W., Humphrey, G.F. (1975). New spectrophotometric equations for determining chlorophylls a,b,b1 and c2 in higher plants, algae and natural phytoplankton. Biochem. Physiol. Pflanzen 167: 191-194.
Joo M, Raymond MAA, McNeil VH, Huggins R, Turner RDR, Choy S (2012) Estimates of sediment and nutrient loads in 10 major catchments draining to the Great Barrier Reef during 2006–2009. Marine Pollution Bulletin 65: 150-166
69

Reef Rescue MMP - Inshore water quality monitoring - Final Report 2011/12
Kroon FJ (2012) Towards ecologically relevant targets for river pollutant loads to the Great Barrier Reef. Marine Pollution Bulletin 65: 261-266
Kroon FJ, Kuhnert KM, Henderson BL, Wilkinson SN, Kinsey-Henderson A, Brodie JE, Turner RDR (2012) River loads of suspended solids, nitrogen, phosphorus and herbicides delivered to the Great Barrier Reef lagoon. Marine Pollution Bulletin 65: 167-181
Lambrechts J, Humphrey C, McKinna L, Gourge O, Fabricius KE, Mehta AJ, Lewis S, Wolanski E (2010) Importance of wave-induced bed liquefaction in the fine sediment budget of Cleveland Bay, Great Barrier Reef. Estuarine, Coastal and Shelf Science 89:154-162
Larcombe P, Ridd PV, Prytz A, Wilson B (1995) Factors controlling suspended sediment on inner-shelf coral reefs. Townsville, Australia. Coral Reefs 14:163-171
Lewis SE, Shields GA, Kamber BS, Lough JM (2007) A multi-trace element coral record of land-use changes in the Burdekin River catchment, NE Australia. Palaeogeography, Palaeoclimatology, Palaeoecology 246: 471-487
Lirman D, Fong P (2007) Is proximity to land-based sources of coral stressors an appropriate measure of risk to coral reefs? An example from the Florida Reef Tract. Marine Pollution Bulletin 54:779-791Lough JM (2011) Great Barrier Reef coral luminescence reveals rainfall variability over northeastern Australia since the 17th century. Paleoceanography 26: PA2201
Luick JL, Mason L, Hardy T, Furnas MJ (2007) Circulation in the Great Barrier Reef Lagoon using numerical tracers and in situ data. Continental Shelf Research 27:757-778
Marshall PA, Johnson JE (2007) The Great Barrier Reef and climate change: vulnerability and management implications. In: Johnson JE, Marshall PA (eds) Climate change and the Great Barrier Reef. Great Barrier Reef Marine Park Authority and the Australian Greenhouse Office, Australia, pp 774-801
McCulloch M, Fallon S, Wyndham T, Hendy E, Lough J, Barnes D (2003) Coral record of increased sediment flux to the inner Great Barrier Reef since European settlement. Nature 421: 727-730
Mora C (2008) A clear human footprint in the coral reefs of the Caribbean. Proceedings of the Royal Society B 275: 767-773
Nixon S (2009) Eutrophication and the macroscope. Hydrobiologia 629:5-19
Nixon SW (1995) Coastal marine eutrophication: A definition, social causes, and future concerns. Ophelia 41:199-219
Orpin AR, Ridd PV (2012) Exposure of inshore corals to suspended sediments due to wave-resuspension and river plumes in the central Great Barrier Reef: A reappraisal. Continental Shelf Research 47: 55-67
OSPAR Commission, 2005. Common Procedure for the Identification of the Eutrophication Status of the OSPAR Maritime Area. (Reference number: 2005–3). EUC 05/13/1, Annex 5 as amended and endorsed by OSPAR 2005 Summary Record – OSPAR 05/21/1, §§ 6.2–6.5 and Annex 6: 36 pp.
Parsons, T.R., Maita, Y., Lalli, C.M. (1984). A Manual of Chemical and Biological Methods for Seawater Analysis. Oxford, Pergamon Press.
Perry CT, Smithers SG, Gulliver P, Browne NK (2012) Evidence of very rapid reef accretion and reef growth under high turbidity and terrigenous sedimentation. Geology 40: 719-722
70
Reef Rescue MMP - Inshore water quality monitoring - Final Report 2011/12
R Development Core Team (2011). R: A language and environment for statistical computing. R Foundation for Statistical Computing, Vienna, Austria. ISBN 3-900051-07-0, URL http://www.R-project.org/.
Redfield AC (1958) The biological control of chemical factors in the environment. American Scientist 46:205–221
Ryle, V. D., Mueller, H. R., Gentien, P. (1981). Automated analysis of nutrients in tropical sea waters. AIMS Technical Bulletin, Oceanography Series No. 3, Australian Institute of Marine Science, Townsville. 24 p
Schaffelke B, Carleton J, Doyle J, Furnas M, Gunn K, Skuza M, Wright M, Zagorskis I (2010) Reef Rescue Marine Monitoring Program. Annual Report of AIMS Activities – Inshore water quality monitoring 2009/10. Report for Reef and Rainforest Research Centre. Australian Institute of Marine Science, Townsville. 81 p.
Schaffelke B, Carleton J, Doyle J, Furnas M, Gunn K, Skuza M, Wright M, Zagorskis I (2011) Reef Rescue Marine Monitoring Program. Final Report of AIMS Activities 2010/11– Inshore Water Quality Monitoring. Report for the Great Barrier Reef Marine Park Authority. Australian Institute of Marine Science, Townsville. 83 p.
Schaffelke B, Carleton J, Skuza M, Zagorskis I, Furnas MJ (2012) Water quality in the inshore Great Barrier Reef lagoon: Implications for long-term monitoring and management. Marine Pollution Bulletin 65: 249-260. DOI: 10.1016/j.marpolbul.2011.10.031
Schaffelke B, Thompson A, Carleton J, Cripps E, Davidson J, Doyle J, Furnas M, Gunn K, Neale S, Skuza M, Uthicke S, Wright M, Zagorskis I (2008) Water Quality and Ecosystem Monitoring Programme – Reef Water Quality Protection Plan. Final Report August 2008. Report to the Great Barrier Reef Marine Park Authority. Australian Institute of Marine Science, Townsville. 153 p
Schaffelke B, Thompson A, Carleton J, Davidson J, Doyle J, Furnas M, Gunn K, Skuza M, Wright M, Zagorskis I (2009) Reef Rescue Marine Monitoring Program. Final Report of AIMS Activities 2008/09. Report for Reef and Rainforest Research Centre. Australian Institute of Marine Science, Townsville. 146 p
Schaffelke B, Thompson A, Carleton J, De’ath G, Doyle J, Feather G, Furnas M, Neale S, Skuza M, Thomson D, Sweatman H, Wright M, Zagorskis I (2007) Water Quality and Ecosystem Monitoring Programme – Reef Water Quality Protection Plan. Final Report to GBRMPA. Australian Institute of Marine Science, Townsville. 197 p
Schaffelke B, Uthicke S, Klumpp DW (2003) Water quality, sediment an biological parameters at four nearshore reef flats in the Herbert River Region, Central Great Barrier Reef. Research Publication No. 82. Great Barrier Reef Marine Park Authority, Townsville. 64 pp.
Schroeder T, Devlin M, Brando V, Dekker AG, Brodie JE, Clementson LA, McKinna L (in revision) Inter-annual variability of wet season freshwater extent into the Great Barrier reef lagoon based on satellite coastal ocean colour observations. Marine Pollution Bulletin
Steffen W (2009) Climate change 2009: faster change and more serious risks. Australian Government, Department of Climate Change, Canberra, p 52
Thompson A, Costello P, Davidson J, Logan M, Schaffelke B, Uthicke S, Takahashi M (2011) Reef Rescue Marine Monitoring Program. Report of AIMS Activities – Inshore coral reef monitoring 2011. Report for Reef and Rainforest Research Centre. Australian Institute of Marine Science, Townsville. (128 pp.)
71

Reef Rescue MMP - Inshore water quality monitoring - Final Report 2011/12
Thompson A, Costello P, Davidson J, Schaffelke B, Uthicke S and Liddy M (2012) Reef Rescue Marine Monitoring Program. Report of AIMS Activities – Inshore coral reef monitoring 2012. Report for Great Barrier Reef Marine Park Authority. Australian Institute of Marine Science, Townsville. 121 pp. [in review at time of writing]
Thompson A, Schaffelke B, De’ath G, Cripps E, Sweatman H (2010) Water Quality and Ecosystem Monitoring Programme-Reef Water Quality Protection Plan. Synthesis and spatial analysis of inshore monitoring data 2005-08. Report to the Great Barrier Reef Marine Park Authority. Australian Institute of Marine Science, Townsville. 81 p
Uthicke S, Thompson A, Schaffelke B (2010) Effectiveness of benthic foraminiferal and coral assemblages as water quality indicators on inshore reefs of the Great Barrier Reef, Australia. Coral Reefs 29: 209-225
Valderrama, J.C. (1981). The simultaneous analysis of total nitrogen and total phosphorus in natural waters. Marine Chemistry 10: 109-122.
Walker TA, O' Donnell G (1981) Observations on Nitrate, Phosphate and Silicate in Cleveland Bay, Northern Queensland. Aust. J. Mar. Freshwat. Res. 32:877-887
Wang Y, Ridd PV, Heron ML, Stieglitz TC, Orpin AR (2007) Flushing time of solutes and pollutants in the central Great Barrier Reef lagoon, Australia. Marine and Freshwater Research 58:778-791
Webster IT, Ford PW (2010) Delivery, deposition and redistribution of fine sediments within macrotidal Fitzroy Estuary/Keppel Bay: Southern Great Barrier Reef, Australia. Continental Shelf Research 30: 793-805
Wenger A, Johansen J, Jones G (2011) Suspended sediment impairs habitat choice and chemosensory discrimination in two coral reef fishes. Coral Reefs 30: 879-887
Wenger AS, Johansen JL, Jones GP (2012) Increasing suspended sediment reduces foraging, growth and condition of a planktivorous damselfish. Journal of Experimental Marine Biology and Ecology 428: 43-48
Wiedenmann J, D'Angelo C, Smith EG, Hunt AN, Legiret F-E, Postle AD, Achterberg EP (2012) Nutrient enrichment can increase the susceptibility of reef corals to bleaching. Nature Clim. Change advance online publication
Wolanski EJ (2007) Estuarine Ecohydrology. Elsevier. 168 p.
Wolanski E, Fabricius KE, Cooper TF, Humphrey C (2008) Wet season fine sediment dynamics on the inner shelf of the Great Barrier Reef. Estuarine, Coastal and Shelf Science 77:755-762
Wolanski E, Spagnol S (2000) Pollution by Mud of Great Barrier Reef Coastal Waters. Journal of Coastal Research 16: 1151-1156
Wooldridge SA (2009) Water quality and coral bleaching thresholds: Formalising the linkage for the inshore reefs of the Great Barrier Reef, Australia. Marine Pollution Bulletin 58: 745-751
Wright S, Jeffrey S (2006) Pigment Markers for Phytoplankton Production. In: The Handbook of Environmental Chemistry, Volume 2N/2006. Springer, Berlin Heidelberg, p 71-104
72

Reef Rescue MMP - Inshore water quality monitoring - Final Report 2011/12
Appendix 1: Additional Information
Appendix 1-Table 1 Details of deployments of WETLabs ECO FLNTUSB instruments deployed at inshore reef locations for water quality monitoring.
Location Logger ID
Deployment date
AIMS
trip #
Match-upwater sample
Retrieval date
AIMS
trip #
Match-upwater
sample
Snapper 828 19/02/2012 5432 WQM615 8/06/2012 5439 WQM636
Snapper 827 3/10/2011 5421 WQM564 19/02/2012 5432 WQM615
Snapper 828 22/06/2011 5161 WQM523 3/10/2011 5421 WQM564
Snapper 837 9/02/2011 5154 WQM455 22/06/2011 5161 WQM523
Fitzroy 838 19/02/2012 5432 WQM613 9/06/2012 5439 WQM638
Fitzroy 842 3/10/2011 5421 WQM566 19/02/2012 5432 WQM613
Fitzroy 815 22/06/2011 5161 WQM525 3/10/2011 5421 WQM566
Fitzroy 826 11/02/2011 5154 WQM465 22/06/2011 5161 WQM525
High 839 18/02/2012 5432 WQM611 6/06/2012 5439 WQM627
High 825 4/10/2011 5421 WQM569 18/02/2012 5432 WQM611
High 839 23/06/2011 5161 WQM527 4/10/2011 5421 WQM569
High 840 11/02/2011 5154 WQM466 23/06/2011 5161 WQM527
Russell 824 18/02/2012 5432 WQM609 9/06/2012 5439 WQM640
Russell 846 4/10/2011 5421 WQM571 18/02/2012 5432 WQM609
Russell 824 23/06/2011 5161 WQM529 4/10/2011 5421 WQM571
Russell 825 11/02/2011 5154 WQM468 23/06/2011 5161 WQM529
Dunk 1729 17/02/2012 5432 WQM606 10/06/2012 5439 WQM643
Dunk 1329 5/10/2011 5421 WQM574 17/02/2012 5432 WQM606
Dunk 1729 24/06/2011 5161 WQM533 5/10/2011 5421 WQM574
Dunk 1329 12/02/2011 5154 WQM471 24/06/2011 5161 WQM533
Pelorus 353 16/02/2012 5432 WQM602 18/06/2012 5439 WQM665
Pelorus 823 1/10/2011 5421 WQM555 16/02/2012 5432 WQM602
Pelorus 817 20/06/2011 5161 WQM514 1/10/2011 5421 WQM555
Pelorus 823 13/02/2011 5154 WQM476 20/06/2011 5161 WQM514
Pandora 822 15/02/2012 5432 WQM600 17/06/2012 5439 WQM663
Pandora 837 30/09/2011 5421 WQM553 15/02/2012 5432 WQM600
Pandora 838 19/06/2011 5161 WQM512 30/09/2011 5421 WQM553
Pandora 822 13/02/2011 5154 WQM477 19/06/2011 5161 WQM512
Geoffrey 351 15/02/2012 5432 WQM597 11/06/2012 5439 WQM648
Geoffrey 840 30/09/2011 5421 WQM551 15/02/2012 5432 WQM597
Geoffrey 351 19/06/2011 5161 WQM510 30/09/2011 5421 WQM551
Geoffrey 352 14/02/2011 5154 WQM480 19/06/2011 5161 WQM510DoubleCone 1958 25/09/2011 5421 WQM537 10/02/2012 5432 WQM583
DoubleCone 1043 18/06/2011 5161 WQM507 25/09/2011 5421 WQM537
DoubleCone 353 19/02/2011 5154 WQM493 18/06/2011 5161 WQM507
DoubleCone 1958 19/02/2011 5154 WQM493 18/06/2011 5161 WQM507
Daydream 816 13/02/2012 5432 WQM595 15/06/2012 5439 WQM658
Daydream 352 28/09/2011 5421 WQM549 13/02/2012 5432 WQM595
73

Reef Rescue MMP - Inshore water quality monitoring - Final Report 2011/12
Location Logger ID
Deployment date
AIMS
trip #
Match-upwater sample
Retrieval date
AIMS
trip #
Match-upwater
sample
Daydream 816 18/06/2011 5161 WQM505 28/09/2011 5421 WQM548
Daydream 843 19/02/2011 5154 WQM491 18/06/2011 5161 WQM505
Pine 1044 13/02/2012 5432 WQM593 15/06/2012 5439 WQM656
Pine 818 28/09/2011 5421 WQM546 13/02/2012 5432 WQM593
Pine 1044 18/06/2011 5161 WQM503 28/09/2011 5421 WQM546
Pine 842 18/02/2011 5154 WQM489 18/06/2011 5161 WQM503
Barren 1043 12/02/2012 5432 WQM590 13/06/2012 5439 WQM650
Barren 826 26/09/2011 5421 WQM539 12/02/2012 5432 WQM826
Barren 1091 16/06/2011 5161 WQM496 26/09/2011 5421 WQM539
Barren 1729 16/02/2011 5154 WQM483 16/06/2011 5161 WQM496
Humpy 844 12/02/2012 5432 WQM588 14/06/2012 5439 WQM654
Humpy 819 26/09/2011 5421 WQM542 12/02/2012 5432 WQM588
Humpy 844 16/06/2011 5161 WQM498 26/09/2011 5421 WQM542
Humpy 816 16/02/2011 5154 WQM486 16/06/2011 5161 WQM498
Pelican 817 11/02/2012 5432 WQM586 13/06/2012 5439 WQM652
Pelican 843 27/09/2011 5421 WQM544 11/02/2012 5432 WQM586
Pelican 827 16/06/2011 5161 WQM501 27/09/2011 5421 WQM544
Pelican 817 17/02/2011 5154 WQM487 16/06/2011 5161 WQM501
Appendix 1-Table 2 Log of instrument issues and failures of WET Labs ECO FLNTUSB instruments deployed at inshore reef locations for water quality monitoring. 14 % of all deployments in this reporting period had issues that led to data losses or will require further QC (8 out of 56 deployments, see shaded cells).
Logger serial no. Location
Event (or deployment) date
Retrieve date Event description:
1729 Barren 16-Feb-11 16-Jun-11 Logging 'OFF' for deployment. Operator error.
817 Pelican 17-Feb-11 16-Jun-11Some negative Chl values. Chl records flagged as erroneous and being checked against validation samples. Contacted WetLabs for solution.
351 Geoffrey 19-Jun-11 30-Sep-11Some negative Chl values. Chl records flagged as erroneous and being checked against validation samples. Sent to WET Labs for service
817 Pelorus 20-Jun-11 01-Oct-11Some negative Chl values. Chl records flagged as erroneous and being checked against validation samples. Sent to WET Labs for service
819 Humpy 26-Sep-11 12-Feb-12Some negative Chl values despite new Wetlabs calibration. Chl records flagged as erroneous and being checked against validation samples.
843 Pelican 27-Sep-11 11-Feb-12Some negative Chl values. Chl records flagged as erroneous and being checked against validation samples. Sent to WET Labs for service
825 High 04-Oct-11 18-Feb-12Some negative Chl values. Chl records flagged as erroneous and being checked against validation samples. Sent to WET Labs for service
846 Russell 04-Oct-11 18-Feb-12Biowiper open when retrieved, open/close sensor not functioning correctly upon recovery. Data ok. Sent to WET Labs for service.
74

Reef Rescue MMP - Inshore water quality monitoring - Final Report 2011/12
Logger serial no. Location
Event (or deployment) date
Retrieve date Event description:
1329 Dunk 05-Oct-11 17-Feb-12
Logger not running when recovered, unable to connect to upload data. WETLabs retrieved data after replacing corroded processor board but record ended prematurely on 26 Dec 2011.
75
Reef Rescue MMP - Inshore water quality monitoring - Final Report 2011/12
Appendix 1-Table 3 Annual freshwater discharge (ML) for the major GBR Catchment rivers influencing the sampling sites of the MMP Inshore Water Quality Monitoring Program. Shaded cells highlight years for which river flow exceeded the median annual flow as estimated from available long-term time series for each river (LT median; from earliest available records to September 2000): yellow= 1.5 to 2-times LT median, orange= 2 to 3-times LT median, red= >3-times LT median. Records for the 2012 water year are incomplete (to August 2012). Discharge data were supplied by the Queensland Department of Natural Resources and Mines (gauging station codes given after river names). Missing values represent years for which >15% of daily flow estimates were not available.
Region River Long-term median 2002 2003 2004 2005 2006 2007 2008 2009 2010 2011 2012
Wet Tropics
Daintree 108002A 727,872 132,216 1,429,195 489,927 1,252,97
1 715,190 873,694 1,215,914 1,654,757 865,139
Barron 110001D 604,729 165,896 113,639 950,207 383,440 745,781 413,328 1,606,907 772,722 500,756 1,924,506 713,928
Mulgrave 111007A 751,149 183,890 333,262 1,132,755 937,024 738,709 930,657 670,019 680,091 1,422,790 1,011,734
Russell 111101D 1,193,577 433,936 615,927 1,345,241 990,735 1,280,58
9 1,281,621 1,088,458 1,130,682 1,221,231 1,806,202 1,166,997
North Johnstone 112004A 1,746,102 657,456 819,663 2,304,375 1,447,19
32,155,31
3 2,071,610 1,858,252 1,925,821 1,825,452 3,551,393 1,054,108
South Johnstone 112101B 820,304 345,067 311,763 542,835 1,014,72
7 886,683 794,698 1,019,195 709,887 1,673,604 931,355
Tully 113006A 3,074,666 1,208,80
21,442,04
4 3,283,940 2,200,706
3,624,289 3,949,123 3,195,153 3,596,264 3,087,403 6,094,549 3,535,675
Herbert 116001F 3,067,947 929,944 688,778 3,303,805 1,186,80
83,990,49
8 3,985,721 3,337,660 9,468,229 3,167,698 11,419,015 4,315,677
Burdekin Burdekin 120006B 5,982,681 4,485,31
52,092,83
4 1,516,191 4,328,245
2,199,744 9,768,935 27,502,70
4 29,951,685 7,947,563 34,602,113 15,386,199
Mackay Whitsunday
Proserpine 122005A 17,140 19,969 18,583 10,350 23,782 20,393 44,740 76,447 65,556 52,341 349,085 51,193
O’Connell 124001B 145,351 85,202 23,236 75,989 84,267 168,513 229,994 165,637 313,605 574,154 281,409
Pioneer 125007A 355,228 218,366 111,589 44,939 196,084 72,633 716,235 1,300,252 822,925 1,180,449 3,044,648 1,339,252
Fitzroy Fitzroy 130005A 2,754,600 581,373 921,670 680,627 1,057,441 12,046,87
3 2,028,795 11,666,996 38,058,960 7,886,091
Burnett Mary
Burnett 136007A n/a 106,888 523,464 221,477 136,959 69,506 29,880 17,155 23,138 1,034,804 7,081,587 562,482
76
Reef Rescue MMP - Inshore water quality monitoring - Final Report 2011/12
Appendix 1-Table 4 Concentrations of dissolved inorganic nitrogen species (µg L-1) at three sampling occasions in 2011/12. Data are depth-weighted means.
Region Location Date NH4 NO2 NO3 Date NH4 NO2 NO3 Date NH4 NO2 NO3
Wet/Tropics
Cape Tribulation 21/06/2011 0.28 0.14 0.20 02/10/2011 0.47 0.14 1.08 20/02/2012 0.38 0.17 0.94Snapper Island 22/06/2011 0.47 0.14 1.73 03/10/2011 0.92 0.36 5.94 19/02/2012 0.28 0.29 0.71Port Douglas 21/06/2011 0.28 0.14 0.25 02/10/2011 0.07 0.22 1.06 20/02/2012 0.54 0.15 0.74Double Island 21/06/2011 0.28 0.14 0.16 02/10/2011 0.00 0.21 0.92 20/02/2012 0.28 0.15 0.96Green Island 21/06/2011 0.28 0.18 0.21 02/10/2011 0.09 0.29 1.35 20/02/2012 0.77 0.14 1.00Yorkey's Knob 21/06/2011 0.28 0.14 0.79 02/10/2011 0.18 0.30 1.12 20/02/2012 1.40 0.09 1.15Fairlead Buoy 21/06/2011 0.45 0.14 0.16 02/10/2011 1.12 0.32 1.05 20/02/2012 0.38 0.07 1.06Fitzroy Island 22/06/2011 0.89 0.14 1.68 03/10/2011 0.93 0.21 1.95 19/02/2012 0.61 0.35 2.30High Island 23/06/2011 0.28 0.20 1.00 04/10/2011 0.51 0.28 2.08 18/02/2012 0.42 0.30 0.94Russell Island 23/06/2011 0.34 0.14 0.26 04/10/2011 0.39 0.25 1.84 18/02/2012 0.48 0.19 0.71Dunk Island 24/06/2011 0.53 0.14 0.40 05/10/2011 0.24 0.31 1.21 17/02/2012 0.67 0.30 0.66
BurdekinPelorus Island 20/06/2011 0.28 0.24 0.29 01/10/2011 0.39 0.28 1.44 16/02/2012 0.49 0.10 1.02Pandora Reef 19/06/2011 0.62 0.14 0.81 30/09/2011 0.65 0.24 1.68 15/02/2012 0.28 0.09 1.25Geoffrey Bay 19/06/2011 0.29 0.14 1.04 30/09/2011 3.40 0.28 5.53 15/02/2012 1.39 0.10 1.06
Mackay/WhitsundayDouble Cone Island 18/06/2011 0.28 0.14 0.53 25/09/2011 0.04 0.31 0.50 10/02/2012 0.66 0.10 0.92Daydream Island 18/06/2011 0.28 0.94 1.21 28/09/2011 0.73 0.29 0.88 13/02/2012 0.96 0.07 0.84Pine Island 18/06/2011 0.28 1.54 2.20 28/09/2011 0.50 0.36 0.84 13/02/2012 0.52 0.10 0.79
FitzroyBarren Island 16/06/2011 0.28 0.14 1.43 26/09/2011 0.81 0.28 1.08 12/02/2012 0.28 0.07 0.42Humpy Island 16/06/2011 0.21 0.69 27/09/2011 0.03 0.28 0.47 12/02/2012 1.21 0.30 4.58Pelican Island 16/06/2011 0.28 0.14 0.53 26/09/2011 0.72 0.33 0.73 11/02/2012 0.28 0.17 0.99
Note: Italicised means include values below the limit of detection (LOD, s. Appendix 2-Table1), reported as half the LOD (see Methods chapter).
77
Reef Rescue MMP - Inshore water quality monitoring - Final Report 2011/12
Appendix 1-Table 5 Concentrations of total dissolved nitrogen and particulate nitrogen (µg L-1) at three sampling occasions in 2011/12. Data are depth-weighted means
Region Location Date TDN PN Date TDN PN Date TDN PN
Wet/Tropics
Cape Tribulation 21/06/2011 108.8 11.3 2/10/2011 78.8 7.2 20/02/2012 51.5 13.2Snapper Island 22/06/2011 108.2 11.3 3/10/2011 82.7 9.5 19/02/2012 123.0 12.1Port Douglas 21/06/2011 125.2 11.5 2/10/2011 73.1 9.3 20/02/2012 96.5 10.9Double Island 21/06/2011 108.3 11.0 2/10/2011 76.6 9.8 20/02/2012 100.7 11.6Green Island 21/06/2011 53.7 8.9 2/10/2011 60.2 6.4 20/02/2012 97.6 10.5Yorkey's Knob 21/06/2011 113.3 18.1 2/10/2011 65.4 20.7 20/02/2012 95.7 14.7Fairlead Buoy 21/06/2011 99.8 15.6 2/10/2011 72.1 21.9 20/02/2012 95.8 14.2Fitzroy Island 22/06/2011 100.4 12.6 3/10/2011 69.6 10.6 19/02/2012 87.1 12.3High Island 23/06/2011 109.4 10.0 4/10/2011 76.1 11.6 18/02/2012 107.2 12.1Russell Island 23/06/2011 80.6 2.4 4/10/2011 68.8 10.3 18/02/2012 91.8 9.7Dunk Island 24/06/2011 88.2 13.0 5/10/2011 72.7 10.3 17/02/2012 101.4 14.6
BurdekinPelorus Island 20/06/2011 104.6 7.7 1/10/2011 62.4 6.2 16/02/2012 83.8 13.1Pandora Reef 19/06/2011 104.7 10.3 30/09/2011 74.8 16.5 15/02/2012 92.9 9.3Geoffrey Bay 19/06/2011 105.4 11.2 30/09/2011 86.7 18.9 15/02/2012 80.9 11.5
Mackay/WhitsundayDouble Cone Island 18/06/2011 118.6 8.8 25/09/2011 69.9 10.5 10/02/2012 87.0 16.2Daydream Island 18/06/2011 50.0 11.1 28/09/2011 94.7 14.2 13/02/2012 81.5 14.1Pine Island 18/06/2011 100.8 14.0 28/09/2011 82.5 13.0 13/02/2012 81.6 13.7
FitzroyBarren Island 16/06/2011 110.3 8.4 26/09/2011 61.8 9.0 12/02/2012 29.6 15.6Humpy Island 16/06/2011 98.2 7.6 27/09/2011 79.7 11.1 12/02/2012 107.9 14.5Pelican Island 16/06/2011 114.1 8.6 26/09/2011 61.4 8.6 11/02/2012 5.7 18.6
78
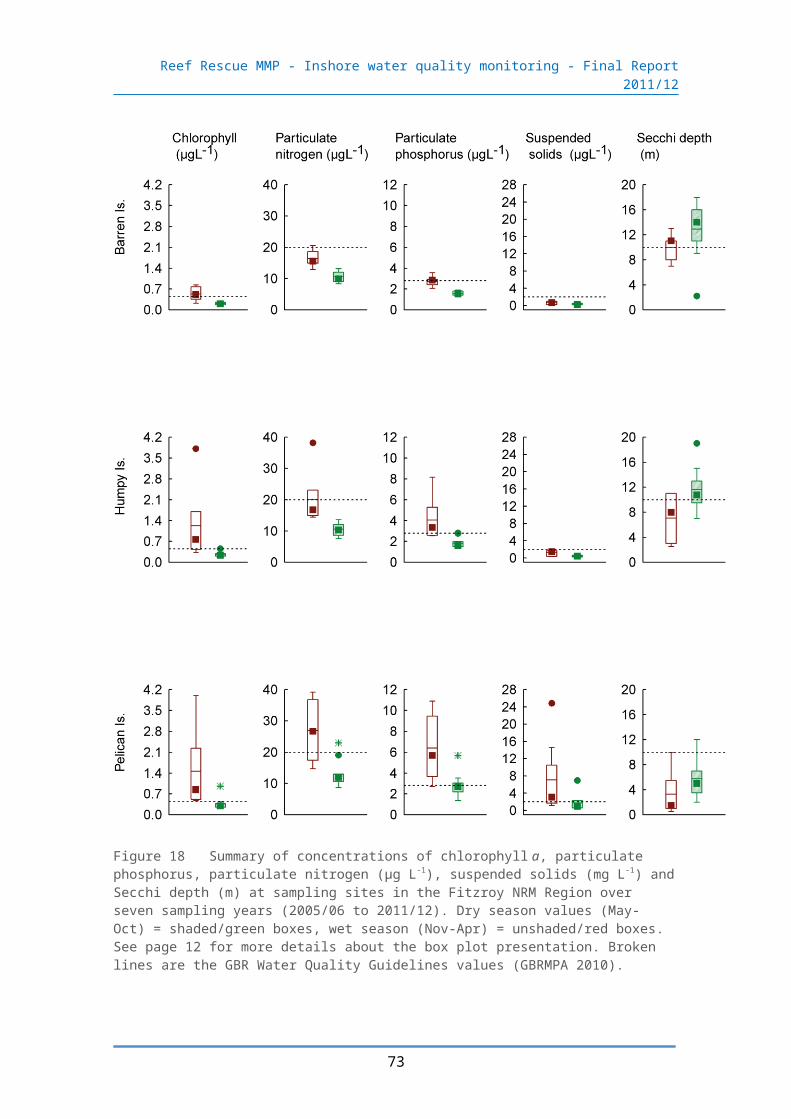
Reef Rescue MMP - Inshore water quality monitoring - Final Report 2011/12
Appendix 1-Table 6 Concentrations of dissolved inorganic phosphorus (PO4), total dissolved phosphorus (TDP) and particulate phosphorus (PP), all in µg L-1, at three sampling occasions in 2011/12. Data are depth-weighted means.
Region Location Date PO4 TDP PP Date PO4 TDP PP Date PO4 TDP PP
Wet/Tropics
Cape Tribulation 21/06/2011 3.6 7.9 2.7 2/10/2011 3.1 5.4 2.0 20/02/2012 1.4 3.3 2.5Snapper Island 22/06/2011 3.9 8.4 1.8 3/10/2011 3.2 6.6 2.2 19/02/2012 1.4 3.3 2.9Port Douglas 21/06/2011 3.7 8.0 2.2 2/10/2011 3.0 6.9 2.8 20/02/2012 1.2 3.0 2.5Double Island 21/06/2011 4.1 7.9 2.4 2/10/2011 2.5 6.0 2.2 20/02/2012 1.2 3.5 2.8Green Island 21/06/2011 4.2 10.2 1.8 2/10/2011 3.4 7.0 1.3 20/02/2012 1.6 3.9 2.3Yorkey's Knob 21/06/2011 4.0 7.6 4.4 2/10/2011 3.0 5.7 4.3 20/02/2012 1.0 3.3 3.3Fairlead Buoy 21/06/2011 3.9 7.1 3.7 2/10/2011 2.6 5.6 4.8 20/02/2012 1.3 3.2 3.6Fitzroy Island 22/06/2011 3.2 6.9 2.5 3/10/2011 3.4 5.5 1.6 19/02/2012 1.3 3.1 2.4High Island 23/06/2011 3.1 7.6 1.9 4/10/2011 2.7 6.1 2.2 18/02/2012 1.0 2.8 2.8Russell Island 23/06/2011 3.1 7.1 1.4 4/10/2011 2.8 5.9 1.9 18/02/2012 0.9 4.5 2.3Dunk Island 24/06/2011 3.4 7.3 3.3 5/10/2011 2.6 5.8 2.1 17/02/2012 1.2 4.8 3.5
BurdekinPelorus Island 20/06/2011 3.9 9.2 1.9 1/10/2011 3.1 8.4 1.5 16/02/2012 2.1 5.5 2.5Pandora Reef 19/06/2011 4.2 8.7 1.7 30/09/2011 3.2 4.9 3.6 15/02/2012 1.0 4.4 2.2Geoffrey Bay 19/06/2011 4.5 10.0 2.5 30/09/2011 3.8 6.3 4.3 15/02/2012 1.8 5.1 1.9
Mackay/WhitsundayDouble Cone Island 18/06/2011 5.1 10.3 3.2 25/09/2011 5.1 8.9 1.9 10/02/2012 1.9 5.3 3.1Daydream Island 18/06/2011 5.1 10.4 6.6 28/09/2011 4.5 8.2 4.7 13/02/2012 1.5 5.5 2.8Pine Island 18/06/2011 5.6 9.4 6.7 28/09/2011 5.0 9.0 4.2 13/02/2012 1.8 5.2 3.1
FitzroyBarren Island 16/06/2011 2.7 8.0 1.6 26/09/2011 3.3 5.9 1.4 12/02/2012 0.4 8.9 2.9Humpy Island 16/06/2011 2.7 6.6 2.0 27/09/2011 4.6 9.2 2.7 12/02/2012 2.3 7.2 2.6Pelican Island 16/06/2011 5.7 11.2 2.7 26/09/2011 2.8 5.8 1.5 11/02/2012 0.3 11.9 4.3
79

Reef Rescue MMP - Inshore water quality monitoring - Final Report 2011/12
Appendix 1-Table 7 Concentrations of dissolved organic carbon (DOC), particulate organic carbon (POC), and silicate, all in µg L-1, at three sampling occasions in 2011/12. Data are depth-weighted means.
Region Location Date DOC POC Si Date DOC POC Si Date DOC POC Si
Wet/Tropics
Cape Tribulation 21/06/2011 909 99 255 2/10/2011 995 77 85 20/02/2012 899 65 146Snapper Island 22/06/2011 892 81 271 3/10/2011 990 79 99 19/02/2012 921 104 173Port Douglas 21/06/2011 987 89 231 2/10/2011 921 86 94 20/02/2012 838 87 104Double Island 21/06/2011 995 96 189 2/10/2011 911 74 98 20/02/2012 770 115 100Green Island 21/06/2011 901 55 110 2/10/2011 822 58 91 20/02/2012 806 89 89Yorkey's Knob 21/06/2011 973 144 358 2/10/2011 930 158 115 20/02/2012 779 122 115Fairlead Buoy 21/06/2011 932 121 173 2/10/2011 968 170 129 20/02/2012 784 166 118Fitzroy Island 22/06/2011 915 107 106 3/10/2011 862 61 95 19/02/2012 806 88 113High Island 23/06/2011 869 81 202 4/10/2011 839 80 122 18/02/2012 1112 127 209Russell Island 23/06/2011 854 71 118 4/10/2011 867 68 89 18/02/2012 832 86 146Dunk Island 24/06/2011 894 88 131 5/10/2011 897 72 73 17/02/2012 1009 111 282
BurdekinPelorus Island 20/06/2011 883 57 107 1/10/2011 826 54 73 16/02/2012 864 101 117Pandora Reef 19/06/2011 905 79 202 30/09/2011 1004 156 102 15/02/2012 983 96 135Geoffrey Bay 19/06/2011 975 95 237 30/09/2011 970 160 168 15/02/2012 815 81 314
Mackay/WhitsundayDouble Cone Island 18/06/2011 871 129 137 25/09/2011 1021 104 149 10/02/2012 1012 144 118Daydream Island 18/06/2011 816 162 100 28/09/2011 927 153 123 13/02/2012 849 131 74Pine Island 18/06/2011 879 181 131 28/09/2011 981 153 152 13/02/2012 818 121 59
FitzroyBarren Island 16/06/2011 919 104 59 26/09/2011 993 74 42 12/02/2012 1155 146 150Humpy Island 16/06/2011 961 94 114 27/09/2011 1130 93 132 12/02/2012 1180 115 205Pelican Island 16/06/2011 1087 137 209 26/09/2011 1001 85 89 11/02/2012 1196 222 379
80

Reef Rescue MMP - Inshore water quality monitoring - Final Report 2011/12
Appendix 1-Table 8 Concentrations of chlorophyll a (µg L-1) at three sampling occasions in 2011/12. Data are depth-weighted means.
Region Location Date Chlorophyll a Date Chlorophyll a Date Chlorophyll a
Wet/Tropics
Cape Tribulation 21/06/2011 0.25 02/10/2011 0.23 20/02/2012 0.42Snapper Island 22/06/2011 0.21 03/10/2011 0.28 19/02/2012 0.44Port Douglas 21/06/2011 0.26 02/10/2011 0.37 20/02/2012 0.40Double Island 21/06/2011 0.37 02/10/2011 0.31 20/02/2012 0.47Green Island 21/06/2011 0.30 02/10/2011 0.14 20/02/2012 0.52Yorkey's Knob 21/06/2011 0.48 02/10/2011 0.73 20/02/2012 0.61Fairlead Buoy 21/06/2011 0.41 02/10/2011 0.64 20/02/2012 0.49Fitzroy Island 22/06/2011 0.41 03/10/2011 0.26 19/02/2012 0.38High Island 23/06/2011 0.34 04/10/2011 0.29 18/02/2012 0.51Russell Island 23/06/2011 0.17 04/10/2011 0.32 18/02/2012 0.32Dunk Island 24/06/2011 0.39 05/10/2011 0.57 17/02/2012 0.75
BurdekinPelorus Island 20/06/2011 0.28 01/10/2011 0.18 16/02/2012 0.45Pandora Reef 19/06/2011 0.14 30/09/2011 0.59 15/02/2012 0.15Geoffrey Bay 19/06/2011 0.31 30/09/2011 0.72 15/02/2012 0.22
Mackay/WhitsundayDouble Cone Island 18/06/2011 0.53 25/09/2011 0.17 10/02/2012 0.57Daydream Island 18/06/2011 0.72 28/09/2011 0.57 13/02/2012 0.61Pine Island 18/06/2011 0.79 28/09/2011 0.58 13/02/2012 0.75
FitzroyBarren Island 16/06/2011 0.18 26/09/2011 0.14 12/02/2012 0.59Humpy Island 16/06/2011 0.24 27/09/2011 0.26 12/02/2012 0.33Pelican Island 16/06/2011 0.30 26/09/2011 0.15 11/02/2012 0.76
81

Reef Rescue MMP - Inshore water quality monitoring - Final Report 2011/12
Appendix 1-Table 9 Secchi depth (m), concentrations of total suspended solids (SS, mg L-1) and salinity (dimensionless) at three sampling occasions in 2011/12. Data (except for Secchi depth) are depth-weighted means.
Region Location DateSecch
iSS
Salinity
DateSecch
iSS
Salinity
DateSecch
iSS
Salinity
Wet/Tropics
Cape Tribulation 21/06/2011 6.5 0.7 33.68 2/10/2011 8.0 1.2 35.22 20/02/2012 6.5 0.6 33.99Snapper Island 22/06/2011 6.0 0.5 33.45 3/10/2011 4.0 1.5 35.21 19/02/2012 4.0 1.3 34.16Port Douglas 21/06/2011 5.0 0.9 33.82 2/10/2011 5.5 2.9 35.22 20/02/2012 7.5 0.9 34.04Double Island 21/06/2011 4.0 1.0 33.94 2/10/2011 7.5 1.4 35.11 20/02/2012 10.0 0.6 34.03Green Island 21/06/2011 8.0 0.4 34.45 2/10/2011 16.0 0.6 35.20 20/02/2012 9.5 0.4 34.10Yorkey's Knob 21/06/2011 2.0 2.0 33.42 2/10/2011 3.0 2.8 35.17 20/02/2012 6.5 1.5 34.02Fairlead Buoy 21/06/2011 3.5 2.3 33.96 2/10/2011 3.0 3.6 35.13 20/02/2012 4.5 1.8Fitzroy Island 22/06/2011 7.0 2.0 34.48 3/10/2011 7.5 1.0 35.20 19/02/2012 8.5 0.6 33.99High Island 23/06/2011 6.0 0.6 33.68 4/10/2011 6.5 0.9 35.21 18/02/2012 7.5 0.9 33.17Russell Island 23/06/2011 9.0 0.1 34.33 4/10/2011 7.5 0.7 17.59 18/02/2012 12.0 0.6 16.91Dunk Island 24/06/2011 3.0 2.0 33.78 5/10/2011 5.5 1.2 35.27 17/02/2012 4.2 1.4 32.72
BurdekinPelorus Island 20/06/2011 6.5 0.7 34.41 1/10/2011 9.0 0.8 35.27 16/02/2012 8.0 0.7 34.34Pandora Reef 19/06/2011 9.0 0.5 33.82 30/09/2011 4.0 1.4 35.21 15/02/2012 13.5 0.1 33.91Geoffrey Bay 19/06/2011 5.5 1.1 33.72 30/09/2011 2.0 3.4 35.27 15/02/2012 8.5 0.3 33.04
Mackay/WhitsundayDouble Cone Island 18/06/2011 3.0 2.9 34.23 25/09/2011 7.5 1.1 34.90 10/02/2012 5.5 1.2 35.02Daydream Island 18/06/2011 2.0 7.6 34.27 28/09/2011 2.0 6.5 35.05 13/02/2012 6.0 1.3 35.07Pine Island 18/06/2011 1.3 10.8 34.17 28/09/2011 2.0 8.5 34.89 13/02/2012 6.0 1.6 17.52
FitzroyBarren Island 16/06/2011 15.0 0.2 35.38 26/09/2011 15.0 0.2 35.70 12/02/2012 11.0 0.2 35.45Humpy Island 16/06/2011 12.0 0.4 35.21 27/09/2011 4.0 2.1 35.82 12/02/2012 11.0 0.4 34.44Pelican Island 16/06/2011 4.0 0.8 34.32 26/09/2011 15.0 0.4 35.76 11/02/2012 5.5 1.1 33.59
82

Reef Rescue MMP - Inshore water quality monitoring - Final Report 2011/12
83
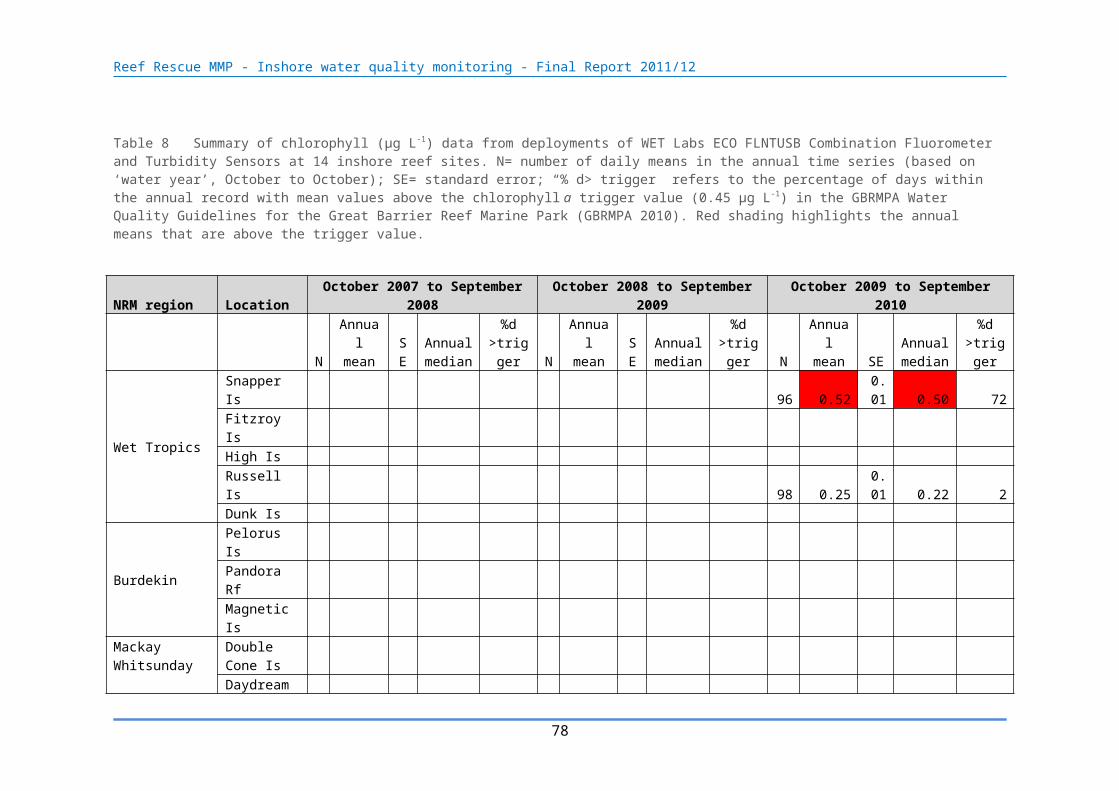
Reef Rescue MMP - Inshore water quality monitoring - Final Report 2011/12
Appendix 1-Table 100 Interim water quality index: Summary of four-year running means and calculation of the index (see Section 2.2 for details). Data range = from start of the program (2005 for direct water sampling data or 2007 for water quality instruments) to September of each respective year (June for 2012). Red shaded cells are running means that did not comply with the GBRMPA Water Quality Guidelines for the Great Barrier Reef Marine Park (GBRMPA 2010). Values that did not comply with the Guidelines received a score of “1”; those that did comply were scored as “0”. The scores for suspended solids, turbidity and Secchi depth were averaged for a “combined turbidity score”. The sum of these combined scores and the scores for PN, PP and chlorophyll yielded a total score per site. This total score was converted into a percentage rating and colour-coded (see Section 2.2. for details). Empty cells indicate data not available.
Depth-weighted means Indicator ScoresSite Data
rangePN(µg L-
1)
PP(µg L-
1)
Chl a(µg L-
1)
SS(mg L-1)
Secchi(m)
Turbidity(NTU)
PN(µg L-
1)
PP(µg L-
1)
Chl a(µg L-
1)
SS(mg L-1)
Secchi(m)
Turbidity(NTU)
Combined turbidity score
Total score
Total score (%)
Cape Tribulation 2005-08 0.08 0.89 0.34 1.64 7.5 0 0 0 0 1 0.50 0.50 88
2006-09 0.08 0.88 0.35 1.54 6.0 0 0 0 0 1 0.50 0.50 88
2007-10 0.09 0.95 0.41 1.64 6.5 0 0 0 0 1 0.50 0.50 88
2008-11 0.09 0.96 0.46 1.31 6.2 0 0 1 0 1 0.50 1.50 63
2009-12 0.09 0.93 0.48 1.24 7.2 1 0 1 0 1 0.50 2.50 38Snapper Island 2005-08 0.08 0.86 0.31 1.26 6.4 2.20 0 0 0 0 1 1 0.67 0.67 83
2006-09 0.08 0.89 0.32 1.20 6.4 2.04 0 0 0 0 1 1 0.67 0.67 83
2007-10 0.08 0.91 0.36 1.16 6.8 2.43 0 0 0 0 1 1 0.67 0.67 83
2008-11 0.09 1.00 0.44 1.24 5.9 2.44 0 0 0 0 1 1 0.67 0.67 83
2009-12 0.09 0.99 0.46 1.46 5.3 2.50 1 0 1 0 1 1 0.67 2.67 33Port Douglas 2005-08 0.07 0.97 0.30 1.46 7.7 0 0 0 0 1 0.50 0.50 88
2006-09 0.07 0.89 0.28 1.23 7.0 0 0 0 0 1 0.50 0.50 88
2007-10 0.08 0.94 0.36 1.20 6.9 0 0 0 0 1 0.50 0.50 88
2008-11 0.08 0.94 0.38 1.22 6.1 0 0 0 0 1 0.50 0.50 88
2009-12 0.08 0.89 0.43 1.32 6.4 0 0 0 0 1 0.50 0.50 88Double Island 2005-08 0.06 0.86 0.32 1.17 10.0 0 0 0 0 0 0.00 0.00 100
2006-09 0.07 0.80 0.31 1.14 8.2 0 0 0 0 1 0.50 0.50 88
2007-10 0.07 0.83 0.36 1.22 8.7 0 0 0 0 1 0.50 0.50 88
2008-11 0.08 0.82 0.41 1.23 6.9 0 0 0 0 1 0.50 0.50 88
2009-12 0.09 0.84 0.45 1.42 6.8 0 0 0 0 1 0.50 0.50 88Green Island 2005-08 0.05 0.66 0.23 0.66 15.4 0 0 0 0 0 0.00 0.00 100
2006-09 0.05 0.64 0.23 0.36 13.3 0 0 0 0 0 0.00 0.00 100
84

Reef Rescue MMP - Inshore water quality monitoring - Final Report 2011/12
2007-10 0.05 0.67 0.24 0.32 13.4 0 0 0 0 0 0.00 0.00 100
2008-11 0.05 0.70 0.29 0.26 12.2 0 0 0 0 0 0.00 0.00 100
2009-12 0.06 0.72 0.32 0.32 11.6 0 0 0 0 0 0.00 0.00 100Yorkey's Knob 2005-08 0.12 1.26 0.52 2.66 4.0 1 0 1 1 1 1.00 3.00 25
2006-09 0.12 1.12 0.49 2.53 3.9 1 0 1 1 1 1.00 3.00 25
2007-10 0.13 1.18 0.60 3.45 3.6 1 0 1 1 1 1.00 3.00 25
2008-11 0.13 1.10 0.62 3.53 3.5 1 0 1 1 1 1.00 3.00 25
2009-12 0.13 1.18 0.69 3.14 3.7 1 0 1 1 1 1.00 3.00 25Fairlead Buoy 2005-08 0.12 1.14 0.45 2.94 4.3 1 0 1 1 1 1.00 3.00 25
2006-09 0.13 1.07 0.46 2.88 3.9 1 0 1 1 1 1.00 3.00 25
2007-10 0.15 1.17 0.54 4.67 3.7 1 0 1 1 1 1.00 3.00 25
2008-11 0.15 1.18 0.59 5.02 3.3 1 0 1 1 1 1.00 3.00 25
2009-12 0.16 1.29 0.62 5.09 3.2 1 0 1 1 1 1.00 3.00 25Fitzroy Island 2005-08 0.06 0.80 0.37 1.08 9.9 0.85 0 0 0 0 1 0 0.33 0.33 92
2006-09 0.07 0.78 0.34 0.88 9.4 0.87 0 0 0 0 1 0 0.33 0.33 92
2007-10 0.06 0.76 0.31 0.83 9.4 0.87 0 0 0 0 1 0 0.33 0.33 92
2008-11 0.07 0.84 0.39 1.08 8.6 0.97 0 0 0 0 1 0 0.33 0.33 92
2009-12 0.07 0.86 0.41 1.06 8.1 1.26 0 0 0 0 1 0 0.33 0.33 92High Island 2005-08 0.08 0.93 0.48 1.48 9.1 0.81 0 0 1 0 1 0 0.33 1.33 67
2006-09 0.09 0.91 0.50 1.26 6.8 0.83 0 0 1 0 1 0 0.33 1.33 67
2007-10 0.09 0.90 0.50 1.27 7.0 0.95 0 0 1 0 1 0 0.33 1.33 67
2008-11 0.10 0.92 0.56 1.29 4.7 1.10 1 0 1 0 1 0 0.33 2.33 42
2009-12 0.09 0.95 0.58 1.17 5.7 1.21 1 0 1 0 1 0 0.33 2.33 42Russell Island 2005-08 0.06 0.80 0.33 0.89 10.8 0.49 0 0 0 0 0 0 0.00 0.00 100
2006-09 0.06 0.73 0.32 0.63 10.4 0.56 0 0 0 0 0 0 0.00 0.00 100
2007-10 0.06 0.76 0.32 0.57 10.7 0.61 0 0 0 0 0 0 0.00 0.00 100
2008-11 0.07 0.76 0.38 0.58 9.2 0.74 0 0 0 0 1 0 0.33 0.33 92
2009-12 0.07 0.83 0.41 0.63 9.0 0.86 0 0 0 0 1 0 0.33 0.33 92Dunk Island 2005-08 0.13 1.25 0.66 3.13 5.3 2.02 1 0 1 1 1 1 1.00 3.00 25
2006-09 0.12 1.13 0.55 2.80 5.0 2.17 1 0 1 1 1 1 1.00 3.00 25
85

Reef Rescue MMP - Inshore water quality monitoring - Final Report 2011/12
2007-10 0.10 1.07 0.54 2.77 5.3 2.33 1 0 1 1 1 1 1.00 3.00 25
2008-11 0.12 1.12 0.66 3.14 4.3 2.56 1 0 1 1 1 1 1.00 3.00 25
2009-12 0.12 1.06 0.75 2.72 5.0 2.89 1 0 1 1 1 1 1.00 3.00 25Pelorus Island 2005-08 0.06 0.83 0.37 1.36 7.9 0.50 0 0 0 0 1 0 0.33 0.33 92
2006-09 0.06 0.81 0.41 0.77 8.4 0.62 0 0 0 0 1 0 0.33 0.33 92
2007-10 0.07 0.84 0.47 0.75 8.6 0.62 0 0 1 0 1 0 0.33 1.33 67
2008-11 0.08 0.91 0.54 0.83 7.8 0.71 0 0 1 0 1 0 0.33 1.33 67
2009-12 0.08 0.85 0.45 0.84 8.1 0.78 0 0 1 0 1 0 0.33 1.33 67Pandora Reef 2005-08 0.08 0.97 0.49 2.11 6.0 0.96 0 0 1 1 1 0 0.67 1.67 58
2006-09 0.08 0.91 0.38 1.36 7.6 1.07 0 0 0 0 1 0 0.33 0.33 92
2007-10 0.07 0.98 0.36 0.96 8.1 1.08 0 0 0 0 1 0 0.33 0.33 92
2008-11 0.09 1.01 0.39 1.13 8.5 1.24 0 0 0 0 1 0 0.33 0.33 92
2009-12 0.10 1.06 0.43 1.19 8.3 1.36 1 0 0 0 1 0 0.33 1.33 67Magnetic Island 2005-08 0.14 1.44 0.80 4.12 4.3 2.12 1 1 1 1 1 1 1.00 4.00 0
2006-09 0.12 1.24 0.57 3.12 5.1 2.23 1 0 1 1 1 1 1.00 3.00 25
2007-10 0.11 1.18 0.57 1.76 5.1 2.08 1 0 1 0 1 1 0.67 2.67 33
2008-11 0.12 1.21 0.66 2.10 4.3 2.26 1 0 1 1 1 1 1.00 3.00 25
2009-12 0.13 1.18 0.64 2.34 4.2 2.37 1 0 1 1 1 1 1.00 3.00 25Double Cone Island 2005-08 0.07 0.92 0.49 1.17 7.9 1.15 0 0 1 0 1 0 0.33 1.33 67
2006-09 0.07 0.94 0.45 1.07 7.5 1.28 0 0 0 0 1 0 0.33 0.33 92
2007-10 0.08 0.94 0.51 1.34 6.5 1.44 0 0 1 0 1 0 0.33 1.33 67
2008-11 0.09 0.93 0.57 2.13 5.1 1.45 1 0 1 1 1 0 0.67 2.67 33
2009-12 0.09 0.88 0.54 2.03 5.8 1.49 1 0 1 1 1 0 0.67 2.67 33Daydream Island 2005-08 0.07 0.97 0.43 1.44 8.7 2.01 0 0 0 0 1 1 0.67 0.67 83
2006-09 0.07 0.95 0.52 1.74 7.6 2.00 0 0 1 0 1 1 0.67 1.67 58
2007-10 0.08 0.91 0.64 2.09 5.6 2.14 0 0 1 1 1 1 1.00 2.00 50
2008-11 0.11 0.92 0.69 3.14 4.8 2.24 1 0 1 1 1 1 1.00 3.00 25
2009-12 0.12 0.93 0.67 3.39 4.3 2.22 1 0 1 1 1 1 1.00 3.00 25Pine Island 2005-08 0.09 1.09 0.53 1.87 6.0 2.87 0 0 1 0 1 1 0.67 1.67 58
2006-09 0.08 1.01 0.59 1.93 6.2 2.97 0 0 1 0 1 1 0.67 1.67 58
86

Reef Rescue MMP - Inshore water quality monitoring - Final Report 2011/12
2007-10 0.08 0.99 0.62 2.12 6.1 3.05 0 0 1 1 1 1 1.00 2.00 50
2008-11 0.11 0.95 0.64 3.88 4.7 3.21 1 0 1 1 1 1 1.00 3.00 25
2009-12 0.12 0.95 0.66 4.56 4.2 3.12 1 0 1 1 1 1 1.00 3.00 25Barren Island 2005-08 0.07 1.03 0.32 0.58 11.2 0.37 0 0 0 0 0 0 0.00 0.00 100
2006-09 0.07 0.98 0.35 0.35 11.8 0.42 0 0 0 0 0 0 0.00 0.00 100
2007-10 0.07 0.95 0.41 0.39 12.4 0.43 0 0 0 0 0 0 0.00 0.00 100
2008-11 0.07 0.91 0.40 0.40 12.2 0.42 0 0 0 0 0 0 0.00 0.00 100
2009-12 0.08 0.94 0.43 0.41 12.4 0.39 0 0 0 0 0 0 0.00 0.00 100Humpy Island 2005-08 0.08 1.05 0.60 0.93 9.3 0.87 0 0 1 0 1 0 0.33 1.33 67
2006-09 0.08 1.07 0.57 0.63 8.4 0.88 0 0 1 0 1 0 0.33 1.33 67
2007-10 0.10 1.20 0.89 0.67 8.5 1.01 1 0 1 0 1 0 0.33 2.33 42
2008-11 0.10 1.13 0.81 0.73 9.3 1.07 1 0 1 0 1 0 0.33 2.33 42
2009-12 0.11 1.15 0.82 0.79 9.7 1.06 1 0 1 0 1 0 0.33 2.33 42Pelican Island 2005-08 0.16 1.41 0.89 4.40 5.4 5.08 1 0 1 1 1 1 1.00 3.00 25
2006-09 0.17 1.45 0.92 4.58 3.7 4.25 1 1 1 1 1 1 1.00 4.00 0
2007-10 0.15 1.41 1.09 2.44 4.7 4.67 1 0 1 1 1 1 1.00 3.00 25
2008-11 0.14 1.35 0.86 4.30 4.3 5.19 1 0 1 1 1 1 1.00 3.00 25
2009-12 0.14 1.41 0.97 5.03 4.6 5.39 1 0 1 1 1 1 1.00 3.00 25
.
87

Reef Rescue MMP - Inshore water quality monitoring - Final Report 2011/12
Appendix 2: Method performance and QAQC information
Information pertaining to quality control and assurance generally includes the assessment of the limit of detection (LOD), measurements of accuracy (e.g. using reference materials to assess recovery of known amount of analyte) and precision (the repeated analyses of the same concentration of analyte to check for reproducibility). Detailed QAQC data are contained as metadata in the data delivery DVD.
Limits of detection
Limit of Detection (LOD) or detection limit, is the lowest concentration level that can be determined to be statistically different from a blank (99% confidence). LOD of water quality parameters sampled under the Reef Rescue MMP inshore marine water quality monitoring are summarised below:
Appendix 2-Table 1 Limit of detection (LOD) for analyses of marine water quality parameters.
Parameter (analyte) LODNO2 0.14 - 0.28 µg L-1*
NO3+ NO2 0.14 - 0.42 µg L-1*NH4 0.56 µg L-1
TDN 0.42 – 0.84 µg L-1*PN 1.0 µg filter-1
PO4 0.62 – 1.24 µg L-1*TDP 1.24 – 1.55 µg L-1*PP 0.09 µg L-1
Si 2.5 – 4.2 µg L-1*DOC 0.1 mg L-1
POC 1.0 µg filter-1
Chlorophyll a 0.004 µg L-1
SS 0.15 mg filter-1
Salinity 0.03 PSU*LOD for analysis of dissolved nutrients is estimated for each individual analytical batch, the range given is the range of LODs from batches analysed with samples collected in 2011/12.
Precision
The variation between results for replicate analyses of standards or reference material is used as a measure for the precision of an analysis. Reproducibility of samples was generally within a CV of 20%, with the majority of analyses delivering precision of results within 10% (Appendix 2-Table 2)
88

Reef Rescue MMP - Inshore water quality monitoring - Final Report 2011/12
Appendix 2-Table 2 Summary of coefficients of variation (CV, in %) of replicate measurements (N) of a standard or reference material.
Parameter (analyte) CV (%) NNO2 2-7* 4
NO3+ NO2 5-32* 4NH4 1-8* 4TDN 3-11* 4-5PN 12-20 13-28
PO4 1-17* 4TDP 4-20* 4-5PP 7 7Si 1-34* 3-4
DOC 3-4* 42-49POC 8-10** 33-37
Chlorophyll a 1.8 20SS n/a***
Salinity <0.1 3-6
*Precision for analysis of dissolved nutrients is estimated for each individual analytical batch, the range given is the range of CVs from batches analysed with samples collected in 2011/12.** two different reference materials used in each batch***n/a= no suitable standard material available for analysis of this parameter
Accuracy
Analytical accuracy is measured as the recovery (in %) of a known concentration of a certified reference material or analyte standard (where no suitable reference material is available, e.g. for PP), which is usually analysed interspersed between samples in each analytical run. The recovery of known amounts of reference material is expected to be within 90-110% (i.e. the percent difference should be ≤ 20%) of their expected (certified) value for results to be considered accurate. The accuracy of analytical results for PN, PP, POC, chlorophyll, SS and salinity was within this limit (Appendix 2-Table 3). Analytical results for PP are adjusted using a batch-specific recovery factor that is determined with each sample batch.
Appendix 2-Table 3 Summary of average recovery of known analyte concentrations.
Parameter (analyte) Average recovery (%) NPN 102-113 13-28PP 95* 7
POC 101 70Chlorophyll a 102 20
SS n/a**Salinity 100 5
*PP: data are adjusted using a batch-specific efficiency factor (recovery)**n/a= no suitable reference material available for analysis of this parameter
89

Reef Rescue MMP - Inshore water quality monitoring - Final Report 2011/12
The accuracy of analytical results for dissolved nutrients is being assessed using z-scores of the results returned from analysis of NLLNCT certified reference material (National Low-Level Nutrient Collaborative Trials, run every year by the Queensland Health Forensic and Scientific Services, QHFSS- AIMS is a formal participant of these trials). According to the NLLNCT instructions, accuracy is deemed good if results are within 1 z-score and satisfactory if results are within 2 z-scores. In each analytical batch, two bottles with different concentrations were analysed. In 2011/12 we used bottles #5 and #7 from Round 14 of the NLLNCT for the first batch analysed and from Round 16 of the NLLNCT for the second and thirds batches. For the #5 bottle (lower concentrations) the majority of nutrient analyses z-scores were within 1 z-score (Appendix 2-Table 4) and, hence, accuracy was deemed good. One batch each out of three Si and TDN batches returned a result within the acceptable range of 2 z. The z-scores for the #7 bottle (higher concentrations) were within 1z for all variables except TDN and Si (Appendix 2-Table 4) and therefore deemed good. One TDN batch and all three Si batches for bottle #7 returned z-scores between -1 and -2, deemed acceptable. To assure that the monitoring results were accurate, additional QAQC samples were included in all batches (e.g. in-house reference seawater that allows for batch to batch comparison, added nutrient spikes) which usually return acceptable results.
Appendix 2-Table 4 Summary of average Z-scores of replicate measurements (N) of a standard or reference material. Accuracy of analysis of dissolved nutrients is estimated for each individual analytical batch, the range given is the range of average Z-scores from batches analysed with samples collected in 2011/12
Parameter (analyte)
Z-score forbottle #5
*
Z-score forbottle #7 *
N
NOx -0.39 to -0.30
-0.67 to 1.83 3
NH4 -0.59 to -0.37
-0.67 to -0.21 3
TDN -0.23 to 1.88 -1.30 to 1.30 3PO4 -0.62 to 0.21 -0.22 to 0.44 3TDP -0.27 to 0.64 -0.09 to 0.59 3Si -1.66 to 1.84 -1.15 to 1.50 3
* NLLNCT reference samples round 16, bottles #5 and #7 analysed with samples collected in 2011/12.
90

Reef Rescue MMP - Inshore water quality monitoring - Final Report 2011/12
Procedural blanks
Wet filter blanks (filter placed on filtration unit and wetted with filtered seawater, then further handled like samples) were prepared during the on-board sample preparation to measure contamination during the preparation procedure for PN, PP, POC and chlorophyll. The instrument readings (or actual readings, in case of chlorophyll) from these filters were compared to instrument readings from actual water samples. On average, the wet filter blank values were below 5% of the measured values for PN and below 2% of the measured values for chlorophyll a (Chl) (Appendix 2-Table 5) and we conclude that contamination due to handling was minimal. Wet filter blanks (as well as filter blanks using pre-combusted filters) for PP and POC generally returned measureable readings, which indicates that the filter material contains traces of phosphorus and organic carbon. The blank values are relatively constant and were subtracted from sample results to adjust for the inherent filter component.
Wet filter blanks for SS analysis (filter placed on filtration unit and wetted with filtered seawater, rinsed with distilled water, then further handled like samples) were prepared during the on-board sample preparation. The mean weight difference of these filter blanks (final weight - initial filter weight) was 0.00010 g (n=32). This value indicated the average amount of remnant salt in the filters (“salt blank”). The salt blank was about 6% of the average sample filter weight (Appendix 2-Table 5). This value was included in the calculation of the amount of suspended solids per litre of water by subtraction from the sample filter weight differences.
Appendix 2-Table 5 Comparison of instrument readings of wet filter blanks to actual sample readings
PP(absorbance readings)
PN(instrument readings)
Chl(µg L-1)
SS(mg filter-1)
POC(µg filter-1)
Average of blank readings 0.010 2090 0.006 0.1 6.76N of blank readings 20 27 18 32 34Average of sample readings 0.088 42488 0.312 1.73 28.3N of sample readings 455 452 486 482 478Average of blanks as % of average sample readings
11.7% 4.9% 1.8% 6.0% 24%
91
Reef Rescue MMP - Inshore water quality monitoring - Final Report 2011/12
Validation by alternative methods
Chlorophyll a To validate the results of the chlorophyll a analysis by fluorometry (which is the routinely applied standard method for samples collected under Reef Rescue MMP), a number of samples (collected separately from surface waters after the main Niskin cast) were analysed at AIMS by HPLC (a more elaborate technique yielding high resolution detection of various phytoplankton pigments) during the previous years of MMP monitoring. In 2011/12 this validation was not carried out for cost reasons. The previous results always showed a good agreement between the two standard methods, consistent for several years. However the fluorometry method showed values on average 10% lower than those obtained by the HPLC technique (Appendix 2- Figure 1). This small difference is most likely due to differences in extraction methods and hence, extraction efficiency. When the same extract was used for analysis by both instruments the agreement was very good (y=0.99x, R2=0.995, N=6). The differences in extraction efficiency between these two methods do not affect the reliability and usefulness of the results obtained by fluorometry, which applies the internationally accepted US EPA standard method and has been used at AIMS for about 20 years.
0.0 0.5 1.0 1.5 2.0 2.5 3.00.0
0.2
0.4
0.6
0.8
1.0
1.2
1.4
1.6f(x) = 0.900304580729094 xR² = 0.911795793375937
Chlorophyll a by HPLC (µg L-1)
Chl
orop
hyll
a by
fluo
rom
etry
(µg
L-1)
Appendix 2- Figure 1 Match-up of duplicate samples analysed for chlorophyll a by fluorometry and HPLC.
92

Reef Rescue MMP - Inshore water quality monitoring - Final Report 2011/12
Validation of ECO FLNTUSB instrument dataDirect water samples were collected and analysed (see Methods chapter for details) for comparison to instrument data acquired at the time of manual sampling.
Turbidity was validated against suspended solids concentrations in the water column. The relationship between optically measured turbidity and total suspended solids analysed on filters was good, and the linear equation [SS (mgL-1)] = 1.3 x FLNTUSB Turbidity (NTU)] has been used for conversion between these two variables. The equation has been the same in last three year’s estimates (Schaffelke et al. 2009, 2010, 2011).
Using this equation, the SS trigger value in the Guidelines of 2.0 mg L-1 (GBRMPA 2010) translates into a turbidity trigger value of 1.5 NTU.
In this report, no correlation between chlorophyll fluorescence and directly measured chlorophyll a in water samples is provided as the adjustment of the instrument-derived chlorophyll fluorescence data is still underway (see Appendix 3 for more detail).
0 2 4 6 8 10 120
2
4
6
8
10
12
14
16
18
20
f(x) = 1.30595800139425 xR² = 0.914864788368936
Turbidity - FLNTUSB (NTU)
Susp
ende
d so
lids
(mg
L-1)
Appendix 2- Figure 2 Match-up of instrument readings of turbidity (NTU) from field deployments of WET Labs Eco FLNTUSB Combination Fluorometer and Turbidity Sensors with values from standard laboratory analysis of concurrently collected water samples.
93

Reef Rescue MMP - Inshore water quality monitoring - Final Report 2011/12
Appendix 3: Retrospective calibration of WET Labs ECO FLNTUSB loggers
Objectives of the instrumental water quality monitoring under the Reef Rescue MMP
The objective of the Reef Rescue MMP in-situ environmental logger sub-project is to produce high-frequency time series of two key water quality parameters (turbidity, chlorophyll fluorescence) at fourteen (14) representative inshore reefs to:
Quantify the cumulative exposure of inshore reef communities to adverse water quality conditions caused by recurrent, short-term disturbance events (wind or current-driven sediment resuspension, flood plumes, cyclonic storms)
Provide a strong statistical basis for identifying long-term trends in water quality at these sites in relation to changing land-management practices undertaken as part of the Reef Rescue program to reduce runoff of terrestrial sediment and nutrients.
WET Labs Environmental Characterization Optics (ECO) FLNTUSB (Fluorescence, NTU) loggers were selected in 2005 for the chlorophyll and turbidity monitoring program. The loggers measure chlorophyll fluorescence and turbidity at 10-minute intervals over continuous deployments of approximately four months duration (see methods section for more details). The chlorophyll and turbidity sensors of the WET Labs loggers are identical to those in research-grade CTD profilers used by AIMS in GBR waters. In situ water temperatures are measured with Sensus Ultra Temperature loggers deployed at each site (see Thompson et al. 2011 for further details and results).
History of testing of the instruments at AIMS and identification of calibration problems
To achieve the above objectives, it is essential that the loggers accurately and stably measure the parameters of interest. Initial testing with three loggers demonstrated that appropriately configured FLNTU loggers have the requisite sensitivity and stability for GBR conditions. Biofouling has been successfully managed to acceptable limits over the 3-6 month durations of individual deployments by wrapping the loggers in black plastic and copper tape.
However, as the instrumental monitoring program was fully implemented at all sites from October 2007, it became apparent that there were noticeable differences between fluorescence responses of individual, nominally ‘calibrated’ loggers at the same site. Responses of the turbidity channel were usually within an acceptable logger-to-logger difference range. Differences in chlorophyll responses were established in two ways:
94

Reef Rescue MMP - Inshore water quality monitoring - Final Report 2011/12
By in-house validation of chlorophyll fluorescence using dilution series of plankton culture (described in detail in Schaffelke et al. 2007 and in the regularly updated MMP QAQC report, GBRMPA in press) and
By comparisons with water samples collected by divers close to the instrument in situ and analysed for chlorophyll a concentrations using our standards MMP protocol (see Methods section). The latter validation method was implemented as a routine component of the sampling in February 2008. These differences were reported in Thompson et al. (2010) and also communicated to WET Labs.
Potential causes for these differences include:
The full logger fleet (30 instruments) was purchased in several batches from 2007 as the monitoring program was progressively rolled out. Within this period, a number of loggers have been replaced due to failures or damage during deployments. Also during this period, the manufacturer made a number of design changes to the logger optics and associated electronics to reduce power consumption, improve nominal performance and optical durability of the instrument. In particular, significant changes were made to the optical windows (sapphire glass → cast optical acrylic) and the light source for the fluorometer (from two high-intensity blue LEDs → a single blue LED → a single non-coloured LED). Individual models in the evolution of the loggers had differing calibration relationships.
During the course of the logging program, a number of loggers were returned to the manufacturer for servicing and repairs. The repairs sometimes involved changes to the optics or electronics which altered the calibrations for those instruments. Cleaning and polishing of the optical heads during servicing also changed the optical performance slightly.
However, these causes cannot fully explain why the factory calibrations did not control for the between-instrument differences. Hence, the performance of the chlorophyll fluorescence monitoring has been less than satisfactory throughout most of the Reef Rescue MMP.
To validate logger performance and derive empirically relationships between direct instrument outputs (digital counts) and laboratory measurements of chlorophyll a in water samples (i.e. an in-house calibration), AIMS has used three types of logger deployments with parallel water sample collection for laboratory chlorophyll a analysis:
Routine field collection of natural water samples in close proximity to loggers at the times of instrument deployment and recovery (see above, from 2008),
Co-deployment of batches of loggers in coastal seawater at the AIMS Jetty with frequent direct water sample collection (from 2010)
Co-deployment of batches of loggers in large-volume phytoplankton cultures with frequent direct water sample collection. These tests were carried out in a large (380L) seawater tank to which aliquots of cultured algae (Nannochloropsis sp.) were progressively added to achieve a broader range of chlorophyll concentrations compared to levels encountered in the field (from 2012).
95

Reef Rescue MMP - Inshore water quality monitoring - Final Report 2011/12
While useful for validating instrument performance, natural samples or cultures provide an imperfect means of calibrating the loggers as the water sampling devices and logger optics sample considerably different volumes of water. At these differing scales, small-scale patchiness (spatial variability) of natural phytoplankton becomes a significant source of data variability. Also, variation in instrument response to different phytoplankton taxa has been observed which makes the use of monocultures to derive chlorophyll fluorescence calibrations problematic. The above described deployments with parallel direct water sampling are continued for validation purposes, however, at this stage not used for the derivation of an in-house calibration.
Solutions for retrospective calibration
During the course of the monitoring program, the manufacturer became aware of problems with the original (dry) laboratory fluorescence calibration procedure used at the factory and by users. Chlorophyll fluorescence was calibrated by operating the logger with the light source targeting a flat plate of fluorescent plastic, however this procedure proved to be overly sensitive to target-sensor geometry and alignment, and calibrations could not be reliably reproduced. In mid-2011, the dry plate calibration was replaced with a wet calibration procedure involving immersion of the sensor head in a ‘standard fluorescence’ 100 ppb uranine (also commonly known as sodium fluorescein) solution. Empirical testing was also carried out by the manufacturer using cultures of the diatom Thalassiosira weissflogii.
From June 2011, all loggers in the fleet were progressively returned to the WET Labs factory after recovery from the field for optical servicing and re-calibration against the ‘new’ standard factory uranine solution. From December 2011, WET Labs agreed to recalibrate the remainder of the AIMS logger fleet to the new uranine standard (no labour charges). Most of the instruments were calibrated against the uranine standard before servicing or repairs were undertaken (“pre-cal”).
Both, the old calibration procedure (“dry plate”) and the new uranine calibration produce individual linear equations for each instrument that convert instrumental readings (digital counts) to nominal chlorophyll a concentration:
Chl a = A * (instrument counts – dark count)
Most of the loggers returned stable dark count values (recorded instrument values in the dark = “zero” response) in the old and new calibration, usually around 50 counts. However, as was expected, the slope (A) changed appreciably between the old and new calibration procedures.
When loggers were returned from the field and/or from WET Labs, since August 2010 they were co-deployed, when possible, for 2-3 days from the mooring pontoon at the AIMS Marine Operations facility to compare their performance with each other, and in comparison with frequent direct water samples analysed for concentrations of chlorophyll a. The recent co-deployments showed that most of the loggers now calibrated by WET Labs in uranine produce similar and consistent responses to ambient chlorophyll in hand-collected water samples and the results were deemed reliable [green deployments in Appendix 3- Figure 1].
96

Reef Rescue MMP - Inshore water quality monitoring - Final Report 2011/12
Unless loggers were damaged and not functioning at the time they were returned to WET Labs for recalibration, they underwent an initial factory uranine calibration check (pre-cals) prior to any servicing which might change the optical properties. After servicing, the instruments were re-calibrated with uranine. Using the “pre-cal” equations, chlorophyll fluorescence data from earlier deployments back to the time of purchase or a previous servicing were recalculated from instrumental “counts” [yellow deployments in Appendix 3- Figure 1].
Chl a = Apre-cal * (instrument counts – dark count)
The level of agreement between the newly calculated records and in situ chlorophyll was checked against available earlier validation data from direct water sampling (see above) and, if deemed acceptable, the earlier Reef Rescue MMP logger chlorophyll records were replaced.
In cases where instruments were irreparably damaged in the field, retuned or the optics refurbished earlier in the project [blue deployments in Appendix 3- Figure 1], no uranine calibrations prior to the damage/repair/servicing procedures are available. In these cases, ‘old’ and ‘current’ calibrations cannot not be directly associated. For the time being, we have chosen to omit these ‘orphan’ records until such time that a robust and defensible method of adjusting and incorporating them is devised.
In another group of cases [pink deployments in Appendix 3- Figure 1], direct application of the factory supplied calibration function to the instrumental data sets yielded negative estimates of chlorophyll concentrations. The cause(s) of the negative values in these particular records is (are) currently unresolved. We are attempting to see whether useful information can eventually be extracted from these records.
At the time of writing (Sept 2012) the process of factory re-calibration with uranine is almost complete, with six (6) instruments yet to be returned from WET Labs. WET Labs is also continuing to review older calibration data for individual instruments to derive better adjustment factors for historical calibration equations. The chlorophyll records from these instruments and deployments are yet to be resolved [uncoloured deployments in Appendix 3- Figure 1]. We expect that in time for the next annual report (September 2013), the calibration issues will be fully resolved and that reliable data will obtained and reported. A new standard QA/QC protocol will also be produced in the near future.
Finally, we are investigating the incorporation of an annual calibration of our instruments in conjunction with the collaborative Integrated Marine Observing System (IMOS) projects. These projects at AIMS have a cost-effective agreement to calibrate oceanographic instrumentation with the CSIRO Oceanographic Calibration Facility in Hobart. This facility is a National Association of Testing Authorities (NATA) accredited facility.
97

Reef Rescue MMP - Inshore water quality monitoring - Final Report 2011/12
Appendix 3- Figure 1 A timeline of logger deployments and calibration status at the 14 MMP reef sites. Numbers shown above each timeline are serial numbers of individual loggers used in individual deployments. Logger numbers without extensions (e.g. 828) identify instruments operated as originally received from WET Labs. Logger numbers with extensions (e.g. 353.01) identify instruments subsequently retuned or the optics refurbished by WET Labs, and thereby the preceding calibration is not related to the later version. Gaps with grey logger numbers indicate deployments where data were lost. See text for explanation of other colour categories.
98

Reef Rescue MMP - Inshore water quality monitoring - Final Report 2011/12
Appendix 4: Publications and Presentations from the Program in 2011/12
Presentations:
AMSA 2011 Crossing Boundaries Conference, Fremantle, 3-7 July 2011
Angus Thompson “A report card for monitoring the condition of hard coral communities over steep environmental gradients”
Australian Coral Reef Society 2011 Conference, 27-28 August, Twin Waters Qld
Angus Thompson, Paul Costello, Johnston Davidson and Britta Schaffelke “The influence of extreme events on coral community dynamics on turbid nearshore reefs of the GBR”
Johnston Davidson, Paul Costello, Murray Logan, Britta Schaffelke, Angus Thompson “Checking the pulse: coral recruitment dynamics at inshore reefs on the Great Barrier Reef”
Britta Schaffelke, Richard Brinkman, Irena Zagorskis, John Carleton, Michelle Devlin “Water quality monitoring in the inshore GBR: a long-term view after a summer of extremes”
12th International Coral Reef Symposium, 9-13 July 2012,
Florent Angly, Candice Heath, Virginia Rich, Britta Schaffelke, David Bourne, Gene Tyson “Microbial buffering: protecting the Great Barrier Reef against anthropogenic impacts”
Vittorio Brando, Thomas Schroeder, Arnold Dekker, Britta Schaffelke, Michelle Devlin “Assessing GBR water quality compliance using earth observation data”
Frederieke Kroon, Britta Schaffelke, Rebecca Bartley “Enhancing coral reef resilience through management of water quality”
Katherine Martin, Chris Chinn, Britta Schaffelke, Karen Kennedy, Len McKenzie, Michelle Waycott, Vittorio Brando, Angus Thompson, Michelle Devlin “Assessing the effectiveness of water quality management of the Great Barrier Reef”
Britta Schaffelke, John Carleton, Miles Furnas, Murray Logan “Water quality variability in the inshore Great Barrier Reef lagoon”
Angus Thompson, Britta Schaffelke, Paul Costello, Johnston Davidson “Extreme environmental conditions disproportionately force change in coral community composition”
Scarla Weeks, Jeremy Werdell, Richard Brinkman, Zhongping Lee, Marites Canto, Britta Schaffelke “Spatio-temporal patterns of water clarity on the Great Barrier Reef”
99

Reef Rescue MMP - Inshore water quality monitoring - Final Report 2011/12
Publications:
Brodie JE, Kroon FJ, Schaffelke B, Wolanski EC, Lewis SE, Devlin MJ, Bohnet IC, Bainbridge ZT, Waterhouse J, Davis AM (20 2) Terrestrial pollutant runoff to the Great Barrier Reef: An update of issues, priorities and management responses. Marine Pollution Bulletin 65: 8 - 00
Fabricius KE, Cooper TF, Humphrey C, Uthicke S, De’ath G, Davidson J, LeGrand H, Thompson A, Schaffelke B (20 2) A bioindicator system for water quality on inshore coral reefs of the Great Barrier Reef. Marine Pollution Bulletin 65: 320-332
Fabricius, K.E., De'ath, G., Humphrey, C., Zagorskis, I., Schaffelke, B., in press. Intra-annual variation in turbidity in response to terrestrial runoff at near-shore coral reefs of the Great Barrier Reef. Estuarine, Coastal and Shelf Science.DOI: doi: 0. 0 6/j.ecss.20 2.03.0 0
Munksgaard N, Wurster C, Bass A, Zagorskis I, Bird M (2012) First continuous shipboard δ18O and δD measurements in sea water by diffusion sampling—cavity ring-down spectrometry. Environmental Chemistry Letters 10: 301-307
Schaffelke B, Carleton J, Skuza M, Zagorskis I, Furnas MJ (2012) Water quality in the inshore Great Barrier Reef lagoon: Implications for long-term monitoring and management. Marine Pollution Bulletin 65: 249-260
100