list of acronyms · list of acronyms acp – african, caribbean and pacific states beru – banana...
TRANSCRIPT


LIST OF ACRONYMS
ACP – African, Caribbean and Pacific States
BERU – Banana Emergency Recovery Unit
BOE – Barrels of Oil Equivalent
CARE – Centre for Adolescent, Rehabilitation and Education
CARICOM – Caribbean Community and Common Market
CPI – Consumer Price Index
CREDP –Caribbean Renewable Energy Development project
CXC –Caribbean Examination Council
DCA – Development Control Authority
DCA –Development Control Authority
ECB – European Central Bank
ECCB – Eastern Caribbean Central Bank
ECCU –Eastern Caribbean Currency Union
EU – European Union
GDP – Gross Domestic Product
GFLC – George F.L Charles Airport
LPG – Liquified Propane Gas
LUCELEC – St. Lucia Electricity Services Limited
M2 – Broad Money
M2 – Narrow Money
NDA –Net Domestic assets
NELP – National Enrichment and Learning Program
NFA –Net Foreign assets
NHC – National Housing Corporation
NIC – National Insurance Corporation
NIPRO – National Insurance Poverty Development and Management Company
NIR – Net International reserves
OAS – Organisation of American States
RGSM – Regional Government Securities Market
RDP – Roads Development Programme
SDA – Seventh Day Adventist
SLASPA – St. Lucia Air and Sea Ports Authority
TEUS – Twenty foot Equivalent Units Containers
TRP – Tertiary Roads Programme
UK– United KingdomUNEC –United Network of the Eastern Caribbean
ULG – Unleaded gasoline
US – United States
WASCO – Water and Sewage Company
WACD– Weighted average cost of debt
WIBDECO – Windward Island Banana Development Co-operation
WTO – World Trade Organization
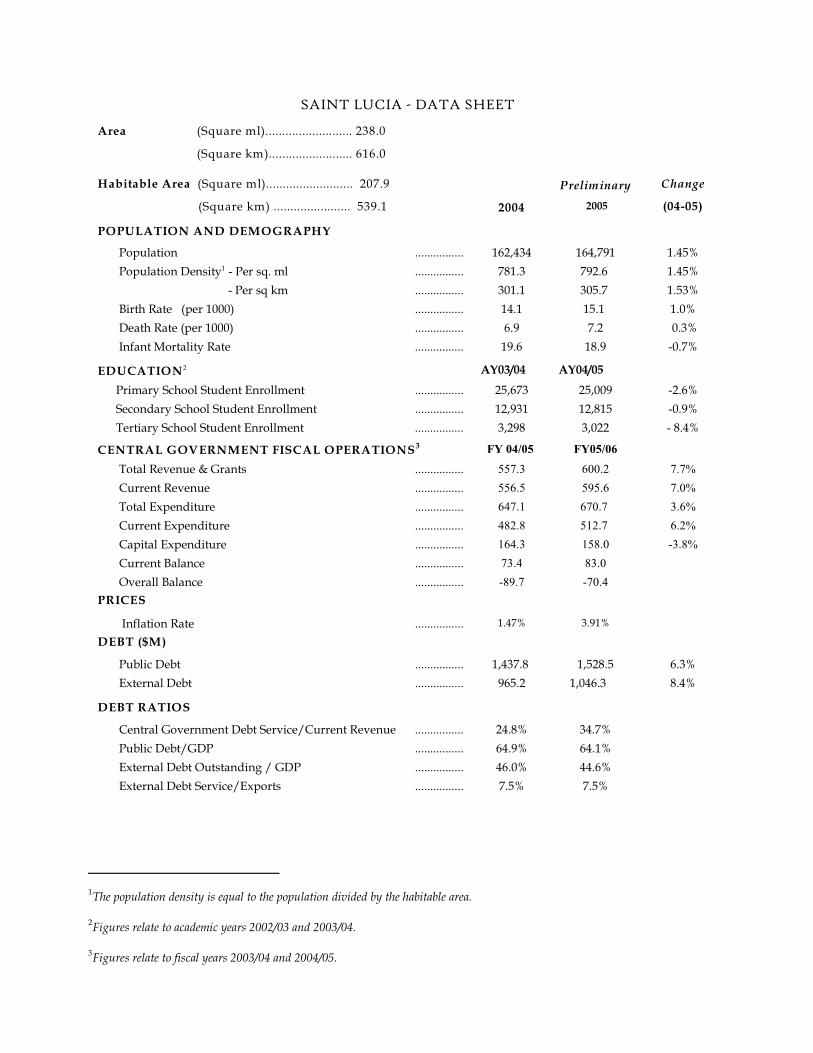
The population density is equal to the population divided by the habitable area.1
Figures relate to academic years 2002/03 and 2003/04.2
Figures relate to fiscal years 2003/04 and 2004/05.3
SAINT LUCIA - DATA SHEET
Area (Square ml).......................... 238.0
(Square km)......................... 616.0
Habitable Area (Square ml).......................... 207.9
(Square km) ....................... 539.1 2004
Preliminary
2005
Change
(04-05)
POPULATION AND DEMOGRAPHY
Population ................ 162,434 164,791 1.45%
Population Density - Per sq. ml ................ 781.3 792.6 1.45%1
- Per sq km ................ 301.1 305.7 1.53%
Birth Rate (per 1000) ................ 14.1 15.1 1.0%
Death Rate (per 1000) ................ 6.9 7.2 0.3%
Infant Mortality Rate ................ 19.6 18.9 -0.7%
EDUCATION2 AY03/04 AY04/05
Primary School Student Enrollment ................ 25,673 25,009 -2.6%
Secondary School Student Enrollment ................ 12,931 12,815 -0.9%
Tertiary School Student Enrollment ................ 3,298 3,022 - 8.4%
CENTRAL GOVERNMENT FISCAL OPERATIONS3 FY 04/05 FY05/06
Total Revenue & Grants ................ 557.3 600.2 7.7%
Current Revenue ................ 556.5 595.6 7.0%
Total Expenditure ................ 647.1 670.7 3.6%
Current Expenditure ................ 482.8 512.7 6.2%
Capital Expenditure ................ 164.3 158.0 -3.8%
Current Balance ................ 73.4 83.0
Overall Balance ................ -89.7 -70.4
PRICES
Inflation Rate ................ 1.47% 3.91%
DEBT ($M)
Public Debt ................ 1,437.8 1,528.5 6.3%
External Debt ................ 965.2 1,046.3 8.4%
DEBT RATIOS
Central Government Debt Service/Current Revenue ................ 24.8% 34.7%
Public Debt/GDP ................ 64.9% 64.1%
External Debt Outstanding / GDP ................ 46.0% 44.6%
External Debt Service/Exports ................ 7.5% 7.5%

SAINT LUCIA - DATA SHEET
2004
Preliminary
2005
Change
(04-05)
GDP at Factor Cost ................
Constant Prices ($m) ................ 1,271.8 1,340.5 5.4%
of which: - Agriculture ................ 57.7 45.1 -22.0%
- Tourism ................ 170.9 181.7 6.3%
Rate of Growth ................ 3.99% 5.41%
MONEY AND CREDIT ($m)
Total Deposits ................ 2,239.8 2,537.5 13.3%
Money Supply (M1) ................ 481.2 547.3 13.7%
Money Supply (M2) ................ 1,509.0 1,711.8 13.4%
Bank Credit to Public Sector ................ 134.6 178.4 32.5%
Bank Credit to Private Sector ................ 1,673.1 1,996.2 19.3%
BANK CREDIT BY SECTOR:
Agriculture ................ 33.4 30.5 -8.7%
Manufacturing, mining and quarrying ................ 50.6 59.9 18.4%
Tourism ................ 204.1 270.9 32.7%
Distributive Trades ................ 195.2 227.7 1647%
Personal ................ 863.2 957.6 10.9%
Transport ................ 24.0 50.2 109.2%
Public Utilities ................ 21.7 20.7 -4.6%
Construction and Land Development ................ 108.5 121.8 12.3%
Public Administration (Gov't Services) ................ 102.5 149.9 46.2%
Professional and other Services ................ 168.2 218.5 29.9%
Total Credit ................ 1,807.7 2,174.6 20.3
AGRICULTURE (tonnes)
Banana Production ................ 42,326 30,007 29.1%
Fish Landing ................ 1,519.8 1,386.2 -8.8%
TOURISM
Total Visitor Arrivals ................ 813,68 751,275 -7.7%
of which: - Stay-over Tourists ................ 298,431 317,939 6.5%
- Excursionists ................ 11,441 7,541 -34.1%
- Cruise Ship Arrivals ................ 481,279 394,431 -18.0%
- Yacht Passenger Arrivals ................ 22,530 27,464 21.9%
MERCHANDISE FOREIGN TRADE ($m)
Imports (C.I.F.) .............. 1,137.8 1,258.2 10.6%
Imports (F.O.B) .............. 1,001.2 1,107.2 10.6%
Exports .............. 215.0 170.6 -20.7%
Balance .............. -786.2 -936.6
RATE OF EXCHANGE (US$) .............. EC$2.70 EC$2.70

TABLE OF CONTENTS
Chapter Page
1 Domestic Economic Developments . . . . . . . . . . . 1
2 International & Regional Developments . . . . . 7
3 The Monetary & Financial Sector . . . . . . . . . . . 11
Monetary Developments . . . . . . . . . . . . . 11
Prices . . . . . . . . . . . . . . . . . . . . . . . . . . . . . . 17
4 The Real Sector . . . . . . . . . . . . . . . . . . . . . . . . . . . 19
Tourism . . . . . . . . . . . . . . . . . . . . . . . . . . . . 19
Agriculture . . . . . . . . . . . . . . . . . . . . . . . . . 22
Manufacturing . . . . . . . . . . . . . . . . . . . . . . 27
Construction . . . . . . . . . . . . . . . . . . . . . . . 30
Transportation . . . . . . . . . . . . . . . . . . . . . 35
Communications . . . . . . . . . . . . . . . . . . . . 37
Energy . . . . . . . . . . . . . . . . . . . . . . . . . . . . . 38
5 Government Fiscal Operations . . . . . . . . . . . . . 42
Central Government Fiscal Operations 42
Public Debt . . . . . . . . . . . . . . . . . . . . . . . . 48
6 Trade & The Balance of Payments . . . . . . . . . . 52
7 Socio-Demographic Indicators . . . . . . . . . . . . . . 59
Population & Demography . . . . . . . . . . . 59
Education . . . . . . . . . . . . . . . . . . . . . . . . . . 61
8 Economic Outlook . . . . . . . . . . . . . . . . . . . . . . . . 66
Statistical Appendix
NOTE/ACKNOWLEDGMENT
The data contained in this
Review have been arranged
and classified to facilitate
economic analysis, and may
therefore not coincide exactly with
the accounting systems from
which they may have been derived.
In addition, the figures for the
year under review, and in some
cases for previous years, are
preliminary.
The Government of Saint Lucia
wishes to thank for their kind
cooperation, all the individuals
and institutions in both the public
and private sectors (whether in
Saint Lucia or abroad), who have
supplied data or other information
for this Review.

List of Tables Page
1. Selected Global Economic Indicators . . . . . . . . . . . . . . . . . . . . . . . . . . . . . . . . . . . . . . . . . . 8
2. Selected Regional Economic Indicators . . . . . . . . . . . . . . . . . . . . . . . . . . . . . . . . . . . . . . . . 9
3. Selected Interest rates . . . . . . . . . . . . . . . . . . . . . . . . . . . . . . . . . . . . . . . . . . . . . . . . . . . . . . 16
4. Production and Export of food and Beverage Sub-Sector . . . . . . . . . . . . . . . . . . . . . . . . 28
5. Building Applications to the Development Control Authority . . . . . . . . . . . . . . . . . . 32
6. Imports of Construction Material . . . . . . . . . . . . . . . . . . . . . . . . . . . . . . . . . . . . . . . . . . . . 33
7. Weighted Average Cost of Debt . . . . . . . . . . . . . . . . . . . . . . . . . . . . . . . . . . . . . . . . . . . . . 47
List of Graphs Page
1. Real Domestic Product . . . . . . . . . . . . . . . . . . . . . . . . . . . . . . . . . . . . . . . . . . . . . . . . 1
2. Financial Sector Growth and Contribution to Real GDP . . . . . . . . . . . . . . . . . 11
3. Credit by Economic Sector . . . . . . . . . . . . . . . . . . . . . . . . . . . . . . . . . . . . . . . . . . . 12
4. Deposit Liabilities by Category . . . . . . . . . . . . . . . . . . . . . . . . . . . . . . . . . . . . . . . 13
5. Selected Liquidity Ratios . . . . . . . . . . . . . . . . . . . . . . . . . . . . . . . . . . . . . . . . . . . . 15
6. Consumer Price Index . . . . . . . . . . . . . . . . . . . . . . . . . . . . . . . . . . . . . . . . . . . . . . . 17
7. Selected Consumer Price Indices . . . . . . . . . . . . . . . . . . . . . . . . . . . . . . . . . . . . . . 18
8. Tourism: Real Growth and Contribution to Real GDP . . . . . . . . . . . . . . . . . . . 19
9. Stay-over Arrivals by Major Markets . . . . . . . . . . . . . . . . . . . . . . . . . . . . . . . . . . 20
10. Agriculture: Real Growth . . . . . . . . . . . . . . . . . . . . . . . . . . . . . . . . . . . . . . . . . . . . 22
11. Banana Exports . . . . . . . . . . . . . . . . . . . . . . . . . . . . . . . . . . . . . . . . . . . . . . . . . . . . . 24
12. Purchases of Other Crops by Category . . . . . . . . . . . . . . . . . . . . . . . . . . . . . . . . . 25
13. Fish Landing by Species . . . . . . . . . . . . . . . . . . . . . . . . . . . . . . . . . . . . . . . . . . . . . 26
14. Manufacturing Growth and Contribution to Real GDP . . . . . . . . . . . . . . . . . . 27
15. Composition of Manufacturing Production . . . . . . . . . . . . . . . . . . . . . . . . . . . . 28
16. Construction: Growth and Contribution to Real GDP . . . . . . . . . . . . . . . . . . . 29
17. Public Sector Construction . . . . . . . . . . . . . . . . . . . . . . . . . . . . . . . . . . . . . . . . . . . 30
18. Transportation (Real Growth) . . . . . . . . . . . . . . . . . . . . . . . . . . . . . . . . . . . . . . . . 34
19. Total Passengers Handled . . . . . . . . . . . . . . . . . . . . . . . . . . . . . . . . . . . . . . . . . . . . 34
20. Cargo Traffic . . . . . . . . . . . . . . . . . . . . . . . . . . . . . . . . . . . . . . . . . . . . . . . . . . . . . . . 35

List of Graphs ( cont’d) Page
21. Communications: Real Growth and Contribution to Real GDP . . . . . . . . . . 36
22. Oil Price Movements (West Texas Intermediate) . . . . . . . . . . . . . . . . . . . . . . . 37
23. Composition of Electricity . . . . . . . . . . . . . . . . . . . . . . . . . . . . . . . . . . . . . . . . . . 38
24. Fuel Price and Surcharges . . . . . . . . . . . . . . . . . . . . . . . . . . . . . . . . . . . . . . . . . . . 38
25. Central Government Fiscal Operations . . . . . . . . . . . . . . . . . . . . . . . . . . . . . . . 41
26. Major Components of Current Revenue . . . . . . . . . . . . . . . . . . . . . . . . . . . . . . 42
27. Capital Expenditure by Ministry . . . . . . . . . . . . . . . . . . . . . . . . . . . . . . . . . . . . . 46
28. Debt Indicators . . . . . . . . . . . . . . . . . . . . . . . . . . . . . . . . . . . . . . . . . . . . . . . . . . . . 48
29. Distribution of Debt by Sector . . . . . . . . . . . . . . . . . . . . . . . . . . . . . . . . . . . . . . . 50
30. Imports . . . . . . . . . . . . . . . . . . . . . . . . . . . . . . . . . . . . . . . . . . . . . . . . . . . . . . . . . . . 53
31. Petroleum Imports . . . . . . . . . . . . . . . . . . . . . . . . . . . . . . . . . . . . . . . . . . . . . . . . . 53
32. Exports . . . . . . . . . . . . . . . . . . . . . . . . . . . . . . . . . . . . . . . . . . . . . . . . . . . . . . . . . . . . 55
33. Trade Balance . . . . . . . . . . . . . . . . . . . . . . . . . . . . . . . . . . . . . . . . . . . . . . . . . . . . . . 56
34. Birth Statistics . . . . . . . . . . . . . . . . . . . . . . . . . . . . . . . . . . . . . . . . . . . . . . . . . . . . . 58
35. Stare of Population by District . . . . . . . . . . . . . . . . . . . . . . . . . . . . . . . . . . . . . . . 59
36. Primary School Students and Teacher Enrolment. . . . . . . . . . . . . . . . . . . . . . 61
37. Secondary School Students and Teacher Enrolment . . . . . . . . . . . . . . . . . . . . 62
38. Sir Arthur Lewis Community College Enrolment by Division . . . . . . . . . . . 62

-1-
CHAPTER ONE
DOMESTIC ECONOMIC DEVELOPMENTS
During 2005, economic activity in St. Lucia intensified, driven by the performance of the
construction, hotel/ restaurants, banking/insurance, communications and distributive trade
sectors. Despite external pressures from increasing international petroleum prices and the
persistence of international terrorism, the economy registered real GDP growth of 5.4 percent. This
strong growth performance represented full recovery from the post 2001 downturn, as the economy
is now at a higher base. After contracting by 4.1 percent in 2001, the economy has posted cumulative
growth of 13.6 percent over the five year period 2001 to 2005.
The outturn for real GDP growth
was influenced by increases in
output of 10.4 percent in the
construction sector, 9.2 percent in
distributive trade, 8.7 percent in
banking and insurance, 7.3 percent in
communications and 6.3 percent in
the hotel and restaurant sub-sector.
Tourism
The tourism sector continued along
its path of steady growth in the
review period, despite the emergence of several factors that posed a threat to prospects for the sector.
These factors included, increasing oil prices, continued threats of terrorism in major tourist markets
The St. Lucia economy continued to post a strong growth performance, dominated by activity in the
hotel and restaurant sector and significant investment in tourism, private sector construction and
public infrastructure .

This is represented by hotels and restaurants4
-2-
and the impact of an active hurricane season. Tourism accounted for 13.6 percent of real GDP in4
2005, retaining its position as the principal engine of economic growth in St. Lucia. Moreover, real
growth in the sector, reflected by the value added in the hotel and restaurant sub-sectors, expanded
by 6.3 percent.
Total visitor arrivals were 747,375 in the review period, which represented an 8.1 percent decrease
compared to 2004. Increases of 6.5 percent and 21.9 percent respectively were noted in the high value
added categories of stay-over and yachting visitors. Growth in the stay-over arrivals segment was
attributed to the St. Lucia Jazz, the strong weddings and honeymoon niche market, increased airlift
capacity from the United States (US), hosting of international cricket matches and the St. Lucia
Tourist Board; Simply Shocking promotion.
The number of excursionists fell by 34.1 percent to 7,541, and cruise arrivals decreased by 18.0
percent over 2004, as a result of the renovation of the northern wharf.
Despite the decline in total arrivals, total visitor expenditure increased by 9.3 percent to $961.2
million in 2005 on account of the growth performance in the high value added visitor categories.
There was a 6.8 percent increase in the average occupancy rate in 2005, which mirrored the growth
observed in the number of stay-over arrivals. The all-inclusive category recorded moderate growth
in hotel occupancy, while the conventional hotels and small properties showed considerable
improvements of 14.2 percent and 5.8 percent respectively.
Agriculture
During 2005, output of the sub-sectors within agriculture sector, with the exception of the livestock
sector recorded contractions of varying magnitudes. Real output in the sector fell by 22.0 percent in
2005, following marginal growth of 1.8 percent in the previous year. The largest contraction, 36.2
percent, was observed in the banana sub-sector. However, there were also significant declines in
value added in the non-traditional crops sub-sector of 16.9 percent and the fisheries sub-sector of 6.8
percent. By contrast, the livestock sub-sector expanded for the second year, growing by 2.2 percent.
In keeping with the decline in banana output, the agriculture sector’s contribution to real GDP fell
to 3.4 percent with bananas contributing a mere 1.3 percent.

-3-
Banana exports from St. Lucia ,fell by 29.1 percent to 30,007 tonnes while export revenue fell by 23
percent to $41.5 million. This performance was influenced by difficulties in the management of
yellow sigatoka disease (leaf spot) and destruction of over 1,400 acres under banana cultivation by
hurricane Ivan in 2004. Moreover, negotiations for the conversion of the European Union (EU)
banana import regime from a multi quota and tariff regime to a single tariff structure in 2006, also
added uncertainty to the industry.
Manufacturing
Buoyed by the continued strong performance of the food and beverage sub-sector, value added in
the manufacturing sector is estimated to have expanded by 3.9 percent while contributing 5.6
percent to real GDP.
The value of output in the manufacturing sector increased by 10.2 percent to $156.7 million in 2005,
compared to 3.0 percent growth in the previous year. This performance was dominated by activity
in the food and beverage, paper and paperboard and electrical sub-sectors, which together
accounted for 80.0 percent of production in the manufacturing sector. Manufacturing exports fell
by 10.7 percent to $52.9 million during the review period.
Construction
The construction sector recorded substantial growth of 10.4 percent in 2005, following a growth of
1.0 percent in the previous year. Consequently, the share of construction to total real GDP increased
from 7.6 percent in 2004 to 8.0 percent. This performance was influenced by significant private
sector investment, especially in the tourism sector, housing construction and Government
investment in infrastructure.
Public sector construction expenditure more than doubled to $134.5 million, after recording a decline
of 9.2 percent in 2004. This reflects significant expenditure on major road rehabilitation projects
such as the completion of the Roads Development Programme (RDP), the Tertiary Roads
Programme and the East Coast Road Rehabilitation Project. Data on imports of construction
material, building permit applications and credit to the private sector reflected buoyancy in both
residential and commercial construction over the review period.

-4-
Money and Prices
The strong economic performance was mirrored in the monetary and financial sector during 2005.
National accounts data indicate that the sector (banking and insurance) expanded by 8.7 percent
during 2005, following growth of 4.9 percent in the previous year. The expansion of the banking
sector, which grew by 9.9 percent, was primarily responsible for this strong performance. As a
result, the sector’s contribution to real GDP increased to 11.3 percent. During 2005, there was an
increase of 21.3 percent in domestic credit to $1,777.9 million, driven mainly by a 16.2 percent rise
in credit to the private sector. Credit to households and businesses expanded by 13.3 percent to
$951.0 million and 19.2 percent to $966.3 million respectively. Despite a 49.0 percent increase in
credit to the Central Government to $279.1 million, net credit to the Central Government fell by 33.7
percent to $84.9 million. This resulted from a 14.6 percent expansion in deposits, which maintained
the position of the Central Government as a net lender to the banking system.
Deposit liabilities grew by 13.3 percent to $2,537.5 million in 2005. Of this amount, 41.0 percent were
savings deposits which grew by 12.8 percent to $1,041.1 million, following moderate growth of 6.9
percent in 2004. Time deposits grew by 5.8 percent to $797.5 million, following marginal growth of
0.4 percent in 2004. By contrast, demand deposits grew by 20.3 percent to $621.3 million, building
on growth of 38.7 percent in 2004.
The broad money supply (M2) grew by 13.4 percent to $1,711.8 million in 2005, following an
increase of 10.1 percent in the previous year. This was in line with an expansion in the components
of the narrow measure of the money supply (M1) and components of quasi-money, both of which
were consistent with increased economic activity.
During 2005, there was a tightening of liquidity as measured by the loans and advances to deposits
ratio. The ratio rose from 80.7 to 85.7 as the growth in loans and advances of 20.3 percent
outstripped the 13.3 percent expansion in deposits.
Rising international petroleum prices placed significant upward pressure on the Consumer Price
Index (CPI) during 2005. The inflation rate, as measured by the percentage change in the 12-month
average of the CPI increased to 3.9 percent, compared to a rate of 1.5 percent in 2004. On the
domestic front, movements in the CPI were influenced largely by the Food, Fuel/Light and
Transport /Communications sub-indices, reflecting the pass-through effects of rising global oil
prices.

-5-
Central Government Fiscal Operations
Central Government fiscal operations improved significantly in 2005/06 reflecting strengthened
revenue performance with continued economic expansion and moderate growth in expenditure.
The current surplus increased from 3.3 percent to 3.5 percent of GDP or $83.0 million, substantiated
by growth of receipts from all major tax sources, while growth of most categories of current
expenditure remained subdued. Consequently, the overall deficit narrowed by 21.5 percent to $70.4
million (3.0 percent of GDP), mainly due to strong revenue growth of 7.7 percent and slower growth
in total expenditure of 3.7 percent .
Current expenditure increased by 6.2 percent, to $512.7 million, while maintaining a share of 21.7
percent of GDP from the previous year reflecting higher wages and salaries, interest commitments
on outstanding debt, pension contributions, rental payments, utilities and communications. Capital
expenditure continued to be affected by implementation delays and consequently, declined by 3.8
percent to $158.0 million.
Current revenue increased by 7.0 percent to $595.64 million in 2005/06 compared to an increase of
13.2 percent in 2004/05. This represented 25.2 percent of GDP. This performance was strongly
influenced by an increase of 17.4 percent of revenue from international trade taxes to $202.7 million.
Total outstanding public liabilities stood at $1,528.2 million, including payables of $17.3 million.
This represented about 64.1 percent of GDP, down from 64.9 percent in 2004. However, Central
Government debt which accounted for 85.6 percent of public sector debt, increased by 9.7 percent
to $1,296.3 million, or 55.0 percent of GDP. This was due largely to the 4.6 percent rise in domestic
debt, and to a lesser extent, the 12.1 percent increase in external debt compared to 2004.
In keeping with Government's policy to refinance high cost loans with cheaper instruments the
growth in interest payments fell to 7.5 percent compared to an increase of 19.7 percent in the
previous year. Total interest payments was recorded at $72.0 million but remained at approximately
3.0 percent of GDP over the two-year period. In 2005, the average cost of debt declined, leading to
a corresponding drop in the weighted average cost of debt (WACD) to 5.93 percent from 5.96 percent
in 2004. This is consistent with the Government's policy on accessing debt at the cheapest available
rates

-6-
Trade and Balance of Payments
The deficit associated with the current account of the Balance of Payments widened by 51.4 percent
to $406.8 million (17.9 percent of GDP at market prices), mainly reflecting a rise in the value of
imports and a decline in the value of exports. The value of imports increased by 11.1 percent
$1,107.2 million relative to growth of 4.1 percent in 2004. The growth in imports can be associated
with increased activity in the construction sector and higher oil prices during the review period.
The value of exports declined by 31.9 percent to $170.6 million, in line with a decline in banana
production. Consistent with the increase in imports and fall in exports the merchandise trade deficit
grew by 29.3 percent to $906.2 million.
In contrast to the outturn in the merchandise account, the surplus on the services account grew by
9.5 percent to $640.3 million building on strong growth of 24.9 percent in 2005. This performance
was supported by a 9.3 percent increase of inflows associated with activity in the tourism industry
during 2005.
The surplus on the capital and financial account rose by 28.2 percent to $448.9 million (20.2 percent
of GDP), in contrast to a decline of 14.9 percent in 2004. On the capital account, capital grants
declined from a low base of $6.0 million to $4.2 million, reflecting the implementation of new and
revised procedures by the European Union Parliament for accessing and spending grant funds. The
surplus on the capital and financial account was not sufficient to offset the current account deficit
and as a result an overall deficit of $46.9 million was recorded on the balance of payments accounts
relative to a surplus of $72.4 million in the previous year. This was financed by a decline in St.
Lucia’s share of the imputed reserves of $48.9 million or 2.1 percent of GDP.

As measured by the West Texas Intermediate.5
-7-
CHAPTER TWO
ECONOMIC DEVELOPMENTS
INTERNATIONAL
Growth in global output slowed to
about 4.3 percent in 2005, relative to
a strong outturn of 5.1 percent in 2004.
Despite slower growth in real output of
3.5 percent, the US economy remained
the main engine of global economic
growth. However, the dynamic
performance of China, India and a few
other large developing economies
exerted significant influence on
developments in the global economy.
Economic growth slowed in many
developed countries including the EU and the United Kingdom (UK).
Part of the global slowdown resulted from the maturing of the cyclical recovery in a number of
economies. Several exogenous shocks, including persistent high oil prices, natural disasters,
terrorist incidents and macroeconomic imbalances of the major economies impacted on the pace of
growth in the world economy in 2005. Global oil prices increased sharply by 27.2 percent over the5
period January to December 2005. This was driven primarily by growing demand, supply
constraints and concerns about low levels of excess capacity. As a result, oil prices created
inflationary pressures which drove up headline inflation in the majority of countries. The
employment situation worldwide remained unsatisfactory as the majority of countries continue to
face high levels of structural unemployment and underemployment.
Despite the downturn in world economic growth, international trade remains a strong impetus to
the growth of the global economy. Trade flows continued to expand at double the pace of world
output and increased by an estimated 7.1 percent in 2005. However, there were contrasting
Growth Inflation
Global 4.3 percent -
United States 3.5 percent 3.4 percent
United
Kingdom1.7 percent 3.8 percent
Euro Zone 1.4 percent 2.2 percent
Canada 3.0 percent 2.2 percent
China 9.3 percent 3.2 percent
1 Selected Global Economic Indicators

-8-
movements between oil and other commodity prices. Therefore oil-exporting countries, whose
exports are dominated by minerals and mining products, experienced positive terms-of-trade. In
contrast, oil-importing countries that export agricultural and manufactured products, suffered
significant terms-of-trade losses.
The US economy experienced moderate expansion in 2005 in the face of an intense hurricane season
and record energy costs. This was reflected tin he ongoing labour market recovery, high consumer
spending, supportive financial market conditions, and rising house prices. After fluctuating around
a moderate 3.0 percent in the early part of 2005, headline inflation rose to almost 4.0 percent in the
latter part of the year, as petrol prices peaked following disruptions in supply and refining
difficulties. The Federal Reserve Bank continued to raise interest rates, in quarter-point steps
throughout the year, from 2.25 at the end of 2004 to 4.25 percent in 2005, amidst increasing concerns
about inflationary pressures and the widening current account deficit supported by spending
pressures. Although the external deficit escalated to over US$800 billion in 2005, the dollar rose by
3.5 percent against a broad trade-weighted basket of major currencies.
The Canadian economy grew by to 3.0 percent in 2005, despite the marked appreciation of the
Canadian dollar which resulted from high commodity export prices and relatively flexible monetary
policies. High energy prices impacted inflation in 2005 to reach 2.2 percent, prompting the Bank
of Canada to increase its discount rate from 2.8 percent to 3.0 percent.
Conditions in the Euro Zone remained weak in 2005 as real output was estimated at 1.4 percent,
compared to an increase of 2.0 percent in the previous year. This outcome resulted from slow
growth in most of the 12 countries in the Region, but was particularly suppressed by weak domestic
demand in Germany, and to a lesser extent, Italy. The exception was Spain, where rising house
prices and investment growth continued. Despite the continued weakness in domestic demand, the
surge in energy prices caused headline inflation to rise at its fastest pace in four years in the Euro
Zone, reaching beyond the 2.0 percent target set by the European Central Bank (ECB). In the UK,
economic activity in 2005 slowed sharply to 1.7 percent, largely due to weaker consumption related
to the ending of the house price boom. Inflation grew by about 70 basis points to 3.8 percent,
reflecting the continued increase in crude oil prices and transportation costs.
Economic output in Japan slowed to 2.2 percent in 2005 compared to 2.7 percent in the previous
year. However, activity was supported by healthier bank and corporate balance sheets, a firmer

-9-
labour market and high consumer and business sentiment. Annual retail sales rose for the first time
in almost a decade, reflecting decreased reliance on exports. The absence of deflation in 2005 has
also reduced real interest rates, giving further impetus to domestic demand.
China maintained its substantial growth momentum during 2005 despite administrative and
monetary tightening measures to curb overheating in selected sectors. Real GDP remained robust,
expanding by 9.3 percent as a result of strong contribution from investment and manufacturing
exports. Similarly, economic activity in India grew by about 7.0 percent in 2005, on the strength of
increased agricultural output, and growth in industrial production and the services sector.
REGIONAL
Growth in the Caribbean was generally weaker than anticipated in 2005, as persistently high
international oil prices eroded already strained fiscal and external positions. In most
economies, the expansion in real economic output was driven by construction activity, and to a
lesser extent, tourism. Most Caribbean countries, however, experienced downward trends in the
tourism industry during 2005. Inflation for most of the Caribbean economies was moderately higher
in 2005 than in the previous year. This was fuelled mainly by rising energy prices and the surge in
food prices. Many regional Governments were unable to continue subsidizing petroleum prices for
unleaded gasoline, kerosene diesel and liquified propane gas.
The Trinidad and Tobago economy posted its twelfth consecutive year of expansion of 6.5 percent
in 2005, led by the energy sector, but faced the challenge of combatting rising inflation. The Central
Growth Inflation
Trinidad and Tobago 6.5 percent 7.2 percent
Jamaica 1.5 percent 15.0 percent
Barbados 4.1 percent 5.0 percent
Eastern Caribbean
Currency Union4.0 percent 3.5 percent
The Bahamas 3.0 percent 1.8 percent
Guyana 2.5 percent 5.5 percent
2 Selected Regional Economic Indicators

-10-
Bank of Trinidad and Tobago raised its 'repo' rate to 5.75 percent by year-end, as escalating food
prices forced headline inflation to reach 7.2 percent.
Jamaica's real GDP growth slowed sharply to 1.5 percent in 2005 due primarily to adverse weather
conditions which caused a decline of 24.4 percent in output in the agriculture, forestry and fishing
sectors by 24.4 percent in the first half of the year. This outcome, combined with high international
oil prices, prompted a 15 percent increase in annual inflation.
In Barbados, preparations for Cricket World Cup 2007 boosted economic output by 4.1 percent in
2005, while growth in the traditional main foreign exchange earners (sugar and tourism) remained
sluggish. The combined effect of continued import growth and the decline in export receipts was
a worsening of the external deficit, prompting the Central Bank of Barbados to raise the minimum
deposit rate in an attempt to dampen spending. The rate of inflation rose to 5.0 percent reflecting
the pass-through effects of high energy prices.
The 2.5 percent contraction in real economic growth in Guyana was explained mainly by the decline
in value-added from the agriculture, fishing sectors and bauxite sectors. Given the marginal
exchange rate appreciation against the US dollar in 2005, inflation in Guyana increased by 5.5
percent.
Among the smaller economies, there was a general increase in economic activity in 2005. Output
in Anguilla was estimated at about 9.0 percent compared to the 14.0 percent upturn in the previous
year, owing mainly to robust tourism activity. Grenada continued to recover from the devastating
impact of Hurricane Ivan with Real GDP growth estimated at about 2.0 percent, but faces a huge
financing gap for development projects. The Bahamas and Antigua and Barbuda both recorded
economic growth of over 3.0 percent on the strength of construction activity, while output in the
tourism sector lulled. The economies of the Eastern Caribbean Currency Union (ECCU) registered
an average inflation rate of 3.5 percent in 2005 while their economies expanded on average by 4.0
percent.

In the Monetary Survay credit to the private sector is not presented as net credit, that is total credit minus total6
depost. This contrasts with the treatment of all other participants in the banking system.
-11-
CHAPTER THREE
MONEY & PRICES
MONETARY DEVELOPMENTS
Developments in the monetary
and financial sector mirrored
strong growth performance in the
real sector during 2005. National
accounts data indicate that the sector
(banking and insurance) expanded by
8.7 percent during 2005, following
growth of 4.9 percent in the previous
year. The banking sub-sector grew
by 9.9 percent, and was primarily
responsible for the s trong
performance in the monetary and
financial sector. As a result, the sector’s contribution to real GDP increased to 11.3 percent during
the review period.
Activity within the sector was characterized by an expansion in both credit and deposits, with
growth in credit outweighing that of deposits leading to a tightening of liquidity. There were varied
reductions in commercial bank interest rates. The Monetary Survey featured a reduction in St.
Lucia’s net international reserves (NIR) and a strong increase in commercial banks’ net liabilities
within the ECCB area that led to a reduction in net foreign assets (NFA). However, M2 expanded
on the strength of a significant increase in net domestic assets (NDA).
Domestic Credit
For the second consecutive year, domestic credit expanded by double digits reflecting vibrant
activity in the real sector. During 2005, there was an increase of 21.3 percent in domestic credit to
$1,777.9 million as the main impetus continued to be credit to the private sector, which grew by 16.2
percent to $1,917.3 million . In comparison, private sector credit grew by 10.1 percent in 2004. Of6
-12-
total private sector credit in 2005, household credit expanded by 13.3 percent to $951.0 million while
business credit grew by 19.2 percent to $966.3 million.
Despite a 49.0 percent increase in credit to the Central Government to $279.1 million, net credit to
the Central Government fell by 33.7 percent to $84.9 million. This resulted from a 14.6 percent
expansion in deposits, which maintained the position of the Central Government as a net lender to
the banking system. This can be attributed to significant growth in current revenue on the fiscal
accounts of the Central Government.
Credit to non-bank financial institutions increased by 19.2 percent to $36.8 million, reflecting a 47.0
percent increase in loans to $18.2 million. Concurrently, deposits grew by 12.6 percent, leading to
an expansion of 6.8 percent of the net credit position of these institutions. This represented a
turnaround from the previous year when net credit to non-bank financial institutions fell by 10.0
percent as both credit and deposits declined.
Net credit to subsidiaries and affiliates fell by 3.5 percent to $168.5 million, a marked contrast to an
expansion of 10.7 percent in 2004. This resulted from a doubling of deposits, while credit registered
a smaller increase of 1.3 percent to $182.8 million. Notwithstanding the increase in deposits,
subsidiaries and affiliates remained net borrowers from the banking system.
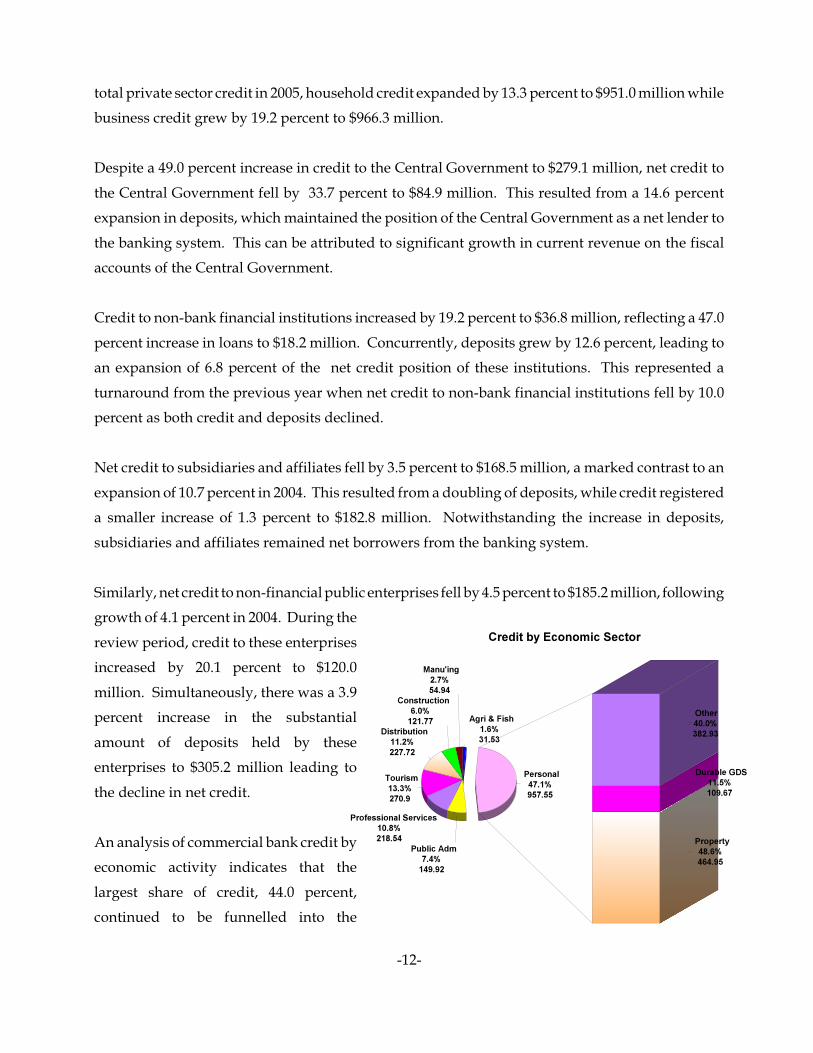
Similarly, net credit to non-financial public enterprises fell by 4.5 percent to $185.2 million, following
growth of 4.1 percent in 2004. During the
review period, credit to these enterprises
increased by 20.1 percent to $120.0
million. Simultaneously, there was a 3.9
percent increase in the substantial
amount of deposits held by these
enterprises to $305.2 million leading to
the decline in net credit.
An analysis of commercial bank credit by
economic activity indicates that the
largest share of credit, 44.0 percent,
continued to be funnelled into the

-13-
acquisition of personal items. For the third consecutive year loans and advances for this purpose
expanded, increasing by 10.9 percent to $957.6 million. Approximately one half of personal credit
was allocated to the acquisition of property and lending to this sub-sector grew by 12.5 percent to
$465.0 million. Of this amount, lending for the purpose of house and land purchases increased by
26.1 percent, while credit for home construction and renovation rose marginally to $220.0 million.
Lending for tourism related activities, the second largest amount of credit, rose by 32.7 percent to
$270.9 million, reflecting the expansion in that sector. In line with increased tourism activity, credit
to the distributive trades, 11.0 percent of the total, rose by 16.7 percent to $227.7 million. Credit for
construction and land development was also spurred by increased activity within the tourism sector,
rising by 12.2 percent to $121.8. There was also a 17.2 percent increase in lending to the
manufacturing sector contrasting with a 6.8 percent decline in the previous year.
By contrast, credit to the agriculture sector contracted for the fourth consecutive year, falling by 7.0
percent to $26.5 million. This reflects the continued credit risk associated with the sector and is
consistent with the large decline in value added of that sector during 2005.
Domestic Liabilities
The impact of economic growth within the domestic economy was also mirrored by the continued
robust growth of domestic liabilities across the banking system. Gross liabilities increased by 17.1
percent to $3,433.6 million, following an increase of 12.9 percent in 2004. The momentum for growth
continued to come from a substantial rise in deposit liabilities, which accounted for approximately
three quarters of all liabilities.
Deposit liabilities grew by 13.3 percent to
$2,537.5 million in 2005. Of this amount,
41 percent were savings deposits which
grew by 12.8 percent to $1,041.1 million,
following moderate growth of 6.9 percent
in 2004.
Time deposits grew by 5.8 percent to
$797.5 million, following marginal
growth of 0.4 percent in 2004. By

-14-
contrast, demand deposits grew by 20.3 percent to $621.3 million building on growth of 38.7 percent
in 2004. Demand deposits as a portion of deposit liabilities rose from 23 to 25 percent, while time
deposits as a portion of deposit liabilities fell from 34 to 31 percent. This was because foreign
currency deposits were one and a half times more in 2005 than the previous year as there are
increasing foreign direct investment in the construction sector.
An examination of deposits by depositor indicates that deposits by residents continue to grow
steadily as they increased in 2005 by 13.5 percent to $2,349.9 million. Similarly, deposits by non
residents, while less than 10 percent of deposits, increased by 10.7 percent to $187.6 million.
During the review period, one-half of all deposits by residents were held by private individuals,
whose deposits increased by 7.1 percent to $1,199.7 million. Deposits of the central and local
Government, which accounted for 15.0 percent of all deposits, increased by 18.7 percent to $349.8
million while those deposits held by statutory bodies fell by 3.8 percent to $304.9 million. Of the
latter, approximately 80 percent were deposits held by the National Insurance Corporation, an
amount which grew by a modest 2.9 percent. Deposits by business firms grew by 37 percent to
$343.5 million, expanding by double digits for the third consecutive year. This is consistent with
the recovery in the economy since 2003 and resulted in an increase of the share of deposits held by
business firms from 12 to 15 percent during 2005.
Money Supply
M2 grew by 13.4 percent to $1,711.8 million in 2005, following an increase of 10.1 percent in the
previous year. This was in line with an expansion in the components of M1, as well as the
components of quasi-money.
M1, defined as currency held by the public along with private sector demand deposits, grew by 13.7
percent to $547.3 million. This resulted from an increase of 15.4 percent in private sector demand
deposits, which accounted for 80 percent of the total. However, this represented a slow down from
the previous year, when this component expanded by 50 percent. Nonetheless, the performance
reflected continued economic activity as demand deposits are balances held to conduct business
transactions by firms and households.
Following a marginal increase in the previous year, quasi-money increased by 13.3 percent to
$1,164.5 million in 2005. The sharp increase was due to a 13.1 percent rise in private sector savings

-15-
deposits, which accounted for over three quarters of quasi-money. In addition, there was a 4 percent
increase in the level of private sector time deposits contrasting with a 25 percent decline in 2004.
The increase in M2 reflected contrasting movements of the aggregates on the asset side.
Notwithstanding a 73.5 percent decrease in NFA to $84.5 million, NDA expanded by 36.7 percent
to $1,627.3 million.
Liquidity
Over the review period there was a
tightening of liquidity as measured by
the loans and advances to deposits
ratio. Since 1999 this ratio has
consistently declined, signalling a
gradual easing of liquidity. However
in 2005, the ratio rose from 80.7 to 85.7
as the growth in loans and advances of
20.3 percent outstripped the 13.3
percent expansion in deposits.
Additionally, the stock of net liquid assets was halved during 2005, following a moderate decline
of 2.5 percent during the previous year. This was a result of a doubling in borrowing from banks
in other ECCB territories as well as an increase in longer term deposit liabilities to non-ECCB area
banks. Consequently, the ratio of net liquid assets to deposit liabilities fell significantly from 19.3
to 7.8.
Interest Rates
During the review period, movements in the interest rates continued in large part, to reflect trends
from the previous year. Rates on savings and demand deposits remained unchanged, but there was
a decline of 75 basis points on the upper end of the range on special deposits.
Rates on the upper end of the spectrum on time deposits of all maturities continued to decline as in
2004. Time deposits with maturities up to 3 months and maturities between 6 and 12 months saw
declines of 150 basis points while those with between 3 months to 6 months moved from 5.5 percent
to 3.5 percent. In addition, deposits with maturities between 1 and 2 years saw declines in the

-16-
spread of 50 basis points, while those over 2 years experienced the smallest contraction in the spread
of 25 basis points.
For the third consecutive year, the prime lending rate was maintained, but the spread on other
lending rates contracted as the lower end rose by 50 basis points and the upper end of the range fell
by the same amount.
The spread on the nominal rates of interest on add on loans also contracted as the rate on the lower
end of the range rose by 100 basis points. However, the effective interest rate on add on loans
remained unchanged.
External Sector Developments
In contrast with the outcome in 2004, the NIR declined during the review period, by 13.9 percent to
$302.6 million. This was influenced by developments in the real sector and highlighted in the
Balance of Payments. In 2005, there was a widening of the current account deficit, despite increased
travel receipts from a buoyant tourism sector. As a result, the stock of imputed assets declined by
13.6 percent to $311.8 million.
Deposit/ Lending Rates of various maturities2002 2003 2004 2005
Demand Deposits 3.0-5.0 0.0-4.5 0.0-3.5 0.0-3.5
Savings Deposits 3.0-5.5 3.0-4.75 3.0-4.75 3.0-4.75
Special rates 4.5-8.75 3.5-8.75 1.5-8.75 1.5-8.00
2.0-6.0 2.0-5.5 1.0-4.5 Time: up to 3 months 1.0-3.0
: over 3 to 6 months 2.0-6.0 2.0-5.75 1.0-5.5 1.0-3.5
: over 6 to 12 months 2.0-6.0 2.0-6.0 1.0-5.5 1.0-4.0
:over 1 to 2 years 2.0-8.50 2.0-7.5 1.0-4.5 1.0-4.0
: over 2 years 2.5-8.50 2.0-7.0 1.0-4.5 1.0-3.75
Lending rates: Prime 9.5-10.5 9.5-10.0 9.5-10.0 9.5-10.0
:other rates 7.5-18.0 6.0-18.5 5.5-18.0 6.0-17.5
Add on Loans : Nominal rate 8.50-18.00 7.0-18.00 6.0-18.00 7.0-18.00
: Effective rate 11.03-23.0 8.50-23.0 10.50-23.50 10.50-23.50
3 Selected Interest Rates

-17-
Additionally, there were substantial investment inflows to commercial banks during the review
period. Therefore, at the end of the review period, commercial banks moved from a net liability
position of $32.9 million to $218.1 million. Consequently, the stock of NFA declined by $234.1
million to $84.5 million.
PRICES
The inflation rate in 2005 was higher than in the previous year, as the persistent rise in
international oil prices continued to drive up the Consumer Price Index (CPI). The inflation rate
measured by the percentage change in the 12-month average of the CPI, increased to 3.9 percent
compared to 1.5 percent in 2004. Similarly, the point-to-point measure of the inflation rate as at
December 2005 registered at 5.2 percent compared to 3.5 percent in the same period a year earlier.
Inflationary pressures within the
domestic economy were influenced
by external economic conditions
which resulted in a relatively high
level of ‘imported' inflation. Annual
inflation in major developed countries
rose to 2.2 percent in 2005, up from
1.8 percent in 2004. More
importantly, in 2005, inflation rates in
main trading partner economies such
as the US and the UK, grew by about
70 basis points to 3.4 and 3.8 percent,
respectively. With regards to
CARICOM, inflation for most of the
member states was moderately higher in 2005 than in the previous year. More specifically, the rate
of inflation in the Eastern Caribbean Currency Union (ECCU) for 2005 was provisionally estimated
at 3.5 percent. Nevertheless, for the most part, the annual inflation rate in 2005 for various
CARICOM member states was comparable with those in trading partner countries.
On the domestic front, movements in the CPI were influenced largely by the Food, Fuel and Light

-18-
and Transport and Communications sub-indices, reflecting the pass-through effects of rising
petroleum prices. The Food sub-index, the most heavily weighted in the CPI, rose by 7.1 percent
in 2005 compared to a rise of 0.8 percent in 2004. This outcome was influenced by increased prices
in various source markets as well as rising freight charges prompted by supply constraints in the
domestic and regional agricultural sectors.
Similarly, the sub-index for Fuel and Light jumped by 7.7 percent in 2005 from an increase of 3.5
percent in the previous year. This upturn represented the largest movement among all the
sub-indices and was prompted chiefly by the 36.0 percent rise in international oil prices in 2005,
relative to 2004. The light component of the sub-index reflects the production cost of electricity
services which is based on the prevailing international price of oil.
Soaring oil prices also impacted on
Transport and Communications,
pushing up the year-on-year sub-index
by 3.0 percent in 2005. This outcome
was led primarily by the transport
component which saw increases in
prices for petrol, bus fare and air travel,
while prices for communications
remained flat compared to 2004.
In the twelve months to December
2005, other upward movements in the
remaining sub-indices were recorded,
though less significant. As a result, core inflation inched up by 0.7 percent in 2005. Accordingly,
the sub-indices for the categories namely, Clothing and Footwear, Housing, Furniture and
Household Equipment remained unchanged, while increases were recorded for the sub-indices of
Beverages and Tobacco (1.5 percent), Medical Care and Health (0.3 percent), Recreation, Education
and Culture (0.9 percent) and Miscellaneous Goods and Services (0.9 percent).

This is represented by hotels and restaurants7
-19-
CHAPTER FOUR
REAL SECTOR
TOURISM
The tourism sector continued along its path of steady growth in the review period, despite the
emergence of several factors that
hindered growth prospects for the sector.
Tourism accounted for 13.6 percent of7
real GDP in 2005, retaining its position as
the principal engine of economic growth
in St. Lucia. Moreover, real growth in the
sector, reflected by the value added in the
hotel and restaurant sub-sectors,
expanded by 6.3 percent.
Total visitor arrivals were 747,375 in the
review period, which represented an 8.1
percent decrease compared to 2004. Increases of 6.5 percent and 21.9 percent respectively were noted
in the high value added categories of stay-over and yachting visitors. The number of excursionists
fell by 34.1 percent to 7, 541, and cruise arrivals decreased by 18 percent over 2004.
Several factors emerged which adversely impacted on the sector’s performance in 2005. These
factors include rising petroleum prices, the impact of an active hurricane season, and persistent
threats of international terrorism. Petroleum is a major input into the provision of air transportation
and therefore any significant increase in prices would have impacted on air travel. International
petroleum prices increased by 27.2 percent to reach an average of US $59.4 per barrel by December
2005. This resulted in significant increases in airline tickets as fuel surcharges were added to the
base price of such tickets. Consequently, the developments in the international petroleum market
may have dampened the growth in long haul visitors. The year 2005 was marked as the most active
hurricane season experienced in the Atlantic region. Press coverage of hurricane activity may have
caused potential visitors to reconsider their vacation decisions.
-20-
The major contributors to the increase in the stay-over and yachting arrivals are St. Lucia Jazz
commencing in April, St. Lucia’s strong weddings and honeymoons niche market and the increased
airlift capacity from the US market. The number of direct airline flights increased from twice per
week to five times per week by Delta Airlines. Moreover, special events such as the Atlantic Rally
for Cruisers (ARC), Carnival and the hosting of various cricket matches in St. Lucia also played a
significant role in influencing the observed increase in these categories.
The increase in stay-over arrivals was mirrored by a 9.3 percent rise in visitor expenditure to $961.2
million. The Caribbean market saw the highest boost in expenditure of 30.2 percent to
approximately $137.9 million over 2004. Visitors from the UK market recorded the highest rise in
average daily expenditure of 6.7 percent or $19.0 million to $304.5 million, this closely followed by
expenditure by visitors from the US market who increased average daily spending by $16.5 million
to $373.9 million.
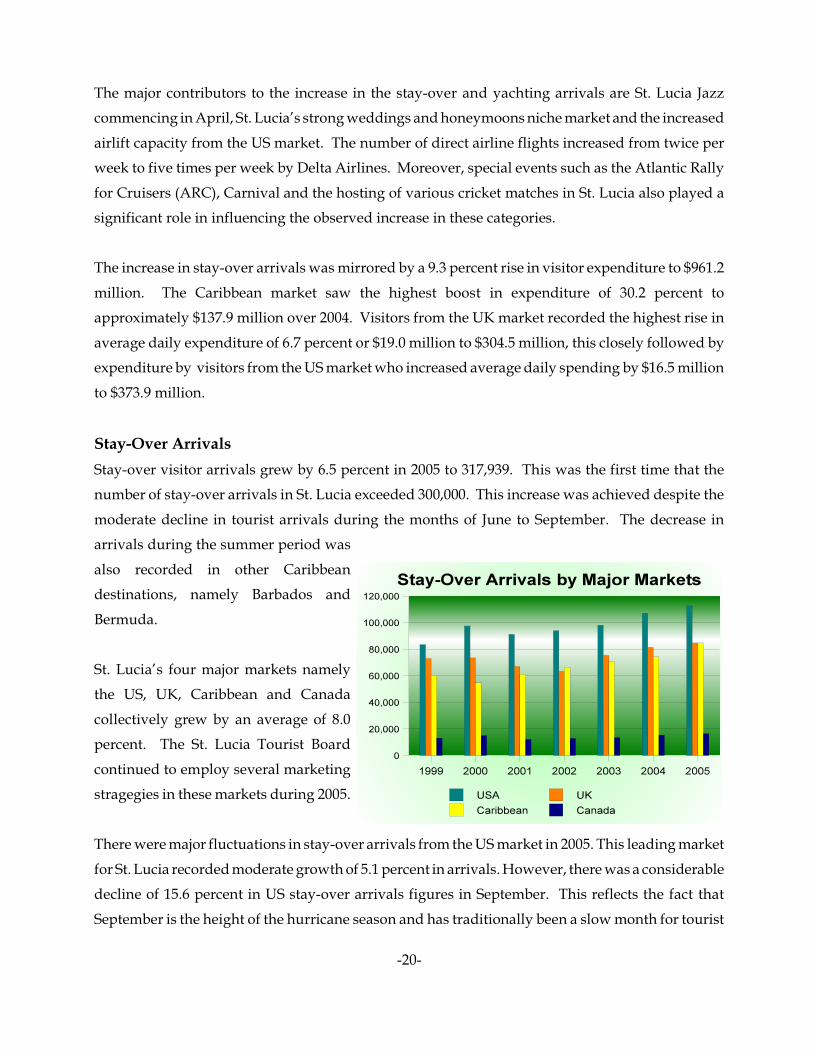
Stay-Over Arrivals
Stay-over visitor arrivals grew by 6.5 percent in 2005 to 317,939. This was the first time that the
number of stay-over arrivals in St. Lucia exceeded 300,000. This increase was achieved despite the
moderate decline in tourist arrivals during the months of June to September. The decrease in
arrivals during the summer period was
also recorded in other Caribbean
destinations, namely Barbados and
Bermuda.
St. Lucia’s four major markets namely
the US, UK, Caribbean and Canada
collectively grew by an average of 8.0
percent. The St. Lucia Tourist Board
continued to employ several marketing
stragegies in these markets during 2005.
There were major fluctuations in stay-over arrivals from the US market in 2005. This leading market
for St. Lucia recorded moderate growth of 5.1 percent in arrivals. However, there was a considerable
decline of 15.6 percent in US stay-over arrivals figures in September. This reflects the fact that
September is the height of the hurricane season and has traditionally been a slow month for tourist

-21-
arrivals. The peak month for US arrivals was April, with the highest percentage increase of 42.3.
Total visitor expenditure associated with the US market stood at $340.9 million, representing a 7.3
percent increase over 2004.
The UK market performed similarly, where in-bound travel to St. Lucia recorded modest growth
in stay-over arrivals with a 4.1 percent increase over 2004. The most substantial increase in arrivals
from the UK was 33.4 percent and this was recorded in January. In tandem with the US market, the
lowest level of stay-over arrivals was recorded in September. Visitor expenditure related to the UK
market rose by 6.3 percent to $288.9 million.
A sustained upward trend was observed in the Caribbean market, with a significant 14.0 percent
growth over 2004. This market achieved the largest growth as compared to the performance of St.
Lucia’s other major source markets. The Caribbean market was largely driven by various events
such as St. Lucia Jazz and the hosting of cricket matches. Special travel packages from Caribbean
airlines such as LIAT and the St. Lucia Tourist Board’s ‘Simply Socking’ promotion which ran from
October to December, contributed heavily to the high percentage increase during the last quarter
of 2005. The Caribbean which historically is a relatively small market, registered stay-over arrivals
that were comparable in number to stay-over arrivals from the UK market; the second largest source
market.
The Canadian market continued to remain a winter market, with arrivals between the months of
January and March accounting for 48.5 percent of total Canadian arrivals into St. Lucia. Significant
growth was recorded in the Canadian market with a 7.8 percent increase over the prior year.
Occupancy
There was a 6.8 percent points increase in the average occupancy rate in 2005. This trend mirrors
the growth observed in the number of stay-over arrivals. The all-inclusive category recorded
moderate growth in hotel occupancy, while the conventional hotels and small properties showed
considerable improvements of 14.2 percent points and 5.8 percent points respectively. The months
of February and March recorded the highest occupancy levels, while the lowest level of hotel
ocuupancy occurred in September 2005.

-22-
Other Arrivals
In 2005, a significant decline of 18.0 percent to 394,431 was noted in the number of cruise visitors.
This is primarily due to the closure of the northern wharf as the St. Lucia Air and Sea Ports
Authority implemented a renovation project in that area. The closure of this wharf adversely
impacted cruise arrivals, resulting in a 21.3 percent reduction in the number of cruise ship calls in
2005. The cruise arrivals in 2005 were on par with the 2003 arrival levels of approximately 400,000.
In contrast, yachting arrivals into St. Lucia increased considerably by 21.9 percent to 27,464 in 2005
as compared to 2004. This suggests that St. Lucia is steadily gaining recognition as a prime yachting
destination within the Caribbean. The greastest level of yachting arrivals was recorded in
December, mainly due to the hosting of the annual Atlantic Rally for Cruisers.
AGRICULTURE
The performance of the
agriculture sector continued to
display great volatility during the
review period. Real GDP growth
in the sector fell by 22 percent in
2005, following marginal growth of
1.8 percent in the previous year.
The largest contraction, 36.2
percent, was seen in the banana
sub-sector. However, there were
also significant declines in value
added in the non-traditional crops sub-sector of 16.9 percent and the fisheries sub-sector of 6.8
percent. By contrast, the livestock sector expanded for the second year, growing by 2.2 percent. In
keeping with its recent struggles, the agriculture sector’s contribution to real GDP fell to 3.4 percent
with banana contributing a mere 1.3 percent.
Growth in the sector continued to be retarded by a number of factors. The historically high credit
risk associated with financing agriculture has made credit largely inaccessible to farmers. This has
-23-
hindered medium to long term investment leaving many farmers unable to provide for working
capital needs. This trend continued during the review period, with commercial bank credit to the
sector declining for the fifth consecutive year and accounting for a mere 1.2 percent of total
commercial bank credit.
As a result of the limited access to finance, the sector finds it increasingly difficult to contend with
other factors adversely impacting production, particularly the rising cost of agricultural inputs.
Additionally, the absence of formal marketing arrangements and weak farmers’ associations,
particularly in the livestock and non-traditional sub-sectors, had a dilatory effect on production.
Bananas
During 2005, major developments within the international banana market were centred on the
conversion of the EU banana import regime from a multi quota and tariff regime to a single tariff
structure. This was in keeping with a 2001 agreement between the EU, the US and Ecuador to
reform the banana regime by January 2006. Therefore in January 2005, the EU proposed an increase
in the bound duty on bananas imported from non ACP countries from €75 per tonne to €230 tonne
as part of a new tariff only regime.
This initial proposal was below the tariff of €275 per tonne that ACP countries had requested but
far above the tariff of €75 per tonne that Latin American countries had advocated. Consequently,
the EU proposal was challenged by Latin American countries before the WTO and arbitration was
initiated in March 2005. This process ended in a ruling in favour of the Latin countries, with the
arbitrators citing the inability of the proposed system to maintain market access for Latin American
suppliers.
Subsequently, a proposed tariff of €187 per tonne and a quota of 775 000 tonnes on ACP banana
imports was also rejected as failing to rectify the issues. Therefore, in November of the review
period, the EU adopted Council Regulation 1964/2005 which established a tariff level of €176 per
tonne payable by non ACP countries along with a zero duty quota of 775 000 tonnes for ACP
countries. Notwithstanding this, Panama and Honduras have signalled their intention to challenge
this regime.

-24-
Production
Banana production by the Windward Islands fell by 25.7 percent to 57,969 tonnes. Exports from St.
Lucia accounted for 52 percent of total Windward Island exports and fell by 29.1 percent to 30,007
tonnes while export revenue fell by 23 percent to $41.5 million.
The reasons for the decline in
production during 2005 were
threefold. First, the destruction of an
estimated 1,400 acres of banana fields
during the passage of Hurricane Ivan
in September 2004 affected
production, particularly in the first
quarter. Moreover, the effect of this
hurricane was magnified because the
majority of acreage destroyed was in
the productive Roseau Valley.
In addition, difficulties in the management of yellow sigatoka or leaf spot disease continued,
particularly during the first quarter, because insufficient funds inhibited the purchase of materials
used to control the disease. Consequently, there was a decline of 5,900 tonnes during the first
quarter of the review period. Subsequently, WIBDECO provided a grant of $1.3 million which led
to an improvement in disease management.
Thirdly, higher input prices and a loss in income to farmers who had sustained crop damage during
the hurricane led to general deterioration in field maintenance/crop husbandry. The overall result
of these factors was the abandonment of a further 500 acres of land under banana cultivation.
Notwithstanding the decline in production, there continued to be investment into the banana sector.
To date the Banana Emergency Recovery Unit (BERU) has expended $11.6 million, which was
financed through the Banana Emergency Recovery Plan and the Banana Rehabilitation Program.
Approximately one third of this amount was spent during the review period on land preparation
activities, the tissue culture program and leaf spot monitoring.

Data estimated for the months of November and December.8
-25-
Non-Traditional Crops
Estimates of production of non-
traditional crops indicate a 7.8 percent
fall in production to 4,435 tonnes,
valued at $9.2 million. Exports of such
crops fell by 2.9 percent to an estimated
2,208.3 tonnes, valued at $2.6 million.8
For the fifth consecutive year,
preliminary data indicate that domestic
purchases of non-traditional crops
declined. Purchases by both
supermarkets and hotels fell by 13.1 percent to 2,226.7 tonnes which were valued at $6.6 million, this
follows a 8.0 percent decline in the previous review period.
The primary source of the decline was an 11.4 percent fall in purchases by supermarkets which
account for approximately two thirds of all domestic purchases. Purchases by supermarkets fell by
187 tonnes to 1,457.3 tonnes with fruit and tree crops (28.0 percent of purchases) declining by 17.6
percent. The purchase of vegetables (31 percent of purchases) also fell by 4.1 percent.
Notwithstanding the decline, favourable prices led to an 8.4 percent increase in revenue from
supermarkets of $4.0 million, indicative of efforts to encourage higher quality produce.
Hotel purchases also fell by 16.0 percent to 769.4 tonnes, despite an increase in stay-over arrivals.
This highlights the weak linkage between the two sectors, which was exacerbated the poorly
organised marketing structures that exist in the non-traditional sector.
Fisheries
In contrast with developments in the previous year, fish landings in 2005 fell by 8.8 percent in 2005
to 1,386.2 tonnes, valued at $15.8 million. The magnitude of the catch continued to be heavily
influenced by variability in weather conditions that impacted on the migratory pattern of pelagic
species. The adverse impact of weather is exacerbated by the lack of long liner fishing capacity and
other technologies that would develop mid water fishing. Of the 680 registered vessels in 2005, only

Data from the application of import licenses for which 20 percent of demand by imports for chicken and9
40 percent of pork must be satisfied from the local market.
-26-
5 were long liners. The majority (67 percent or 456) were
pirogues while 20 percent or 134 were canoes.
An analysis of landings by species indicates a decline in all
major categories with the exception of tuna and flying fish.
Tuna accounted for 34 percent of all landings and grew by
11.4 percent to 465.7 tonnes while landings of flying fish,
which display a large degree of natural variability,
rose from 10.6 tonnes to 71.5 tonnes. After
expanding significantly in 2004, the landings of
dolphin and that of wahoo/kingfish fell by 47.2
and 29.7 percent respectively.
During the review period, Vieux Fort and
Dennery continued to be the largest landing sites with 22 and 20 percent of total catch, respectively.
Landings at all major sites declined with the exception of Choiseul, Soufriere and Gros Islet which
increased by 4.2, 21.5 and 12.5 percent respectively. At the end of the review period, there were
2,109 registered fishers, a decline of 45. The largest share of fishers, 18.0 percent, was recorded in
Vieux Fort, followed by Castries and Dennery with 12.0 percent each of registered fishers
respectively.
Livestock
Production by the livestock sector continues to be hindered by the lack of an abattoir on the island
which would allow for the application of standards and stronger linkages with the tourism sector.
Despite this however, available data indicate an improvement in output from the sector.
The island continued to be self sufficient in egg production as during the review period, 1,113 dozen
eggs valued at $6.8 million were produced. This represents an increase of 21.2 percent over the
pervious year. Nonetheless, there were problems with both the quantity and quality of feed which
caused shortages at the peak demand period in December.
After a dismal performance for the last four years it is estimated that broiler production rose by 469
-27-
percent to 976.6 tonnes which was valued at $8.1 million. This is in line with strong domestic
demand
Pork production is also estimated to have increased significantly during the review period.
Production increased by 34 percent to 131.6 tonnes and generated revenue of $1.5 million. However,
there are indications that this underestimates the level of production since purchase of pork outside
of the formal wholesale and retail trade sectors has risen in the past three years.
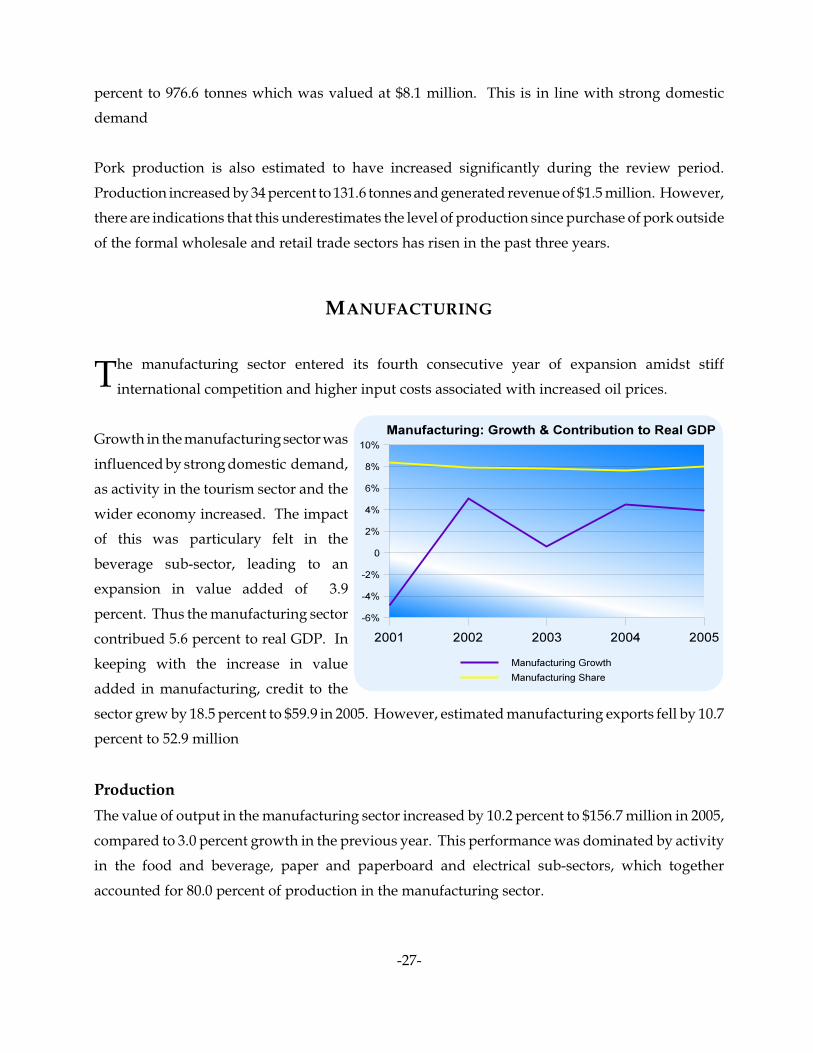
MANUFACTURING
The manufacturing sector entered its fourth consecutive year of expansion amidst stiff
international competition and higher input costs associated with increased oil prices.
Growth in the manufacturing sector was
influenced by strong domestic demand,
as activity in the tourism sector and the
wider economy increased. The impact
of this was particulary felt in the
beverage sub-sector, leading to an
expansion in value added of 3.9
percent. Thus the manufacturing sector
contribued 5.6 percent to real GDP. In
keeping with the increase in value
added in manufacturing, credit to the
sector grew by 18.5 percent to $59.9 in 2005. However, estimated manufacturing exports fell by 10.7
percent to 52.9 million
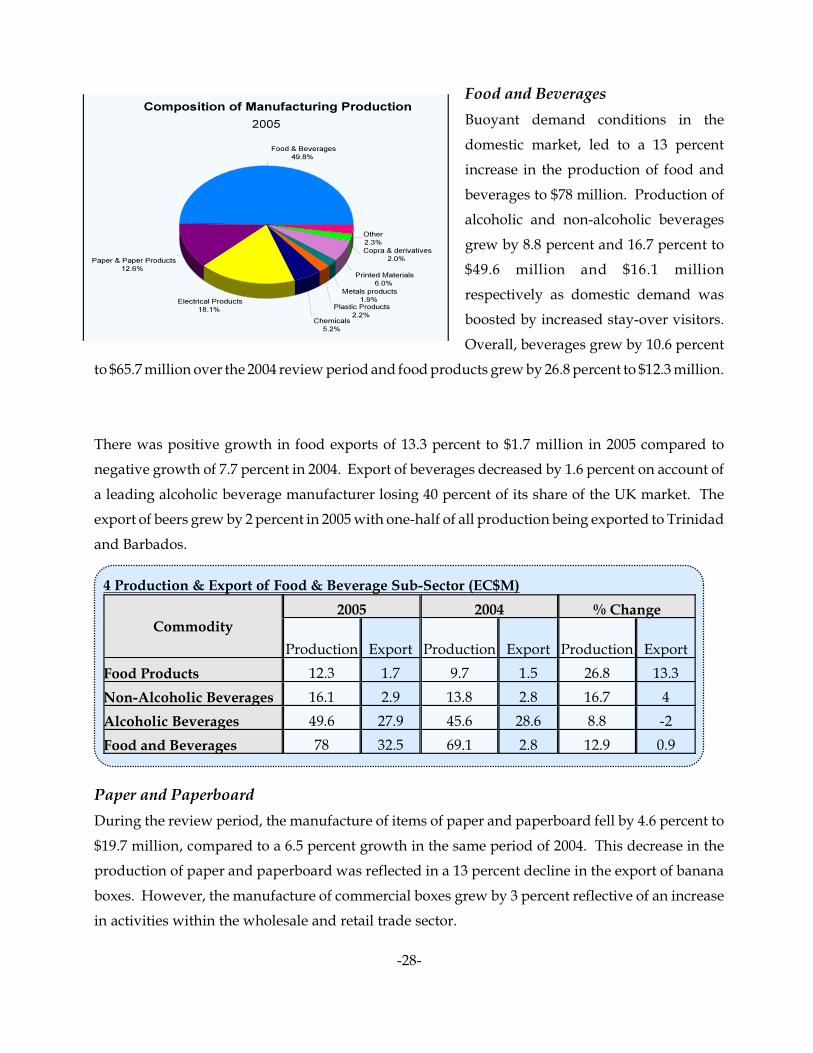
Production
The value of output in the manufacturing sector increased by 10.2 percent to $156.7 million in 2005,
compared to 3.0 percent growth in the previous year. This performance was dominated by activity
in the food and beverage, paper and paperboard and electrical sub-sectors, which together
accounted for 80.0 percent of production in the manufacturing sector.
-28-
Food and Beverages
Buoyant demand conditions in the
domestic market, led to a 13 percent
increase in the production of food and
beverages to $78 million. Production of
alcoholic and non-alcoholic beverages
grew by 8.8 percent and 16.7 percent to
$49.6 million and $16.1 million
respectively as domestic demand was
boosted by increased stay-over visitors.
Overall, beverages grew by 10.6 percent
to $65.7 million over the 2004 review period and food products grew by 26.8 percent to $12.3 million.
There was positive growth in food exports of 13.3 percent to $1.7 million in 2005 compared to
negative growth of 7.7 percent in 2004. Export of beverages decreased by 1.6 percent on account of
a leading alcoholic beverage manufacturer losing 40 percent of its share of the UK market. The
export of beers grew by 2 percent in 2005 with one-half of all production being exported to Trinidad
and Barbados.
Paper and Paperboard
During the review period, the manufacture of items of paper and paperboard fell by 4.6 percent to
$19.7 million, compared to a 6.5 percent growth in the same period of 2004. This decrease in the
production of paper and paperboard was reflected in a 13 percent decline in the export of banana
boxes. However, the manufacture of commercial boxes grew by 3 percent reflective of an increase
in activities within the wholesale and retail trade sector.
Commodity2005 2004 % Change
Production Export Production Export Production Export
Food Products 12.3 1.7 9.7 1.5 26.8 13.3
Non-Alcoholic Beverages 16.1 2.9 13.8 2.8 16.7 4
Alcoholic Beverages 49.6 27.9 45.6 28.6 8.8 -2
Food and Beverages 78 32.5 69.1 2.8 12.9 0.9
4 Production & Export of Food & Beverage Sub-Sector (EC$M)

-29-
Production of Electrical Items
Production of electrical items grew by 15.3 percent to $28.3 million in 2005 a decline of over 50
percent compared to the growth of 2004. This sub-sector continues to perform favourably due to
St Lucia’s proximity to the US relative to its main competitor, China. However, the relatively slow
recovery in the telecommunications manufacturing sector in the US has militated against faster
growth in the industry. Despite these challenges, the export of electrical items grew by 8 percent
compared to a 6.5 percent increase in 2004.
Copra & Copra Derivatives
Production of copra and copra derivatives declined by 36.1 percent to $3.1 million in the review
period compared to positive growth of 3.3 percent in 2004. This mirrored the decline in banana
production since the production of copra is done mainly by banana farmers. Another major
difficulty facing the copra industry is that most farmers prefer selling jelly coconuts since the returns
are higher and involves less effort than the production of copra.
Manufacture of Other Items
The production of other items continued to experience positive growth contributing to 15.3 percent
of overall production. Basic industrial items grew by 54 percent ($1.29 million), along with other
chemicals which grew by 43.4 percent to $6.9 million. Production of plastic materials grew by 4.5
percent to $3.4 million and printed material decreased by 3.7 percent to $2.9 million. There was a
marginal decline in the production of plastic material while the manufacturing of wood and wood
products, despite import restrictions, fell by 14.6 percent to $0.069 million in the review period.

-30-
CONSTRUCTION
Despite significant increases in the cost of
building materials and periodic shortages
in cement, the construction sector recorded
substantial growth of 10.4 percent in 2005
following a growth of 1.0 percent in the
previous year. Consequently, construction's
share of to real GDP increased from 7.6
percent in 2004 to 8.0 percent. This
performance was influenced by significant
private sector investment, especially in the
tourism sector, housing construction and
Government investment in infrastructure.
During 2005, the level of tourism investment within the domestic economy was unprecedented.
This high level of investment can be associated with the International Cricket World Cup which will
be partly hosted by St. Lucia in 2007. Many existing hotels and new developments have invested
in an effort to benefit from the package of incentives that were specifically designed to increase
capacity for the event.
Public Sector Construction
Public sector construction expenditure more than doubled to $134.5 million, after recording a decline
of 9.2 percent in 2004. This was attributed mainly to a 91.7 percent increase in Central Government
expenditure to $104.5 million. This reflects significant expenditure on major road rehabilitation
projects such as the completion of the RDP, the Tertiary Roads Programme and the East Coast Road
Rehabilitation Project.
Statutory corporations also increased their expenditure on capital projects to $30.3 million, primarily
reflecting the rehabilitation of the Northern Wharf of the Castries port. The increased expenditure
by the St. Lucia Air and Sea Ports Authority (SLASPA) led to an increase in the share of the statutory
bodies' construction to total public expenditure to 22.5 percent despite a reduction in construction
expenditure by the other statutory bodies.
-31-
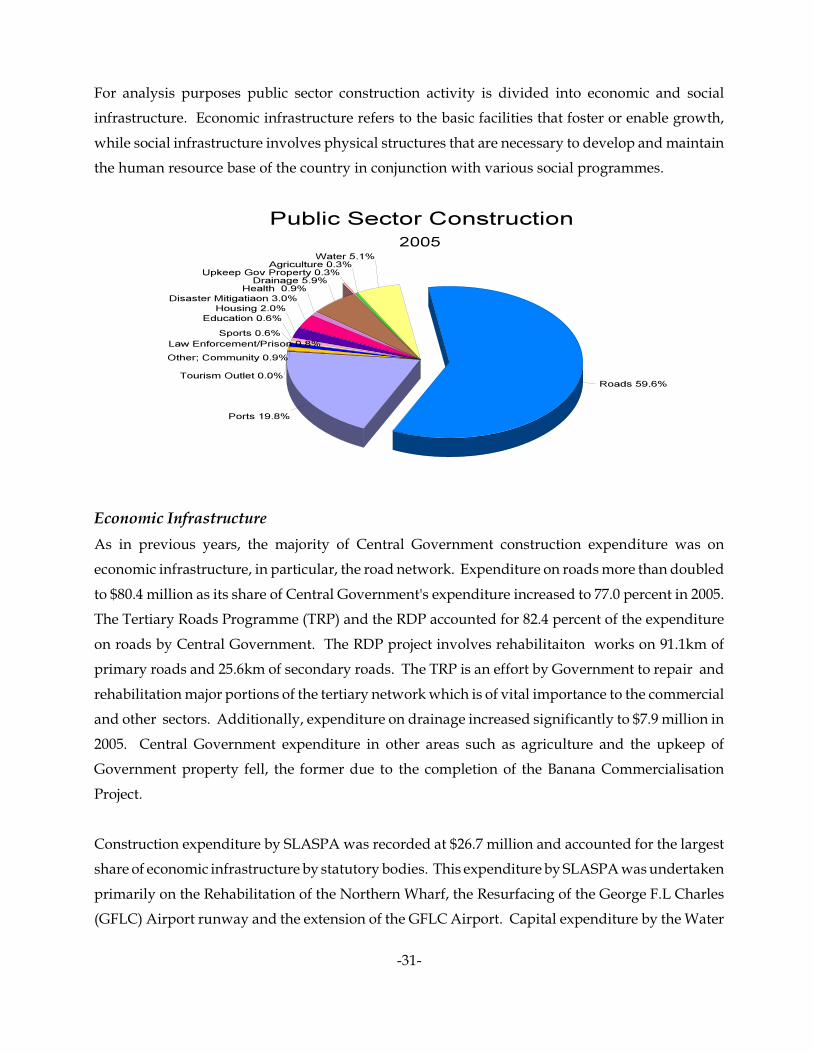
For analysis purposes public sector construction activity is divided into economic and social
infrastructure. Economic infrastructure refers to the basic facilities that foster or enable growth,
while social infrastructure involves physical structures that are necessary to develop and maintain
the human resource base of the country in conjunction with various social programmes.
Economic Infrastructure
As in previous years, the majority of Central Government construction expenditure was on
economic infrastructure, in particular, the road network. Expenditure on roads more than doubled
to $80.4 million as its share of Central Government's expenditure increased to 77.0 percent in 2005.
The Tertiary Roads Programme (TRP) and the RDP accounted for 82.4 percent of the expenditure
on roads by Central Government. The RDP project involves rehabilitaiton works on 91.1km of
primary roads and 25.6km of secondary roads. The TRP is an effort by Government to repair and
rehabilitation major portions of the tertiary network which is of vital importance to the commercial
and other sectors. Additionally, expenditure on drainage increased significantly to $7.9 million in
2005. Central Government expenditure in other areas such as agriculture and the upkeep of
Government property fell, the former due to the completion of the Banana Commercialisation
Project.
Construction expenditure by SLASPA was recorded at $26.7 million and accounted for the largest
share of economic infrastructure by statutory bodies. This expenditure by SLASPA was undertaken
primarily on the Rehabilitation of the Northern Wharf, the Resurfacing of the George F.L Charles
(GFLC) Airport runway and the extension of the GFLC Airport. Capital expenditure by the Water

-32-
and Sewerage Company (WASCO), the sole provider of potable and sewage facilities island wide,
declined marginally by 1.6 percent to $1.5 million. The main projects undertaken by WASCO were
the replacement and upgrade of water mains and the Scada project which included the installation
of telemetry systems at various water plants.
Social Infrastructure
Central Government construction expenditure on social infrastructure fell in 2005 by 2.1 percent to
$10.0 million. The decline in social infrastructure was partly due to delays in receiveing grant funds
associated with changes in EU procedures. A decline in expenditure was recorded in the area of
housing, education and community development. Expenditure on housing declined by 52.9 percent
to $1.4 million. Expenditure on education also declined by 59.1 percent to $0.84 million. However,
expenditure on health almost doubled to $1.3 million in 2005, as it was an area of priority for the
Government in 2005. The two major health sector projects accounting for this increase were the
Clinics Refurbishment Project, Emergency Recovery Programme and preliminary works on the New
Psychiatric Facility. Expenditure on disaster mitigation also recorded a significant increase to $4.1
million as Government attempt to ensure infrastructural stability in the event of natural disasters.
There was an increase in construction expenditure in the area of law enforcement to $0.26 million.
Construction expenditure on social infrastructure by statutory bodies declined. The National
Housing Corporation (NHC) recorded a decline of 52.04 percent to $1.4 million. The main
construction project undertaken by NHC was phase three of the Black Bay housing Project and
Phase two of the Beausejour housing project. Construction expenditure by the National Insurance
Property Development & Management Company (NIPRO) also fell by 35.9 percent to $0.83 million
in 2005. Due to the decrease in expenditure on new police and fire stations by NIPRO, the share of
law enforcement to total public expenditure decreased to less than 1.0 percent to $1.09 million in
2005.
Private Sector Construction
Data on imports of construction material, building applications and credit to the private sector
reflected buoyancy in both residential and commercial construction for the review period.
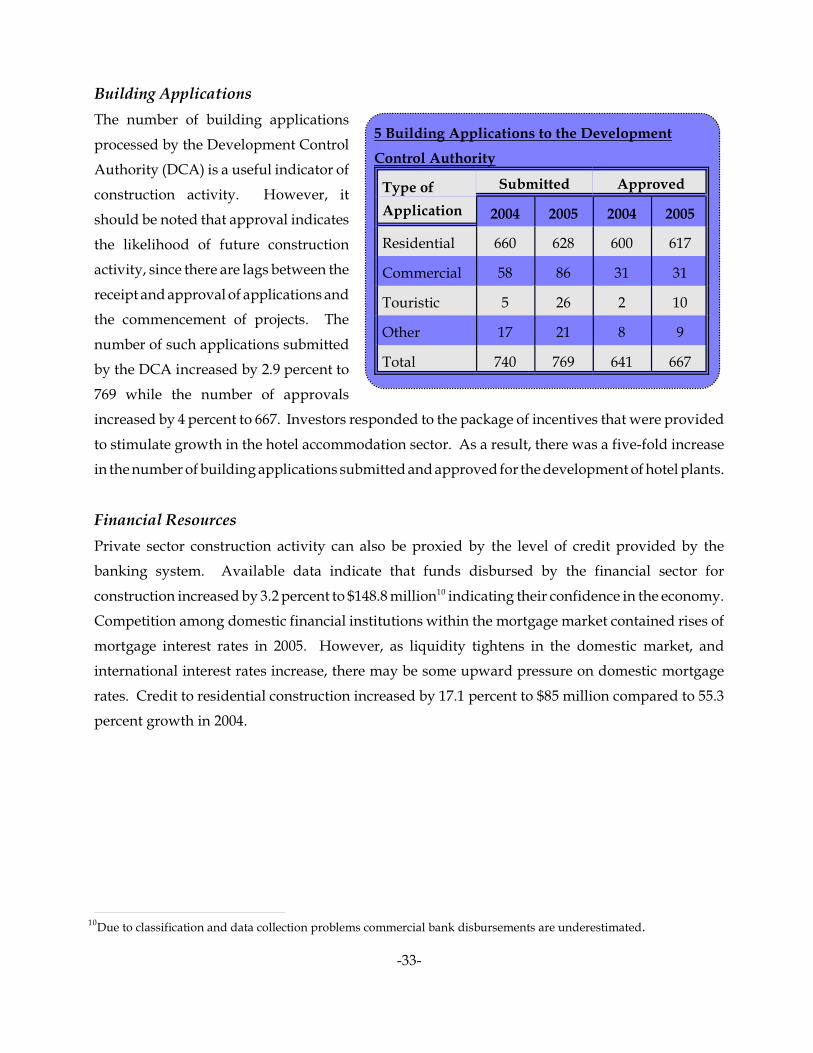
Due to classification and data collection problems commercial bank disbursements are underestimated. 10
-33-
Building Applications
The number of building applications
processed by the Development Control
Authority (DCA) is a useful indicator of
construction activity. However, it
should be noted that approval indicates
the likelihood of future construction
activity, since there are lags between the
receipt and approval of applications and
the commencement of projects. The
number of such applications submitted
by the DCA increased by 2.9 percent to
769 while the number of approvals
increased by 4 percent to 667. Investors responded to the package of incentives that were provided
to stimulate growth in the hotel accommodation sector. As a result, there was a five-fold increase
in the number of building applications submitted and approved for the development of hotel plants.
Financial Resources
Private sector construction activity can also be proxied by the level of credit provided by the
banking system. Available data indicate that funds disbursed by the financial sector for
construction increased by 3.2 percent to $148.8 million indicating their confidence in the economy.10
Competition among domestic financial institutions within the mortgage market contained rises of
mortgage interest rates in 2005. However, as liquidity tightens in the domestic market, and
international interest rates increase, there may be some upward pressure on domestic mortgage
rates. Credit to residential construction increased by 17.1 percent to $85 million compared to 55.3
percent growth in 2004.
Type of
Application
Submitted Approved
2004 2005 2004 2005
Residential 660 628 600 617
Commercial 58 86 31 31
Touristic 5 26 2 10
Other 17 21 8 9
Total 740 769 641 667
5 Building Applications to the Development
Control Authority

-34-
Imports of Construction Materials
Despite increases in the prices of some
components, sample data indicate that
construction imports grew by 21
percent to $93.6 million in 2005
compared to a 15 percent increase in
2004.
The price of cement increased from
$14.70 and $15.0 to $15.0 and $16.1 for
c e m en t f rom Car i com a n d
non-Caricom countries respectively.
Notwithstanding the increase in price
and the supply problems experienced by importers, the import value of cement increased by 33.1
percent to $16.1 million in 2005 in keeping with increased construction in both private and public
sectors. Correspondingly, the value of wood imports increased by 42.1 percent in 2005 to $22.8
million.
Building
Materials
2004 2005 Change
Cement 12,097,096 16,103,713 33.12%
Sand 3,445,646 2,515,002 -27.01%
Wood 16,032,256 22,794,817 42.18%
Prefabricated
Materials
2,109,134 1,809,086 -14.23%
Other 43,701,997 50,387,854 15.30%
Total 77,388,133 93,612,477 20.96%
6 Imports of Construction Materials

-35-
TRANSPORTATION
The transport sector's recorded its third
consecutive year of growth in 2005, with value
added rising by 12.4 percent.
Consequently, all three components of transport
(air, road and sea) recorded increases in excess of
8.0 percent. As a result the sector's contribution to
real GDP increased slightly to 10.9 percent. This
was consistent with growth in the hotel and
restaurant and the wholesale and retail trade
sectors.
Air Transport
The tourism industry is an important contributor to value added in the air transport sub-sector.
Spurred by 6.5 percent increase in stay-over arrivals, the air transport sub-sector's share of real GDP
increased to 2.0 percent while its value added expanded by 18.0 percent.
The total number of aircraft movements (arrivals and departures) at St. Lucia's two airports fell
slightly to 44,461. This was attributable to a decline in the number of movements at George F.L.
Charles, which more than offset an increase in movements at Hewanorra. Despite, the decline in
the number of movements at George F.L. Charles, the airport accounts for about 73.0 percent of
movements.
Consequently, the total number of
passengers handled decreased slightly to
813,445, as a result of a decline in
passengers embarked and disembarked.
The George F.L. Charles airport because of
its smaller aircraft capacity, handled only
51.5 percent of all passengers.

-36-
Total scheduled service landings (arrivals and departures) decreased by 9.5 percent to 21, 930.
Non-scheduled service landings and other service landings both increased by 11.4 percent and 7.0
percent to 20,048 and 2,483 respectively.
Sea Transport
In keeping with bouyant activity in wholesale and retail trade, this sub-sector grew by almost 24.2
percent and contributed almost 2.0 percent to real GDP in 2005. Total volume of cargo traffic at
Castries and Vieux-Fort decreased by 8.4 percent to 723, 701 tons. Port Castries accounted for 77.3
percent of total cargo traffic, as well as 88.8 percent of import volumes while Port Vieux-Fort
accounted for 85.9 percent of export volumes, attributable mainly to banana exports.
There were varied movements in the different types of cargo handled by SLASPA. The volume of
break bulk cargo landed (including cement, paper rolls, animal feed and lumber) increased by 2.5
percent to 160,526 tons while loaded cargo
(including waste paper, aggregate and bananas)
decreased by 38.6 percent to 98,358 tons. The
volume of dry/liquid landed decreased by 28.8
percent to 129,096 tons while volume loaded
increased by 98.8 percent to 1,654 tons. The
volume of containers loaded and landed
increased by 11.8 percent and 30.0 percent to
23,949 and 10,802 twenty foot equivalent units
containers (TEUS) respectively.
Both ports experienced a decrease in vessel calls. Port Vieux-Fort recorded 411 vessel calls a 4
percent decrease from 2004; there were no cruise ship calls. Vessel calls to Port Castries fell by 3.1
percent to 1,309 with 395 regional cruise ship calls and 258 international cruise ship calls. Yacht
throughput at Rodney Bay Marina experienced a decline of 5.3 percent to 4,009.
Road Transport
A steady increase in the stock of commercial vehicles resulted in an estimated 8.2 percent growth
in the transport sector while boosting its share of real GDP to almost 7.0 percent.

-37-
The stock of vehicles registered has continued to grow since 1997, increaseing by 5.6 percent to
44,167, following a 4.4 percent increase in 2004. New vehicles account for the majority of the
registered fleet; they accounted for 99.3 percent of the 2,131 vehicles added to the stock in 2005.
Private vehicles continued to account for the largest share of the total (56.6 percent) and grew by 6.5
percent to 25,013. Goods vehicles, the second largest category grew by 4.1 percent to 10,670. The
number of passenger vans decreased slightly by 0.2 percent to 3,485 whilst taxis/hired vehicles grew
by 15.1 percent to 2,544.
COMMUNICATIONS
Value added by the telecommunications
sector expanded for the eighth
consecutive year with significant growth of
7.3 percent in 2005. This follows growth of
4.6 percent in the previous review period.
As a result its contribution to real GDP
edged up to 11.3 percent making it the
fourth largest contributior to value added in
the economy.
During the review period there was some
consolidation in the mobile sub-sector which saw the acquisition of Wireless Venture Ltd / Cingular
Wireless by Digicel St. Lucia Ltd.
Activity in the cellular, internet and cable sub-sectors continued to grow albeit at a slower rate
relative to 2004. This was particularly evident in the cellular sub-sector which, though increased
in size, saw for the first time an ebb in total activity as demonstrated by the number of mobile
minutes.
The mobile telecommunication sub-sector continued to expand with a 16.3 percent increase in the
number of subscriptions to 112,638. However, this was accompanied by a 9.6 percent decrease in
cellular minutes sold.
The internet and cable TV sub sectors grew by 39.9 and 24 percent to 10,071 and 24,798 subscribers

-38-
respectively. However, the land line component continued to decline in both subscriber base and
activity, a trend which began with the introduction of the new mobile companies in 2003. Of the
68.1 million minutes sold, local calls accounted for 82.3 percent. These subscriptions fell by 18.1
percent from 48,713 to 39,892 in 2005.
Capital investment in telecommunciations infrastructure was estimated at $28.7 million for the
period under review.
Postal Services
Nothwithstanding the increase in electronic communications, the postal service continues to play
an important role in the telecommunications sector. During 2005 this was reflected by an increase
in the volume of both domestic and internation mail handled by the postal service. The volume of
domestic mail handled increased by 3.2 percent to 2.4 million items while international mail for the
same period increase by 9.0 percent to 0.64 million items.
The increased activity in 2005 resulted in a gross profit of $1.2 million. Gross revenue was recorded
at $5.1 million, 66.7 percent of which came from the sale of stamps, the highest revenue generating
item.
ENERGY
The energy sector in St Lucia is influenced
significantly by developments in the
i n t e rn a t i o n a l p e t r o l e u m m a r k e t .
Developments in international oil prices have
been influenced by a number of factors
including, increased supply side pressure and
increasing global demand. Supply side
pressures in 2005 included political instability
in oil producing countries and the impact of
hurricane Katrina on refinery capacity. On
the demand side, there is growing demand for oil from emerging economies such as China and
India, as their economies continue to expand. These supply and demand side factors have placed

-39-
significant upward pressures on international oil prices.
In 2005 the WTI increased from an average of US$46.7 per barrel in January to US$59.4 per barrel
in December, representing growth of 27.2 percent.
Electricity
There was a 4.8 percent increase to 323,922 Kilowatt hours (KWh) in electricity generated by St.
Lucia Electricity Services Limited (LUCELEC) during the review period. Increases in electricity
consumption were noted in all categories, with the exception of the industrial segment. During 2005
the electricity sub-sector’s contribution to real GDP was 4.3 percent
Domestic consumption moved up by 3.2
percent with the average number of
domestic consumers increasing by 2.3
percent, reflecting increased use of
electricity by domestic users to 98,917
Kilowatt hours. Commercial users
registered a 6.2 percent increase in the use
of electricity to 101,597 Kilowatt hours,
consistent with very intensive use as the
number of commercial customers grew by
only 3.1 percent over the same period.
At 56,884 Kilowatt hours a moderate
increase in hotel usage was experienced (2.6 percent). This reveals a lower rate of consumption than
the previous year as the number of hotels increased by 8.3 percent to 52.
After an intensive street lighting programme during the 2004 financial year, efforts were reduced
significantly for 2005. Nevertheless with 7,480 Kilowatt hours, an increase of 14.9 percent in
consumption from street lighting was recorded.
LUCELEC’s use of electricity increased by a significant 10.5 percent to 13,407 Kilowatt hours and
total electricity sales for the period increased by 4.01percent to 277,400 Kilowatt hours. After a 9.9
percent decline in 2004, the line loss rate increased by 8.8 percent to 33,115 Kilowatt hours in 2005.

-40-
During the review period consumers paid
significantly more for fuel compared to prior
years. The average price paid to LUCELEC’s
main supplier increased by 55 percent to
$5.87 per gallon. As a result, the fuel
surcharge increased by 42.0 percent to 32.1
cents per unit. Fuel price and fuel surcharge
continue their movements in line with
international oil prices.
Alternative Forms of Energy
The Government of Saint Lucia is currently working on a National Energy Policy. This policy will
create the appropriate enabling environment for the growth and development of the local energy
sector. The policy will, inter alia, encourage diversification in the energy base by facilitating the
development of new and renewable forms of energy. This is beneficial to our sustained
development as it promotes stability, reliability and security of our energy supply. Alternative
forms of energy help to safeguard against external price fluctuations on the world oil market and
develop indigenous resources and technological base.
Geothermal Energy
Work into the development of geothermal energy on St. Lucia has been continuing and some
significant strides were achieved within the past year. In 2004, the Government signed a
Memorandum of Understanding with the United Network of the Eastern Caribbean (UNEC) to
undertake further work into geothermal energy exploration. This should assist with the
development of a geothermal energy plant once an economically exploitable resource has been
discovered. UNEC will undertake to finance this stage of the exploratory work with the
Government providing support and creating an enabling environment for the initiative.
The Government is also receiving assistance from the Organization of American States (OAS) in the
area of geothermal energy development. St. Lucia is one of three countries receiving support under
the Geocaraibes Project. This project is designed to catalyze commercial geothermal energy by
providing support in policy/regulatory reform and technical studies. Under this project, St. Lucia
is currently working on a geothermal resource development bill that will govern the development
-41-
of geothermal energy on the island.
Solar Energy
St. Lucia has benefited under the United Nations Industrial Development Organization through the
Caribbean Solar Financing project. This initiative provides funding to low-income households
through the local credit union league to enable them to purchase solar water heaters.
Wind Energy
The Government has continued to support the development of wind energy on island and is
currently involved in helping LUCELEC to acquire 71 acres of land to set up the wind farm.
Equipment has been provided to begin wind measurements at a site on the proposed wind farm
with the assistance of the Caribbean Renewable Energy Development Project (CREDP). Data
gathering has already begun.
Importation of Commercial Energy
During 2005 importation of commercial energy increased by 7.6 percent to 716,209 Barrels of Oil
Equivalent (BOE) . This was despite the fact that spraytex, a chemical used to control leaf spot2
disease was not imported in 2005.
During the review period, importation of diesel fell by 0.5 percent to 120,668 BOE and that of
kerosene increased by 18.1 percent to 200,328 BOE. Imports of Liquified propane gas (LPG) rose
by 7.5 percent to 61,623 BOE, suggesting an increase in its demand. Importation of unleaded
gasoline (ULG) rose by 5.4 percent to 333,590 BOE. This is consistent with the trend where an
increase in ULG imports in any one year is followed by a decrease in the following year.
Government continues to regulate the pricing system for petroleum products, keeping retail prices
constant throught adjustments in consumption taxes to reflect international oil price changes. Due
to spiraling oil prices, the Government in August 2005 adjusted retail prices upwards in order to
reduce the rapidly eroding consumption tax revenues. The retail price of unleaded gasoline and
diesel were increased to $9.50 and $8.75 per gallon respectively. However, the prices of kerosene
and LPG remained at $5.20 per gallon and $1.50/$1.41 per pound, respectively and are effectively
subsidized by Government whenever the international oil price surpasses $49 per barrel.

-42-
CHAPTER FIVE
CENTRAL GOVERNMENT FISCAL OPERATIONS
Preliminary estimates reveals that
Central Government fiscal operations
improved significantly in 2005/06. The
current surplus increased from 3.3 percent
to 3.5 percent of GDP or $83.0 million.
Signifcant growth in receipts from all
major tax sources was recorded, while
growth of most categories of current
expenditure were moderate. Capital
expenditure continued to be affected by
delays arising from implementation and
non-receipt of funds. However, prelimiary
estimates indicate that capital expenditure
declined by 3.8 percent to $158 million. The overall deficit narrowed by 21.5 percent to $70.4 million
equivalent to 3.0 percent of GDP.
Revenue Performance
Total revenue and grants increased by 7.7 percent, moving from $557.3 million in 2004/05 to $600.2
million in 2005/06, as a result of strong growth in revenue. Current revenue increased by 7.0 percent
to $595.64 million in 2005/06 or 25.2 percent of GDP, following an increase of 13.2 percent in
2004/05.
Taxes on Income and Property
During the 2005/06 fiscal year direct tax receipts on income and property grew by approximately
13.0 percent to $153.8 million. Despite a reduction in the corporate tax rate from 32.0 percent to 30.0
percent in 2005, revenue collection from corporations increased by 14.2 percent in 2005/06 to $62.4
million consistent with higher levels of economic activity.

-43-
Taxes on personal income
grew by 17.5 percent to
$58.4 million reflecting a
general increase in
employment and increase
in incomes resulting from
the negotiation of a
number of collective wage
agreements. Property tax
revenue increased by 33.2
percent to $4.86 million
following a contraction of
4.6 percent in 2004/05,
indicating a higher level
of compliance associated with the ongoing valuation exercise being conducted by the Inland
Revenue Department.
Revenue from withholding taxes more than doubled during 2005/06 rising from $3.7 million to $7.5
million. This is consistent with the strong performance of the construction sector in 2005.
Taxes on Goods and Services
During the fiscal year 2005/06, receipts from taxes on goods and services fell by 1.7 percent to $199.8
million, after recording growth of 6.7 percent in the previous fiscal year. Revenue yields from
consumption tax on imports contracted by 10.7 percent to $104.7 million, mainly reflecting the
decline in receipts associated with consumption tax on petroleum products. International petroleum
prices increased by an average of 27.2 percent over the period January to December 2005. Given that
the Government did not adjust retail prices in order to minimize consumption tax losses, this
resulted in Government subsidizing the supply of LPG and kerosene.
In keeping with growth in stay over arrivals, receipts of hotel accommodation tax grew by 10.6
percent to $29.04 million during the review period. The performance of this tax continued to be
affected by compliance issues. Ongoing negotiations between the St Lucia Hotel and Tourism
Association and the Inland Revenue Department are expected to address this concern.

-44-
Revenue from licences contracted by 7.5 percent to $15.7 million. This follows an increase of 1.8
percent in the previous fiscal year. This contraction was attibuted to the receipt of arrears during
the previsous fiscal year. However, there was an increase of 11.4 percent in the collection of stamp
duties consistent with vibrant activity in the construction sector.
Revenue from cellular tax increased by 28.7 percent to $7.8 million, reflecting continued growth in
the moblie phone subscriptions. Passenger facility fees grew to $1.54 million dollars, in line with
increasaed stay-over arrivals.
Taxes On International Trade and Transactions
Revenue from international trade taxes grew by 17.4 percent, to $202.7 million (representing 8.6
percent of GDP), reflecting growth in all major revenue items. Import duty and service charge
collections grew by 15.9 percent to $87.2 million and 16.0 percent to $53.8 million respectively.
Environmental levy and excise tax (imports) recorded positive growth of 29.7 percent and 34.8
percent respectively owing mainly to an increase in import values of motor vehicles. Travel and
airport tax receipts on average declined by 23 percent to $8.8 million collectively. This decline may
be attibutable to one-off payments related to arrears made in the previous year.
Non-tax Revenue
Non-tax revenues declined by 11.7 percent to $39.4 million compared to 16.1 percent in the previous
year. With the exception of interest and rents, fines, fees and sales, all other revenue items recorded
a decline. Earnings from Government departments declined by 36.7 percent to $3.7 million as
Government continued its policy of maintaining the prices of controlled products such as rice and
sugar, unchanged in light of a 32.0 percent increase in international prices.
Central Government Expenditure Performance
Central Government expenditure continued on an upward path in fiscal year 2005/2006 reflecting
Government's continued role in providing public services and stimulating growth through the
provision of adequate social and economic infrastructure.
During the review period, total Government expenditure increased by 3.7 percent following higher
growth of 5.4 percent in the previous year resulting in a decline to 28.3 percent from 29.3 percent of
GDP in the previous year. The sharpest increases were recorded in wages and salaries, interest

-45-
payments, retirement benefits and the provision of goods and services. On the other hand there was
a reduction in the capital outlay due to the slow pace of implementation of major capital projects
leading to a reduction from 7.5 percent to 6.7 percent of GDP in 2005/06.
Current Expenditure
Current expenditure increased by 6.2 percent, to $512.7 million, maintaining a share of 21.7 percent
of GDP reflecting higher wages and salaries, interest commitments on outstanding debt, pension
contributions, rental payments, utilities and communications.
Wages and salaries and National Insurance Contributions
Expenditure on wages and salaries grew by 7.3 percent to $237.4 million, representing 10.1 percent
of GDP. This was due to a cumulative increase of six percent paid retroactively for the first two
years of the triennium 2004/05 to 2006/07. Similarly, wage increases amounting to approximately
$2.0 million were paid for the same period. However, in the review period, the shares of both wages
and salaries to GDP remained relatively stable at 1.2 and 8.2 percent of GDP, respectively.
Contributions to the National Insurance Corporation (NIC) grew by 8.2 percent to $3.84 million but
remained at a constant share of GDP. NIC contributions are paid by recent recruits on permanent
establishment, temporary appointees and wage earners.
Retirement Benefits
Following the granting of an increase in pensions in the review period, retirement contributions are
estimated to have increased to $38.9 million or 1.7 percent of GDP. This represented an increase of
7.4 percent in absolute terms as compared to 3.9 percent in 2004/2005.
Goods and Services
Expenditure on goods and services, influenced significantly by increased commitments to meet
rental and lease payments, utilities, travel and subsistence, communication expenses, operating
expenses and supplies, grew modestly by 1.7 percent to $93.5 million. The major categories of
expenditures include, rental, utilites, communications and supplies.
Rental expenses are estimated to have grown by 24.1 percent to $21.4 million following modest
growth of 4.7 percent in the previous fiscal year. Of particular significance was the growth in lease
commitments following the completion of the construction of police and fire stations, which are

-46-
under the Build Own Lease and Transfer (BOLT) agreements. In addition, a number of Government
offices, are being renovated resulting in the transfer of offices to rental accommodations.
In line with the surge in petroleum prices and increased office accommodation, utility commitments
grew by 55.3 percent to $21.5 million compared with growth of 20.6 percent in the previous year.
Communication expenses are estimated to have increased by 6.7 percent to $8.3 million following
growth of 11.5 percent in the previous year. The volatility of this item of expenditure is largely in
keeping with the payment of accumulated arrears.
Driven primarily by the increasing demands for supplies at the major health institutions,
expenditure on supplies and materials grew by 38.1 percent to $16.6 million following a moderate
growth of 6.9 percent in the previous year. Operating and maintenance expenses rose by 13.6
percent to $11.0 million after recording a reduction of 9.4 percent last year as a result of the
restoration of infrastructure following destruction from natural disasters.
Current Transfers
Indicative of its role to provide assistance both to the public sector institutions and to the private
sector, Central Government's transfers increased by 6.7 percent to $67.1 million (2.8 percent of GDP).
During the fiscal year, private sector contributions increased by 18.6 percent to $4.8 million while
growth in public sector contributions edged upwards to 5.9 percent. Of particular significance was
the contribution for increases in public assistance ($0.8 million), the contribution to the Cuban Eye
Care and the increase in assistance to senior citizens.
Interest Payments
In keeping with Government's policy to refinance high cost loans with cheaper instruments, the
growth in interest payments fell to 7.5 percent in contrast to an increase of 19.8 percent in the
previous year. Total interest payments were recorded at $72.0 million but maintained a share in the
region of 3 percent of GDP over the two-year period. Domestic interest payments were 26.3 percent
lower as a result of the reclassification of a significant number of instruments from domestic to
external debt and the maturity of some domestic treasury bills. On the other hand interest payments
on external debt increased by 24.4 percent.
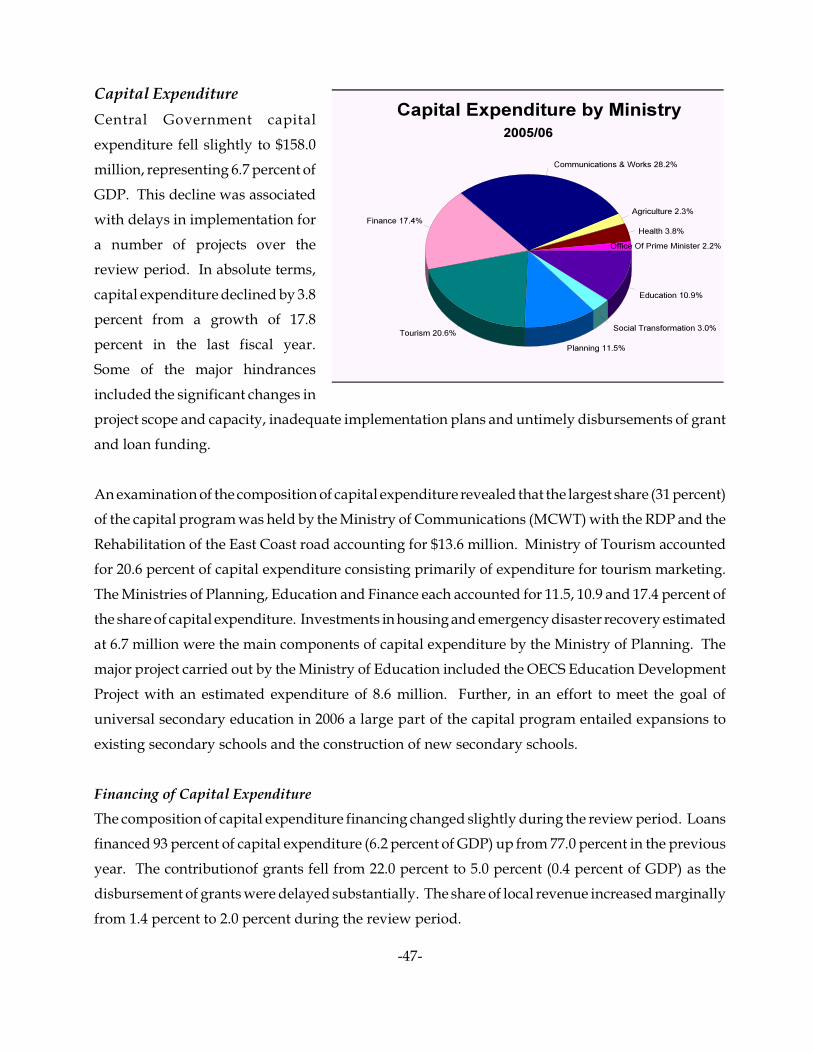
-47-
Capital Expenditure
Central Government capital
expenditure fell slightly to $158.0
million, representing 6.7 percent of
GDP. This decline was associated
with delays in implementation for
a number of projects over the
review period. In absolute terms,
capital expenditure declined by 3.8
percent from a growth of 17.8
percent in the last fiscal year.
Some of the major hindrances
included the significant changes in
project scope and capacity, inadequate implementation plans and untimely disbursements of grant
and loan funding.
An examination of the composition of capital expenditure revealed that the largest share (31 percent)
of the capital program was held by the Ministry of Communications (MCWT) with the RDP and the
Rehabilitation of the East Coast road accounting for $13.6 million. Ministry of Tourism accounted
for 20.6 percent of capital expenditure consisting primarily of expenditure for tourism marketing.
The Ministries of Planning, Education and Finance each accounted for 11.5, 10.9 and 17.4 percent of
the share of capital expenditure. Investments in housing and emergency disaster recovery estimated
at 6.7 million were the main components of capital expenditure by the Ministry of Planning. The
major project carried out by the Ministry of Education included the OECS Education Development
Project with an estimated expenditure of 8.6 million. Further, in an effort to meet the goal of
universal secondary education in 2006 a large part of the capital program entailed expansions to
existing secondary schools and the construction of new secondary schools.
Financing of Capital Expenditure
The composition of capital expenditure financing changed slightly during the review period. Loans
financed 93 percent of capital expenditure (6.2 percent of GDP) up from 77.0 percent in the previous
year. The contributionof grants fell from 22.0 percent to 5.0 percent (0.4 percent of GDP) as the
disbursement of grants were delayed substantially. The share of local revenue increased marginally
from 1.4 percent to 2.0 percent during the review period.
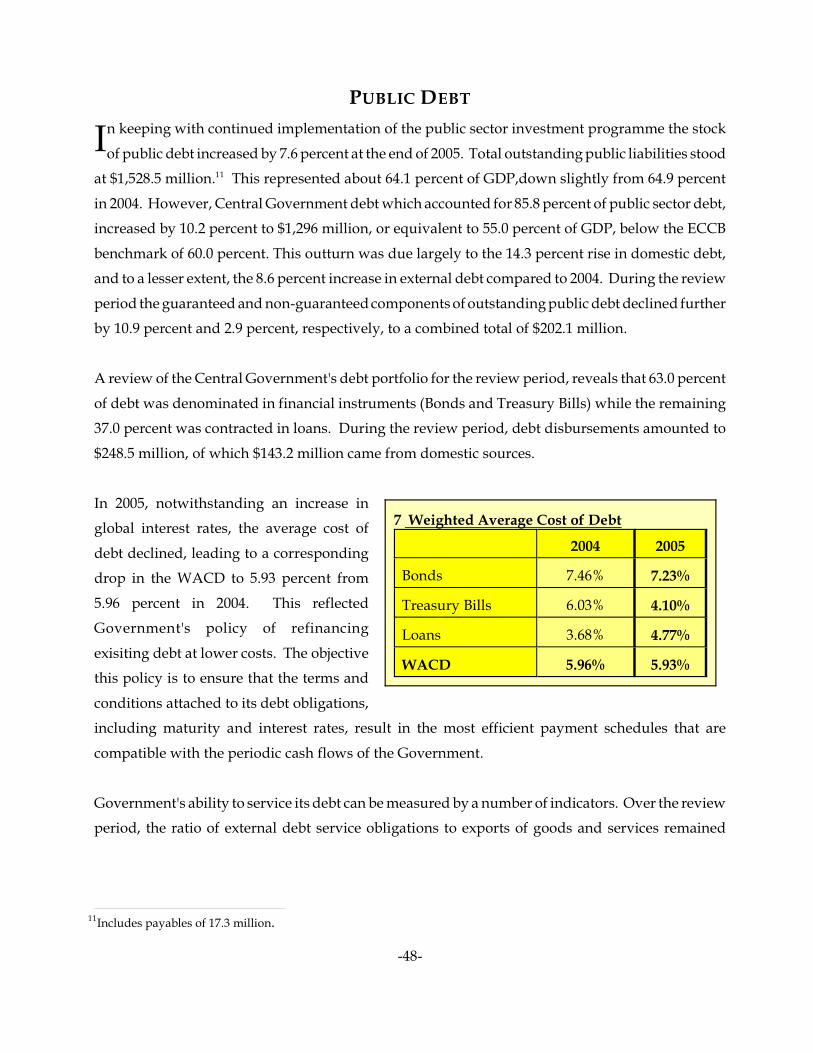
Includes payables of 17.3 million.11
-48-
PUBLIC DEBT
In keeping with continued implementation of the public sector investment programme the stock
of public debt increased by 7.6 percent at the end of 2005. Total outstanding public liabilities stood
at $1,528.5 million. This represented about 64.1 percent of GDP,down slightly from 64.9 percent11
in 2004. However, Central Government debt which accounted for 85.8 percent of public sector debt,
increased by 10.2 percent to $1,296 million, or equivalent to 55.0 percent of GDP, below the ECCB
benchmark of 60.0 percent. This outturn was due largely to the 14.3 percent rise in domestic debt,
and to a lesser extent, the 8.6 percent increase in external debt compared to 2004. During the review
period the guaranteed and non-guaranteed components of outstanding public debt declined further
by 10.9 percent and 2.9 percent, respectively, to a combined total of $202.1 million.
A review of the Central Government's debt portfolio for the review period, reveals that 63.0 percent
of debt was denominated in financial instruments (Bonds and Treasury Bills) while the remaining
37.0 percent was contracted in loans. During the review period, debt disbursements amounted to
$248.5 million, of which $143.2 million came from domestic sources.
In 2005, notwithstanding an increase in
global interest rates, the average cost of
debt declined, leading to a corresponding
drop in the WACD to 5.93 percent from
5.96 percent in 2004. This reflected
Government's policy of refinancing
exisiting debt at lower costs. The objective
this policy is to ensure that the terms and
conditions attached to its debt obligations,
including maturity and interest rates, result in the most efficient payment schedules that are
compatible with the periodic cash flows of the Government.
Government's ability to service its debt can be measured by a number of indicators. Over the review
period, the ratio of external debt service obligations to exports of goods and services remained
2004 2005
Bonds 7.46% 7.23%
Treasury Bills 6.03% 4.10%
Loans 3.68% 4.77%
WACD 5.96% 5.93%
7 Weighted Average Cost of Debt

-49-
relatively stable at 7.5 percent. The ratio
of Central Government debt service to
current revenue stood at 32.9 percent in
2005 compared to 24.9 percent in 2004,
due mainly to increased debt service
payments on new disbursements during
2005.
Domestic Debt
Over the review period, the stock of
Central Government domestic debt
moved upwards to $395.3 million
primarily as a result of:
1. An increase in bonds by 32.5 percent or $70.1 million to $285.4 million.
2. An increase of 65.4 percent or $20.7 million in commercial bank loans to $52.4 million to
finance part of the Government's 2005/2006 annual budget.
At the end of 2005, about 86 percent of Central Government disbursed domestic debt consisted of
financial instruments with medium-term maturities. This reflects, in large measure, the debt
management objectives of the Government which include refinancing high cost loans by sourcing
new funds at the most favourable terms, and thereby reducing debt servicing in a manner that
minimises costs, consistent with a prudent risk profile. Since the launching of the Regional
Government Securities Market (RGSM) in late 2002, the Government has participated in a number
of bond and Treasury Bill issues in pursuance of the cheapest available non-concessional financing.
In 2005, the Central Government raised $152 million on the RGSM through security issues for debt
restructuring purposes and the financing of capital expenditure.
-50-
External Debt
External debt, which accounted for just under 70 percent of the total Central Government debt stock,
advanced by 9.2 percent or $76.2 million to $900.9 million representing 40.7 percent of GDP owing
to:
1. An increase of $26.8 million in treasury bills and bonds to foreign institutions.
2. Loan disbursements of $78.5 million of which the RDP ($35.9 million), Rehabilitation of
Tertiary Roads ($10.2 million), Flood Mitigation ($8.2 million) and Emergency Recovery ($6.6
million) accounted for some of the largest
disbursements.
At the end of the review period, about 45 percent of the Central Government outstanding external
debt consisted of financial instruments, while the remaining external debt was composed of loans
and advances. Moreover, external debt with long-term maturities account, on average, for about 60
percent of total Central Government debt, much of which originates from multi-lateral sources.
Another integral component of Government's debt management strategy is to hedge its debt against
adverse currency shocks. Consequently, the Government has pursued a policy of contracting its
debt in currencies with fixed exchange rates such as the US and Barbados dollars. An assessment
of external debt by currency indicates that 83 percent of the external public debt stock at the end of
2005 bears no exposure to exchange rate risk, as 60 percent and 21.7 percent was contracted in US
and EC dollars, respectively. Debt denominated in Special Drawing Rights (SDRs) represented the
third largest share (8.6 percent) of total public external debt, all of which represent concessionary
funding from multi-lateral sources.
External Debt by Creditor
The Government continues to rely heavily on traditional concessional sources of credit from various
international development institutions. The Caribbean Development Bank (CDB) remains the
largest creditor, accounting for 32.0 percent of Central Government external debt and 35.7 percent
of total public external debt, while the World Bank Group (IBRD and IDA) contributed 11.2 percent
to the Central Government external outstanding debt stock at the end of 2005. Commercial debt held
by the Central Government represented 37.6 percent of total Central Government external debt,
down from 42.6 percent in 2004.

-51-
Debt by Economic Sector
The allocation of external debt among the various economic sectors showed little change from the
previous year. The proportion of debt for Communications & Works and Utilities, principally for
the financing of the RDP, and other road rehabilitation projects and water supply network
improvements, remained broadly flat in the review period. In contrast, however, given the
implementation of projects to prepare for Cricket World Cup 2007, new disbursements were
allocated to the Finance and Insurance and Hotel and Tourism sectors over the review period.

-52-
CHAPTER SIX
THE EXTERNAL SECTOR
TRADE & THE BALANCE OF PAYMENTS
Provisional estimates indicate that in 2005, an overall deficit of $46.9 million was recorded on the
balance of payments accounts relative to a surplus of $72.4 million in the previous year. As a
ratio of GDP this outturn represented 2.1 percent compared to 3.5 percent in 2004. This performance
was influenced by significant widening of the current account deficit, and modest growth in inflows
on the capital and financial account.
The Current Account
During 2005, there was deterioration in the performance on the current account of the Balance of
Payments, in contrast to an improvement in 2004. The current account deficit widened by 51.4
percent to $406.8 million (17.9 percent of GDP market prices), mainly reflecting a significant rise in
the value of imports and a decline in the value of exports. The value of imports increased by 11.1
percent to $1,107.2 million relative to growth of 4.1 percent in 2004. The growth in imports can be
associated with increased activity in the construction sector and higher oil prices during the review
period. The value of exports declined by 31.9 percent to $170.6 million, in line with a decline in
banana production. Consistent with the increase in imports and fall in exports the merchandise
trade deficit grew by 29.3 percent to $ 906.2 million.
In contrast to the outturn in the merchandise account, the surplus on the services account grew by
9.5 percent to $640.3 million building on strong growth of 24.9 percent in 2005. This performance
was supported by a 9.3 percent increase of inflows associated with activity in the tourism industry
during 2005. The growing surplus on the services account is consistent with the developments on
the real side of the economy, where tourism has become the lead economic sector.
The Capital and Financial Account
The surplus on the capital and financial account rose by 28.2 percent to $448.9 million (20.2 percent
of GDP), in contrast to a decline of 14.9 percent in 2004. On the capital account, capital grants
declined from a low base of $6.0 million to $4.2 million, reflecting the implementation of new and
revised procedures by the European Union Parliament for accessing and spending grant funds. As
Values refer to f.o.b prices unless otherwise stated. Figures for 2004 have been revised.12
-53-
a result of these procedures there has been a significant decline in capital grants over the last two
years. It is expected that this trend will be reversed in 2006 as the revised procedures have been
formalized and implemented.
The surplus on the financial account grew by 29.5 percent to $441.5 million compared to a decline
of 6.7 percent in the previous year. This outturn was driven by a 6.0 percent increase in equity
investment to $110.7 million, 10.1 percent increase in reinvested earnings within the economy and
significant inflows of capital into the banking system. Net inflows of direct investment increased
by 35.3 percent to $290.9 million, reflecting significant capital investment in hotel development
across the island.
A decline of 7.5 percent to $40.6 million was registered on the portfolio investment account,
consistent with the performance in 2004. Loan disbursements to the public sector declined by 8.9
percent to $83.0 million in contrast to an increase of 23.3 percent in 2004. Commercial banks
reduced their net foreign asset position in 2005, by $185.1 million, consistent with the outturn in
2004. This suggests that commercial banks were reducing their foreign asset positions in an effort
to finance projects within the domestic economy. This is also consistent with the 21.1 percent
increase in domestic credit on the monetary accounts.
The Overall Balance
An overall deficit of 46.9 million was recorded on the balance of payments accounts in 2005, relative
to a surplus of $72.4 million in 2004. The overall deficit was financed by a decrease in St. Lucia's
share of imputed reserves of $48.9 million or 2.1 percent of GDP.
Imports12
Reflective of buoyant economic activity, the value of merchandise imports climbed steadily in 2005
by 10.6 percent to $1,107.23 million, equivalent to about 50 percent of GDP. This outcome was the
result of soaring international oil prices and significant upward movements in the import values of
intermediate and capital goods. The value of non-oil imports grew by 9.1 percent to $950.4 million
compared to the 2.4 percent rise in 2004. Likewise, retained imports grew significantly by nearly
15.0 percent to $1,041.3 million, after a 1.4 percent increase in 2004. The yawning gap between total
and retained imports is explained mainly by re-exports of petroleum products.
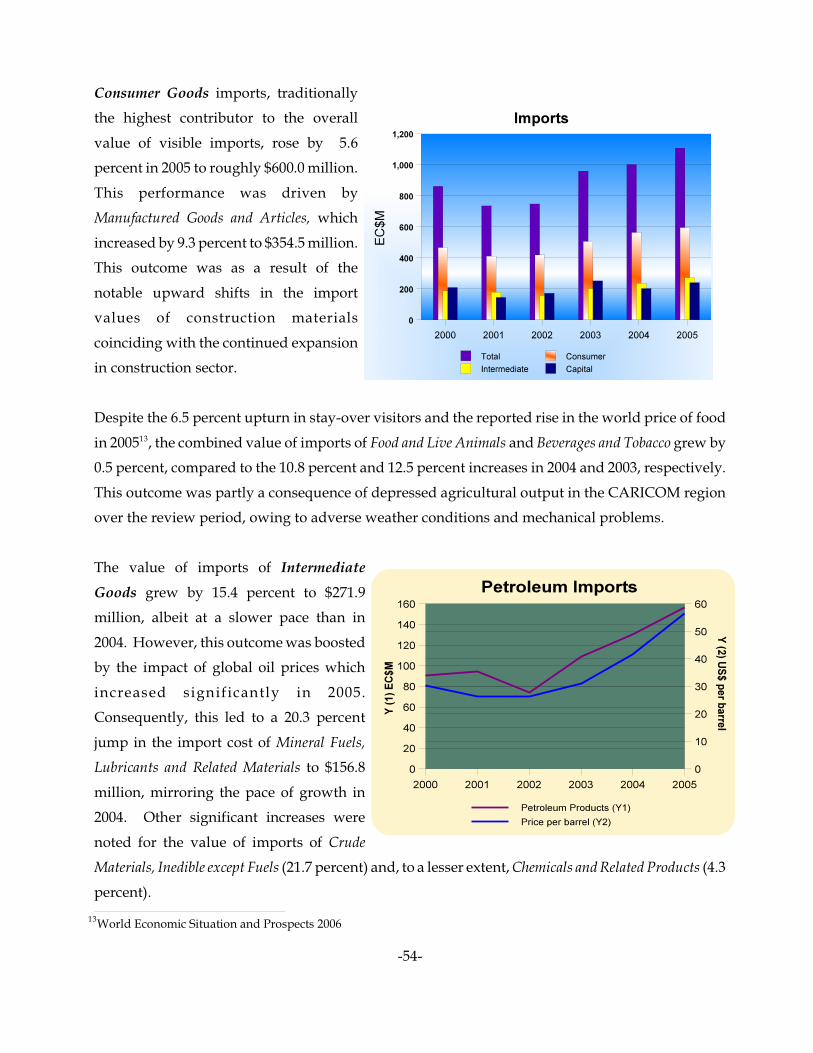
World Economic Situation and Prospects 200613
-54-
Consumer Goods imports, traditionally
the highest contributor to the overall
value of visible imports, rose by 5.6
percent in 2005 to roughly $600.0 million.
This performance was driven by
Manufactured Goods and Articles, which
increased by 9.3 percent to $354.5 million.
This outcome was as a result of the
notable upward shifts in the import
values of construction materials
coinciding with the continued expansion
in construction sector.
Despite the 6.5 percent upturn in stay-over visitors and the reported rise in the world price of food
in 2005 , the combined value of imports of Food and Live Animals and Beverages and Tobacco grew by13
0.5 percent, compared to the 10.8 percent and 12.5 percent increases in 2004 and 2003, respectively.
This outcome was partly a consequence of depressed agricultural output in the CARICOM region
over the review period, owing to adverse weather conditions and mechanical problems.
The value of imports of Intermediate
Goods grew by 15.4 percent to $271.9
million, albeit at a slower pace than in
2004. However, this outcome was boosted
by the impact of global oil prices which
increased significantly in 2005.
Consequently, this led to a 20.3 percent
jump in the import cost of Mineral Fuels,
Lubricants and Related Materials to $156.8
million, mirroring the pace of growth in
2004. Other significant increases were
noted for the value of imports of Crude
Materials, Inedible except Fuels (21.7 percent) and, to a lesser extent, Chemicals and Related Products (4.3
percent).

-55-
In keeping with the buoyant trend in economic activity, the value of imports of Capital Goods in
2005 rose by 18.9 percent to $240.6 million, in contrast to the fall of 19.5 percent in 2004. This
upswing was predominantly driven by an 18.9 percent growth in the import value of Machinery and
Transport Equipment, which amounted to nearly the entire value of capital goods. Sharp upward
movements in the import values of the components of machinery and transport equipment,
particularly civil engineering and contractors’ plant equipment ( a twofold increase to $15.2 million),
heating and cooling equipment (45.1 percent to nearly $9 million) and motor vehicles were recorded.
The import value of motor vehicles continues to expand, recording a 51.4 percent rise to over $70
million, consistent with the overall growth in the number of new vehicle registrations in the review
period. Accordingly, the value of imports of Motor cars/Other vehicles designed for the transport of
persons leaped by almost 50.0 percent to $40.0 million, and outpaced the 16.7 percent rise in 2004.
Additionally, the import value of Motor Vehicles for the Transport of Goods shot up by nearly 37.0
percent to just under $20.0 million. The continued growth in the number and import value of motor
vehicles suggests vibrant economic activity, particularly in the wholesale and retail and transport
sectors. Conversely, the import value of telecommunications equipment fell by 5.0 percent to $27.6
million, following a 66.7 percent slump in 2004. This reflects a levelling-off of investment activity
in the sector after the entry of two new service providers in the industry in 2003.
Caricom
On the regional front, the total value of merchandise imports from CARICOM–equivalent to about
21.0 percent of the overall import bill–inched up by 2.0 percent to $231.5 million in 2005, following
a 16.8 percent rise in 2004. This performance reflected a decline in imports of consumer goods from
CARICOM amd an increase in the value of capital and intermediate imports.
Over the review period, the value of imports of Consumer Goods from CARICOM fell by 7.6 percent
to $120.40 million, led by sharp contractions in the import values of all sub-categories of consumer
goods except Beverages and Tobacco. The value of imports of Beverages and Tobacco grew by 7.9
percent to just under $20.0 million following a near 24.0 percent growth in 2004. Imports of Food and
Live Animals declined by 7.3 percent to $53.9 million while the value of imports of Manufactured
Goods and Articles shrank by 13.2 percent to a combined total of $46.8 million.
The 12.7 percent rise in the value of imports of Intermediate Goods from the Region in 2005 was
driven chiefly by the 9.0 percent increase in the import cost of Mineral Fuels, Lubricants and Related

-56-
Materials, which stood at $73.8 million, and accounted for nearly half of the overall import bill for
imports classified under this category. The bulk of these imports consisted of refined petroleum oils,
residual petroleum products, liquified propane and butane, and natural gases, which are sourced
mainly from Trinidad and Tobago.
The value of imports of Capital Goods from CARICOM stood at $10.6 million, up from $7.4 million
in the preceding year. Machinery and Transport Equipment maintained its lion’s share of the overall
import value of capital goods, much of which comprised civil engineering and contractors’
equipment, telecommunications equipment, and electrical machinery and apparatus.
Exports
Receipts from total merchandise exports
fell by 20.8 percent to $170.6 million in the
review period compared to a 28.2 percent
growth in 2004. This was due to sluggish
performance of domestic exports which
recorded a 14.1 percent drop in foreign
exchange earnings to $104.7 million, in
contrast to the 16.6 percent upturn in
2004.
T h e performan ce of dom e st i c
merchandise exports in 2005 was driven
largely by the notable downturn in foreign exchange revenue from Consumer Goods which declined
by 13.5 percent to $92.7 million, in contrast to the 13.3 percent increase in 2004. Declines were
recorded in the export receipts for all the sub-components of consumer goods. Most notable was
Food and Live Animals which recorded a fall in export earnings of 20.2 percent to $45.7 million as a
result of a 20.0 percent contraction in banana exports. Foreign exchange earnings from Manufactured
Goods and Articles declined by 14.4 percent to $15.6 million partly a result of the decrease in export
receipts for articles of paper and paperboard (13.1 percent) and articles of apparel (56.0 percent). The
fall in revenue from exports of paper and paperboard is due to the general fall-off in Windward
Island banana exports. Export earings from beverages dipped slightly to $31.8 million, in contrast
to the 10.1 percent upturn in 2004. This outcome reflects the continued impact of a highly
competitive environment, both regionally and internationally, following the loss of a contract to

-57-
export bulk rum to Europe by a major local manufacturer.
Caricom
Over the review period, earnings generated from total visible exports to the Region grew by 7.6
percent to $88.9 million, building on growth of 11.2 percent in 2004. However, receipts from non-
oil exports to CARICOM declined by 3.8 percent to $65.6 million, a turnaround from the 17.3 percent
increase in 2004. Total export receipts for Consumer Goods over the review period remained flat at
$49 million, compared to the 7.8 percent rise a year earlier, owing to the fall in receipts from
Manufactured Goods (12.6 percent).
Trade Balance
In 2005, the overall trade deficit widened by
19.1 percent to $936.6 million, after
remaining flat in the preceding year. The
trade deficit for Consumer Goods, which
accounted for over 50 percent of the overall
trade deficit, deteriorated by 10.3 percent,
following a 12.3 percent contraction in
2004.
Over the review period, the trade deficit for
Intermediate Goods increased by over 35
percent, in contrast to the 2.4 percent dip in 2004. This was driven by the growth in the value of
imports of mineral fuels. Additionally, the price effect of fuel payments and the impact of the
construction boom contributed to the worsening of the trade deficit for intermediate goods.
A similar trend was recorded in the trade deficit for Capital Goods, which widened by over 25.0
percent, in contrast to the 21.7 percent improvement in 2004. This downturn was owed to the
increase in imports of motor vehicles and machinery equipment.
The arithmetic average of the values of merchandise imports from and exports to CARICOM14
-58-
Caricom
In 2005, the growth in the overall value of trade with CARICOM slowed by 3.2 percent to $160.214
million compared to the 15.6 percent upswing in 2004. Accordingly, the trade deficit with the
Region narrowed by 1.2 percent to $142.6 million. This was the net result of a 12.2 percent
contraction in the trade deficit for Consumer Goods ($71.3 million) and the 8.4 percent growth in the
trade deficit for Intermediate Goods ($72.9 million) coupled with the 61.4 percent decline in the trade
surplus for Capital Goods ($1.6 million).
The fall in the trade deficit for consumer goods resulted mainly from the decrease in the value of
imports of food and manufactured goods and articles. The widening of the trade deficit for
intermediate goods was influenced by the increase in the value of imports of chemicals and related
products while the drop in the trade surplus for capital goods was due to the rise in the value of
imports of civil engineering and contractors’s equipment. This outcome was associated primarily
with heightened activity in the construction sector.

-59-
CHAPTER SEVEN
SOCIO-DEMOGRAPHIC INDICATORS
POPULATION & DEMOGRAPHY
The size of a country’s population, as well as its age distribution and education/skill level, among
other things, determine its capacity for economic development. Small developing countries like
St. Lucia, constrained by low natural resource endowment, face the challenge of raising both the
quality and quantity of output from the population. Incremental changes in population
characteristics therefore have significant implications for economic growth.
Preliminary estimates indicate that St.
Lucia’s population increased by 1.5 percent
to 164,791 in 2005. The birth rate increased
to 15.1 per thousand, while the death rate
increased slightly from 6.9 to 7.2 per
thousand. Accordingly, the natural rate of
increase of the population was 1,308 or 124
more than 2004. The former continued on
its fluctuating trend, while the death rate
continued to increase since 2002. Data
from the Ministry of Health indicate that
the leading causes of death are chronic-non
communicable diseases such as heart disease, stroke, diabetes, hypertension and cancer. Land
transport accidents and homicides also feature among the top ten leading causes of death.
Since 2001 male births and deaths have exceeded that of females, however, the classification of the
population by sex reveal that females accounted for 51.1 percent (84,196) of the total. The population
distribution by age reveals a “teen-bias” with the cohorts 10-14 years (17,429) and 15-19 years
(17,483) being the most populous and accounted for a combined 21.0 percent of the population. This
has impacted on the labour force, as there is growing pressure for creation of employment
opportunities especially among the youth.
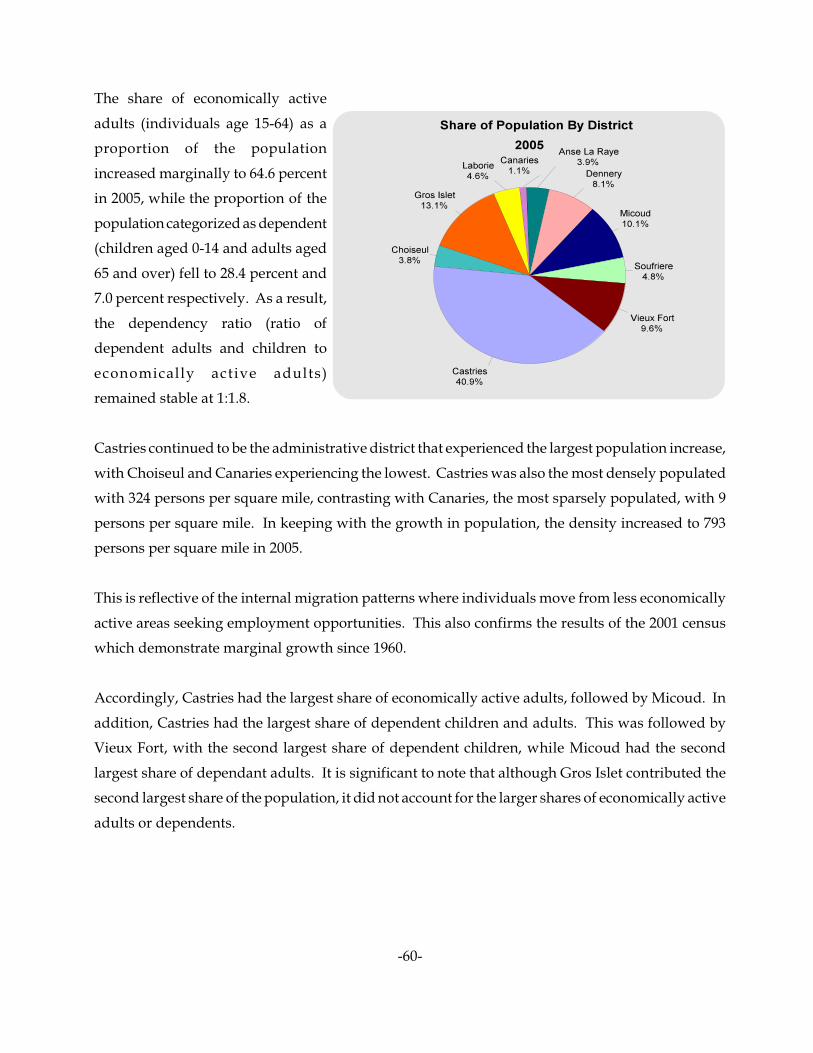
-60-
The share of economically active
adults (individuals age 15-64) as a
proportion of the population
increased marginally to 64.6 percent
in 2005, while the proportion of the
population categorized as dependent
(children aged 0-14 and adults aged
65 and over) fell to 28.4 percent and
7.0 percent respectively. As a result,
the dependency ratio (ratio of
dependent adults and children to
economically active adults)
remained stable at 1:1.8.
Castries continued to be the administrative district that experienced the largest population increase,
with Choiseul and Canaries experiencing the lowest. Castries was also the most densely populated
with 324 persons per square mile, contrasting with Canaries, the most sparsely populated, with 9
persons per square mile. In keeping with the growth in population, the density increased to 793
persons per square mile in 2005.
This is reflective of the internal migration patterns where individuals move from less economically
active areas seeking employment opportunities. This also confirms the results of the 2001 census
which demonstrate marginal growth since 1960.
Accordingly, Castries had the largest share of economically active adults, followed by Micoud. In
addition, Castries had the largest share of dependent children and adults. This was followed by
Vieux Fort, with the second largest share of dependent children, while Micoud had the second
largest share of dependant adults. It is significant to note that although Gros Islet contributed the
second largest share of the population, it did not account for the larger shares of economically active
adults or dependents.

The analysis in this section relates to the academic year 2004/05.15
-61-
EDUCATION15
Cognizant of the importance of human resource development in sustaining economic growth, the
Government of St. Lucia continues to pursue its policy of providing education to a wide cross
section of society. In the period under review, Government continued to focus on the improvement
of the quality of education at all levels of the education system and intensified its efforts to attain
universal seconday education.
During the fiscal year 2004/05 current expenditure on education grew by 5.6 percent to $115.5
million and accounted for 21.0 percent of the Central Government forecasted expenditure. Despite
a near 54.0 percent reduction in capital expenditure to $17.4 million, the total expenditure on
education amounted to a significant $132.7 million , the second largest ministerial allocation behind
that of the Ministry of Finance and Economic Affairs.
There were contrasting movements in the distribution of resources among the various levels of the
education system. Actual recurrent expenditure on primary education increased by 4.1 percent to
$46.2 million while that on secondary education increased by 6.7 percent to $34.3 million. In addition
expenditure on special education increased by 8.6 percent to $1.7 million. On the other hand, there
were declines in expenditure on namely, tertiary education, by 1.2 percent to $12.5 million and the
National Enrichment and Learning Program (NELP) by 5.9 percent to $0.8 million.
Early Childhood
This level caters to the learning needs of children who are between the ages of zero to five years old.
In St. Lucia day-care centres and pre-schools are the main providers of early childhood education.
During the academic year 2004/05, the number of day-care centres increased by 2 to a total of 40
centres. In contrast the number of pre-schools on the island decreased by 2 to 11. Enrolment at this
level decreased by 2.4 percent to 1,253 students with a teacher to students ratio of 1:10 for day-care
and 1:12 for pre-schools.
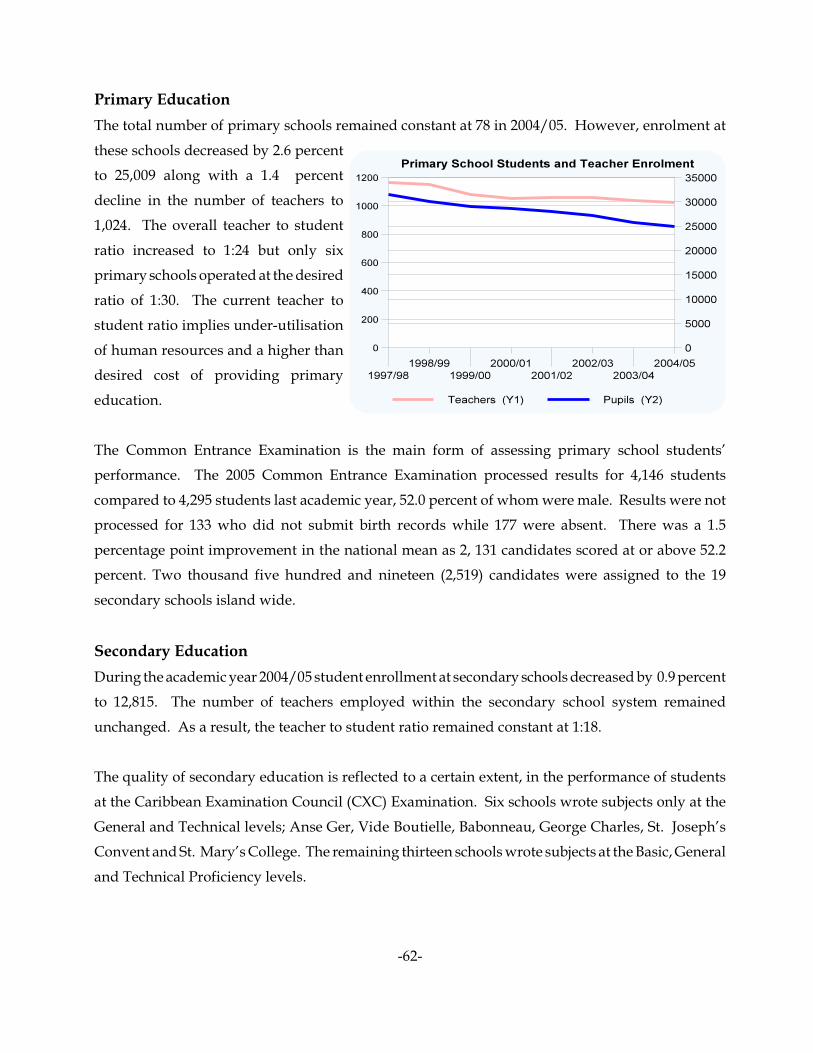
-62-
Primary Education
The total number of primary schools remained constant at 78 in 2004/05. However, enrolment at
these schools decreased by 2.6 percent
to 25,009 along with a 1.4 percent
decline in the number of teachers to
1,024. The overall teacher to student
ratio increased to 1:24 but only six
primary schools operated at the desired
ratio of 1:30. The current teacher to
student ratio implies under-utilisation
of human resources and a higher than
desired cost of providing primary
education.
The Common Entrance Examination is the main form of assessing primary school students’
performance. The 2005 Common Entrance Examination processed results for 4,146 students
compared to 4,295 students last academic year, 52.0 percent of whom were male. Results were not
processed for 133 who did not submit birth records while 177 were absent. There was a 1.5
percentage point improvement in the national mean as 2, 131 candidates scored at or above 52.2
percent. Two thousand five hundred and nineteen (2,519) candidates were assigned to the 19
secondary schools island wide.
Secondary Education
During the academic year 2004/05 student enrollment at secondary schools decreased by 0.9 percent
to 12,815. The number of teachers employed within the secondary school system remained
unchanged. As a result, the teacher to student ratio remained constant at 1:18.
The quality of secondary education is reflected to a certain extent, in the performance of students
at the Caribbean Examination Council (CXC) Examination. Six schools wrote subjects only at the
General and Technical levels; Anse Ger, Vide Boutielle, Babonneau, George Charles, St. Joseph’s
Convent and St. Mary’s College. The remaining thirteen schools wrote subjects at the Basic, General
and Technical Proficiency levels.

-63-
At the General and Technical
Proficiency levels the overall percentage
pass rate fell by 1.03 percentage points
to 70.6 percent. The highest overall pass
rate was recorded for St. Joseph's
Convent (96.9 percent), followed by
Leon Hess Comprehensive (89.9
percent) and St. Mary's College (88.9
percent). Four schools recorded pass
rates of below 50 percent, namely Anse
Ger, Bocage, George Charles and Piaye
Secondary.
At the general proficiency level, there was marginal improvement in the area of Mathematics, the
pass rate increasd by a mere 3.8 percent to 45.3 percent. Similarly the pass rate in English Language
rose slightly to 64.6 percent.
Tertiary Education
There are two main tertiary institutions in St. Lucia ; Sir Arthur Lewis Community College (SALCC),
and the Vieux-Fort Post Secondary Department of the Vieux Comprehensive School.
For the academic year 2004/05 enrolment
at the SALCC decreased significantly by
18.1 percent to 2,702 , continuing its trend
of decline from 2002/03. Continuing
Education accounted for 40.5 percent
(1,093) of this enrolment, followed by
Technical Education and Management
Studies with 25.7 percent (695) and Arts
and General Studies, 18.1 percent (489).
The other departments of Teacher
Education, University of the West Indies,
Health Sciences, Agriculture and Home

-64-
Economics, collectively accounted for the remaining 15.7 percent. Three hundred and twenty
students were enrolled at the Post Secondary Department of the Vieux Fort Comprehensive School.
Female students continued to outnumber males and accounted for 68.9 percent of total enrolment
in 2004/05.
SALCC’s Cambridge Advanced Level and Vieux Fort Comprehensive A’ Level Department
percentage pass rate increased to 80.6 percent and 72.4 percent, respectively. SALCC recorded 100
percent passes for English Literature and Chemistry whilst Vieux Fort recorded the same for French,
English Literature, History and Art and Design.
Vieux Fort Technical Institute
The Vieux Fort Technical Institute, formerly known as the Vieux Fort Primary Technical Extension
recorded a marginal increase in enrolment to 334 students. Males formed the largest share of
enrolment (61.8 percent), while the teacher to student ratio was 1:18 with 73.7 percent of the teachers
being trained.
Special Education
The Special Education Centres in St. Lucia are the Special Education Centre (Vieux-Fort), Lady
Gordon Opportunity Centre, Dunnottar School, School for the Blind and Soufriere Special Education
Centre. These centres cater to the needs of the autistic, hearing, visually impaired and other children
with special needs. There were no new centres in academic year 2004/05. Total combined enrolment
remained unchanged (238) with a teacher to student ratio of 1:5. Fifty-nine percent of the teachers
are trained.
National Enrichment and Learning Program (NELP)
This program caters to the learning needs of unemployed adults or those wo are part of the labour
force and require skills enhancement. This program offers courses in two phases, Phase One from
September to March and Phase Two from April to July. During the academic year the number of
learners who participated in the program declined by 29.0 percent to 1,413 in keeping with a
decrease in the total number of NELP centres from 16 to 15.

-65-
Skills Training
The National Skills Development centre was established to provide those entering the labour force
with technical and vocational skills. The centre specifically targets unemployed youth over the age
of 16. The main skills training centre is located at Bisee in Castries, with three other satellite centres.
Seven hundred and sixty-three (763) persons were trained, a 46.4 percent increase from last year,
with the highest enrolment (504) being recorded for Productivity Enhancement Training.
Private Education
There are six private primary schools in St. Lucia: Labayee Seventh Day Adventist (SDA), Mon
Repos SDA, Castries SDA, Tapion, Bonne Terre Private and the Montessouri Centre. Teacher and
student enrolment were 49 and 808 respectively. Total teacher to student ratio was 1:16 in
comparison to 1:14 last academic year in keeping with higher enrollement.
The two private secondary schools in St. Lucia are SDA Academy and Girls Vocational. Student
enrolment decreased by 26.4 percent to 234 while teacher to student ratio was 1:10 reflecting the
increase in the number of teachers and decline in the number of students.
The Centre for Adolescent, Rehabilitation and Education (CARE) is a community based indigenous
voluntary organisation established to help disadvantaged and marginalized youth acquire skills that
will make them more employable. CARE offers programmes of two years duration . The number
of centres (6) was the same as last year with student enrolment of 318 and a teacher to student ratio
of 1:11.

STATISTICAL APPENDIXTITLE PAGE
GROSS DOMESTIC PRODUCT
G.D.P. Factor Cost - Current Prices ...................................................................................................... 1G.D.P. Factor Cost - Constant Prices ................................................................................................... 2Growth of G.D.P. Factor Cost - Constant Prices ................................................................................... 3Sectoral Share of G.D.P. Factor Cost - Constant Prices ....................................................................... 4Expenditure on Gross Domestic Product - Current Prices..................................................................... 5
AGRICULTURE
Banana Exports ..................................................................................................................................... 6Banana Revenue Earnings ................................................................................................................... 7Windward Islands Banana Exports per Island ....................................................................................... 8Share of Total Windward Island Banana Exports................................................................................... 8Fish Landings......................................................................................................................................... 9Growth in Fish Landings......................................................................................................................... 9Milk Production....................................................................................................................................... 10Egg Production....................................................................................................................................... 10Supermarket and Hotel Purchases of "Other Crops" by Category......................................................... 11Domestic Purchase of "Other Crops" by Category................................................................................ 12
TOURISM
Selected Visitor Statistics ...................................................................................................................... 13Tourist Arrivals by Country of Origin.................................................................................................... 14Monthly Arrivals By Category................................................................................................................. 15Monthly Stay-Over Arrivals By Market................................................................................................... 16
BANKING
Detailed Monetary Survey ..................................................................................................................... 17Commercial Banks Total Deposits by Depositors ................................................................................. 18Commercial Banks - Assets and Liabilities............................................................................................ 19Commercial Bank Liquidity .................................................................................................................... 20Commercial Banks Structure of Interest Rates ..................................................................................... 21Commercial Banks Credit by Sector ..................................................................................................... 22ECCB Operation with St. Lucia.............................................................................................................. 23St. Lucia External Reserves................................................................................................................... 23
PRICES
Annual Inflation Rates............................................................................................................................ 24Consumer Price Index ........................................................................................................................... 25Consumer Price Index - Percentage Change......................................................................................... 26
MANUFACTURING
Manufacturing Production...................................................................................................................... 27
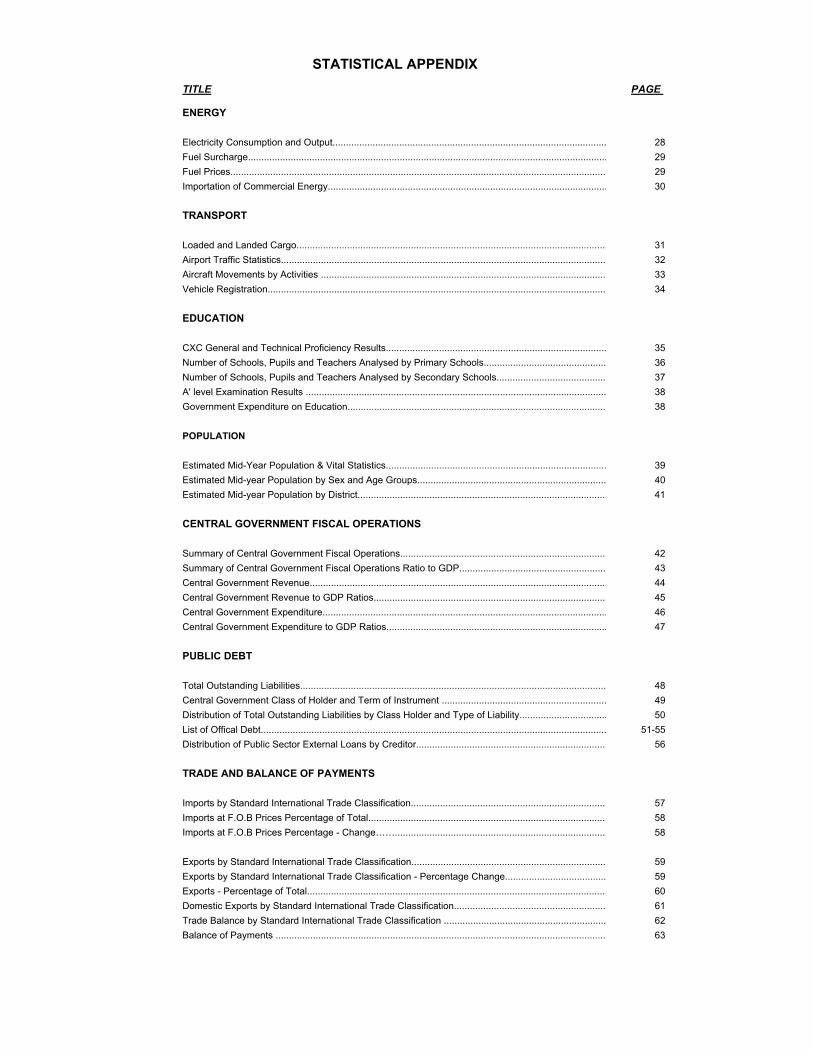
STATISTICAL APPENDIXTITLE PAGE
ENERGY
Electricity Consumption and Output....................................................................................................... 28Fuel Surcharge....................................................................................................................................... 29Fuel Prices............................................................................................................................................. 29Importation of Commercial Energy......................................................................................................... 30
TRANSPORT
Loaded and Landed Cargo..................................................................................................................... 31Airport Traffic Statistics.......................................................................................................................... 32Aircraft Movements by Activities ........................................................................................................... 33Vehicle Registration............................................................................................................................... 34
EDUCATION
CXC General and Technical Proficiency Results................................................................................... 35Number of Schools, Pupils and Teachers Analysed by Primary Schools.............................................. 36Number of Schools, Pupils and Teachers Analysed by Secondary Schools......................................... 37A' level Examination Results ................................................................................................................. 38Government Expenditure on Education................................................................................................. 38
POPULATION
Estimated Mid-Year Population & Vital Statistics................................................................................... 39Estimated Mid-year Population by Sex and Age Groups....................................................................... 40Estimated Mid-year Population by District.............................................................................................. 41
CENTRAL GOVERNMENT FISCAL OPERATIONS
Summary of Central Government Fiscal Operations.............................................................................. 42Summary of Central Government Fiscal Operations Ratio to GDP....................................................... 43Central Government Revenue................................................................................................................ 44Central Government Revenue to GDP Ratios........................................................................................ 45Central Government Expenditure........................................................................................................... 46Central Government Expenditure to GDP Ratios................................................................................... 47
PUBLIC DEBT
Total Outstanding Liabilities................................................................................................................... 48Central Government Class of Holder and Term of Instrument .............................................................. 49Distribution of Total Outstanding Liabilities by Class Holder and Type of Liability................................. 50List of Offical Debt.................................................................................................................................. 51-55Distribution of Public Sector External Loans by Creditor........................................................................ 56
TRADE AND BALANCE OF PAYMENTS
Imports by Standard International Trade Classification.......................................................................... 57Imports at F.O.B Prices Percentage of Total.......................................................................................... 58Imports at F.O.B Prices Percentage - Change……................................................................................ 58
Exports by Standard International Trade Classification......................................................................... 59Exports by Standard International Trade Classification - Percentage Change...................................... 59Exports - Percentage of Total................................................................................................................. 60Domestic Exports by Standard International Trade Classification......................................................... 61Trade Balance by Standard International Trade Classification ............................................................. 62Balance of Payments ............................................................................................................................ 63

SECTORS 1995 1996 1997 1998 1999r 2000r 2001r 2002p 2003p 2004p 2005pj
Agriculture, Livestock, Forestry, Fishing 122.16 114.74 94.83 122.23 113.19 114.28 98.94 94.20 85.02 91.66 70.80 - Bananas 69.16 55.87 32.31 60.04 57.56 52.67 31.08 40.47 32.31 40.64 23.18 - Other Crops 31.07 33.05 33.49 31.09 25.17 26.47 28.52 18.58 22.44 20.60 17.30 - Livestock 7.93 10.27 11.50 12.50 7.16 10.67 11.77 12.34 9.51 9.71 11.14 - Fishing 11.02 13.86 15.98 17.16 21.97 23.25 26.36 21.64 19.62 19.70 18.30 - Forestry 1.81 1.69 1.55 1.44 1.33 1.22 1.21 1.17 1.14 1.01 0.88
Mining and Quarrying 5.85 5.67 6.11 6.22 6.02 7.94 6.08 6.05 6.03 5.90 5.98
Manufacturing 88.78 87.67 84.92 82.37 84.88 78.76 73.29 74.32 83.10 88.10 105.80
Construction 103.66 99.70 101.12 117.48 137.04 130.88 125.08 118.40 114.03 119.02 150.85
Electricity and Water 47.27 46.98 53.65 63.89 75.16 86.95 86.57 82.24 89.20 99.45 100.43 - Electricity 37.93 37.59 44.22 54.34 65.54 70.38 71.16 66.68 73.01 82.12 82.90 - Water 9.34 9.39 9.43 9.55 9.62 16.57 15.41 15.56 16.19 17.33 17.53
Wholesale and Retail Trade 182.53 184.58 188.73 197.88 210.76 202.61 177.83 178.44 195.21 215.26 247.12
Hotels and Restaurants 147.03 159.89 176.92 186.23 200.85 213.87 201.26 199.57 235.15 252.61 279.07
Transport 141.37 147.54 159.29 165.41 176.85 182.91 189.31 194.19 201.24 211.13 222.89 - Road Transport 91.98 95.58 101.25 104.12 110.81 114.58 118.59 122.15 124.05 129.13 134.16 - Air Transport 17.54 19.17 21.64 23.13 25.46 26.33 27.25 27.76 30.62 33.63 38.47 - Sea Transport 31.85 32.79 36.40 38.16 40.58 42.00 43.47 44.28 46.57 48.37 50.26Communications 92.53 97.00 97.80 102.00 104.79 111.32 122.40 131.96 140.37 147.71 169.86
Banking and Insurance 111.89 117.85 121.70 132.66 139.18 144.06 153.34 160.47 169.63 178.87 194.66 - Banking 93.08 95.09 99.85 108.86 112.70 116.68 125.01 131.46 140.27 148.48 162.99 - Insurance 18.81 22.76 21.85 23.80 26.48 27.38 28.33 29.01 29.36 30.39 31.67
Real Estate and Owner Occupied Dwellings 129.30 134.48 138.61 145.24 148.66 150.08 152.83 156.32 161.81 167.36 172.31
Producers of Government Services 195.41 195.61 210.16 205.43 227.65 239.18 249.42 247.31 248.11 261.22 259.62
Other Services 59.37 63.05 65.37 69.01 73.04 75.52 78.54 80.31 82.10 84.97 85.73
Less: Imputed Banking Service Charge -100.40 -110.64 -116.17 -114.36 -118.33 -122.19 -124.10 -126.78 -135.28 -144.87 -159.02
TOTAL 1,326.75 1,344.12 1,383.04 1,481.68 1,579.74 1,616.17 1,590.79 1,596.99 1,675.71 1,778.39 1,906.10Growth Rate 7.41% 1.04% 2.90% 7.13% 6.62% 2.31% -1.57% 0.39% 4.93% 6.13% 7.18%
P= Provisional
Pj= Projected
R = Revised
Source: Government Statistics Department (St.Lucia)
SAINT LUCIAGROSS DOMESTIC PRODUCT BY ECONOMIC ACTIVITY AT FACTOR COST
CURRENT PRICESEC$ millions
1

SECTORS 1995 1996 1997 1998R 1999R 2000R 2001R 2002R 2003R 2004P 2005PJ
Agriculture, Livestock, Forestry, Fishing 118.80 119.89 98.38 97.20 82.69 85.37 64.50 67.33 56.73 57.73 45.06
- Bananas 80.43 76.72 52.14 51.22 41.05 43.68 22.37 35.75 22.78 26.81 17.11 - Other Crops 24.02 25.68 26.71 25.56 21.14 19.57 20.48 13.50 14.27 13.93 11.57 - Livestock 5.71 7.49 8.39 9.12 6.67 7.67 7.20 6.86 6.64 6.77 6.92 - Fishing 6.86 8.33 9.57 9.84 12.48 13.21 13.22 10.02 11.88 9.10 8.48 - Forestry 1.78 1.67 1.57 1.46 1.35 1.24 1.23 1.20 1.16 1.12 0.98
Mining and Quarrying 5.17 5.15 5.73 5.83 6.72 7.66 5.71 5.82 5.83 5.70 5.79
Manufacturing 75.06 69.97 69.74 68.91 71.77 69.87 66.45 69.80 70.19 73.31 76.17
Construction 90.91 87.30 87.64 96.82 109.22 104.21 99.02 94.23 95.73 96.70 106.80
Electricity and Water 46.00 43.25 47.94 57.83 64.09 60.99 63.79 62.22 63.38 60.93 65.23 - Electricity 37.38 34.95 38.34 49.68 57.32 53.12 55.53 55.03 56.28 53.75 58.00 - Water 8.63 8.30 9.60 8.15 6.77 7.87 8.26 7.20 7.10 7.19 7.23
Wholesale and Retail Trade 144.97 145.38 150.10 151.65 156.18 146.05 124.84 126.39 136.21 147.68 161.19
Hotels and Restaurants 119.32 128.47 142.05 145.40 151.57 155.61 139.20 138.35 161.36 170.86 181.67
Transport 113.73 117.19 119.10 122.42 128.79 127.14 125.49 120.70 123.45 129.96 146.07 - Road Transport 74.64 76.84 81.40 83.03 85.04 86.90 87.05 84.73 85.18 86.09 93.14 - Air Transport 15.23 14.78 15.83 16.14 17.50 18.03 17.06 16.44 17.84 22.26 26.26 - Sea Transport 23.86 25.57 21.87 23.25 26.25 22.21 21.38 19.53 20.43 21.61 26.67Communications 89.10 94.09 93.53 96.18 102.13 107.75 120.50 129.56 135.43 141.65 152.05
Banking and Insurance 91.88 98.29 105.73 110.99 120.79 124.42 127.72 129.29 131.85 138.36 150.40 - Banking 79.20 85.49 91.73 96.19 105.14 107.98 110.22 112.35 114.07 119.57 131.37 - Insurance 12.68 12.80 14.00 14.80 15.65 16.44 17.50 16.94 17.78 18.79 19.03
Real Estate and Owner Occupied Dwellings 120.99 125.12 129.26 135.13 138.36 141.39 146.16 149.63 154.62 159.68 168.78
Producers of Government Services 135.83 135.97 136.53 138.57 144.74 145.89 149.43 146.97 143.93 149.82 149.40
Other Services 48.34 50.82 52.42 53.99 55.72 57.55 53.33 54.29 54.27 54.59 55.60
Less: Imputed Banking Service Charge -76.82 -82.82 -88.94 -93.77 -99.45 -104.13 -106.21 -108.24 -109.95 -115.2 -123.67
TOTAL 1,123.29 1,138.08 1,149.20 1,187.14 1,233.32 1,229.77 1,179.94 1,186.33 1,223.03 1,271.78 1,340.54Growth Rate 1.59% 1.32% 0.98% 3.30% 3.89% -0.29% -4.05% 0.54% 3.09% 3.99% 5.41%
P=Provisional.
Pj=Projected
R=Revised
Source: Government Statistics Department (St. Lucia)
SAINT LUCIAGROSS DOMESTIC PRODUCT BY ECONOMIC ACTIVITY AT FACTOR COST
CONSTANT PRICES - 1990EC$ millions
2

SECTORS 1995 1996 1997 1998R 1999R 2000R 2001R 2002P 2003P 2004P 2005PJ
Agriculture, Livestock, Forestry, Fishing 5.11% 0.92% -17.95% -1.20% -14.93% 3.24% -24.45% 4.38% -15.74% 1.76% -21.95%
- Bananas 16.55% -4.61% -32.04% -1.76% -19.86% 6.41% -48.79% 59.81% -36.28% 17.69% -36.18% - Other Crops -20.17% 6.91% 4.01% -4.31% -17.29% -7.43% 4.65% -34.08% 5.70% -2.38% -16.94% - Livestock -6.55% 31.17% 12.02% 8.70% -26.86% 14.99% -6.13% -4.72% -3.21% 1.96% 2.22% - Fishing 15.68% 21.43% 14.89% 2.82% 26.83% 5.85% 0.08% -24.21% 18.56% -23.40% -6.81% - Forestry -5.71% -6.06% -6.45% -7.02% -7.42% -8.01% -0.73% -2.92% -3.01% -3.36% -12.50%
Mining and Quarrying 30.56% -0.39% 11.26% 1.75% 15.27% 13.99% -25.46% 1.87% 0.30% -2.30% 1.58%
Manufacturing 5.93% -6.78% -0.33% -1.19% 4.15% -2.65% -4.89% 5.04% 0.56% 4.44% 3.90%
Construction 2.42% -3.97% 0.39% 10.47% 12.81% -4.59% -4.98% -4.84% 1.59% 1.01% 10.44%
Electricity and Water 9.26% -5.98% 10.83% 20.64% 10.83% -4.84% 4.59% -2.47% 1.86% -3.86% 7.05% - Electricity 9.87% -6.49% 9.69% 29.60% 15.37% -7.33% 4.55% -0.92% 2.28% -4.50% 7.91% - Water 6.72% -3.78% 15.62% -15.13% -16.88% 16.26% 4.92% -12.88% -1.31% 1.20% 0.60%
Wholesale and Retail Trade -5.14% 0.28% 3.25% 1.03% 2.99% -6.49% -14.52% 1.24% 7.77% 8.42% 9.15%
Hotels and Restaurants 1.13% 7.67% 10.57% 2.36% 4.24% 2.67% -10.55% -0.61% 16.63% 5.89% 6.33%
Transport 1.05% 3.04% 1.63% 2.79% 5.20% -1.28% -1.30% -3.82% 2.28% 5.27% 12.40% - Road Transport 5.98% 2.95% 5.93% 2.00% 2.42% 2.19% 0.17% -2.67% 0.53% 1.07% 8.19% - Air Transport 7.86% -2.95% 7.10% 1.96% 8.43% 3.03% -5.38% -3.63% 8.52% 24.78% 17.97% - Sea Transport -14.79% 7.17% -14.47% 6.31% 12.90% -15.39% -3.74% -8.65% 4.61% 5.78% 23.42%Communications -0.11% 5.60% -0.60% 2.83% 6.19% 5.50% 11.83% 7.52% 4.53% 4.59% 7.34%
Banking and Insurance 4.08% 6.98% 7.57% 4.97% 8.83% 3.01% 2.65% 1.23% 1.98% 4.94% 8.70% - Banking 4.16% 7.94% 7.30% 4.86% 9.31% 2.70% 2.07% 1.93% 1.53% 4.82% 9.87% - Insurance 3.59% 0.95% 9.38% 5.71% 5.74% 5.05% 6.45% -3.18% 4.93% 5.70% 1.26%
Real Estate and Owner Occupied Dwellings -0.02% 3.41% 3.31% 4.54% 2.39% 2.19% 3.37% 2.37% 3.33% 3.27% 5.70%
Producers of Government Services 2.95% 0.10% 0.41% 1.49% 4.45% 0.79% 2.43% -1.65% -2.07% 4.09% -0.28%
Other Services 2.00% 5.13% 3.15% 3.00% 3.20% 3.28% -7.33% 1.79% -0.03% 0.59% 1.85%
Less: Imputed Banking Service Charge 3.53% 7.81% 7.39% 5.43% 6.05% 4.71% 2.00% 1.91% 1.58% 4.77% 7.35%
TOTAL 1.59% 1.32% 0.98% 3.30% 3.89% -0.29% -4.05% 0.54% 3.09% 3.99% 5.41%
P=Provisional.
Pj=Projected
R=Revised
Source: Government Statistics Department (St. Lucia)
SAINT LUCIAGROSS DOMESTIC PRODUCT BY ECONOMIC ACTIVITY AT FACTOR COST
GROWTH RATE IN CONSTANT PRICES - 1990
3
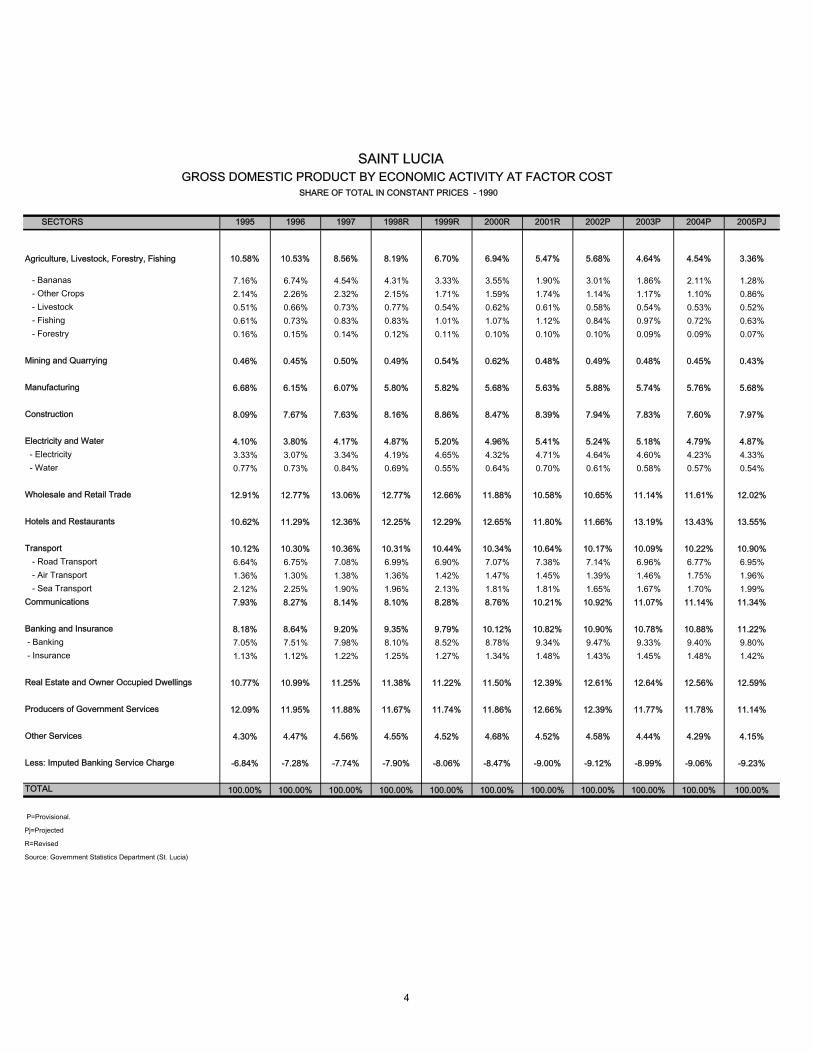
SECTORS 1995 1996 1997 1998R 1999R 2000R 2001R 2002P 2003P 2004P 2005PJ
Agriculture, Livestock, Forestry, Fishing 10.58% 10.53% 8.56% 8.19% 6.70% 6.94% 5.47% 5.68% 4.64% 4.54% 3.36%
- Bananas 7.16% 6.74% 4.54% 4.31% 3.33% 3.55% 1.90% 3.01% 1.86% 2.11% 1.28% - Other Crops 2.14% 2.26% 2.32% 2.15% 1.71% 1.59% 1.74% 1.14% 1.17% 1.10% 0.86% - Livestock 0.51% 0.66% 0.73% 0.77% 0.54% 0.62% 0.61% 0.58% 0.54% 0.53% 0.52% - Fishing 0.61% 0.73% 0.83% 0.83% 1.01% 1.07% 1.12% 0.84% 0.97% 0.72% 0.63% - Forestry 0.16% 0.15% 0.14% 0.12% 0.11% 0.10% 0.10% 0.10% 0.09% 0.09% 0.07%
Mining and Quarrying 0.46% 0.45% 0.50% 0.49% 0.54% 0.62% 0.48% 0.49% 0.48% 0.45% 0.43%
Manufacturing 6.68% 6.15% 6.07% 5.80% 5.82% 5.68% 5.63% 5.88% 5.74% 5.76% 5.68%
Construction 8.09% 7.67% 7.63% 8.16% 8.86% 8.47% 8.39% 7.94% 7.83% 7.60% 7.97%
Electricity and Water 4.10% 3.80% 4.17% 4.87% 5.20% 4.96% 5.41% 5.24% 5.18% 4.79% 4.87% - Electricity 3.33% 3.07% 3.34% 4.19% 4.65% 4.32% 4.71% 4.64% 4.60% 4.23% 4.33% - Water 0.77% 0.73% 0.84% 0.69% 0.55% 0.64% 0.70% 0.61% 0.58% 0.57% 0.54%
Wholesale and Retail Trade 12.91% 12.77% 13.06% 12.77% 12.66% 11.88% 10.58% 10.65% 11.14% 11.61% 12.02%
Hotels and Restaurants 10.62% 11.29% 12.36% 12.25% 12.29% 12.65% 11.80% 11.66% 13.19% 13.43% 13.55%
Transport 10.12% 10.30% 10.36% 10.31% 10.44% 10.34% 10.64% 10.17% 10.09% 10.22% 10.90% - Road Transport 6.64% 6.75% 7.08% 6.99% 6.90% 7.07% 7.38% 7.14% 6.96% 6.77% 6.95% - Air Transport 1.36% 1.30% 1.38% 1.36% 1.42% 1.47% 1.45% 1.39% 1.46% 1.75% 1.96% - Sea Transport 2.12% 2.25% 1.90% 1.96% 2.13% 1.81% 1.81% 1.65% 1.67% 1.70% 1.99%Communications 7.93% 8.27% 8.14% 8.10% 8.28% 8.76% 10.21% 10.92% 11.07% 11.14% 11.34%
Banking and Insurance 8.18% 8.64% 9.20% 9.35% 9.79% 10.12% 10.82% 10.90% 10.78% 10.88% 11.22% - Banking 7.05% 7.51% 7.98% 8.10% 8.52% 8.78% 9.34% 9.47% 9.33% 9.40% 9.80% - Insurance 1.13% 1.12% 1.22% 1.25% 1.27% 1.34% 1.48% 1.43% 1.45% 1.48% 1.42%
Real Estate and Owner Occupied Dwellings 10.77% 10.99% 11.25% 11.38% 11.22% 11.50% 12.39% 12.61% 12.64% 12.56% 12.59%
Producers of Government Services 12.09% 11.95% 11.88% 11.67% 11.74% 11.86% 12.66% 12.39% 11.77% 11.78% 11.14%
Other Services 4.30% 4.47% 4.56% 4.55% 4.52% 4.68% 4.52% 4.58% 4.44% 4.29% 4.15%
Less: Imputed Banking Service Charge -6.84% -7.28% -7.74% -7.90% -8.06% -8.47% -9.00% -9.12% -8.99% -9.06% -9.23%
TOTAL 100.00% 100.00% 100.00% 100.00% 100.00% 100.00% 100.00% 100.00% 100.00% 100.00% 100.00%
P=Provisional.
Pj=Projected
R=Revised
Source: Government Statistics Department (St. Lucia)
SAINT LUCIAGROSS DOMESTIC PRODUCT BY ECONOMIC ACTIVITY AT FACTOR COST
SHARE OF TOTAL IN CONSTANT PRICES - 1990
4

1995 1996 1997 1998 1999 2000 2001P 2002P 2003P 2004P 2005PJ
EXPENDITURE ON GROSS DOMESTIC PRODUCT (M. P.)
1,542.16 1,588.23 1,617.49 1,775.33 1,869.37 1,907.76 1,850.69 1,899.17 2,014.81 2,154.00 2,355.81
Government Final Consumption Expenditure 259.68 261.23 284.08 314.65 330.85 353.70 358.51 393.22 414.74 412.18 436.85
Private Final Consumption Expenditure 925.61 1,039.73 1,078.14 1,135.99 1,208.58 1,254.98 1,237.00 1,308.04 1,447.04 1,454.49 1,539.27
Gross Capital Formation 367.19 381.54 417.71 433.08 500.45 490.70 459.37 415.89 408.40 451.79 551.21
Increase in Stocks Gross Fixed Capital Formation 367.19 381.54 417.71 433.08 500.45 490.70 459.37 415.89 408.40 451.79 551.21 Construction 233.23 223.79 227.52 264.34 325.46 310.84 299.72 282.08 270.71 285.30 343.70 - Public Sector 95.20 99.40 80.00 67.16 89.60 60.03 93.10 79.51 73.15 61.17 126.70 - Private Sector 138.03 124.39 147.52 197.18 235.86 250.81 206.62 202.57 197.56 224.13 217.00 Transport Equipment 26.82 29.97 55.96 31.32 37.29 40.86 42.48 35.79 46.59 64.89 91.87 - Public Sector 0.37 0.51 0.07 0.65 0.35 0.73 0.55 0.28 0.71 0.18 0.16 - Private Sector 26.45 29.46 55.89 30.67 36.94 40.13 41.93 35.51 45.88 64.71 91.71 Other Machinery & Equip. 107.14 127.78 134.23 137.42 137.70 139.00 117.17 98.02 91.10 101.60 115.64 - Public Sector 1.57 10.04 2.55 5.22 4.05 5.47 3.23 5.80 4.02 1.14 2.57 - Private Sector 105.57 117.74 131.68 132.20 133.65 133.53 113.95 92.22 87.08 100.46 113.07
Net Exports -10.32 -94.27 -162.44 -108.39 -170.51 -191.62 -204.19 -217.98 -255.37 -164.46 -171.52 Exports of Goods and Services 1038.74 953.33 968.34 1037.30 1031.40 1012.44 883.02 860.17 1033.24 1081.64 1119.47 Less: Imports of Goods and Services 1049.06 1047.60 1130.78 1145.69 1201.91 1204.06 1087.21 1078.15 1288.61 1246.10 1290.99
GDP AT MARKET PRICES 1,542.15 1,588.23 1,617.49 1,775.33 1,869.37 1,907.76 1,850.69 1,899.17 2,014.81 2,154.00 2,355.81
-215.41 -244.11 -234.45 -293.65 -289.63 -291.59 -259.90 -302.18 -339.10 -375.51 -449.81Less: Indirect Taxes 218.77 247.15 237.74 296.70 292.73 294.67 263.47 305.30 343.16 379.46 454.60Plus: Subsidies 3.36 3.05 3.29 3.05 3.10 3.08 3.57 3.12 4.06 3.95 4.79
GDP AT FACTOR COST 1,326.74 1,344.12 1,383.04 1,481.68 1,579.74 1,616.17 1,590.79 1,596.99 1,675.71 1,778.49 1,906.00Growth Rate 7.41% 1.31% 2.90% 7.13% 6.62% 2.31% -1.57% 0.39% 4.93% 6.13% 7.17%P=Provisional
pj=Projected
R=Revised
Source: Government Statistics Department (St.Lucia)
EC$ millions
SAINT LUCIAEXPENDITURE ON GROSS DOMESTIC PRODUCT
5

Period 1998 1999 2000 2001 2002 2003 2004 2005
JANUARY 9,089 6397 5809 4417 3945 2,903 4,923 2,400
FEBRUARY 6,448 4651 6019 3973 3963 2,843 4,045 2,321
MARCH 6,691 6541 6143 3994 5015 3,546 4,416 2,763
First Quarter 22,228 17,589 17,971 12,384 12,923 9,292 13,385 7,485
APRIL 4,994 6,055 5,010 2,584 4,365 2,755 3,096 2,357
MAY 4,513 5,488 5,486 2,434 4,355 2,951 3,027 2,381
JUNE 4,732 5,818 6,103 2,432 5,159 3,516 3,858 2,781
2nd Quarter 14,239 17,361 16,599 7,450 13,879 9,222 9,981 7,520
1st Half Total 36,467 34,950 34,570 19,834 26,802 18,514 23,366 15,005
JULY 3,469 4,363 5,506 1,711 3,609 2,252 2,934 1,648
AUGUST 3,562 3,727 5,094 1686 3654 1,951 3,116 1,717
SEPTEMBER 6,194 4,851 6861 2288 4265 2,371 3,818 2,702
3rd Quarter 13,225 12,941 17,461 5,685 11,528 6,574 9,869 6,067
OCTOBER 6,125 5,365 6,082 2267 3126 2,390 3,104 2,486
NOVEMBER 8,343 5,357 5,650 2771 3235 2,654 2,848 3,006
DECEMBER 8,879 6,616 6,519 3487 3469 3,839 3,139 3,443
4th Quarter 23,347 17,338 18,251 8,525 9,830 8,883 9,091 8,935
2nd Half Total 36,572 30,279 35,712 14,210 21,358 15,457 18,960 15,002 Annual Total 73,039 65,229 70,282 34,044 48,160 33,971 42,326 30,007
growth 2.3% -10.7% 7.7% -51.6% 41.5% -29.5% 24.6% -29.1%
ST. LUCIA BANANA EXPORTS
(Tonnes)
6

MONTH 1998 1999 2000 2001 2002 2003 2004 2005
January 10.07 9.53 7.51 4.17 4.38 3.71 5.96 3.20
February 8.74 6.82 8.31 4.15 4.39 3.22 5.06 3.18
March 7.08 9.95 8.57 4.49 5.96 4.65 5.56 3.72
1st Quarter 25.89 26.30 24.39 12.80 14.74 11.57 16.59 10.09
April 7.58 10.00 6.93 3.49 5.22 3.59 4.00 3.17
May 7.42 9.04 7.51 3.38 5.47 3.92 3.95 3.22
June 4.75 6.91 8.65 3.36 6.45 4.63 5.04 3.93
2nd Quarter 19.75 25.95 23.09 10.23 17.15 12.14 12.99 10.31
1st Half 45.64 52.25 47.48 23.02 31.89 23.71 29.58 20.41
July 3.45 4.47 6.1 2.25 4.49 3.01 3.85 2.24
August 3.14 3.43 5.67 2.22 4.49 2.63 4.01 2.34
September 9.09 5.57 7.66 3.16 5.39 3.21 4.78 3.80
3rd Quarter 15.68 13.47 19.43 7.63 14.37 8.85 12.64 8.38
October 8.98 7.19 6.35 2.89 3.97 3.25 3.91 3.56
November 15.02 6.90 5.85 3.44 4.12 3.43 3.66 4.29
December 7.09 7.16 6.86 4.18 4.26 4.33 4.05 4.84
4TH QTR 31.09 21.25 19.06 10.51 12.35 11.01 11.63 12.69
2ND HALF 46.77 34.72 38.49 18.14 26.72 19.86 24.26 21.07
TOTAL 92.41 86.97 85.97 41.16 58.61 43.57 53.84 41.48
growth 7.5% -5.9% -1.1% -52.1% 42.4% -25.7% 23.6% -23.0%
ST. LUCIA BANANA REVENUE EARNINGS($EC Millions)
7

Country 1995 1996 1997 1998 1999 2000 2001 2002 2003 2004 2005
St.Lucia 103,668 104,805 71,395 73,042 65,231 70,281 34,044 48,160 33,971 42,326 30,006.79
Dominica 32,324 39,553 34,903 28,135 27,264 27,157 17,575 16,983 10,379 12,720.70 10,599.35
St.Vincent 49,899 43,986 31,020 39,887 37,379 42,339 30,497 33,243 22,558 22,631.11 17,363.18
Grenada 4,529 1,850 102 94 583 722 566 507 393 337.73 0.00
TOTAL 190,420 190,194 137,420 141,158 130,457 140,499 82,843 98,893 67,301 78,015 57,969
Average Monthly Exports 15,868 15,850 11,452 11,763 10,871 11,708 6,904 8,241 5,608 6,501 4,831
1995 1996 1997 1998 1999 2000 2001 2002 2003 2004 2005
St.Lucia 54.44% 55.10% 51.95% 51.74% 50.00% 50.02% 41.09% 48.70% 50.48% 54.25% 51.76%
Dominica 16.98% 20.80% 25.40% 19.93% 20.90% 19.33% 21.21% 17.17% 15.42% 16.31% 18.28%
St.Vincent 26.20% 23.13% 22.57% 28.26% 28.65% 30.13% 36.81% 33.62% 33.52% 29.01% 29.95%
Grenada 2.38% 0.97% 0.07% 0.07% 0.45% 0.51% 0.68% 0.51% 0.58% 0.43% 0.00%
TOTAL 100.00% 100.00% 100.00% 100.00% 100.00% 100.00% 100.00% 100.00% 100.00% 100.00% 100.00%
WINWARD ISLAND BANANA EXPORTSTonnes
SHARE OF WINWARD ISLAND BANANA EXPORTS
Source: WIBDECO
8

Species 2000 2001 2002 2003 2004 2005
Shark 4.9 4.5 66.1 5.9 20.2 11.6
Dolphin 555.1 426.9 372.8 286.6 375.7 198.3
Wahoo/Kingfish 243.1 214 246.2 169.3 238.0 168.9
Tuna 473.4 404.2 219.1 456.2 418.6 465.7
Flying Fish 98.5 323.3 170.1 75.5 10.6 71.5
Others 485.1 593.8 538.2 454.5 456.7 470.3Total 1,860.1 1,966.7 1,612.5 1,448.0 1,519.8 1,386.2
growth 8.5% 5.7% -18.0% -10.2% 5.0% -8.8%
Species 2000 2001 2002 2003 2004 2005
Shark -15.5% -8.2% 1368.9% -91.1% 242.4% -42.7%
Dolphin -5.6% -23.1% -12.7% -23.1% 31.1% -47.2%
Wahoo/Kingfish -21.6% -12.0% 15.0% -31.2% 40.6% -29.1%
Tuna 46.1% -14.6% -45.8% 108.2% -8.2% 11.3%
Flying Fish 47.5% 228.2% -47.4% -55.6% -86.0% 574.3%
Others 15.3% 22.4% -9.4% -15.6% 0.5% 3.0%Total 8.5% 5.7% -18.0% -10.2% 5.0% -8.8%
FISH LANDINGS
Source Ministry of Agriculture
Others include Snapper, Lobster and Conch
FISH LANDINGSGROWTH
Source Ministry of Agriculture
Others include Snapper, Lobster and Conch
Tonnes
9

Period 2000 2001 2002 2003 2004 2005 2000 2001 2002 2003 2004 2005
First Quarter 71,932 49,146 49,596 17,320 -$ -$ $172,771.00 $159,724.00 152,261.00$ 56,290.00$ -$ -$
Second Quarter 77,536 38,974 51,692 17,134 -$ -$ $176,335.00 $126,665.00 158,696.00$ 55,684.00$ -$ -$
Sub Total 149,468 88,120 101,288 34,454 -$ -$ $349,106.00 $286,389.00 310,957.00$ 111,974.00$ -$ -$
Third Quarter 73,811 38,453 50,437 N/A -$ -$ $180,522.00 $111,162.90 163,920.00$ N/A -$ -$
Fourth Quarter* 74,264 34,761 23,277 N/A -$ -$ $137,530.00 $91,462.16 75,650.00$ N/A -$ -$
Sub Total 148,075 73,215 73,714 N/A -$ -$ $318,052.00 $202,625.06 239,570.00$ N/A -$ -$ Annual Total 297,543 161,335 175,002 34,454 -$ -$ $667,158.00 $489,014.06 550,527.00$ 111,974.00$ -$ -$
Quarter 1 Quarter 2 Quarter 3 Quarter 4 Total
Quantity ('000 dozens) 482 763 745 903 305 356 207 245 1,113
Growth -47.5% 58.3% -2.4% 21.2%
Value ($'000) 2,892 4,578 3,725 5,418 1830 2136 1242 1468 6,676
Growth -51.5% 58.3% -18.6% 45.4%
Avr Lying Stock on Farms (' 000 Hens) 25 37 na 57 63 47 27 32 42
Source: Ministry of Agriculture
Source: Ministry of Agriculture & Beausejour Dairy Fa
2001
VALUEPRODUCTION (litres)
MILK PRODUCTION
EGG PRODUCTION
2002 2003 20042005
10

Crop CategoryQuantity (Tonnes) Value $EC Quantity
(Tonnes) Value $EC Quantity (Tonnes) Value $EC Quantity
(Tonnes) Value $EC Quantity (Tonnes) Value $EC
Fruit & Tree Crops 1,007.48 $1,097,042.93 712.67 $862,549.28 631.76 $911,343.84 497.23 $669,598.23 409.9 $686,712.44
Musa 523.78 $509,273.42 509.51 $408,179.43 331.78 $291,487.17 351.41 $308,672.76 342.7 $375,487.85
Traditional Vegetables 434.90 $1,459,040.84 328.71 $1,278,237.62 220.47 $871,980.43 197.34 $928,486.24 174.9 $1,029,274.32
Non Traditional Vegetables 478.08 $1,054,041.59 404.05 $916,729.96 352.45 $903,594.14 285.12 $843,935.68 287.2 $1,019,809.64
Roots & Tubers 442.33 $1,075,775.37 433.91 $843,808.45 265.12 $675,559.18 280.36 $723,471.75 211.9 $627,622.99
Condiments 46.57 $263,610.65 49.41 $302,117.90 45.01 $267,744.51 32.88 $230,728.32 30.8 $276,736.12Total 2,933.14 $5,458,784.80 2,438.26 $4,611,622.64 1,846.58 $3,921,709.27 1,644.33 $3,704,892.98 1457.3 4,015,643.36$ Growth -38.7% -35.2% -16.9% -15.5% -24.3% -15.0% -11.0% -5.5% -11.4% 8.4%
Quantity (Tonnes) Value $EC Quantity
(Tonnes) Value $EC Quantity (Tonnes) Value $EC Quantity
(Tonnes) Value $EC Quantity (Tonnes) Value $EC
Fruit & Tree Crops 195.2 $648,747.50 105.5 $333,578.68 501.4 $1,328,381.17 468.8 $1,185,995.00 415.2 $1,021,217.89
Musa 324.4 $329,003.75 101.5 $130,910.14 72.6 $112,358.33 84.5 $140,337.83 80.5 $126,583.05
Traditional Vegetables 96.8 $678,193.06 50.8 $349,168.39 131.8 $877,270.97 115.7 $811,269.14 80.2 $576,364.69
Non Traditional Vegetables 85.1 $381,473.16 49.1 $214,198.90 122.3 $529,673.95 126.8 $550,645.61 101.4 $461,503.89
Roots & Tubers 58.4 $311,487.91 46.2 $158,519.93 96.6 $351,447.65 107.3 $369,768.76 84.2 $307,608.02
Condiments 9.1 $108,095.59 5.1 $61,468.32 12.3 $145,220.81 12.7 $145,145.18 8.0 $93,589.78Total 769.0 $2,457,000.97 358.2 $1,247,844.36 936.9 $3,344,352.88 915.7 $3,203,161.52 769.4 2,586,867.30$
Growth -19.1% -28.7% -53.4% -49.2% 161.6% 168.0% -2.3% -4.2% -16.0% -19.2%
* Preliminary Data
2003
2005
HOTEL PURCHASES OF OF OTHER CROPS BY CATEGORY*
2004Crop Category
Source: Ministry of Agriculture
**Includes Purchases by the SLMB
SUPERMARKET PURCHASES OF OF OTHER CROPS BY CATEGORY**
2001 2002 2003
2001 2002 2004 2005
11

Quantity (Tonnes) Value $EC Quantity
(Tonnes) Value $EC Quantity (Tonnes) Value $EC Quantity
(Tonnes) Value $EC Quantity (Tonnes) Value $EC
Fruit & Tree Crops 1,202.7 $1,745,790.43 818.2 $1,196,127.96 1,133.2 $2,239,725.01 966.0 $1,855,593.23 825.1 $1,707,930.33
Musa 848.2 $838,277.17 611.0 $539,089.57 404.4 $403,845.50 435.9 $449,010.59 423.2 $502,070.90
Traditional Vegetables 531.7 $2,137,233.90 379.5 $1,627,406.01 352.3 $1,749,251.40 313.0 $1,739,755.38 255.1 $1,605,639.01
Non Traditional Vegetables 563.2 $1,435,514.75 453.1 $1,130,928.86 474.7 $1,433,268.09 411.9 $1,394,581.29 388.6 $1,481,313.53
Roots & Tubers 500.7 $1,387,262.28 480.1 $1,002,328.38 361.7 $1,027,006.83 387.6 $1,093,240.51 296.1 $935,231.01
Condiments 55.7 $371,706.24 54.5 $363,586.22 57.3 $412,965.32 45.6 $375,873.50 38.7 $370,325.90
Total 3,702.1 $7,915,784.77 2,796.5 $5,859,467.00 2,783.5 $7,266,062.15 2,560.1 $6,908,054.50 2,226.7 $6,602,510.66
growth -24.5% -26.0% -0.5% 24.0% -8.0% -4.9% -13.0% -4.4%
* Preliminary Data
2004Crop Category
2001 2002 2003
Source: Ministry of Agriculture
**Includes Purchases by the SLMB
2005
DOMESTIC PURCHASES OF OF OTHER CROPS BY CATEGORY**
12

1999 2000 2001 2002 2003 2004 2005
Total Visitor Arrivals 625,269 742,323 767,037 673,871 704,236 813,681 747,375of which:
Cruise Passengers 351,233 443,551 489,912 387,180 393,262 481,279 394,431
Stay-Over Arrivals 263,793 269,850 250,132 253,463 276,948 298,431 317,939
Yacht Arrivals n/a 16,069 19,817 25,516 21,209 22,530 27,464
Excursionists 10,243 12,853 7,176 7,712 12,817 11,441 7,541
Paid Bednights (in millions) 1.83 1.87 1.68 1.67 1.94 2.06 2.19
Tourist Expenditure ($EC Millions)1 740.0 752.3 623.88 558.50 750.77 879.28 961.16
Average Hotel Occupancy 72.5 63.8 57.0 56.1 62.7 61.9 68.7
All Inclusives 79.5 78.0 79.2 72.5 73.8 73.6 74.0
Semi-inclusive hotels2 n/a n/a n/a n/a 61.8 69.9 n/a
European Plan 65.1 46.2 48.8 45.4 54.7 51.8 66.0
Small Properties 62.6 60.3 50.4 50.4 59.6 60.4 66.2
Average Length of Stay 9.1 9.6 10.6 9.99 10.0 9.3 10.1
Cruise Ship Calls 356 389 378 245 262 328 258
of 82.34% was applied for 2004.
2. Based on the new classification; this category comprises hotels which are conventional but offer all-inclusive packages as well.
SELECTED VISITOR STATISTICS
1. For 2000 - 2003, the cruise component of total expenditure was revised downwards to reflect an average disembrakation ratio of 80.5% while a ratio of
13

Country of Origin 1999 2000 2001 2002 2003 2004 2005
USA 83,475 97,532 91,248 94,044 98,078 107,089 112,557
CANADA 13,153 14,968 12,213 12,927 13,494 15,315 16,506
EUROPE 102,690 98,869 82,601 76,698 90,193 97,862 100,085
United Kingdom 73,101 73,433 67,046 63,277 75,426 81,370 84,725
Germany 8,665 7,292 4,818 3,929 3,582 3,289 3,318
France 13,586 10,992 5,091 3,405 6,017 7,682 7,241
Rest of Europe 7,338 7,152 5,646 6,087 5,168 5,521 4,801
CARIBBEAN 60,342 54,595 61,047 66,409 70,543 74,242 84,729
Caricom 31,246 33,650 34,331 49,500 52,316 48,478 56,101
French West Indies 23,318 14,495 21,849 12,053 13,449 22,313 25,684
OTHER 4,133 3,886 3,023 3,385 4,640 3,923 4,062
TOTAL 263,793 269,850 250,132 253,463 276,948 298,431 317,939
Source: St.Lucia Tourist Board
STAY-OVER TOURIST ARRIVALS BY COUNTRY OF ORIGIN
14

MONTH Stay-over Excursionist Yacht Cruise Total Stay-over Excursionist Yacht Cruise Total Stay-over Excursionist Yacht Cruise Total Stay-over Excursionist Yacht Cruise Total
January 25,448 684 2,269 66,742 95,143 24,930 1,573 2,927 53,410 82,840 21,532 1,128 2,540 65,462 90,662 25,997 437 3,256 68,510 98,200February 23,627 731 2,277 56,352 82,987 21,875 1,286 2,243 48,736 74,140 25,766 1,154 2,427 59,660 89,007 27,229 351 2898 50,938 81,416March 23,123 526 3,045 58,120 84,814 23,387 1,013 2,436 52,224 79,060 24,977 1,294 1,573 67,887 95,731 30,320 329 2,675 60,392 93,716
Quarter 1 72,198 1,941 7,591 181,214 262,944 70,192 3,872 7,606 154,370 236,040 72,275 3,576 6,540 193,009 275,400 83,546 1,117 8,829 179,840 273,332
April 27,661 667 1,920 41,787 72,035 27,993 758 1,645 44,738 75,134 30,131 1,590 2,260 55,354 89,335 38,901 588 2,175 49,343 91,007May 23,001 318 2,800 17,238 43,357 25,372 803 2,283 13,073 41,531 26,196 561 2,615 18,456 47,828 28,469 502 2,955 8,253 40,179June 16,662 612 1,724 11,072 30,070 22,504 881 1,392 6,786 31,563 21,991 610 2,184 17,667 42,452 20,753 452 2,167 10,264 33,636
Quarter 2 67,324 1,597 6,444 70,097 145,462 75,869 2,442 5,320 64,597 148,228 78,318 2,761 7,059 91,477 179,615 88,123 1,542 7,297 67,860 164,822
First Half 139,522 3,538 14,035 251,311 408,406 146,061 6,314 12,926 218,967 384,268 150,593 6,337 13,599 284,486 455,015 171,669 2,659 16,126 247,700 438,154
July 21,920 835 2,025 9,509 34,289 26,228 1,427 1,353 6,756 35,764 29,926 2,530 1,151 15,099 48,706 28,839 1,259 2,009 7,099 39,206August 19,968 896 2,156 11,706 34,726 24,632 1,323 1,285 6,790 34,030 28,079 620 1,558 14,574 44,831 26,474 901 2,081 7,050 36,506September 14,185 668 576 8,202 23,631 17,392 858 399 8,184 26,833 17,748 959 645 20,777 40,129 16,016 493 854 10,200 27,563
Quarter 3 56,073 2,399 4,757 29,417 92,646 68,252 3,608 3,037 21,730 96,627 75,753 4,109 3,354 50,450 133,666 71,329 2,653 4,944 24,349 103,275
Oct 18,859 770 1,373 18,587 39,589 19,448 885 648 25,984 46,965 22,065 262 1,185 18,376 41,888 23,511 796 1,043 10,820 36,170Nov 19,612 661 1,734 29,860 51,867 20,665 942 527 54,666 76,800 23,214 327 1,321 54,618 79,480 23,538 680 1,585 53,766 79,569Dec 19,397 344 3,617 58,005 81,363 22,522 1,068 4,071 71,915 99,576 26,806 406 3,071 73,349 103,632 27,892 753 3,766 57,796 90,207
Quarter 4 57,868 1,775 6,724 106,452 172,819 62,635 2,895 5,246 152,565 223,341 72,085 995 5,577 146,343 225,000 74,941 2,229 6,394 122,382 205,946
Second Half 113,941 4,174 11,481 135,869 265,465 130,887 6,503 8,283 174,295 319,968 147,838 5,104 8,931 196,793 358,666 146,270 4,882 11,338 146,731 309,221
TOTAL 253,463 7,712 25,516 387,180 673,871 276,948 12,817 21,209 393,262 704,236 298,431 11,441 22,530 481,279 813,681 317,939 7,541 27,464 394,431 747,375
SLASPA
MONTHLY ARRIVALS BY CATEGORY
2005
Source: St. Lucia Tourist Board
200420032002
15

Country of Origin Jan Feb Mar Quarter 1 Apr May Jun Quarter 2 Jul Aug Sept Quarter 3 Oct Nov Dec Quarter 4 TOTAL2005 2005 2005 2005 2005
USA 8,923 8,892 10,479 28,294 14,061 10,111 9,658 33,830 9,614 8,568 5,684 23,866 8,558 8,535 9,474 26,567 112,557
CANADA 2,768 2,803 2,431 8,002 1,274 955 524 2,753 789 715 459 1,963 710 1,264 1,814 3,788 16,506
EUROPE 9,228 10,310 9,562 29,100 10,603 8,440 5,626 24,669 7,414 6,719 5,155 19,288 6,849 7,624 7,754 22,227 95,284
United Kingdom 8,144 8,361 8,085 24,590 9,144 7,642 5,083 21,869 6,766 6,219 4,813 17,798 6,474 6,888 7,106 20,468 84,725
Germany 486 487 470 1,443 375 214 127 716 172 94 118 384 207 312 256 775 3,318
France 598 1,462 1,007 3,067 1,084 584 416 2,084 476 406 224 1,106 168 424 392 984 7,241
CARIBBEAN 3,910 4,489 6,958 15,357 11,623 8,392 4,249 24,264 10,309 10,110 4,392 24,811 6,852 5,565 7,880 20,297 84,729
Caricom 2,885 3,183 5,134 11,202 8,339 5,789 3,083 17,211 5,811 5,715 3,407 14,933 4,060 3,921 4,629 12,610 55,956
French West Indies 820 1,180 1,589 3,589 2,930 2,251 1,037 6,218 4,094 3,998 751 8,843 2,474 1,428 3,015 6,917 25,567
OTHER/NOT STATED* 1,168 735 890 2,793 1,340 571 696 2,607 713 362 326 1,401 542 550 970 2,062 8,863
TOTAL 25,997 27,229 30,320 83,546 38,901 28,469 20,753 88,123 28,839 26,474 16,016 71,329 23,511 23,538 27,892 74,941 317,939
* Other/Not Stated is a merger of Rest of Europe and Other markets
MONTHLY STAY-OVER ARRIVALS BY MARKET2005
16

Dec-99 Dec-00 Dec-01 Dec-02 Dec-03 Dec-04 Dec-05 % Change 04-05
1. NET FOREIGN ASSETS 81,380 116,608 117,324 106,819 335,158 318,542 84,485 -73.48%(i) Central Bank (Imputed Reserves) 195,624 207,797 235,168 248,083 282,629 351,522 302,574 -13.92%
Imputed Assets 213,897 224,441 246,151 258,883 291,908 360,756 311,816 -13.57%
Imputed Liabilities 18,272 16,644 10,983 10,801 9,279 9,234 9,242 0.09%
(ii) Commercial Banks (net) -114,244 -91,189 -117,844 -141,264 52,529 -32,980 -218,089 561.28%
External (net) -113,085 -86,859 -165,246 -191,182 -143,606 -64,738 -91,870 41.91%
Assets 87,395 80,685 99,977 108,326 199,703 300,308 333,067 10.91%
Liabilities 200,480 167,544 265,246 299,508 343,309 365,046 424,937 16.41%
Other ECCB Territories (net) -1,159 -4,330 47,402 49,918 196,135 31,758 -126,219 -497.44%
Assets 59,126 55,308 76,003 124,311 229,108 144,064 141,310 -1.91%
Liabilities 60,285 59,638 28,601 74,393 32,973 112,306 267,529 138.21%
2. NET DOMESTIC ASSETS 1,011,887 1,062,779 1,117,001 1,166,497 1,035,248 1,190,496 1,627,294 36.69%
2(a) Domestic Credit 1,114,578 1,196,740 1,381,820 1,427,960 1,323,409 1,465,177 1,777,861 21.34%(i) Private Sector 1,394,185 1,481,687 1,541,773 1,553,471 1,498,204 1,650,069 1,917,268 16.19%
Households Credit 678,182 736,164 758,492 730,671 761,999 839,543 950,990 13.27%
Business Credit 716,003 745,523 783,281 822,800 736,205 810,526 966,278 19.22%
Loans 715,653 725,312 768,867 809,970 723,314 791,018 951,759 20.32%
Investments 350 20,211 14,414 12,830 12,891 19,508 14,519 -25.57%
(ii) Non-Bank Financial Institutions (NBFI) (Net) -38,589 -24,912 -43,421 -32,736 -39,300 -35,371 -37,781 6.81%Credit 30,469 30,663 25,913 28,266 31,660 30,830 36,757 19.22%
Loans 14,182 13,899 11,150 13,338 16,269 12,350 18,162 47.06%
Investments 16,287 16,764 14,763 14,928 15,391 18,480 18,595 0.62%
Deposits 69,058 55,575 69,334 61,002 70,960 66,201 74,538 12.59%
(iii) Subsidiaries and Affiliates (Net) -1,881 -1,603 165,099 162,419 157,836 174,683 168,500 -3.54%Credit 68 20 166,281 170,129 167,951 180,512 182,768 1.25%
Loans 5 20 883 7,466 7,825 7,950 16,041 101.77%
Investments 63 -- 165,398 162,663 160,126 172,562 166,727 -3.38%
Deposits 1,949 1,623 1,182 7,710 10,115 5,829 14,268 144.78%
(iv) Non-Financial Public Enterprises (Net) -175,373 -172,658 -168,563 -158,852 -186,404 -193,991 -185,241 -4.51%Credit 47,089 65,508 65,110 65,322 96,035 99,877 119,970 20.12%
Loans 42,250 65,508 64,584 65,322 96,035 99,877 119,970 20.12%
Investments 4,839 - 526 - - - -
Deposits 222,462 238,166 233,673 224,174 282,439 293,868 305,211 3.86%
(v) Central Government (Net) -63,763 -85,774 -113,068 -96,343 -104,399 -127,958 -84,885 -33.66%
Credit to Central Government 139,900 147,288 140,257 153,394 140,261 187,297 279,080 49.00%
Central Bank Credit 18,195 16,625 10,920 10,751 9,240 9,188 9,200 0.13%
Central bank Loans & Advances 6,627 6,238 5,104 5,501 3990 3,938 4,200 6.65%
Central bank Advances -1,220 1,912 1,860 3,338 2,909 3,938 4,200
Advances to Government - - - - - - -
Gov'ts Operating Accounts 1,219 1,912 1,860 3,338 2,909 3,938 4,200
Central Bank Loans 5,407 4,326 3,244 2,163 1,081 - -
Central Bank Treasury Bills Holdings 6,568 5,387 816 250 250 250
Central Bank Debentures 5,000 5,000 5,000 5,000 5,000 5,000 5,000 0.00%
Central Bank Interest due on Securities - - - - - -
Commercial Bank Credit 121,705 130,663 129,337 142,643 131,021 178,109 269,880 51.53%
Commercial Bank Loans & Advances 87,045 85,924 87,678 70,140 31,825 34,761 58,433 68.10%
Commercial Bank Treasury Bills Holdings 11,160 10,160 18,320 20,320 18,323 5,450 27,591 406.26%
Commercial Bank Debentures 23,500 34,579 23,339 52,183 80,873 137,898 183,856 33.33%
Deposits of Central Government (-) 203,664 233,062 253,326 249,737 244,660 317,510 363,965 14.63%
Commercial Banks Deposits 193,373 219,915 253,288 242,085 234,826 292,072 350,492 20.00%
Central Bank Deposits 10,291 13,147 38 7,652 9,834 22,935 13,473 -41.26%
Gov't Deposits, Call Acc & Fixed Deposits 10,237 13,146 35 7,649 9,828 22,933 13,190 -42.48%
Sinking Fund Call Account 54 1 1 1 5 1 282 26453.67%
Gov't Operating Accounts 0 0 1 1 1 1 1 6.95%Govt Securities Proceeds - - - - 27,000 - -
2(b). Others Items (Net) -102,692 -133,961 -264,818 -261,462 -288,161 -274,681 -150,567 -45.18%
3. MONETARY LIABILITES (M2) 1,093,267 1,179,387 1,234,325 1,273,316 1,370,406 1,509,038 1,711,779 13.44% 3(a) MONEY SUPPLY (M1) 267,616 286,053 283,828 287,615 343,130 481,194 547,321 13.74%
(i) Currency held by the Public 84,057 84,598 82,089 83,588 91,297 99,160 106,380 7.28%
Currency in Circulation 124,413 121,884 119,091 124,392 132,321 140,470 161,720 15.13%
Cash at Commercial Banks -40,356 -37,286 -37,002 40,804 -41,024 41,310 55,340 33.96%
(ii) Private Sector Demand Deposits 183,559 201,455 201,739 204,027 251,833 382,034 440,941 15.42%
3(b). QUASI-MONEY 825,651 893,334 950,497 985,701 1,027,276 1,027,844 1,164,458 13.29%
(iii) Private Sector Savings Deposits 512,514 551,119 573,302 652,331 755,214 810,422 916,341 13.07%
(iv) Private Sector Time Deposits 292,190 334,661 364,399 309,589 240,191 178,695 185,881 4.02%
(v) Private Sector Foreign Currency Deposits 20,947 7,554 12,796 23,781 31,871 38,727 62,236 60.70%
DETAILED MONETARY SURVEY(EC$ 000s)
17

DEPOSITS 1999 2000 2001 2002 2003 2004 2005
RESIDENTS 1,495.99 1,610.00 1,709.71 1,724.70 1,877.45 2,070.37 2,349.91Central and Local Government 192.20 218.20 252.27 238.21 233.96 294.58 349.77
Statutory Bodies and Gov't Corps 222.20 237.20 233.55 224.15 282.39 293.87 304.93
of which NIS 163.02 184.11 183.80 174.37 229.54 240.93 247.91
Business Firms 139.70 165.50 205.79 182.59 214.75 250.74 343.51
Private Individuals 848.50 921.70 933.65 983.36 1032.49 1120.41 1,199.66
Non-Bank Financial Institutions 69.05 55.58 55.84 60.542 70.044 64.34 73.28
Subsidiaries & Affliaites 1.95 1.62 1.182 7.71 10.12 5.83 12.86
Foreign Currency 22.40 10.20 27.44 28.14 33.70 43.54 70.36
NON-RESIDENTS 122.50 118.70 131.268 147.21 145.31 169.42 187.59
TOTAL DEPOSITS 1,618.49 1,728.70 1,840.98 1,871.91 2,022.76 2,239.79 2,537.50
Growth 8.39% 6.81% 10.60% 1.68% 8.06% 10.73% 13.29%
CATEGORY 1999 2000 2001 2002 2003 2004 2005
DEMAND 262,063 260,594 264,351 285,099 372,297 516,406 621,348
TIME 733,668 824,473 878,599 798,918 750,639 753,497 797,479
SAVINGS 599,205 632,413 669,696 756,135 863,347 923,272 1,041,437
FOREIGN CURRENCY 23,580 11,330 28,335 31,758 36,477 46,618 77,234
TOTAL DEPOSITS 1,618,516 1,728,810 1,840,981 1,871,910 2,022,760 2,239,793 2,537,498
Growth 8.39% 6.81% 6.49% 1.68% 8.06% 10.73% 13.29%
[In EC$ millions]As at Dec.31.st
COMMERCIAL BANKSTOTAL DEPOSITS BY DEPOSITORS
COMMERCIAL BANKSTOTAL DEPOSITS BY CATEGORY
EC$ 000sAs at Dec. 31st
18

2000 2001 2002 2003 2004 2005Gross Liabilities 2,057.8 2,325.1 2,401.4 2,597.9 2,933.4 3,433.6
balances due to ECCB area banks 43.2 20.8 49.4 18.0 102.6 248.6
balance due to ECCB 0.9 2.1 1.0 4.0 - 10.2
Deposit Liabilities 1,728.8 1,841.0 1,871.9 2,022.7 2,239.8 2,537.5Demand 260.6 264.4 285.1 372.3 516.4 621.3
Time 824.5 878.6 798.9 750.6 753.5 797.5
Savings 632.4 669.7 756.1 863.3 923.3 1,041.4
Gross Assets 2,057.8 2,325.1 2,401.4 2,597.9 2,933.4 3,433.6
claims on ECCB area banks 24.4 56.2 78.9 184.7 95.2 70.5
Cash 37.3 37.0 40.8 41.0 41.3 55.3
Loans/Advances 1,649.5 1,709.2 1,721.2 1,656.3 1807.7 2,174.6
public sector 151.4 152.3 135.5 127.9 134.6 178.4
Source: Eastern Caribbean Central Bank
COMMERCIAL BANKSASSETS AND LIABILITIES
(EC$ millions)
19

1997 1998 1999 2000 2001 2002 2003 2004 2005
(1) CASH 38,323 53,583 43,648 44,565 44,937 51,341 51,553 50,209 68,036
(2) DEPOSITS AT ECCB 74,308 64,736 72,735 83,740 115,414 133,065 153,107 199,254 143,287
TOTAL 112,631 118,319 116,383 128,305 160,351 184,406 204,660 249,463 211,323
(3) Less STAT.REQ'D RESRVS. 77,851 89,590 97,111 103,729 129,884 149,369 165,775 202,065 171,172
(4) EXCESS RESERVES (LIQUIDITY) 34,780 28,729 19,272 24,576 30,467 35,037 38,885 47,398 40,151
Less Borrowings from Deposits
HELD FOR ECCB 0 0 0 0 0 0 0 0 0
ADJUSTED LIQUIDTIY 34,780 28,729 19,272 24,576 30,467 35,037 38,885 47,398 40,151
LOANS AND ADVANCES 1,307,186 1,422,160 1,560,498 1,649,516 1,709,230 1,721,214 1,656,308 1,807,708 2,174,580
DEPOSIT LIABILITIES 1,297,510 1,493,168 1,618,516 1,728,810 1,840,981 1,871,910 2,022,760 2,239,793 2,537,498
of which:
(i) Demand 220,608 233,010 262,063 260,594 264,351 285,099 372,297 516,406 621,348
(ii) Savings 488,573 564,542 599,205 632,413 878,599 756,135 863,347 923,272 1,041,437
(iii) Time 583,288 685,172 733,669 824,473 669,696 798,918 750,639 753,497 797,479
(iv) Foreign Currency 5,809 11,450 23,580 11,330 28,335 31,305 36,477 46,618 77,234
RATIO (%) 100.7 95.2 96.4 95.4 92.8 91.9 81.9 80.7 85.7
EXCESS RESERVES/DEPOSIT LIAB. 2.68 1.92 1.19 1.42 1.65 1.87 1.92 2.12 1.58
COMMERCIAL BANK LIQUIDITYAs at December 31st
(in EC$ 000s)
20

Deposit/Lending Rates for various maturities 2000 2001 2002 2003 2004 2005
Demand Deposits 3.0-6.0 3.0-6.0 3.0-5.0 0.0-4.5 0.0-3.5 0.0-3.5
Savings Deposits 4.0-6.0 4.0-6.0 3.0-5.5 3.0-4.75 3.0-4.75 3.0-4.75
Special Rates (if any) 4.5-9.0 4.5-8.75 4.5-8.75 3.5-8.75 1.5-8.75 1.5-8.00
Time Deposits
- Up to 3 months 2.0-6.0 2.0-6.0 2.0-6.0 2.0-5.5 1.0-4.5 1.0-3.0
- Over 3 months to 6 months 2.0-6.25 2.0-6.25 2.0-6.0 2.0-5.75 1.0-5.5 1.0-3.5
- Over 6 months to 12 months 2.0-9.25 2.0-6.5 2.0-6.0 2.0-6.0 1.0-5.5 1.0-4.0
- Over 1 year to 2 years 2.0-8.50 2.0-8.50 2.0-7.5 1.0-4.5 1.0-4.0
- Over 2 years - 2.5-8.50 2.5-8.50 2.0-7.0 1.0-4.5 1.0-3.75
Lending Rates
- Prime Rate 9.5-10.5 9.5-10.5 9.5-10.5 9.5-10.0 9.5-10.0 9.5-10.0
- Other Rates, Range 9.5-23.0 6.0-18.0 7.5-18.0 6.0-18.5 5.5-18.0 5.5-17.5
Add-on Loans, Range
- Nominal Interest Rate 8.50-18.00 8.0-18.0 8.50-18.00 7.0-18.00 6.0-18.00 6.0-18.00
- Effective Interest Rates 11.03-23.0 11.03-23.0 11.03-23.0 8.50-23.0 10.50-23.50 10.50-23.50
Length of Loan Period, Range 1 mth-25years 1 mth-25years 1 mth-25years 1 yr-35years 3mths-35years3mths-35years
COMMERCIAL BANKS STRUCTURE OF INTEREST RATES(In percent per annum)
21

1999 2000 2001 2002 2003 2004 2005 Growth 05 Share 05
Agriculture 21.00 26.18 35.29 30.18 29.35 28.50 26.52 -7.0% 1.2%
Fisheries 2.72 3.86 5.84 4.73 5.16 4.87 5.01 2.7% 0.2%
Mining and Quarry 1.71 0.96 1.25 - 3.92 3.67 4.96 35.3% 0.2%
Manufacturing 51.29 45.52 52.57 56.87 50.32 46.90 54.94 17.2% 2.5%
Public Utilites 15.90 20.23 31.35 37.52 22.34 21.71 20.66 -4.8% 1.0%
Construction & Land Dev. 66.47 84.54 99.93 110.90 101.42 108.48 121.77 12.2% 5.6%
Distributive Trades 195.40 200.35 198.92 214.05 197.79 195.16 227.72 16.7% 10.5%
Tourism 146.50 139.95 152.85 190.20 176.03 204.09 270.90 32.7% 12.5%
Entertainment & Catering 16.60 15.27 19.76 21.99 22.74 19.26 22.87 18.8% 1.1%
Transport 48.20 55.80 48.96 33.21 22.97 24.03 50.15 108.7% 2.3%
Financial Institutions 12.07 12.45 9.50 15.23 26.90 17.20 43.09 150.6% 2.0%
Professional & Other Services 125.80 119.02 134.45 135.89 124.98 168.22 218.54 29.9% 10.0%
Gov't Services/Public Adm 115.20 124.23 125.48 112.33 67.48 102.49 149.92 46.3% 6.9%
Personal 741.63 801.18 793.09 758.12 799.92 863.15 957.55 10.9% 44.0%
Acquisition of Property 337.70 378.29 319.51 325.70 343.83 413.38 464.95 12.5% 21.4%
Home Const. & Renovation 183.63 239.77 169.69 177.31 179.84 219.17 220.03 0.4% 10.1%
House & Land Purchase 154.10 138.52 149.82 148.38 163.99 194.22 244.92 26.1% 11.3%
Durable Consumer Goods 99.40 103.76 90.07 63.86 64.76 80.51 109.67 36.2% 5.0%
Other Personal 304.50 319.10 383.52 368.56 391.34 369.25 382.93 3.7% 17.6%
TOTAL 1560.49 1649.52 1709.23 1721.21 1656.31 1807.72 2174.58 20.3% 100.0%
Growth 9.7% 5.7% 3.62% 0.70% -3.77% 9.14%
Source: Eastern Caribben Central Bank
As as Dec.31st.
COMMERCIAL BANKS' CREDIT BY SECTOR(In EC$ Millions)
22

2000 2001 2002 2003 2004 2005
Net Imputed international reserves 207.80 235.20 248.08 282.63 351.52 306.77
Net claims on commercial banks -125.43 -164.00 -167.59 -190.74 -238.62 -191.92
Claims 0.019 0.06 0.050 0.039 0.05 0.04
Liabilities -125.45 -164.02 -167.64 -190.77 -238.66 -191.96
Currency -37.29 -37.00 -40.80 -41.02 -41.31 -55.34
Current deposits -84.41 -123.30 -126.84 -149.75 -197.35 -136.62of which Fixed Deposits -3.80 -3.80 -0.68 -0.68 -0.68 -0.68
Net claims on Statutory Bodies -1.25 -0.003 -0.003 -0.003 0.00 0.00
Net Domestic Assets -123.20 -153.10 -164.49 -191.33 -252.36 -200.39
Net Credit to Central Government 3.50 10.90 3.10 0.59 -13.75 -8.47
Treasury bills 5.38 0.82 0.25 0.25 0.25 0.00
Debentures 5.00 5.00 5.00 5.00 5.00 5.00
Temporary advances 1.91 1.86 3.34 2.90 3.938 -
Other Claims 4.32 3.24 2.16 1.08 - -
Central Government Deposits -10.29 -13.15 -7.62 -9.83 -22.94 -13.47
Liabilities to the Private Sector 84.60 82.10 83.59 91.28 99.16 106.38
Total currency issued 121.90 119.10 124.39 132.32 140.47 161.72
Currency held by banks -37.30 -37.00 -40.80 -41.02 -41.31 -55.34
Dec-00 Dec-01 Dec-02 Dec-03 Dec-04 Dec-05
CENTRAL BANK:
Net (Imputed) Share of Reserves 207.8 235.17 248.63 282.63 351.52 306.77
Percentage Change (%) 6.2% 13.2% 5.7% 13.7% 24.4% -12.7%
Comm. Banks Net Foreign Assets (liabilities) -91.2 -117.9 -141.3 52.5 -33.0 -218.1
Percentage Change (%) 20.14 29.28 19.82 -137.18 -162.78 561.28
TOTAL NET FOREIGN ASSETS(LIABILITIES) 116.6 117.27 107.37 335.16 318.54 88.68
Percentage Change (%) 43.2 0.6 -8.45 212.16 -4.96 -72.16
(In EC$ millions)
Source: Eastern Caribbean Central Bank
ECCB OPERATIONS WITH ST LUCIA (In EC$ millions)
ST LUCIAEXTERNAL RESERVES
23

MONTH\YEAR 1999 2000 2001 2002 2003 2004 2005
January 155.20 165.40 173.30 173.10 176.80 176.90 181.50
February 155.80 165.70 173.50 173.60 177.70 176.40 183.30
March 156.60 167.40 174.10 175.60 178.10 177.20 184.50
April 156.70 167.60 176.20 176.80 177.50 177.70 186.20
May 159.60 168.10 175.80 176.60 178.70 180.40 187.40
June 162.70 166.30 177.80 176.50 178.30 181.00 187.50
July 161.70 168.30 177.70 176.30 177.90 182.60 189.90
August 161.50 167.60 176.60 175.80 177.00 182.30 187.50
September 163.10 164.60 176.90 175.70 176.40 180.50 186.50
October 166.70 167.00 175.70 176.10 177.20 179.70 187.30
November 167.00 168.60 178.10 175.40 176.70 182.60 190.70
December 167.90 168.30 177.50 176.30 177.20 183.40 192.90
Annual Ave. 161.21 167.08 176.10 175.65 177.46 180.06 187.10
Inflation Rates as at December:
(Moving Average) 3.48% 3.64% 5.40% -0.26% 1.03% 1.47% 3.91%
(Point to Point) 6.20% 0.24% 5.47% -0.68% 0.51% 3.50% 5.18%
Source: Statistics Department
CONSUMER PRICE INDEXAnnual Inflation Rates
(Base Year April 1984 =100)
24
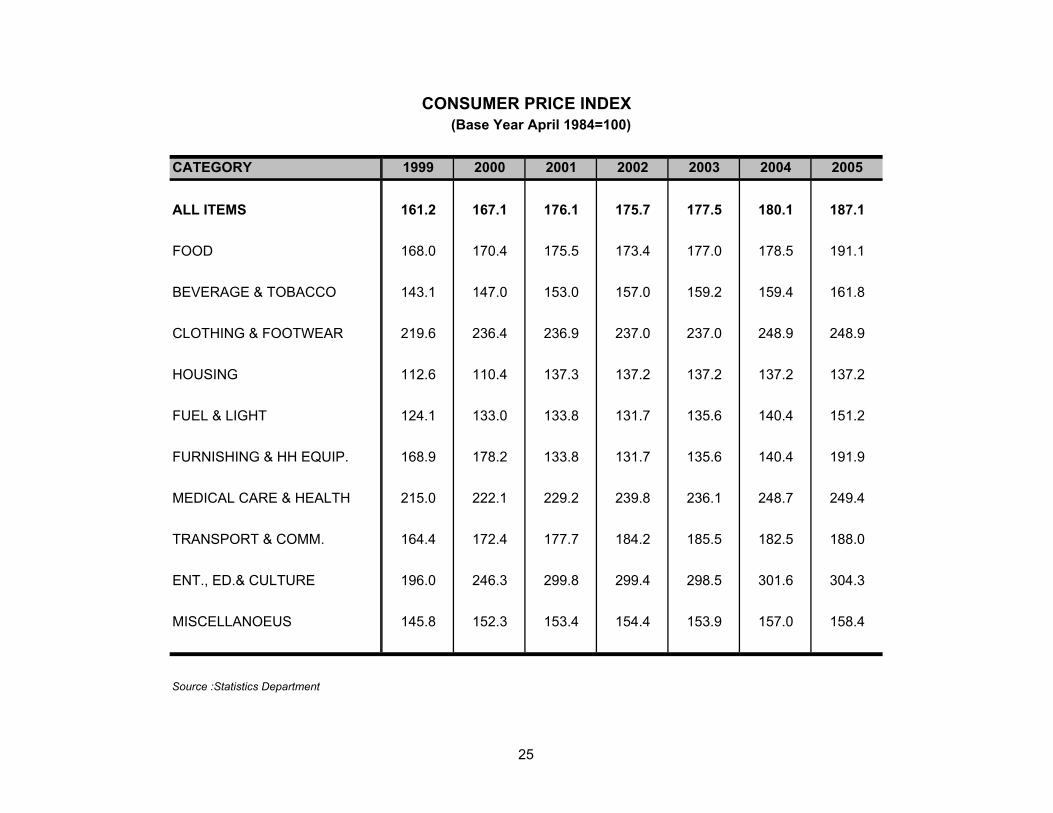
CATEGORY 1999 2000 2001 2002 2003 2004 2005
ALL ITEMS 161.2 167.1 176.1 175.7 177.5 180.1 187.1
FOOD 168.0 170.4 175.5 173.4 177.0 178.5 191.1
BEVERAGE & TOBACCO 143.1 147.0 153.0 157.0 159.2 159.4 161.8
CLOTHING & FOOTWEAR 219.6 236.4 236.9 237.0 237.0 248.9 248.9
HOUSING 112.6 110.4 137.3 137.2 137.2 137.2 137.2
FUEL & LIGHT 124.1 133.0 133.8 131.7 135.6 140.4 151.2
FURNISHING & HH EQUIP. 168.9 178.2 133.8 131.7 135.6 140.4 191.9
MEDICAL CARE & HEALTH 215.0 222.1 229.2 239.8 236.1 248.7 249.4
TRANSPORT & COMM. 164.4 172.4 177.7 184.2 185.5 182.5 188.0
ENT., ED.& CULTURE 196.0 246.3 299.8 299.4 298.5 301.6 304.3
MISCELLANOEUS 145.8 152.3 153.4 154.4 153.9 157.0 158.4
Source :Statistics Department
CONSUMER PRICE INDEX (Base Year April 1984=100)
25

CATEGORY 1999 2000 2001 2002 2003 2004 2005
ALL ITEMS 3.5% 3.6% 5.4% -0.3% 1.0% 1.5% 3.9%
FOOD 2.9% 1.4% 3.0% -1.2% 2.1% 0.8% 7.1%
BEVERAGE & TOBACCO 0.9% 2.7% 4.1% 2.6% 1.4% 0.1% 1.5%
CLOTHING & FOOTWEAR 5.5% 7.7% 0.2% 0.0% 0.0% 5.0% 0.0%
HOUSING 0.0% -2.0% 24.4% 0.0% 0.0% 0.0% 0.0%
FUEL & LIGHT 0.6% 7.2% 0.6% -1.6% 3.0% 3.5% 7.7%
FURNISHING & HH EQUIP. 6.0% 5.5% -24.9% -1.6% 3.0% 3.5% 36.7%
MEDICAL CARE & HEALTH 8.3% 3.3% 3.2% 4.6% -1.5% 5.3% 0.3%
TRANSPORT & COMM. 0.2% 4.9% 3.0% 3.7% 0.7% -1.7% 3.0%
ENT., ED.& CULTURE 13.4% 25.6% 21.7% -0.1% -0.3% 1.0% 0.9%
MISCELLANOEUS 5.5% 4.4% 0.7% 0.7% -0.3% 2.0% 0.9%
CONSUMER PRICE INDEX (Base Year April 1984 = 100)
Percentage Changes
26

Quantity Value Quantity Value Quantity Value Quantity Value Quantity Value Food, Beverage & Tobacco NA $50,984,987.00 NA $60,052,889.00 $64,261,194.00 $69,099,007.00 $78,001,583.00
Wearing Apparel doz. 21,474 $1,932,743.00 17,337 $1,464,552.00 11,977 $1,011,098.00 15,930 $1,039,284.00 15,274 $905,891.00
Textile No. 144,487,874 $1,772,711.00 103,930,114 $4,846,851.00 99,988,771 $7,234,658.00
Other Paper & Paperboard cases 143,698 $3,596,546.00 101,479 $2,227,537.00 82,468 $1,790,480.00 67,885 $1,472,018.00 86,801 $1,850,644.00
Wood & Wood Products $1,928,853.00 $1,926,789.00 $2,578,895.00 $81,164.00 $69,296.00
Electrical Products No. 19,057,975 $17,637,450.00 20,821,769 $25,368,595.00 13,941,696 $18,477,267.00 14,655,286 $24,529,242.00 11,890,114 $28,279,338.00
Basic Industrial Chemicals cu. ft. 15,023,950 $388,623.00 1,636,137 $426,024.00 1,635,706 $408,833.00 1,722,437 $836,085.00 1,882,319 $1,287,939.00
Other Chemicals $3,399,346.00 $4,740,829.00 $5,044,213.00 $4,813,214.00 $6,903,990.00
Plastic Products No. 1,726,841 $3,064,058.00 1,708,018 $3,157,175.00 1,659,461 $3,014,081.00 1,774,021 $3,295,694.00 1,810,871 $3,442,505.00
Rubber Products No. 4,454 $786,852.00 3,541 $683,514.00 3,052 $571,573.00 3,554 $742,426.00 3,286 $724,484.00
Printed Material $2,589,731.00 $2,762,909.00 $2,778,971.00 $3,047,631.00 889,932 $2,935,707.00
Metal Products Tonnes $4,800,322.00 2,886 $4,282,809.00 4,089 $6,190,271.00 3,969 $7,757,025.00 4,171 $9,443,674.00
Total $109,430,073.00 $133,147,036.00 $133,401,288.00 $137,373,544.00 $153,561,805.00Copra & Copra Derivatives
Copra L.Tonnes 2,189 $2,124,209.00 1,270 $1,138,311.00 1,535 $1,364,707.00 1,094 $1,102,750.00 714 $819,652.00
Raw Coconut Oil Galls 345,092 $3,623,463.27 69,867 $733,607.00 54,035 $576,368.00 136,610 $1,434,402.00 105,759 $1,214,980.00
Refined Coconut Oil Galls 191,901 $2,590,663.50 151,092 $2,039,742.00 193,063 $2,552,895.00 160,766 $2,170,345.00 71,494 $965,170.00
Coconut Meal kgs 1,172,250 $234,448.00 329,967 $145,360.00 428,667 $188,740.00 649,200 $129,740.00 453,400 $90,681.00
Total Copra & Copra Derivatives $8,572,783.77 $4,057,020.00 $4,682,710.00 $4,837,237.00 $3,090,483.00
Total $118,002,856.77 $137,204,056.00 $138,083,998.00 $142,210,781.00 $156,652,288.00-15.82% 16.27% 0.64% 2.99% 10.16%
Source: Statistics Department
2003r
10,260,000 Corrugated Paper & Paper Board & Containers of Paper & Paper Board No.
Growth
Commodities Manufactured Unit 2001
MANUFACTURING PRODUCTION
2005
9,858,000 $19,716,754.00$20,039,754.00
2004
10,741,600
2002
$16,547,851.00 $20,660,754.00$21,206,563.007,977,561 14,069,000
27

Percentage Share of TotalCategory 2000 2001 2002 2003 2004 2005 Change (04/05) Sales (2005)
Domectic Use 85,075 88,443 89,083 93,329 95,877 98,917 3.17% 35.66%
Ave. No. of Consumers 40,042 41,982 43,460 44,980 46,347 47,417 2.31%
Commercial Use 85,192 88,577 86,679 91,779 95,697 101,597 6.17% 36.62%
Ave. No. of Consumers 5,444 5,210 5,134 5,134 5,259 5,423 3.12%
Hotel Use 46,670 48,440 47,317 53,109 55,446 56,884 2.59% 20.51%
Ave. No of Hotels 37 33 33 48 48 52 8.33%
Industrial Use 13,249 12,955 12,710 13,221 13,031 12,522 -3.91% 4.51%
Ave. No. of Ind Consumers 114 117 112 112 96 98 2.08%
Streetlighting 3,893 5,003 3,619 4,720 6,513 7,480 14.85% 2.70%
Total Sales 234,080 243,417 239,409 256,158 266,564 277,400 4.07% 100.00%
Internal use 11,759 12,211 11,939 11,973 12,134 13,407 10.49%
Loss in transmission 29,108 29,114 33,212 37,362 30,439 33,115 8.79%
Total Generated 274,946 284,742 284,560 305,493 309,137 323,922 4.78%
Line Loss % 10.59% 10.22% 11.67% 12.23% 9.85% 10.22% 3.83%
Source: LUCELEC
ELECTRICITY CONSUMPTION AND OUTPUTKilowatt hours (KWh)
28

1998 1999 2000 2001 2002 2003 2004 2005January 14.4 8.8 17.8 18.8 12.6 18.8 19.36 26.40
February 12.8 8.2 13.8 20.2 12.4 18.83 20.23 26.21
March 12.6 7.9 16.4 16.2 12 22.4 18.6 25.92
April 13.7 11.2 18.5 17.6 15.6 21.53 19.78 32.18
May 12.1 10 16.7 16.5 15 16.5 19.66 32.74
June 12.5 11.5 18.2 17.9 15.6 17.76 21.89 29.60
July 9.9 10.3 17.2 16.6 14.3 16.52 20.6 32.42
August 10.4 12.8 18.1 15.7 16.3 17.7 23.49 33.98
September 9.8 12.9 20.6 16.4 15.7 18.11 26.34 37.34
October 10.1 14.4 21.3 15.4 15.9 16.32 24.28 36.50
November 10.3 14 22.2 15.6 17.2 18.28 30.61 35.92
December 9.9 15.4 22.8 13.4 15.4 17.84 26.34 36.00Average 11.54 11.45 18.63 16.69 14.83 18.38 22.60 32.10
Source: LUCELEC
1998 1999 2000 2001 2002 2003 2004 2005January 2.34 1.75 2.70 3.49 2.33 3.19 3.19 4.75
February 2.26 1.67 3.17 3.43 2.59 2.59 3.6 4.9
March 2.16 1.89 3.13 3.19 2.72 3.58 3 5.47
April 2.17 2.04 3.02 2.94 2.75 3.42 3.92 5.49
May 2.11 2.04 3.11 3.02 2.7 2.52 3.2 5.24
June 2.00 2.08 3.20 3.11 2.81 2.96 3.63 5.76
July 1.94 2.27 3.25 3.07 2.89 2.63 3.42 5.93
August 1.87 2.44 3.50 2.93 3.07 2.83 3.76 6.42
September 1.99 2.60 3.83 2.97 3.09 3.00 4.17 6.43
October 1.99 2.58 3.78 2.97 2.99 2.64 4.21 6.31
November 1.87 2.74 3.86 2.71 3.19 3.03 5.14 6.75
December 1.73 2.83 3.49 2.45 3.19 2.94 4.59 6.96Average 2.04 2.24 3.34 3.02 2.86 2.94 3.82 5.87
Source : LUCELEC
This represents the fuel price paid by LUCELEC to Hess, the main supp
FUEL SURCHARGE (CENTS/UNIT)
FUEL PRICE ($/IMP. GALS.)
29
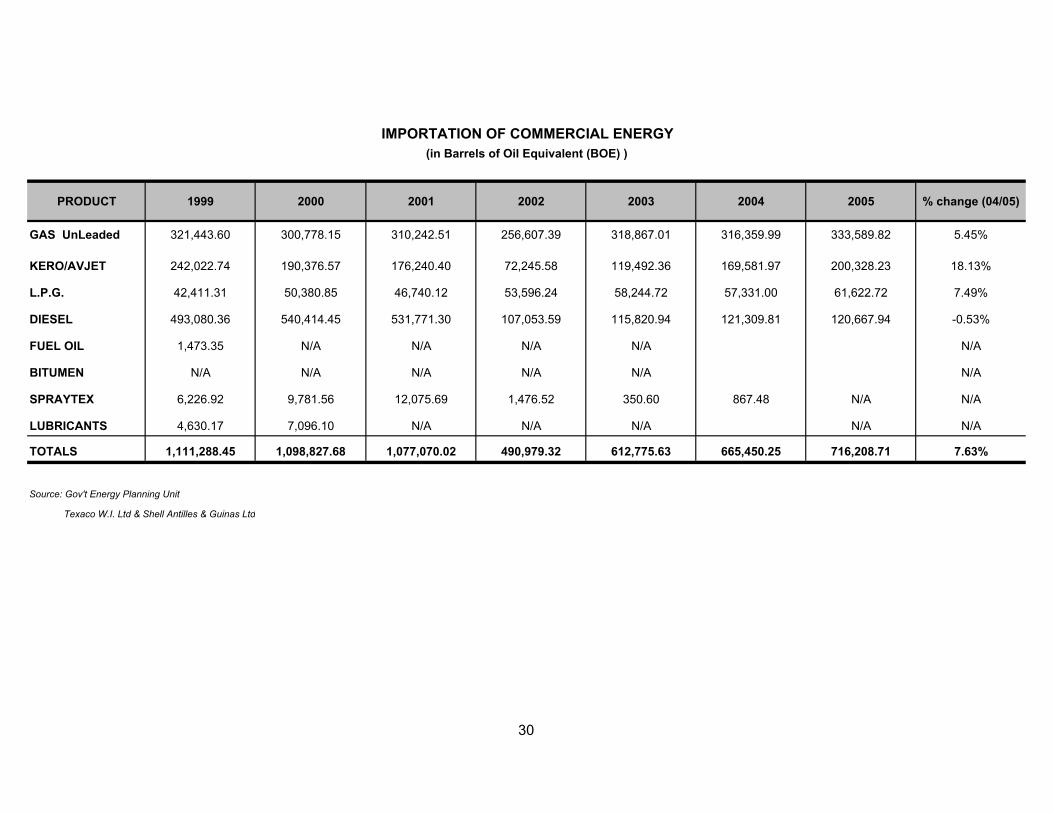
PRODUCT 1999 2000 2001 2002 2003 2004 2005 % change (04/05)
GAS UnLeaded 321,443.60 300,778.15 310,242.51 256,607.39 318,867.01 316,359.99 333,589.82 5.45%
KERO/AVJET 242,022.74 190,376.57 176,240.40 72,245.58 119,492.36 169,581.97 200,328.23 18.13%
L.P.G. 42,411.31 50,380.85 46,740.12 53,596.24 58,244.72 57,331.00 61,622.72 7.49%
DIESEL 493,080.36 540,414.45 531,771.30 107,053.59 115,820.94 121,309.81 120,667.94 -0.53%
FUEL OIL 1,473.35 N/A N/A N/A N/A N/A
BITUMEN N/A N/A N/A N/A N/A N/A
SPRAYTEX 6,226.92 9,781.56 12,075.69 1,476.52 350.60 867.48 N/A N/A
LUBRICANTS 4,630.17 7,096.10 N/A N/A N/A N/A N/A
TOTALS 1,111,288.45 1,098,827.68 1,077,070.02 490,979.32 612,775.63 665,450.25 716,208.71 7.63%
Texaco W.I. Ltd & Shell Antilles & Guinas Ltd
Source: Gov't Energy Planning Unit
IMPORTATION OF COMMERCIAL ENERGY(in Barrels of Oil Equivalent (BOE) )
30
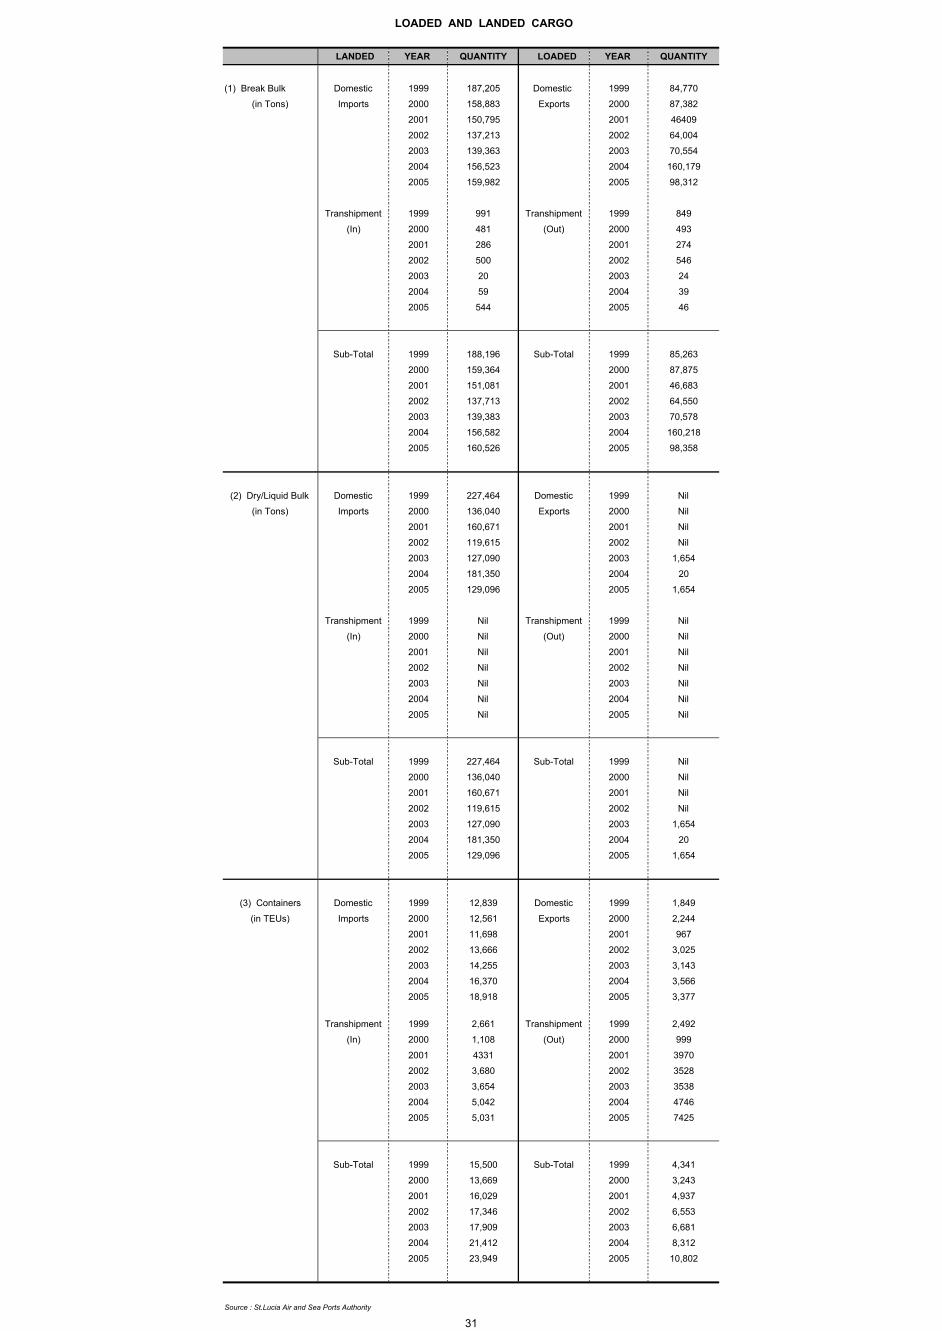
LANDED YEAR QUANTITY LOADED YEAR QUANTITY
(1) Break Bulk Domestic 1999 187,205 Domestic 1999 84,770
(in Tons) Imports 2000 158,883 Exports 2000 87,382
2001 150,795 2001 46409
2002 137,213 2002 64,004
2003 139,363 2003 70,554
2004 156,523 2004 160,179
2005 159,982 2005 98,312
Transhipment 1999 991 Transhipment 1999 849
(In) 2000 481 (Out) 2000 493
2001 286 2001 274
2002 500 2002 546
2003 20 2003 24
2004 59 2004 39
2005 544 2005 46
Sub-Total 1999 188,196 Sub-Total 1999 85,263
2000 159,364 2000 87,875
2001 151,081 2001 46,683
2002 137,713 2002 64,550
2003 139,383 2003 70,578
2004 156,582 2004 160,218
2005 160,526 2005 98,358
(2) Dry/Liquid Bulk Domestic 1999 227,464 Domestic 1999 Nil
(in Tons) Imports 2000 136,040 Exports 2000 Nil
2001 160,671 2001 Nil
2002 119,615 2002 Nil
2003 127,090 2003 1,654
2004 181,350 2004 20
2005 129,096 2005 1,654
Transhipment 1999 Nil Transhipment 1999 Nil
(In) 2000 Nil (Out) 2000 Nil
2001 Nil 2001 Nil
2002 Nil 2002 Nil
2003 Nil 2003 Nil
2004 Nil 2004 Nil
2005 Nil 2005 Nil
Sub-Total 1999 227,464 Sub-Total 1999 Nil
2000 136,040 2000 Nil
2001 160,671 2001 Nil
2002 119,615 2002 Nil
2003 127,090 2003 1,654
2004 181,350 2004 20
2005 129,096 2005 1,654
(3) Containers Domestic 1999 12,839 Domestic 1999 1,849
(in TEUs) Imports 2000 12,561 Exports 2000 2,244
2001 11,698 2001 967
2002 13,666 2002 3,025
2003 14,255 2003 3,143
2004 16,370 2004 3,566
2005 18,918 2005 3,377
Transhipment 1999 2,661 Transhipment 1999 2,492
(In) 2000 1,108 (Out) 2000 999
2001 4331 2001 3970
2002 3,680 2002 3528
2003 3,654 2003 3538
2004 5,042 2004 4746
2005 5,031 2005 7425
Sub-Total 1999 15,500 Sub-Total 1999 4,341
2000 13,669 2000 3,243
2001 16,029 2001 4,937
2002 17,346 2002 6,553
2003 17,909 2003 6,681
2004 21,412 2004 8,312
2005 23,949 2005 10,802
LOADED AND LANDED CARGO
Source : St.Lucia Air and Sea Ports Authority
31

Year Arrivals Departures Movements Disembarked Embarked Total Handled*
1997 15443 15,067 30,510 148,966 158,868 307,834
1998 14927 14,832 29,759 155,582 158,318 313,900
1999 15,527 15,504 31,031 177,385 180,751 358,136
2000 16,093 16,099 32,192 193,222 201,086 394,308
2001 16,432 16,352 32,784 198,682 204,979 403,661
2002 16,231 16,259 32,490 199,287 205,190 404,477
2003 16,374 16,404 32,778 210,561 216,919 427,480
2004 17,290 17,290 34,580 227,866 236,584 464,450
2005 16,260 16,260 32,522 206,468 212,628 419,096
Arrivals Departures Movements Disembarked Embarked Total Handled*
1997 5,312 5,312 10,624 178,564 168,310 346,874
1998 5,336 5,344 10,680 179,990 174,306 354,296
1999 5,748 5,764 11,512 179,905 181,933 361,838
2000 5,012 4,966 9,978 178,112 173,566 351,678
2001 4,318 4,653 8,971 153,973 148,242 302,215
2002 4,098 4,100 8,198 138,586 137,072 275,658
2003 4,518 4,518 9,036 157,186 153,421 310,607
2004 4,978 4,969 9,947 180,875 173,240 354,115
2005 5,970 5,969 11,939 199,617 194,732 394,349
* Excludes intransit passengers
AIRPORT TRAFFIC STATISTICS
AIRCRAFT LANDINGS PASSENGERS
Source : St.Lucia Air & Sea Ports Authority
G.F.L. Charles
Hewanorra
32

AIRCRAFT MOVEMENTS 1999 2000 2001 2002 2003 2004 2005Scheduled
Service Landings* 24,888 24,347 24,077 24,499 22,952 24,232 21,930
Non-scheduled
Service Landings* 13,100 13,062 13,938 13,457 16,508 18,003 20,048
OtherService Landings* 4,390 5,633 4,874 2,896 2,354 2,320 2,483
G. F. L. CHARLES AIRPORT
1999 2000 2001 2002 2003 2004 2005Scheduled
Service Landings* 20,124 20,220 21,122 21,780 20,270 21,284 19,146
Non-scheduled
Service Landings* 7,326 7,904 8,532 8,400 10,767 11,698 11,866
OtherService Landings* 3,518 4,814 3,762 2,310 1,741 1,562 1,510
HEWANORRA AIRPORT
1999 2000 2001 2002 2003 2004 2005Scheduled
Service Landings* 4,764 4,127 2,955 2,719 2,682 2,948 2,784
Non-scheduled
Service Landings* 5,774 5,158 5,406 5,057 5,741 6,305 8,182
OtherService Landings* 872 819 1,112 586 613 758 973
Source: St.Lucia Air & Sea Ports Authority
* Landings, as used in this table, mean Arrivals & Departures.
TOTAL
AIRCRAFT MOVEMENT BY ACTIVITIES
33
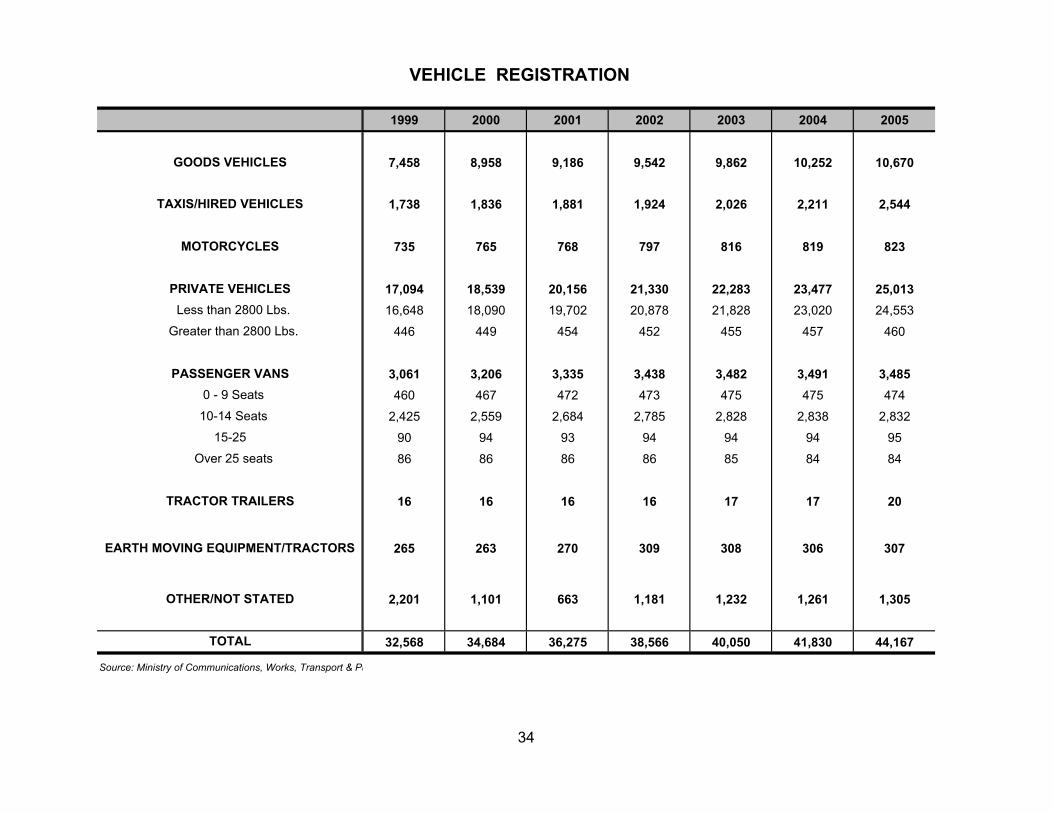
1999 2000 2001 2002 2003 2004 2005
7,458 8,958 9,186 9,542 9,862 10,252 10,670
1,738 1,836 1,881 1,924 2,026 2,211 2,544
735 765 768 797 816 819 823
17,094 18,539 20,156 21,330 22,283 23,477 25,01316,648 18,090 19,702 20,878 21,828 23,020 24,553
446 449 454 452 455 457 460
3,061 3,206 3,335 3,438 3,482 3,491 3,485460 467 472 473 475 475 474
2,425 2,559 2,684 2,785 2,828 2,838 2,832
90 94 93 94 94 94 95
86 86 86 86 85 84 84
16 16 16 16 17 17 20
265 263 270 309 308 306 307
2,201 1,101 663 1,181 1,232 1,261 1,305
32,568 34,684 36,275 38,566 40,050 41,830 44,167
VEHICLE REGISTRATION
Source: Ministry of Communications, Works, Transport & Pu
GOODS VEHICLES
TAXIS/HIRED VEHICLES
Greater than 2800 Lbs.
PASSENGER VANS
MOTORCYCLES
PRIVATE VEHICLES Less than 2800 Lbs.
TRACTOR TRAILERS
0 - 9 Seats
10-14 Seats
15-25
Over 25 seats
OTHER/NOT STATED
TOTAL
EARTH MOVING EQUIPMENT/TRACTORS
34
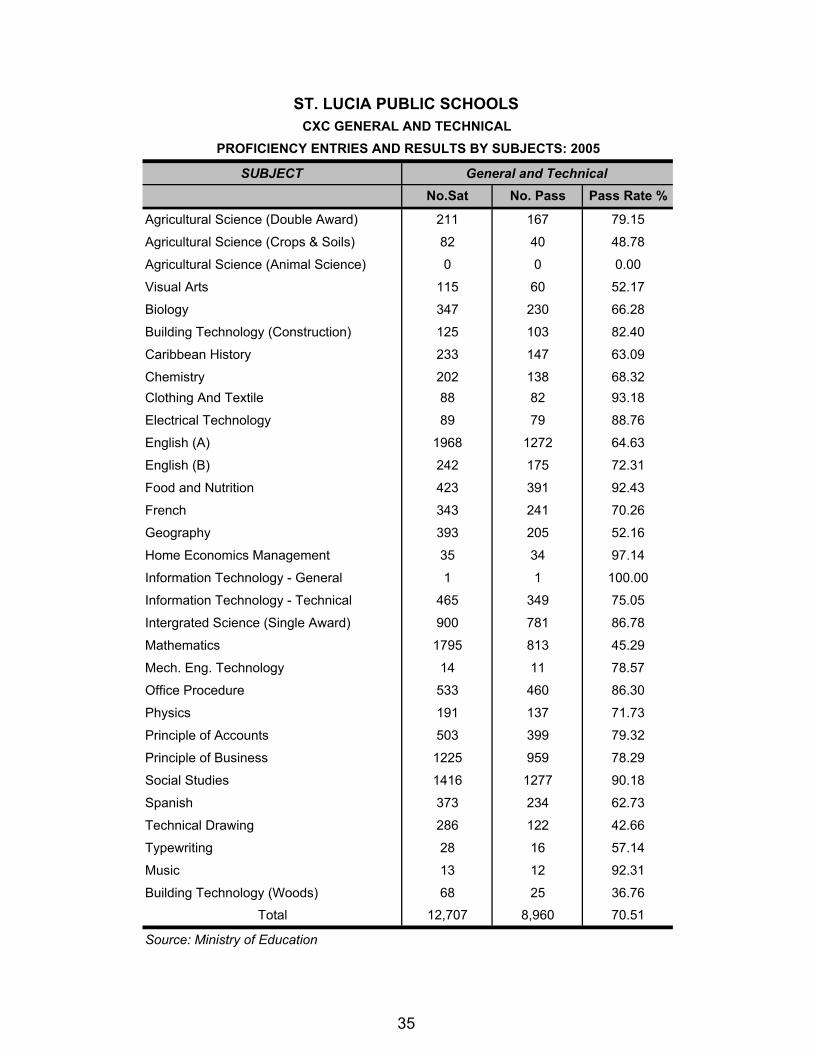
SUBJECT General and TechnicalNo.Sat No. Pass Pass Rate %
Agricultural Science (Double Award) 211 167 79.15
Agricultural Science (Crops & Soils) 82 40 48.78
Agricultural Science (Animal Science) 0 0 0.00
Visual Arts 115 60 52.17
Biology 347 230 66.28
Building Technology (Construction) 125 103 82.40
Caribbean History 233 147 63.09
Chemistry 202 138 68.32Clothing And Textile 88 82 93.18
Electrical Technology 89 79 88.76
English (A) 1968 1272 64.63
English (B) 242 175 72.31
Food and Nutrition 423 391 92.43
French 343 241 70.26
Geography 393 205 52.16
Home Economics Management 35 34 97.14
Information Technology - General 1 1 100.00
Information Technology - Technical 465 349 75.05
Intergrated Science (Single Award) 900 781 86.78
Mathematics 1795 813 45.29
Mech. Eng. Technology 14 11 78.57
Office Procedure 533 460 86.30
Physics 191 137 71.73
Principle of Accounts 503 399 79.32
Principle of Business 1225 959 78.29
Social Studies 1416 1277 90.18
Spanish 373 234 62.73
Technical Drawing 286 122 42.66
Typewriting 28 16 57.14
Music 13 12 92.31
Building Technology (Woods) 68 25 36.76
Total 12,707 8,960 70.51
Source: Ministry of Education
CXC GENERAL AND TECHNICAL PROFICIENCY ENTRIES AND RESULTS BY SUBJECTS: 2005
ST. LUCIA PUBLIC SCHOOLS
35

Number of pupils Number of TeachersYEAR No.of Schools Male Female TOTAL Male Female TOTAL
1990/91 83 16,661 15,741 32,402 166 931 1,127
1991/92 84 16,639 15,582 32,221 214 967 1,181
1992/93 85 16,456 15,472 31,928 203 971 1,174
1993/94 82 16,179 15,439 30,486 169 969 1,138
1994/95 84 15,986 15,208 31,194 195 985 1,180
1995/96 86 16,243 15,129 31,372 195 944 1,139
1996/97 84 16,387 15,161 31,584 213 962 1,175
1997/98 84 16,545 14,892 31,437 220 948 1,168
1998/99 82 14,393 14,232 29,984 192 959 1,151
1999/00 82 14,991 13,984 28,975 171 910 1,081
2000/01 82 14,991 13,627 28,618 180 872 1,052
2001/02 82 14,588 13,367 27,955 170 892 1,062
2002/03 81 14,323 12,852 27,175 159 898 1,057
2003/04 78 13,522 12,151 25,673 153 886 1,039
2004/05 78 13,193 11,816 25,009 151 873 1,024
PRIMARY SCHOOLSANALYSIS OF SCHOOLS, PUPILS AND TEACHERS
Source: Ministry of Education
36

Numberof. schools Male Female TOTAL Male Female TOTAL
1990/91 13 2,185 4,054 6,239 159 237 396
1991/92 14 2,493 4,662 7,155 191 275 466
1992/93 14 3,973 5,196 9,169 199 308 507
1993/94 14 4,193 5,528 9,721 249 323 572
1994/95 14 4,435 5,755 10,190 279 340 619
1995/96 15 4,431 5,883 10,314 247 373 620
1996/97 15 4,870 6,212 11,082 247 385 632
1997/98 15 5,050 6,490 11,540 255 375 630
1998/99 16 5,406 6,441 11,847 264 376 640
1999/00 18 5,645 7,172 12,817 253 392 645
2000/01 18 5,544 7,194 12,738 256 422 678
2001/02 18 5,488 7,255 12,743 256 454 710
2002/03 18 5,469 7,186 12,655 261 445 706
2003/04 19 5,659 7,272 12,931 256 474 730
2004/05 19 5,745 7,070 12,815 267 463 730
SECONDARY SCHOOLS ANALYSIS OF SCHOOLS, PUPILS AND TEACHERS
Source: Ministry of Education
No. of pupils No. of TeachersAcademic
Year
37

1999 2000 2001 2002 2003 2004 2005
Sir Arthur Lewis Community College 78.05 76.31 72.07 75.30 81.3 79.76 80.6
(SALCC)
Vieux Fort Comprehensive Sec. Sch. 78.17 72.19 59.38 76.90 70.76 65.8 72.4
(VFCSS)
Source: Ministry of Education
Head Title 1994/95 1995/96 1996/97 1997/98 1998/99 1999/00 2000/01 2001/02 2002/03 2003/04 2004/05
Early Childhood Educ. 0.17 0.14 0.25 0.38 0.24 0.39 0.36 0.27 0.36 0.45 0.45
SpecialEducation 0.91 0.91 0.91 1.13 1.26 1.31 1.45 1.35 1.49 1.52 1.65
PrimaryEducation 35.10 37.80 37.33 38.23 37.77 42.13 43.32 45.96 45.28 44.4 46.20
SecondaryEducation 19.62 20.59 24.47 25.96 25.21 28.53 28.41 30.44 32.29 32.13 34.29
Tertiary
Education 10.58 10.59 11.53 13.54 14.31 13.81 13.15 13.75 12.86 12.65 12.50
AdultEducation 0.60 0.55 0.57 0.88 0.30 0.65 0.63 0.58 0.86 0.85 0.80
Total 66.97 70.58 75.06 80.12 79.09 86.82 87.32 92.35 93.14 92.00 95.89
Source: Ministry of Finance
CAMBRIDGE ADVANCED LEVEL EDUCATION PASS RATE
GOVERNMENT RECURRENT EXPENDITURE ON EDUCATION (EC $ Millions)
% Pass Rate (Grades A-E)Institution
38

POPULATION ESTIMATES 1998 1999r 2000 2001r 2002r 2003r 2004p 2005e
ESTIMATES 151,952 153,703 155,996 157,898 159,133 160,620 162,434 164,791
LIVE BIRTHSMale 1,506 1,497 1,406 1,405 1,330 1,270 1,191 1,260
Female 1,444 1,500 1,498 1,383 1,268 1,216 1,107 1,230
Total 2,950 2,997 2,904 2,788 2,598 2,486 2,298 2,490
of unmarried parents 2,532 2,543 2,493 2,369 2,229 2,111 1,961 2,116
Birth rate (per 1000 of pop.) 19.4 19.5 18.6 17.7 16.3 15.5 14.1 15.1STILL BIRTHS
Male 21 27 23 13 27 16 16 17
Female 18 19 18 19 24 21 23 24
Total 39 46 41 32 51 37 39 41
DEATHSMale 536 515 508 531 512 584 598 640
Female 440 466 433 467 448 462 516 542
Total 976 981 941 998 960 1,046 1,114 1,182
of which infants under one year
Male 26 25 21 16 17 16 22 23
Female 22 17 17 21 19 21 23 24
Total 48 42 38 37 36 37 45 47
Death Rate 6.4 6.4 6.0 6.3 6.0 6.5 6.9 7.2
Infant Mortality Rate 16.3 14.0 13.1 13.3 13.9 14.9 19.6 18.9
MARRIAGES 627 732 655 513 500 540 459 490
DIVORCES 59 63 49 76 45 113 114 120
e=Estimated
r=Revised
Source: Government Statistics Department
ESTIMATED MID-YEAR POPULATION AND VITAL STATISTICS
39

2001 2002 2003r 2004p 2005eGROUP Male Female Total Male Female Total Male Female Total Male Female Total Male Female Total
0-4 7,199 7,374 14,573 6,839 7,064 13,903 6,667 6,835 13,502 6,628 6,886 13,514 7,054 7,169 14,223
5-9 8,730 8,540 17,270 8,563 8,389 16,952 8,289 8,177 16,466 8,000 7,939 15,939 7,551 7,607 15,158
10-14 8,683 8,750 17,433 8,742 8,739 17,481 8,800 8,729 17,529 8,783 8,667 17,450 8,797 8,632 17,429
15-19 8,154 8,540 16,694 8,335 8,704 17,039 8,451 8,771 17,222 8,598 8,873 17,471 8,648 8,835 17,483
20-24 6,720 6,890 13,610 6,949 7,135 14,084 7,244 7,489 14,733 7,475 7,733 15,208 7,787 8,113 15,900
25-29 6,223 6,747 12,970 6,301 6,783 13,084 6,358 6,754 13,112 6,493 6,875 13,368 6,585 6,883 13,468
30-34 5,705 6,054 11,759 5,767 6,136 11,903 5,864 6,292 12,156 5,919 6,353 12,272 6,037 6,519 12,556
35-39 5,562 5,961 11,523 5,629 6,031 11,660 5,645 6,035 11,680 5,693 6,090 11,783 5,687 6,068 11,755
40-44 4,591 4,748 9,339 4,807 5,027 9,834 5,017 5,306 10,323 5,176 5,506 10,682 5,340 5,710 11,050
45-49 3,516 3,397 6,913 3,698 3,604 7,302 3,899 3,850 7,749 4,098 4,110 8,208 4,314 4,410 8,724
50-54 2,695 2,792 5,487 2,829 2,864 5,693 2,963 2,945 5,908 3,117 3,064 6,181 3,258 3,188 6,446
55-59 2,058 2,342 4,400 2,121 2,405 4,526 2,215 2,474 4,689 2,305 2,538 4,843 2,431 2,610 5,041
60-64 1,904 2,060 3,964 1,880 2,073 3,953 1,865 2,101 3,966 1,865 2,144 4,009 1,883 2,194 4,077
65-69 1,753 1,897 3,650 1,746 1,905 3,651 1,733 1,900 3,633 1,708 1,914 3,622 1,693 1,913 3,606
70-74 1,332 1,393 2,725 1,351 1,441 2,792 1,391 1,517 2,908 1,399 1,561 2,960 1,423 1,620 3,043
75-79 1,061 1,207 2,268 987 1,075 2,062 939 999 1,938 915 1,025 1,940 914 1,040 1,954
80+ 1,357 1,963 3,320 1,324 1,890 3,214 1,289 1,817 3,106 1,235 1,749 2,984 1,193 1,685 2,878
TOTAL 77,243 80,655 157,898 77,868 81,265 159,133 78,629 81,991 160,620 79,407 83,027 162,434 80,595 84,196 164,791
p-preliminary
Source: Government Statistics Departmen
ESTIMATED MID - YEAR POPULATION BY SEX AND AGE GROUP
40

Administrative
Areas 1998 1999 2000 2001 2002 2003 2004 2005
Castries 60,934 61,823 62,967 64,404 64,957 65,565 66,365 67,340
Vieux Fort 14,448 14,624 14,833 14,757 14,904 15,130 15,409 15,750
Soufriere 8,910 8,953 9,075 7,665 7,706 7,759 7,824 7,935
Micoud 17,194 17,423 17,708 16,051 16,143 16,267 16,407 16,620
Dennery 12,603 12,778 12,966 12,767 12,876 12,997 13,105 13,296
Anse-la-Raye 6,090 6,203 6,356 6,071 6,136 6,215 6,298 6,382
Canaries 1,919 1,923 1,935 1,787 1,789 1,812 1,835 1,862
Laborie 8,630 8,727 8,861 7,365 7,414 7,458 7,539 7,623
Gros-Islet 14,055 13,994 13,972 20,892 21,034 21,207 21,370 21,660
Choiseul 7,169 7,255 7,323 6,139 6,174 6,210 6,282 6,323
Total 151,952 153,703 155,996 157,898 159,133 160,620 162,434 164,791
ESTIMATED MID-YEAR POPULATION BY DISTRICT
Source: Government Statistics Department
41

2001/02 2002/03 2003/04 2004/05 R 2005/06 Pre % ChangeTotal Revenue & Grants 458.18 497.66 533.03 557.33 600.20 7.7%
of which:Grants 26.30 36.29 32.89 0.00 4.24Capital revenue 2.68 19.85 8.64 0.87 0.32 -63.3%
Current Revenue 429.21 441.52 491.50 556.46 595.64 7.0%Tax Revenue 385.27 405.36 453.05 511.83 556.22 8.7%
of which:Taxes on Income 118.37 105.35 109.91 132.38 148.91 12.5%Taxes on Goods & Services 168.47 174.82 190.43 203.22 199.80 -1.7%Taxes on International Trade 93.76 120.82 148.89 172.59 202.66 17.4%Others 4.67 4.37 3.82 3.64 4.85 33.2%
Non Tax Revenue 43.94 36.16 38.45 44.63 39.42 -11.7%
Total Expenditure 532.84 589.82 614.14 647.01 670.64 3.7%of which, Capital & Net Lending 132.59 150.00 139.47 164.29 158.00 -3.8%
Capital Expenditure 132.59 150.00 139.47 164.29 158.00 -3.8%Net Lending 0.00 0.00 0.00 0.00 0.00
Current Expenditure 400.24 439.82 474.67 483.07 512.64 6.1%of which:
Wages & Salaries 212.75 211.62 229.94 221.32 237.41 7.3%Interest Payments 41.73 46.60 55.87 66.87 71.98 7.6%Goods & Services 72.80 78.00 90.44 91.93 93.46 1.7%Current Transfers 38.70 68.37 60.20 62.86 67.08 6.7%
Current Balance 28.96 1.70 16.83 73.39 83.00 13.1%
Overall Balance -74.65 -92.16 -81.11 -89.68 -70.44 -21.5%
Financing 74.65 92.16 81.11 89.68 70.44 -21.5%
External (Net) 73.87 80.64 51.25 65.90Disbursements 92.96 129.00 68.04 79.16Amortization -19.09 -48.36 -16.79 -13.26
Domestic 0.78 11.52 29.86 23.78Banks (net) -2.00 -22.04 18.49
Change in Loans & Advances (including overdrafts) -2.22Change in Deposits -0.22
Non Banks 2.79 33.56 11.37
R=Revised
Pre-Preliminary
* April to March
CENTRAL GOVERNMENT SUMMARY OF FISCAL OPERATIONS [Fiscal Year]*
ECONOMIC CLASSIFICATION(EC$ Million)
42

2001/02 2002/03 2003/04 2004/05 2005/06Total Revenue & Grants 24.60% 25.81% 26.01% 25.28% 25.42%
of which:Grants 1.41% 1.88% 1.60% 0.00% 0.18%Capital revenue 0.14% 1.03% 0.42% 0.04% 0.01%
Current Revenue 23.04% 22.90% 23.98% 25.24% 25.23%Tax Revenue 20.68% 21.02% 22.10% 23.22% 23.56%
of which:Taxes on Income 6.35% 5.46% 5.36% 6.01% 6.31%Taxes on Goods & Services 9.04% 9.07% 9.29% 9.22% 8.46%Taxes on International Trade 5.03% 6.27% 7.26% 7.83% 8.58%Others 0.25% 0.23% 0.19% 0.17% 0.21%
Non Tax Revenue 2.36% 1.88% 1.88% 2.02% 1.67%
Total Expenditure 28.60% 30.59% 29.96% 29.35% 28.41%of which, Capital & Net Lending 7.12% 7.78% 6.80% 7.45% 6.69%
Capital Expenditure 7.12% 7.78% 6.80% 7.45% 6.69%Net Lending 0.00% 0.00% 0.00% 0.00% 0.00%
Current Expenditure 21.49% 22.81% 23.16% 21.91% 21.71%of which:
Wages & Salaries 11.42% 10.98% 11.22% 10.04% 10.06%Interest Payments 2.24% 2.42% 2.73% 3.03% 3.05%Goods & Services 3.91% 4.05% 4.41% 4.17% 3.96%Current Transfers 2.08% 3.55% 2.94% 2.85% 2.84%
Current Balance 1.55% 0.09% 0.82% 3.33% 3.52%
Overall Balance -4.01% -4.78% -3.96% -4.07% -2.98%
Financing 4.01% 4.78% 3.96% 4.07% 2.98%
External (Net) 3.97% 4.18% 2.50% 2.99%Disbursements 4.99% 6.69% 3.32% 3.59%Amortization -1.02% -2.51% -0.82% -0.60%
Domestic 0.04% 0.60% 1.46% 1.08%Banks (net) -0.11% -1.14% 0.90% 0.00%
Change in Loans & Advances (including overdrafts) -0.12% 0.00% 0.00% 0.00%Change in Deposits -0.01% 0.00% 0.00% 0.00%
Non Banks 0.15% 1.74% 0.55% 0.00%
Memorandum Items:Nominal GDP at Market Prices 1862.81 1928.08 2049.61 2204.45 2360.95R=RevisedPre=Preliminary
SUMMARY OF FISCAL OPERATIONS AS RATIO OF GDPCENTRAL GOVERNMENT
ECONOMIC CLASSIFICATION
43

2000/01 1000.50 2002/03 2003/04 2004/5 R 2005/06 Pre % ChangeTotal Revenues and Grants 492.02 458.18 497.66 533.03 557.33 600.20 7.7%
Capital Grants 10.75 26.30 36.29 32.89 0.00 4.24 -Capital Revenue 0.14 2.68 19.85 8.64 0.87 0.32 -63.2%
CURRENT REVENUE 481.12 429.21 441.52 491.50 556.46 595.64 7.0%Tax Revenue 432.04 385.27 405.36 453.05 511.83 556.22 8.7%Taxes on Income 137.37 118.37 105.35 109.91 132.38 148.91 12.5%
Individuals 48.88 47.92 47.40 43.75 49.69 58.38 17.5%Withholdings 6.57 6.43 4.89 3.86 3.73 7.51 101.5%Corporations 62.91 54.51 42.17 44.80 54.65 62.41 14.2%Arrears 25.20 17.56 18.79 24.89 31.62 28.82 -8.9%LessTax Refunds 6.19 8.05 -7.89 -7.40 -7.32 -8.21 12.2%
Tax on Property 1.87 4.67 4.37 3.82 3.65 4.86 33.2%Property Tax 1.87 4.67 4.37 3.82 3.65 4.86 33.2%
Tax On Goods And Services 173.68 168.47 174.82 190.43 203.22 199.80 -1.7%Consumption Tax 100.83 105.36 112.68 121.00 123.46 112.99 -8.5%
Consumption tax (imports) 90.31 100.08 107.76 114.43 117.16 104.66 -10.7%Consumption tax (domestic) 10.52 5.28 4.93 6.57 6.31 8.32 31.9%
Excise tax (domestic) 27.52 21.07 6.31 7.17 7.57 7.47 -1.3%Hotel Occupancy tax 22.67 18.53 19.49 22.17 26.26 29.04 10.6%Insurance Premium Tax 3.78 3.99 4.21 4.11 4.52 5.05 11.6%Licences 7.07 7.97 8.72 16.63 16.93 15.67 -7.5%Fuel Surcharge 2.95 2.97 2.72 3.11 3.21 3.33 3.5%Stamp Duties (Inland Revenue) 8.85 8.59 19.56 11.48 15.21 16.95 11.4%Cellular Tax 1.13 4.75 6.04 7.77 28.7%Passenger Facility Fee 1.54
Taxes on International Trade and Transactions 119.13 93.76 120.82 148.89 172.59 202.66 17.4%
Import Duty 64.18 51.67 57.41 69.45 75.25 87.22 15.9%Thruput Charges 1.12 0.89 0.96 0.40 0.53 1.25 135.9%Travel Tax 2.55 1.68 2.52 4.91 5.50 3.94 -28.5%Service Charge (imports) 33.35 27.88 30.17 39.31 46.35 53.77 16.0%Environmental Levy 9.04 7.09 9.63 11.74 13.46 17.45 29.7%Surcharge on Int'l Calls 3.95 - - -Airport Tax 4.94 4.54 4.07 4.39 5.98 4.91 -18.0%Security Charge 0.15 0.82 0.84 2.4%Excise tax (imports) 16.06 18.53 24.69 33.28 34.8%
Non-Tax Revenue 49.08 43.94 36.16 38.45 44.63 39.42 -11.7%Earnings From Govt. Depts. 8.94 7.09 3.60 5.43 5.84 3.69 -36.7%E.C.C.B. Profits 2.35 3.26 2.28 1.79 1.72 0.00 -100.0%Interest and rents 12.55 14.06 10.66 7.39 6.37 8.81 38.2%Fees, Fines and Sales 14.30 13.36 15.47 20.31 21.90 23.58 7.7%Other Non Tax Revenues 10.95 6.17 4.15 3.54 8.81 3.34 -62.1%
R=Revised
Pre=Preliminary* April to March
CENTRAL GOVERNMENT REVENUE*ECONOMIC CLASSIFICATION
(EC$ millions)
44

2000/01 2001/02 2002/03 2003/04 2004/05 2005/06Total Revenues and Grants 25.98% 24.60% 25.81% 26.01% 25.28% 25.42%
Capital Grants 0.57% 1.41% 1.88% 1.60% 0.00% 0.18%Capital Revenue 0.01% 0.14% 1.03% 0.42% 0.04% 0.01%
CURRENT REVENUE 25.41% 23.04% 22.90% 23.98% 25.24% 25.23%Tax Revenue 22.82% 20.68% 21.02% 22.10% 23.22% 23.56%Taxes on Income 7.25% 6.35% 5.46% 5.36% 6.00% 6.31%
Individuals 2.58% 2.57% 2.46% 2.13% 2.25% 2.47%Withholdings 0.35% 0.35% 0.25% 0.19% 0.17% 0.32%Corporations 3.32% 2.93% 2.19% 2.19% 2.48% 2.64%Arrears 1.33% 0.94% 0.97% 1.21% 1.43% 1.22%LessTax Refunds 0.33% 0.43% -0.41% -0.36% -0.33% -0.35%
Tax on Property 0.10% 0.25% 0.23% 0.19% 0.17% 0.21%Property Tax 0.10% 0.25% 0.23% 0.19% 0.17% 0.21%
Tax On Goods And Services 9.17% 9.04% 9.07% 9.29% 9.22% 8.46%Consumption Tax 5.33% 5.66% 5.84% 5.90% 5.60% 4.79%
Consumption tax (imports) 4.77% 5.37% 5.59% 5.58% 5.31% 4.43%Consumption tax (domestic) 0.56% 0.28% 0.26% 0.32% 0.29% 0.35%
Excise tax (domestic) 1.45% 1.13% 0.33% 0.35% 0.34% 0.32%Hotel Occupancy tax 1.20% 0.99% 1.01% 1.08% 1.19% 1.23%Insurance Premium Tax 0.20% 0.21% 0.22% 0.20% 0.21% 0.21%Licences 0.37% 0.43% 0.45% 0.81% 0.77% 0.66%Fuel Surcharge 0.16% 0.16% 0.14% 0.15% 0.15% 0.14%Stamp Duties (Inland Revenue) 0.47% 0.46% 1.01% 0.56% 0.69% 0.72%Cellular Tax 0.00% 0.00% 0.06% 0.23% 0.27% 0.33%
Taxes on International Trade 0.00% 5.03% 6.27% 7.26% 7.83% 8.58% and Transactions 0.00% 0.00% 0.00% 0.00% 0.00% 0.00%
Import Duty 6.29% 5.03% 6.27% 7.26% 7.83% 8.58%Travel Tax 0.06% 0.05% 0.05% 0.02% 0.02% 0.05%Service Charge (imports) 0.13% 0.09% 0.13% 0.24% 0.25% 0.17%Environmental Levy 1.76% 1.50% 1.56% 1.92% 2.10% 2.28%Surcharge on Int'l Calls 0.48% 0.38% 0.50% 0.57% 0.61% 0.74%Airport Tax 0.21% 0.00% 0.00% 0.00% 0.00% 0.00%Security Charge 0.26% 0.24% 0.21% 0.21% 0.27% 0.21%Excise tax (imports) 0.00% 0.00% 0.00% 0.01% 0.04% 1.41%
Non-Tax Revenue 2.59% 2.36% 1.88% 1.88% 2.02% 1.67%Earnings From Govt. Depts. 0.56% 0.44% 0.23% 0.34% 0.37% 0.23%E.C.C.B. Profits 0.15% 0.21% 0.15% 0.12% 0.11% 0.00%Interest and rents 0.81% 0.90% 0.69% 0.48% 0.41% 0.57%Fees, Fines and Sales 0.92% 0.86% 1.00% 1.31% 1.41% 1.52%Other Non Tax Revenues 0.70% 0.40% 0.27% 0.23% 0.57% 0.21%
Memorandum Items:Nominal GDP at Market Prices 1893.49 1862.81 1928.08 2049.61 2204.45 2360.95R=Revised
Pre=Preliminary
CENTRAL GOVERNMENT REVENUE TO GDPECONOMIC CLASSIFICATION
(% GDP)
45

1999/2000 2000/01 2001/02 2002/03 2003/04 R 2004/05 R 2005/06 P %changeWages and Salaries 198.26 209.49 212.75 211.62 229.94 221.32 237.42 7.27%
wages 26.22 27.81 28.31 27.72 27.88 28.79 28.81 0.07%salaries 163.29 177.39 182.80 183.90 187.06 192.53 193.15 0.32%retro-active 8.76 4.29 1.63 0.00 15.00 0.00 15.46
N.I.S 2.71 2.77 2.72 3.02 3.38 3.55 3.84 8.17%Retiring Benefits 24.72 32.80 31.55 32.21 34.83 36.19 38.87 7.40%Interest Payments 23.62 29.50 41.73 46.60 55.87 66.94 71.98 7.53%
domestic 15.75 21.28 22.47 21.88 19.49 22.17 16.29 -26.52%foreign 7.86 8.22 8.96 24.71 36.38 44.77 55.69 24.39%
Goods and Services 71.05 74.01 72.80 78.00 90.44 91.93 93.46 1.66%Current Transfers 34.11 34.63 38.70 68.37 60.20 62.86 67.08 6.71%
public sector 30.38 30.50 34.21 49.11 56.15 58.82 62.29 5.90%private sector 3.73 4.13 4.50 19.27 4.06 4.04 4.79 18.56%
subsidies 0.96 1.68 1.49 1.20 1.19 1.17 0.93 -20.51%other 3.00 18.07 2.87 2.87 3.86 34.49%
Current Expenditure 354.47 383.20 400.24 439.82 474.67 482.79 512.65 6.18%
Capital Expenditure 166.52 134.06 132.59 150.00 136.14 164.29 158.00 -3.83%Local Revenue 91.28 82.07 24.66 8.39 7.25 2.24 3.18 41.96%Grants 28.90 17.47 7.56 22.50 17.87 35.73 8.54 -76.10%Loans 46.34 34.52 100.38 119.11 111.02 126.32 146.28 15.80%
Total Expenditure 520.98 517.26 532.84 589.82 610.81 647.08 670.65 3.64%* April to March
R=Revised
Pj=projected
CENTRAL GOVERNMENT EXPENDITUREECONOMIC CLASSIFICATION*
(EC$ millions)
46

2000/01 2001/02 R 2002/03 2003/04 2004/05 R 2005/06 PjWages and Salaries 11.06% 11.42% 10.98% 11.22% 10.04% 10.06%
wages 1.47% 1.52% 1.44% 1.36% 1.31% 1.22%salaries 9.37% 9.81% 9.54% 9.13% 8.73% 8.18%retro-active 0.23% 0.09% 0.00% 0.73% 0.00% 0.65%
N.I.S 0.15% 0.15% 0.16% 0.17% 0.16% 0.16%Retiring Benefits 1.73% 1.69% 1.67% 1.70% 1.64% 1.65%Interest Payments 1.56% 2.24% 2.42% 2.73% 3.04% 3.05%
domestic 1.12% 1.21% 1.13% 0.95% 1.01% 0.69%foreign 0.43% 0.48% 1.28% 1.78% 2.03% 2.36%
Goods and Services 3.91% 3.91% 4.05% 4.41% 4.17% 3.96%Current Transfers 1.83% 2.08% 3.55% 2.94% 2.85% 2.84%
public sector 1.61% 1.84% 2.55% 2.74% 2.67% 2.64%private sector 0.22% 0.24% 1.00% 0.20% 0.18% 0.20%
subsidies 0.09% 0.08% 0.06% 0.06% 0.05% 0.04%other 0.00% 0.16% 0.94% 0.14% 0.13% 0.16%
Current Expenditure 20.24% 21.49% 22.81% 23.16% 21.90% 21.71%
Capital Expenditure 7.08% 7.12% 7.78% 6.64% 7.45% 6.69%Local Revenue 4.33% 1.32% 0.43% 0.35% 0.10% 0.13%Grants 0.92% 0.41% 1.17% 0.87% 1.62% 0.36%Loans 1.82% 5.39% 6.18% 5.42% 5.73% 6.20%
Total Expenditure 27.32% 28.60% 30.59% 29.80% 29.35% 28.41%
Nominal GDP at Market Prices 1893.49 1862.81 1928.08 2049.61 2204.45 2360.95R=Revised
Pj=Projected
CENTRAL GOVERNMENT EXPENDITURE TO GDP RATIOSAPRIL TO MARCH
ECONOMIC CLASSIFICATION(% GDP)
47

2000 2001 2002 2003 R 2004 2005 % ChangeTOTAL OUTSTANDING LIABILITIES 868,543.00 974,330.00 1,092,455.90 1,239,113.36 1,420,152.65 1,528,483.89 7.63%
1. OFFICIAL DEBT 852,199.20 947,776.30 1,076,637.20 1,213,174.70 1,399,960.15 1,511,179.79 7.94%
A. Central Gov't.
Outstanding Debt* 623,426.60 695,938.30 826,110.20 968,158.80 1,175,864.31 1,296,258.27 10.24% - Domestic 292,398.90 310,579.30 318,480.00 231,197.30 345,882.34 395,340.26 14.30% - External 331,027.60 385,359.00 507,630.20 736,961.50 829,981.97 900,918.00 8.55%
B. Government Guaranteed
Outstanding Debt 228,772.60 212,499.10 197,147.80 187,861.00 167,923.96 160,382.99 -4.49% - Domestic 59,499.00 42,808.40 45,616.10 74,359.70 39,177.32 47,619.42 - External 169,274.00 169,690.70 151,531.70 140,501.30 128,746.64 112,763.57 -12.41%
C. Public Non-Guaranteed
Outstanding Debt 39,338.90 53,379.20 57,154.90 56,171.97 54,538.53 -2.91% - Domestic 16,907.30 22,970.50 24,466.30 23,185.60 21,976.76 -5.21% - External 22,431.60 30,408.70 32,688.60 32,986.37 32,561.77 -1.29%
Outstanding payables 16,343.80 26,553.70 15,818.70 25,938.66 20,192.51 17,304.10 -14.30%
R=Revised
TOTAL OUTSTANDING LIABILITIES As at December 31, 2005
(in EC$000's)
48

Bonds Loans & Advances
Other Sub-total Bonds Loans & Advances
Other Sub-total Bonds Treasury Bills Loans & Advances
Other Sub-Total TOTAL
1. DOMESTIC
A. Monetary Authorities1. ECCB 0.0 0.0 7,000.0 7,000.0 1,000.0 0.0 1,000.0 8,000.0
B. Financial Institutions1. Commercial Banks 0.0 0.0 79,993.0 21,456.5 101,449.5 99,882.0 28,728.3 24,424.1 153,034.4 254,483.92. Insurance Companies 0.0 18,531.5 7,500.0 26,031.5 600.0 14,302.5 14,902.5 40,934.03. Other 0.0 4,101.0 4,101.0 8,250.0 95.5 8,345.5 12,446.5
C. Non-Financial Private Sector 651.0 651.0 0.0 79.2 79.2 730.2
D. Non-Financial Public Sector 0.0 52,589.0 52,589.0 10,000.0 17,539.2 27,539.2 80,128.20.0
E. Other (Private Individuals & Agencies included) 0.0 2,459.3 2,459.3 347.0 9.8 356.8 2,816.1
F. Short term credits 0.0 0.0 0.0
Sub-Total 0.0 0.0 0.0 0.0 165,324.8 28,956.5 0.0 194,281.3 120,079.0 60,754.5 24,424.1 0.0 205,257.6 399,538.9
11. EXTERNAL
A. Monetary Authorities1. ECCB 0.0 0.0 0.0
B. Int'l Development Institutions1. C.D.B. 287,448.2 287,448.2 0.0 0.0 497.3 497.3 287,945.52. E.I.B. 1,858.4 1,858.4 0.0 0.0 1,858.43. I.F.A.D. 3,004.8 3,004.8 0.0 0.0 3,004.84. OPEC 3,341.7 3,341.7 0.0 0.0 3,341.75. IDA 73,436.6 73,436.6 0.0 0.0 73,436.66. IBRD 27,668.9 27,668.9 0.0 0.0 27,668.9
C. Foreign Governments 0.01. France 49,883.2 49,883.2 0.0 0.0 49,883.22. Kuwait 12,681.6 12,681.6 0.0 0.0 12,681.6
C. Other Foreign Institutions1. Regional 0.0 76,240.0 76,240.0 21,869.0 21,869.0 98,109.02. Extra Regional 0.0 0.0 0.0 0.0 0.0
E. OTHER1. Royal Merchant Bank 174,200.0 174,200.0 38,294.7 38,294.7 0.0 212,494.72. Citibank 128,031.2 128,031.2 0.0 0.0 0.0 128,031.23. Other 0.0 2,467.2 2,467.2 0.0 2,467.2
Sub-Total 302,231.2 459,323.4 0.0 761,554.6 76,240.0 40,761.9 0.0 117,001.9 0.0 21,869.0 497.3 0.0 22,366.3 900,922.8PAYABLES 17,304.1 17,304.1 17,304.1GRAND TOTAL 302,231.2 459,323.4 0.0 761,554.6 241,564.8 69,718.4 0.0 311,283.2 120,079.0 82,623.5 24,921.4 17,304.1 244,928.0 1,317,765.8
DISTRIBUTION OF TOTAL OUTSTANDING LIABILITIES OF THE CENTRAL GOVERNMENT ($'000)
(3) The figure $17304.169 representing outstanding payables is not broken down into the external and domestic components.
BY CLASS OF HOLDER & TERM OF INSTRUMENTas at December 31, 2005
Note (1) The long term "other" figure of $62203.2.4 representing securities ( promissory notes) to Multilateral Development Institutions viz : IMF/IBRD has been omitted. (2) The short term loans and advances figure includes $4199 representing the overdraft facility with Commercial Banks.
LONGTERM [>10 years] MEDIUM TERM [>5 - 10YRS] SHORT TERM [1 - 5 Years]
49

GRAND TOTAL(e) CURR. (f) TOTAL (g) ARREARS (h) CURR. (i) TOTAL (j) ARREARS (k) CURR. (l) TOTAL
PRIN. INT. SUB TOTAL d + e PRIN. INT. g + h PRIN. INT. j + k
1. DOMESTIC
A. Monetary Authorities1. ECCB 0.0 0.0 0.0 8,000.0 8,000.0 0.0 0.0 8,000.0
B. Financial Institutions1. Commercial Banks 0.0 250,284.9 250,284.9 12,417.0 35,128.1 47,545.1 0.0 21,976.7 21,976.7 319,806.72. Insurance Companies 40,934.0 40,934.0 0.0 0.0 40,934.03. Other 0.0 12,446.5 12,446.5 0.0 0.0 12,446.5
C. Non-Financial Private Sector 730.2 730.2 0.0 0.0 730.2D. Non-Financial Public Sector 0.0 80,128.2 80,128.2 0.0 0.0 80,128.2E. Other (Private Individuals & Agencies included) 2,816.1 2,816.1 0.0 0.0 2,816.1F. Short term credits 0.0 0.0 0.0 0.0 0.0 0.0
Sub-Total 0.0 0.0 0.0 395,339.9 395,339.9 12,417.0 0.0 35,128.1 47,545.1 0.0 0.0 21,976.7 21,976.7 464,861.7
11. EXTERNAL
A. Monetary Authorities1. ECCB 0.0 0.0 0.0 0.0 0.0 0.0
B. Int'l Development Institutions1. C.D.B. 287,945.5 287,945.5 85,643.1 85,643.1 0.0 373,588.62. E.I.B. 1,858.4 1,858.4 16,504.0 16,504.0 3,200.1 3,200.1 21,562.53. I.F.A.D. 3,004.8 3,004.8 0.0 0.0 3,004.84. OPEC 3,341.7 3,341.7 0.0 0.0 3,341.75. IDA 73,436.6 73,436.6 0.0 0.0 73,436.66. IBRD 27,668.9 27,668.9 0.0 0.0 27,668.9
C. Foreign Governments1. France 49,883.2 49,883.2 10,444.3 10,444.3 0.0 60,327.52. Kuwait 12,681.6 12,681.6 0.0 0.0 0.0 12,681.6
C. Other Foreign Institutions1. Regional 98,109.0 98,109.0 0.0 0.0 0.0 98,109.02. Other Regional 0.0 0.0 0.0 0.0 0.0 0.03. Extra Regional 0.0 0.0 0.0 0.0 0.0 0.0
E. OTHER1. Royal Merchant Bank 212,494.7 212,494.7 0.0 0.0 212,494.72. Citibank 128,031.2 128,031.2 0.0 0.0 0.0 128,031.23. FINCOR 0.0 0.0 0.0 0.0 0.0 0.0 29,361.7 29,361.7 29,361.74. Other 2,467.2 2,467.2 0.0 0.0 0.0 2,467.2
Sub-Total 0.0 0.0 0.0 900,922.8 900,922.8 0.0 0.0 112,591.4 112,591.4 0.0 0.0 32,561.8 32,561.8 1,046,076.0
Payables 0.0 0.0 0.0 17,304.1 17,304.1 0.0 0.0 17,304.1GRAND TOTAL 0.0 0.0 0.0 1,313,566.8 1,313,566.8 12,417.0 0.0 147,719.5 160,136.5 0.0 0.0 54,538.5 54,538.5 1,528,241.8
DISTRIBUTION OF OUTSTANDING LIABILITIES
(d) ARREARS(a) CENTRAL GOV'T.
OFFICIAL DEBT(c) NON-GUARANTEED
DISTRIBUTION OF TOTAL PUBLIC OUTSTANDING LIABILITIES ($'000)BY CLASS OF HOLDER & TYPE OF LIABILITY
as at December 31, 2005
(b) GOVERNMENT GUARANTEED
50

INTEREST EXCHANGE FOREIGN EC$LOAN REFERENCE CURRENCY RATE RATE CURRENCY EQUIVALENT
DOMESTIC 1. Central Government
COMMERCIAL BANKS
Purchase of Collingham Gardens EC 10.00% 1.0000 2,512,871.30Bank of China Loan EC 7.50% 1.0000 225,153.60
Cricket World Cup 2007 EC 5.25% 1.0000 20,000,000.00
Redraining of Cul-de-Sac River EC 8.00% 1.0000 7,500,000.00
Construction of New Prison EC 8.00% 1.0000 12,000,000.00Short Term Employment Programme EC 8.00% 1.0000 6,943,755.31
Bonds1996/2006 EC 6.00% 1.0000 12,763,800.001997/2007 EC 7.50% 1.0000 17,905,000.002002/2012 EC 7.00% 1.0000 $5.00 45,416,000.002004/2014 EC 7.00% 1.0000 39,989,000.002004/2014 LCG101114 EC 7.00% 1.0000 27,375,000.002004/2010 LCG061110 EC 6.00% 1.0000 13,110,000.00
Refinancing of Citibank Bond EC 5.75% 1.0000 16,200,000.00 2005/2015 LCG101015 6.50% 1.0000 21,876,000.00
Treasury Note2004/2009 LCN230709 EC 5.79% 1.0000 42,569,000.00
2005/2010 LCG141010 EC 5.50% 1.0000 48,200,000.00
Treasury Bills Special Issue EC 4% & 5% 1.0000 32,950,683.78LCB110206 EC 4.45% 1.0000 25,798,500.00LCB220706 EC 4.45% 1.0000 2,005,500.00
SUB - TOTAL (Central Gov't) 395,340,263.992. Government Guaranteed
(a) Dennery Farmco EC 1.0000 2,426,811.00(b) Freezone Management Authority EC 1.0000 227,374.00(c) NDC EC 1.0000 5,296.00(d) Radio St. Lucia Ltd. EC 1.0000 1,733,130.00(e) Soufriere Regional Development Foundation EC 1.0000 2,088,745.00(f) St. Lucia Air & Sea Ports Authority EC 1.0000 15,155,866.00(g) St Lucia Fish Marketing Corporation EC 1.0000 1,702,135.00(h) St Lucia Livestock Development EC 1.0000 465,083.00(i) St Lucia Marketing Board EC 1.0000 682,667.00(j) St. Lucia National Housing Corp. EC 1.0000 9,599,479.00(k) St Lucia Tourist Board EC 1.0000 2,882,937.00(l) Water and Sewerage Authority EC 1.0000 10,649,895.38
SUB - TOTAL (Gov't Guaranteed) 47,619,418.38
3. Public Non-Guarnateed
St. Lucia Air & Sea Ports AuthorityBank of Nova Scotia EC$ 1.0000 21,976,760.32
USD 2.7000 0 0.00
SUB - TOTAL (Non-Guaranteed) 21,976,760.32TOTAL (Domestic) 464,936,442.69
B. EXTERNAL
Bonds -Royal Merchant Bank EC$ 8.95% 1.0000 63,500,000.00 63,500,000.00
USD 7.75% 2.7000 41,000,000.00 110,700,000.00 -CITIBANK USD 7.75% 2.7000 21,875,000.00 59,062,500.00
USD 7.25% 1.3500 10,000,000.00 13,500,000.00EC$ 9.90% 1.0000 17,500,000.00 17,500,000.00USD 7.80% 2.7000 14,062,500.00 37,968,750.00
-Other
1996/2006 EC$ 6.00% 1.0000 500,000.001997/2007 EC$ 7.50% 1.0000 22,275,000.002002/2012 EC$ 7.00% 1.0000 14,584,000.002004/2014 LCG100714 EC$ 7.00% 1.0000 10,011,000.002004/2014 LCG101114 EC$ 7.00% 1.0000 2,625,000.002004/2010 LCG061110 EC$ 6.00% 1.0000 13,890,000.002005/2015 LCG101015 EC$ 6.50% 1.0000 3,124,000.00
Treasury Note2004/2009 LCN230709 EC 5.79% 1.0000 7,431,000.002005/2010 LCG141010 EC 5.50% 1.0000 1,800,000.00
Treasury Bills LCB220706 EC$ 21,869,500.00
CURRENT BALANCE
LISTING OF OFFICIAL DEBTas at December 31, 2005
51

INTEREST EXCHANGE FOREIGN EC$LOAN REFERENCE CURRENCY RATE RATE CURRENCY EQUIVALENT
CURRENT BALANCE
LISTING OF OFFICIAL DEBTas at December 31, 2005
LOANS
Bilateral:Agence Francaise de Developpement
(i) Rodney Bay Sewerage C LC 0006 01 C EUR 5.00% 0.0000 2,219,861.00 7,103,777.19
(ii) Castries Cul-De Sac Highway C LC 1005 01 C USD 3.50% 2.7000 4,090,909.00 11,045,454.30
(iii) Northern Water Supply C LC 1009 01C EUR 5.00% 0.0000 4,200,000.00 13,440,420.00
(iv) Rehabilitation of Tertiary Roads CLC 3000 01 Z EUR 3.50% 0.0000 5,716,568.00 18,293,589.26
Kuwait Fund for Arab Economic Development(i) Castries Cul-De Sac Highway 470 KWD 4.00% 0.0000 1,166,672.00 10,787,049.31
(ii) Castries/Choc Bay Junction Hwy.Improvement 646 KWD 4.00% 0.0000 204,902.63 1,894,529.72
Multilateral:Caribbean Development Bank:
Vigie Terminal 3/SFR-OR ECD 8.00% 1.00000 4.53 4.53
West Indies Shipping Corporation 6/SFR-R-ST.L ECU 2.00% 0.0000 55,102.48 176,333.45
Rural Electrification 21/SFR-STL USD 4.00% 2.7000 46,066.00 124,378.20
Purchase of Equity - SLDB 27/SFR-ST.L USD 0.75% 2.7000 292,317.46 789,257.14
Water Supply 37/SFR CAD 4.00% 0.0000 84,690.82 196,525.05STG 4.00% 0.0000 27,137.87 128,090.75USD 4.00% 2.7000 155,004.84 418,513.07
SWKR 4.00% 0.0000 152,827.97 51,854.53SDR 4.00% 0.0000 919,029.27 3,553,426.67
Feeder Roads 38/SFR-STL USD 4.00% 2.7000 287,933.98 777,421.75
Technical Vocational Education 39/SFR-ST.L SDR 0.75% 0.0000 1,556,468.01 6,018,083.5639/SFR-ST.L USD 2.00% 2.7000 711,344.86 1,920,631.12
Water Supply 8/SFR-OR-STL USD 2.00% 2.7000 3,739,705.51 10,097,204.88USD 6.00% 2.7000 898,565.07 2,426,125.69CAD 6.00% 0.0000 248,653.12 576,999.56STG. 6.00% 0.0000 43,941.67 207,404.68
Road Improvement and Maintenance 13/SFR-OR-ST.L IU 6.00% 2.7000 765,714.19 2,067,428.31USD 2.00% 2.7000 356,576.03 962,755.28
Road Improvement & Maintenance 43/SFR-ST.L SDR 0.75% 0.0000 1,110,001.72 4,291,821.65
Road Improvement & Maintenance 15/SFR-OR-ST.L USD 2.00% 2.7000 1,478,125.00 3,990,937.50USD 6.00% 2.7000 1,983,879.92 5,356,475.78TTD 6.00% 0.0000 775,902.57 337,052.08ECD 6.00% 1.0000 84,945.00 84,945.00EUR 6.00% 0.0000 35,111.98 112,361.85STG 6.00% 0.0000 91,657.43 432,623.07
Caribbean Court of Justice 15/OR-STL USD 6.00% 2.7000 1980000.00 5,346,000.00
Economic Reconstruction Programme 28/SFR-OR-St.L USD 2.5,5.5% 2.7000 332,710.15 898,317.41EC 1.0000 33,119.40 33,119.40
Banana Recovery Project 27/SFR-OR USD 2.50% 2.7000 1,196,033.41 3,229,290.21
Rehabilitation of Storm Damages 45/SFR-STL USD 2.00% 2.7000 3,875,205.51 10,463,054.88
OECS Waste Management Project 18/SFR-OR-ST.L USD 6.00% 2.7000 1,710,000.00 4,617,000.002.00% 2.7000 1,110,000.00 2,997,000.00
18/SFR-OR-ST.L (ADD) 2.00% 2.7000 1,882,601.32 5,083,023.56
Basic Education Reform Project 16/SFR-OR-ST.L USD 2.00% 2.7000 2,794,019.11 7,543,851.606.00% 2.7000 980,000.06 2,646,000.16
Rural Enterprise Project 47/SFR-ST.L USD 2.50% 2.7000 742,659.31 2,005,180.14
Disaster Mitigation 20/SFR-OR-ST.L USD 6.00% 2.7000 883,218.00 2,384,688.60USD 6.00% 2.7000 2,646,858.77 7,146,518.68
Roads Development Project 12/OR-ST.L USD 6.00% 2.7000 25,499,008.92 68,847,324.08STG. 6.00% 0.0000 1,022,008.37 4,823,879.51ECD 6.00% 1.0000 946,045.47 946,045.47
12/OR-ST.L (ADD) USD 6.00% 2.7000 2,494,244.40 6,734,459.88STG. 6.00% 0.0000 186,463.27 880,106.63ECD 6.00% 1.0000 95,034.68 95,034.68
2ND 12/OR-ST.L (ADD) USD 6.00% 2.7000 11,039,156.01 29,805,721.23GBP 6.00% 0.0000 1,296,104.94 6,117,615.32
52
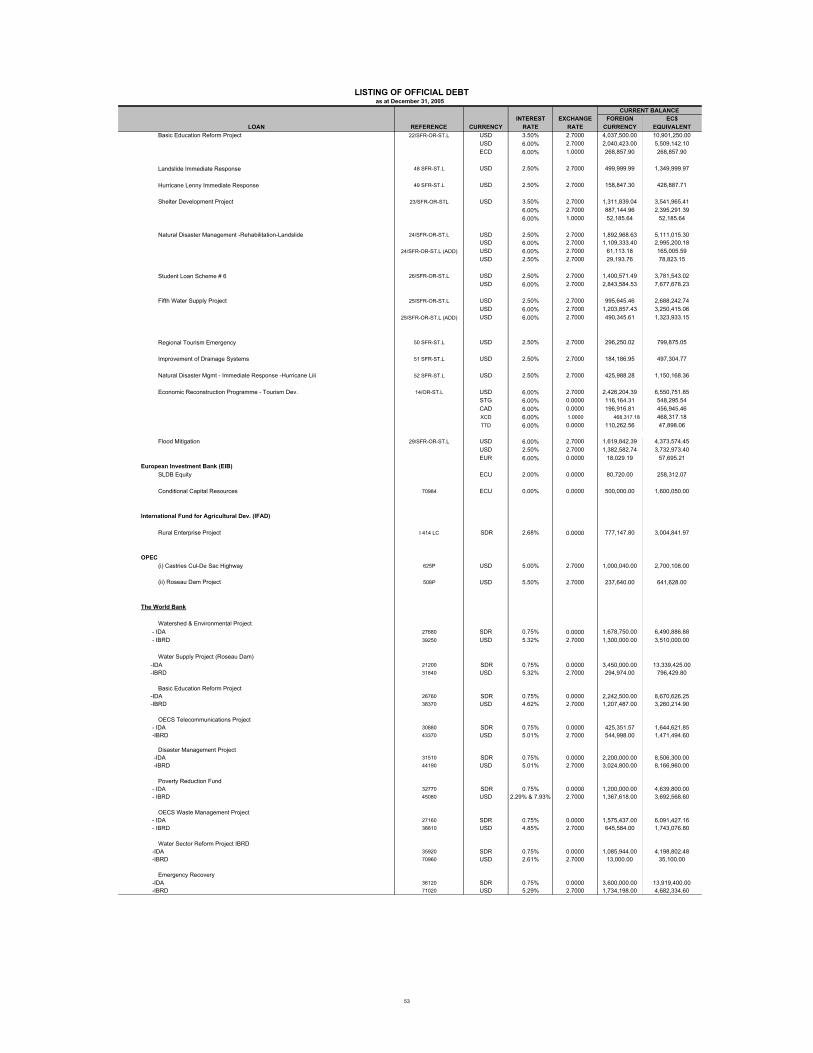
INTEREST EXCHANGE FOREIGN EC$LOAN REFERENCE CURRENCY RATE RATE CURRENCY EQUIVALENT
CURRENT BALANCE
LISTING OF OFFICIAL DEBTas at December 31, 2005
Basic Education Reform Project 22/SFR-OR-ST.L USD 3.50% 2.7000 4,037,500.00 10,901,250.00USD 6.00% 2.7000 2,040,423.00 5,509,142.10ECD 6.00% 1.0000 268,857.90 268,857.90
Landslide Immediate Response 48 SFR-ST.L USD 2.50% 2.7000 499,999.99 1,349,999.97
Hurricane Lenny Immediate Response 49 SFR-ST.L USD 2.50% 2.7000 158,847.30 428,887.71
Shelter Development Project 23/SFR-OR-STL USD 3.50% 2.7000 1,311,839.04 3,541,965.416.00% 2.7000 887,144.96 2,395,291.396.00% 1.0000 52,185.64 52,185.64
Natural Disaster Management -Rehabilitation-Landslide 24/SFR-OR-ST.L USD 2.50% 2.7000 1,892,968.63 5,111,015.30USD 6.00% 2.7000 1,109,333.40 2,995,200.18
24/SFR-OR-ST.L (ADD) USD 6.00% 2.7000 61,113.18 165,005.59USD 2.50% 2.7000 29,193.76 78,823.15
Student Loan Scheme # 6 26/SFR-OR-ST.L USD 2.50% 2.7000 1,400,571.49 3,781,543.02USD 6.00% 2.7000 2,843,584.53 7,677,678.23
Fifth Water Supply Project 25/SFR-OR-ST.L USD 2.50% 2.7000 995,645.46 2,688,242.74USD 6.00% 2.7000 1,203,857.43 3,250,415.06
25/SFR-OR-ST.L (ADD) USD 6.00% 2.7000 490,345.61 1,323,933.15
Regional Tourism Emergency 50 SFR-ST.L USD 2.50% 2.7000 296,250.02 799,875.05
Improvement of Drainage Systems 51 SFR-ST.L USD 2.50% 2.7000 184,186.95 497,304.77
Natural Disaster Mgmt - Immediate Response -Hurricane Lili 52 SFR-ST.L USD 2.50% 2.7000 425,988.28 1,150,168.36
Economic Reconstruction Programme - Tourism Dev. 14/OR-ST.L USD 6.00% 2.7000 2,426,204.39 6,550,751.85STG 6.00% 0.0000 116,164.31 548,295.54CAD 6.00% 0.0000 196,916.81 456,945.46XCD 6.00% 1.0000 468,317.18 468,317.18TTD 6.00% 0.0000 110,262.56 47,898.06
Flood Mitigation 29/SFR-OR-ST.L USD 6.00% 2.7000 1,619,842.39 4,373,574.45USD 2.50% 2.7000 1,382,582.74 3,732,973.40EUR 6.00% 0.0000 18,029.19 57,695.21
European Investment Bank (EIB)SLDB Equity ECU 2.00% 0.0000 80,720.00 258,312.07
Conditional Capital Resources 70984 ECU 0.00% 0.0000 500,000.00 1,600,050.00
International Fund for Agricultural Dev. (IFAD)
Rural Enterprise Project I 414 LC SDR 2.68% 0.0000 777,147.80 3,004,841.97
OPEC(i) Castries Cul-De Sac Highway 625P USD 5.00% 2.7000 1,000,040.00 2,700,108.00
(ii) Roseau Dam Project 508P USD 5.50% 2.7000 237,640.00 641,628.00
The World Bank
Watershed & Environmental Project - IDA 27680 SDR 0.75% 0.0000 1,678,750.00 6,490,886.88 - IBRD 39250 USD 5.32% 2.7000 1,300,000.00 3,510,000.00
Water Supply Project (Roseau Dam) -IDA 21200 SDR 0.75% 0.0000 3,450,000.00 13,339,425.00 -IBRD 31840 USD 5.32% 2.7000 294,974.00 796,429.80
Basic Education Reform Project -IDA 26760 SDR 0.75% 0.0000 2,242,500.00 8,670,626.25 -IBRD 38370 USD 4.62% 2.7000 1,207,487.00 3,260,214.90
OECS Telecommunications Project - IDA 30880 SDR 0.75% 0.0000 425,351.57 1,644,621.85 -IBRD 43370 USD 5.01% 2.7000 544,998.00 1,471,494.60
Disaster Management Project -IDA 31510 SDR 0.75% 0.0000 2,200,000.00 8,506,300.00 -IBRD 44190 USD 5.01% 2.7000 3,024,800.00 8,166,960.00
Poverty Reduction Fund - IDA 32770 SDR 0.75% 0.0000 1,200,000.00 4,639,800.00 - IBRD 45080 USD 2.29% & 7.93% 2.7000 1,367,618.00 3,692,568.60
OECS Waste Management Project - IDA 27160 SDR 0.75% 0.0000 1,575,437.00 6,091,427.16 - IBRD 38810 USD 4.85% 2.7000 645,584.00 1,743,076.80
Water Sector Reform Project IBRD -IDA 35920 SDR 0.75% 0.0000 1,085,944.00 4,198,802.48 -IBRD 70960 USD 2.61% 2.7000 13,000.00 35,100.00
Emergency Recovery -IDA 36120 SDR 0.75% 0.0000 3,600,000.00 13,919,400.00 -IBRD 71020 USD 5.29% 2.7000 1,734,198.00 4,682,334.60
53

INTEREST EXCHANGE FOREIGN EC$LOAN REFERENCE CURRENCY RATE RATE CURRENCY EQUIVALENT
CURRENT BALANCE
LISTING OF OFFICIAL DEBTas at December 31, 2005
OECS Education Development -IDA 36610 SDR 0.75% 0.0000 773,050.00 2,988,997.83 -IBRD USD 4.82% 2.7000 60,000.00 162,000.00
Disaster Mitigation Project II -IBRD 72380 USD 2.54% 2.7000 18,500.00 49,950.00 -IDA 39360 SDR 0.75% 0.0000 762,014.00 2,946,327.13
HIV/AIDS Prevention & Control -IDA 39470 SDR 0.75% 0.0000 0.00 0.00 -IBRD 72520 USD 5.16% 2.7000 16,000.00 43,200.00
Water Supply Infrastructure Improvement Project -IDA 40650 SDR 0.80% 0.0000 0.00 0.00 -IBRD 72970 USD 4.61% 2.7000 19,250.00 51,975.00
Telecom & Information & Communication Tech. Dev Project -IDA 40570 SDR 0.50% 0.0000 0.00 0.00 -IBRD 47770 USD 4.61% 2.7000 1,361.00 3,674.70
Other(i) Bordelais Correctional Facility
RMB ECD 8.00% 1.0000 30,000,000.00 30,000,000.00USD 8.00% 2.7000 3,072,118.96 8,294,721.19
(iii) Angloco - Purchase of First Response Water Tenders USD 5.24% 2.7000 128,465.60 346,857.12 (iv) Eyre Spottiswoode - Publishing Laws of St. Lucia STG 0.00% 0.0000 448,135.00 2,115,197.20
SUB - TOTAL (Central Gov't) 900,918,001.33
2. GOVERNMENT GUARANTEED
(a) National Development Corporation (N.D.C.)CDB Loans:
Industrial Estate VII 7/SFR-STL USD 5.75% 2.7000 617,902.81 1,668,337.592.20% 2.7000 398,772.14 1,076,684.78
Industrial Estate VIII 11/SFR-OR USD 2.20% 2.7000 578,403.26 1,561,688.80USD 2.00% 2.7000 606,191.30 1,636,716.51TTD 6.00% 0.4319 156,903.92 67,766.80
(b) LUCELEC
Expansion Project IIEuropean Investment Bank (EIB) LOAN #1.3768 STG 5.15% 0.0000 29,264.30 138,127.50
YEN 5.15% 25.9692 17,730.00 460,433.92USD 5.15% 2.7000 172,191.90 464,918.13
USD 3.78% 2.7000 1,278,183.24 3,451,094.75USD 3.19% 2.7000 3,571,878.31 9,644,071.44
(c) BANK OF ST. LUCIA (SLDB). CDB Loans:
Student Loans 9/SFR-OR USD 6.00% 2.7000 292,037.89 788,502.30BZD 5.50% 1.3500 15,726.76 21,231.13
Consolidated Line of Credit II 40/SFR-STL USD 3.00% 2.7000 836,686.80 2,259,054.36EUR 4.00% 0.0000 179,283.56 573,725.32
Consolidated Line of Credit III 12/SFR-OR USD 2.00% 2.7000 786,940.92 2,124,740.486.00% 2.7000 773,997.72 2,089,793.84
Consolidated Line of Credit IV 14/SFR-OR-St.L USD 2.00% 2.7000 1,033,885.15 2,791,489.916.00% 2.7000 2,945,244.98 7,952,161.45
Consolidated Line of Credit V 17/SFR-OR-STL USD 2.00% 2.7000 937,681.87 2,531,741.056.00% 2.7000 2,761,324.27 7,455,575.53
Consolidated Line of Credit VI 19/SFR-OR.STL USD 2.00% 2.7000 1,020,205.36 2,754,554.476.00% 2.7000 4,281,674.52 11,560,521.20
Consolidated Line of Credit VII 21/SFR-OR-STL USD 2.00% 2.7000 1,636,610.81 4,418,849.196.00% 2.7000 4,122,498.08 11,130,744.82
European Investment Bank:St. Lucia Development Bank II B AFF.01 17714 USD 4.20% 2.7000 441,605.00 1,192,333.50
STG 4.20% 0.0000 185,624.10 876,145.75St. Lucia Development Bank II B 17714 YEN 3.00% 0.0000 5,801.90 131,790.16
CHF 3.00% 0.0000 70,232.80 145,122.03
Agence Francaise De Developpement:Refinancing Industry & Tourism CLC 0001 01 Y USD 4.00% 2.7000 414,075.00 1,290,003.00
(d) Air & Sea Ports AuthorityCDB:Fourth Airport Project 10/SFR-OR-ST.L USD 2.00% 2.7000 1,992,599.59 5,380,018.89
10/SFR-OR-ST.L USD 6.00% 2.7000 1,322,393.73 3,570,463.07
Air Cargo Facility 35/SFR-ST.L USD 4.00% 2.7000 24,174.97 65,272.42
Upgrading Cruiseship Facilities 11/OR-STL ECD 6.00% 1.0000 425,000.03 425,000.03USD 6.00% 2.7000 4,347,592.61 11,738,500.05
Agence Francaise De Developpement Hewanorra Airport Extension Project C LC 0002 01 Y EUR 5.00% 0.0000 3,330,747.07 9,326,399.70
SUB - TOTAL (Gov't Guaranteed) 112,763,573.86
54

INTEREST EXCHANGE FOREIGN EC$LOAN REFERENCE CURRENCY RATE RATE CURRENCY EQUIVALENT
CURRENT BALANCE
LISTING OF OFFICIAL DEBTas at December 31, 2005
3. Non-Guaranteed
Bank of St. Lucia (SLDB) 3.00SLDB Conditional Loan on Risk Capital Resources II-C 70985 EUR 0.00% 0.0000 1,000,000.00 3,200,100.00
St. Lucia National Lotteries AuthorityFINCOR USD 10.25% 2.7000 5,039,249.00 13,605,972.30Beausejour Cricket Ground ECD 10.25% 1.0000 15,755,698.00 15,755,698.00
SUB - TOTAL (Non-Guaranteed) 32,561,770.30
TOTAL (External) 1,046,243,345.49
TOTAL (Gov't Guaranteed) 160,382,992.24
TOTAL (Non-guaranteed) 54,538,530.62
TOTAL (Central Gov't) 1,296,258,265.32
GRAND TOTAL 1,511,179,788.18
55

CDB: 287,945,122.45 31.96%E.I.B.: 1,858,362.07 0.21%I.F.A.D. 3,004,841.97 0.33%IDA 73,436,614.56 8.15%IBRD 27,668,979.00 3.07%OPEC 3,341,736.00 0.37%AGENCE FRANCAISSE 49,883,240.74 5.54%KUWAIT FUND 12,681,579.03 1.41%CITIBANK 128,031,250.00 14.21%ROYAL MERCHANT BANK 212,494,721.19 23.59%ANGLOCO 346,857.12 0.04%EYRE-SPOTTISWOODE 2,115,197.20 0.23%OTHER: NSDB 37,359,000.00 4.15%RGSM 38,881,000.00 4.32%T.BILLS 21,869,500.00 2.43%SUB-TOTAL 900,918,001.33 100%
CDB 85,643,133.99 75.95%EIB 16,504,037.17 14.64%AGENCE FRANCAISSE 10,616,402.70 9.41%SUB-TOTAL 112,763,573.86 100%
EIB 3,200,100.00 9.83%FINCOR 29,361,670.30 90.17%SUB-TOTAL 32,561,770.30 100%GRAND TOTAL 1,046,243,345.49
DISTRIBUTION OF PUBLIC SECTOR EXTERNAL DEBT BY CREDITOR
NON-GUARANTEED
GOVERNMENT GUARANTEED
CENTRAL GOVERNMENT DECEMBER 2005
56

COMMODITY GROUPS 1998 1999 2000 2001r 2002 2003 2004r 2005pjCONSUMER GOODS 528.05 552.72 529.11 467.43 477.10 574.96 640.03 675.90
0. Food & Live Animals 202.70 191.29 193.34 186.38 168.95 204.01 225.93 225.761. Beverage & Tobacco 31.21 32.62 32.77 31.75 32.30 41.29 45.74 47.356. Manufactured Goods Classified Chiefly by Material 176.13 194.72 171.23 150.16 143.52 165.77 183.72 198.548. Miscellaneous Manufactured Articles 118.01 134.09 131.78 99.14 132.32 163.89 184.64 204.25
INTERMEDIATE GOODS 177.70 182.75 212.61 201.99 177.60 228.82 267.80 308.96
2. Crude Materials, Inedible Except Fuels 26.42 28.64 28.68 23.10 21.66 24.01 27.25 33.173. Mineral Fuel, Lubricants and Related Materials 71.41 65.08 102.88 106.98 83.75 123.48 148.08 178.184. Animal and Vegetable Oils & Fats 1.70 1.71 1.50 1.65 0.95 2.03 2.70 4.005. Chemicals and Related Products 78.17 87.32 79.54 70.26 71.24 79.30 89.77 93.61
CAPITAL GOODS 199.37 221.82 237.26 165.33 195.34 285.62 229.93 273.36
7. Machinery and Transport Equipment 198.82 221.15 237.19 165.21 195.21 285.36 229.74 273.069. Miscellaneous 0.55 0.68 0.07 0.12 0.14 0.26 0.19 0.30TOTAL 905.12 957.29 978.98 834.75 850.04 1,089.40 1,137.76 1,258.22
Source: Statistics Department
r=revised;pj= projected
COMMODITY GROUPS 1998 1999 2000 2001r 2002 2003 2004r 2005pjCONSUMER GOODS 464.68 486.39 465.62 411.34 419.84 505.97 563.23 594.79
0. Food & Live Animals 178.37 168.34 170.14 164.01 148.68 179.53 198.82 198.671. Beverage & Tobacco 27.47 28.70 28.83 27.94 28.42 36.34 40.25 41.676. Manufactured Goods Classified Chiefly by Material 155.00 171.35 150.68 132.14 126.30 145.88 161.68 174.718. Miscellaneous Manufactured Articles 103.85 118.00 115.96 87.25 116.45 144.22 162.48 179.74
INTERMEDIATE GOODS 156.38 160.82 187.09 177.75 156.29 201.36 235.66 271.89
2. Crude Materials, Inedible Except Fuels 23.25 25.20 25.24 20.33 19.06 21.13 23.98 29.193. Mineral Fuel, Lubricants and Related Materials 62.84 57.27 90.54 94.14 73.70 108.66 130.31 156.804. Animal and Vegetable Oils & Fats 1.50 1.51 1.32 1.45 0.83 1.79 2.38 3.525. Chemicals and Related Products 68.79 76.84 69.99 61.83 62.69 69.78 79.00 82.38
CAPITAL GOODS 175.44 195.21 208.79 145.49 171.90 251.35 202.34 240.56
7. Machinery and Transport Equipment 174.96 194.61 208.73 145.39 171.78 251.12 202.17 240.299. Miscellaneous 0.49 0.60 0.06 0.10 0.12 0.23 0.17 0.26
TOTAL 796.50 842.42 861.50 734.58 748.04 958.68 1001.23 1107.23
Source: Statistics Department
pj= Projected
r=revised
(EC$Millions)
IMPORTS BY STANDARD INTERNATIONAL TRADE CLASSIFICATION(EC$ MILLION)
IMPORTS BY STANDARD INTERNATIONAL TRADE CLASSIFICATION (At F.O.B Prices)
57

COMMODITY GROUPS 1998 1999 2000 2001 2002 2003 2004r 2005pj
CONSUMER GOODS 58.34% 57.74% 54.05% 56.00% 56.13% 52.78% 56.25% 59.41%
0. Food & Live Animals 22.39% 19.98% 19.75% 22.33% 19.88% 18.73% 19.86% 19.84%1. Beverage & Tobacco 3.45% 3.41% 3.35% 3.80% 3.80% 3.79% 4.02% 4.16%6. Manufactured Goods Classified Chiefly by Material 19.46% 20.34% 17.49% 17.99% 16.88% 15.22% 16.15% 17.45%8. Miscellaneous Manufactured Articles 13.04% 14.01% 13.46% 11.88% 15.57% 15.04% 16.23% 17.95%
INTERMEDIATE GOODS 19.63% 19.09% 21.72% 24.20% 20.89% 21.00% 23.54% 27.16%
2. Crude Materials, Inedible Except Fuels 2.92% 2.99% 2.93% 2.77% 2.55% 2.20% 2.39% 2.92%3. Mineral Fuel, Lubricants and Related Materials 7.89% 6.80% 10.51% 12.82% 9.85% 11.33% 13.01% 15.66%4. Animal and Vegetable Oils & Fats 0.19% 0.18% 0.15% 0.20% 0.11% 0.19% 0.24% 0.35%5. Chemicals and Related Products 8.64% 9.12% 8.12% 8.42% 8.38% 7.28% 7.89% 8.23%
CAPITAL GOODS 22.03% 23.17% 24.24% 19.81% 22.98% 26.22% 21.11% 25.09%
7. Machinery and Transport Equipment 21.97% 23.10% 24.23% 19.79% 22.96% 26.19% 20.19% 24.00%9. Miscellaneous 0.06% 0.07% 0.01% 0.01% 0.02% 0.02% 0.02% 0.03%
TOTAL 100.00% 100.00% 100.00% 100.00% 100.00% 100.00% 100.00% 110.59%
COMMODITY GROUPS 1998 1999 2000 2001 2002 2003 2004 2005
CONSUMER GOODS 6.49% 4.67% -4.27% -11.66% 2.07% 20.51% 11.32% 5.60%
0. Food & Live Animals 3.32% -5.63% 1.07% -3.60% -9.35% 20.75% 10.74% -0.07%1. Beverage & Tobacco 10.24% 4.51% 0.45% -3.11% 1.74% 27.85% 10.77% 3.52%6. Manufactured Goods Classified Chiefly by Material 15.30% 10.55% -12.06% -12.30% -4.42% 15.50% 10.83% 8.06%8. Miscellaneous Manufactured Articles -0.50% 13.63% -1.73% -24.76% 33.47% 23.85% 12.66% 10.62%
INTERMEDIATE GOODS -4.36% 2.84% 16.34% -4.99% -12.07% 28.84% 17.03% 15.37%
2. Crude Materials, Inedible Except Fuels -8.20% 8.40% 0.16% -19.47% -6.22% 10.85% 13.49% 21.74%3. Mineral Fuel, Lubricants and Related Materials -6.45% -8.86% 58.09% 3.98% -21.71% 47.44% 19.92% 20.33%4. Animal and Vegetable Oils & Fats -61.10% 0.68% -12.42% 9.96% -42.62% 114.75% 32.97% 48.05%5. Chemicals and Related Products 2.44% 11.70% -8.91% -11.66% 1.39% 11.31% 13.21% 4.28%
CAPITAL GOODS -7.41% 11.26% 6.96% -30.32% 18.15% 46.21% -19.50% 18.89%
7. Machinery and Transport Equipment -7.40% 11.23% 7.25% -30.35% 18.16% 46.18% -19.49% 18.85%9. Miscellaneous -12.59% 22.70% -89.38% 65.04% 15.02% 92.54% -27.15% 57.42%
TOTAL 0.91% 5.76% 2.27% -14.73% 1.83% 28.16% 4.44% 10.59%
IMPORTS BY STANDARD INTERNATIONAL TRADE CLASSIFICATION AT F.O.B PRICESPercentage Change
IMPORTS BY STANDARD INTERNATIONAL TRADE CLASSIFICATION AT F.O.B PRICESPercentage of Total
58

COMMODITY GROUPS 1998 1999 2000 2001 2002 2003 2004r 2005pjCONSUMER GOODS 153.41 133.92 134.00 98.32 116.60 107.55 119.31 104.94
0. Food & Live Animals 107.72 91.15 90.84 46.15 64.07 48.57 57.84 46.461. Beverage & Tobacco 14.92 22.11 24.92 28.31 23.65 29.09 31.91 31.786. Manufactured Goods Classified Chiefly by Material 17.24 8.77 4.41 7.11 15.74 14.42 16.11 13.048. Miscellaneous Manufactured Articles 13.54 11.89 13.83 16.75 13.14 15.47 13.45 13.66
INTERMEDIATE GOODS 3.99 2.86 2.16 3.95 15.73 20.36 59.01 33.03
2. Crude Materials, Inedible Except Fuels 0.75 0.56 0.49 0.67 0.78 1.25 3.48 2.093. Mineral Fuel, Lubricants and Related Materials 0.00 0.01 0.01 0.00 12.45 16.56 49.96 26.804. Animal and Vegetable Oils & Fats 1.04 0.76 0.05 0.01 0.13 0.01 0.23 0.035. Chemicals and Related Products 2.20 1.54 1.62 3.28 2.37 2.54 5.35 4.12
CAPITAL GOODS 10.52 13.55 14.09 17.60 35.22 39.76 36.69 32.67
7. Machinery and Transport Equipment 10.49 13.50 14.08 17.55 32.88 37.55 34.34 30.619. Miscellaneous 0.02 0.05 0.01 0.05 2.34 2.21 2.34 2.06
TOTAL 167.92 150.33 150.25 119.88 167.55 167.67 215.01 170.63
Source: Statistics Departmentpj=Projectedr=revised
COMMODITY GROUPS 1999 2000 2001 2002 2003r 2004pj 2005pjCONSUMER GOODS -12.71% 0.06% -26.62% 18.59% -7.76% 10.93% -12.05%
0. Food & Live Animals -15.38% -0.35% -49.19% 38.83% -24.20% 19.09% -19.66%1. Beverage & Tobacco 48.19% 12.71% 13.64% -16.49% 23.03% 9.71% -0.43%6. Manufactured Goods Classified Chiefly by Material -49.12% -49.67% 61.14% 121.32% -8.39% 11.72% -19.09%8. Miscellaneous Manufactured Articles -12.20% 16.34% 21.06% -21.54% 17.76% -13.09% 1.58%
INTERMEDIATE GOODS -28.16% -24.64% 83.02% 298.19% 29.41% 189.85% -44.04%
2. Crude Materials, Inedible Except Fuels -26.03% -12.40% 37.24% 16.99% 60.63% 177.62% -40.09%3. Mineral Fuel, Lubricants and Related Materials 241.89% -30.36% -89.05% 1991940.64% 32.98% 201.73% -46.35%4. Animal and Vegetable Oils & Fats -26.37% -93.75% -86.00% 1902.16% -89.60% 1556.23% -89.08%5. Chemicals and Related Products -30.03% 5.24% 102.35% -27.70% 7.01% 110.87% -23.00%
CAPITAL GOODS 28.84% 4.00% 24.91% 100.09% 12.88% -7.73% -10.94%
7. Machinery and Transport Equipment 28.62% 4.31% 24.63% 87.38% 14.21% -8.55% -10.85%9. Miscellaneous 125.33% -75.84% 325.48% 4165.11% -5.78% 6.28% -12.23%
TOTAL -10.47% -0.06% -20.21% 39.77% 0.07% 28.23% -20.64%
TOTAL EXPORTS BY STANDARD INTERNATIONAL TRADE CLASSIFICATION
TOTAL EXPORTS BY STANDARD INTERNATIOANL TRADE CLASSIFICATION (EC$ Millions)
Percentage Change
59

COMMODITY GROUPS 1999 2000 2001 2002 2003r 2004pj 2005pj
CONSUMER GOODS 89.08% 89.18% 82.02% 69.59% 64.14% 55.49% 61.50%
0. Food & Live Animals 60.63% 60.46% 38.50% 38.24% 28.96% 26.90% 27.23%1. Beverage & Tobacco 14.70% 16.58% 23.62% 14.11% 17.35% 14.84% 18.62%6. Manufactured Goods Classified Chiefly by Material 5.83% 2.94% 5.93% 9.40% 8.60% 7.49% 7.64%8. Miscellaneous Manufactured Articles 7.91% 9.21% 13.97% 7.84% 9.23% 6.25% 8.01%
INTERMEDIATE GOODS 1.91% 1.44% 3.30% 9.39% 12.14% 27.45% 19.36%
2. Crude Materials, Inedible Except Fuels 0.37% 0.32% 0.56% 0.47% 0.75% 1.62% 1.22%3. Mineral Fuel, Lubricants and Related Materials 0.01% 0.00% 0.00% 7.43% 9.87% 23.23% 15.71%4. Animal and Vegetable Oils & Fats 0.51% 0.03% 0.01% 0.08% 0.01% 0.11% 0.01%5. Chemicals and Related Products 1.02% 1.08% 2.73% 1.41% 1.51% 2.49% 2.41%
CAPITAL GOODS 9.01% 9.38% 14.68% 21.02% 23.71% 17.06% 19.15%
7. Machinery and Transport Equipment 8.98% 9.37% 14.64% 19.62% 22.40% 15.97% 17.94%9. Miscellaneous 0.04% 0.01% 0.05% 1.40% 1.32% 1.09% 1.21%
TOTAL 100.00% 100.00% 100.00% 100.00% 100.00% 100.00% 100.00%
TOTAL EXPORTS - PERCENTAGE OF TOTAL
60

COMMODITY GROUPS 1998 1999 2000 2001 2002 2003 2004 2005pj
CONSUMER GOODS 152.18 132.21 130.35 92.61 106.20 94.64 107.22 106.15
0. Food & Live Animals 107.65 91.02 90.84 45.89 63.68 48.08 57.28 56.211. Beverage & Tobacco 14.73 21.68 24.65 28.17 23.29 28.73 31.62 31.626. Manufactured Goods Classified Chiefly by Material 16.64 8.19 3.92 5.75 10.83 9.70 11.44 11.448. Miscellaneous Manufactured Articles 13.15 11.31 10.95 12.80 8.41 8.13 6.88 6.88
INTERMEDIATE GOODS 3.24 2.67 1.87 3.13 1.70 2.19 6.75 3.96
2. Crude Materials, Inedible Except Fuels 0.70 0.49 0.43 0.62 0.58 1.11 2.73 1.533. Mineral Fuel, Lubricants and Related Materials 0.00 0.00 0.01 0.00 0.00 0.00 0.00 0.004. Animal and Vegetable Oils & Fats 1.04 0.76 0.05 0.01 0.13 0.01 0.21 0.005. Chemicals and Related Products 1.51 1.41 1.39 2.50 0.99 1.06 3.82 2.43
CAPITAL GOODS 7.60 5.44 6.87 5.36 8.03 8.01 7.91 7.96
7. Machinery and Transport Equipment 7.60 5.44 6.87 5.34 8.01 8.01 7.89 7.789. Miscellaneous 0.00 0.00 0.00 0.02 0.02 0.01 0.02 0.19
TOTAL 163.02 140.32 139.09 101.10 115.93 104.84 121.88 118.07
Source: Statistics Department
DOMESTIC EXPORTS BY STANDARD INTERNATIONAL TRADE CLASSIFICATION(EC$MILLIONS)
61

COMMODITY GROUPS 1995 1996 1997 1998 1999 2000 2001 2002 2003 2004r 2005pj
CONSUMER GOODS -182.57 -222.43 -289.19 -311.27 -352.48 -331.62 -313.01 -303.25 -398.42 -443.92 -489.85
0. Food & Live Animals -9.78 -18.25 -75.49 -70.66 -77.18 -79.31 -117.86 -84.60 -130.96 -140.98 -152.211. Beverage & Tobacco -10.79 -15.43 -13.11 -12.55 -6.60 -3.92 0.38 -4.78 -7.25 -8.34 -9.896. Manufactured Goods Classified Chiefly by Material -127.74 -116.36 -113.74 -137.76 -162.58 -146.27 -125.03 -110.56 -131.46 -145.56 -161.688. Miscellaneous Manufactured Articles -34.26 -72.39 -86.84 -90.30 -106.11 -102.13 -70.50 -103.31 -128.75 -149.04 -166.08
INTERMEDIATE GOODS -143.40 -157.37 -160.49 -152.39 -157.95 -184.93 -173.80 -140.56 -181.00 -176.65 -238.86
2. Crude Materials, Inedible Except Fuels -21.25 -19.75 -24.84 -22.50 -24.65 -24.76 -19.66 -18.28 -19.88 -20.50 -27.113. Mineral Fuel, Lubricants and Related Materials -55.34 -61.56 -67.05 -62.84 -57.26 -90.53 -94.14 -61.25 -92.11 -80.35 -130.004. Animal and Vegetable Oils & Fats -0.70 -2.17 -3.68 -0.46 -0.74 -1.27 -1.44 -0.70 -1.77 -2.15 -3.505. Chemicals and Related Products -66.11 -73.90 -64.92 -66.59 -75.30 -68.38 -58.55 -60.32 -67.25 -73.65 -78.26
CAPITAL GOODS -107.14 -149.90 -174.28 -164.93 -181.65 -194.70 -127.89 -136.68 -211.59 -165.66 -207.88
7. Machinery and Transport Equipment -106.94 -149.31 -178.86 -164.47 -181.11 -194.65 -127.84 -138.90 -213.56 -167.83 -209.689. Miscellaneous -0.20 -0.59 4.58 -0.46 -0.54 -0.05 -0.05 2.22 1.97 2.18 1.79
TOTAL -433.11 -529.71 -623.96 -628.59 -692.08 -711.25 -614.70 -580.48 -791.01 -786.22 -936.60
Source: Statistics Department and Department of Economic Affairs
pj=projected
r=revised
TRADE BALANCE BY STANDARD INTERNATIONAL TRADE CLASSIFICATION (EC$ Million)
62

2000r 2001r 2002r 2003r 2004r 2005e
CURRENT ACCOUNT -248.78 -296.02 -296.49 -394.04 -268.77 -406.76
Goods -685.27 -596.73 -560.81 -764.75 -701.05 -906.19 Merchandise -711.22 -623.66 -580.48 -791.00 -745.67 -936.59 Repair on goods 0.03 0.02 0.00 0.02 0.02 0.01 Goods procured in ports by carriers 25.92 26.91 19.67 26.23 44.60 30.39
Services 506.86 383.87 327.02 469.02 584.67 640.24 Transportation -109.76 -113.77 -107.07 -139.37 -138.25 -152.02 Travel 662.41 543.40 476.05 665.41 779.84 854.01 Insurance Services -15.98 -11.64 -13.38 -17.75 -20.16 -22.37 Other Business Services -13.69 -22.07 -18.52 -30.68 -28.55 -30.20 Government Services -16.12 -12.06 -10.05 -8.59 -8.21 -9.18
Income -121.33 -121.77 -95.35 -130.82 -189.94 -183.67 Compensation of Employees 0.11 0.17 0.15 0.25 0.36 0.36 Investment Income -121.44 -121.94 -95.50 -131.07 -190.30 -184.03
Current Transfers 50.95 38.61 32.64 32.50 37.55 42.86 General Government 9.18 -0.87 -2.64 -2.20 -0.50 -0.33 Other Sectors 41.77 39.48 35.28 34.70 38.05 43.19
CAPITAL AND FINANCIAL ACCOUNT 274.34 282.49 259.48 411.61 350.07 448.95
CAPITAL ACCOUNT 38.33 68.75 53.32 46.13 9.32 7.50 Capital Transfers 42.63 68.75 53.32 46.13 9.32 7.50 Acquisition & Disposition of Non-Produced, Non-Financial Assets -4.30 0.00 0.00 0.00 0.00 0.00
FINANCIAL ACCOUNT 236.01 213.74 206.16 365.48 340.75 441.45 Direct Investment 145.12 158.78 134.74 261.31 215.07 290.89 Portfolio Investment 76.64 31.69 13.14 170.81 43.98 40.56 Other Investments 14.24 23.26 58.28 -66.63 81.70 110.00 Public Sector Loans 19.50 0.22 3.47 43.97 56.57 37.12 Commercial Banks -23.06 26.56 23.42 -193.79 88.15 185.11 Other 17.81 -3.52 31.39 83.19 16.80 18.10
ERRORS AND OMISSIONS 10.68 40.90 50.90 18.42 -8.92 -89.14
OVERALL BALANCE 36.23 27.37 13.89 35.99 72.38 -46.95
FINANCING -36.23 -32.46 -13.89 -35.99 -72.38 46.95 Change in SDR Holdings 0.00 0.00 0.00 0.00 0.00 0.00 Change in Reserve Position with IMF 0.00 0.00 0.00 0.00 0.00 0.00 Change in Government Foreign Assets -24.06 -5.09 -0.98 -1.45 -3.49 -2.00 Change in Imputed Reserves -12.17 -27.37 -12.91 -34.55 -68.89 48.95
(EC$Million) BALANCE OF PAYMENTS
Source :ECCB & Department of Economic Affaris, MOF
63

COPYRIGHT 2006-Ministry of Finance, International Financial Services and Economic Affairs
All rights reserved. No part of this publication may be reproduced or transmitted in any form or by any
means, electronic or mechanical, including photocopy, recording, or any information storage and retrieval
system, without permission in writing from the producer.
www.stlucia.gov.lc
PRINTED BY THE DIVISION OF ECONOMIC AFFAIRS