lisa sofi e höckel - rwi...
TRANSCRIPT

RUHRECONOMIC PAPERS
Individualism vs. CollectivismHow Inherited Cultural Values Aff ect Labor Market Outcomes of Second Generation Immigrants in the US
#669
Lisa Sofi e Höckel

Imprint
Ruhr Economic Papers
Published by
Ruhr-Universität Bochum (RUB), Department of Economics Universitätsstr. 150, 44801 Bochum, Germany
Technische Universität Dortmund, Department of Economic and Social Sciences Vogelpothsweg 87, 44227 Dortmund, Germany
Universität Duisburg-Essen, Department of Economics Universitätsstr. 12, 45117 Essen, Germany
RWI Leibniz-Institut für Wirtschaftsforschung Hohenzollernstr. 1-3, 45128 Essen, Germany
Editors
Prof. Dr. Thomas K. Bauer RUB, Department of Economics, Empirical Economics Phone: +49 (0) 234/3 22 83 41, e-mail: [email protected]
Prof. Dr. Wolfgang Leininger Technische Universität Dortmund, Department of Economic and Social Sciences Economics – Microeconomics Phone: +49 (0) 231/7 55-3297, e-mail: [email protected]
Prof. Dr. Volker Clausen University of Duisburg-Essen, Department of Economics International Economics Phone: +49 (0) 201/1 83-3655, e-mail: [email protected]
Prof. Dr. Roland Döhrn, Prof. Dr. Manuel Frondel, Prof. Dr. Jochen Kluve RWI, Phone: +49 (0) 201/81 49-213, e-mail: [email protected]
Editorial Office
Sabine Weiler RWI, Phone: +49 (0) 201/81 49-213, e-mail: [email protected]
Ruhr Economic Papers #669
Responsible Editor: Jochen Kluve
All rights reserved. Bochum, Dortmund, Duisburg, Essen, Germany, 2017
ISSN 1864-4872 (online) – ISBN 978-3-86788-776-2The working papers published in the Series constitute work in progress circulated to stimulate discussion and critical comments. Views expressed represent exclusively the authors’ own opinions and do not necessarily reflect those of the editors.

Ruhr Economic Papers #669
Lisa Sofie Höckel
Individualism vs. CollectivismHow Inherited Cultural Values Affect
Labor Market Outcomes of Second Generation Immigrants in the US

Bibliografische Informationen der Deutschen Nationalbibliothek
Die Deutsche Bibliothek verzeichnet diese Publikation in der deutschen National-bibliografie; detaillierte bibliografische Daten sind im Internet über: http://dnb.d-nb.de abrufbar.
Das RWI wird vom Bund und vom Land Nordrhein-Westfalen gefördert.
http://dx.doi.org/10.4419/86788776ISSN 1864-4872 (online)ISBN 978-3-86788-776-2

Lisa Sofie Höckel1
Individualism vs. CollectivismHow Inherited Cultural Values Affect Labor Market Outcomes of Second Generation Immigrants in the US
AbstractThe labor market performance of second generation immigrants is a crucial determinant of integration. Labor market returns to their different cultural traits, however, have been rarely researched within the economic literature. This study provides insight on the link between the level of collectivism at the country of ancestry and labor market outcome of second generation immigrants in the US. Using 1994 - 2014 survey data, we analyze the relationship between inherited cultural values and the economic outcome of more than 21,000 male homogamous second generation immigrants. We use the historical disease environment of the country of ancestry as a measurement for collectivism since collectivistic values have been particularly advantageous in countries with a greater prevalence of disease-causing pathogens. We find that higher scores of collectivism are associated with higher labor force participation and income earned in the US. The number of hours worked and self-selection into jobs that require collectivistic traits are the main determinants of the positive impact of collectivism on earnings.
JEL Classification: A13, F22, J14, J24
Keywords: Labor force participation; occupational choice; migration; cultural values
January 2017
1 Lisa Sofie Höckel, RWI. – I am grateful to Thomas K. Bauer, Julia Bredtmann, Ira N. Gang, Stephan Klasen, Manuel Santos Silva as well as conference participants at the EGI Conference 2015, the RGS Conference 2016, the SMYE 2016, the VfS Meeting 2016 and the EALE 2016 for valuable comments and suggestions. All remaining errors are my own. – All correspondence to: Lisa Sofie Höckel, RWI, Hohenzollernstr. 1-3, 45128 Essen, Germany, e-mail: [email protected]

1. Introduction
Cultural diversity induced by migration is beneficial to economically ad-vanced host countries such as the US (Ottaviano and Peri, 2006). For thelong run evaluation of migration, however, the labor market performance ofsecond-and-higher generation immigrants is a “key yardstick” (Card, 2005).1
Policy makers argue that the cultural ancestries of migrants need to be takeninto consideration to ensure a successful (labor market) integration - espe-cially in countries like the US, where the ethnic composition of immigrantshas changed dramatically over time. While in 1970, 70.4 percent of the im-migrant population originated from North America or Europe, by 2012 81.6percent of the foreign born population came from Asia or Latin America (USCensus Bureau, 2016). The labor market returns to different cultural traits,however, have been neglected in the empirical literature until recently.
This paper aims at partly filling this gap by investigating the impactof different cultural ancestries on the economic performance of second gen-eration immigrants in the US. Within the cultural value sphere, we studythe individualism vs. collectivism dimension which influences immigrants’preferences and expectations with respect to work values like cooperation,effort, and innovation. This dimension is particularly interesting since thetraditional source countries of immigrants in the US tend to be individual-istic whereas new source countries, such as China, are often collectivisticallyshaped.
Our paper is related to the economic literature on the labor market per-formance of immigrants. This strand of literature widely employs the epi-demiological approach which uses source country characteristics as a proxyfor the cultural values of immigrants (Fernandez and Fogli, 2009; Blau et al.,2011; Hansen, 2013). Using the variation in source country labor force par-ticipation rate (LFPR) as a cultural proxy, Antecol (2000), for example,explains half of the variation in the gender gap in LFPR of first generationimmigrants in the US. A disadvantage of most cultural proxies employedin the literature, is that they capture different unobservable factors, even
1Given current birth rates and immigration trends, the Pew Research Center (2013)predicts that all of the growth of the US working-age population between 2013 and 2050will be accounted for by immigrants and their US-born children.
4

those outside the cultural dimension such as the economic and institutionalconditions of the country of ancestry. The use of collectivism as a culturalvalue has the advantage of employing cultural theory to impose a pattern ofcross-country similarities and dissimilarities. We connect the epidemiologi-cal approach to the literature on skill complementarities which shows thatforeign-born workers specialize in different production tasks relative to com-parably skilled natives (Green, 1999; Peri and Sparber, 2009). Ottavianoand Peri (2005) suggest that this might be due to different culture specificskills inducing different occupational preferences. However, the authors donot investigate potential disparities among immigrants with different culturalancestry.
This paper contributes to the literature in three ways. First, we pro-vide evidence on the channels through which cultural values shape labormarket outcomes. Not only do we study the labor force participation, butalso the occupational choice of second generation male immigrants, to showhow cultural values influence income. We therefore take into considerationwhich abilities are relevant for the occupations chosen by second generationimmigrants with collectivistic ancestry, as well as their individualistic coun-terparts.
Second, we employ a novel collectivism measure. In the existing literaturethe level of individualism is usually measured by Hofstede’s individualism in-dex which uses survey data on work attitudes of IBM employees. However,survey data on values as an indicator for cultural traits can be driven byomitted variables (e.g. economic development) which are correlated withcollectivism. In contrast, our collectivism measure, the historical prevalenceof infectious diseases in the country of ancestry, is drawn from biology andgives us confidence in exogenous variation. We follow Fincher et al. (2008)who argue that the regional variation in the prevalence of infectious diseasesis a determinant factor in the origin of collectivism. They demonstrate thatcollectivism is likely to have emerged and persisted within populations witha historically higher prevalence of pathogens. By creating i.) a sharp dis-tinction between in-groups and out-groups and ii.) a strong emphasis ontradition and conformity, collectivism evolved as a best response strategy tothe dangers posed by mortality-causing pathogens.
Third, we are the first to analyze exclusively homogamous family constel-lations (i.e. families, in which both parents were born in the same country)to ensure that the effect of our cultural variable is unambiguous. If parentshave different cultural backgrounds, taking only one parental ancestry into
5

consideration adds ambiguity to the interpretation of the results since thereis no evidence on which parent is dominant in passing on his or her culturalheritage.
Using the epidemiological approach on US survey data, we find a strongpositive effect of collectivism on labor force participation. This result givesindication that individuals with a collectivistic ancestry feel responsible forsupporting their in-group. As a result they value their own leisure relativelyless and they have relatively lower reservation wages. Thus, they are morelikely to take jobs which do not fulfill them. We also find evidence of a positiveeffect of collectivism on income earned. This effect is mainly explained bythe amount of hours worked and the occupation chosen. Finally, higherscores of ancestral collectivism are associated with occupations which requirecollectivistic abilities such as dependability, suggesting that individuals sortinto occupation requiring skills on which they have a cultural comparativeadvantage.
The remainder of the paper is organized as follows. Section 2 gives a shortoverview of the economics of culture and outlines the relevant literature.Section 3 introduces the empirical strategy used and section 4 presents theresults as well as the most relevant findings of this study. Concluding remarksare presented in section 5.
2. Background
2.1. Collectivism as a Cultural Value
The concepts of collectivism and individualism can be linked to the schoolof new institutional economics (see, for example, North, 1990). As culturalvalues, they are informal institutions which constrain human behavior andshape incentives. They are transmitted fairly unchanged from generation togeneration and can be largely treated as constant throughout an individual’slifetime (Guiso et al., 2006). Cultural values persist in societies if disobedi-ence results in a sufficient loss of reputation or feelings of guilt and anxiety.2
This implies that cultural values sustain in immigrant communities if thecompliance with the values is societally monitored within the group.
The influence of cultural values can be analyzed with respect to the di-rect impact on preferences and expectations and with respect to the indirect
2For more on cultural values in general, see, e.g. Greif (1994); Akerlof (1980); Elster(1989); Nunn and Wantchekon (2011); Akerlof and Kranton (2000).
6

effects of those preferences on economic outcomes. Our investigation focuseson the impact of the individualism-collectivism (IND-COL) dimension whichis described as, “the most important dimension for capturing cultural varia-tion” (Heine, 2008, p.189). Therefore, we adopt the following definition:
Individualism pertains to societies in which the ties between indi-viduals are loose: everyone is expected to look after him- or her-self and his or her immediate family. Collectivism as its oppositepertains to societies in which people from birth onward are inte-grated into strong, cohesive in-groups, which throughout people’slifetime continue to protect them in exchange for unquestioningloyalty (Hofstede et al., 2010, p.92).
In collectivist societies, the relationship between in-group members ischaracterized by interdependence and intensity. The relationship is sustainedthrough the preservation of traditions and members remain in their in-groupeven if it is costly. In individualistic societies, people tend to make “friends”easily but if in-group obligations get inconvenient, they quit the group andlook for another one instead. Further, people emphasize their own uniquenessand are encouraged to explore their individual features. Innovations areincentivized since success is considered a result of an exceptional personalitytrait and rewarded with social status. In collectivistic societies, however, thedrive towards individual achievement is less distinct. Therefore, collectivistsocieties reward the effort people invest in serving the group’s goal as well asthe ability to conform (Hofstede et al., 2010; Triandis, 1995).
Table 1 summarizes economically relevant differences between individu-alists and collectivists, and illustrates that characteristics emerging from thedifferent societal emphases can have very different labor market implications.Based upon their characteristics, we predict collectivists to have a higher la-bor force participation rate. Given that collectivists feel responsible towardssupporting their in-group, we expect them to be more likely to take unpleas-ant jobs. While some of their individualistic counterparts take time to finda job which fits their abilities best or pursue their individualistic happinessthrough studying or other means of self-fulfillment, we assume that the mo-tivation to support one’s in-group leads to a higher labor force participationof collectivists. Within the labor force, we assume collectivists to also workmore hours. Collectivistic societies reward the effort displayed by their mem-bers and effort can be well demonstrated through a high amount of hoursworked. We further assume that collectivists’ in-group orientation reduces
7

Table 1: Collectivism vs. Individualism
Collectivism Individualism
Motivation Obligation Social StatusWork Values Effort AbilityWork Styles Cooperation Innovation
Dependability Independance
Source: Hofstede et al. (2010); Triandis (1995)
concerns for own leisure in the labor supply decision, thereby reducing reser-vation wages relative to individualists facing similar labor market conditions.Moreover, we assume people from individualistic societies to have a prefer-ence for jobs which require individualistic abilities such as independence andinnovation and people from collectivistic societies to have a comparative ad-vantage in jobs which are cooperation-intensive and require social skills likesensibility. The income earned by collectivists and individualists then partlydepends on the returns to those different work characteristics.
2.2. Related Literature
The literature on the determinants of economic growth shows that col-lectivism is a relevant determinant of economic outcomes.3 Gorodnichenkoand Roland (2010, 2011), for example, develop an endogenous growth modelwhich accounts for the IND-COL dimension and predict that individualismleads to more innovation because of the social rewards for achievement inindividualistic societies. Collectivism leads to efficiency gains, but they arestatic unlike the dynamic effects of individualism. Using rainfall variation asan instrument for individualism, Davis (2016) finds that individualism hasa positive effect on economic development. Licht et al. (2007) investigatethe effect of individualism on formal institutions using grammar rules4 as
3The growth literature on the importance of institutions is even more extensive (see,for example, Acemoglu et al., 2005; Alesina and La Ferrara, 2002; Levine, 2005; Greif,1994; Tabellini, 2010).
4They classify languages in which the use of a pronoun (“I”, “You”, etc.) for the subjectin a sentence is compulsory as relatively more individualistic than languages which do notrequire a compulsory pronoun and allow the identity of the subject in a sentence to becontext-specific.
8

an instrument and find that individualism is positively correlated with ba-sic social norms of governance (the rule of law, corruption, and democraticaccountability).
A micro-economic strand of literature focuses on the cultural determi-nants of immigrants’ economic outcomes. The empirical strategy most of-ten employed is the so called “epidemiological approach” (Fernandez, 2007)which uses source country cultural proxies (originally female labor force par-ticipation rates (FLFPR)) to explain the labor supply of female immigrants(see, for example, Antecol, 2000; Blau et al., 2011; Fernandez and Fogli,2009; Bredtmann and Otten, 2015). Antecol (2000) finds that the FLFPRof the country of ancestry explains half of the overall variation in the gendergap in LFPR of first generation immigrants in the US. The effect is smallerfor second-and-higher generation immigrants which Antecol (2000) interpretsas evidence for assimilation. Similary, Fernandez and Fogli (2009) investi-gate fertility behavior of second generation female immigrants in the US andBredtmann and Otten (2015) study the impact of both source and host-country characteristics for female immigrant labor supply in Europe. Thesestudies exclusively consider cultural components with respect to gender roles,e.g. a woman’s appropriate role in society. Further, FLFPR captures dif-ferent unobservable factors, even those outside the cultural dimension likethe economic and institutional conditions of the country of ancestry. Thus,the estimated effects could also be driven by systematic economic differencesacross countries of ancestry rather than by cultural differences.
A collectivism measurement, following cultural theory, has the advantageof being more explicit about why ancestries matter and why the differences incollectivism emerged. Hansen (2013) employs the epidemiological approachto test the influence of individualism on the annual income of male secondgeneration immigrants. He measures the level of individualism at one of theparent’s country of origin and uses the Hofstede index as a measure. Overall,he finds a small but significant positive effect of individualism on the annualincome of male US respondents. Hansen (2013)’s approach has the disad-vantage that only the origin of one parent is observed. According to Bisinand Verdier (2000), however, the inter-generational transmission of culturalvalues of parents with mixed cultural background can be complex. The find-ings of Hansen (2013) might be biased by the origin of the unobserved parentif there is a systematic bias in mating behavior (e.g., if individualists over-proportionally marry US-natives). We extend Hansen’s work by consideringonly parents from the same country of origin to capture a clearer effect of
9

cultural differences.Our paper further connects the literature on cultural values to the strand
on occupational substitutability of immigrants to study the underlying causesof income differences. Green (1999) investigates the occupational attainmentof immigrants relative to native born Canadians and finds that immigrantschoose different occupations compared to otherwise similar natives. Periand Sparber (2009) confirm Green (1999)’s findings for the US and provideevidence that less educated foreign-born workers specialize in different pro-duction tasks than natives. Foreign-born workers with similar observablecharacteristics to natives seem imperfect substitutes in production becausethey posses unique skills that make them specialize in different occupations.Ottaviano and Peri (2005) suggest that this might be due to different cul-ture specific skills which induce different occupational preferences. We builtupon this hypothesis by investigating the differences in occupational choicebetween respondents with a individualistic and collectivistic ancestry.
3. Empirical Strategy and Data
3.1. Conceptional Framework
Our specification follows the epidemiological approach by investigatingthe performance of descendants of immigrants from different countries in thesame host country. Fernandez (2007) argues that people who emigrate leavetheir formal institutional environment behind, but take their cultural valueswith and pass them on to their children. For second generation immigrants,the institutional and economic conditions of the parents’ country of originshould no longer be relevant since the children grew up facing the marketsand formal institutions of the host country which are homogeneous to thedescendants of all immigrants.5 Inter-generationally transmitted culturalvalues, however, can still affect their preferences and beliefs.6
5In her denotation, Fernandez (2007) refers to the science of epidemiology, in whichpatterns and effects of disease conditions are studied. Therefore, health conditions ofimmigrants are analyzed to test whether cross-country differences in diseases are environ-mental or genetic. In epidemiology, culture is regarded as a component of the environment.Therefore, differences in the disease patterns of natives and immigrants are not necessarilydue to genetic differences. The underlying cause can also be the persistence of culture andits transferability through channels like diet or lifestyle.
6Note that our definition of culture only contains those dimensions of culture whichare inherited rather than voluntarily accumulated.
10

To analyze the role of collectivism as a determinant of income earned ofsecond generation male immigrants, we are therefore interested in the stylizedmodel
ln(yijst) = α + βCollectivismj + λ′Xi + δ′Cj + ρs + γt + εijst (1)
where ln(yijst) denotes the natural logarithm of the total personal annualincome (pre-tax) in US$ of second generation male immigrant i with countryof ancestry j in state s and year t. The explanatory variable Collectivismcorresponds to the historical prevalence of nine infectious diseases in hiscountry of ancestry and is taken from Fincher et al. (2008). X is a vectorof controls at the individual level and C contains control variables for thecountry of ancestry j. All regressions include state dummies ρs and year ofsurvey fixed effects γt. εijst is the error term. All reported standard errorsare clustered at the country of ancestry level.
In the analysis, we focus on second generation immigrants who were bornto homogamous families (i.e., families in which both parents were born in thesame country). The consideration of second generation immigrants ratherthan first generation immigrants has the advantage that they are not ex-posed to immigration shocks that can lead to a temporary deviation fromtraditional cultural behavior. For example, language barriers, discriminationor greater uncertainty can prevent immigrants from acting in accordanceto their cultural principles. Further, the investigation of second generationimmigrants reduces a possible selection bias of migration.
The restriction to homogamous families is based on Bisin and Verdier(2000)’s model of endogenous cultural transmission. The authors demon-strate how parents are motivated to shape their childrens’ cultural values bya, “paternalistic altruism” (Bisin and Verdier, 2000, p.962) and how parentsintensify their efforts when family and societal values are substitutes. Intheir model, parents are most efficient in transmitting their cultural heritageif they both have the same cultural traits. Since there is no literature onwhich parent is dominant in passing his or her cultural heritage on if parentshave different cultural backgrounds, it is preferable to only study homoga-mous families. The consideration of only one parent’s cultural backgroundcould bias the results.
The epidemiological approach uses the portability characteristic of cul-ture relative to a fixed institutional and economic environment to investigate
11

the impact of cultural values on economic performance. This allows us todisentangle the impact of collectivism from formal institutions and ensuresthat no reverse causality between economic performance and individualismoccurs. Further, we employ historical data as a measure for collectivism.This has the advantage that historical data from the country of ancestryreflects the immigrant’s ancestral circumstances, but does not suffer fromendogeneity of recent development processes. If our historical measure atthe country of ancestry level is able to explain part of the variation in eco-nomic outcomes of descendents of immigrants, growing up in the US, thenit is because of the explanatory power of inter-generational transmission ofcultural values.
A major threat to our identification strategy is whether collectivism iscorrelated with other characteristics of countries of origin that may affectimmigrants’ performance. For example, since individualistic countries havehistorically higher levels of income, education, etc., we would be worried ifour cultural variable would be picking up those effects - that is, the effect of,for example, being an immigrant from a richer country of origin. Therefore,we include a vast number of control variables capturing economic, social,political, and historical characteristics of the countries of origin to ensurethat our results are not being driven by potential confounders.
3.2. Data
The data employed for the analysis is the Current Population Survey(CPS), which we extracted from the IPUMS (Integrated Public Use Mi-crodata Series) database (King et al., 2010). The CPS is a monthly UShousehold survey conducted jointly by the Bureau of Labor Statistics andthe US Census Bureau. Within the CPS, our data comes from the MarchAnnual Social and Economic Supplement (ASEC). This data set is ideal be-cause since 1994, the ASEC includes questions about the birthplace of therespondent’s parents. Another advantage of the data is that it includes de-tailed variables on demographics (e.g. age, education7, family size, maritalstatus, race8) and labor market outcomes (employment status, personal in-
7Years of schooling provides the expected years of schooling to obtain a certain degree.8We construct race dummies for Black, Asian and Mixed race. The reference race
group is White/Caucasian. We also control for Hispanic origin. The ACS does not classifyHispanic as a race but as a country of origin. Thus, the covariate Hispanic and the (other)race dummies are not mutually exclusive.
12
come, usual hours worked per week, occupation). It further enables us toinclude year and state dummies.9
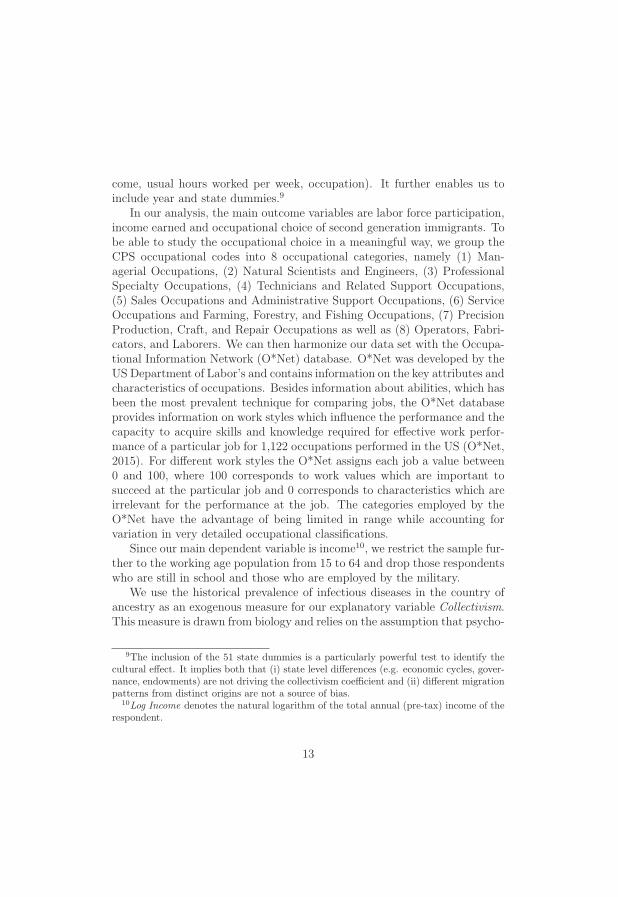
In our analysis, the main outcome variables are labor force participation,income earned and occupational choice of second generation immigrants. Tobe able to study the occupational choice in a meaningful way, we group theCPS occupational codes into 8 occupational categories, namely (1) Man-agerial Occupations, (2) Natural Scientists and Engineers, (3) ProfessionalSpecialty Occupations, (4) Technicians and Related Support Occupations,(5) Sales Occupations and Administrative Support Occupations, (6) ServiceOccupations and Farming, Forestry, and Fishing Occupations, (7) PrecisionProduction, Craft, and Repair Occupations as well as (8) Operators, Fabri-cators, and Laborers. We can then harmonize our data set with the Occupa-tional Information Network (O*Net) database. O*Net was developed by theUS Department of Labor’s and contains information on the key attributes andcharacteristics of occupations. Besides information about abilities, which hasbeen the most prevalent technique for comparing jobs, the O*Net databaseprovides information on work styles which influence the performance and thecapacity to acquire skills and knowledge required for effective work perfor-mance of a particular job for 1,122 occupations performed in the US (O*Net,2015). For different work styles the O*Net assigns each job a value between0 and 100, where 100 corresponds to work values which are important tosucceed at the particular job and 0 corresponds to characteristics which areirrelevant for the performance at the job. The categories employed by theO*Net have the advantage of being limited in range while accounting forvariation in very detailed occupational classifications.
Since our main dependent variable is income10, we restrict the sample fur-ther to the working age population from 15 to 64 and drop those respondentswho are still in school and those who are employed by the military.
We use the historical prevalence of infectious diseases in the country ofancestry as an exogenous measure for our explanatory variable Collectivism.This measure is drawn from biology and relies on the assumption that psycho-
9The inclusion of the 51 state dummies is a particularly powerful test to identify thecultural effect. It implies both that (i) state level differences (e.g. economic cycles, gover-nance, endowments) are not driving the collectivism coefficient and (ii) different migrationpatterns from distinct origins are not a source of bias.
10Log Income denotes the natural logarithm of the total annual (pre-tax) income of therespondent.
13

logical phenomena such as collectivism serve as anti-pathogen defense func-tions. Fincher et al. (2008) argue that the regional variation in the prevalenceof infectious diseases is a determinant factor in the origin of cross-culturaldifferences in cultural values. Collectivism is likely to have emerged andpersisted within populations which historically had a greater prevalence ofpathogens since it comprises two particular features which provide defenseagainst the dangers posed by morbidity causing pathogens. First, collec-tivism emphasizes a sharp distinction between in-groups and out-groups. Ina disease environment, this inhibits the exposure to novel pathogens. Col-lectivist populations are wary of contact with foreigners which reduces therisk of being infected by unusual pathogen imported by out-groups. Sec-ond, the strong emphasize on conformity in collectivist societies ensures thatspecific norms and traditions which serve as buffers against pathogen trans-mission are preserved.11 A higher level of tolerance could encourage devi-ation from the status quo and thus lead to higher risks to self and others.Fincher et al. (2008) assume ecological effects on culture to require sometime lag and pathogen prevalence to be causally precedent to collectivism.Therefore, they employ old epidemiological atlases to rate the prevalence ofnine different kinds of disease-causing pathogens on a 4-point coding schemefor 160 geopolitical regions.12 The nine infectious diseases are leishmanias,schistosomes, trypanosomes, leprosy, malaria, typhus, filariae, dengue andtuberculosis. They are coded 0 if they were never reported or completely ab-sent; 1 if they were rarely reported; 2 if they were moderately or sporadicallyreported and 3 if the disease occurred on an epidemic level at least once oris currently present at severe levels.13 Each disease rating is converted into
11Sherman and Billing (1999) illustrate the functioning of traditions in the context offood preparation. They argue that the cultivation of culinary spices is costly given that theresources could otherwise be devoted to more nutritional crops. Since spices are powerfulantibiotics, however, their cultivation is especially beneficiary in regions where bacterialinfestation of food is problematic. Thus, they are more likely to be cultivated in regionswhere the prevalence of infectious diseases is high.
12Murray and Schaller (2010) also estimate a seven-item index (excluding leprosy andtuberculosis) for 230 geopolitical regions, which is less highly correlated with other col-lectivism measures. In our robustness analysis in section 4.3, we refer to the seven-itemscore because it is available for more countries than the more accurate nine-item score. Inparticular, it includes Caribbean islands and South American countries which are relevantcountries of ancestry for US immigrants.
13The prevalence of tuberculosis is based on another source and coded according to a
14

z-scores (i.e. standardized) and computed as the mean of the z-scores of thenine separate disease items. The mean of the overall index is approximately0, positive scores refer to a disease prevalence which is higher than the meanand, therewith, collectivism and negative scores refer to a disease prevalencewhich is lower than the mean and thus, individualism. Figure 1 illustratesthe collectivism measure across world regions and shows that Western coun-tries such as the US or Europe tend to be individualistic while most Asianand African countries are collectivistic.
Our collectivism measure is highly correlated with other collectivismscores and has been used in the economic literature before (e.g., Gorod-nichenko and Roland, 2012). The most prevalent individualism score inthe existing literature is the Hofstede individualism index which uses cross-country matched survey data on work attitudes of IBM employees in dif-ferent countries. However, this approach is controversial since survey datacan pick up general cross-country differences rather than precisely measuringculturally subjective and sensitive values. Further, critics claim that a studyconducted in one particular company cannot be generalized to the entire cul-tural system of a country. In comparison, our disease measure gives us moreconfidence in unbiased estimations.
[-1.31,-.46](-.46,-.01](-.01,.29](.29,.52](.52,.94](.94,1.17]No data
Figure 1: Historical Disease Prevalence
We also include a set of control variables at the country of ancestrylevel (life expectancy, GDP per capita, primary school enrollment, LFPR)to ensure that our collectivism variable does not capture the economic de-
3-point scheme.
15
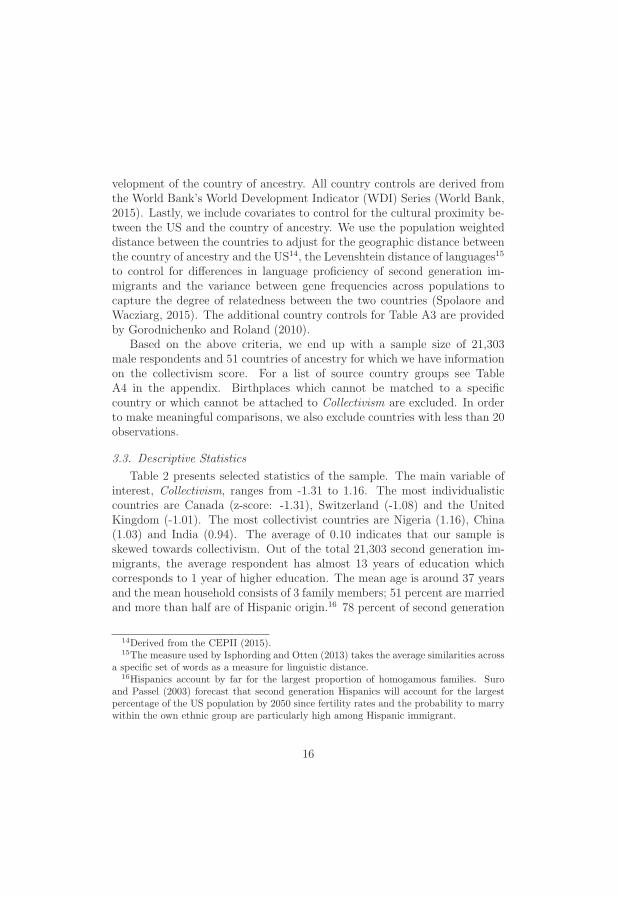
velopment of the country of ancestry. All country controls are derived fromthe World Bank’s World Development Indicator (WDI) Series (World Bank,2015). Lastly, we include covariates to control for the cultural proximity be-tween the US and the country of ancestry. We use the population weighteddistance between the countries to adjust for the geographic distance betweenthe country of ancestry and the US14, the Levenshtein distance of languages15
to control for differences in language proficiency of second generation im-migrants and the variance between gene frequencies across populations tocapture the degree of relatedness between the two countries (Spolaore andWacziarg, 2015). The additional country controls for Table A3 are providedby Gorodnichenko and Roland (2010).
Based on the above criteria, we end up with a sample size of 21,303male respondents and 51 countries of ancestry for which we have informationon the collectivism score. For a list of source country groups see TableA4 in the appendix. Birthplaces which cannot be matched to a specificcountry or which cannot be attached to Collectivism are excluded. In orderto make meaningful comparisons, we also exclude countries with less than 20observations.
3.3. Descriptive Statistics
Table 2 presents selected statistics of the sample. The main variable ofinterest, Collectivism, ranges from -1.31 to 1.16. The most individualisticcountries are Canada (z-score: -1.31), Switzerland (-1.08) and the UnitedKingdom (-1.01). The most collectivist countries are Nigeria (1.16), China(1.03) and India (0.94). The average of 0.10 indicates that our sample isskewed towards collectivism. Out of the total 21,303 second generation im-migrants, the average respondent has almost 13 years of education whichcorresponds to 1 year of higher education. The mean age is around 37 yearsand the mean household consists of 3 family members; 51 percent are marriedand more than half are of Hispanic origin.16 78 percent of second generation
14Derived from the CEPII (2015).15The measure used by Isphording and Otten (2013) takes the average similarities across
a specific set of words as a measure for linguistic distance.16Hispanics account by far for the largest proportion of homogamous families. Suro
and Passel (2003) forecast that second generation Hispanics will account for the largestpercentage of the US population by 2050 since fertility rates and the probability to marrywithin the own ethnic group are particularly high among Hispanic immigrant.
16

male immigrants in our sample participate in the labor force and the meanannual personal income (pre-tax) is 40,131 US$. The standard deviationof 52,277 US$, higher than the average itself, illustrates the wide range ofincome variation in our sample.
Table 2: Summary statistics
Mean Std. Dev. Min Max
Collectivism 0.10 0.51 −1.31 1.16Work characteristicsLabor force participation 0.78 0.42 0 1Income (in thousands) 40.13 52.28 0 110.02Usual hours worked per week 42.11 10.39 1 99Individual characteristicsYears of schooling 12.95 3.13 0 22Age 36.88 13.54 15 64Family size 3.38 1.83 1 16Married 0.51 0.50 0 1EthnicityWhite 0.80 0.40 0 1Black 0.03 0.17 0 1Asian 0.15 0.35 0 1Mixed ethnicity 0.01 0.09 0 1
Hispanic 0.54 0.50 0 1
Observations 21,303
Table 3 illustrates how the countries of ancestry differ with respect to eco-nomic relevant characteristics and their cultural proximity to the US. TheGDP per capita ranges between 538 current US$ in Cambodia and 63,316current US$ in Norway. The mean life expectancy of approximately 74 yearscorresponds to the average life expectancy in Barbados. The LFPR is es-pecially high in Southeast Asian countries (e.g. Laos, Vietnam, China, andThailand). The country with the lowest population weighted distance to theUS is Canada and the country the furthest away is Cambodia. Four countriesin our sample have plain English as a mother tongue and thus a Levenshteinlinguistic distance of 0. While countries like Canada and England are ge-netically similar to the US, Nigeria is the country with the largest weightedgenetic distance to the US.
The different countries of ancestry are not equally represented in oursample. Figure 2 illustrates that the distribution of the collectivism score
17

Table 3: Country summary statistics (1994-2014)
Mean Std. Dev. Min Max
Collectivism −0.02 0.59 −1.31 1.16Country characteristicsGDP per capita 14, 542.49 15, 768.08 538.05 63, 316.10Labor force participation rate 60.37 8.66 43.51 81.83Life expectancy 73.59 6.20 48.51 81.65Primary school enrollment 92.76 7.07 65.29 99.98Cultural proximityWeighted distance 8, 305.29 3, 290.92 2, 079.30 14, 023.45Linguistic distance 84.75 27.53 0.00 104.06Genetic distance 0.56 0.57 0.00 1.49
Observations 51
within the US sample is skewed towards the right with a sample mean of0.10. This implies that our sample mainly consists of second generationimmigrants with a collectivistic ancestry. The median score is 0.28, sincemost second generation immigrants were born to Mexican (7,705) parents.Children to Puerto Rican (2,957), Italian (1,544), Philippine (1,195) andCanadian (937) parents also occur frequently in our sample.
18

02
46
8D
ensi
ty
-1.5 -1 -.5 0 .5 1Collectivism
Figure 2: Sample Distribution of Collectivism
Table 4: Comparative summary statistics
Collectivists Individualist
Mean Std. dev. Mean Std. dev. t-test
Individual characteristicsYears of schooling 12.61 3.01 14.44 3.20 −1.83∗∗∗Age 34.93 13.06 45.36 12.25 −10.43∗∗∗Family size 3.50 1.87 2.87 1.53 0.62∗∗∗Married 0.47 0.50 0.67 0.47 −0.20∗∗∗Ethnic originWhite 0.77 0.42 0.94 0.24 −0.17∗∗∗Black 0.03 0.17 0.02 0.12 0.02∗∗∗Asian 0.17 0.38 0.04 0.19 0.13∗∗∗Mixed ethnicity 0.01 0.09 0.00 0.05 0.01∗∗∗
Hispanic 0.66 0.47 0.04 0.20 0.62∗∗∗Work characteristicsLabor force participation 0.76 0.43 0.83 0.37 −0.07∗∗∗Income (in thousands) 35.78 47.85 59.03 64.95 −23.26∗∗∗Usual hours worked per week 41.61 10.19 44.02 10.91 −2.41∗∗∗Observations 17,313 3,990 21,303
Notes: – The table shows descriptive statistics for the two sub-samples of second-generation im-migrants from (i) collectivistic and (ii) individualistic countries of origin. The last column showsthe difference in mean values between the two samples. Significance stars indicate the result of therespective t-test. * p<0.10, ** p<0.05, *** p<0.01.
19

Table 4 exhibits the difference in the characteristics of second genera-tion immigrants with collectivistic ancestry compared to their individualis-tic counterparts.17 Respondents with collectivistic ancestry are on averageyounger, less educated and more likely to be Hispanic. Further, they earnless and are less likely to participate in the labor force. The number of obser-vations demonstrates that the majority of our sample consists of respondentswith a collectivistic ancestry and the t-tests show that collectivists and indi-vidualists differ significantly for all characteristics displayed.
4. Results
4.1. Extensive Margin
The log income distribution in our sample is segmented between a left“peak” of zero incomes and a second segment with positively (normally)distributed incomes. We, therefore, begin our econometric analysis by inves-tigating if a collectivistic ancestry affects the probability of participating inthe labor force.
For the extensive margin, we estimate a probit model18 where the de-pendent variable is a binary indicator for labor force participation. Table 5reports the average marginal effect of three different specifications. It displaysa positive and significant impact of our variable of interest on the probabilityto participate in the labor force. Column (1) reports the results of the regres-sion with only individual controls included, column (2) with individual andcountry controls and column (3) further includes measures for the culturalproximity. A one unit (i.e. standard deviation19) higher score of collectivism,which, for example, corresponds to the difference between China and Greece,indicates a 1.8 percentage point higher probability to participate in the laborforce in column (1). The individual covariates are significant and the signsof the coefficients are as expected. As found in previous studies, the effect ispositive for education, being married and for age.20 Factors negatively asso-
17For simplicity we divide the sample into two segments, a collectivistic one with a dis-ease prevalence larger than the average and an individualistic one with a disease prevalencesmaller than the average.
18Comparable estimates with a logit model.19Note that the standard deviation corresponds to the 51 countries included in our
sample rather than the 160 countries for which the collectivism score is available.20The average marginal effect results do not display that we control for age squared to
allow for a potential non-linear relationship of age and LFP.
20

ciated with labor force participation are the number of household members.We further incorporate ethnic origin dummies to ensure that our results arenot biased by discrimination. Column (2) controls for covariates at the coun-try of ancestry level since the effect of Collectivism could be driven by theeconomic development of the source country. Labor force participation rateas well as primary school enrollment at the country of ancestry influencethe probability to participate in the labor force significantly. Notably, theinclusion of country of ancestry controls increases both the size and the signif-icance of our variable of interest. This can be explained by the counteractingeffects of collectivism and economic development. On average, individual-istic countries are richer and more developed than collectivistic countries.This is correlated with higher average human capital of their citizens andtherewith a higher endowment to assimilate in the US. Once we control forthe economic development of the country of ancestry, however, the opposingeffects are disentangled. In column (3), we further control for the culturalproximity of the country of origin and the US. This specification capturesthe advantage in the labor market which immigrants from countries similarto the US might have. Column (3) displays our preferred specification.
4.2. Intensive Margin
In Table 6, we investigate the impact of collectivism on income earnedfor those in the labor force using the same controls as in the previous specifi-cation. While our variable of interest has a robust effect on LFP in all threespecifications, the impact on income earned only becomes significant oncewe include our full set of relevant controls. However, in our preferred speci-fication (3), a one unit higher Collectivism score increases income earned byalmost 5 percent. This result is both statistically and economically relevant,implying that a one unit more collectivistic ancestry has approximately thesame impact on income as half a year of schooling. The individual character-istics resemble those of Table 5 with respect to their signs while the effect ofdifferent ethnic origins changes. Being black affects the LFP negatively whileHispanics earn on average 11 percent less than their non-hispanic counter-parts. With respect to the country characteristics, primary school enrollmentstays a significant predictor of income earned and among the cultural proxim-ity indicators, the genetic distance has a significant impact on income earned.Overall, our model can explain about 25 percent of the variation of incomeand illustrates that the income of second generation immigrants is positively
21

Table 5: Extensive margin specification
Labor force participation
(1) (2) (3)
Collectivism 0.018∗∗ 0.024∗∗∗ 0.030∗∗∗
(0.008) (0.008) (0.011)Individual characteristicsYears of schooling 0.022∗∗∗ 0.022∗∗∗ 0.022∗∗∗
(0.003) (0.002) (0.002)Age 0.002∗∗∗ 0.002∗∗∗ 0.002∗∗∗
(0.000) (0.000) (0.000)Family size −0.007∗∗∗ −0.007∗∗∗ −0.007∗∗∗
(0.002) (0.002) (0.002)Married 0.109∗∗∗ 0.107∗∗∗ 0.107∗∗∗
(0.016) (0.014) (0.014)Ethnic origin (ref.: white)Black −0.040∗∗∗ −0.037∗∗ −0.043∗∗
(0.014) (0.018) (0.019)Asian −0.050∗∗∗ −0.055∗∗ −0.036
(0.019) (0.025) (0.030)Mixed ethnicity 0.002 0.004 0.006
(0.014) (0.013) (0.014)Hispanic −0.012 0.009 −0.009
(0.015) (0.012) (0.015)Country characteristicsGDP per capita 0.004 0.005
(0.006) (0.006)LFPR 0.002∗∗ 0.001∗
(0.001) (0.001)Life expectancy −0.002 −0.003
(0.002) (0.002)Primary school enrollment 0.002∗∗ 0.003∗∗
(0.001) (0.001)Cultural proximityWeighted distance −0.004
(0.003)Linguistic distance 0.006
(0.019)Genetic distance −0.005
(0.016)State controls Yes Yes YesYear controls Yes Yes Yes
Pseudo-R2 0.369 0.372 0.372Observations 21,303
Notes: – Probit results are reported as marginal effects evaluated at co-variate means. Heteroskedasticity robust standard errors that cluster atthe country of ancestry are shown in parentheses. * p<0.10, ** p<0.05,*** p<0.01.
22

correlated with a collectivistic ancestry.21
To investigate the drivers of this effect, Table 7 displays the impact ofvarious work characteristics. In our preferred specification, column (3) ofTable 6, we do not include work characteristics because they are likely to beendogenous to income earned. However, they can hint to relevant mecha-nisms. Thus, we control for hours worked and occupational choice in Table7. The introduction of hours worked in column (1) reduces the coefficientof Collectivism notably in size and significance. In column (2) we furtherinclude occupational dummies, which makes our Collectivism variable in-significant. This gives strong indication that occupational choice is one ofthe main channels of the positive effect of Collectivism. In columns (3) and(4), we report the estimates on the number of hours worked. Using the con-trols of our preferred specification, we find that a one unit more collectivisticancestry increases the weekly number of hours worked by more than one.The strong and significant effect of collectivism even holds if we control foroccupations (column (4)), which indicates that even within the same job,respondents with a collectivistic ancestry work more.
We further test whether a collectivist ancestry affects the occupationalchoice of second generation immigrants. Descriptively, Figure 3 displaysthe density of second generation immigrants in eight occupation categoriesaccording to their cultural ancestry.22 The figure illustrates that secondgeneration immigrants with individualistic ancestry are more likely to workin managerial occupations, engineering, professional specialty occupationsand technician jobs. Collectivistic second generation immigrants on the otherhand choose jobs in sales and administration, service occupations, in precisionproduction or as laborers. It seems that the probabilities of being employed ina particular occupational category vary along the individualism-collectivismdimension.23 However, Figure 3 only provides descriptive trends and thedifference in occupations could also be explained by individual characteristics
21To ensure that the positive effect of Collectivism is not driven by outliers we run quan-tile regressions which are robust to extreme value points. Table A1 reports the estimatesand shows that the effect of Collectivism is mainly driven by the median percentile.
22For simplicity we divide the sample into two segments, a collectivistic one with a dis-ease prevalence larger than the average and an individualistic one with a disease prevalencesmaller than the average.
23Figure A1 shows the distribution of all occupations taken by second generation immi-grants with collectivist or individualistic ancestry.
23

Table 6: Intensive margin specification
Log of income
(1) (2) (3)
Collectivism 0.017 0.024 0.049∗∗
(0.014) (0.022) (0.023)Individual characteristicsYears of schooling 0.098∗∗∗ 0.098∗∗∗ 0.098∗∗∗
(0.003) (0.003) (0.003)Age 0.118∗∗∗ 0.118∗∗∗ 0.118∗∗∗
(0.006) (0.006) (0.006)Age squared −0.001∗∗∗ −0.001∗∗∗ −0.001∗∗∗
(0.000) (0.000) (0.000)Family size −0.047∗∗∗ −0.047∗∗∗ −0.047∗∗∗
(0.005) (0.005) (0.005)Married 0.401∗∗∗ 0.399∗∗∗ 0.399∗∗∗
(0.019) (0.019) (0.019)Ethnic origin (ref.: white)Black −0.107∗∗ −0.084 −0.078
(0.052) (0.058) (0.054)Asian −0.022 0.007 0.033
(0.030) (0.049) (0.056)Mixed ethnicity −0.109∗ −0.099∗ −0.096
(0.060) (0.057) (0.057)Hispanic −0.143∗∗∗ −0.116∗∗∗ −0.112∗∗∗
(0.019) (0.024) (0.029)Country characteristicsGDP per capita 0.008 −0.005
(0.015) (0.012)LFPR −0.000 −0.000
(0.002) (0.002)Life expectancy −0.002 −0.002
(0.005) (0.005)Primary school enrollment 0.004 0.006∗
(0.003) (0.003)Cultural proximityWeighted distance −0.003
(0.006)Linguistic distance −0.053
(0.049)Genetic distance −0.049∗
(0.029)State controls Yes Yes YesYear controls Yes Yes Yes
Adjusted R2 0.244 0.244 0.244Observations 16,189
Notes: – Results are obtained from OLS regressions. Heteroskedasticityrobust standard errors that cluster at the country of ancestry are shownin parentheses. * p<0.10, ** p<0.05, *** p<0.01.
24
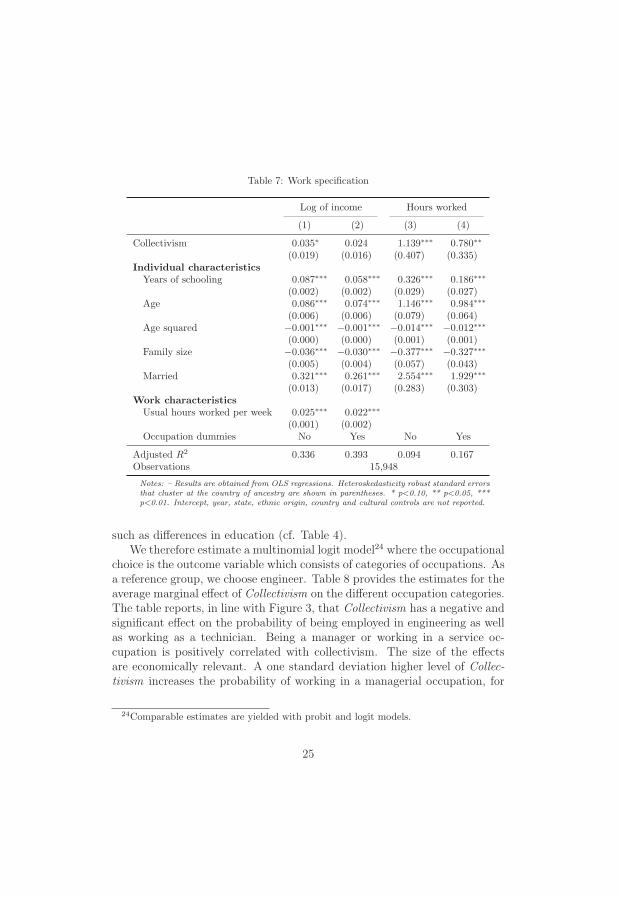
Table 7: Work specification
Log of income Hours worked
(1) (2) (3) (4)
Collectivism 0.035∗ 0.024 1.139∗∗∗ 0.780∗∗
(0.019) (0.016) (0.407) (0.335)Individual characteristicsYears of schooling 0.087∗∗∗ 0.058∗∗∗ 0.326∗∗∗ 0.186∗∗∗
(0.002) (0.002) (0.029) (0.027)Age 0.086∗∗∗ 0.074∗∗∗ 1.146∗∗∗ 0.984∗∗∗
(0.006) (0.006) (0.079) (0.064)Age squared −0.001∗∗∗ −0.001∗∗∗ −0.014∗∗∗ −0.012∗∗∗
(0.000) (0.000) (0.001) (0.001)Family size −0.036∗∗∗ −0.030∗∗∗ −0.377∗∗∗ −0.327∗∗∗
(0.005) (0.004) (0.057) (0.043)Married 0.321∗∗∗ 0.261∗∗∗ 2.554∗∗∗ 1.929∗∗∗
(0.013) (0.017) (0.283) (0.303)Work characteristicsUsual hours worked per week 0.025∗∗∗ 0.022∗∗∗
(0.001) (0.002)Occupation dummies No Yes No Yes
Adjusted R2 0.336 0.393 0.094 0.167Observations 15,948
Notes: – Results are obtained from OLS regressions. Heteroskedasticity robust standard errorsthat cluster at the country of ancestry are shown in parentheses. * p<0.10, ** p<0.05, ***p<0.01. Intercept, year, state, ethnic origin, country and cultural controls are not reported.
such as differences in education (cf. Table 4).We therefore estimate a multinomial logit model24 where the occupational
choice is the outcome variable which consists of categories of occupations. Asa reference group, we choose engineer. Table 8 provides the estimates for theaverage marginal effect of Collectivism on the different occupation categories.The table reports, in line with Figure 3, that Collectivism has a negative andsignificant effect on the probability of being employed in engineering as wellas working as a technician. Being a manager or working in a service oc-cupation is positively correlated with collectivism. The size of the effectsare economically relevant. A one standard deviation higher level of Collec-tivism increases the probability of working in a managerial occupation, for
24Comparable estimates are yielded with probit and logit models.
25

0
5
10
15
20
Per
cent
Manag
erial
Occ
Engine
ers
Specia
list
Techn
ician
s
Sales/A
dmini
strati
on
Service
and F
arming
Precisi
on
Labo
rers
Occupational Patterns
Collectivistic Individualistic
Figure 3: Occupational Pattern
example, by 2.2 percent. For the other occupational categories, the impactof Collectivism is insignificant, implying that the difference of frequency incategorical employment cannot be explained by collectivism, but rather byother individual characteristics. Adding on Patel and Vella (2007) who showthat immigrants with different background self-select into different occupa-tions, our results point to a self-selection along the cultural dimension whichpersists for second generation immigrants.
The O*Net data allows us to investigate the cultural implications fur-ther. In Table 9 we test if second generation immigrants with a collectivisticancestry are more likely to pursue a profession in which collectivistic valuesare required. Column (1) and (2) display the impact of Collectivism on thelikelihood of having a job which requests the collectivistic values concern forothers25 and dependability26. The trend is obvious and supportive of ourhypothesis. Second generation immigrants with a collectivistic ancestry aresignificantly more likely to pursue professions which require to be sensitivetowards others and reliable - both characteristics which are typically fosteredin collectivistic communities. In columns (3) and (4), we report the nega-
25Jobs which require being sensitive to others’ feelings and needs and being helpful andunderstanding on the job.
26Job requires being reliable, responsible, and dependable, and fulfilling obligations.
26

Table 8: Occupational Choice
(1)
Managerial Occ 0.022∗∗∗
(0.008)Engineer −0.014∗∗∗
(0.005)Specialist 0.005
(0.007)Technician −0.013∗∗∗
(0.005)Salesman −0.008
(0.011)Service 0.027∗∗
(0.012)Precicion Worker −0.012
(0.012)Laborer −0.008
(0.012)
Pseudo-R2 0.112Observations 16,201
Notes: – Multinomial logit re-sults are reported as marginaleffects evaluated at covariatemeans. Heteroskedasticity ro-bust standard errors that clusterat the country of ancestry areshown in parentheses. * p<0.10,** p<0.05, *** p<0.01. In-tercept, year, state, individual,country and cultural controls arenot reported. 307 observations(in 8 states) are excluded due tolimited within state occupationalvariation.
tive but insignificant effect of Collectivism on the probability of having anoccupation which requires individualistic traits such as the ability of innova-tion27 and independence28. These specifications allow us to address selection
27Jobs which require creativity to answers to work-related problems and to develop newideas.
28Jobs which requires developing one’s own ways of doing things, depending on oneselfto get things done and guiding oneself with little or no supervision.
27

concerns indirectly. A possible driver of the positive effect of Collectivism onincome earned could be a selection bias on immigration to the US. In collec-tivistic countries, people with an individualistic value set could feel misplacedand could therefore be more likely to immigrate to the individualistic US.Passing on their individualistic values, their children would then representa collectivistic country although the values transmitted to them are ratherindividualistic than collectivistic. If it was true that our results are drivenby the selection of individualistic respondents of collectivistic countries, wewould expect that Collectivism is negatively correlated with jobs requiringcollectivistic values. A positive correlation of Collectivism and collectivisticjobs, however, points to an impact of collectivistic values on the occupa-tional choice of respondents with a collectivistic background. Since Table 9reveals such a positive relationship, we can reject the hypothesis that ourresults are mainly driven by a selection bias. Instead, we conclude that theconsideration of cultural shaped preferences seems to be a vital determinantin explaining the occupational choice, income earned and the labor forceparticipation decision of second generation immigrants in the US.
Table 9: Work style specification
Collectivistic Individualistic
(1) (2) (3) (4)Concern for others Dependability Innovation Independence
Collectivism 0.987∗∗ 0.564∗∗ −0.584 −0.034(0.395) (0.250) (0.406) (0.247)
Individual characteristicsYears of schooling 0.980∗∗∗ 0.790∗∗∗ 1.261∗∗∗ 0.988∗∗∗
(0.097) (0.074) (0.052) (0.089)Age −0.132∗∗ 0.070∗∗∗ 0.416∗∗∗ 0.065
(0.060) (0.023) (0.056) (0.046)Age squared 0.002∗∗ −0.001∗∗ −0.005∗∗∗ −0.000
(0.001) (0.000) (0.001) (0.001)Family size −0.027 −0.164∗∗∗ −0.373∗∗∗ −0.141∗∗∗
(0.100) (0.044) (0.046) (0.051)Married 0.429∗ 0.941∗∗∗ 1.797∗∗∗ 1.099∗∗∗
(0.221) (0.117) (0.181) (0.222)
Adjusted R2 0.067 0.147 0.133 0.110Observations 16,508
Notes: – Results are obtained from OLS regressions. Heteroskedasticity robust standard errors that cluster at the countryof ancestry are shown in parentheses. * p<0.10, ** p<0.05, *** p<0.01. Intercept, year, state, ethnic origin, countryand cultural controls are not reported.
28

4.3. Robustness Checks
We test the robustness of our results by using alternative measures asan explanatory variable. In columns (1) and (3) of Table 10, we replace ourcollectivism measure by the collectivism index which includes seven ratherthan nine infectious diseases. Although Murray and Schaller (2010) claimthat this measure is less precise than the index with nine diseases, it hasthe advantage that it is available for 59 instead of 51 countries representedin our sample. The countries missing for Collectivism, but available for thePrevalence of 7 Infectious Diseases include Cuba, Haiti and the DominicanRepublic which have considerable immigration flows to the US. Thereforethe use of the Prevalence of 7 Infectious Diseases as the explanatory vari-able increases our sample size by 1,488 observations. In comparison to ourfindings, column (1) displays comparable, however less significant results forthe extensive margin. Column (3) exhibits a strong and significant effect atthe intensive margin.
Columns (2) and (4) exhibit the estimates of our preferred specifica-tion using Hofstede’s individualism index for 46 countries of origin. Theeffect of individualism is small and insignificant for both models. The (unre-ported) strong and significant effects of the country characteristics indicatethat source country effects are relevant, however Hofstede’s individualism in-dex fails to extract the effect of individualism. This implies that Hofstede’sindex might be an imprecise measure of individualism, which would be inline with the critic claiming that Hofstede’s survey captures general countryconditions rather than actual values of individualism.
We further assess if our results are driven by a particular country inour sample. Therefore, Table 11 reproduces the main specification withoutMexican (columns (1) and (4)), Puerto Rican (columns (2) and (5)) andChinese (columns (3) and (6)) observations. The Mexican second generationimmigrants are excluded because they account for 36 percent of our sampleand are therewith by far the largest country represented. The Puerto Ricansare omitted because they are national born US-citizens29 and thus do notnecessarily qualify as immigrants. We further disregard Chinese observationsbecause of China’s high level of collectivism. In the US, Asian immigrants
29Puerto Rico is an unincorporated United States territory. We included them into ourmain specification because they differ significantly from the US with respect to language,history and culture.
29

Table 10: Alternative measures specification
LFP Income
(1) (2) (3) (4)
Alternative measuresPrevalence of 7 infectious diseases 0.024∗∗ 0.129∗∗∗
(0.010) (0.034)Hofstede’s individualism index −0.001 0.001
(0.000) (0.001)
Pseudo/ Adjusted R2 0.378 0.397 0.172 0.187Observations 22,791 18,028 17,655 13,997
Notes: – Columns (1) and (2) report probit results as average marginal effects. Theresults of column (3) and (4) are obtained from OLS regressions. Heteroskedasticityrobust standard errors that cluster at the country of ancestry are shown in parentheses.* p<0.10, ** p<0.05, *** p<0.01. Intercept, year, state, ethnic origin, country andcultural controls are not reported.
are often the best performing immigrant group (see, e.g., LaLonde and Topel,1992; Chiswick, 1983; Mattoo et al., 2008). Thus, the Chinese collectivistscould drive our positive effect. Columns (1)-(3) of Table 11 show that theextensive margin results are robust to the exclusion of possible outliers andcolumns (4)-(6) suggest a stronger effect of Collectivism once the potentialoutlier countries are excluded.30 Table 11 gives us confidence that the positiveeffect of collectivism is not driven by potential outlier countries.
Our results are restricted to homogamous families since they are mostlikely to coherently transmit the cultural background of the country of an-cestry. For completeness, we re-run our baseline regression for heterogeneousfamily constellations while focusing on the collectivistic background of onlyone parent. We cannot control for the cultural background of the other immi-grant parent, e.g. it is unclear if there is a systematic bias in mating behaviorand therewith different reinforcements of cultural heritage. Table 12 displaysthe specifications with the collectivistic ancestry of only the father (columns(1) and (3)) or the mother (columns (2) and (4)). We find slightly smallerbut comparable results to our baseline regression at the extensive marginfor both parents. At the intensive margin, we only find insignificant resultswith a larger coefficient for fathers implying that fathers are more successful
30We also find large and strong significant effects of Collectivism if we exclude all Asiansfrom our sample.
30

Table 11: Specification without country sub-samples
LFP Income
(1) (2) (3) (4) (5) (6)
Collectivism 0.031∗∗∗ 0.026∗∗ 0.032∗∗∗ 0.091∗∗∗ 0.096∗∗ 0.139∗∗∗
(0.010) (0.010) (0.010) (0.031) (0.036) (0.040)
Pseudo/ Adjusted R2 0.320 0.398 0.373 0.166 0.188 0.174Observations 13,598 18,346 20,651 10,812 14,198 15,990
Notes: – Columns (1) and (4) display results without Mexicans, columns (2) and (5) withoutPuerto Ricans and column (3) and (6) without Chineses. Column (1)-(3) report probit resultsas average marginal effects. The results of column (4)-(6) are obtained from OLS regressions.Heteroskedasticity robust standard errors that cluster at the country of ancestry are shown inparentheses. * p<0.10, ** p<0.05, *** p<0.01. Intercept, year, state, ethnic origin, countryand cultural controls are not reported.
in passing their cultural values on to their sons. However, mixed culturalbackground leads to less pronounced impact of collectivism.31
This section illustrates that our results are robust to various specifica-tions. Besides the robustness checks shown here, Table A3 provides esti-mation results with additional controls for the country of ancestry such ascontrols for the prevalent religion, legal origin and geographic characteristics.We further run unreported regressions which include more indicators of eco-nomic development in the country of ancestry (e.g. secondary enrollment,GDP growth, public healthcare32 and country controls of 197033) and findsignificant effects of Collectivism at the extensive margin and confirm the
31Table A2 considers families of which one parent is born in the US and the other oneis born abroad. This has the advantage that the cultural background of both parents isclear. However, we expect the results to be weaker than in our baseline regression becausethe cultural values of both parents do not reinforce each other. Further, the native parenthas a larger network to implement his cultural background and therewith an advantagein influencing the child. In all specifications the coefficient of Collectivism is insignificant,which supports the hypothesis that a foreign born parent struggles to pass on his or hervalues if the counterpart is a native American. The results in Table A2 and Table 12highlight the sensitivity of outcomes with respect to different family constellation.
32In addition to its role as a human health proxy, public healthcare variables can also berelated to the degree of public social security. This might be of relevance since, whenever anextensive public safety net exists, collectivist networks (of informal risk sharing) partiallylose their raison d’etre. (See the discussion of Davis (2016)).
33Country controls of 1970 reflect the condition of the country of ancestry when theaverage cultural trait of the parents was formed.
31

Table 12: Specification with foreign parents
LFP Income
(1) (2) (3) (4)Father Mother Father Mother
Collectivism 0.026∗∗∗ 0.026∗∗∗ 0.029 0.022(0.010) (0.009) (0.018) (0.022)
Pseudo/ Adjusted R2 0.367 0.368 0.250 0.248Observations 24,826 24,971 18,909 19,012
Notes: – Column (1)and (2) report probit results as average marginaleffects. The results of column (3) and (4) are obtained from OLS re-gressions. Heteroskedasticity robust standard errors that cluster at thecountry of ancestry are shown in parentheses. * p<0.10, ** p<0.05,*** p<0.01. Intercept, year, state, ethnic origin, country and culturalcontrols are not reported.
direction of the effect at the intensive margin.Our regression analysis reveals that the inclusion of these variables does
not alter our results substantially. The results also do not change if weestimate the baseline regression using a tobit model, which accounts for thehigh concentration of zero incomes at the low end of the income distribution.We also run regression with interactions between Collectivism and differentdecades as well as with interactions between state and year. Overall, wefind strong econometric support that Collectivism significantly increases theprobability of participating in the labor force and indication that there is apositive effect of collectivism on income earned.34
5. Conclusion
This paper is motivated by the importance of immigration for econom-ically advanced nations as well as by the growing interest of economists inthe influence of cultural values on economic outcomes. Following the epi-demiological approach and using survey data from the US, we investigatethe impact of collectivism on the economic outcome of homogamous secondgeneration male immigrants. We use the historical disease prevalence of theirparents’ country of origin as a measure for collectivism since collectivistic val-ues (e.g., sharp distinction between in- and out-groups or consciousness of
34All regression results are available from the author upon request.
32

tradition) evolved as particularly advantageous strategies in countries witha greater prevalence of disease-causing pathogens.
We find a robust positive effect of collectivism on labor force participation.This result gives indication that respondents with a collectivistic ancestryfeel responsible for supporting their in-group and thus are more likely to alsopursue employment even if it does not fulfill them. We also obtain evidenceof a positive effect of collectivism on income earned. This effect is mainlydriven by hours worked and the occupation chosen. We show that higherscores of ancestral collectivism are associated with occupations which requirecollectivistic abilities such as dependability. Our findings are robust to theuse of alternative measures of collectivism and different data compositions.
Our study contributes to the literature by emphasizing the importance ofinherited cultural values for the labor market outcomes of second generationimmigrants. In particular, we provide unique evidence on the relationshipbetween cultural skills and occupational choice. Our findings can be inter-preted as an encouragement to policy makers to consider cultural differencesin their labor market integration policies. They further suggest that labormarket integration of second generation immigrants from culturally distantcountries to the US works particularly well. Immigrants with a collectivisticancestry seem to find employment in jobs that require a particular skill setfor which they have a cultural advantage. Therefore, more research is neededto investigate how immigrants with different cultural skills can complementUS natives on the labor market.
33

6. References
Acemoglu, D., Johnson, S., Robinson, J. A., 2005. Institutions as a funda-mental cause of long-run growth. In: Handbook of economic growth. Vol. 1.Elsevier, pp. 385–472.
Akerlof, G. A., 1980. A theory of social custom, of which unemployment maybe one consequence. Quarterly Journal of Economics 94 (4), 749–775.
Akerlof, G. A., Kranton, R. E., 2000. Economics and identity. QuarterlyJournal of Economics 115 (3), 715–753.
Alesina, A., La Ferrara, E., 2002. Who trusts others? Journal of PublicEconomics 85 (2), 207–234.
Antecol, H., 2000. An examination of cross-country differences in the gendergap in labor force participation rates. Labour Economics 7 (4), 409–426.
Bisin, A., Verdier, T., 2000. “beyond the melting pot”: cultural transmis-sion, marriage, and the evolution of ethnic and religious traits. QuarterlyJournal of Economics 115 (3), 955–988.
Blau, F. D., Kahn, L. M., Papps, K. L., 2011. Gender, source country char-acteristics, and labor market assimilation among immigrants. Review ofEconomics and Statistics 93 (1), 43–58.
Bredtmann, J., Otten, S., 2015. The role of source-and host-country char-acteristics in female immigrant labor supply. MPRA Working Paper No.44544.
Card, D., 2005. Is the new immigration really so bad? Economic Journal115 (507), 300–323.
CEPII, 2015. Cepii geodist database. [accessed 08.28.2015].URL http://www.cepii.fr/CEPII/en/bdd modele/presentation.asp?id=6
Chiswick, B. R., 1983. An analysis of the earnings and employment of asian-american men. Journal of Labor Economics 1 (2), 197–214.
Davis, L. S., 2016. Individual responsibility and economic development: Ev-idence from rainfall data. SSRN 1746884, Working Paper.
34

Elster, J., 1989. Social norms and economic theory. Journal of EconomicPerspectives 3 (4), 99–117.
Fernandez, R., 2007. Alfred marshall lecture women, work, and culture. Jour-nal of the European Economic Association 5 (2–3), 305–332.
Fernandez, R., Fogli, A., 2009. Culture: An empirical investigation of beliefs,work, and fertility. American Economic Journal: Macroeconomics 1 (1),146–177.
Fincher, C. L., Thornhill, R., Murray, D. R., Schaller, M., 2008.Pathogen prevalence predicts human cross-cultural variability in individu-alism/collectivism. Proceedings of the Royal Society of London B: Biolog-ical Sciences 275 (1640), 1279–1285.
Gorodnichenko, Y., Roland, G., 2010. Culture, institutions and the wealthof nations. NBER Working paper 16368. National Bureau of EconomicResearch.
Gorodnichenko, Y., Roland, G., 2011. Which dimensions of culture matterfor long-run growth? American Economic Review 101 (3), 492–498.
Gorodnichenko, Y., Roland, G., 2012. Understanding the individualism-collectivism cleavage and its effects: Lessons from cultural psychology.Institutions and Comparative Economic Development 150, 213–236.
Green, D. A., 1999. Immigrant occupational attainment: Assimilation andmobility over time. Journal of Labor Economics 17 (1), 49–79.
Greif, A., 1994. Cultural beliefs and the organization of society: A historicaland theoretical reflection on collectivist and individualist societies. Journalof Political Economy 102 (5), 912–950.
Guiso, L., Sapienza, P., Zingales, L., 2006. Does culture affect economicoutcomes? Journal of Economic Perspectives 20, 23–48.
Hansen, C. W., 2013. Economic growth and individualism: The role of in-formal institutions. Economics Letters 118 (2), 378–380.
Heine, S. J., 2008. Cultural psychology. WW Norton, New York.
35

Hofstede, G., Hofstede, G. J., Minkov, M., 2010. Cultures and Organizations:Software of the Mind. McGraw-Hill, New York.
Isphording, I. E., Otten, S., 2013. Linguistic barriers in the destination lan-guage acquisition of immigrants. Journal of Economic Behavior and Orga-nization 150, 30–50.
King, M., Ruggles, S., Alexander, J. T., Flood, S., Genadek, K., Schroeder,M. B., Trampe, B., Vick, R., 2010. Integrated public use microdata series,current population survey: Version 3.0. [machine-readable database].
LaLonde, R. J., Topel, R. H., 1992. The assimilation of immigrants in the uslabor market. In: Immigration and the workforce: Economic consequencesfor the United States and source areas. University of Chicago Press, pp.67–92.
Levine, R., 2005. Law, endowments, and property rights. NBER Workingpaper 11502. National Bureau of Economic Research.
Licht, A. N., Goldschmidt, C., Schwartz, S. H., 2007. Culture rules: Thefoundations of the rule of law and other norms of governance. Journal ofComparative Economics 35 (4), 659–688.
Mattoo, A., Neagu, I. C., Ozden, C., 2008. Brain waste? educated immi-grants in the us labor market. Journal of Development Economics 87 (2),255–269.
Murray, D. R., Schaller, M., 2010. Historical prevalence of infectious diseaseswithin 230 geopolitical regions: A tool for investigating origins of culture.Journal of Cross-Cultural Psychology 41 (1), 99–108.
North, D. C., 1990. Institutions, institutional change and economic perfor-mance. Cambridge University Press, Cambridge.
Nunn, N., Wantchekon, L., 2011. The slave trade and the origins of mistrustin africa. American Economic Review 101 (7), 3221–3252.
O*Net, 2015. O*net data descriptors. [accessed 08.28.2015].URL http://www.onetonline.org/find/descriptor/browse/Work Styles/
36

Ottaviano, G. I., Peri, G., 2005. Rethinking the gains from immigration:Theory and evidence from the us. NBER Working paper 11672. NationalBureau of Economic Research.
Ottaviano, G. I., Peri, G., 2006. The economic value of cultural diversity:evidence from us cities. Journal of Economic Geography 6 (1), 9–44.
Patel, K., Vella, F., 2007. Immigrant networks and their implications foroccupational choice and wages. IZA Discussion Papers, No. 3217.
Peri, G., Sparber, C., 2009. Task specialization, immigration, and wages.American Economic Journal: Applied Economics 1 (3), 135–169.URL http://www.jstor.org/stable/25760175
Pew Research Center, 2013. Second-generation americans - a portrait ofthe adult children of immigrants. Research report, Pew Research Center,Washington, D.C.
Sherman, P. W., Billing, J., 1999. Darwinian gastronomy: Why we use spicesspices taste good because they are good for us. BioScience 49 (6), 453–463.
Spolaore, E., Wacziarg, R., 2015. Ancestry, language and culture. NBERWorking paper 21242. National Bureau of Economic Research.
Suro, R., Passel, J. S., 2003. The rise of the second generation: changing pat-terns in hispanic population growth. Study, Pew Hispanic Center, Wash-ington, D.C.
Tabellini, G., 2010. Culture and institutions: economic development in theregions of europe. Journal of the European Economic Association 8 (4),677–716.
Triandis, H. C., 1995. Individualism & collectivism. Westview Press, Boulderand Colorado.
US Census Bureau, 2016. Us census bureau website. [accessed 01.28.2015].URL http://www.census.gov/
World Bank, 2015. World development indicators (wdi). [accessed08.28.2015].URL http://data.worldbank.org/
37

Appendix
Table A1: Quantile specification
Log of income
(1) (2) (3) (4) (5)0.10 0.25 0.50 0.75 0.90
Collectivism 0.073 0.036 0.069∗∗∗ 0.018 0.017(0.085) (0.032) (0.020) (0.020) (0.029)
Observations 16,522 16,522 16,522 16,522 16,522
Notes: – The results are obtained from quantile regressions. Heteroskedas-ticity robust standard errors that cluster at the country of ancestry areshown in parentheses. * p<0.10, ** p<0.05, *** p<0.01. Intercept, indi-vidual covariates, year, state, ethnic origin, country and cultural controlsare not reported.
kden
sity
Occupation Class
Collectivistic Individualistic
Figure A1: Occupational Choice
i

Table A2: Specification with one foreign parent
LFP Income
(1) (2) (3) (4)Father Mother Father Mother
Collectivism 0.011 0.009 −0.014 −0.042(0.007) (0.009) (0.025) (0.034)
Psuedo/ Adjusted R2 0.265 0.303 0.239 0.239Observations 14,647 14,334 11,804 12,023
Notes: – Column (1) and (2) report probit results as average marginal ef-fects. Heteroskedasticity robust standard errors that cluster at the countryof ancestry are shown in parentheses. * p<0.10, ** p<0.05, *** p<0.01.Intercept, individual covariates, year, state, ethnic origin, country and cul-tural controls are not reported.
ii

Table A3: Specification with further controls
LFP Income
(1) (2) (3) (4) (5) (6)
Collectivism 0.049∗∗∗ 0.032∗∗∗ 0.027∗∗ 0.064 0.068 0.031(0.008) (0.009) (0.012) (0.043) (0.042) (0.038)
Adherence sharesCatholic −0.088 −0.487
(0.074) (0.351)Protestant −0.045 −0.663
(0.086) (0.449)Other christan −0.041 −1.003∗∗
(0.095) (0.480)Orthodox −0.129∗ −0.536
(0.070) (0.339)Jewish 0.053 −0.351
(0.079) (0.373)Muslim −0.171∗∗ −0.806∗∗
(0.075) (0.329)Hindu −0.225∗∗∗ −0.216
(0.077) (0.338)Buddhist −0.115 −0.690∗
(0.081) (0.393)Other eastern religions −0.095 −1.672∗∗
(0.141) (0.796)Other religions 0.038 −0.494
(0.066) (0.306)Non-religion −0.085 −0.632∗∗
(0.071) (0.304)Legal originEnglish −0.049 0.169
(0.043) (0.169)French 0.014 0.053
(0.024) (0.120)German 0.009 0.024
(0.023) (0.095)Geographic characteristicsLatitude −0.000 −0.006∗∗
(0.001) (0.002)Longitude 0.000 −0.003∗∗∗
(0.000) (0.001)
Pseudo/ Adjusted R2 0.401 0.399 0.398 0.188 0.187 0.188Observations 18,301 14,166
Notes: – Column (1)-(3) report probit results as average marginal effects. The results of column (4)-(6) areobtained from OLS regressions. Heteroskedasticity robust standard errors that cluster at the country of ancestryare shown in parentheses. * p<0.10, ** p<0.05, *** p<0.01. Intercept, individual covariates, year, state,ethnic origin, country and cultural controls are not reported.
iii

Table A4: Collectivism Measures
Country Disease9 Disease7 IDV
Afghanistan 0.23 0.15Albania -0.25 0.03Algeria 0.47 0.63American Samoa -0.41Antigua -0.27Argentina -0.12 0.03 46Armenia 0.10 0.15Australia -0.25 -0.14 90Austria -0.77 -0.65 55Azerbaijan 0.33 0.29Azores 0.47 0.63 27Bahamas -0.51Bangladesh 0.62 0.66Barbados -0.15Belarus -0.75 -0.78Belgium -1 -0.78 75Belize 0.28Bermuda -0.63Bhutan 0.44 0.27Bolivia 0.34 0.30Bosina and Herzegovina 0.00 0.03Brazil 0.93 1.06 38Bulgaria -0.35 -0.10 30Burma (Myanmar) 0.64 0.53Cambodia 0.45 0.28Cameroon 1.17 1.20Canada -1.31 -1.18 80Cap Verde -0.26Chile -0.45 -0.22 23China 1.03 1.03 20Colombia 0.27 0.53 13Congo 0.97 0.95Costa Rica 0.12 0.18 15Croatia -0.44 -0.38 33Cuba 0.00Cyprus -0.34 -0.25Czech Rep -0.87 -0.78 58Denmark -0.98 -0.91 74Dominica -0.02Dominican Republic -0.13Ecuador 0.34 0.30 8Egypt 0.44 0.76 38El Salvador 0.3 0.42 19Eritrea 0.52 0.37Estonia -0.62 -0.78 60Ethiopia 0.71 0.77 27Fiji -0.07 -0.39Finland -0.75 -0.78 63France -0.46 -0.40 71Georgia 0.10 0.16Germany -0.87 -0.78 67Ghana 1.16 1.19 20
Continued on next page
iv

Collectivism Measures - continued
Country Disease9 Disease7 IDV
Great Britain -1.01 -0.78 89Greece 0.08 0.29 35Grenada -0.53Guam -0.17 -0.52Guatemala 0.42 0.56 6Guinea 1.06 1.06Guyana 0.64Haiti -0.01Honduras 0.16Hong Kong 0.27 0.37 25Hungary -1.00 -0.78 80Iceland -1.19 -1.18India 0.94 0.91 48Indonesia 0.63 0.51 14Iran -0.15 -0.16 41Iraq 0.54 0.40 38Ireland -0.45 -0.23 70Israel 0.52 0.53 54Italy 0.16 0.40 76Ivory Coast 1.06 1.06Jamaica 0.18 0.25 39Japan 0.43 0.25 46Jordan 0.16 0.39Kenya 0.95 0.92 27Korea South -0.11 -0.28 18Kosovo -0.23 -0.11 25Kuwait -0.34 -0.25 38Laos 0.45 0.28Latvia -0.62 -0.78 70Lebanon 0.36 0.65 38Liberia 0.73 0.80Libya 0.04 0.24 38Lithuania -0.75 -0.78 60Macedonia -0.25 0.03Malaysia 0.5 0.51 26Marshall Islands -0.25Mexico 0.28 0.56 30Micronesia -0.11Moldova -0.31 -0.37Mongolia -0.78Morocco 0.59 0.62 46Nepal 0.14 -0.12Netherlands -0.87 -0.78 80New Zealand -0.98 -0.91 79Nicaragua 0.16Nigeria 1.16 1.19 20Northern Ireland -0.87 -0.78Norway -0.85 -0.91 69Pakistan 0.02 -0.12 14Palestine 0.52 0.53Panama 0.09 0.31 11Paraguay 0.17Peru 0.23 0.16 16
Continued on next page
v

Collectivism Measures - continued
Country Disease9 Disease7 IDV
Philippines 0.5 0.51 32Poland -0.87 -0.78 60Portugal 0.47 0.63 27Puerto Rico 0.07 0.12Romania -0.18 -0.37 30Russia -0.39 -0.64 39Samoa -0.41Saudi Arabia 0.04 0.24 38Scotland -1.31 -1.18Senegal 0.72 0.78Serbia -0.23 -0.11 25Sierra Leone 0.94 0.92 20Singapore 0.31 0.26 20Slovak Rep -1 -0.78 52Somalia 0.61 0.64South Africa white 0.11 0.00 65Spain -0.05 0.13 51Sri Lanka 0.64 0.52St. Kitts -0.15St. Lucia -0.15St. Vincent -0.28Sudan 1.00 1.15Sweden -0.98 -0.91 71Switzerland -1.08 -1.05 68Syria 0.30 0.41Taiwan 0.3 0.25 17Tanzania 0.75 0.66 27Thailand 0.64 0.52 20Togo 1.16 1.19Tonga -0.67Trinidad and Tobago -0.03 -0.01 16Turkey 0.16 0.40 37U.S.A. -0.89 -0.64 91Uganda 1.05 1.05Ukraine -0.40 -0.64United Arab Emirates -0.45 -0.39 38Uruguay 0.39 0.53 36Uzbekistan -0.44 -0.37Venezuela 0.48 0.80 12Vietnam 0.61 0.64 20Yemen 0.41 0.23Yugoslavia -0.36 -0.24Zambia 0.64 0.52 27Zimbabwe 0.64 0.53
vi