lisa ng, dustin poppendieck, brian polidoro, 9/17/2020
TRANSCRIPT

This Photo by Unknown Author is licensed under CC BY-SA
Lisa Ng, Dustin Poppendieck, Brian Polidoro, W. Stuart Dols, Steven Emmerich and Andrew Persily
9/17/2020 IBPSA-USA Webinar
Version 2.0, Updated 9/18/20
Replaces previous versions

▪ Study objective
▪ FaTIMA (Fate and Transport of Indoor Microbiological Aerosols)
▪ Educational spaces simulated
▪ Simulation parameters
▪ Results
▪ Summary
▪ Next steps
2

To evaluate the relative reduction in aerosol exposure in education spaces as a result of changes to the operation of heating, cooling and ventilation (HVAC) systems and inclusion of non-HVAC controls (e.g., wearing of face coverings) using FaTIMA
3
This Photo by Unknown Author is licensed under CC BY-SA

▪ This study characterizes the relative reduction in aerosol exposure (of individuals with face coverings) due to controls studied
▪ This study provides data that can help decision makers select changes to HVAC operation that may reduce aerosol exposure
▪ This study is for a single zone with uniform aerosol concentration and for single contagious occupant
▪ This study does not define a level of exposure that is safe or healthy
▪ Controls presented should be part of a larger risk reduction strategy
4

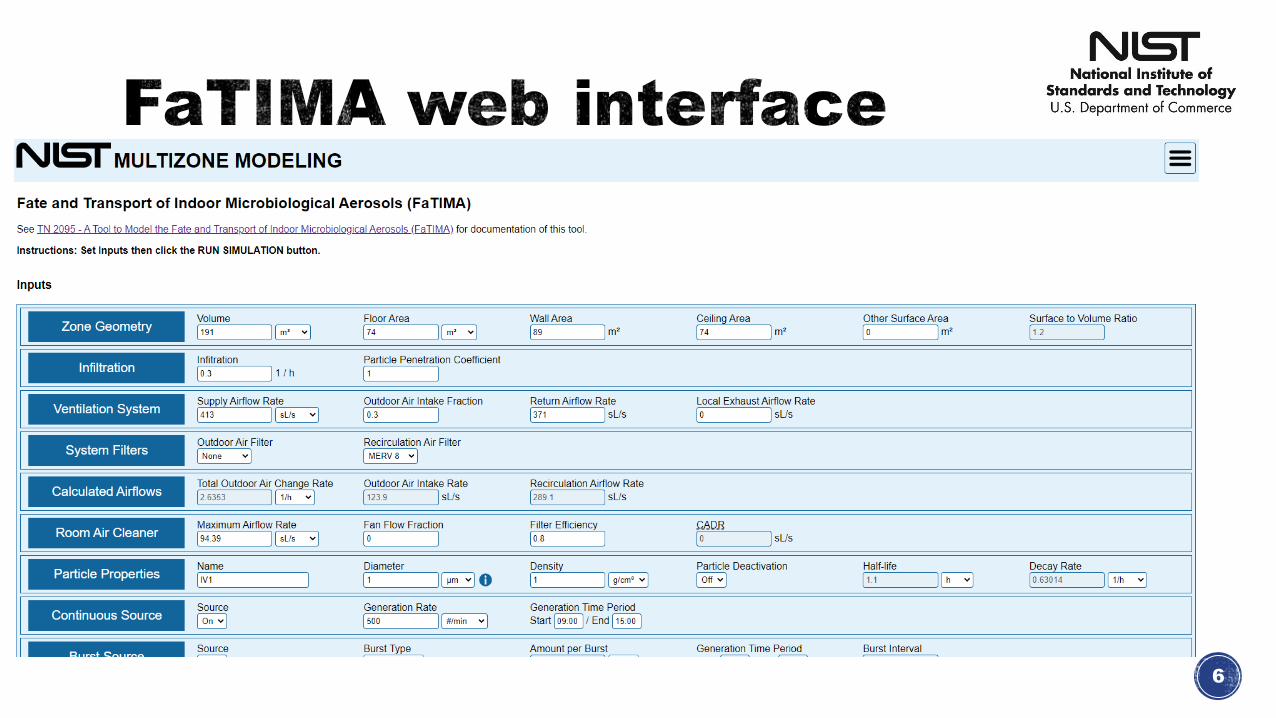
▪ FaTIMA: Fate and Transport of Indoor Microbiological Aerosols [Ref 1]
▪ https://pages.nist.gov/CONTAM-apps/webapps/FaTIMA/
▪ Free online tool for evaluating aerosol exposure
▪ Single-zone with uniform aerosol concentration
▪ 24 h simulation
Inputs
• Room dimensions
• Infiltration rate
• HVAC airflow rates
• Portable air cleaner specs• Aerosol characteristics
• Deactivation rate
• Sources
• Surface deposition rates
• Occupied time
Inputs
• Airborne aerosol concentration
• Surface loading
• Aerosols on filter
• Occupant exposure
• Numerical and graphical
Outputs
5
6

7

8
CONTAM
Project
Air handler
• User sets OA (fraction of supply)
• Exhaust rate calculated using supply,
return, and OA rates set by user
Supply for air handler
Return for air handler
C Defines burst (cough) source, constant (breathing)
source, sinks (for deposition), or deactivation
Zone characteristics (area, volume)
Controls for outputting 15-min
zone concentration, integrated zone
concentration, integrated exposure
Portable air cleaner (supply,
return, and fan with filter)
Standalone exhaust fan,
infiltration set by user

9
CSV: “inputs” portion CSV: “results” portion
Same as what’s on web
interface
Time series of airborne
exposure and surface loading

10
Downloadable results template
Paste fatima.csv file here

11

ASHRAE 62.1-2019 L/s·person L/s·m2 cfm/person cfm/ft2
Default occupancy
(#/100 m2 or
#/1000 ft2)
Classroom (ages 5-8) 5 0.6 10 0.12 25
Classroom (ages 9+) 5 0.6 10 0.12 35
Lecture hall 3.8 0.3 7.5 0.06 65
L/s·m2 cfm/ft2
Classroom (ages 5-8) 5.60 1.12
Classroom (ages 9+) 7.05 1.41
Lecture hall 7.05 1.41
12
Size Dimensions (m) Dimensions (ft) Occupancy Assumption/Source
Classroom (ages 5-8) 8.6 x 8.6 x 2.6 28 x 28 x 8.5 18 California Specification 01350 [Ref 3]
Classroom (ages 9+) 12.2 x 7.3 x 2.6 40 x 24 x 8.5 31 Portable classroom [Ref 4]
Lecture hall 18.9 x 18.9 x 5.2 62 x 62 x 17 232 Area = 4 x classroom (ages 5-8)
Height = 2 x classroom (ages 5-8)
Note:
Total OA required = per·person rate x #ppl + per·area rate x Area

[Ref 5]
MEDIAN
of meas. ASHRAE 62.1-
2004 required minimum
Space Type
(occupant ages)
Floor area, m2
(ft2)
Volume, m3
(ft3)
Full
occupancy
Total outdoor air
ventilation rate
Supply
airflow rate
L/s·p cfm/p h-1 L/s·m2 cfm/ft2 h-1
Classroom (5-8) 74 (793) 191 (6,739) 18 7.4 15.2 2.6 5.60 1.12 7.8
Portable classroom (9+) 89 (960) 231 (8,158) 31 6.7 13.7 3.3 7.05 1.41 9.8
Lecture hall 357 (3,841) 1,848 (65,270) 232 4.3 8.5 1.9 7.05 1.41 4.9
13
Notes:
• Zone Air Distribution Effectiveness Ez = 1 used to calculate outdoor air ventilation rate in ASHRAE Standard 62.1-2019• As a reference, measured rates below:

▪ Size: 1 μm
▪ Density: 1 g/cm3 (water)
▪ No virus inactivation
▪ Deposition velocities
▪ Continuous source▪ Contagious person emitting 500 particles/min
▪ All results will be normalized
14
Space Type
(occupant ages)
Air change rate (h-1)
(supply)
Deposition velocity (cm/s) [Ref 1] Total
deposition
rate (h-1) Floors Walls Ceiling
Classroom (5-8) 7.8
3.40E-03
3.38E-05 0 0.048
Portable classroom (9+) 9.8 1.13E-03 1.75E-04 0.067
Lecture hall 4.9 3.38E-06 0 0.024
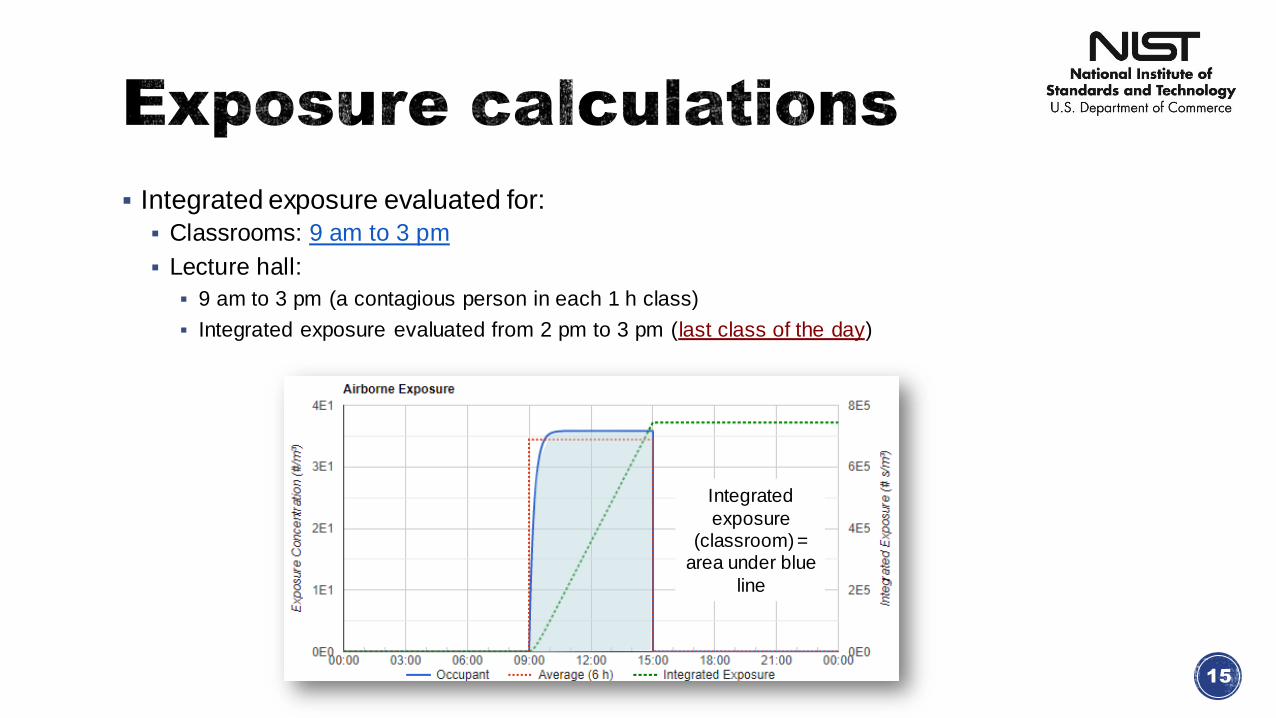
▪ Integrated exposure evaluated for:
▪ Classrooms: 9 am to 3 pm
▪ Lecture hall:
▪ 9 am to 3 pm (a contagious person in each 1 h class)
▪ Integrated exposure evaluated from 2 pm to 3 pm (last class of the day)
15
Integrated
exposure (classroom) =
area under blue
line

FACE COVERINGS
OUTDOOR AIR (OA)
PORTABLE AIR CLEANER
(PAC)
FILTER/
MERV RATING
EXHAUST FAN
16

▪ Assuming homemade cotton masks (80 threads per inch, TPI) filter efficiency:
▪ Filter efficiency at 1 μm: 30 % [Ref 6]
▪ Assume perfect fit in simulations
17
1 μm
[Ref 6]

classroom (5-8) values
18
HVAC-TU HVAC-WU
2.6 h-1
7.8 h-1 5.2 h-1
7.8 h-1 7.8 h-1
MERV 6 filterOA filter (rating N/A for this study) MERV 8 filterCooling/Heating coils
HVAC-DOAS
DOAS2.6 h-1
2.6 h-1
Conditioning
system
5.2 h-1 5.2 h-1
HVAC-CTL
2.6 h-1
7.8 h-1 7.0 h-1
1.8 h-1

▪ For each space, four HVAC systems simulated:
▪ CTL: central systems (e.g., roof top units, central multizone, variable air volume (VAV))
▪ DOAS: dedicated outdoor air system (assume separate unit handling room-level conditioning)
▪ TU: terminal units (e.g., fan coil units, unit ventilators) with no supplementary HVAC
▪ WU: window units (e.g., room air conditioners)
19
HVAC
system
Mechanical OA (h-1) Can OA be
varied?
Assumed
infiltration (h-1)
Recirculation
filtration level
Can filter be
upgraded?Class (5-8) Class (9+) Lecture hall
HVAC-CTL 2.6 3.3 1.9 Y
0.30 [Ref 7]
MERV 8 Y
HVAC-DOAS 2.6 3.3 1.9 N MERV 6 N
HVAC-TU 2.6 3.3 1.9 N MERV 6 Y
HVAC-WU 0 0 0 N None N
Notes:
1. HVAC-CTL: MERV 8 filters per ASHRAE 62.1-20192. MERV 6 filters for terminal units per manufacturer specifications

▪ Filters can be rated using MERV (minimum efficiency reporting value) rating system [Ref 8]
▪ Depends on particle/aerosol diameter
▪ Filter efficiency for 1 μm varies from 0.01 to 0.99 as MERV rating increases
▪ Most HVAC-related guidance recommends minimum MERV 13which are 90 % effective at removing 1 μm aerosols [Ref 9]
▪ Performance curves for new, perfectly installed filters
20
1 μm
MERV 13
[Ref 1]
MERV 8

▪ Portable air cleaner (PAC)
▪ CADR [Ref 10]: clean air delivery rate = airflow (cfm) x efficiency of particle removal of 3 test particles(i.e., smoke 0.09 μm -1.0 μm, dust 0.5 μm -3 μm and 5 μm -11 μm pollen) per ANSI/AHAM Standard AC-1
▪ Convert CADR to h-1
▪ PACs: typically 50 CADR to 400 CADR
▪ Simulation assumptions
▪ Filter efficiency 0.99 (HEPA filter)
▪ Operated at highest speed setting
▪ For classroom and portable classroom: units that deliver between 1 h -1 and 6 h-1
▪ For lecture hall, no single available PAC able to deliver 1 h-1 so simulated multiples of 400 CADR
21
Space Type
(occupant ages)
Area, m2
(ft2)
Equivalent air changes (h-1) achieved with CADR listed
150 250 300 350 400 2x400 3x400
Classroom (5-8) 74 (793) 1.3 2.2 2.7 3.1 3.6 7.1 10.7
Portable classroom (9+) 89 (960) 1.1 1.8 2.2 2.6 2.9 5.9 8.8
Lecture hall 357 (3,841) 0.1 0.2 0.3 0.3 0.4 0.7 1.1
h−1 =CADR× 60
area x height ft3
Note: classrooms ceiling height = 2.6 m (8.5 ft), lecture hall ceiling height = 5.2 m (17 ft).

▪ Exhaust fans simulated for TU and WU systems
▪ Simulation assumptions▪ For classroom and portable classroom: airflow from 1 h-1 to 6 h-1
▪ For lecture hall, no single available PAC able to deliver 1 h-1 so simulated multiples of 400 cfm
▪ Makeup air for exhaust fans typically from adjacent spaces (corridor, other classroom) and through building envelope
▪ Can lead to IAQ issues: cross-contamination, moisture → mold
22

Base assumption Uncertainty
Face coverings 30 % filtration efficiency 20 % less effective for fit
Infiltration 0.30 h-1 0.1 h-1 and 1.0 h-1
OA (HVAC-TU) 62.1-2019 rate 20 % less for performance issues
Filter MERV 13:
90 % filtration efficiency at 1 μm
10 % less for improper installation, age, etc.
PACs 99 % effective at max setting 33 % capacity when operated at <max setting
Exhaust fan 100 % effective 10 % less for improper installation
23

across systems24

▪ Integrated exposure normalized (NIE) to HVAC-DOAS with:
▪ One person contagious
▪ No face covering
▪ 6 h day (classrooms 5-8 and 9+) or 1 h day (last class of the day, lecture)
▪ Error bars account for simulation results using infiltration rates that are higher/lower than base
▪ HVAC-WU system has largest error bar due to having no mechanical OA as its base
▪ HVAC-WU systems have highest NIE
25Classroom (5-8) Portable classroom (9+)
WUoa=0.0 h-1
Lecture hall
DOASoa, CTLoa, TUoa = 2.6 h-1 WUoa=0.0 h-1DOASoa, CTLoa, TUoa = 3.3 h-1 WUoa=0.0 h-1DOASoa, CTLoa, TUoa = 1.9 h-1

26
▪ Increases in NIE similar in classrooms (5-8, 9+)
Classroom (5-8) Lecture hall

▪ Normalized to HVAC-DOAS (no control)
▪ Error bars account for combined uncertaintya in reduced effectiveness of face coverings fit plus 300 CADR PAC operated at 33 % capacity
▪ Higher NIE for lecture hall with HVAC-WU system because 300 CADR not as effective in larger lecture hall
27Classroom (5-8) Portable classroom (9+) Lecture hall
Avg 64 % reduction in NIE for HVAC-DOAS, CTL, and TU systems
(all spaces)
Avg 83 % reduction in NIE for HVAC-WU systems
(all spaces)
a. “Combined uncertainty” refers to propagation of error in this presentation.

by system type28

HVAC-DOAS
▪ For no controls, error bars account for lower and higher infiltration
▪ Results similar in both classrooms
▪ Face coverings or PAC (300 CADR) alone reduce NIE to 0.5 and 0.6, respectively in classrooms
▪ NIE for PAC alone in lecture hall greater than in classrooms because of larger space volume
▪ In addition, NIE for PAC alone was 0.9
29
Classroom (5-8) Lecture hall

HVAC-DOAS: classrooms
▪ Similar for both classrooms (5-8, 9+)
▪ 50 % reduction in NIE at 2 h-1
▪ Classroom (5-8): 250 CADR
▪ Classroom (9+): 300 CADR
30
Both classrooms:
150 CADR
Both classrooms:
2 x 400 CADR

HVAC-DOAS: lecture hall
▪ 50 % reduction in NIE between 1 h-1 (3x400 CADR) and1.5 h-1 (4x400 CADR)
31

HVAC-CTL classrooms▪ Results similar in both classrooms
▪ Error bars account for uncertainty in effectiveness of filter, face coverings and/or PAC
▪ Face coverings, MERV-13 and PAC (300 CADR) reduced NIE to 0.5, 0.5 and 0.6, respectively
▪ Combined face coverings with MERV-13 (or PAC) had lower NIE compared with individual controls
32

HVAC-CTL lecture hall
▪ Error bars account for uncertainty in effectiveness of filter, face coverings and/or PAC
▪ Face coverings, MERV-13 and PAC + face coverings reduced NIE to 0.5, 0.6, and 0.5 respectively
▪ Face coverings with MERV-13 (or PAC) had lower NIE compared with individual controls
▪ PAC (300 CADR) not as effective in lecture hall compared with classrooms because of larger volume
33

HVAC-CTLclassrooms
34
▪ Similar for both classrooms (5-8, 9+)
▪ 70 % reduction in NIE at MERV 13▪ Equivalent controls: 90 % OA or 3 h-1 PACs
▪ OA and MERV lines crossover at 70 % OA and MERV 12
▪ PAC may be more effective than other controls (OA, filtration) as capacity increases beyond 1 h-1
▪ Assumes good fit of face coverings and PAC operated at max setting
3 h-1:
Class (5-8):
350 CADR
Class (9+):
2x400 CADR
MERV 13

HVAC-CTLlecture hall
35
▪ 68 % reduction in NIE at MERV-13
▪ Equivalent controls: 90 % OA or 5x400 CADR (1.8 h-1)
▪Each additional 400 CADR unit (~0.3 h-1) resulted in similar NIE as each 10 % increase in OA (~0.5 h-1)
MERV 13, or
90 % OA, or
5x400 CADR
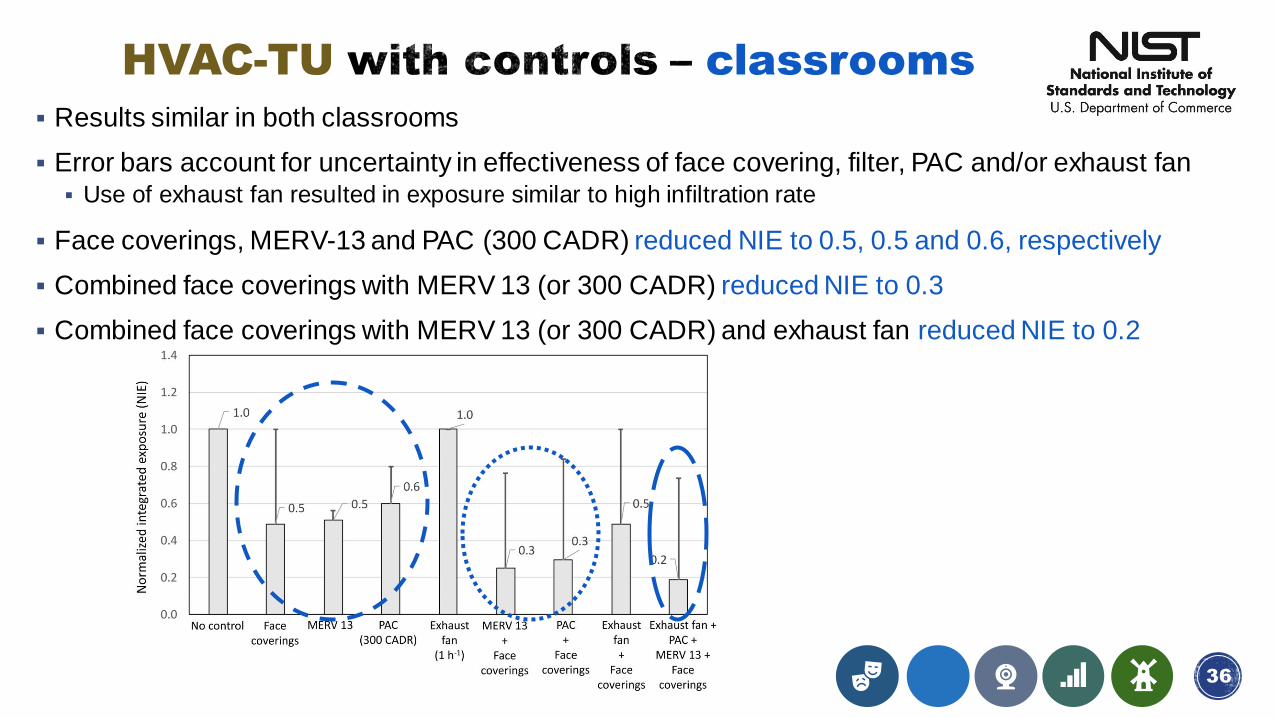
HVAC-TU classrooms
▪ Results similar in both classrooms
▪ Error bars account for uncertainty in effectiveness of face covering, filter, PAC and/or exhaust fan ▪ Use of exhaust fan resulted in exposure similar to high infiltration rate
▪ Face coverings, MERV-13 and PAC (300 CADR) reduced NIE to 0.5, 0.5 and 0.6, respectively
▪ Combined face coverings with MERV 13 (or 300 CADR) reduced NIE to 0.3
▪ Combined face coverings with MERV 13 (or 300 CADR) and exhaust fan reduced NIE to 0.2
36

HVAC-TU lecture hall ▪ Error bars account for uncertainty in effectiveness of face coverings, filter, PAC and/or exhaust fan
▪ Use of exhaust fan resulted in exposure similar to natural ventilation approaches
▪ Face coverings, MERV 13 and PAC (300 CADR) reduced NIE to 0.5 and 0.6, respectively
▪ Combined face coverings with MERV 13 had lower NIE compared with individual controls
▪ Combined face coverings with MERV 13 and exhaust fan had same NIE (0.3) because exhaust fan (1 h-1) not large enough to overcome HVAC pressurization
37
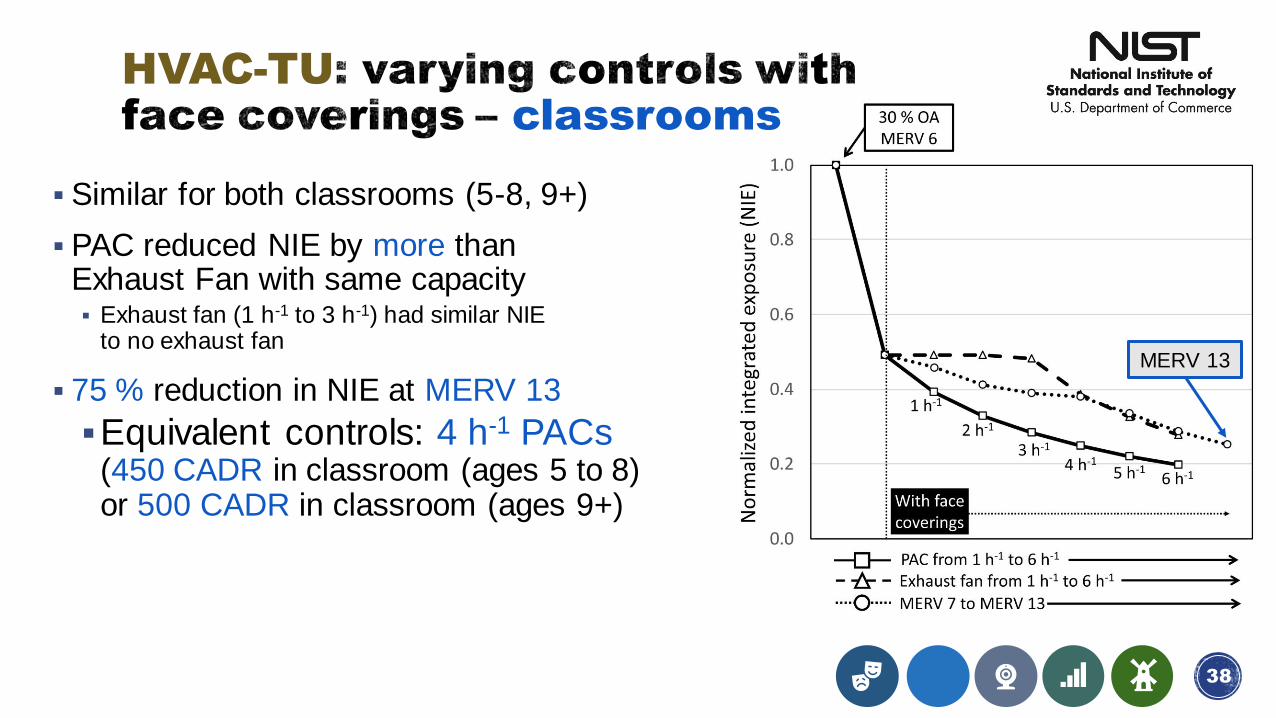
HVAC-TUclassrooms
38
▪ Similar for both classrooms (5-8, 9+)
▪ PAC reduced NIE by more than Exhaust Fan with same capacity▪ Exhaust fan (1 h-1 to 3 h-1) had similar NIE
to no exhaust fan
▪ 75 % reduction in NIE at MERV 13
▪Equivalent controls: 4 h-1 PACs(450 CADR in classroom (ages 5 to 8) or 500 CADR in classroom (ages 9+)
MERV 13

HVAC-TUlecture hall
39
▪ Exhaust fan with face coverings did not reduce NIE compared withface coverings alone
▪ 73 % reduction in NIE at MERV 13
▪ Equivalent controls: 6x400 CADR (2.2 h-1)
MERV 13
40
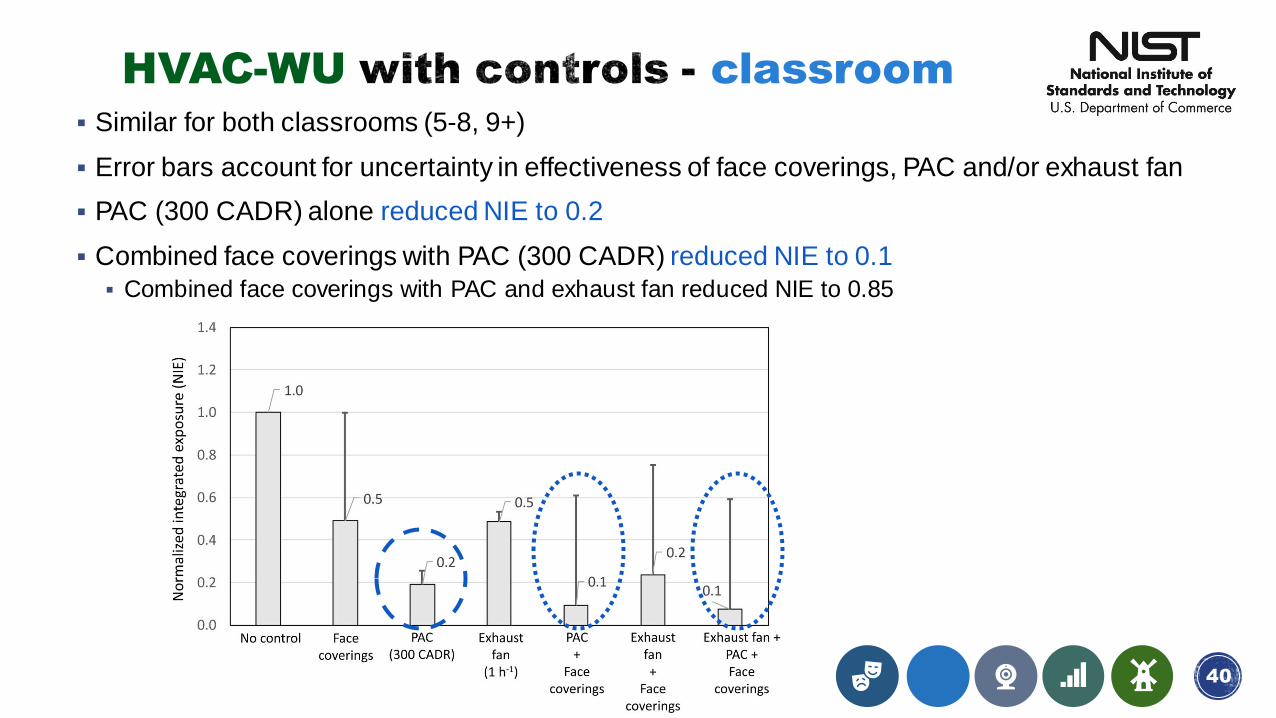
HVAC-WU classroom▪ Similar for both classrooms (5-8, 9+)
▪ Error bars account for uncertainty in effectiveness of face coverings, PAC and/or exhaust fan
▪ PAC (300 CADR) alone reduced NIE to 0.2
▪ Combined face coverings with PAC (300 CADR) reduced NIE to 0.1
▪ Combined face coverings with PAC and exhaust fan reduced NIE to 0.85
41
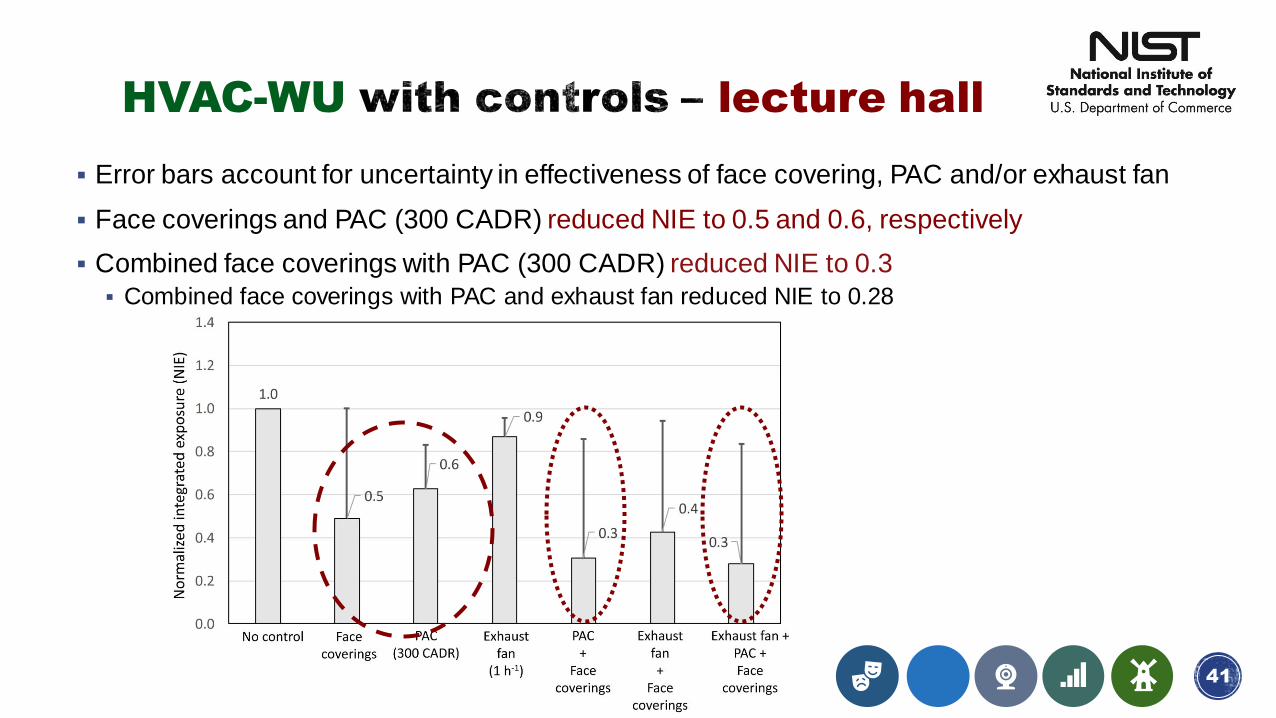
HVAC-WU lecture hall
▪ Error bars account for uncertainty in effectiveness of face covering, PAC and/or exhaust fan
▪ Face coverings and PAC (300 CADR) reduced NIE to 0.5 and 0.6, respectively
▪ Combined face coverings with PAC (300 CADR) reduced NIE to 0.3
▪ Combined face coverings with PAC and exhaust fan reduced NIE to 0.28

HVAC-WUclassrooms
42
▪ Similar for both classrooms (5-8, 9+)
▪ PAC and exhaust fan reduced NIE by similar amounts over range of capacities
▪ 81 % reduction in NIE at 150 CADR
▪ 90 % reduction with 300 CADR
▪ Note: HVAC-WU system (no controls) started with 9x exposure of HVAC-DOAS (avg both classrooms)
150 CADR

HVAC-WUlecture hall
43
▪ PAC reduced NIE slightly more than exhaust fan ▪ Exhaust fan (0.4 h-1) with face coverings
did not significantly reduce NIE compared with face coverings alone
▪ 50 % reduction in NIE with face coverings alone
▪ Note: HVAC-WU system (no controls) started with 8x exposure of HVAC-DOAS system
Exhaust (0.4 h-1)

44

Integrated exposure with no controls
▪ HVAC-WU system starts out with highest exposure
▪ Values are not a direct metric of infection risk
45
System – base
operationOA (h-1) Infiltration (h-1)
Integrated exposure
(#•s/m3) w/ no controls
HVAC-DOAS 2.6
0.30
855,000
HVAC-CTL 2.6 717,000
HVAC-TU 2.6 855,000
HVAC-WU 0.0 5,519,000
Classroom (5-8)
Portable classroom (9+)
Lecture hall
System – base
operationOA (h-1) Infiltration (h-1)
Integrated exposure
(#•s/m3) w/ no controls
HVAC-DOAS 3.3
0.30
574,000
HVAC-CTL 3.3 486,000
HVAC-TU 3.3 574,000
HVAC-WU 0.0 4,571,000
System – base
operationOA (h-1) Infiltration (h-1)
Integrated exposure
(#•s/m3) w/ no controls
HVAC-DOAS 1.9
0.30
21,000
HVAC-CTL 1.9 18,000
HVAC-TU 1.9 21,000
HVAC-WU 0.0 151,000

46

classrooms▪ All results with face coverings
▪ To achieve NIE = 1 (same IE as HVAC-CTL):▪ HVAC-DOAS: PAC (150 CADR)
▪ HVAC-TU:
▪ PAC (150 CADR) or
▪ Exhaust fan (4 h-1) or
▪ MERV 8 filter
▪ HVAC-WU:
▪ Classroom (5-8):
▪ PAC (2x400 CADR) or
▪ Exhaust fan (5 h-1)
▪ Classroom (9+):
▪ PAC (3x400 CADR) or
▪ Exhaust fan (6 h-1)
47
Classroom
(5-8)
Portable
classroom
(9+)

lecture hall
▪ All results with face coverings
▪ To achieve NIE = 1 (same IE as HVAC-CTL):▪ HVAC-DOAS: PAC (1x400 CADR)
▪ HVAC-TU:
▪ PAC (1x400 CADR) or
▪ MERV 8 filter
▪ HVAC-WU:
▪ Not achievable with 6xPACs or exhaust fans
48

49

classrooms
50
▪ Dark cells indicate controls with lowest NIE
▪ Assumes controls are performing “perfectly”
▪ These values are not a direct metric of infection risk
Average NIE across classrooms
(5-8, 9+)No face coverings With face coverings
SystemNo
controls
Face
coverings alone
PAC
(300CADR)
MERV 13
Exhaust
fan(1 h-1)
PAC
(300CADR)
MERV 13
Exhaust
fan(1 h-1)
All
combined
HVAC-Central 1.0 0.5 0.7 0.6 N/A 0.3 0.3 N/A 0.2
HVAC-DOAS 1.0 0.5 0.6 N/A N/A 0.3 N/A N/A N/A
HVAC-Terminal Unit 1.0 0.5 0.6 0.5 1.0 0.3 0.2 0.5 0.2
HVAC-Window Unit 1.0 0.5 0.2 N/A 0.5 0.1 N/A 0.2 0.1

51
▪ Dark cells indicate controls with lowest NIE
▪ Assumes controls are performing “perfectly”
▪ These values are not a direct metric of infection risk
lecture hall
Average NIE lecture hall No face coverings With face coverings
SystemNo
controls
Face
coverings alone
PAC
(300CADR)
MERV 13
Exhaust
fan(1 h-1)
PAC
(300CADR)
MERV 13
Exhaust
fan(1 h-1)
All
combined
HVAC-Central 1.0 0.5 0.9 0.6 N/A 0.5 0.3 N/A 0.3
HVAC-DOAS 1.0 0.5 0.9 N/A N/A 0.4 N/A N/A N/A
HVAC-Terminal Unit 1.0 0.5 0.9 0.6 1.0 0.4 0.3 0.5 0.3
HVAC-Window Unit 1.0 0.5 0.6 N/A 0.9 0.3 N/A 0.4 0.3

▪ Effect of controls varies depending on HVAC system type
▪ Effect of controls depends on how they are implemented▪ Fit of face coverings
▪ Portable air cleaner setting
▪ Filter fit, sealing or condition
▪ While the exposure presented here are not a direct metric of infection risk, FaTIMA can be used to identify and compare possible control strategies to reduce exposure
52

▪ Sensitivity analyses
▪ Combination of controls
▪ Additional controls: UVGI
▪ Additional space types (educational and other)
▪ Additional HVAC systems
▪ Impacts of poor ventilation system performance
▪ More detailed analyses using CONTAM
▪ Multizone
▪ Infiltration rates by climate
▪ Building envelope airtightness
▪ Varying OA and PAC schedules
53
1. Dols, W. S., B. J. Polidoro, D. Poppendieck and S. J. Emmerich (2020). "A Tool to Model the Fate and Transport of Indoor Microbiological Aerosols (FaTIMA)." TN2095.
2. ASHRAE (2019). ANSI/ASHRAE Standard 62.1-2019: Ventilation for Acceptable Indoor Air Quality. Atlanta, ASHRAE.
3. CDPH (2017). Standard method for the testing and evaluation of volatile organic chemical emissions from indoor sources using environmental chambers, version 1.2. Sacramento, CA, California Department of Public Health. California Specification 01350.
4. Thomas-Rees, S., D. Parker and J. Sherwin (2009). "Lessons Learned in Portable Classrooms." ASHRAE Journal 51: 30-41.
5. Haverinen-Shaughnessy, U., D. J. Moschandreas and R. J. Shaughnessy (2011). "Association between substandard classroom ventilation rates and students' academic achievement." Indoor Air 21(2): 121-31.
6. Konda, A., A. Prakash, G. A. Moss, M. Schmoldt, G. D. Grant and S. Guha (2020). "Aerosol Filtration Efficiency of Common Fabrics Used in Respiratory Cloth Masks." ACS Nano 14(5): 6339-6347.
7. Ng, L. C., A. K. Persily and S. J. Emmerich (2015). "Improving infiltration modeling in commercial building energy models." Energy and Buildings 88(0): 316-323.
8. ASHRAE (2017). Standard 52.2-2017: Method of Testing General Ventilation Air-Cleaning Devices for Removal Efficiency by Particle Size. Atlanta, ASHRAE.
9. Ng, L. (2020). “ Summary of Current HVAC Recommendations for Re-Opening Buildings” presented at the Committee on Indoor Air Quality Meeting (CIAQ), June 25, 2020
10. AHAM (2019). ANSI/AHAM AC-1: Method for Measuring the Performance of Portable Household Electric Room Air Cleaners. Washington, DC, Association of Home Appliance Manufacturers. 54

▪ Harvard-UC Boulder Portable Air Cleaner Calculator for Schools v1 (Joseph Allen and Shelly Miller) https://docs.google.com/spreadsheets/d/1NEhk1IEdbEi_b3wa6gI_zNs8uBJjlSS-86d4b7bW098/edit#gid=1882881703
▪ COVID-19 Aerosol Transmission Estimator (Jose-Luis Jimenez) https://docs.google.com/spreadsheets/d/16K1OQkLD4BjgBdO8ePj6ytf-RpPMlJ6aXFg3PrIQBbQ/edit#gid=519189277
▪ App based on estimator: https://covid-infection-risk.netlify.app
▪ The SAFEAIRSPACES COVID-19 Aerosol Relative Risk Estimator https://safeairspaces.com/(Rich Corsi, Kevin Van Den Wymelenberg, Hooman Parhizkar)
55