lisa b. beever greater everglades ecosystem restoration ... · their local leadership to ... change...
TRANSCRIPT

Lisa B. BeeverGreater Everglades Ecosystem Restoration Conference
July 15, 2010

Climate Ready Estuaries –Partnership with 15 NEPs and EPA
Barnegat Bay NEP
www.epa.gov/cre

Comprehensive Conservation and Management Plan
SG-Q: Build capacity for communities and their local leadership to mitigate and adapt to the effects of climate change through joint efforts.

Projects in support of SG-Q• Regional Vulnerability Assessment (2007-2009)• Punta Gorda Adaptation Plan (CRE 2008-2009)• Vulnerability Assessment Lite (2009-2010)• CC Environmental Indicators (CRE 2009-2010)• Model Ordinances/Comp Plan (CRE 2009-2010)• Punta Gorda Comp Plan amend (2009-2010)• Salt Marsh Adaptation (2009-2012)• Seagrass response to SLR (2009)• Lee County Resiliency Plan (2009-2010)• Conceptual Ecological Models (CRE 2010-2011)• Bonita Springs Adaptation Plan (Battelle pilot)

Existing Env. Indicators
• EPA Required• 54 named• 12 priority• Currently filling
gaps for 12.• No SG indicators.

Pollutant Loads

General Process
• Inventory potential indicators (vulnerabilities)• Survey scientists and interested people• Select top indicators for further study• Identify monitoring data sources, etc.• Survey scientists and interested people• Select top indicators• Prepare one-page sheets to amend report• Adopt through committee


172 Individual Candidate Indicators
20Respondents

Respondents
• 13 Scientists (USGS, FDEP, FWC, WMD, Co, Mote, etc)
• 4 Citizens (Engineer, WMD outreach, Coast Guard, etc)
• 1 Resource Manager (CHEC)
• 1 City Councilman (Punta Gorda)
• 6 Pretest

Top Contenders• Timing of seasonal activities (migration, hatching, production) • Loss of Conservation Acreage due to sea level rise • Ecologic changes at the coastline• Habitat loss/degradation/migration (changes) of coastal strand• Habitat loss/degradation/migration (changes) of mangroves• Habitat loss/degradation/migration (changes) of mud flats/sand bars• Habitat loss/degradation/migration (changes) of salt marshes• Habitat loss/degradation/migration (changes) of seagrass• Habitat loss/degradation/migration (changes) of wetlands from
retreating shorelines/conversion to open water• Coastal erosion rates• Drought intensity• Flooding at coastlines• Changes to precipitation trend/patterns, including extreme precipitation • Relative sea-level rise• Water temperature
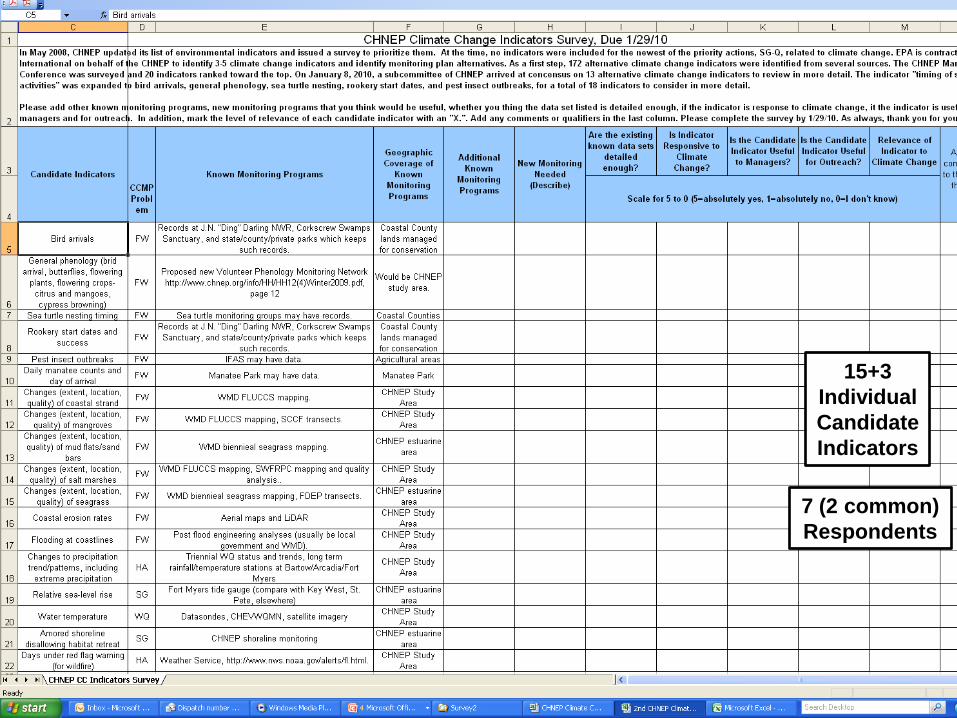
15+3 Individual Candidate Indicators
7 (2 common)Respondents

Draft Climate Change Indicators
• Changes to precipitation trend/patterns, including extreme precipitation
• Sea-level rise• Water temperature• Phenology • Coastal erosion rates • (Habitat migration)
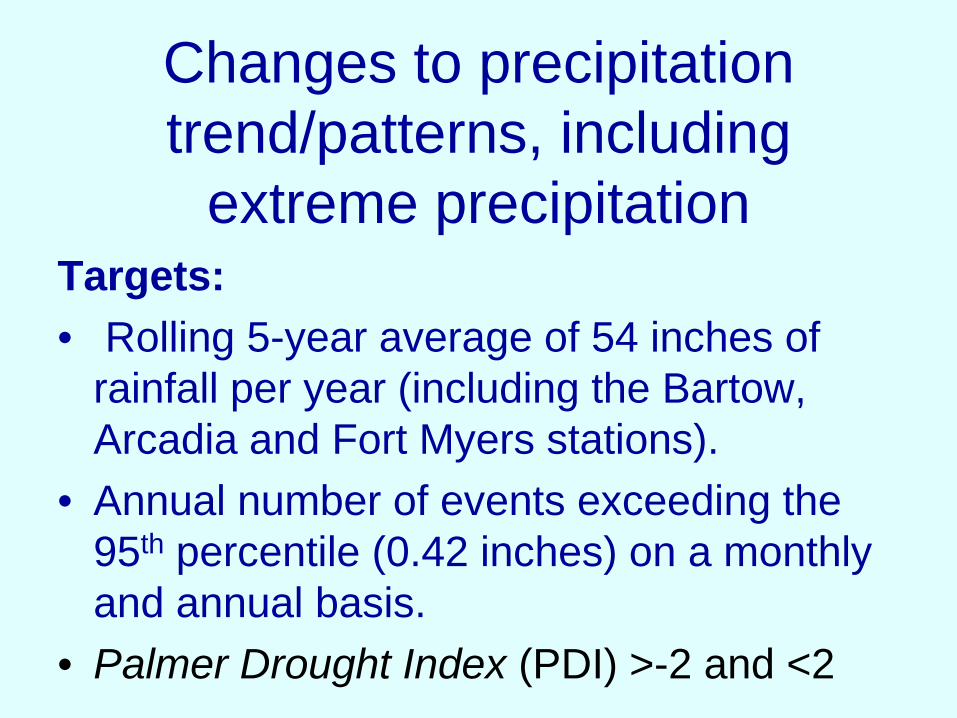
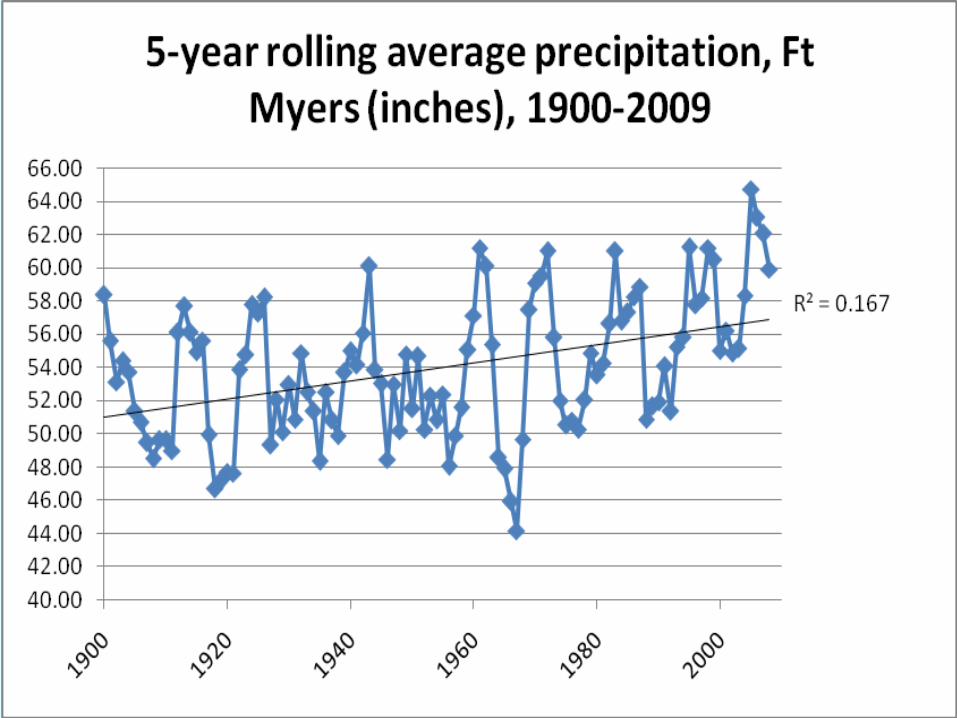
Changes to precipitation trend/patterns, including
extreme precipitationTargets: • Rolling 5-year average of 54 inches of
rainfall per year (including the Bartow, Arcadia and Fort Myers stations).
• Annual number of events exceeding the 95th percentile (0.42 inches) on a monthly and annual basis.
• Palmer Drought Index (PDI) >-2 and <2

1997
1958

Relative Sea Level Rise
Targets: • Limit relative sea-level rise to 1 inch per
decade (plus or minus ½ inch).

Water Temperature
Targets: • Gaps for targets.• Sources of data include :
– National Data Buoy Center Station VENF1 –Venice sea temperatures between 53 and 91o F.
– Volunteer data beginning 1998.

Time of day can give misleading results.

Phenology• Citrus phenology longest period of record.• Citrus flowers about a week after live oak.• Regression analysis suggests that floral
organ differentiation (requiring >650 accumulated hours below 19o C) has shifted later by one day for every 3 years.
• Valiente, J. I., and L.G. Albrigo. 2002. Modeling flowering date of sweet orange trees in central Florida based on historical weather. Proc. Intl. Soc. Citriculture, pages 296-299.

Citrus Phenology-Lake Alfred
50
60
70
80
90
100
110
1959
1960
1961
1962
1963
1964
1965
1966
1967
1968
1969
1970
1971
1972
1973
1974
1975
1976
1977
1978
1979
1980
1981
1982
1983
1984
1985
1986
1987
1988
1989
1990
1991
1992
1993
1994
1995
1996
1997
1998
1999
2000
2001
2002
2003
2004
2005
2006
2007
2008
2009
2010
Day
s fr
om O
ctob
er 1
First Differentation

Bartow Temperatures
55
60
65
70
75
80
85
90
1897
1899
1901
1903
1905
1907
1909
1911
1913
1915
1917
1919
1921
1923
1925
1927
1929
1931
1933
1935
1937
1939
1941
1943
1945
1947
1949
1951
1953
1955
1957
1959
1961
1963
1965
1967
1969
1971
1973
1975
1977
1979
1981
1983
1985
1987
1989
1991
1993
1995
1997
1999
2001
2003
2005
2007
Avg of Min Temps Avg of Max Temps

Avg Min Temp Citrus POR
57
58
59
60
61
62
63
64
65
66
1959
1960
1961
1962
1963
1964
1965
1966
1967
1968
1969
1970
1971
1972
1973
1974
1975
1976
1977
1978
1979
1980
1981
1982
1983
1984
1985
1986
1987
1988
1989
1990
1991
1992
1993
1994
1995
1996
1997
1998
1999
2000
2001
2002
2003
2004
2005
2006
2007
2008
Average of Min Temps


Range Expansions?
Longnose Killifish (Fundulus similis)Audubon Guide to Fishes 2002Northern extent, Marco IslandFound at Sanibel Causeway 2010
Florida White, male (Appias drusilla)Butterflies thru binocs, Glassberg et al 2000Northern extent, Monroe CountyFound at Estero Bay 2010

Coastal Erosion Rates
Targets: • The average historical rate of erosion in
west Florida is -0.8 ± 0.9 m/yr.
Confounded by beach renourishment and other anthropogenic activities.

(Habitat Migration)
Targets: • Not selected through survey but salt
marsh analysis may reveal useful indicator.


1953

2009

Landward Migration of seagrass in Charlotte Harbor East/West

Long Island Sound
• Initiating first survey to reduce number of indicators from ~32.

• HABs• DO• Groundwater Salinity• Pathogens/Human• Pathogens/Shellfish• Hydrogen Ions in sea• TSS• Invasive Species• Benthic Index• Phytoplankton• Zooplankton • Benthic Algae• Lobster
• Crustaceans/Shell• Shellfish (3 types)• Finfish• Marine Mammals/Turtles• Tidal Flat Inundation/Diver’y• Salt Marsh Diversity• Brackish/FW marsh sp shift• Coastal Veg changes• Cliff/Bluff Erosion• Bird species declines• Insect abundance• Light/eelgrass• SAV Species

Director: Lisa B. Beever, PhD, AICPDeputy Director: Liz Donley , esq.
Communications Manager: Maran HilgendorfProgram Scientist: Judy Ott, MS
1926 Victoria Ave, Fort Myers FL 33901-3414239/338-2556, Toll free 866/835-5785
Fax 239/338-2560, [email protected] www.CHNEP.org