liquified natural gas (lng) - pacra · lng - lifecycle liquefied natural gas ... india 14 5....
TRANSCRIPT

LIQUIFIED NATURAL GAS (LNG)
March 2016
Sector Overview

LNG Industry
Global Industry
Life Cycle
Industry Dynamics
Trade | Regional Mix
Exporting & Importing Countries
Pricing
Local Industry
Dynamics | Production & Consumption
Government Initiatives
Upcoming Developments
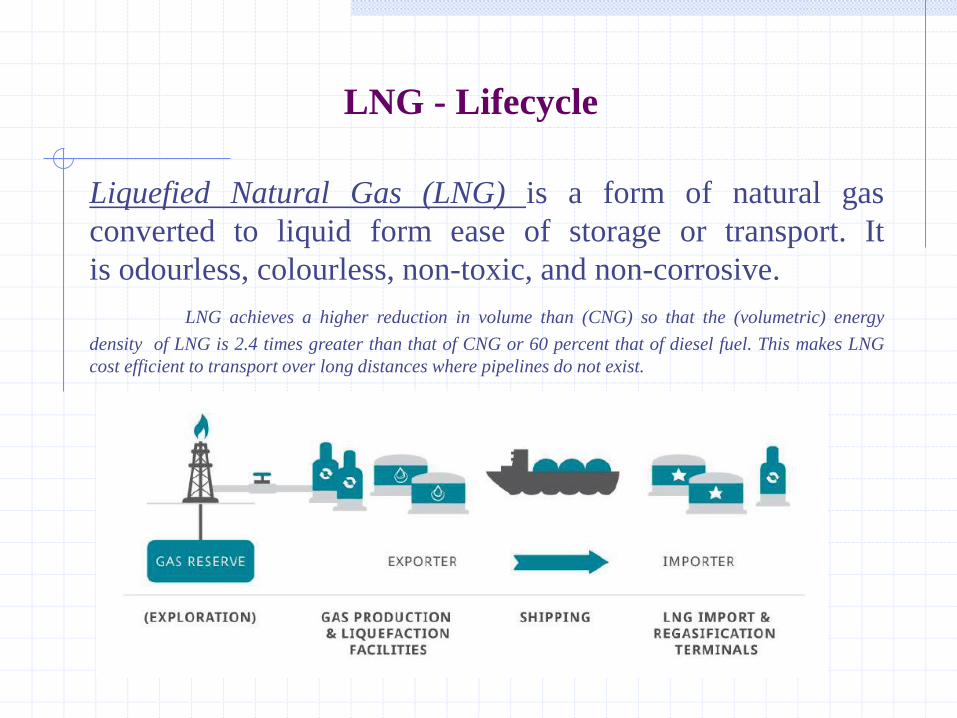
LNG - Lifecycle
Liquefied Natural Gas (LNG) is a form of natural gas
converted to liquid form ease of storage or transport. It
is odourless, colourless, non-toxic, and non-corrosive.
LNG achieves a higher reduction in volume than (CNG) so that the (volumetric) energy
density of LNG is 2.4 times greater than that of CNG or 60 percent that of diesel fuel. This makes LNG
cost efficient to transport over long distances where pipelines do not exist.
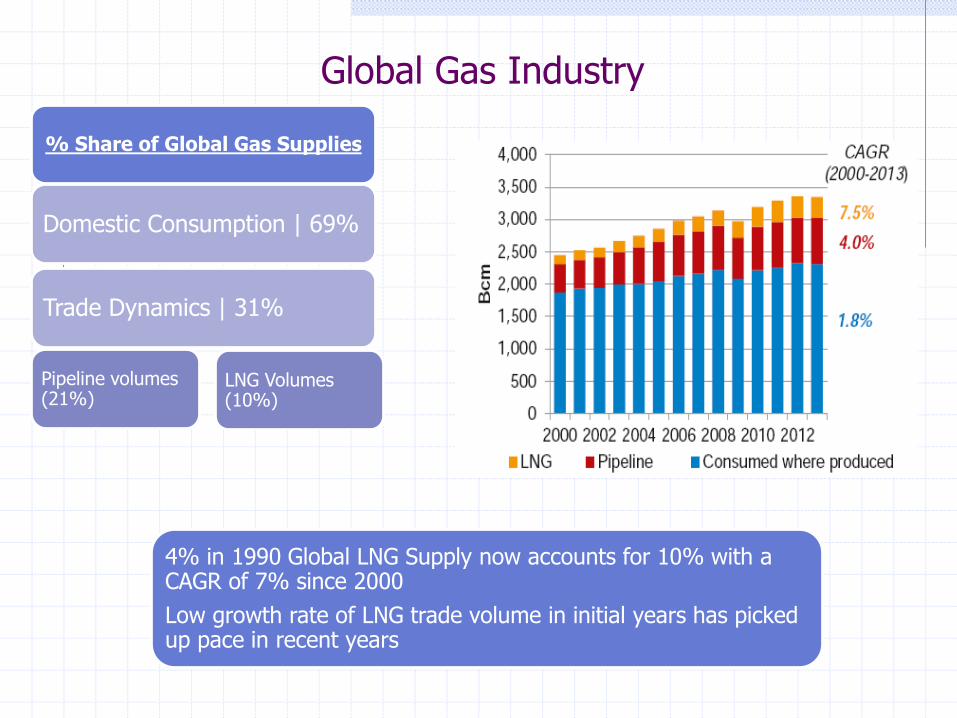
Global Gas Industry
% Share of Global Gas Supplies
Domestic Consumption | 69%
Trade Dynamics | 31%
Pipeline volumes (21%)
LNG Volumes (10%)
4% in 1990 Global LNG Supply now accounts for 10% with a CAGR of 7% since 2000
Low growth rate of LNG trade volume in initial years has picked up pace in recent years

Global Trade | Regional Mix
Global Trade With a growth of 4.3MT reached 241.1MT in 2014
Highest level of trade was 241.5MT in 2011
Middle Eastern region remained the largest exporter with 41% share
Asia Pacific region remained the largest importer with 61% share
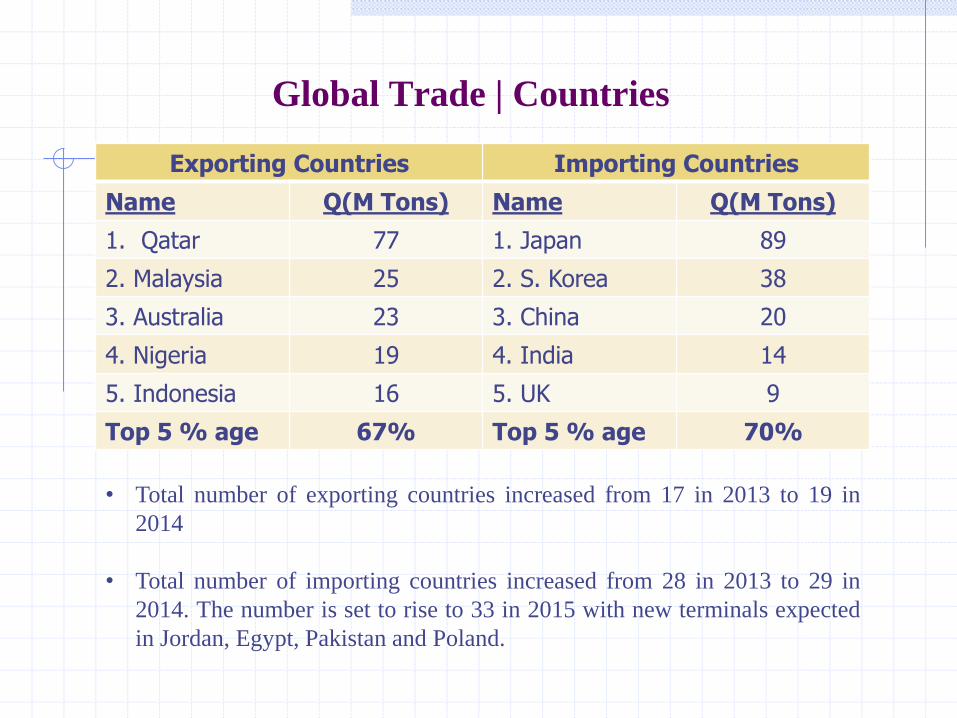
Global Trade | Countries
Exporting Countries Importing Countries
Name Q(M Tons) Name Q(M Tons)
1. Qatar 77 1. Japan 89
2. Malaysia 25 2. S. Korea 38
3. Australia 23 3. China 20
4. Nigeria 19 4. India 14
5. Indonesia 16 5. UK 9
Top 5 % age 67% Top 5 % age 70%
• Total number of exporting countries increased from 17 in 2013 to 19 in
2014
• Total number of importing countries increased from 28 in 2013 to 29 in
2014. The number is set to rise to 33 in 2015 with new terminals expected
in Jordan, Egypt, Pakistan and Poland.

Global Pricing Mechanism
Pricing in world gas markets driven more by local and regional factors.
Following are the details pertaining to pricing contracts and pricing
mechanism more widely available in the International Market.
Pricing Contracts:
• Long-term contracts
• Medium-term
• Spot & Short-term contracts
Pricing Mechanism:
1. Hub Based : Prices are largely set at liquid trading hubs, the largest and most
important of which is Henry Hub in Louisiana.
2. Oil-Linked: Without established and liquid gas trading markets, the price of
LNG is for the most part of Asia and emerging markets is set via oil-linkages.

Global Pricing Dynamics
The technological advancements during the
last decade in US Shale gas boom led to a 50%
increase in reserves and 34% increase in
production of natural gas.
The increased production reduced the prices of
natural gas in US in comparison to Europe and
Asia, creating a commercial logic to export
from US. This led to increase in the projected
export facilities from US.
The low natural gas prices in US as compared
to Europe and Asia since 2009 increased the
appetite for short-term supply contracts and
sport trade of LNG. These contracts offer
buyers the flexibility to arbitrage prices
between alternate LNG markets.
The decline in oil prices changed the economics
of LNG export from US completely. The
average annual prices of natural gas have
moved from $16/mmbtu in June2013 to
~$7/mmbtu currently at major world terminals.
Due to a large share of long-term contracts and
oil linked pricing, US LNG exports could not
compete with Russian Pipeline supplies and
Qatar’s LNG exports.
European market: The Europe would not have
a direct advantage of US LNG exports but
would reap indirect benefits due to increased
total supply.
Asian market: The higher shipping cost due to
longer distances would make the export
commercially unviable in most regions at
current oil prices.
US Entry as an Exporter Declining Oil Prices

Domestic Industry | Production & Consumption
Total Demand - 6000mmcfd
Total Production - 4000mmcfdShortfall – 2000mmcfd
Domestic Consumption Sector Wise
Sector % share in Consumption
Power 40%
Commercial &
Household
25%
Fertilizer 19%
General Industry 10%
Transport 6%
Total 100%
Domestic Production Data
Company Name % share in Production
OGDCL 29%
PPL 16%
MPCL 14%
Eni Pakistan 12%
OMV Pakistan 8%
Top 5 % Share 78%
Others 22%
Total 100%
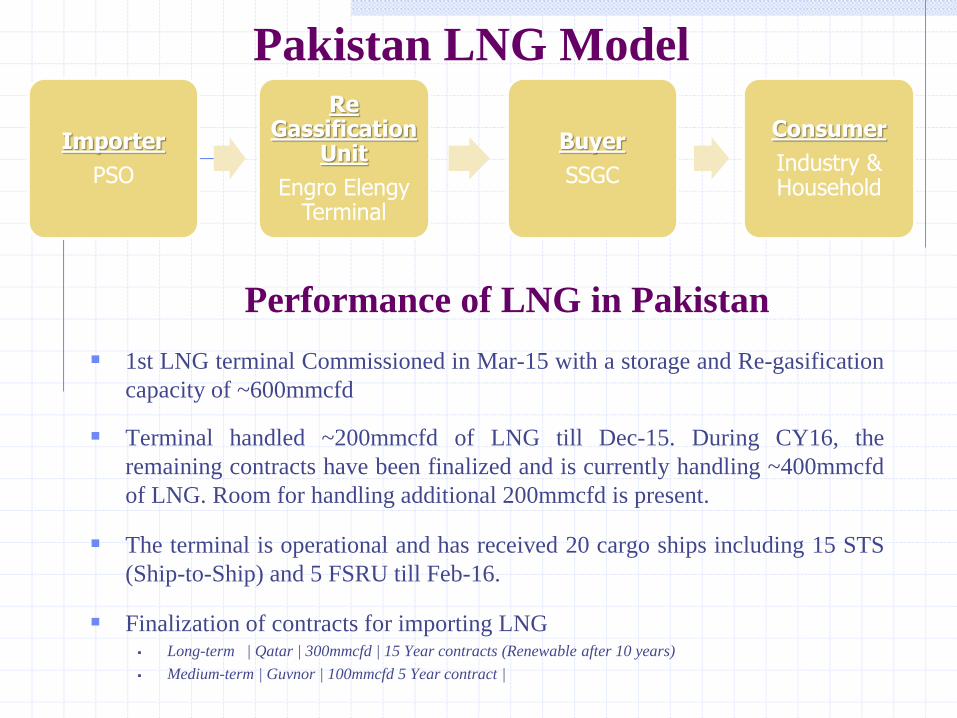
Pakistan LNG Model
Importer
PSO
Re Gassification
Unit
Engro ElengyTerminal
Buyer
SSGC
Consumer
Industry & Household
1st LNG terminal Commissioned in Mar-15 with a storage and Re-gasification
capacity of ~600mmcfd
Terminal handled ~200mmcfd of LNG till Dec-15. During CY16, the
remaining contracts have been finalized and is currently handling ~400mmcfd
of LNG. Room for handling additional 200mmcfd is present.
The terminal is operational and has received 20 cargo ships including 15 STS
(Ship-to-Ship) and 5 FSRU till Feb-16.
Finalization of contracts for importing LNG Long-term | Qatar | 300mmcfd | 15 Year contracts (Renewable after 10 years)
Medium-term | Guvnor | 100mmcfd 5 Year contract |
Performance of LNG in Pakistan

Upcoming Developments
Gwadar-Nawabshah LNG Terminal and Pipeline Project:• Installation of offshore / FSRU based LNG Terminal and associated Utilities & Off-Sites at
Gwadar Port. (500MMCFD) through Government Holding Private Limited (GHPL).
• Construction of 42 inch diameter 700 Km (Approx.) Pipeline System from Gwadar to
Nawabshah.
North-South Gas Pipeline Project:
• The government is planning to increase the size of power plant in Punjab. The Pipeline will
enable to efficiently transport imported RLNG. Length of the pipeline is 1,100 km with a
estimated total cost of US$ 2.6bn.
Turkmenistan-Afghanistan-Iran-India Pipeline Project:
• A gas pipeline project from Turkemanistan to India Via Afghanistan, Iran & Pakistan.
Turkemanistan will provide ~3.2 bfcd of gas (Pakistan Share: 1.3 Bfcd). Estimated Capital
Cost of the project is US$ 7.6bn.

Challenges for LNG in Pakistan
The end consumer for the use of LNG has not yet been finalized.
Pricing mechanism for commercial and households use of LNG is yet
not clear.
The emergence of circular debt may hamper the continuity of smooth
operations.

Bibliography
1. World LNG Reports 2015 | www.igu.org/publications
2. BP Statistical Review of World Energy 2015 | www.bp.com
3. US Energy Information Agency (EIA)
4. Pakistan Energy Year book
5. Ministry of Petroleum & Natural Resources | Gas Allocation Data
6. Impact of US LNG exports on Europe | www.energymining.org
7. Engro Elengy Terminal Limited
DISCLAIMERPACRA has used due care in preparation of this document. Our information has been obtained
from sources we consider to be reliable but its accuracy or completeness is not guaranteed.
The information in this document may be copied or otherwise reproduced, in whole or in part,
provided the source is duly acknowledged. The presentation should not be relied upon as
professional advice.
Analysts Rai Umar Zafar
Manager Ratings
+92 42 3586 9504
Usama Liaquat
Financial Analyst
+92 42 3586 9504