liquid–liquid equilibria for butyl tert-butyl ether + (methanol or ethanol) + water at several...
TRANSCRIPT

Fluid Phase Equilibria 224 (2004) 185–192
Liquid–liquid equilibria for butyltert-butyl ether+(methanol or ethanol)+ water at several temperatures
Alberto Arce∗, Oscar Rodrıguez, Ana Soto
Department of Chemical Engineering, University of Santiago de Compostela, Lope de Marzoa, s/n. E-15782 Santiago de Compostela, Spain
Received 20 March 2004; accepted 24 May 2004
Available online 21 August 2004
Abstract
Liquid–liquid equilibrium (LLE) data for butyltert-butyl ether+ (methanol or ethanol)+ water were measured experimentally at 298.15,308.15 and 318.15 K. The experimental data were correlated with the NRTL and UNIQUAC equations. The equations were used to performthe correlation of each temperature data set and for the three temperatures data set simultaneously. The best results were found with UNIQUACand NRTL (α = 0.1), respectively. Data prediction was carried out using the UNIFAC method, however the results found were not quantitative.© 2004 Elsevier B.V. All rights reserved.
Keywords: LLE; BTBE; Methanol; Ethanol; Water; Correlation; Prediction
1. Introduction
Ethers and alcohols are used on gasoline formulation asoctane boosters or anti-knock additives. Nowadays, the mostused are methyltert-butyl ether (MTBE) and ethyltert-butylether (ETBE). The use of other ethers with higher molec-ular weights has been suggested as it reduces the gasolinevapor pressure, water solubility and gum formation, or im-proves combustion. A possible octane booster would be thebutyl tert-butyl ether (BTBE), however, little information isavailable: kinetics of the synthesis reaction[1–3] and somephysical properties[4] are found, but nothing has been inves-tigated on the liquid–liquid equilibrium (LLE). Also, bothmethanol and ethanol are often present on gasoline formu-lations.
Phase behaviour is important in the petrochemical indus-try: it is critical for designing extraction equipment or toavoid two-phase formation. Here, we report the experimen-tal tie-lines of the systems BTBE+ (methanol or ethanol)+ water at 298.15, 308.15 and 318.15 K. These experimentaldata have been correlated using the UNIQUAC and NRTLequations. The energetic parameters of the models were ob-tained for the data sets at each temperature and also from asimultaneous correlation of the data at three different tem-
∗ Corresponding author. Tel.:+34 981 563 100; fax:+34 981 528 050.E-mail address: [email protected] (A. Arce).
peratures. The LLE data have also been predicted using theUNIFAC method and they are compared with the experi-mental data.
2. Experimental
2.1. Materials
BTBE was supplied by the Yarsintez Research Institute(Yaroslav, Russia) with a nominal purity of 99.8 mass%.Methanol and ethanol were both supplied by Merck with anominal purity of 99.8 mass%. These purities were verifiedby gas chromatography and the chemicals were used withoutfurther purification. The water content of the three chemi-cals was 0.05 mass%. Water was purified with a Milli-Q Plussystem.Table 1shows the components used, together withtheir purities, water contents and the experimental and pub-lished values[4–6] of density, speed of sound and refractiveindex.
2.2. Apparatus
All weighing was carried out in a Mettler Toledo AT 261balance precise to within±10−7 kg. Water contents weremeasured with a Metrohm 737 KF coulometer. Densitieswere measured with an Anton Paar DMA 60/602 densime-ter precise to within±10−2 kg m−3. Speeds of sound were
0378-3812/$ – see front matter © 2004 Elsevier B.V. All rights reserved.doi:10.1016/j.fluid.2004.05.008

186 A. Arce et al. / Fluid Phase Equilibria 224 (2004) 185–192
Table 1Water content (mass%), density (ρ), speed of sound (u) and refractive index (nD) of the pure components at 298.15 K and atmospheric pressure
Product Purity Water ρ (g cm−3) nD u (m s−1)
mass% mass% Exp. Bibl. Exp. Bibl. Exp. Bibl.
Water – – 0.99704 0.99705[5] 1.33250 1.33250[5] 1497 1497[7]Methanol 99.8 0.05 0.78663 0.78664[5] 1.32640 1.32652[5] 1101 1102[6]Ethanol 99.8 0.05 0.78522 0.78493[5] 1.35920 1.35941[5] 1139 1141[6]BTBE 99.8 0.05 0.75936 0.7581[4] 1.39206 – 1116 –
measured with an Anton Paar DSA 48 precise to within±1 m s−1 Refractive indices were measured to an accuracyof ±4 × 10⁻⁵ in an Atago RX-5000 refractometer. A Het-oterm thermostat was used to maintain the temperature at298.15±0.02 K. Phase analysis was carried out by gas chro-matography using a Hewlett-Packard 6890 Series chromato-graph equipped with a thermal conductivity detector and aHP-FFAP capillary column (25 m×0.2 mm×0.3�m). Thecarrier gas was Helium, with a flow rate of 1 ml min−1 inthe column. The injector, detector and column temperatureswere held at 453.15, 453.15 and 353.15 K, respectively. Theinjection volume was 1�l and the split ratio was 150:1 forthe system with methanol, and 80:1 for the system withethanol.
2.3. Procedure
The experimental procedure could be divided into threesteps. First, the solubility curves were obtained using the
Table 2Experimental tie-lines of the system BTBE (x1) + methanol (x2) + water (x3)
Organic phase T Aqueous phase
x1 x2 x3 x1 x2 x3
0.9910 0.0000 0.0090 298.15 K 0.0006 0.0000 0.99940.9471 0.0415 0.0114 0.0006 0.1321 0.86730.9135 0.0719 0.0145 0.0005 0.2163 0.78320.8676 0.1107 0.0217 0.0007 0.2958 0.70350.8174 0.1637 0.0189 0.0020 0.3753 0.62270.7732 0.1937 0.0332 0.0047 0.4393 0.55600.6826 0.2653 0.0521 0.0114 0.5072 0.48140.5049 0.4022 0.0929 0.0398 0.6011 0.35910.4916 0.4139 0.0945 0.0458 0.6115 0.3427
0.9968 0.0000 0.0032 308.15 K 0.0006 0.0000 0.99940.9837 0.0116 0.0047 0.0006 0.0552 0.94430.9259 0.0671 0.0070 0.0005 0.1916 0.80780.8602 0.1297 0.0101 0.0015 0.3663 0.63220.8073 0.1701 0.0226 0.0031 0.4399 0.55700.6673 0.2788 0.0539 0.0229 0.5547 0.42240.4737 0.4213 0.1050 0.0523 0.6141 0.3336
0.9961 0.0000 0.0039 318.15 K 0.0006 0.0000 0.99940.9756 0.0222 0.0022 0.0006 0.0984 0.90110.9192 0.0745 0.0063 0.0006 0.2690 0.73050.8603 0.1267 0.0130 0.0010 0.3414 0.65760.7794 0.1883 0.0323 0.0046 0.4289 0.56650.6284 0.3074 0.0642 0.0173 0.5502 0.43250.4770 0.4136 0.1094 0.0448 0.6010 0.3542
Compositions in mole fraction.
cloud-point method[8]. Then, the solubility curves wereused to carry out the calibration of the gas chromatographusing the internal standard method. Standards used were wa-ter for the aqueous phases and BTBE for the organic phases.The greatest errors in mole fraction composition during cal-ibration were±0.005 in the aqueous phases and±0.006 inthe organic phases, and were found in the rich-alcohol zone.Finally, the conjugate phases were obtained preparing mix-tures whose compositions laid in the immiscible region. Themixtures were vigorously stirred for at least 1.5 h in jacketedcells with septum outlets, thereafter left to stand for at least5 h (the time necessary to attain equilibrium was establishedin preliminary experiments). The temperature was controlledusing water from a thermostat (Selecta Ultraterm 6000383)and the water temperature was measured with a thermome-ter Heraeus Quat 100 precise to within±0.02 K. Then asample of each phase was withdrawn and injected onto thegas chromatograph. The compositions of the tie-lines endsare listed inTables 2 and 3.

A. Arce et al. / Fluid Phase Equilibria 224 (2004) 185–192 187
Table 3Experimental tie-lines of the system BTBE (x1) + ethanol (x2) + water (x3)
Organic phase T Aqueous phase
x1 x2 x3 x1 x2 x3
0.9786 0.0000 0.0214 298.15 K 0.0002 0.0000 0.99980.9487 0.0297 0.0216 0.0002 0.0300 0.96980.9213 0.0537 0.0250 0.0002 0.0630 0.93680.8731 0.0948 0.0321 0.0002 0.1044 0.89540.8071 0.1453 0.0476 0.0003 0.1472 0.85250.7036 0.2230 0.0734 0.0006 0.2000 0.79940.6394 0.2656 0.0950 0.0020 0.2380 0.76000.5887 0.2957 0.1156 0.0031 0.2620 0.73490.5089 0.3443 0.1468 0.0080 0.2971 0.69490.4623 0.3675 0.1702 0.0112 0.3125 0.67630.3235 0.4243 0.2522 0.0361 0.3735 0.5904
0.9832 0.0000 0.0168 308.15 K 0.0002 0.0000 0.99980.9455 0.0440 0.0105 0.0003 0.0451 0.95460.9042 0.0793 0.0165 0.0002 0.0847 0.91510.8081 0.1544 0.0375 0.0002 0.1459 0.85390.7344 0.2121 0.0535 0.0006 0.1926 0.80680.6520 0.2656 0.0824 0.0009 0.2301 0.76900.5617 0.3201 0.1182 0.0046 0.2762 0.71920.3688 0.4123 0.2189 0.0230 0.3586 0.61840.2840 0.4318 0.2842 0.0416 0.3799 0.5785
0.9894 0.0000 0.0106 318.15 K 0.0002 0.0000 0.99980.9364 0.0490 0.0146 0.0001 0.0522 0.94770.9273 0.0588 0.0139 0.0002 0.0630 0.93680.8944 0.0918 0.0138 0.0001 0.0981 0.90180.8542 0.1155 0.0303 0.0002 0.1075 0.89230.7835 0.1746 0.0419 0.0002 0.1564 0.84340.7251 0.2239 0.0510 0.0006 0.2026 0.79680.5889 0.3010 0.1101 0.0013 0.2551 0.74360.4707 0.3599 0.1694 0.0131 0.3071 0.67980.3471 0.4187 0.2342 0.0320 0.3624 0.6056
Compositions in mole fraction.
3. Correlation
The correlation of the experimental data was madewith the NRTL [9] and the UNIQUAC [10] equations,of the models most used in the literature. The value ofthe non-randomness parameter for the NRTL equation,α,was previously assigned to 0.1, 0.2 and 0.3. The structuralparameters for UNIQUAC,r and q, were taken from theliterature[11–13].
The binary interaction parameters for both NRTL andUNIQUAC equations were obtained using a computer pro-gram as that described by S�rensen and Arlt[14] whichuses two objective functions. The first,Fa, does not requireany previous guess for the parameters, and after convergencethese parameters are used in the second function,Fb, to fitthe experimental concentrations:
Fa =∑
k
∑i
∑j
[(aI
ijk − aIIijk)
(aIijk + aII
ijk)
]2
+ Q∑n
P2n (1)
Fb =∑
k
min∑
i
∑j
(xijk − xijk)2 + Q
∑n
P2n
+[
ln
(γ IS∞
γ IIS∞
β∞
)]2
(2)
where a is the activity,Pn the parameter value, andQ aconstant;x is the composition in mole fraction,γ the calcu-lated activity coefficient,β the solute distribution ratio be-tween the organic and the aqueous phases (xBTBE
2 /xWATER2 ),
and min refers to the minimum obtained by the Marquardtmethod. The subscripts and superscripts are:i for the com-ponents (1, 2, 3),j for the phases (I, II),k for the tie-lines (1,2, . . . , M) andn for the parameters (1,. . . , 6). The symbolrefers to calculated magnitudes,s to the solute (methanol orethanol) and∞ to infinite dilution.
The second terms of bothEqs. (1) and (2)are penaltyterms designed to reduce risks of multiple solutions asso-ciated with high parameter values. InFb objective function(Eq. (2)) the third term ensures that the binary interactionparameters give a solute distribution ratio at infinite dilution,
188 A. Arce et al. / Fluid Phase Equilibria 224 (2004) 185–192
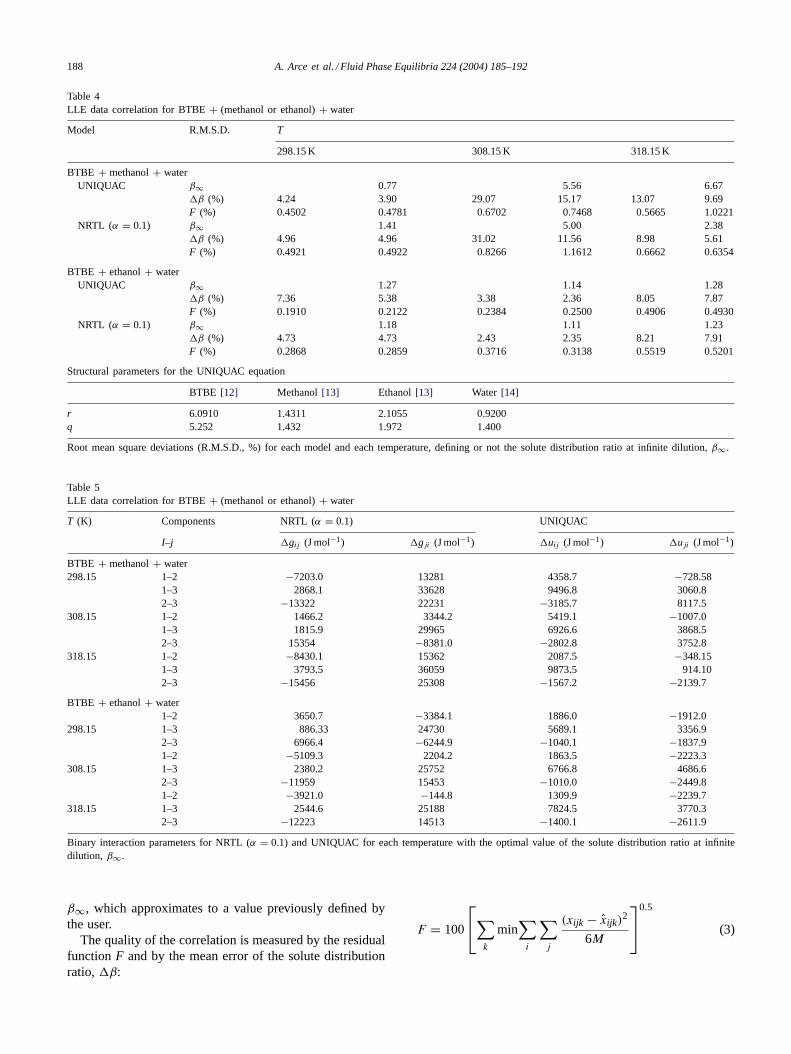
Table 4LLE data correlation for BTBE+ (methanol or ethanol)+ water
Model R.M.S.D. T
298.15 K 308.15 K 318.15 K
BTBE + methanol+ waterUNIQUAC β∞ 0.77 5.56 6.67
�β (%) 4.24 3.90 29.07 15.17 13.07 9.69F (%) 0.4502 0.4781 0.6702 0.7468 0.5665 1.0221
NRTL (α = 0.1) β∞ 1.41 5.00 2.38�β (%) 4.96 4.96 31.02 11.56 8.98 5.61F (%) 0.4921 0.4922 0.8266 1.1612 0.6662 0.6354
BTBE + ethanol+ waterUNIQUAC β∞ 1.27 1.14 1.28
�β (%) 7.36 5.38 3.38 2.36 8.05 7.87F (%) 0.1910 0.2122 0.2384 0.2500 0.4906 0.4930
NRTL (α = 0.1) β∞ 1.18 1.11 1.23�β (%) 4.73 4.73 2.43 2.35 8.21 7.91F (%) 0.2868 0.2859 0.3716 0.3138 0.5519 0.5201
Structural parameters for the UNIQUAC equation
BTBE [12] Methanol[13] Ethanol[13] Water [14]
r 6.0910 1.4311 2.1055 0.9200q 5.252 1.432 1.972 1.400
Root mean square deviations (R.M.S.D., %) for each model and each temperature, defining or not the solute distribution ratio at infinite dilution,β∞.
Table 5LLE data correlation for BTBE+ (methanol or ethanol)+ water
T (K) Components NRTL (α = 0.1) UNIQUAC
I–j �gij (J mol−1) �gji (J mol−1) �uij (J mol−1) �uji (J mol−1)
BTBE + methanol+ water298.15 1–2 −7203.0 13281 4358.7 −728.58
1–3 2868.1 33628 9496.8 3060.82–3 −13322 22231 −3185.7 8117.5
308.15 1–2 1466.2 3344.2 5419.1 −1007.01–3 1815.9 29965 6926.6 3868.52–3 15354 −8381.0 −2802.8 3752.8
318.15 1–2 −8430.1 15362 2087.5 −348.151–3 3793.5 36059 9873.5 914.102–3 −15456 25308 −1567.2 −2139.7
BTBE + ethanol+ water1–2 3650.7 −3384.1 1886.0 −1912.0
298.15 1–3 886.33 24730 5689.1 3356.92–3 6966.4 −6244.9 −1040.1 −1837.91–2 −5109.3 2204.2 1863.5 −2223.3
308.15 1–3 2380.2 25752 6766.8 4686.62–3 −11959 15453 −1010.0 −2449.81–2 −3921.0 −144.8 1309.9 −2239.7
318.15 1–3 2544.6 25188 7824.5 3770.32–3 −12223 14513 −1400.1 −2611.9
Binary interaction parameters for NRTL (α = 0.1) and UNIQUAC for each temperature with the optimal value of the solute distribution ratio at infinitedilution, β∞.
β∞, which approximates to a value previously defined bythe user.
The quality of the correlation is measured by the residualfunction F and by the mean error of the solute distributionratio, �β:
F = 100
∑
k
min∑
i
∑j
(xijk − xijk)2
6M
0.5
(3)

A. Arce et al. / Fluid Phase Equilibria 224 (2004) 185–192 189
Fig. 1. Experimental tie-lines (—�) and the corresponding UNIQUAC correlation (----) using the optimal value of the solute distribution ratio atinfinite dilution at 298.15, 308.15 and 318.15 K. Left: BTBE+ methanol+ water. Right: BTBE+ ethanol+ water.

190 A. Arce et al. / Fluid Phase Equilibria 224 (2004) 185–192
Fig. 2. Experimental tie-lines (—�) and data predicted (----�) using the UNIFAC method at 298.15, 308.15 and 318.15 K. Left: BTBE+ methanol+ water. Right: BTBE+ ethanol+ water.

A. Arce et al. / Fluid Phase Equilibria 224 (2004) 185–192 191
Table 6Simultaneous correlation of the data at the three temperatures for BTBE+ (methanol or ethanol)+ water
Model PairI–j Parameters R.M.S.D. (%) T (K)
�uij (J mol−1) �uji (J mol−1) 298.15 308.15 318.15
BTBE + methanol+ waterUNIQUAC 1–2 4867.8 −894.89
1–3 7853 3567.7 �β 18.19 13.89 12.062–3 −3230.9 5114.4 F 1.1027 1.0257 0.9161
NRTL (α = 0.1) 1–2 −6232.3 114851–3 4790 45448 �β 14.53 27.99 19.712–3 −13482 22017 F 0.7466 0.9815 0.8708
BTBE + ethanol+ waterUNIQUAC 1–2 −2407 2776.7
1–3 11329 440.28 �β 8.18 5.88 8.242–3 −1124.6 −1626 F 0.6240 0.6799 0.6454
NRTL (α = 0.1) 1–2 2772.3 −4025.51–3 1972.1 25982 �β 4.66 2.35 8.512–3 12498 −10072 F 0.3961 0.3759 0.5761
Binary interaction parameters and root mean square deviations (R.M.S.D.) of the models.
�β = 100
[∑k
((βk − βk)/βk)2
M
]0.5
(4)
Three different kinds of correlations were made. First,the experimental data were fitted at each temperature withboth NRTL and UNIQUAC equations, at each temperatureand without defining a value for the solute distribution ra-tio at infinite dilution,β∞, and also using the optimal valuefor this parameter. In the latter case, the optimalβ∞ wasfound by trial and error with�β as optimality criterion.Table 4 lists the root mean square deviations found withboth models, NRTL (α = 0.1) and UNIQUAC, obtainedfor each temperature defining the solute distribution ratioat infinite dilution, β∞, or not. When the solute distribu-tion ratio at infinite dilution,β∞ is defined, the residual�β decreases extensively, and the residualF slightly in-creases. As the residual�β shows the fitness of the LLEdata at solute low concentrations, and due to the impor-tance of this region, the correlation definingβ∞ is usuallypreferred[14]. This behaviour occurs in most of our sys-tems, as can be seen inTable 4, thus we have decided to fixβ∞ for correlation.Table 5lists the NRTL (α optimized at0.1) and UNIQUAC parameters obtained at each tempera-ture when the optimal value of the solute distribution ratioat infinite dilution, β∞, is defined.Fig. 1 shows a com-parison of the experimental tie-lines and those calculatedwith UNIQUAC definingβ∞, for each temperature and eachsystem.
Table 7LLE data prediction for BTBE+ (methanol or ethanol)+ water. Rootmean square deviations (F) for each temperature
System 298.15 K 308.15 K 318.15 K
BTBE + ethanol+ water 5.46 6.05 4.45BTBE + methanol+ water 3.32 4.02 3.88
Since the correlations are correct only at each tempera-ture and to obtain a set of parameters valid in the range ofthe three temperatures, we have also carried out the simulta-neous correlation of the all data sets.Table 6lists the results(binary parameters and residuals) obtained with this corre-lation for both models NRTL (α = 0.1) and UNIQUAC inboth systems BTBE+ (methanol or ethanol)+ water.
4. Prediction
The LLE data were predicted with the UNIFAC method[11]. The interaction and structural parameters were takenfrom Magnussen et al.[15]. The LLE data were calculatedfor the middle point of the experimental tie-lines. This allowsthe comparison of the experimental and predicted tie-linesusing the residualF (Eq. (3)). This comparison is shown onTable 7and inFig. 2.
5. Conclusions
Liquid–liquid Equilibrium data of the systems BTBE+ (methanol or ethanol)+ water were determined experi-mentally at 298.15, 308.15 and 318.15 K. Temperature haspractically no effect on the size of the immiscibility regionfor the working temperatures in both systems.
The LLE data were correlated using the NRTL and UNI-QUAC activity models. The best correlation was found byfixing an optimalβ∞ value. This way, a slightly larger valueof the residualF than the correlation without definingβ∞was found, however the value of the residual�β is muchsmaller (seeTable 4). The same behaviour is frequentlyfound in the open literature[14]. The correlation with UNI-QUAC equation gives the best results, but also the NRTLequation with a value of the nonrandomness parameter op-timized inα = 0.1 fits the experimental data satisfactorily.

192 A. Arce et al. / Fluid Phase Equilibria 224 (2004) 185–192
The simultaneous correlation of the data at the three tem-peratures gives common parameters in the temperature rangeconsidered, increasing in this way their application. As wasexpected, the residuals were higher than when the individ-ual correlation at each temperature was made (seeTables4 and 6). Nonetheless, the correlation parameters have nophysical meaning. It is clearly indicated by the differencesin the interaction parameters between BTBE and water inboth systems and in all the cases (seeTables 5 and 6).
The LLE data predicted with the UNIFAC method giveshigh values of the residualF (seeTable 7). Thus, the resultscould not be considered quantitative (seeFig. 2) and shouldonly be used in preliminary studies. This is especially truein the system BTBE+ ethanol+ water where the predictedslope of the tie-lines is the opposite than that of the experi-mental data (seeFig. 2).
List of symbolsa activityF rms deviation of phase compositionFa activity objective functionFb concentration objective functionM number of tie-linesPn parameter valueQ constantx experimental mole fractionx calculated mole fraction
Subscriptsi component identifierj phase identifierk tie-line identifiern parameter identifier in the termQ
∑n P2
n∞ infinite dilution
Greek lettersα NRTL non-randomness parameterβ experimental solute distribution ratioβ calculated solute distribution ratio�β rms relative deviation of solute distribution ratio�g optimizable binary NRTL parameters�u optimizable binary UNIQUAC parameters
Greek lettersγ activity coefficientγ calculated activity coefficient
Acknowledgements
The authors are grateful to the Ministerio de Cien-cia y Tecnologıa of Spain for financial support (ProjectPPQ2003-01326).
References
[1] K.G. Sharonov, Y.B. Mishentseva, A.M. Rozhnov, E.A. Mirosh-nichenko, L.I. Korchatova, J. Chem. Thermodyn. 23 (1991) 141–145.
[2] K.G. Sharonov, Y.B. Mishentseva, A.M. Rozhnov, E.A. Mirosh-nichenko, L.I. Korchatova, J. Chem. Thermodyn. 23 (1991) 637–642.
[3] F. Ancillotti, M. Massi Mauri, E. Pescarollo, L. Romagnoni, J. Mol.Catal. 4 (1978) 37–48.
[4] M. Obama, Y. Oodera, N. Kohama, T. Yanase, Y. Saito, K. Kusano,J. Chem. Eng. Data 30 (1985) 1–5.
[5] J.A. Riddick, W.B. Bunger, T. Sakano, Organic Solvents, John Wileyand Sons, New York, 1986.
[6] T.M. Aminabhavi, M. Aralaguppi, S.B. Harogoppad, R.H. Balundgi,J. Chem. Eng. Data 38 (1993) 31–39.
[7] S.G. Bruun, A. Hvidt, Berichte der Bunsen-Gesellschaft 81 (1977)930–933.
[8] D.F. Othmer, R.E. White, E. Trueger, Ind. Eng. Chem. 33 (1940)1240–1248.
[9] H. Renon, J.M. Prausnitz, AIChE J. 14 (1968) 135–144.[10] D.S. Abrams, J.M. Prausnitz, AIChE J. 21 (1975) 116–128.[11] A. Fredenslund, R.L. Jones, J.M. Prausnitz, AIChE J. 21 (1975)
1086–1099.[12] T.E. Daubert, R.P. Danner, Physical and Thermodynamic Properties
of Pure Chemicals Data Compilation, Hemisphere Publishing Co.,New York, 1989.
[13] J.M. Prausnitz, T.F. Anderson, E.A. Grens, C.A. Eckert, R. Hsieh,J.P. O’Connell, Computer Calculations for Multicomponent VLE andLLE, Prentice Hall Inc., New Jersey, 1980.
[14] J.M. S�rensen, W. Arlt, Liquid–liquid Equilibrium Data Collection.Binary Systems, DECHEMA Chemistry Data Series, vol. 5 (1),Frankfurt, 1979.
[15] T. Magnussen, P. Rasmussen, A. Fredenslund, UNIFAC parametertable for prediction of liquid–liquid equilibria, Ind. Eng. Chem.Process Des. Dev. 20 (1981) 331–339.