liquidity and transparency in bank risk management 1introduction banks use short-term debt to invest...
TRANSCRIPT

Liquidity and Transparency in
Bank Risk Management
Lev Ratnovski
WP/13/16
© 2013 International Monetary Fund WP/13/16
IMF Working Paper
Research Department
Liquidity and Transparency in Bank Risk Management
Prepared by Lev Ratnovski1
Authorized for distribution by Stijn Claessens
January 2013
Abstract
Banks may be unable to refinance short-term liabilities in case of solvency concerns. To manage this risk, banks can accumulate a buffer of liquid assets, or strengthen transparency to communicate solvency. While a liquidity buffer provides complete insurance against small shocks, transparency covers also large shocks but imperfectly. Due to leverage, an unregulated bank may choose insufficient liquidity buffers and transparency. The regulatory response is constained: while liquidity buffers can be imposed, transparency is not verifiable. Moreover, liquidity requirements can compromise banks' transparency choices, and increase refinancing risk. To be effective, liquidity requirements should be complemented by measures that increase bank incentives to adopt transparency.
JEL Classification Numbers: G21, G28, G32
Keywords: Banks, liquidity risk, regulation, transparency, Basel III
Author’s E-Mail Address: [email protected]
1 I thank Viral Acharya and Manju Puri (JFI editors), Arnoud Boot, Charles Goodhart, Mark Flannery, Iftekhar Hasan, Erlend Nier, Per Ostberg, Daniel Paravisini, Enrico Perotti, Rafael Repullo, Jean-Charles Rochet, Javier Suarez, Ernst-Ludwig von Thadden, Tanju Yorulmazer, and participants of WFA meetings (Denver), EFA meetings (Zurich), Basel Committee workshop on "Banking, Risk, and Regulation" at FDIC, CEPR conference on "Corporate Finance and Risk Management," JFS/Bank of Finland conference "Financial Instability, Supervision and Central Banks", LSE conference on "Cycles, Contagion, and Crises,” and the FIRS meeting (Anchorage).
This Working Paper should not be reported as representing the views of the IMF. The views expressed in this Working Paper are those of the author(s) and do not necessarily represent those of the IMF or IMF policy. Working Papers describe research in progress by the author(s) and are published to elicit comments and to further debate.

2
Contents Page
I. Introduction ............................................................................................................................3 II. Related Literature ..................................................................................................................5 III. The Model ............................................................................................................................9 IV. Liquidity Risk Management ..............................................................................................14 V. Regulation ...........................................................................................................................20 VI. Conclusion .........................................................................................................................24 Figures 1. The Timeline .......................................................................................................................35 2. The Information Structure ...................................................................................................36 3. Socially Optimal Liquidity Risk Management ....................................................................37 4. Private Risk Management Choices ......................................................................................38 5. The Unintended Effects of Liquidity Requirements ...........................................................39 6. Maturity Mismatch Limits ...................................................................................................40 Appendix A. A Model Without Deposit Insurance .................................................................................31 B. A Quantitative Example .....................................................................................................33 References ................................................................................................................................25

3
1 Introduction
Banks use short-term debt to invest in long-term assets (Diamond and Dybvig, 1983).
This creates liquidity risk: a bank unable to roll over maturing debt can fail despite
being solvent. A majority of recent bank liquidity crises in developed economies were
caused by increased uncertainty over a bank’s solvency and played out primarily in
wholesale funding markets (Gatev and Strahan, 2006, Shin, 2008, Yorulmazer, 2008,
Huang and Ratnovski, 2011).1 The new Basel III accord aims to address liquidity risk
in banks through the Liquidity Coverage Ratio (a liquidity requirement) and the Net
Stable Funding Ratio (a restriction on maturity mismatch that limits the volume of
refinancing coming due each period; see Basel Committee, 2010).
The purpose of this paper is to offer a model of bank liquidity risk driven by solvency
concerns and to study its regulatory implications. In particular, we want to understand
the interaction between liquidity requirements, access to refinancing (which we link to
bank transparency), and liquidity risk.
We model liquidity risk driven by a sudden increase of uncertainty over the bank’s
solvency. A bank has a valuable long-term project, which with a small probability can
turn out to be of zero value. Because the risk is small, it does not prevent initial funding.
At the intermediate date, the bank needs to refinance an exogenous random withdrawal.
Yet its ability to do so can be compromised by informational frictions. In most states of
the world, the bank is solvent, and refinancing is available. Yet, with some probability,
the world is in a “bad” state, where the posterior probability of insolvency is high (but
less than one). Then, investors may become unwilling to lend to the bank, creating
liquidity risk and the possibility of a failure of a potentially solvent institution.
1Some notable examples include: Citibank and Standard Chartered in Hong Kong in 1991 (rumors
of technical insolvency), Lehman Brothers in 1998 (rumors of severe losses in emerging markets), and
Commerzbank in 2002 (rumors of large trading losses). In the recent crisis: Northern Rock and Country-
wide in 2007 and IndyMac in 2008 (concerns about mortgage exposures), Bear Stearns in 2008 (concerns
about CDS exposures). Note that in most of these cases the solvency (hypothetical long-term viability)
of a bank was still uncertain at the time of the crisis. Yet a banks’ inability to refinance prompted
distressed liquidations and was a proximate cause of the collapse. The bankruptcy of Lehman Brothers
in 2008 led to endemic counterparty solvency concerns, and an inability to refinance in a large number
of institutions.
4
We observe that a bank can hedge liquidity risk in two ways. One, traditional,
is to accumulate a precautionary buffer of easily tradeable assets: a liquidity buffer.
In a liquidity crisis, a bank can dispose of such assets and cover the refinancing needs
internally. Another, less conventional, is to enhance the ability to communicate solvency
information to outsiders. A bank that can “prove” its solvency will be able to attract
external refinancing. We label the mechanisms by which a bank can establish effective
communication “transparency”. We take the standard corporate governance view on
transparency (Doidge, 2003, Leuz et al., 2003, Anderson et al., 2009), formalized by two
assumptions: (i) banks can choose the level of transparency (the amount of information
available to outsiders), and (ii) higher transparency reduces the owner-manager’s private
benefits of control.
Liquidity buffers and transparency are complements, yet strategic substitutes. They
are complements because they hedge the same risk with different imperfections. A
liquidity buffer can only cover small refinancing needs because its size is limited. Trans-
parency improves access to external refinancing for liquidity needs of any size, but is
only effective with a probability. The reason is that transparency relies on ex-post com-
munication to market participants, which may sometimes fail, and then refinancing will
not be forthcoming. A bank can therefore combine liquidity buffers and transparency
in its risk management, to fully hedge small refinancing needs, and partially hedge large
ones. Yet liquidity buffers and transparency are strategic substitutes, because for a bank
that adopts one hedging instrument, the value of another diminishes.
Liquidity and transparency are costly hedges, and most of their cost is borne by
the bank’s shareholders. Holding liquidity buffers is costly because their maintenance
requires effort from bank managers (or other administrative cost); the cost of effort
cannot be compensated by a low return on highly liquid assets. With transparency, the
owner-manager sacrifices private benefits. Yet some of the benefits of hedging accrue to
creditors in the form of lower risk and are not internalized by shareholders (Jensen and
Meckling, 1976). As a result, a leveraged bank may under-invest in liquidity buffers and
transparency.

5
Suboptimal risk management (insufficient hedging) justifies government interven-
tion in the form of bank liquidity regulation. We make two observations. First, while
liquidity buffers can be imposed, transparency is not easily verifiable and is harder to
regulate. Then, liquidity requirements may have unintended consequences: compromise
the bank’s endogenous transparency choices. We show that for some parameter val-
ues the deterioration of transparency may more than offset the positive effect of larger
liquidity buffers, so that liquidity regulation will unintentionally increase the overall
refinancing risk.
Second, while transparency cannot be regulated directly, the model identifies a num-
ber of indirect mechanisms by which policy can address it. One mechanism is to en-
courage transparency by reducing its alternative cost, the bank owner-manager’s private
benefits of control. This can be achieved, for example, by stronger corporate governance.
Another mechanism is to accept insufficient transparency, but reduce the risk of large
refinancing needs that exceed the size of the liquidity buffer. This can be implemented
through maturity mismatch limits (such as the Net Stable Funding Ratio of Basel III).
These solutions may be essential complements to liquidity requirements.
The paper is organized as follows. Section 2 reviews the literature on bank liquidity
risk and on transparency. Section 3 sets up the model. Section 4 describes socially
optimal and private risk management choices. Section 5 studies regulatory implications.
Section 6 concludes.
2 Related Literature
2.1 Bank Liquidity Risk
The paper relates to the literature on bank liquidity risk and refinancing frictions. Early
papers on liquidity risk, such as Diamond and Dybvig (1983) and Chari and Jagannathan
(1988), assumed the absence of informed refinancing even for banks with valuable as-
sets. The seminal work of Goodfriend and King (1988) provided a benchmark that

6
banks known to be solvent should be able to refinance themselves in well-functioning
interbank markets. Their work implies that, in order to describe modern liquidity risk in
banks, models need to demonstrate how market failures may restrict the market-based
refinancing of solvent institutions.
One such market failure is informational frictions. In Flannery (1996), potential
lenders are uncertain of their screening ability, and restrict refinancing to avoid lemon
costs. Rochet and Vives (2004) model a coordination failure among bank creditors,
where each withdraws if expects others to do the same. Freixas et al. (2004) consider
a solvent bank that seeks refinancing but is indistinguishable from an insolvent one
that attracts funds to gamble for resurrection. Huang and Ratnovski (2011) argue that
sophisticated lenders may over-react to solvency concerns when they are senior and do
not incur the full cost of liquidations. Our paper contributes to this literature with
a simple model driven by a basic information friction, where the probability of bank
failure is initially low, but its posterior can increase at an intermediate date, exposing
affected banks to prohibitive lemon costs.
Another market failure that may restrict refinancing is an increase in moral hazard
as in Holmstrom and Tirole (1998, 2011). The key distinction between the Holmstrom
and Tirole framework and our approach is that they consider a net liquidity need: a
bank needs to attract additional funds to continue the project, but a moral hazard-
related leverage constraint may prevent it from doing so. As a result, such models may
be more attuned to the analysis of leverage and capital regulation (cf. Farhi and Tirole,
2012). In contrast, our and similar models consider a gross liquidity need: a firm needs
to attract funds to substitute the outflow. The bank’s leverage does not change and its
overall borrowing constraint does not become more binding.
Our focus on liquidity buffers and transparency as instruments of liquidity risk man-
agement is consistent with the empirical results that both stock liquidity (Paravisini,
2007) and access to external refinancing (Kashyap and Stein, 1990, Holod and Peek,
2004) are important in determining bank financial pressures. There is evidence that
banks may be insufficiently liquid (Gatev et al., 2004, Gonzalez-Eiras, 2003) or trans-

7
parent (Morgan, 2002). The issue of transparency may be most relevant for advanced
banking systems (Bennet and Peristiani, 2002, Chaplin et al., 2000), since banks in devel-
oping countries (with less deep financial markets) predominantly rely on stock liquidity
to manage refinancing risks (Freedman and Click, 2006).
2.2 Bank Transparency
The paper also relates to the literature on bank transparency (or, conversely, opacity).
The literature offers two ways to formalize transparency: as the presence of credible
communication channels or as asset choice. We focus on the former.
The link between transparency and credible communication has strong foundations
in the corporate governance literature. Firms can suppress information and conceal
own performance by deliberately maintaining lower levels of disclosure (Anderson et.
al., 2009) or through earnings management (Leuz et al., 2003). The key reason for
suppressing information is that it enhances insiders’ private benefits of control (Doidge,
2003, Leuz et al., 2003, Doidge et al., 2009). The impact of transparency on firm
performance is ambiguous.
For banks, the argument that the availability of information on asset returns is en-
dogenous goes back at least to Stanhouse (1986). In addition to the methods available
to non-financial firms, banks can conceal information through organizational complexity
(Berger et al., 2000) or obfuscation (Carlin, 2009, and Carlin and Manso, 2011). Banks
can facilitate information production by maintaining incentives for market participants
to specialize in analyzing information about the bank (Calomiris, 1999). The argu-
ment that opacity enhances private benefits of control in banks has been articulated by
Ostberg (2006) and Wagner (2007).
We follow this literature in interpreting transparency as a set of ex-ante choices
that determine the presence of credible communication channels; with the key cost of
transparency being lower private benefits of control.
It is useful to highlight the distinction between transparency and disclosure. First,

8
establishing transparency can involve other corporate actions, such as avoiding complex-
ity. Second, transparency is a strategic ex-ante decision, while disclosure is an ex-post
action (Perotti and Von Thadden, 2003). Unless preconditions are in place, ad hoc
disclosure may be not credible (Boot and Thakor, 2001), particularly in the context of
a liquidity crisis, since a distressed firm has high incentives to manipulate information
(Povel et al., 2007, Atanasov et al., 2010).2 Therefore while the regulation of disclo-
sure may be useful (Admati and Pfleiderer, 2000, Ostberg, 2006), it is not sufficient to
achieve transparency when banks can manipulate or obfuscate information.
The final caveat is that we focus on the positive effects of transparency where it
enables the refinancing of solvent banks. One can construct opposite examples where
transparency has negative unintended consequences. For example, Chen and Hasan
(2006) and Huang and Ratnovski (2011) show how transparency renders banks unable
to conceal negative but possibly incorrect news about solvency. We abstract from these
effects.
An alternative approach to interpreting transparency would be to link it with bank
asset choice. Indeed, some bank assets, such as relationship-based loans, are intensive in
soft information, and their value is hard to communicate. In contrast, other assets, such
as trading assets or securitized loans (e.g. mortgages) rely on hard information that
can be more easily communicated (Boot and Thakor, 2000, Berger et al., 2005). While
theoretically appealing, the relationship between transparency and asset choice has lim-
ited empirical support: Morgan (2002) and Flannery et al. (2010) find no relationship
between bank asset class holdings and market-based measures of transparency.
2Two illustrations are useful. The Economist highlights the difficulty of communicating during a
banking crisis: “You know something bad is going to happen... when a bank boss [is] insisting that his
institution is completely solid” (“Here We Go Again”, October 8, 2011). Griffin and Wallach (1991)
offer a historic perspective on the credibility of disclosure: when Citicorp became the first large bank
to make provisions against losses from the Latin American debt crisis (in May 1987), it had to make
clearly excess, very costly provisions ($3 billion) as a signal of a commitment to draw a line under prior
losses.

9
3 The Model
This section outlines a model of bank liquidity risk driven by solvency concerns.
3.1 Economy and Agents
Consider a risk-neutral economy with three dates (0 1 2) and no discounting. The
economy is populated by multiple competitive investors and a single owner-managed
bank. Investors are endowed with money that they can lend to the bank against a zero
expected rate of return.
The bank is endowed with a profitable investment project. The project is fixed in
size. It requires an investment of 1 at date 0, and returns at date 2 a high 0
with probability 1 − or 0 with a small probability ( stands for solvency risk). In
addition to the project’s pecuniary returns, the payoff of the bank’s owner-manager has
two other components. First, she incurs a cost of effort per unit of the bank’s balance
sheet at date 0.3 Second, she derives non-verifiable private benefits of control from
running the bank. The owner-manager maximizes the sum of profits, costs (taken with
a negative sign), and private benefits.
The bank has no initial capital and is financed with debt. Some debt is short-term
and has to be refinanced at date 1, as detailed below. The timeline is given in Figure 1.
3The parameter can be though of as the administrative cost of running the bank. The empirical
literature (cf. Berger et al., 1987) showed that the cost function of banks is, in general, U-shaped in bank
size, and may depend on product mix. We simplify by using a fixed cost, with the idea that managing
any component of the bank’s balance sheet is costly. For example, in the case of loans, the bank’s
owner-manager has to monitor loan officers, and in the case of managing liquidity, she has to monitor
bank treasury employees. The fact that the management of bank liquidity is associated with agency
costs and requires monitoring is highlighted theoretically by Myers and Rajan (1998) and was recently
illustrated by the 2012 losses of $6.8 billion in the treasury department of JP Morgan on mishandled
operations to invest surplus liquidity.
The role of the parameter in our model is that it imposes a cost on large bank balance sheets, and
hence on holding idle assets — liquidity buffers. An alternative way to model the cost of holding liquidity
would have been to use the “pledgeable income” approach of Holmstrom and Tirole (1998, 2011). There,
the size of the bank’s balance sheet is limited to a multiplier of bank capital by an incentive compatibility
constraint. When the incentive compatibility constraint is binding, accumulating additional liquidity
buffers has costs: it requires either cutting down on profitable investments or attracting costly capital.
The implications of the “pledgeable income” and our “cost of effort” approaches to micro-founding the
costs of liquidity are similar.

10
3.2 Information and Refinancing
Two events happen at date 1. One is a random withdrawal of a part of initial funding.
Another is a signal on bank solvency. The two events are independent — withdrawals
are made by uninformed depositors or represent maturing term funding, and therefore
are not influenced by the solvency signal.
Withdrawals and the refinancing need While the project is long-term, some debt
matures earlier and must be refinanced.4 In reality there may be multiple refinancing
events through the course of the project, but for the analysis we collapse them into a
single “intermediate” date 1. The share of funds maturing at date 1 — the refinancing
need — is random. With probability , the refinancing need is low: a share 1 of
initial funds. With additional probability 1− , the refinancing need is high, = 1, so
that a bank has to refinance all initial funding. If a bank cannot refinance, it fails and
has to liquidate the long-term project at zero residual value.
Information and the refinancing risk Because investors always offer an elastic
supply of funds (there is no aggregate liquidity shortage in the model), a known solvent
bank can refinance any withdrawals by new borrowing. Yet smooth refinancing can be
impeded by imperfect information, namely — solvency concerns. That is the origin of
liquidity risk in this model.
Recall that a bank is solvent (yields at date 2) with probability 1− and insolventwith probability . Assume that, at date 1, investors receive a noisy signal refining the
posterior of bank solvency. With probability 1 − ( + ) there is a “positive” signal,
conditional on which a bank is always solvent and yields with certainty. Then, a
bank can refinance itself at a risk-free rate. However, with a residual probability + ,
there is a “negative” signal when the probability of insolvency is high. The negative
4We do not explicitly model why the bank has short-term debt. The reliance of banks on short-term
debt is an established stylized fact. It also has numerous explanations in the literature. One explanation
is that short-term debt is a mechanism by which banks offer liquidity insurance to customers, as in
Diamond and Dybvig (1983). Another explanation is that short-term debt is a device for disciplining
banks (Calomiris and Kahn, 1991, Diamond and Rajan, 2001).

11
signal is received by all insolvent banks and by some solvent banks. The posterior
probability of insolvency under a “negative” signal is then ( + ), higher than the
date 0 prior probability, . A solvent bank affected by a negative signal is thus pooled
with a large number of insolvent banks, which can render it unable to refinance due to
increased solvency risk. Such a set-up, while stylized, is descriptive of many real-world
liquidity crises. The information structure is illustrated in Figure 2.5
The model allows different interpretations of the availability of solvency information
to the bank’s owner-manager. The only requirement is that all banks should have in-
centives to seek refinancing. This is natural in the model. Indeed, for the manager,
there is an upside to seeking refinancing if there is some chance that the bank is sol-
vent. And even if the manager knows that the bank is insolvent, there is no cost to
seeking refinancing (so we can assume that, on the margin, the manager prefers to seek
refinancing).
We impose two restrictions. The first restriction is that a bank can always obtain
initial funding at date 0, and the owner-manager’s return is positive:
1
1− (+ )+
1− (+ ). (1)
On the left hand side of (1), is the return in case of success. The first term on the
right hand side is the repayment that a bank has to offer to investors if it always failed
upon a “negative” signal at date 1. The second term is the compensation for the owner-
manager’s cost of effort (for an initial balance sheet size of 1 corresponding to the size
of the investment project).
The second restriction is that under a negative signal at date 1 a bank cannot obtain
5The signal can also be interpreted as a state of the world. In a “good” state, such as an economic
expansion, all banks are solvent. In a “bad” state, such as a recession, some solvent banks may start
looking insolvent.
Note that in this model a solvent bank cannot signal its quality (or the state of the world) since it
are not known to the owner-manager ex-ante (cf. Stein, 1998). Also, liquidity risk insurance (along the
lines of Perotti and Suarez, 2009, or similar) can be ruled out. Since the insurer is unable to distinguish
illiquid from insolvent banks, any insurance will cover insolvent banks too.

12
refinancing even for a low refinancing need:
(1− ) + · +
. (2)
This is a sufficient condition, where on the right hand side the funds that are not
withdrawn (1− ) carry a risk-free interest rate, while the funds which the bank has
to refinance carry a rate adjusted for the posterior probability of solvency, (+ ).
Clearly, this implies that a bank faced with a more significant withdrawal is also
unable to refinance.
We can now formulate the following result on the existence of liquidity risk.
Lemma 1 There exist parameter values such that a bank can attract initial funding at
date 0, but cannot refinance in case of solvency concerns (a negative signal) at date 1.
In that case, some solvent banks are liquidated.
The parameter values under which Lemma 1 holds are given by (1) and (2). The
two inequalities are satisfied simultaneously, for example, for + 1, (where
“” stands for “much smaller”), and a that is not too close to zero.
To streamline exposition, in the main model we assume that the date 0 initial fund-
ing is attracted at the risk-free interest rate of 0, as in the case of not priced deposit
insurance. To model refinancing frictions, we maintain that the date 1 refinancing is
not covered by deposit insurance and is risk-sensitive. This corresponds to the prac-
tice where banks use market-based wholesale funding to manage intermediate liquidity
needs, such as deposit outflows. This assumption does not affect the properties of the
model; in fact, it makes our results weaker. The key friction of the model is that the
bank’s owner-manager chooses insufficient hedging because she does not internalize the
part of the benefits of success that accrues to the bank’s creditors. When bank fund-
ing is risk-sensitive, it is attracted at a higher interest rate. The bank owes more to
the creditors, making the owner-manager’s decisions more distorted. To verify this, in
Appendix A, we present a version of the model that incorporates risk-sensitive debt.

13
3.3 Risk Management Tools
The bank has two instruments of liquidity risk management.
Liquidity buffer First, a bank can accumulate a liquidity buffer. A bank can attract
additional funds at date 0 and invest them in short-term assets, such as cash or easily
tradeable securities that can be liquidated at any time, but produce a return of 0.
Holding liquidity is costly, since the bank incurs a per-unit cost of effort to maintain
a larger balance sheet.
The size of the liquidity buffer required to cover a refinancing need is given by:
(1 + ) · = , (3)
where the left-hand side is the refinancing need (1 is the funding for the investment
project, and is the funding for the liquidity buffer), and the right-hand side is the size
of the liquidity buffer. This makes:
=
1− . (4)
Accordingly, the cost of maintaining a liquidity buffer to cover small refinancing needs
is .
Note that, since we took = 1, no liquidity buffer can cover a large refinancing
need: all funding has to be refinanced, so the bank would need to have only liquid
assets.6 Finally, we assume that if a bank is liquidated at date 1, or if it does not use
6The fact that liquidity buffers cannot be used to cover large refinancing needs is consistent with
practice. For example, the Basel III Liquidity Coverage Ratio requires banks to hold sufficient liquidity
to cover outflows only over a relatively short period of 30 days. This acknowledges that the use of
liquidity buffers to insure larger refinancing needs is not optimal.
We model the fact that liquidity buffers cannot be used to cover large outflows by assuming that
in the case of large outflows the bank has to refinance all initial funding: = 1. To manage such
outflows internally, all bank funding should be put into liquid assets. This corresponds to practitioners’
arguments that large liquidity buffers “crowd out” the bank’s core business — their economic role,
maturity transformation. An alternative setup would have been to keep 1 but impose a condition
that the cost of maintaining a liquidity buffer necessary to cover such outflows, ((1−)) · , is sohigh that it makes bank profit negative. This would correspond to another practitioners’ notion, that
large liquidity buffers are “too costly”.

14
the liquidity buffer, the bank returns the liquidity buffer to creditors in its entirety at
date 1.
Transparency Second, a bank can adopt transparency. Transparency is an ex-ante
(date 0) decision that enables a more effective communication of bank asset values to
outsiders (see Section 2). In case of a negative signal at date 1, a transparent solvent
bank can communicate its solvency to investors (and obtain funding) with probability
. With probability 1− , the bank is still unable to “prove” solvency and cannot obtainrefinancing. The imperfect, probabilistic nature of transparency is driven by the fact
that it relies on ex-post communication. Even for a bank that has put in place all the
necessary preconditions, the communication may sometimes be ineffective, and then
the refinancing will not be forthcoming. The cost of transparency is that the bank’s
owner-manager loses private benefits of control .
For certainty we impose that, on the margin, the bank prefers hedging to no hedging,
and liquidity buffers to transparency.
4 Liquidity risk management
We now derive the first best and the bank’s private choices of liquidity buffers and
transparency.
4.1 First best
In the first best, the bank’s risk management strategy maximizes the social welfare,
defined as the joint surplus of the bank’s owner-manager and creditors (and equivalent
to the NPV of the bank). The bank chooses between four strategies. The first strategy
is to do nothing. The second strategy is to accumulate a liquidity buffer . It will protect
a solvent bank in a liquidity crisis with probability (if the refinancing need is small).
The third strategy is to adopt transparency. It will protect a solvent bank in a liquidity

15
crisis with probability (when ex-post communication is effective). The final strategy
is to adopt both a liquidity buffer and transparency.
Payoffs We derive the social welfare under different hedging strategies. When a
bank does not hedge liquidity risk (no liquidity buffer and no transparency), the social
welfare is:
= (1− (+ )) − +, (5)
where the first term on the right hand side is the probability of success times the payoff
in success, is the cost of effort for an initial balance sheet of size 1, and are the
private benefits.
When a bank has a liquidity buffer only, the social welfare is:
= (1− (+ ) + ) − − +. (6)
Note the changes in the right hand side compared to (5). The probability of success
increases by : the risk of an incorrect negative signal on solvency times the probability
that the withdrawals are low (so that the liquidity buffer is sufficient to cover the
refinancing need). The additional term − is the cost of effort associated with holdingthe liquidity buffer.
When a bank is transparent only, the social welfare is:
= (1− (+ ) + ) − . (7)
The probability of success now increases by where is the probability that ex-post
communication is effective. Compared to (5), the right hand side misses the private
benefits , reflecting the cost of transparency.
When a bank is both liquid and transparent, the social welfare is:
= (1− (+ ) + ( + − )) − − . (8)

16
This is a combination of the costs and benefits of (6) and (7). In the probability of suc-
cess, the term − represents a probability that a bank experiences a small refinancingneed (which can be covered from a liquidity buffer) at the time as when transparency
is effective and enables external refinancing. Then, one of the two bank’s hedges is
redundant ex-post.
Preferences We can now derive the first best hedging strategy. The social preferences
are determined on the balance between the costs and benefits of hedging. It is optimal,
for a bank without a hedge, to be liquid when ≤, giving:
≤ , (9)
where the left hand side is the cost of holding a liquidity buffer, and the right hand side
is the payoff from a higher probability of success.
Similarly, it is optimal, for a bank without a hedge, to be transparent when ≤ , giving:
≤ . (10)
In the choice between the two single hedges, a liquidity buffer is preferred to trans-
parency for ≥ , giving:
− ≤ ( − ), (11)
where the left hand side is the difference in cost, and the right hand side is the difference
in the probabilities of success times the payoff in success.
Finally, it is optimal for a bank to be both liquid and transparent for ≤
and ≤ , corresponding to:
½ ≤ (1− )
≤ (1− ). (12)

17
The right-hand sides show the marginal benefit of an additional hedge for a bank that
already has another hedge. Note that the marginal benefit of the second hedge (in (12))
is lower than that of the first hedge (on the right-hand side in (9) and (10)). This means
that the two hedges are strategic substitutes: when one hedge is already in place, the
additional value of another diminishes. This is because of the probability that one
of the two hedges is redundant ex-post (see (8)).
Taking the above inequalities together allows us to describe the bank’s first best
hedging strategy, shown in Figure 3. In the figure, the horizontal axis measures the cost
of maintaining the liquidity buffer, , and the vertical axis — the cost of transparency,
. There are four areas. When the costs of liquidity buffers and transparency are high,
it is optimal that a bank does not hedge: the area , with the boundary given by (9)
and (10). When the costs of hedging are intermediate, it is optimal that a bank uses
either a liquidity buffer or transparency to hedge liquidity risk; the choice between the
two is determined by (11). When the costs are low enough, it is optimal that a bank
uses both hedges: area , with the boundary given by (12).
Proposition 1 Both liquidity buffers and transparency can be socially desirable com-
ponents of bank liquidity risk management. When the costs of liquidity buffers and
transparency are low enough, it is optimal that a bank combines them in its liquidity risk
management.
Proposition 1 establishes that, in the first best, a bank may combine liquidity buffers
and transparency in its risk management. Liquidity buffers fully insure small refinancing
needs, while transparency provides a partial hedge for large withdrawals.
4.2 Private Risk Management Choices
We can now analyze private risk management choices.
Payoffs The bank owner-manager’s payoffs Π are similar to the corresponding levels
of social welfare, with the difference that the owner-manager only internalizes the cost

18
of bank funding in case of success. This is a standard effect driven by limited liability.
When a bank does not hedge liquidity risk, the owner-manager’s payoff is:
Π = (1− (+ )) ( − 1)− +. (13)
Note how compared to (5) the owner-manager’s payoff in success is reduced by the cost
of funding: the multiplier to the probability of success is ( − 1) instead of . Thesame difference will appear in the rest of private payoffs (as compared to (6)-(8)).
When a bank has a liquidity buffer, the payoff is:
Π = (1− (+ ) + ) ( − 1)− − +. (14)
When a bank is transparent, the payoff is:
Π = (1− (+ ) + ) ( − 1)− . (15)
When a bank is both liquid and transparent, the owner-manager’s payoff is:
Π = (1− (+ ) + ( + − )) ( − 1)− − . (16)
Preferences As with the social preferences, the banker’s preferences are determined
on the balance between the costs and benefits of hedging. The difference, however, is
that the bank’s owner-manager does not internalize the full benefit of hedging since a
part of that benefit accrues to the bank’s creditors in the form of safer claims.
The bank’s owner-manager prefers that a bank is at least liquid for Π ≤ Π giving:
≤ ( − 1) . (17)

19
The left-hand side is the cost of holding a liquidity buffer. It is the same as in (9),
implying that the cost is fully internalized by the bank’s owner-manager. The right-
hand side is the benefit of hedging for the bank’s owner manager. Note that it is lower
than the social benefit of hedging in (9): the owner-manager internalizes only her own
payoff in case of success ( − 1), not the full social payoff that includes benefits that
accrue to creditors. This means that the owner-manager disregards the positive effect of
hedging on creditors’ claims, and will only choose to hold a liquidity buffer for a lower
cost of hedging. The same holds for the rest of hedging decisions.
The bank’s owner-manager prefers that a bank is at least transparent for Π ≤ Π giving:
≤ ( − 1) . (18)
The bank’s owner-manager prefers liquidity over transparency for Π ≥ Π giving:
− ≤ ( − ) ( − 1) . (19)
And the bank’s owner-manager prefers to have both transparency and liquidity for
Π ≤ Π and Π ≤ Π , corresponding to:
½ ≤ (1− ) ( − 1) ≤ (1− ) ( − 1) . (20)
Figure 4 depicts the private risk management choices and compares them to the first
best. Note that the threshold lines separating private hedging choices are below and to
the left of the respective lines for the first best hedging choices. This implies that a bank
can choose insufficient hedging. In particular, there exist parameter values (represented
by an area in light gray) such that the bank privately chooses to use only one hedge (a
liquidity buffer or transparency), while it is socially optimal that the bank is both liquid
and transparent.
Proposition 2 A bank’s owner-manager may choose a level of liquidity risk hedging

20
that is insufficient from the social welfare perspective. There exist parameter values such
that it is socially optimal that a bank adopts both liquidity buffers and transparency, while
it privately chooses to have only one or the other.
From (9)-(12) and (17)-(20), the bank is only liquid, while it is socially optimal that
it both liquid and transparent for:
⎧⎪⎪⎪⎪⎨⎪⎪⎪⎪⎩(1− ) ( − 1) ≤ (1− )
≤ (1− )
− ≤ ( − ) ( − 1)
, (21)
and the bank is only transparent, while it is socially optimal that it both liquid and
transparent for: ⎧⎪⎪⎪⎪⎨⎪⎪⎪⎪⎩(1− ) ( − 1) ≤ (1− )
≤ (1− )
− ( − ) ( − 1)
. (22)
The reason why a bank under-insures against liquidity risk is that, under limited
liability, the owner-manager does not internalize the full benefit of hedging (Jensen and
Meckling, 1976).7 Having established the market failure, we can now proceed to the
analysis of regulation.
5 Regulation
Suboptimal hedging justifies policy intervention. This section studies the implications
of our model for the optimal regulatory design. We start by observing that regulation
can directly affect bank liquidity buffers (through liquidity requirements). However reg-
ulation cannot directly affect bank transparency choices because transparency is not
verifiable. Indeed, while some components of transparency are amenable to regulation
7There may be more reasons for banks to be insufficiently insured: banks may not internalize the
systemic externalities of failure (Acharya and Yorulmazer, 2007) or expect a bailout in case of distress
(Mailath and Mester, 1994, Ratnovski, 2008).

21
(e.g. formal disclosure), others are not (the credibility of disclosure, the endogenous
production of information, the choice of the organizational structure; see Section 2).
Regulating only the verifiable components of transparency may be insufficient (as there
are non-verifiable determinants too) and ineffective (e.g. a bank may manipulate in-
formation, making formal disclosure not credible). Hence, transparency is largely an
endogenous decision of a bank.
We proceed in steps. We first establish what happens if the regulator only regulates
liquidity buffers, and then discuss ways of influencing the bank’s choice of transparency.
5.1 The Unintended Effects of Liquidity Requirements
Consider the case where authorities can regulate only one dimension of bank liquidity risk
management, liquidity buffers, while also another dimension, transparency, is important
for hedging liquidity risk. Section 4 showed that liquidity buffers and transparency are
strategic substitutes: a bank with one hedge has lower incentives to adopt another. This
brings a question of whether liquidity requirements may have an unintended effect of
compromising bank transparency choices.
To study this, consider a set of parameter values that satisfies (22). For such para-
meters, a bank chooses to be transparent, but to have no liquidity buffers. At the same
time, in the first best the bank should have both liquidity buffers and transparency.
We ask what are the consequences of introducing liquidity requirements (compulsory
liquidity buffers) on such a bank.
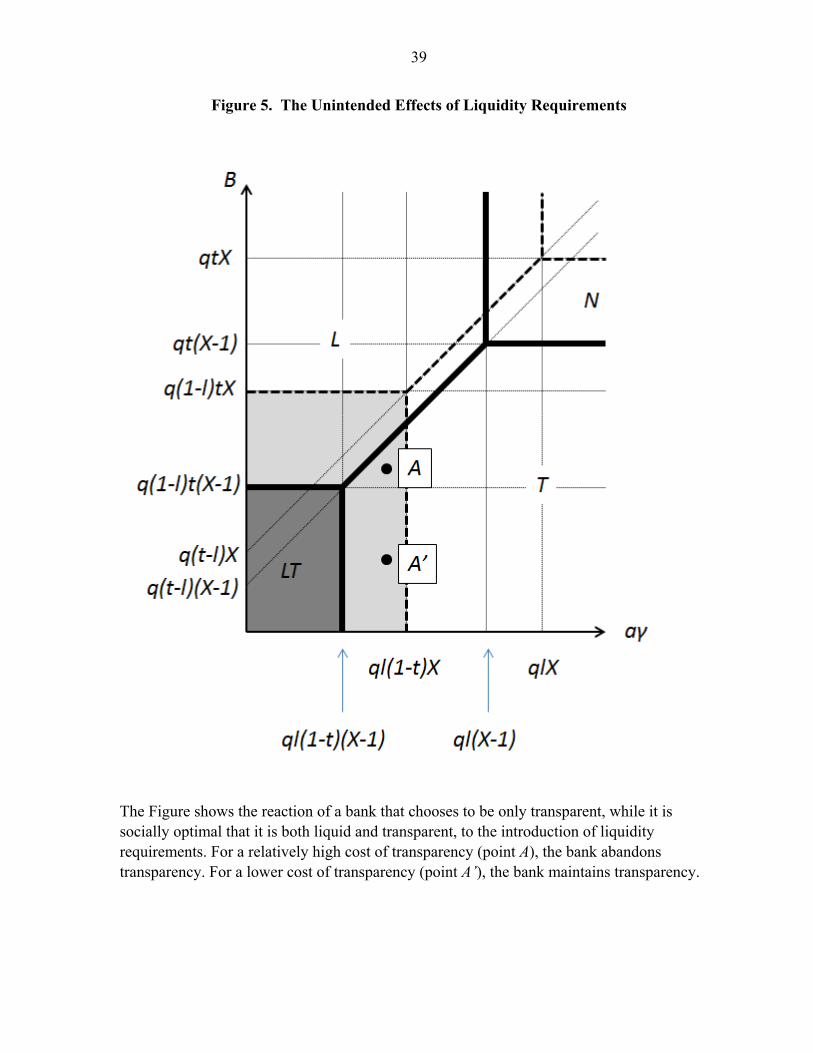
There can be two outcomes, depicted in Figure 5. For a low cost of transparency
(point 0) such that:
≤ (1− ) ( − 1) , (23)
corresponding to the second condition in (20), the bank will choose to maintain trans-
parency. Liquidity requirements will ensure the presence of liquidity buffers and the
bank’s liquidity risk management will become socially optimal.

22
However for a higher cost of transparency (point ) such that:
(1− ) ( − 1) , (24)
the bank will choose to forego transparency in response to liquidity requirements. The
reason is that an exogenously imposed liquidity buffer protects the bank against small
refinancing shocks. Then the value of maintaining transparency as an additional hedge
against large shocks diminishes compared to the conditions when the bank used trans-
parency to respond to both large and small refinancing needs. Note that the bank’s shift
from transparency to liquidity buffers is detrimental to social welfare. Indeed, point
is below the social welfare indifference line between liquidity buffers and transparency
(11), suggesting that transparency was a more cost-effective hedge. Moreover, for ,
the shift from transparency to liquidity also represents an increase in bank refinancing
risk in response to liquidity requirements.
Proposition 3 There exist parameter values such that a transparent bank responds to
liquidity requirements by abandoning transparency. This reduces social welfare, and rep-
resents an unintended effect of liquidity requirements.
The proposition establishes the key policy-relevant result of the paper. While liq-
uidity requirements may be desirable due to banks’ insufficient hedging of liquidity risk,
they may have unintended consequences: compromise bank transparency choices.
A natural question may arise as to how likely this problem is to appear in practice.
A reduced form model such as ours is not well-suited to provide a general answer to
this question. However, in Appendix B, we offer a quantitative example with a set
of plausible parameter values for which the results of the model hold: banks choose
suboptimal liquidity risk management (only transparency), and liquidity requirements
compromise bank transparency choices. In fact, the range of parameters for which
liquidity requirements compromise bank transparency choices appears to be wider than
the range of parameters for which they do not. This suggests that the effects described
in the model are plausible and reasonably likely.
23
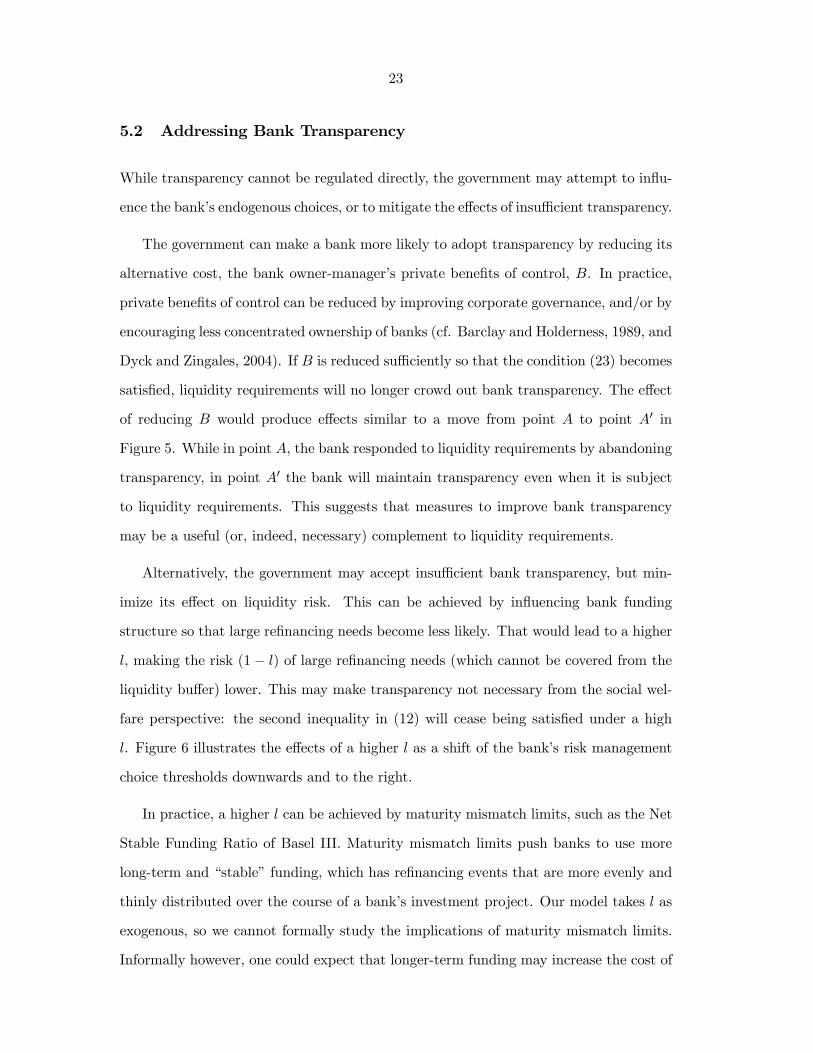
5.2 Addressing Bank Transparency
While transparency cannot be regulated directly, the government may attempt to influ-
ence the bank’s endogenous choices, or to mitigate the effects of insufficient transparency.
The government can make a bank more likely to adopt transparency by reducing its
alternative cost, the bank owner-manager’s private benefits of control, . In practice,
private benefits of control can be reduced by improving corporate governance, and/or by
encouraging less concentrated ownership of banks (cf. Barclay and Holderness, 1989, and
Dyck and Zingales, 2004). If is reduced sufficiently so that the condition (23) becomes
satisfied, liquidity requirements will no longer crowd out bank transparency. The effect
of reducing would produce effects similar to a move from point to point 0 in
Figure 5. While in point , the bank responded to liquidity requirements by abandoning
transparency, in point 0 the bank will maintain transparency even when it is subject
to liquidity requirements. This suggests that measures to improve bank transparency
may be a useful (or, indeed, necessary) complement to liquidity requirements.
Alternatively, the government may accept insufficient bank transparency, but min-
imize its effect on liquidity risk. This can be achieved by influencing bank funding
structure so that large refinancing needs become less likely. That would lead to a higher
, making the risk (1− ) of large refinancing needs (which cannot be covered from the
liquidity buffer) lower. This may make transparency not necessary from the social wel-
fare perspective: the second inequality in (12) will cease being satisfied under a high
. Figure 6 illustrates the effects of a higher as a shift of the bank’s risk management
choice thresholds downwards and to the right.
In practice, a higher can be achieved by maturity mismatch limits, such as the Net
Stable Funding Ratio of Basel III. Maturity mismatch limits push banks to use more
long-term and “stable” funding, which has refinancing events that are more evenly and
thinly distributed over the course of a bank’s investment project. Our model takes as
exogenous, so we cannot formally study the implications of maturity mismatch limits.
Informally however, one could expect that longer-term funding may increase the cost of

24
funds, adding some per-unit to the cost of the liquidity buffer. In Figure 6, this would
imply a shift from point to 00. In any case, either point lays above the social welfare
indifference line for the choice of transparency in the presence of liquidity buffers (given
by the second inequality in (12)), so that transparency is no longer required in order
to maximize social welfare. Then, liquidity requirements and maturity mismatch limits
can ensure that the bank’s liquidity risk management choices are socially optimal.8
6 Conclusion
The paper emphasized that both liquidity buffers and — in a novel perspective — bank
transparency (better communication that enhances access to external refinancing) are
important in bank liquidity risk management. In a liquidity event, a liquidity buffer
can cover small withdrawals with certainty. Transparency allows the bank to refinance
large withdrawals too, but it is not always effective. Banks may choose insufficient
liquidity and transparency; the optimal policy response is constrained by the fact that
bank transparency is not verifiable.
The paper offers important policy implications, particularly for the ongoing liquidity
regulation debate. The results caution that the focus on liquidity requirements needs
to be complemented by measures to improve bank transparency and access to market
refinancing. Without such measures, liquidity requirements may not achieve the full
potential of improvements in social welfare, and under some conditions may have unin-
tended effects. We also highlight the need for better corporate governance as a way to
improve bank transparency, and the scope to use net stable funding ratios to increase
the effectiveness of liquidity requirements.
8Note however that while stable funding ratios may make liquidity requirements more effective (and
bank transparency not necessary), their overall welfare effect remains ambiguous. In particular, it may
be negative if longer-term bank funding is associated with deadweight costs or is distortive (e.g. makes
banks unable to perform their liquidity insurance function, or compromises the monitoring of banks by
their creditors — reduces market discipline; see also Footnote 4).

25
References
[1] Acharya, V.V., T. Yorulmazer, 2007, “Too Many to Fail — An Analysis of Time-
inconsistency in Bank Closure Policies,” Journal of Financial Intermediation, 16(1):
1-31.
[2] Admati, A., P. Pfleiderer, 2000, “Forcing Firms to Talk: Financial Disclosure Reg-
ulation and Externalities,” Review of Financial Studies, 13(3): 479-519.
[3] Anderson, R. C., A. Duru, D. M. Webb, 2009, “Founders, heirs, and corporate
opacity in the United States,” Journal of Financial Economics, 69(2): 205-22.
[4] Atanasov, V.A., B.S. Black, C.S. Ciccotello, and S.B. Gyoshev (2010) “How Does
Law Affect Finance? An Examination of Equity Tunneling in Bulgaria,” Journal
of Financial Economics, 96(1): 155-73.
[5] Barclay, M.J., C.G. Holderness, 1989, “Private Benefits from Control of Public
Corporations,” Journal of Financial Economics, 25(2): 371-95.
[6] Basel Committee [on Banking Supervision, The], 2010, “Basel III: International
Framework for Liquidity Risk Measurement, Standards and Monitoring”.
[7] Bennet, P., S. Peristiani, 2002, “Are US Reserve Requirements still Binding?”
FRBNY Economic Policy Review, 8(1).
[8] Berger, A.N., G.A. Hanweck, D.B. Humphrey, 1987, “Competitive Viability in
Banking: Scale, Scope, and Product Mix Economies,” Journal of Monetary Eco-
nomics, 20(3): 501-520
[9] Berger, A.N., S.D. Bonime, D.M. Covitz, D Hancock, 2000, “Why Are Bank Profits
So Persistent? The Roles of Product Market Competition, Informational Opacity,
and Regional/Macroeconomic Shocks,” Journal of Banking and Finance, 24(7):
1203-35.

26
[10] Berger, A.N., N.H. Miller, M.A. Petersen, R.G. Rajan, J.C. Stein, 2005, “Does
Function Follow Organizational Form? Evidence from the Lending Practices of
Large and Small Banks,” Journal of Financial Economics, 76(2): 237-69.
[11] Boot, A.W.A., A. Thakor, 2000, “Can Relationship Banking Survive Competition?”
Journal of Finance, 55(2): 679-713.
[12] Boot, A.W.A., A. Thakor, 2001, “The Many Faces of Information Disclosure,”
Review of Financial Studies, 14(4): 1021-1057.
[13] Calomiris, C.W., C.M. Kahn, 1991, “The Role of Demandable Debt in Structuring
Optimal Banking Arrangements,” American Economic Review, 81(3): 497-513.
[14] Calomiris, C.W., 1999, “Building an Incentive Compatible Safety Net,” Journal of
Banking and Finance, 23: 1499-1519.
[15] Carlin, B.I., G. Manzo, 2011, “Obfuscation, Learning, and the Evolution of Investor
Sophistication,” Review of Financial Studies, 24(3): 754-85.
[16] Carlin, B.I., 2009, “Strategic Price Complexity in Retail Financial Markets,” Jour-
nal of Financial Economics, 91: 278-287.
[17] Chaplin, G., A. Emblow, I. Michael, 2000, “Banking System Liquidity: Develop-
ments and Issues,” Bank of England Financial Stability Review, Dec: 93-112.
[18] Chari, V.V., R. Jagannathan, 1988, “Banking Panics, Information, and Rational
Expectations Equilibrium,” Journal of Finance, 43: 749-61.
[19] Chen, Y, I. Hasan, 2006, “The Transparency of the Banking System and the Ef-
ficiency of Information-Based Bank Runs,” Journal of Financial Intermediation,
15(3): 307-331.
[20] Diamond, D.W., P.H. Dybvig, 1983, “Bank Runs, Deposit Insurance, and Liquid-
ity,” Journal of Political Economy, 91(3): 401-419.

27
[21] Diamond, D.W., R.G. Rajan, 2001, “Liquidity Risk, Liquidity Creation, and Fi-
nancial Fragility: A Theory of Banking,” Journal of Political Economy, 109(2):
287-327.
[22] Doidge, C., 2003, “U.S. Cross-Listings and the Private Benefits of Control: Evi-
dence from Dual-Class Firms,” Journal of Financial Economics, 72(3): 519-553.
[23] Doidge, C., G.A. Karoliy, K.V. Lins, D.P. Miller, R.M. Stulz, 2009, “Private Ben-
efits of Control, Ownership, and the Cross-Listing Decision,” Journal of Finance,
64(1): 425-66.
[24] Dyck, A., L. Zingales, 2004, “Private Benefits of Control: An International Com-
parison,” Journal of Finance, 59(2): 537-600.
[25] Farhi, E., J. Tirole, 2012, “Collective Moral Hazard, Maturity Mismatch, and Sys-
temic Bailouts,” American Economic Review, 102(1): 60-93.
[26] Flannery, M., 1996, “Financial Crises, Payment System Problems, and Discount
Window Lending,” Journal of Money, Credit and Banking, 28(4): 804-24.
[27] Flannery, M.J., S.H.Kwan, M. Nimalendran, 2010, “The 2007-09 Financial Crisis
and Bank Opaqueness,” FRB of San Francisco Working Paper 2010-27.
[28] Freedman, P., R. Click, 2006, “Banks that Don’t Lend? Unlocking Credit to Spur
Growth in Developing Countries,” Development Policy Review, 24(3), 279-302.
[29] Freixas, X., B.M. Parigi, J.-C. Rochet, 2004, “The Lender of the Last Resort: A
Twenty-First Century Approach,” Journal of the European Economic Association,
2(6): 1085-1115.
[30] Gatev, E., T. Schuermann, P.E. Strahan, 2004, “How do Banks Manage Liquidity
Risk? Evidence from Equity and Deposit Markets in the Fall of 1998,” NBER
working paper 10982.
28
[31] Gatev, E., P.E. Strahan, 2006, “Banks’ Advantage in Hedging Liquidity Risk: The-
ory and Evidence from the Commercial Paper Market,” Journal of Finance 61(2):
867-92.
[32] Griffin, Paul K., S. Wallach, 1991, “Latin American Lending by Major U.S. Banks:
The Effects of Disclosures about Nonaccrual Loans and Loan Loss Provisions,”
Accounting Review, 86(4): 830-846.
[33] Gonzalez-Eiras, M., 2004, “Banks’ Liquidity Demand in the Presence of a Lender
of Last Resort,” Universidad de San Andres (Buenos Aires) Working Paper.
[34] Goodfriend, M., R.G. King, 1998, “Financial Deregulation, Monetary Policy,
and Central Banking,” Federal Reserve Bank of Richmond Economic Review,
May/June: 3-22.
[35] Holmstrom, B., J. Tirole, 1998, “Private and Public Supply of Liquidity,” Journal
of Political Economy, 106(1): 1-40.
[36] Holmstrom, B., J. Tirole, 2011, Inside and Outside Liquidity, MIT Press.
[37] Holod, D., J. Peek, 2005, “Asymmetric Information and Liquidity Constraints: A
New Test,” FDIC Center for Financial Research Working Paper 2005-02.
[38] Huang, R., L. Ratnovski, 2011, “The Dark Side of Bank Wholesale Funding,”
Journal of Financial Intermediation 20(2): 248-63.
[39] Jensen, M.C., W. Meckling, 1976, “Theory of the Firm: Managerial Behavior,
Agency Costs and Ownership Structure,” Journal of Financial Economics 3(4):
305-60.
[40] Kashyap, A.K., J.C. Stein, 2000, “What do a Million Observations on Banks Say
about the Transmission of Monetary Policy?” American Economic Review, 90(3):
407-28.
29
[41] Leuz, C., D. Nanda, P.D. Wysocki, 2003, “Earnings Management and Investor
Protection: An International Comparison,” Journal of Financial Economics 69,
505-27.
[42] Mailath, G.J., L.J. Mester, 1994, “A Positive Analysis of Bank Closure,” Journal
of Financial Intermediation, 3(3): 272-299.
[43] Morgan, D.P., 2002, “Rating Banks: Risks and Uncertainty in an Opaque Industry,”
American Economic Review, 92: 874-88.
[44] Myers, S.C., R.G. Rajan, 1998, “The Paradox of Liquidity,” Quarterly Journal of
Economics, 113(3): 733-71.
[45] Ostberg, P., 2006, “Disclosure, investment and regulation,” Journal of Financial
Intermediation, 15(3): 285-306.
[46] Paravisini, D., 2007, “Local Bank Financial Constraints and Firm Access to Exter-
nal Finance,” Journal of Finance, 63(5): 2161-93.
[47] Perotti, E.C., E.-L. von Thadden, 2003, “Strategic Transparency and Informed
Trading: Will Globalization Force Convergence of Corporate Governance?” Journal
of Financial and Quantitative Analysis, 38(1): 61-85.
[48] Perotti, E.C., J. Suarez, 2009, “Liquidity insurance for systemic crises,” CEPR
Policy Insight 31.
[49] Povel, P., R. Singh, A. Winton, 2010, “Booms, Busts, and Fraud,” Review of Fi-
nancial Studies, 20(4): 1219-54.
[50] Ratnovski, L., 2008, “Bank Liquidity Regulation and the Lender of Last Resort,”
Journal of Financial Intermediation, 18(4): 541-588.
[51] Rochet, J.-C., X. Vives, 2004, “Coordination Failure and the Lender of Last Resort:
Was Bagehot Right After All?" Journal of the European Economic Association,
2(6): 1116-47.

30
[52] Stanhouse, B., 1986, “Commercial Bank Portfolio Behavior and Endogenous Un-
certainty," Journal of Finance, 41(5): 1103-14.
[53] Stein, J.C., 1998, “An Adverse-Selection Model of Bank Asset and Liability Man-
agement with Implications for the Transmission of Monetary Policy," RAND Jour-
nal of Economics, 29(3): 466-86.
[54] Wagner, W., 2007, “Financial development and the opacity of banks," Economics
Letters, 97(1): 6-10.

31
Appendixes
A A Model Without Deposit Insurance
In the main model, to streamline the exposition, we have assumed that initial bank
funding benefits from not priced deposit insurance, making the interest rate on it zero.
In this Appendix, we relax that assumption. Note that the interest rate on deposits does
not affect the first best risk management choices since they are based on maximizing
the joint surplus of the bank’s owner-manager and creditors. But the interest rate does
affect the private choices of the owner-manager, by increasing the amount that she has
to repay depositors in case of success. As a result, as we show here, allowing for risk-
sensitive debt increases the wedge between public and private liquidity risk management
preferences, strengthening our result that private choices may be suboptimal.
In the absence of deposit insurance, creditors charge a risky bank a positive interest
rate to compensate for risk and achieve zero expected return. For simplicity, we assume
that the date 0 funding for the investment project is segregated from the funding for the
liquidity buffer. Then the funding for the investment project is risky and is charged a
gross interest rate 1. Funding for the liquidity buffer is risk-free. Indeed, the buffer
is always repaid if the bank survives the intermediate date, and it is also, by assumption,
repaid in liquidations when a liquidity buffer is insufficient to cover a large liquidity need
or a bank is insolvent. Recall that, within our model, funding from date 1 to date 2 is
either risk-free or is not available.
Under risky funding, there is scope for multiple equilibria (when depositors charge
a higher interest rate, the manager may choose a riskier strategy). We assume that, in
case of multiple equilibria, depositors charge the lowest rate possible. Also, to simplify
the analysis, without a loss of generality, we take = .
It is useful to start the analysis from the case of most complete hedging. Assume
that the creditors expect the bank to be both liquid and transparent. Then they charge

32
the interest rate:
2 =1
1− (+ ) + ( + − ), (25)
where on the right hand side in the denominator is the probability of bank success. Under
the interest rate 2, the bank’s owner-manager will choose to be liquid and transparent
for (use expressions (20) substituting 2 into the cost of funds instead of 1) for:
½ (1− ) ( − 2)
(1− ) ( − 2). (26)
Since 2 1, the owner-manager will choose to be liquid and transparent only for lower
costs of hedging and compared to those is (20). This represents a narrower range
of parameter values, and a larger scope for distortions from first best risk management,
compared to the case when initial funding benefitted from not priced deposit insurance.
Similarly, if creditors expect the bank to be only liquid (or only transparent), the
interest rate will be:
1 =1
1− (+ ) +
µand =
1
1− (+ ) + , since we assumed =
¶. (27)
The bank will choose to be at least liquid (use expressions (17) and (18) substituting 1
into the cost of funds instead of 1) for:
( − 1) , (28)
and at least transparent for:
( − 1) . (29)
Again, since 1 1, there is a larger distortion from the first best compared to the
base model with not priced deposit insurance. Therefore, abandoning a simplifying
assumption of not priced deposit insurance strengthens the result of Proposition 2 that
bank choices of liquidity buffers and transparency may be suboptimal.
The bank will choose to be transparent, while it is socially optimal that it is both

33
liquid and transparent, and liquidity requirements will make the bank abandon trans-
parency for (use (12), (19), (24) substituting 1 into the cost of funds instead of 1, and
(26)): ½(1− ) ( − 2) (1− )
(1− ) ( − 1) . (30)
This confirms that the result of Proposition 3 that liquidity requirements may compro-
mise bank transparency choices is robust to introducing into the model risk-sensitive
debt.
B A Quantitative Example
The model is stylized, and showcases the existence of results. It is not well suited for
a calibration exercise. Yet, it is instructive to demonstrate that there exist plausible
parameter values, such that the key results of the model — a divergence of private and
socially optimal choices, and the fact that liquidity requirements may compromise bank
transparency choices — hold.
An example of such parameter values is offered below. These can be thought of as
describing bank returns and risk over a 10-year period.
• = 135, corresponding to a 35% per annum return on bank assets;
• = 008 and = 002, corresponding to a 1% a year risk of bank failure;
• = 009, giving = 01, corresponding to a liquidity buffer of 10% of bank
assets;
• = = 09, so that most shocks are small and transparency is most often effective.
The above parameter values satisfy (1) for 0215, and it is easy to verify that
they satisfy (2). Substituting the parameter values into (22) and applying the additional
restriction on obtains that the bank is only transparent while it is optimal that a bank

34
is both liquid and transparent for:
⎧⎪⎨⎪⎩ 0063 0215
10, (31)
and, using (20), the bank will abandon transparency in response to liquidity require-
ments for 00063.
To close the example, consider = 015 (corresponding to the administrative costs
of 15% per year), making 0015. For 00063 0015 the bank will abandon
transparency in response to liquidity requirements. For ≤ 00063, the bank will
maintain transparency even under liquidity requirements. Interestingly, in this example,
the range of values of for which liquidity requirements compromise bank transparency
choices is wider than the range of values of for which they don’t. This suggests that the
effects described in the model are plausible and reasonably likely to appear in practice.

35
Figure 1. The Timeline

36
Figure 2. The Information Structure
The Figure shows the probability distribution of bank fundamentals and of the intermediate signal. Although a bank is solvent with probability 1–s, it may nevertheless receive at an intermediate date a negative signal with probability q, which makes it unable to refinance.

37
Figure 3. Socially Optimal Liquidity Risk Management
The Figure shows the bank’s socially optimal liquidity risk management choices. The costs of hedging (aγ of holding a liquidity buffer and B of transparency) determine whether it is optimal that a bank has no hedges (area N), one hedge (areas L or T), or both hedges (area LT). Note: This and further figures are drawn for t>l.

38
Figure 4. Private Risk Management Choices
The Figure shows the bank’s private risk management choices (thick solid lines) and contrasts them with the first best (dashed lines, from Figure 3). In the light gray area, the bank privately chooses to be either liquid or transparent (only one hedge), while it is socially optimal that is it both liquid and transparent (two hedges).
39
Figure 5. The Unintended Effects of Liquidity Requirements
The Figure shows the reaction of a bank that chooses to be only transparent, while it is socially optimal that it is both liquid and transparent, to the introduction of liquidity requirements. For a relatively high cost of transparency (point A), the bank abandons transparency. For a lower cost of transparency (point A’), the bank maintains transparency.

40
Figure 6. Maturity Mismatch Limits
The Figure illustrates the effects of a higher probability l that a refinancing need is small. Compared to Figure 5, the threshold lines for private and socially optimal choices shift down and to the right (as shown by arrows; from grey to black lines). If a larger l is achieved through the use of longer-term bank funding (which may be costlier, by r), point A shifts to A’’. Either point is above the new position of the indifference line q(1-l)tX, implying that transparency is not anymore necessary for socially optimal liquidity risk management.