liquefaction potential analysis of...
TRANSCRIPT
International Journal of Science, Engineering and Technology Research (IJSETR), Volume 4, Issue 8, August 2015
2945 ISSN: 2278 – 7798 All Rights Reserved © 2015 IJSETR
LIQUEFACTION POTENTIAL ANALYSIS OF RAMGARH TAAL PROJECT IN
GORAKHPUR CITY
1Nitish Kumar Chaudhary
2Dr. S. M. Ali Jawaid
3Ms. Sana Zafar
1PG Student
2Head of Department
3Assistant Professor
1,2,3Department of Civil Engineering
1,2,3Madan Mohan Malaviya University of Technology, Gorakhpur, U.P.,India, 273010
Abstract
Liquefaction is one of the main effects of an earthquake that is responsible to structural failure and damage to roads, pipelines and
infrastructures. Liquefaction is one of the major types for ground failure. Liquefaction is a soil behavior phenomenon in which a
saturated soil losses a substantial amount of strength due to high excess pore-water pressure generated by and accumulated during
strong earthquake ground shaking. The devastating damage of liquefaction induced ground failures in the Alaska 1964 and Niigata
1964 earthquakes serve as a clear reminder of such events. Liquefaction is one of the ground failures in potential earth science hazard. Soil liquefaction has been a major cause of damage to soil structure, lifelines and building foundation. Zoning for
liquefaction, therefore, has been an important goal for seismic hazard mitigation.
Ramgarh Taal, a natural lake, which is situated to the southeast of Gorakhpur in Uttar Pradesh. Since Gorakhpur falls in the area
with high seismic probability (seismic zone IV), there is need for the assessment of liquefaction potential, so the study area is
“Ramgarh Taal project” to recognize the conditions that exist in a soil deposit before an earthquake in order to identify
liquefaction.
The main aim of the present work is analyse the liquefaction potential and to prepare the liquefaction hazard zonation map of
“Ramgarh Taal Project” in Gorakhpur city using SPT data collected from the various sites of project by simplified procedure of
Seed & Idriss and Idriss & Boulanger.
Determination of liquefaction potential due to earthquake is complex geotechnical problem. Many factors including soil
parameters and seismic characteristics influence this phenomenon. To assess the liquefaction hazard in an area, it is important to
examine the geotechnical characteristics like grain size distribution, percentage of silt, water table, water table depth and SPT „N‟
value. The percentage of silt and poorly graded sand is high in the area under “Ramgarh Taal Project” indicating that there is a
great chance of soil liquefaction. Here liquefaction potential analysis is done to determine the factor of safety at different depth.
The liquefaction is severe in the “Ramgarh Taal Project” due to the presence of silt and poorly graded sand. So the assessmen t of
liquefaction and preparation of liquefaction potential map helps us to select a suitable ground improvement technique and
foundation system for future correction in the region. This study helps us to mitigate the disastrous effect of liquefaction.
Keywords: Liquefaction, SPT, CSR, CRR, Seismic Hazard.
1. INTRODUCTION
As India experiencing lots of seismic threats and
liquefaction is one of the major types for ground failure.
Liquefaction is a phenomenon of soil behavior in which a saturated soil looses of strength due to high excess pore-
water pressure generated and accumulated during strong
earthquake ground shaking. The devastating damage of
liquefaction induced ground failures in the Alaska 1964 and
Niigata (Japan) 1964 earthquakes serve as a clear example
of such events. Large numbers of liquefaction studies were
conducted in all the earthquake prone areas of the world.
After the 2001 Bhuj earthquake and recently 2015 Nepal
earthquake attracted the great attention on liquefaction
studies.
During earthquakes the shaking of ground may cause a loss
of strength or stiffness those results in the settlement of buildings, landslides, and the failure of earth dams or other
hazards.
Soil liquefaction has been a major cause of damage to soil
structure, lifelines and building foundation. Zoning for
liquefaction, therefore, has been an important goal for
seismic hazard mitigation. This situation has created the
necessity for carrying out a detailed seismic hazard
assessment of the city and an awareness building measures
to the people of Gorakhpur regarding the earthquake safety.
It is also important to carry out more earthquake
vulnerability reduction programs in Gorakhpur.
Ramgarh Taal is a natural lake and it is situated to the southeast of Gorakhpur in Uttar Pradesh. It covers an area of
about 723 ha. The catchment area around the lake is
approximately 1632 acres, out of which, 1235 acres land is
under the Gorakhpur Development Authority (GDA). As we
know that Gorakhpur is under seismic zone (IV) the need of
liquefaction analysis requires the characterization of soil
profile.
Gorakhpur region is potentially prone to damaging earthquakes, as it is located in an active seismic zone IV.

International Journal of Science, Engineering and Technology Research (IJSETR), Volume 4, Issue 8, August 2015
2946 ISSN: 2278 – 7798 All Rights Reserved © 2015 IJSETR
Because of the haphazard urbanization and increasing
population in the Gorakhpur region now, it has become very
essential to carry out studies on different aspects of the
earthquake hazard leading to long term earthquake
vulnerability reduction program.
Liquefaction is one of the main effects of an earthquake that is responsible to structural failure and damage to roads,
pipelines and infrastructures. In Gorakhpur region in spite of
weak subsurface condition, many tall buildings have been
built and the number is constantly rising. Most of these
buildings (Except commercial, governmental and
organizational buildings) have been constructed without
adequate research on the subsurface sediment conditions and
hence may run a high risk that they are not properly
designed to withstand the particular accelerations at the site.
Looking at this situation, the study on subsurface geology is
very important, as it helps for the study of seismic hazard
and hence for the earthquake vulnerability reduction program.
The main aim of the thesis is to analyse the liquefaction
potential of “Ramgarh Taal Project” in Gorakhpur city using
SPT bore holes data collected from the various sites of
project by simplified procedure of Seed & Idriss and Idriss
& Boulanger. The geological, geotechnical, and
seismological details of this area have to be studied which
forms important parameters and information to analyse
Liquefaction potential of this region.
The main objectives of this work is to- 1. Estimate the maximum or equivalent cyclic shear stress
ratio (CSR).
2. Estimate the liquefaction resistance of soils using SPT
data (CRR).
3. Estimate the liquefaction potential of soil by calculating
factor of safety by Seed & Idriss and Idriss & Boulanger
method.
4. Comparison of above mentioned methods.
5. Prepare liquefaction hazard zonation map.
2.1 SOIL LIQUEFACTION
The phenomenon by which, soil particles below the water
table temporarily lose their strength and behave as a viscous
liquid rather than a solid known as soil liquefaction.
Liquefaction is the phenomena when there is loss of strength
in saturated and cohesion-less soils because of increased
pore water pressures and hence reduced effective stresses
due to dynamic loading. The phenomenon due to which, the stiffness and strength of a soil is decreased by earthquake
shaking or other rapid loading called liquefaction.
Liquefaction occurs in saturated soils and saturated soils are
those types of soils in which the void between the soil
particles is completely filled with water. A pressure on the
soil particles exerts due to this water. The water pressure is
however relatively low before the occurrence of earthquake.
But earthquake shaking increases the water pressure to the
point at which the soil particles can readily move with
respect to each other.
2.2. MECHANISM OF SOIL LIQUEFACTION
This is essential to understand the mechanism of soil
liquefaction, during earthquake why and where it occurs so
often. During the liquefaction, the water available in the soil
voids exerts a pressure upon the soil particles. If the pressure is low enough then the soil become stable. Pore water
pressure exerts a pressure on the soil particles that
influences how tightly the particles themselves are pressed
together. The water pressure is however relatively low
before the occurrence of earthquake. But earthquake shaking
increases the water pressure to the point at which the soil
particles can readily move with respect to each other.
Fig.1 Mechanism of soil liquefaction
2.3 CLASSIFICATION OF SOIL LIQUEFACTION
Robertson (1994) and Robertson et al. (1994) suggested a
fairly complete classification system to define “soil
liquefaction” and it can be summarized as:
2.3.1 FLOW LIQUEFACTION
It occurs when the static shear stress is greater than the shear
strength of the soil in its liquefied state. When liquefaction
occurs in such case the strength of the soil reduces and the
ability of soil deposit to support for the structure is reduced.
Flow liquefaction failures are characterized by the sudden
nature of their origin, the speed with which they develop and
the large distance cover over which the liquefied materials
often move.
2.3.2 CYCLIC MOBILITY
It occurs when the static shear stress is less than the shear
strength of the liquefied soil. During earthquake shaking, it
produces unacceptably large permanent deformation, which
is also known as lateral spreading. It can occur on very mild
sloping ground or on virtually flat ground adjacent to bodies
of water.
Flow liquefaction occurs much less frequently than cyclic
mobility but its effects are usually far more severe. Besides
these two types, Ground oscillation, loss of bearing strength and sand boils are common phenomena of Liquefaction.

International Journal of Science, Engineering and Technology Research (IJSETR), Volume 4, Issue 8, August 2015
2947 ISSN: 2278 – 7798 All Rights Reserved © 2015 IJSETR
2.4 CONDITIONS FOR SOIL LIQUEFACTION
For the liquefaction to occur in any place the following conditions should be met.
The soil must be susceptible to liquefaction (i.e. the soil
should be loose, water-saturated, sandy soil typically
between 0 and 10 meters below the ground surface).
Ground shaking must be strong enough to cause
susceptible soils to liquefy.
Ground water should lie within 15 meter deep inside the
surface
3.1. GEOLOGY OF GORAKHPUR
The district of Gorakhpur lies between Lat. 26°13′N and
27°29′N and Long. 83°05′E and 83°56′E. Gorakhpur has
also a lake Ramgarh Taal Lake, which is 18 km bigger. It is bigger than Dal Lake of Kashmir which is of 15.5 km
Ramgarh Taal. It's vast and provides home to various types
of fishes. Geography the peak of Dhaulagiri, some 8,230
meters above sea-level, is visible under favourable climatic
conditions as far south as Gorakhpur itself. The district
geology is primarily river born alluvium. This impasses a
very high risk of an earthquake disaster in Gorakhpur
resulting into great damage. To determine the potential hazard due to an earthquake appropriate site characterization
and determination of the soil properties are essential in order
to suitably design a structure.
Ramgarh Taal is a natural lake and it is situated to the
south-east of Gorakhpur in Uttar Pradesh. It covers an area
of about 723 ha. The catchment area around the lake is
approximately 1632 acres, out of which, 1235 acres land is
under the Gorakhpur Development Authority (GDA). As we
know that Gorakhpur is under seismic zone the need of
liquefaction analysis requires the characterization of soil
profile. So my work is to analyse the liquefaction potential
of an area and the liquefaction potential map.
Fig-2 Map of “Ramgarh Taal Project”
Fig.3 Map of Ramgarh Taal Project representing Location of Bore Holes

International Journal of Science, Engineering and Technology Research (IJSETR), Volume 4, Issue 8, August 2015
2948 ISSN: 2278 – 7798 All Rights Reserved © 2015 IJSETR
3.2 GENERATION OF SUBSURFACE DATA AND
DATA ACQUISITION
Collection and organization of data-extensive borehole data
is collected from various locations of Ramgarh Taal Project
and 10 borehole data were collected at different sites shown in fig 3.1 for liquefaction zonation. The collected
geotechnical data is in different formats depending upon the
source of organization and the particular project. Data is
then synthesized and was brought to common platform
needed for the geotechnical characterization and liquefaction
study. The data is given in appendix.
3.2.1 Data acquisition
Data acquisition is one of the most difficult parts of a
research work. For obtaining relevant data from different
institutions more personal relations and contacts are required, which is very time consuming.
3.2.2 Data management
All the data managed in a same platform so as to easily
accessible. Data used to analyse liquefaction potential of a
soil, Microsoft Excel 2007 and Microsoft Access were used
to store the borehole data which was collected during the
SPT test. Firstly the collected data were entered in the Excel sheets. After the data acquisition was completed, all the
boreholes were grouped according to their types and source
as shown in the tables given in appendix.
The deep bore holes samples and data are also used to study
the geological evaluation of the site. Three tables are
generated in this research work. One containing the
information such as: borehole id, site location, depth range,
geological information, Soil type, thickness of the strata,
SPT „N‟ value, corrected N-value and corrected SPT curve.
The second table includes the geotechnical information such
as: borehole-id, site location, depth range, particle size
distribution, consistency limit and soil classification. Third table also contains the geotechnical information such as
moisture content, bulk density, unit weight and shear
characteristics.
APPENDIX-1
Table: 1.BORELOG CHART AND SPT CURVE
Site: G.D.A. OFFICE BUILDING, SIDDHARTH ENCLAVE SCHEME, GORAKHPUR.
Bore Hole No-1
Table: 2. SUMMARY OF MECHANICAL GRADING AND CONSISTANCY LIMIT
Site: G.D.A. OFFICE BUILDING, SIDDHARTH ENCLAVE SCHEME, GORAKHPUR.
Bore Hole No -1

International Journal of Science, Engineering and Technology Research (IJSETR), Volume 4, Issue 8, August 2015
2949 ISSN: 2278 – 7798 All Rights Reserved © 2015 IJSETR
Table: 3. SUMMARY OF LABORATORY RESULTS
Site: PROPOSED G.D.A. OFFICE BUILDING, SIDDHARTH ENCLAVE SCHEME, GORAKHPUR
Bore Hole No-1
4. METHODOLOGY
4.1 Seed & Idriss Method:
The methodology is used to determine the liquefaction
potential of Ramgarh Taal using simplified procedure of Seed & Idriss (1971).The following steps are followed to
determine the liquefaction Potential.
Step 1:
The borehole data used to assess liquefaction susceptibility
included the location of the water table, SPT N value, soil
grain size, unit weight and fines content of the soil ( percent
by weight passing the IS Standard Sieve No. 76μ).
Step 2:
Summary of mechanical grading, consistency limits and
other laboratory test results such as (bulk density, moisture content, dry density and shear characteristics) were
obtained.
Step 3:
The total vertical stress (σvo) and effective vertical stress
(σ´vo) for all soil layers were evaluated.
Step 4: The following equation can be used to evaluate the stress
reduction factor rd
rd = 1 – 0.00765z for z ≤ 9.15m and
rd = 1.174 – 0.0267z for 9.15 < z ≤ 23m
Where “z” is the depth below the ground surface in meters.
Step 5:
The Critical stress ratio induced by the design earthquake,
CSR was calculated as:
CSR = 0.65 (amax / g) rd (σvo / σ'vo)
Where σvo and σ'vo are the total and effective vertical
stresses, respectively, at depth z, amax is the peak horizontal
ground acceleration (PHGA), and g is the acceleration due
to gravity.
Step 6: The standardized SPT blow count (N60) which is the
standard penetration blow count for a hammer with an
efficiency of 60 percent is now evaluated. The standardized
SPT blow count is obtained from the equation:
N60 = N.C60
Where, C60 is the product of various correction factors.
Now the normalized standardized SPT blow count, (N1)60
are calculated using
(N1)60 = CN N60
Where, Stress normalization factor CN is calculated from the
following expression:
CN = (Pa / σ'vo)0.5
Subjected to CN ≤ 2, where Pa is the atmospheric pressure.
However the closed form expression proposed by Liao and
Whitman (1986) may also be used:
CN = 9.79(1 / σ'vo)0.5
Step 7:
The CRR or the resistance of a soil against liquefaction is
estimated from Figure 4.1. for representative (N1)60 values
of the deposit.
Figure 4. Relationship between CRR and (N1)60 for Mw,
7.5 earthquake

International Journal of Science, Engineering and Technology Research (IJSETR), Volume 4, Issue 8, August 2015
2950 ISSN: 2278 – 7798 All Rights Reserved © 2015 IJSETR
Rauch (1998) approximated the clean-sand base curve by
the following equation:
This equation is valid for (N1)60 < 30. For (N1)60 ≥ 30 clean
granular soils are too dense to liquefy and are classified as
non-liquefiable. This equation may be used in spreadsheets
and other analytical techniques to approximate the clean-
sand base curve for routine engineering calculations.
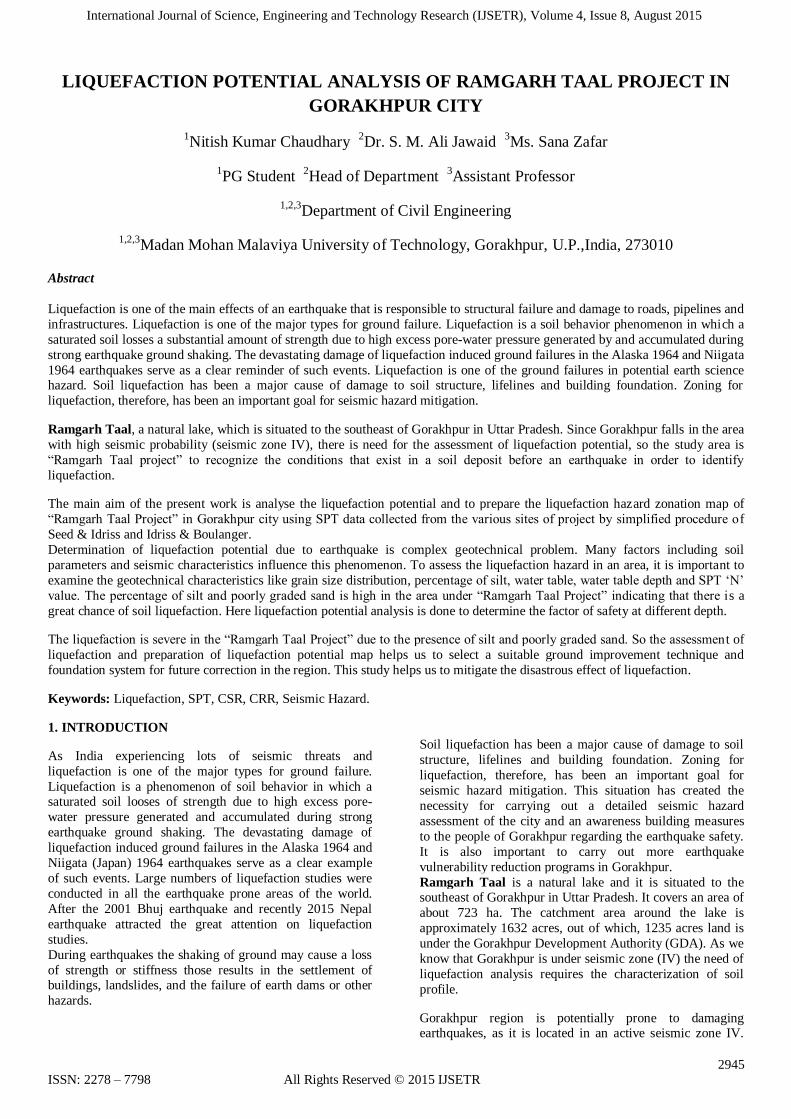
Step 8: The factor of safety against initial liquefaction, FS, is
calculated as:
FS = (CRR7.5/CSR) MSF
Where, CRR= Cyclic Resistance Ratio
CSR= Cyclic Stress Ratio
MSF= Magnitude Scaling Factor
In 2001 Youd and Idriss recommend the following equation
for obtaining MSF
MSF=102.24
/Mw2.56
Where, Mw= Magnitude of earthquake
When the design ground motion is conservative, earthquake-related permanent ground deformation is generally small if
FS ≥ 1.
4.2. Idriss & Boulanger Method :
The methodology is used to determine the liquefaction potential of Ramgarh Taal using procedure of Idriss &
boulanger. The following steps are followed to determine
the liquefaction Potential.
Step 1: The borehole data used to assess liquefaction susceptibility
included the location of the water table, SPT N value, soil
grain size, unit weight and fines content of the soil ( percent
by weight passing the IS Standard Sieve No. 76μ).
Step 2:
Summary of mechanical grading, consistency limits and
other laboratory test results such as (bulk density, moisture
content, dry density and shear characteristics) were
obtained.
Step 3:
The total vertical stress (σvo) and effective vertical stress
(σ´vo) for soil layers were evaluated.
Step 4:
The following equation can be used to evaluate the stress
reduction factor rd:
For Z ≤ 34m
rd = exp(α(z) + β(z)M)
α(z) = −1.012 − 1.126 sin((z ⁄ 11.73) + 5.133)
β(z) = 0.106 + 0.118 sin((z / 11.28 + 5.142)
For Z > 34m
rd = 0.12 exp(0.22M)
Where “z” is the depth below the ground surface in meters
M- Magnitude of the earthquake.
Step 5:
The Critical stress ratio induced by the design earthquake,
CSR was calculated as:
CSR = 0.65 (amax / g) rd (σvo/ σ'vo)
Where, σvo and σ'vo are the total and effective vertical
stresses, respectively, at depth z, amax is the peak horizontal
ground acceleration (PHGA), and g is the acceleration due
to gravity.
Step 6:
The standardized SPT blow count (N60) which is the
standard penetration blow count for a hammer with an
efficiency of 60 percent is now evaluated. The standardized
SPT blow count is obtained from the equation:
N60 = N.C60
Where, C60 is the product of various correction factors.
Now the normalized standardized SPT blow count, (N1)60
are calculated using
(N1)60 = CN N60
Where, Stress normalization factor CN is calculated from the following expression:
CN = (Pa / σ'vo)m
≤ 1.7
Where, m = 0.784 − 0.0768 √(N1)60
The equivalent clean sand SPT penetration resistance
(N1)60cs value for cohesionless soils is developed by Idriss
and Boulanger 2004, 2008
(N1)60cs = (N1)60 + Δ (N1)60
Δ (N1)60 is the equivalent clean-sand adjustment empirically derived by Idriss and Boulanger 2004, 2008. It is used to
account for the effects of fine content on CRR.
Δ (N1)60 = exp ( 1.63 + ( 9.7 / FC) – ( 15.7 / FC)2 )
FC = fines content
Step 7:
Now for assessing liquefaction susceptibility using the SPT
we compute cyclic resistance ratio, CRR
CRR = exp {((N1)60cs / 14.1) + ((N1)60cs / 126)2
–
International Journal of Science, Engineering and Technology Research (IJSETR), Volume 4, Issue 8, August 2015
2951 ISSN: 2278 – 7798 All Rights Reserved © 2015 IJSETR
((N1)60cs / 23.6)3 + ((N1)60cs / 25.4)
4 – 2.8}
Step 8:
The factor of safety against initial liquefaction, FS, is
calculated as:
FS = (CRR7.5/CSR) MSF
Where,
CRR= Cyclic Resistance Ratio
CSR= Cyclic Stress Ratio
MSF= Magnitude Scaling Factor
CRR of soils is affected by the magnitude scaling factor,
MSF. It is calculated based on the relation recommended by
Idriss (1999).
MSF = 6.9 exp (–M / 4) − 0.058
Where,
M = Magnitude of Earthquake
Liquefaction is predicted to occur when FS ≤ 1.0, and
liquefaction predicted not to occur when FS > 1.
5. LIQUEFACTION HAZARD ASSESSMENT
/LIQUEFACTION POTENTIAL ANALYSIS
As mentioned that our first aim is to analyse liquefaction
potential of soil and to prepare liquefaction susceptibility
map of “Ramgarh Taal project” using SPT borehole data.
Liquefaction phenomena have been recorded in many parts
of the world, where ground shaking is frequent and soils
consist of loose fine sand where the water table is shallow. Liquefaction of saturated loose sands and silty sands induce
flow slides, differential settlement, and subsidence, leading
damage to buildings and infrastructure and eventually to
loss of life. Determination of liquefaction potential due to
earthquake is complex geotechnical problem. Many factors
including soil parameters and seismic characteristics
influence this phenomenon To assess the liquefaction hazard
in an area, it is important to examine the geotechnical
characteristics like grain size distribution, percentage of silt,
water table ,water table depth and SPT „N‟ value. The
percentage of silt and poorly graded sand is high in the area
under “Ramgarh Taal Project” indicating that there is a great chance of soil liquefaction. Here liquefaction potential
analysis is done to determine the factor of safety at different
depth. The liquefaction potential of “Ramgarh Taal Project”
in Gorakhpur city using SPT data collected from the various
sites of project is estimated by simplified procedure of Seed
& Idriss and Idriss & Boulanger.
The methodology used to estimate the liquefaction potential is given as example for one borehole Excel spread sheet
used to calculate the Factor of Safety with depth and
enclosed in tables shown below.
SEED & IDRISS METHOD
Table-No-4:- LIQUEFACTION ASSESSMENT OF PROPOSED G.D.A. OFFICE BUILDING, SIDDHARTH ENCLAVE
SCHEME, GORAKHPUR
(BORE HOLE-1)

International Journal of Science, Engineering and Technology Research (IJSETR), Volume 4, Issue 8, August 2015
2952
ISSN: 2278 – 7798 All Rights Reserved © 2015 IJSETR
IDRISS & BOULANGER METHOD
Table-No-5:- LIQUEFACTION ASSESSMENT OF PROPOSED G.D.A. OFFICE BUILDING, SIDDHARTH ENCLAVE
SCHEME, GORAKHPUR
(BORE HOLE-1)
6. RESULTS AND ITS DISCUSSIONS
Result of liquefaction is shown with depth for of each site of bore holes and graph shows factor of safety vs. depth.
Bore Hole Number 1 (BH1)
The analysis of SPT results by seed & idriss method at Bore
hole number-1 shows that the soil strata between depths
10.75-13.90 m are Non-Liquefiable and the soil strata
between 1.65-9.60 m & 14.0-15.30 m are responsible to
liquefy under seismic shaking corresponding to peak
horizontal ground acceleration of 0.24g.
The analysis of SPT results by idriss & boulanger method
at Bore hole number-1 shows that the soil strata between
depths 4.75-5.05 m & 10.75-13.90 m are Non-Liquefiable
and the soil strata between 1.65-3.80 m, 6.50-9.60 m &
14.0-15.30 m are responsible to liquefy under seismic
shaking corresponding to peak horizontal ground
acceleration of 0.24g.
Fig.5. Depth vs. Factor of Safety (Bore Hole-1)
0
5
10
15
20
0 0.5 1 1.5 2 2.5
Dep
th(m
)
factor of safety
Factor of Safety vs Depth
seed & idriss
idriss & boulanger
International Journal of Science, Engineering and Technology Research (IJSETR), Volume 4, Issue 8, August 2015
2953
ISSN: 2278 – 7798 All Rights Reserved © 2015 IJSETR
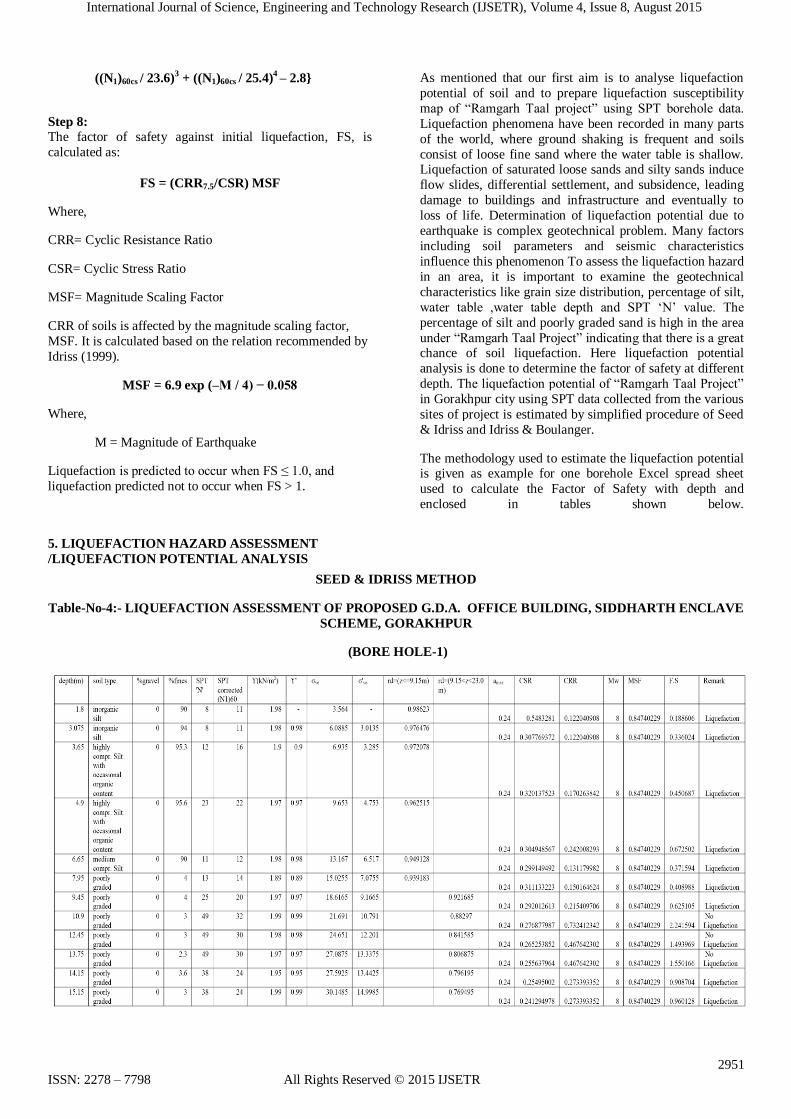
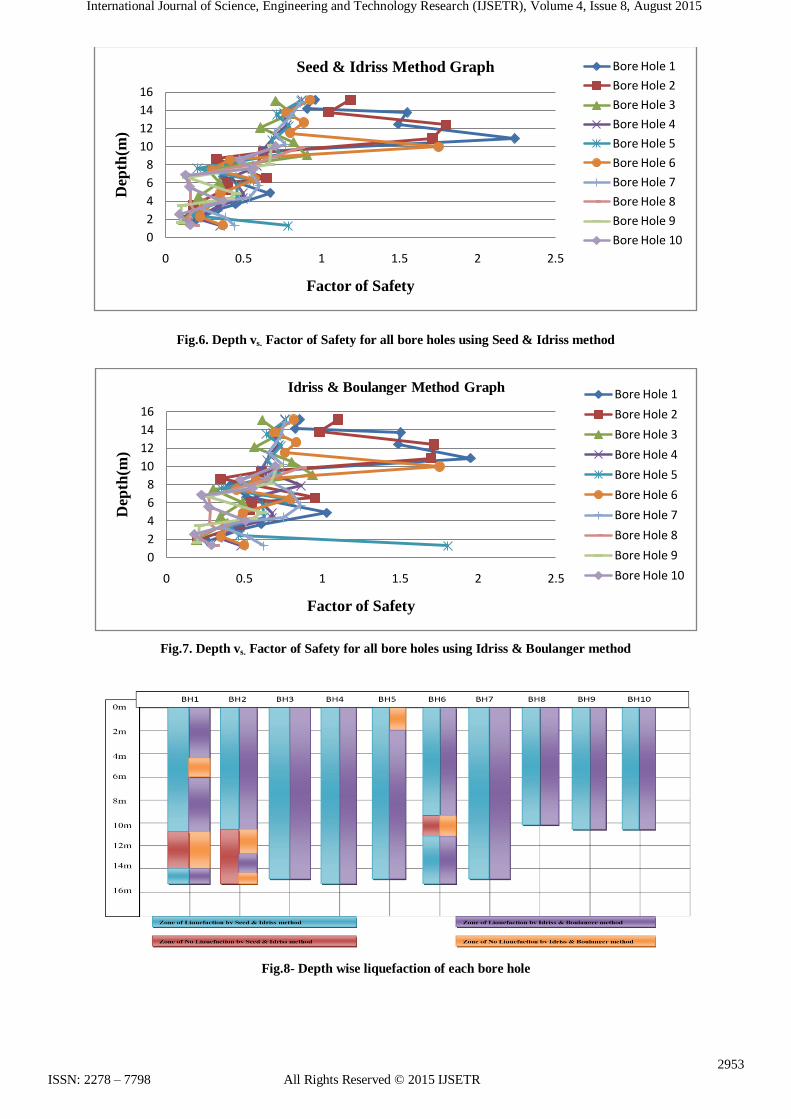
Fig.6. Depth vs. Factor of Safety for all bore holes using Seed & Idriss method
Fig.7. Depth vs. Factor of Safety for all bore holes using Idriss & Boulanger method
Fig.8- Depth wise liquefaction of each bore hole
0
2
4
6
8
10
12
14
16
0 0.5 1 1.5 2 2.5
Dep
th(m
)
Factor of Safety
Seed & Idriss Method Graph Bore Hole 1
Bore Hole 2
Bore Hole 3
Bore Hole 4
Bore Hole 5
Bore Hole 6
Bore Hole 7
Bore Hole 8
Bore Hole 9
Bore Hole 10
0
2
4
6
8
10
12
14
16
0 0.5 1 1.5 2 2.5
Dep
th(m
)
Factor of Safety
Idriss & Boulanger Method Graph Bore Hole 1
Bore Hole 2
Bore Hole 3
Bore Hole 4
Bore Hole 5
Bore Hole 6
Bore Hole 7
Bore Hole 8
Bore Hole 9
Bore Hole 10

International Journal of Science, Engineering and Technology Research (IJSETR), Volume 4, Issue 8, August 2015
2954
ISSN: 2278 – 7798 All Rights Reserved © 2015 IJSETR
Fig.9 - Liquefaction Hazard map of Ramgarh Taal Project for the given bore holes
7. CONCLUSION
Based on the study for assessment of liquefaction potential
for “Ramgarh Taal Project”, it is concluded that soil of study
area is susceptible to liquefaction extra care should be taken
against liquefaction during construction upon this type of
soil. The Study area being a reclaimed area has a top layer
of loose fine sand followed by soft to medium or loose
sandy silt or clayey silt is also susceptible to liquefaction.
In this study we concluded that if earthquake more than or
equal to 8 ritcher scale occurs in Gorakhpur region, it will be
extensively damaged due to liquefaction.
In Fig 3. there is a graphical comparison between
the both methods (Seed & Idriss method and Idriss
& Boulanger method) used in this analysis for the
same bore holes and same depth of soil strata.
In fig 4 and 5 combined graph is drawn between
factor of safety and depth of all 10 bore holes using
Seed & Idriss method and Idriss & Boulanger
method respectively. In those graphs the soil strata
whose factor of safety is less than 1 is susceptible
to liquefaction and should be considered for mitigation before building a structure on it.
In the fig 6, we have bore hole position wise
combined data of all the studied bore holes and
depth wise zone of liquefaction and zone of no
liquefaction using Seed & Idriss method and Idriss
& Boulanger method. In this figure, there is also a
comparison of depth wise zone of liquefaction and
zone of no liquefaction between both methods.
Observation of combined graph shows liquefaction
potential for each borehole and depth upto which soil may liquefy during an earthquake.
The percentage of silt and poorly graded sand is
high in the area under “Ramgarh Taal Project”
indicating that there is a great chance of soil
liquefaction. Here liquefaction potential analysis is
done to determine the factor of safety at different
depth.
The construction should be avoided on liquefaction
susceptible soils. There are various criteria to
determine the soil‟s liquefaction potential in a site.
According to these criteria, the soil of a particular building site is characterized.
The construction of structure should be liquefaction
resistant i.e., the foundation elements should be
designed to resist the effects of liquefaction. Due to
favourable location, space restriction and other
reasons if it is necessary to the construction of
structure on liquefiable soil, the foundation should
be liquefaction resistant.
Improvement of soil is an important method to mitigate the adverse effect of liquefaction hazards
by improving the soil by improving the density,
strength and drainage characteristics of the soil.
This can be done by using various types of soil
improvement techniques.
REFERENCES
1. ABAG (2001). “Bay area Liquefaction Hazard” The REAL Dirt on Liquefaction.
(http://www.abag.ca.gov/bayarea/eqmaps/liquefac/l
iquefac.html,)
2. ABAG (2001). “Collection and analysis of
Liquefaction data from the Northridge and Loma
Prieta Earthquakes” Appendix C
3. Chapter 2: soil liquefaction in earthquakes.
4. IS: 1893-2002, “Criteria for Earthquake Resistant Design of Structures”.
5. Finn, W. L., Ledbetter, R. H., and Wu, G.(1994)
“Liquefaction in silty soils: design and analysis,
Ground failures under seismic conditions”,
Geotechnical Special Publication No 44, ASCE,
Reston, 51–79.

International Journal of Science, Engineering and Technology Research (IJSETR), Volume 4, Issue 8, August 2015
2955
ISSN: 2278 – 7798 All Rights Reserved © 2015 IJSETR
6. Idriss I.M. and Boulanger R.W. (2004) “Semi-
Empirical Procedures for Evaluating Liquefaction
Potential During Earthquakes”. Proc. of 11th SDEE
and 3rd Conference. University of California,
Berkeley. 7. Idriss I. M., and Boulanger R. W. (2006). “Semi-
empirical procedures for evaluating liquefaction
potential during earthquakes.” Soil Dyn.
Earthquake Eng., 26, 115–130.
8. Idriss, I.M., R.W. Boulanger (2008), “Soil
liquefaction during earthquake”, Eq Engg.
Research Institute, EERI Publication, Monograph
MNO-12, Oakland, CA.
9. Idriss, I.M., R.W. Boulanger (2010), “SPT-based
liquefaction triggering procedures” Report No. UCD/CGM-10-02 Centre for Geotechnical
Modelling Department of Civil and Environmental
Engineering University of California Davis,
California.
10. I.M. Idriss,(1999) "An update to the Seed-Idriss
simplified procedure for evaluating liquefaction
potential", Proc., TRB Workshop on New
Approaches to Liquefaction, January, Publication
No. FHWA-RD-99-165, Federal Highway
Administration.
11. K. S. Rao and Mohanty, W. K. (2001),
“Microzonation of Delhi region: An approach”. J.
Indian Build. Congr., 8, 102–114.
12. K. S. Rao, (2001), “Liquefaction Studies for
seismic microzonation of Delhi region”. In Indian
Geotechnical Conference, vol. 2, pp. 44–51.
13. K. S. Rao and D. Neelima Satyam (2007),
“Liquefaction studies for seismic microzonation of
Delhi region”, Current Science, 646 Vol. 92, No. 5.
14. Robertson, P.K. and Fear, C.E. (1996), “Soil
liquefaction and its evaluation based on SPT and
CPT”, Liquefaction Workshop.
15. S. C. Liao and Whitman, R. V.(1986), "Overburden
correction factors for SPT in sand." Journal of
Geotechnical Engineering, ASCE, 112(3), 373-377.
16. Seed, H. B. and Idriss, I. M., (1971) “Simplified
Procedure for Evaluating Soil Liquefaction
Potential”. J. Soil Mech. Found. Div. vol. 97, pp,
1249–1273.
17. Seed, H. B., (1979) “Soil Liquefaction and Cyclic
Mobility Evaluation for Level Ground During
Earthquakes”. J. Geotech. Eng. Div.,105, 210–255.
18. Seed HB, Idriss I.M.(1982). “Ground Motions and
Soil Liquefaction during earthquakes”. EERI
Monograph.
19. Seed, H.B. and Idriss, I.M. and Arango, I. (1983).
“Evaluation of liquefaction potential Using Field
Performance data”. ASCE Journal of Geotechnical
Engineering, 109(3), 458-482.
20. Seed, H.B. (1997),”Soil Liquefaction and Cyclic Mobility Evaluation Level Ground during
Earthquake”, J. of Geotech. Engg. Div., ASCE,
22(3), pp. 298-30
21. Youd, T. L., (1991). “Mapping of Earthquake
Induced Liquefaction for Seismic Zonation”. Proc.
Fourth Int. Int. Conf. Seismic Zonation 1, pp. 111-
147
22. Youd T. L and I. M. Idriss, Editors, (1997). “
National Centre for Earthquake Engineering
Research (NCEER), Proceedings of the NCEER Workshop on Evaluation of Liquefaction
Resistance of Soils”, Technical Report NCEER-97-
022
23. Youd, T.L. and Idriss, I.M. (2001). “Liquefaction
Resistance of Soils: Summary Report from 1996
NCEER and 1998 NCEER/NSF Workshop on
Evaluation of Liquefaction Resistance of Soils”, J.
of Geotech & Geo-env., ASCE 127(4) pp.297.