lipoprotein(a)isthebestsinglemarkerin ...downloads.hindawi.com/journals/crp/2011/175363.pdf ·...
TRANSCRIPT

SAGE-Hindawi Access to ResearchCardiology Research and PracticeVolume 2011, Article ID 175363, 13 pagesdoi:10.4061/2011/175363
Research Article
Lipoprotein(a) Is the Best Single Marker inAssessing Unstable Angina Pectoris
Vidosava B. Djordjevic,1 Vladan Cosic,2 Ivana Stojanovic,1 Slavica Kundalic,2
Lilika Zvezdanovic,2 Marina Deljanin-Ilic,3 Predrag Vlahovic,2 and Lidija Popovic1
1 Institute of Biochemistry, Faculty of Medicine, Nis, Serbia2 Centre for Medical Biochemistry, Clinical Center, Nis, Serbia3 Institute for Cardiovascular and Rheumatic Diseases, Niska Banja, Serbia
Correspondence should be addressed to Predrag Vlahovic, predrag [email protected]
Received 3 September 2010; Revised 30 November 2010; Accepted 30 December 2010
Academic Editor: Ken Ichi Aihara
Copyright © 2011 Vidosava B. Djordjevic et al. This is an open access article distributed under the Creative Commons AttributionLicense, which permits unrestricted use, distribution, and reproduction in any medium, provided the original work is properlycited.
This study evaluated whether statin therapy changed a diagnostic validity of lipid and inflammatory markers in ischemic heartdisease (IHD) patients. Levels of lipids, lipoproteins, apolipoproteins, inflammatory markers, and atherogenic indexes weredetermined in 49 apparently healthy men and women, 82 patients having stable angina pectoris (SAP), 80 patients with unstableangina (USAP), and 106 patients with acute ST-elevation myocardial infarction (STEMI) treated or not treated with statins.Diagnostic accuracy of markers was determined by ROC curve analysis. Significantly lower apoA-I in all statin-treated groupsand significantly higher apoB in statin-treated STEMI group compared to non-statin-treated groups were observed. CRP showedthe best ROC characteristics in the assessment of STEMI patients. Lp(a) is better in the evaluation of SAP and USAP patients,considering that Lp(a) showed the highest area under the curve (AUC). Regarding atherogenic indexes, the highest AUC in SAPgroup was obtained for TG/apoB and in USAP and STEMI patients for TG/HDL-c. Statins lowered total cholesterol, LDL-c, andTG but fail to normalize apoA-I in patients with IHD.
1. Introduction
Beside endothelial dysfunction leading to inflammatoryreaction, lipid metabolism disorders represent the second keyevent in the initiation and rapid development of atheroge-nesis [1]. Many individual lipid and inflammatory markershave been considered as the factors playing an importantrole in atherogenesis and prognosis of related diseases.The atherogenic dyslipidemic profile, especially mild tomarked elevation of apo-B containing lipoproteins, suchas very low-density lipoproteins (VLDL), VLDL-remnants,intermediate-density lipoproteins (IDL), and low-densitylipoproteins (LDL) (specifically small, dense LDL), and lowlevels of high-density lipoproteins (HDL) [2–4], appearsto promote enhanced arterial cholesterol deposition andaccelerate the progression of atherosclerotic disease. Despitethe use of new and effective pharmacological drugs to lower
plasma lipid concentration, cardiovascular diseases continueto be the main cause of death in western countries [5,6]. Fenofibrate lowers the plasma level of cholesterol andtriglyceride, corrects the abnormality in LDL metabolism,but has no effect on HDL-cholesterol (HDL-c) [7]. Onthe other hand, statins have a therapeutic effect on lipidmetabolism and inflammation. They lower total and LDL-cholesterol (LDL-c), elevate HDL-c, and lower inflammatorymarkers such as C-reactive protein (CRP) [8–11]. Sinceantilipidemic drugs induce modifications in current lipidmetabolism and inflammatory response, lipid and inflam-matory markers become less convenient in assessing theactivity of atherosclerotic process. This may be a reason forcontradictory results related to CRP, which was until recentlya promising marker in predicting cardiovascular events.Recent limited data have shown that lipoprotein(a) (Lp(a))and the ratio of Tc/HDL-c may be used as much stronger

2 Cardiology Research and Practice
predictors in screening for high blood lipid [12], and Lp(a)is the best single marker for the presence of cerebrovasculardisease [13].
The aim of this study was to determine which individuallipid or inflammatory biomarkers had the highest clinicalaccuracy by Receiver Operating Characteristic (ROC) curveanalysis in patients with different stages of ischemic heartdisease treated or not treated with statins.
2. Materials and Methods
2.1. Subject. The study evaluated patients admitted to theInstitute for Cardiovascular diseases “Niska Banja” for theevaluation of chest pain. Patients were categorized into threegroups based on the degree of ischemic heart disease (IHD):chronic stable angina pectoris (SAP group), unstable anginapectoris (USAP group), and acute ST-elevation myocardialinfarction (STEMI group). The SAP group consisted of 52male and 30 female (total 82, mean age 61.3± 6.5 years);the USAP group had 50 male and 30 female (total 80 meanage 60.8± 9.8 years); the STEMI patients included 72 maleand 34 female (total 106, mean age 60.22± 12.7 years). Eachgroup was divided into statin-treated (+) and non-statin-treated (−) groups. The SAP(+) group consisted of 34 malesand 17 females, the SAP(−) of 18 males and 13 females, theUSAP(+) of 35 males and 12 females, the USAP(−) of 15males and 18 females, the STEMI(+) of 37 males and 18females, and the STEMI(−) of 35 males and 16 females.
The patients in the SAP group gave a history consistentwith stable angina for at least 3 months before enteringthe study and demonstrated objective evidence of ischemiaon exercise electrocardiogram and/or stress echocardiogram.None of the patients in this group had previous myocardialinfarction or myocardial revascularization, cardiac valvedisease, cardiomyopathy, malignant arrhythmias, acute orchronic liver disease, renal failure, or inflammatory disease,and none of the patients were under consideration forcoronary revascularization at the time of the inclusion intothe study.
Unstable angina was defined according to Hamm andBraunwald [14]. All patients in the USAP group had chestpain of increasing frequency and severity or at rest duringthe last 48 hours before hospitalisation associated with STsegment changes, T wave changes, or both and without risein cardiac enzymes and troponin I.
Acute myocardial infarction was based on the followingcriteria: chest pain persisting longer than 30 min, concomi-tant changes on the electrocardiogram at the admission tohospital and elevated troponin I levels. All patients hadSTEMI according to the Guidelines of the European Societyof Cardiology [15]. In all patients, a detailed clinical analysiswas performed just after admission, and all of them wereasked for current medications. Additional explanation of thecriteria for patients with ischemic heart disease selection wasgiven in our previously published paper [16].
For the control group, we recruited 49 (30 male, 19female) healthy volunteers—blood bank donors from theDepartment for Blood Transfusion of the Clinical Centre Nis.
All controls were free of any acute infectious disease and anyhistory of hypertension, diabetes or ischemic heart disease.All subjects gave informed consent prior to their enrolmentin the study, and the study was approved by the local EthicsCommittee.
2.2. Methods. Blood samples were obtained within 24 hoursafter admission after overnight fasting. Peripheral venousblood was drown into vacutainer tubes containing ethylenediamine-tetracetic acid (EDTA), citrate, or no anticoagulant.Troponin I and inflammatory markers were determinedin serum, fibrinogen in citrate plasma, and lipid markersin EDTA plasma. Aliquots of plasma and serum for thedetermination of neopterin, iNOS, NO2/NO3, TNF-α, Lp(a),and oxidized LDL (oxLDL) were stored at 80◦C until assayed.All other analyses were performed the same day the bloodwas collected.
Troponin I was determined on AxSYM (Abbott IrelandDiagnostics Division, Lisnamuck, Ireland). The diagnosticcutoff for acute myocardial infarction is 0.40 ng/mL. Inapparently healthy population, 99th percentile is 0.04 ng/mL.Depending on patient hours after admission, sensitivityranges from 60% (0–6 h) to 91.7% (12–24 h), and specificity97.4% to 98.3%.
HsCRP, total cholesterol (Tc), triglycerides (TG), LDL-c, HDL-c, apolipoprotein A-I (ApoA-I), apolipoproteinB (ApoB) were assayed on analyzer AU 400 (Olympus,Tokio, Japan). HsCRP was measured using a latex-enhancedimmunoturbidimetric method on Olympus AU400. hsCRPreference values are <1 mg/L (manufacturer recommenda-tion). This test is linear within a concentration range of 0.08–80 mg/L. The intra-assay precision for three different samplesare between CV% 0.55 and CV% 4.32. Tc, TG, HDL-c, andLDL-c were measured by routine methods on analyzer AU400. ApoA-I and apoB concentrations were determined usingan immunoturbidimetric method (Olympus, Tokio, Japan).
The plasma concentration of Lp(a) was also assayedby a latex immunoassay (Sentinel CH Srl Diagnostics,Milan, Italy) on Olympus AU400. Lower detection limitwas 3 mg/dL and the reference values were <30 mg/dL. Theperformance characteristics of Lp(a) test were as follows:the measuring range was 3.0–130 mg/dL; the intra-assay pre-cision determined in two levels was CV% 2.00 and 1.26,respectively.
Serum neopterin concentrations were determined usinga commercially available immunoassay (ELISA kit, IBL,Hamburg, Germany). The limit of detection was 0.7 nmol/L.
Serum iNOS activity was measured by a commerciallyavailable Quantikine human iNOS immunoassay (ELISA kit,R&D Systems Europe, LTD. UK). The limit of detection was0.15 U/mL.
Quantikine human TNF-α immunoassay (R&D SystemsEurope, Ltd. UK) was used for the estimation of serum TNF-α concentration.
Serum NO2/NO3 concentration was measured by themodified cadmium-reduction method of Navaro-Gonzalvezet al. [17] which is based on the produced nitrite deter-mination by diazotization of sulfanilamide and couplingto naphthylene diamine. The lower and upper detection

Cardiology Research and Practice 3
Table 1: Demographic characteristics and blood lipid and inflammatory markers in patients with ischemic heart disease.
SAP USAP STEMI Controls
Male/female (N) 52/30 50/30 72/34 30/19
Age years 61.3± 6.5 60.8± 9.8 60.2± 12.7 59.1± 9.7
Troponin I, ng/mL 0.0 (0.0–1.68) 0.03 (0.0–3.7)∗ 12.8 (0.0–159.6)∗∗∗ 0.0 (0.0–0.01)
TG, mmol/L 1.88 (0.58–21.4)∗ 2.08 (0.56–7.6)∗∗∗ 1.90 (0.56–4.9)∗ 1.30 (0.46–4.18)
Tc, mmol/L 5.60± 1.20 5.78± 1.72 5.91± 1.57 5.48± 0.49
HDL-c, mmol/L 1.16± 0.28 1.00± 0.31∗∗∗ 1.06± 0.26∗∗∗ 1.15± 0.28
LDL-c, mmol/L 3.47± 1.05 3.55± 1.40 3.88± 1.28 3.51± 0.59
Lp(a), mg/dL 14.4 (3.6–67.8)∗∗∗ 22.7 (5.9–88.9)∗∗∗ 17.8 (4.8–79.0)∗∗∗ 5.6 (2.9–19.7)
ApoA-I, g/L 1.13± 0.30∗∗∗ 1.04± 0.29∗∗∗ 1.11± 0.17∗∗∗ 1.34± 0.21
ApoB, g/L 1.06± 0.38 1.17± 0.40 1.25± 0.31 1.17± 0.14
oxLDL, ng/mL 211 (11.7–1925) 143 (7–1550)∗ 140 (15–2105) 195 (18–705)
hsCRP, g/L 3.0 (0.4–84.35)∗ 5.8 (0.43–178.3)∗∗,b 18.0 (0.56–270)∗∗∗,c 1.5 (0.1–16.5)
Fibrinogen, g/L 4.29± 1.22 5.03± 1.49∗∗ 5.06± 2.46∗ 3.92± 1.03
Neopterin, nmol/L 14.9 (3–57)∗∗∗ 14.3 (1–105)∗∗,a 13.0 (1–52) 13.4 (1–19.6)
iNOS, U/mL 2.2 (0.5–4.7) 2.9 (0.9–6.0) 3.0 (0.9–6.2) 2.2 (0.6–9.3)
NO2/NO3, μmol/L 96 (35–197) 125 (52–199)∗∗,b 102 (61–243) 97 (57–230)
TNF-α, pg/mL 12.74± 1.25 13.78± 1.93 14.47± 2.15 13.60± 2.19
The results are presented as means±SD for parametric, and median (min–max) for nonparametric values ∗P < .05 versus controls, ∗∗P < .01 versus controls,∗∗∗P < .001 versus controls, aP < .05 versus STEMI, bP < .01 versus SAP, cP < .001 versus SAP.
limits were 2 and 250 μmol/L, respectively. Plasma oxLDLconcentrations were estimated by a commercially availableELISA kit (Immune diagnostic AG, Bensheim).
2.3. Statistical Analysis. Most statistics were performed usingSPSS (the Statistical Package for the Social Sciences) com-puter program. The comparison of the different patientgroups to the control group was performed using ANOVAfollowed by a 2-sided Dunnett’s test (for multiple compar-isons), or Student’s nonpaired t-test as appropriate. Theclinical accuracy of the examined parameters was assessedusing receiver operating characteristic (ROC) curve analysis.ROC plots were constructed, and the areas under the curves(AUC), standard errors, 95% confidence interval, sensitivity,and specificity as well as optimal cutoff were calculated usingMedCalc computer program. Cutoff values at which thediscrimination between the cases with positive and negativediagnosis was optimal were set. The comparisons of the areasunder different ROC plots were made using univariate zscores. Multinomial logistic regression was used to assesswich of the lipid and inflammatory markers showing highsensitivity and specificity may be the best predictor of SAP,USAP or STEMI.
3. Results
Demographic characteristics in the studied patients showedthe prevalence of males in all groups. The average ageof groups was about sixty (Table 1). Statistical analysisusing ANOVA showed that SAP patients had significantlyhigher concentrations of TG, Lp(a), hsCRP, neopterin, andsignificantly lower levels of apoA-I in comparison withhealthy subjects. In addition to these parameters in the USAP
group, three more markers were significantly increased,including troponin I, NO2/NO3 and fibrinogen, while HDL-c and oxLDL were decreased. In STEMI patients significantdifferences were observed in troponin I, TG, HDL-c, Lp(a),apoA-I, hsCRP and fibrinogen. Also, significant differenceswere found in hsCRP, neopterin and NO2/NO3 betweendifferent patient groups (Table 1).
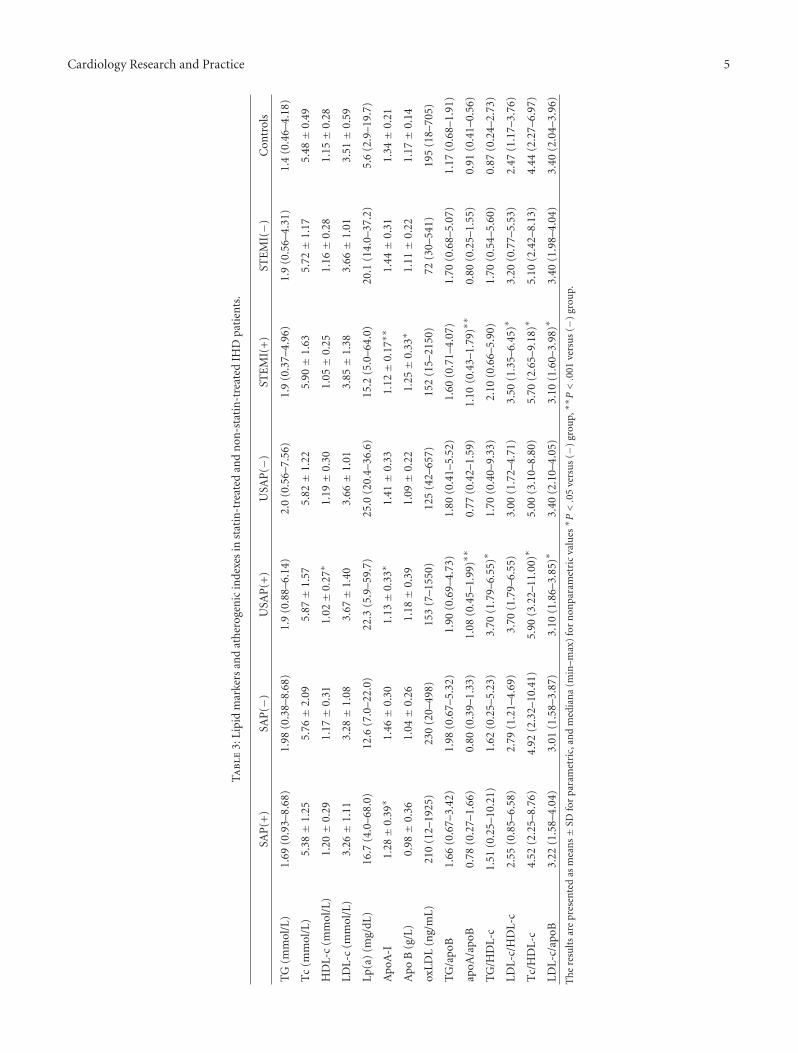
However, the testing between statin-treated and non-statin-treated groups showed fewer differences. None ofall studied inflammatory markers showed any significantdifference between statin-treated and non-statin-treatedgroups (Table 2). Among lipid markers only apoA-I levelswere significantly decreased in SAP(+)compared to SAP(−)patients. A significant decrease in apoA-I, HDL-c, and LDL-c/apoB was noted in USAP(+) patients, as well as a signifi-cant increase in apoB/apoA-I, LDL-c/HDL-c, and Tc/HDL-c, in comparison with the USAP(−) group. STEMI(+)patients showed a significant decrease in apoA-I andLDL-c/apoB and an increase in apoB, apoB/apoA-I, LDL-c/HDL-c and Tc/HDL-c compared to STEMI(−) patients(Table 3).
Since we did not find any significant difference in ROCcurve analysis between statin-treated and non-statin-treatedgroups in any individual inflammatory or lipid marker,ROC curve analysis included both subgroups of each patientgroup.
The ROC curves for inflammatory markers are presentedin Figure 2. In SAP patients no biomarker showed a signifi-cant difference related to any other although hsCRP had thehighest area under the ROC (0.691 ± 0.079) (Table 4). Thegreatest sensitivity was found for NO2/NO3 (81.0%), TNF-α(88.0%), and neopterin (88.6%), but their specificities werelow (30.4%, 42.1%, and 42.9%, resp.).

4 Cardiology Research and Practice
Ta
ble
2:D
emog
raph
icch
arac
teri
stic
s,st
anda
rdan
din
flam
mat
ory
mar
kers
inst
atin
-tre
ated
and
non
-sta
tin
-tre
ated
IHD
pati
ents
.
SAP
(+)
SAP
(−)
USA
P(+
)U
SAP
(−)
STE
MI(
+)
STE
MI(−)
Con
trol
s
Mal
e/fe
mal
e(N
)34
/17
18/1
335
/12
15/1
837
/18
35/1
630
/19
Age
61.4±
6.8
59.8±
8.4
63.2±
7.5
62.6±
6.4
63.2±
9.8
62.9±
11.4
59.1±
9.7
Glu
cose
(mm
ol/L
)5.
72±
1.56
5.95±
1.73
6.41±
0.48
5.98±
2.29
6.31±
2.17
6.99±
3.17
5.19±
0.59
Cre
atin
ine
(μm
ol/L
)88
.8±
15.9
97.2±
31.2
111.
4±
38.9
117.
2±
109.
488
.4±
21.8
103.
0±
34.2
85.1±
13.9
Trop
onin
I(n
g/m
L)0.
00±
0.01
0.08±
0.32
0.0
(0.0
–21.
4)0.
0(0
.0–1
9.5)
12.8
(0.3
7–22
7.8)
9.8
(0.0
01–2
2.8)
0
hsC
RP
(g/L
)2.
7(0
.4–1
9.4)
3.1
(0.7
4–84
.4)
6.2
(0.6
–78.
4)4.
7(0
.4–1
22.9
)12
.8(2
.1–1
86.3
)20
.9(0
.6–2
70.3
)1.
3(0
.1–1
6.5)
Fibr
inog
en(g
/L)
3.9
(2.1
–7.0
)5.
1(2
.6–5
.6)
4.9
(2.0
–7.6
)4.
8(3
.7–8
.5)
4.6
(0.3
–7.8
)5.
3(2
.5–1
1.4)
3.7
(2.1
–7.3
)
Neo
pter
in(n
mol
/L)
14.5
(3.0
–57.
0)17
(8.0
–55.
0)14
.3(1
.0–1
05.0
)14
.5(6
.0–1
9.3)
12.8
(1.0
–52.
0)13
.2(5
.0–3
2.0)
13.4
(1.0
–19.
6)
iNO
S(U
/L)
2.5
(0.5
–4.7
)1.
4(0
.5–2
.2)
2.3
(0.9
–5.7
)3.
0(1
.7–6
.0)
2.8
(0.9
–4.7
)3.
2(1
.4–6
.2)
2.2
(0.6
–9.3
)
NO
2− /N
O3−
(μm
ol/L
)96
.1(3
4.9–
194.
9)93
.0(6
7.4–
197.
4)12
4.6
(78.
6–19
6.6)
127.
4(5
1.8–
154.
3)97
.5(6
1.5–
243.
0)10
5.5
(75.
0–22
4.9)
97(5
7–22
9)
TN
F-α
(pg/
mL)
12.7
(10.
8–15
.2)
13.(
13.1
–13.
9)13
.1(1
2.0–
18.9
)13
.2(1
2.0–
18.3
)15
.1(1
2.1–
18.3
)13
.6(1
0.9–
14.5
)13
.1(1
1.2–
19.7
)
Th
ere
sult
sar
epr
esen
ted
asm
ean
s±
SDfo
rpa
ram
etri
c,an
dm
edia
n(m
in–m
ax)
for
non
para
met
ric
valu
es.
Cardiology Research and Practice 5
Ta
ble
3:Li
pid
mar
kers
and
ath
erog
enic
inde
xes
inst
atin
-tre
ated
and
non
-sta
tin
-tre
ated
IHD
pati
ents
.
SAP
(+)
SAP
(−)
USA
P(+
)U
SAP
(−)
STE
MI(
+)
STE
MI(−)
Con
trol
s
TG
(mm
ol/L
)1.
69(0
.93–
8.68
)1.
98(0
.38–
8.68
)1.
9(0
.88–
6.14
)2.
0(0
.56–
7.56
)1.
9(0
.37–
4.96
)1.
9(0
.56–
4.31
)1.
4(0
.46–
4.18
)
Tc
(mm
ol/L
)5.
38±
1.25
5.76±
2.09
5.87±
1.57
5.82±
1.22
5.90±
1.63
5.72±
1.17
5.48±
0.49
HD
L-c
(mm
ol/L
)1.
20±
0.29
1.17±
0.31
1.02±
0.27
∗1.
19±
0.30
1.05±
0.25
1.16±
0.28
1.15±
0.28
LDL-
c(m
mol
/L)
3.26±
1.11
3.28±
1.08
3.67±
1.40
3.66±
1.01
3.85±
1.38
3.66±
1.01
3.51±
0.59
Lp(a
)(m
g/dL
)16
.7(4
.0–6
8.0)
12.6
(7.0
–22.
0)22
.3(5
.9–5
9.7)
25.0
(20.
4–36
.6)
15.2
(5.0
–64.
0)20
.1(1
4.0–
37.2
)5.
6(2
.9–1
9.7)
Apo
A-I
1.28±
0.39
∗1.
46±
0.30
1.13±
0.33
∗1.
41±
0.33
1.12±
0.17
∗∗1.
44±
0.31
1.34±
0.21
Apo
B(g
/L)
0.98±
0.36
1.04±
0.26
1.18±
0.39
1.09±
0.22
1.25±
0.33
∗1.
11±
0.22
1.17±
0.14
oxLD
L(n
g/m
L)21
0(1
2–19
25)
230
(20–
498)
153
(7–1
550)
125
(42–
657)
152
(15–
2150
)72
(30–
541)
195
(18–
705)
TG
/apo
B1.
66(0
.67–
3.42
)1.
98(0
.67–
5.32
)1.
90(0
.69–
4.73
)1.
80(0
.41–
5.52
)1.
60(0
.71–
4.07
)1.
70(0
.68–
5.07
)1.
17(0
.68–
1.91
)
apoA
/apo
B0.
78(0
.27–
1.66
)0.
80(0
.39–
1.33
)1.
08(0.4
5–1.
99)∗∗
0.77
(0.4
2–1.
59)
1.10
(0.4
3–1.
79)∗∗
0.80
(0.2
5–1.
55)
0.91
(0.4
1–0.
56)
TG
/HD
L-c
1.51
(0.2
5–10
.21)
1.62
(0.2
5–5.
23)
3.70
(1.7
9–6.
55)∗
1.70
(0.4
0–9.
33)
2.10
(0.6
6–5.
90)
1.70
(0.5
4–5.
60)
0.87
(0.2
4–2.
73)
LDL-
c/H
DL-
c2.
55(0
.85–
6.58
)2.
79(1
.21–
4.69
)3.
70(1
.79–
6.55
)3.
00(1
.72–
4.71
)3.
50(1.3
5–6.
45)∗
3.20
(0.7
7–5.
53)
2.47
(1.1
7–3.
76)
Tc/
HD
L-c
4.52
(2.2
5–8.
76)
4.92
(2.3
2–10
.41)
5.90
(3.2
2–11.0
0)∗
5.00
(3.1
0–8.
80)
5.70
(2.6
5–9.
18)∗
5.10
(2.4
2–8.
13)
4.44
(2.2
7–6.
97)
LDL-
c/ap
oB3.
22(1
.58–
4.04
)3.
01(1
.58–
3.87
)3.
10(1.8
6–3.
85)∗
3.40
(2.1
0–4.
05)
3.10
(1.6
0–3.
98)∗
3.40
(1.9
8–4.
04)
3.40
(2.0
4–3.
96)
Th
ere
sult
sar
epr
esen
ted
asm
ean
s±
SDfo
rpa
ram
etri
c,an
dm
edia
na
(min
–max
)fo
rn
onpa
ram
etri
cva
lues∗ P
<.0
5ve
rsu
s(−
)gr
oup,∗∗P<.0
01ve
rsu
s(−
)gr
oup.

6 Cardiology Research and Practice
Table 4: The results of ROC curves analysis of inflammatory markers in ischemic heart disease patients.
AUC SE 95%CI Specificity Sensitivity Criterion
SAP
CRP 0.691 0.079 0.533–0.821 66.7 72.7 >1.9
Fibrinogen 0.557 0.087 0.399–0.706 59.5 75.9 >3.9
iNOS 0.558 0.087 0.400–0.707 78.9 48.0 >2.8
Neopterin 0.642 0.086 0.484–0.781 42.9 88.6 >11.9
NO2/NO3 0.567 0.087 0.410–0.716 30.4 81.0 ≤122.0
TNF-α 0.596 0.088 0.437–0.741 42.1 88.0 ≤14.0
USAP
CRP 0.808∗ 0.074 0.643–0.919 87.2 69.8 >4.1
Fibrinogen 0.680 0.090 0.504–0.825 59.5 90.5 >3.9
iNOS 0.610 0.095 0.433–0.767 78.9 52.6 >2.8
Neopterin 0.709 0.086 0.534–0.848 94.3 34.9 >18.9
NO2/NO3 0.698 0.088 0.523–0.839 47.8 92.7 >88.6
TNF-α 0.548 0.097 0.374–0.714 31.6 94.7 >11.9
STEMI
CRP 0.923∗∗ 0.043 0.796–0.982 89.7 88.6 >4.7
Fibrinogen 0.562 0.090 0.399–0.716 91.9 52.2 >5.0
iNOS 0.602 0.088 0.437–0.751 21.1 100.0 >0.9
Neopterin 0.725 0.081 0.563–0.852 100.0 19.0 >19.6
NO2/NO3 0.627 0.087 0.462–0.772 47.8 74.4 >88.6
TNF-α 0.604 0.088 0.439–0.753 89.5 27.3 >15.5∗P < .05 versus TNF-α, ∗∗P < .05 to P < .001 versus all other markers.
Also, in USAP patients AUC for hsCRP was the highest(0.808 ± 0.074), and significantly higher only in comparisonwith TNF-α (0.548 ± 0.097). Fibrinogen, NO2/NO3, andTNF-α showed very high sensitivity (90.5%, 92.7%, and94.7%, resp.) for optimal cutoff values, and low specificity(under 59.5%). Neopterin showed high specificity (94.3%),and rather poor sensitivity (34.9%). The best predictor fordisease activity was CRP with specificity of 87.2%, andsensitivity 69.8% when the cutoff was >4.1 mg/L.
In the STEMI group, ROC for hsCRP (0.923 ± 0.043)was significantly higher in comparison with all others. Thehighest sensitivity was obtained for iNOS (100%), but verylow specificity (21.1%) excluded this marker from clinicaluse. Due to good sensitivity (88.6%) and specificity (89.7%)for cutoff >4.7, CRP alone may be satisfactory for patientscreening.
The results related to ROC curves of lipid markers wereshown in Figure 1 and Table 5. The highest AUC in SAPpatients was obtained for Lp(a) (0.835 ± 0.049), whichis significantly higher than AUC for oxLDL, LDL-c andapoB (P < .001). ApoA-I also had the AUC (0.780 ±0.065) significantly higher than AUC for oxLDL and LDL-c (P < .05). However, sensitivity (81.8%), and specificity(80.0%) of Lp(a) were higher compared to all the other lipidmarkers.
In patients with USAP the highest AUCs were observedfor Lp(a) (0.951 ± 0.025, significantly higher in comparisonwith LDL-c, oxLDL, apoB and TG), and apoA-I (0.876 ±0.051, significantly higher than apoB and oxLDL AUCs).Sensitivity and specificity for Lp(a) were very high (97.9%and 84.0%, resp.), while for apoA-I these values were 91.3%and 71.8%, respectively. So, these markers may be usefulin assessing disease activity in more than 90% of patients.
No difference between the ability of Lp(a) and apoA-I tocorrectly stratify the patients was found.
Further, in STEMI patients both Lp(a) and apoA-I hadalso the highest AUC in comparison with other studiedmarkers. For Lp(a) AUC was 0.881 and statistically differentin comparison with apoB, LDL-c, oxLDL (P < .001) andTG (P < .01), and for apoA-I it was 0.836 (significantlyhigher than AUCs for LDL-c and oxLDL; P < .001). OxLDL,apoB and LDL-c showed high specificity (96.7%, 89.7% and87.2%, resp.), but very poor sensitivity (24.5%, 30.9%, and25.5%, resp.), which made them unsatisfactory for diagnosticscreening. Thus, Lp(a) with 84.9% sensitivity and 84.0%specificity stayed the best predictor, better than apoA-I whosesensitivity was 83.6% and specificity 71.8%.
Since hsCRP showed the best characteristics among allstudied inflammatory markers, and Lp(a) was the best lipidmarker, we compared these two and troponin I in patientgroups and showed that (Table 6) there was a significantdifference between their AUCs in USAP patients in whomAUC for Lp(a) was 0.957 (P < .05) in comparison with 0.859for hsCRP AUC and 0.821 for troponin I AUC (P = .015).In SAP patients, there was no significant difference in AUCbetween the different markers although hsCRP AUC andLp(a) AUC were significantly higher ((P < .05), P < .01,resp.) than AUC for troponin I.
Generally, almost all atherogenic indexes showed accept-able discriminative ability for ischemic heart disease patients(Figure 3, Table 7). The ratio of TG to apoB had the highestAUC (0.89 ± 0.03) and significantly higher than AUCs forapoB/apoA (0.71 ± 0.06), LDL-c/apoB (0.77 ± 0.06), LDL-c/HDL-c (0.65 ± 0.06), and Tc/HDL-c (0.73 ± 0.06) in SAPpatients. A similar relationship was observed for TG/HDL-c with AUC of 0.88 ± 0.04. Identical AUCs were found

Cardiology Research and Practice 7
Table 5: The results of ROC curves analysis of lipid markers in ischemic heart disease patients.
AUC SE 95%CI Specificity Sensitivity Criterion
SAP
ApoA-I 0.780a 0.065 0.660–0.873 71.8 77.3 ≤1.28
ApoB 0.542b 0.076 0.414–0.666 92.3 38.6 ≤0.9
LDL-c 0.539b 0.076 0.411–0.664 87.2 40.9 ≤3.06
Lp(a) 0.835c 0.049 0.722–0.915 80.0 81.8 >8.2
oxLDL 0.552 0.075 0.423–0.675 80.0 43.2 >280
TG 0.704 0.065 0.578–0.811 48.7 86.4 >1.31
USAP
ApoA-I 0.876C 0.051 0.773–0.944 71.8 91.3 ≤1.28
ApoB 0.557 0.074 0.430–0.678 89.7 21.7 >1.41
LDL-c 0.588 0.075 0.461–0.707 64.1 60.9 ≤3.49
Lp(a) 0.951B 0.025 0.869–0.988 84.0 97.9 >8.2
oxLDL 0.529 0.075 0.403–0.652 93.3 32.6 >460
TG 0.742A 0.060 0.621–0.841 71.8 69.6 >1.94
STEMI
ApoA-I 0.836∗∗∗∗ 0.057 0.732–0.911 71.8 83.6 ≤1.26
ApoB 0.626∗∗ 0.068 0.506–0.735 89.7 30.9 >1.41
LDL-c 0.514 0.073 0.395–0.631 87.2 25.5 ≤3.07
Lp(a) 0.881∗∗∗/∗∗∗∗∗ 0.038 0.785–0.994 84.0 84.9 >8.2
oxLDL 0.505 0.074 0.387–0.623 96.7 24.5 >4.80
TG 0.664∗ 0.065 0.546–0.769 56.4 69.1 >1.49aP < .05 versus LDL-c and oxLDL, bP < .05 versus TG, cP < .001 versus oxLDL, LDL-c and ApoB, AP < .05 versus ApoB and OxLDL, BP < .001 versus LDL-c,oxLDL, ApoB and TG, CP < .001 versus ApoB, LDL-c and oxLDL, ∗P < .05 versus ApoA, LDL-c, ∗∗P < 0.01 versus ApoA, LDL-c, ∗∗∗P < .01 versus TG,∗∗∗∗P < .001 versus LDL-c, oxLDL, ∗∗∗∗∗P < .001 versus ApoB, LDL-c, OxLDL.
Table 6: Comparison of CRP and Lp(a) and troponin I ROC curves analysis.
AUC SE 95%CI Specificity Sensitivity Cutoff
SAPCRP 0.758∗∗ 0.057 0.640–0.853 57.6 75.7 >1.9
Lp(a) 0.843∗∗∗ 0.046 0.736–0.919 80.0 81.8 >8.2
Troponin I 0.568 0.049 0.480–0.654 96.9 17.6 >0
USAPCRP 0.859 0.043 0.750–0.930 87.2 69.8 >4.1
Lp(a) 0.957∗ 0.023 0.880–0.990 84.0 97.9 >8.2
Troponin I 0.821 0.038 0.743–0.883 96.8 63.5 >0
STEMICRP 0.946 0.024 0.870–0.984 89.7 88.6 >4.7
Lp(a) 0.888 0.036 0.796–0.948 84.0 84.9 >8.2
Troponin I 1.000 0.000 0.971–1.000 100.0 93.4 >0.01∗P < .05 versus CRP and troponin I in USAP patients, ∗∗P < .05 versus troponin I in SAP patients, ∗∗∗P < 0.001 versus troponin I in SAP patients.
for apoB/apoA and TG/HDL-c ratios (0.89 ± 0.03) and alittle bit lower AUC for Tc/HDL-c (0.87 ± 0.03) in USAPpatients. All three AUCs were significantly higher than AUCfor LDL-c/HDL-c. The highest sensitivity and specificitywere observed for TG/HDL-c (80.0% and 82.4%, resp.),and for Tc/HDL-c (73.3% and 71.4%, resp.). In STEMIpatients AUC for TG/HDL-c was the highest (0.91 ± 0.03),followed by Tc/HDL-c (0.89 ± 0.03), and apoB/apoA (0.87± 0.04). Satisfactory sensitivity and specificity were noted forTG/apoB (78.6% and 74.3%, resp.).
Multinomial logistic regression was used to adequatelypredict (H = 203.12, df = 15, P < .0005) a classification ofcases into evaluated groups. This model classified evaluatedcases into the SAP group with an accuracy of 87.9%, controlgroup 82.6%, STEMI group with 78.4%, and USAP groupwith 57.6%. Pearson (H = 337.53, df = 402, P = .99) and
Deviance (H = 173.73, df = 402, P = 1) confirmed that thismodel adequately fited the data. Obtained model explainedabout 82% of variation in evaluated groups. Likelihood ratiotest showed that Lp(a), apoA-I, TG, and CRP were predictorssignificantly (P < .0005) contributing to the obtained model.In comparison to the control group, Lp(a) (OR = 1.27, 95%CI 1.11 to 1.45, P = .001) and apoA-I (OR = 8.295, CI95% 1.22 to 56.35, P = .03) represented significant, whileTG (OR = 0.23, 95% CI 0.04 to 1.52, P = 0.13), CRP(OR = 1.36, 95% CI 0.97 to 1.90, P = .07), and neopterin(OR = 1.05, 95% CI 0.96 to 1.15, P = .26) unsignificantpredictors in the SAP group. In the USAP group, Lp(a)(OR = 1.29, 95% CI 1.12 to 1.48, P < .0005), TG (OR = 3.32,95% CI 1.11 to 9.93, P = .03), apoA-I (OR = 0.004, 95% CI 0to 0.37, P = .02), and CRP (OR = 1.56, 95% CI 1.11 to 2.18,P = .01) were significant predictors in comparison with the

8 Cardiology Research and Practice
Table 7: The results of ROC curves analysis of atherogenic indexes in patients with ischemic heart disease.
AUC SE 95%CI Specificity Sensitivity Criterion
SAP
apoB/apoAb 0.717 0.062 0.594–0.820 78.2 64.1 >0.93
LDL-c/apoBd 0.771 0.062 0.652–0.865 52.7 76.9 ≥3.14
LDL-c/HDL-c 0.657 0.067 0.531–0.769 65.5 86.2 >3.24
Tc/HDL-cd 0.737 0.060 0.615–0.837 63.6 74.3 >5.08
TG/apoBa,c 0.897 0.037 0.798–0.958 80.0 54.3 >1.19
TG/HDL-cd,e 0.883 0.040 0.781–0.949 87.0 55.9 >0.88
USAP
apoB/apoA∗∗ 0.896 0.034 0.807–0.953 56.8 82.1 >1.08
LDL-c/apoB 0.745 0.063 0.635–0.836 68.2 76.9 >3.14
LDL-c/HDL-c 0.840 0.043 0.741–0.912 53.3 93.1 >3.40
Tc/HDL-c∗∗ 0.873 0.038 0.780–0.937 73.3 71.4 >4.97
TG/apoB 0.787 0.050 0.681–0.871 61.4 97.1 >1.85
TG/HDL-c∗ 0.896 0.034 0.808–0.953 80.0 82.4 >1.54
STEMI
apoB/apoAA,C 0.879 0.040 0.778–0.945 81.0 41.0 >0.74
LDL-c/apoB 0.784 0.061 0.668–0.874 76.2 59.0 ≤3.33
LDL-c/HDL-c 0.800 0.052 0.686–0.887 36.4 100.0 >3.76
Tc/HDL-cB 0.889 0.038 0.790–0.952 45.5 77.1 >5.22
TG/apoB 0.849 0.045 0.742–0.923 78.6 74.3 >1.49
TG/HDL-cA,D 0.912 0.034 0.819–0.960 88.6 55.9 >0.88aP < .05 versus apoB/apoA, LDL-c/apoB and Tc/HDL-c, bP < .01 versus LDL-c/HDL-c, cP < .01 versus LDL-c/HDL-c, dP < .001 versus LDL-c/HDL-c, eP <.001 versus Tc/HDL-c, ∗P < .05 versus LDL-c/apoB and LDL-c/HDL-c, ∗∗P < .05 versus LDL-c/HDL-c, AP < .05 versus LDL-c/apoB, BP < .05 versus LDL-c/HDL-c, CP < .01 versus LDL-c/HDL-c, DP < .01 versus TG/apoB.
control group. Finally, in AIM group, only Lp(a) (OR = 1.25,95% CI 1.09 to 1.43, P = .001) and CRP (OR = 1.59, 95%CI 1.14 to 2.22, P = .007) represented significant predictorscomparing to the control group.
4. Discussion
The results of this study clearly demonstrated that noneof the studied standard and inflammatory markers showedany significant difference between statin-treated and non-statin-treated patients. However, among lipid markers sig-nificantly lower apoA-I values were observed in all statin-treated groups, as well as significantly higher apoB onesin STEMI(+) group in comparison with non-statin-treatedpatients. Since almost all our patients differed only in thestatin treatment, observed differences indicate that the statinsdid not have the same effects on all lipid markers, whichmade them less sensitive markers.
In this multimarkers study, we showed that Lp(a) was themarker with the best clinical accuracy, being the marker withthe largest AUC and the best sensitivity and specificity amongother lipid markers, as well as atherogenic indexes in allpatient groups. Of all inflammatory studied markers, hsCRPwas found to show significantly higher AUC in comparisonwith all other inflammatory markers in patients with STEMI.In USAP patients, hsCRP also had the highest AUC althoughthis gained significance only compared to TNF-α.
The comparison of hsCRP and Lp(a) ROC curves showedthat AUC for Lp(a) was higher than for hsCRP in SAP andUSAP patients, and a significant difference existed only inUSAP patients. In the STEMI group, hsCRP AUC was higher
than Lp(a) AUC, but the difference was not significant. Thesefindings showed that Lp(a) would be a marker with betterclinical accuracy, particularly in patients with USAP whatwas also confirmed by multinomial logistic regression.
Studies in the past [18] showed that the relationshipbetween coronary artery disease and Lp(a) was weak andthat Lp(a) may be a marker at only high levels. It could notbe used for widespread initial screening because the benefitsmight be small. Others have observed that the free apo(a)had a better diagnostic test performance in atheroscleroticrisk assessment than Lp(a) testing [19]. Elevated Lp(a)level is also considered to be the best single marker forthe presence of ischemic cerebrovascular disease, and theincreased portion of the smaller-molecular-weight apo(a)isoforms in patients and individuals with a sonographyscore >0 points toward an inherited predisposition for thisdisease [13]. Erbagci et al. [20] showed that for optimalcutoff values for Lp(a) of 22.6 and 9.8 mg/dL, the diagnosticvalues of 0.612 and 0.596 in men and women, respectively,with coronary heart disease with or without angiographicallydemonstrable lesion were found. Our results showed thatLp(a) had better AUC characteristics and may be moreuseful than other multimarkers in SAP and USAP patientsespecially in statin-treated ones.
It was also noted that optimal cutoff levels for hsCRP inwomen and men were found as 2.1 and 3.0 mg/L with thediagnostic values of 0.792 and 0.770, respectively. Contraryto these results, we found much higher diagnostic values of0.843, 0.957, and 0.888 for Lp(a) in SAP, USAP, and STEMIpatients, as well as higher diagnostic values of 0.859 and0.946 for hsCRP in USAP and STEMI patients, and the

Cardiology Research and Practice 9
0
Sen
siti
vity
20
40
60
80
100
0 20
ApoAApoBLDL-c
Lp(a)oxLDLTG
40 60 80 100
100-specificity
(a)
0
Sen
siti
vity
20
40
60
80
100
0 20
ApoAApoBLDL-c
Lp(a)oxLDLTG
40 60 80 100
100-specificity
(b)
0
Sen
siti
vity
20
40
60
80
100
0 20
ApoAApoBLDL-c
Lp(a)oxLDLTG
40 60 80 100
100-specificity
(c)
Figure 1: ROC curves of lipid markers: ApoA-I, ApoB, Lp(a), LDL-c, oxLDL, and TG in STEMI patients (a), USAP patients (b), and SAPpatients (c).
difference between these two markers was significant in theUSAP group. This finding is essential as, taking into accountoptimal cutoff level as >8.2 for Lp(a), Lp(a) is a betterindependent predictor than CRP in SAP and USAP patientson chronic treatment with statins. The Atherosclerosis Riskin Communities (ARIC) study showed that including some
of the additional risk factors in the basic model containingonly traditional risk factors might improve predictivity. So,they frequently found that the biggest contributors to thehighest increase in AUC, outside the basic model, werealbumin, fibrinogen, and Lp(a) [21]. Bennet et al. [22] notedthat baseline Lp(a) levels had little or no correlation with

10 Cardiology Research and Practice
0
Sen
siti
vity
20
40
60
80
100
0 20
CRPFibrinogeniNOC
NeopterinNO2/NO3
TNF-α
40 60 80 100100-specificity
(a)
0
Sen
siti
vity
20
40
60
80
100
0 20
CRPFibrinogeniNOC
NeopterinNO2/NO3
TNF-α
40 60 80 100100-specificity
(b)
0
Sen
siti
vity
20
40
60
80
100
0 20
CRPFibrinogeniNOC
NeopterinNO2/NO3
TNF-α
40 60 80 100100-specificity
(c)
Figure 2: ROC curves of inflammatory markers: CRP, fibrinogen, iNOS, neopterin, NO2/ NO3, and TNF-α in STEMI patients (a), USAPpatients (b), and SAP patients (c).
known cardiovascular risk factors including age, sex, totalcholesterol level, and blood pressure. They concluded thatthe levels of Lp(a) were highly stable within individualsacross the time and that there were independent, continuousassociations between Lp(a) levels and a risk of coronaryheart disease in a broad range of individuals. It seems that
nontraditional risk factors could become more useful inpredicting cardiovascular risk since clinical trials of statintherapy have demonstrated that baseline or treated LDL-c levels are only weakly associated with a net coronaryangiographic change or cardiovascular events [23]. Statinsreduce cardiovascular disease events and improve outcomes.

Cardiology Research and Practice 11
0
Sen
siti
vity
20
40
60
80
100
0 20
ApoB/ApoA-ILDL-c/ApoBLDL-c/HDL-c
Tc/HDL-cTG/ApoBTG/HDL-c
40 60 80 100100-specificity
(a)
0
Sen
siti
vity
20
40
60
80
100
0 20
ApoB/ApoA-ILDL-c/ApoBLDL-c/HDL-c
Tc/HDL-cTG/ApoBTG/HDL-c
40 60 80 100100-specificity
(b)
0
Sen
siti
vity
20
40
60
80
100
0 20
ApoB/ApoA-ILDL-c/ApoBLDL-c/HDL-c
Tc/HDL-cTG/ApoBTG/HDL-c
40 60 80 100100-specificity
(c)
Figure 3: ROC curves of atherogenic indexes: ApoB/ApoA-I, LDL-c/ApoB, LDL-c/HDL-c, Tc/HDL-c, TG/ApoB, and TG/HDL-c in patientswith STEMI (a), USAP (b), and SAP (c).
Large clinical trials indicate that statin-treated individualshave significantly smaller chance of cardiovascular disease,irirespective levels, and that the treatment is particularlyeffective among patients with high CRP levels. Beside thereduction of lipid and CRP levels [23], statins express
additional effects resulting in the improvement of endothelialfunction, antiinflammatory and antiproliferative response,and the regression of human atherosclerotic lesions [23–25]. Contrary to previous findings, in patients with typeIIa hypercholesterolemia, both atorvastatin and simvastatin,

12 Cardiology Research and Practice
significantly reduced Lp(a) levels but not apolipoprotein (a)fragment levels after six-week treatment [26]. In spite ofthese findings, we did not find any significant differencein Lp(a) concentration between the statin-treated and non-statin-treated patients, but we observed significantly lowerapoA-I values in all patient groups, and significantly higherapoB in STEMI patients treated with statins.
In a prospective cohort study of more than 15000 healthywomen aged 45 years or older, treated with aspirin andvitamin E and followed up over a 10-year period, it was notedthat non-HDL-c and Tc/HDL-c were as good as, or betterthan, apolipoprotein fraction in the prediction of future car-diovascular events [27]. While these results support the useof standard lipid measurements, rather than apolipoproteinsA-I and B in primary risk detection, in a randomized trialof lovastatin, the levels of apoB and the ratio of apoB/apoA-I were better predictors of future cardiovascular events thanLDL-c, when participants were receiving the treatment [28].On this basis, it has been suggested that the measurementof apoB could replace the current lipid status evaluationamong patients taking statins [29]. Since our study showedthat apoB significantly changed only in STEMI patients, it isnot reliable for the evaluation ischemic heart disease patientstaking statins. According to our results, it can be Lp(a).
In conclusion, considering our results, the best marker inassessing ischemic heart disease seemed to be CRP in STEMI,TG/apoB in SAP, and Lp(a) in USAP patients, respectively.
Statement
The study was approved by the Clinical Centre Nis EthicalCommittee and all the subjects included in study providedwritten informed consent.
There was no possible conflict of interests consideringacception of any funding or support by any organizationgaining or loosing from the results of this study. There wereno any other conflicting interests at all.
V. B. Djordjevic desined the study and wrote the firstdraft of the manuscript. M. Deljanin-Ilic and L. Popovicrecruited the patients and wrote the clinical protocol. V.Cosic and L. Zvezdanovic took the blood samples, collectedand undertook standard biochemical analyses. I. Stojanovicdetermined nitrite/nitrate concentration in plasma. V. Cosic,V. B Djordjevic, P. Vlahovic, and S. Kundalic undertookthe determination of TNF-α, neopterin, iNOS, and oxLDL.V. B. Djordjevic and P. Vlahovic undertook the statisticalanalysis and managed the literature searches and analysis.All authors contributed to and have approved the finalpaper.
Acknowledgments
The authors are grateful to Mr. Filip Petrovic for thetechnical assistance in the realization of the paper. This workwas financially supported by the Ministry of Science andTechnological Development of Serbia.
References
[1] R. Ross, “Atherosclerosis—an inflammatory disease,” NewEngland Journal of Medicine, vol. 340, no. 2, pp. 115–126, 1999.
[2] M. R. Taskinen, “Diabetic dyslipidaemia: from basic researchto clinical practice,” Diabetologia, vol. 46, no. 6, pp. 733–749,2003.
[3] K. J. Williams and I. Tabas, “Lipoprotein retention- andclues for atheroma regression,” Arteriosclerosis, Thrombosis,and Vascular Biology, vol. 25, no. 8, pp. 1536–1540, 2005.
[4] N. A. Le and M. F. Walter, “The role of hypertriglyceridemiain atherosclerosis,” Current Atherosclerosis Reports, vol. 9, no.2, pp. 110–115, 2007.
[5] J. L. Breslow, “Cardiovascular disease burden increases, NIHfunding decreases,” Nature Medicine, vol. 3, no. 6, pp. 600–601,1997.
[6] E. Braunwald, “Shattuck lecture cardiovascular medicineat the turn of the millennium: triumphs, concerns, andopportunities,” New England Journal of Medicine, vol. 337, no.19, pp. 1360–1369, 1997.
[7] C. J. Packard, “LDL subfractions and atherogenicity: anhypothesis from the University of Glasgow,” Current MedicalResearch and Opinion, vol. 13, no. 7, pp. 379–390, 1996.
[8] I. Jialal, D. Stein, D. Balis, S. M. Grundy, B. Adams-Huet,and S. Devaraj, “Effect of hydroxymethyl glutaryl coenzymea reductase inhibitor therapy on high sensitive C-reactiveprotein levels,” Circulation, vol. 103, no. 15, pp. 1933–1935,2001.
[9] S. Kinlay, G. G. Schwartz, A. G. Olsson et al., “High-doseatorvastatin enhances the decline in inflammatory markersin patients with acute coronary syndromes in the MIRACLstudy,” Circulation, vol. 108, no. 13, pp. 1560–1566, 2003.
[10] J. B. Muhlestein, J. L. Anderson, B. D. Horne et al., “Earlyeffects of statins in patients with coronary artery disease andhigh C-reactive protein,” American Journal of Cardiology, vol.94, no. 9, pp. 1107–1112, 2004.
[11] M. A. Albert, E. Danielson, N. Rifai, and P. M. Ridker, “Effectof statin therapy on C-reactive protein levels: the pravastatininflammation/CRP evaluation (PRINCE): a randomized trialand cohort study,” Journal of the American Medical Association,vol. 286, no. 1, pp. 64–70, 2001.
[12] Y. P. Jin, G. M. Qin, S. Z. Zhang, C. J. Li, and G. Xu,“Clinical evaluation of risk factors for coronary heart disease,”Zhonghua Yu Fang Yi Xue Za Zhi, vol. 37, no. 2, pp. 98–101,2003.
[13] G. Jurgens, W. C. Taddei-Peters, P. Koltringer et al., “Lipopro-tein(a) serum concentration and apolipoprotein(a) phenotypecorrelate with severity and presence of ischemic cerebrovascu-lar disease,” Stroke, vol. 26, no. 10, pp. 1841–1848, 1995.
[14] C. W. Hamm and E. Braunwald, “A classification of unstableangina revisited,” Circulation, vol. 102, no. 1, pp. 118–122,2000.
[15] F. Van de Werf, D. Ardissino, A. Betriu et al., “Task Force on theManagement of Acute Myocardial Infarction of the EuropeanSociety of Cardiology. Management of acute myocardialinfarction in patients presenting with ST-segment elevation,”European Heart Journal, vol. 24, pp. 28–66, 2003.
[16] V. B. Djordjevic, I. Stojanovic, V. Cosic et al., “Serumneopterin, nitric oxide, inducible nitric oxide synthase andtumor necrosis factor-α levels in patients with ischemic heartdisease,” Clinical Chemistry and Laboratory Medicine, vol. 46,no. 8, pp. 1149–1155, 2008.

Cardiology Research and Practice 13
[17] J. A. Navarro-Gonzalvez, C. Garcıa-Benayas, and J. Arenas,“Semiautomated measurement of nitrate in biological fluids,”Clinical Chemistry, vol. 44, no. 3, pp. 679–681, 1998.
[18] G. A. Hobbs, I. V. Kaplan, and S. S. Levinson, “Mechanizedlipoprotein(a) assay as a marker for coronary artery diseaseillustrates the usefulness of high lipoprotein(a) levels,” ClinicaChimica Acta, vol. 274, no. 1, pp. 1–13, 1998.
[19] W. Herrmann, S. Quast, K. Wolter et al., “Determinationof free apolipoprotein(a) in serum by immunoassay and itssignificance for risk assessment in patients with coronaryartery disease,” Clinical Chemistry and Laboratory Medicine,vol. 37, no. 1, pp. 21–28, 1999.
[20] A. B. Erbagci, M. Tarakcioglu, M. Aksoy et al., “Diagnosticvalue of CRP and Lp(a) in coronary heart disease,” ActaCardiologica, vol. 57, no. 3, pp. 197–204, 2002.
[21] L. E. Chambless, A. R. Folsom, A. R. Sharrett et al., “Coronaryheart disease risk prediction in the Atherosclerosis Risk inCommunities (ARIC) study,” Journal of Clinical Epidemiology,vol. 56, no. 9, pp. 880–890, 2003.
[22] A. Bennet, E. Di Angelantonio, S. Erqou et al., “Lipoprotein(a)levels and risk of future coronary heart disease: large-scaleprospective data,” Archives of Internal Medicine, vol. 168, no.6, pp. 598–608, 2008.
[23] R. S. Rosenson and C. C. Tangney, “Antiatherothromboticproperties of statins: implications for cardiovascular eventreduction,” Journal of the American Medical Association, vol.279, no. 20, pp. 1643–1650, 1998.
[24] J. K. Plenge, T. L. Hernandez, K. M. Weil et al., “Simvastatinlowers C-reactive protein within 14 days: an effect inde-pendent of low-density lipoprotein cholesterol reduction,”Circulation, vol. 106, no. 12, pp. 1447–1452, 2002.
[25] R. Altman, “Risk factors in coronary atherosclerosis athero-inflammations: the meeting point,” Thrombosis Journal, vol. 1,article 4, 2003.
[26] S. Gonbert, S. Malinsky, A. C. Sposito et al., “Atorvastatinlowers lipoprotein(a) but not apolipoprotein(a) fragmentlevels in hypercholesterolemic subjects at high cardiovascularrisk,” Atherosclerosis, vol. 164, no. 2, pp. 305–311, 2002.
[27] P. M. Ridker, N. Rifai, N. R. Cook, G. Bradwin, and J. E.Buring, “Non-HDL cholesterol, apolipoproteins A-I and B100,standard lipid measures, lipid ratios, and CRP as risk factorsfor cardiovascular disease in women,” Journal of the AmericanMedical Association, vol. 294, no. 3, pp. 326–333, 2005.
[28] A. M. Gotto, E. Whitney, E. A. Stein et al., “Relation betweenbaseline and on-treatment lipid parameters and first acutemajor coronary events in the Air Force/Texas CoronaryAtherosclerosis Prevention Study (AFCAPS/TexCAPS),” Cir-culation, vol. 101, no. 5, pp. 477–484, 2000.
[29] S. Miremadi, A. Sniderman, and J. Frohlich, “Can measure-ment of serum apolipoprotein B replace the lipid profilemonitoring of patients with lipoprotein disorders?” ClinicalChemistry, vol. 48, no. 3, pp. 484–488, 2002.

Submit your manuscripts athttp://www.hindawi.com
Stem CellsInternational
Hindawi Publishing Corporationhttp://www.hindawi.com Volume 2014
Hindawi Publishing Corporationhttp://www.hindawi.com Volume 2014
MEDIATORSINFLAMMATION
of
Hindawi Publishing Corporationhttp://www.hindawi.com Volume 2014
Behavioural Neurology
EndocrinologyInternational Journal of
Hindawi Publishing Corporationhttp://www.hindawi.com Volume 2014
Hindawi Publishing Corporationhttp://www.hindawi.com Volume 2014
Disease Markers
Hindawi Publishing Corporationhttp://www.hindawi.com Volume 2014
BioMed Research International
OncologyJournal of
Hindawi Publishing Corporationhttp://www.hindawi.com Volume 2014
Hindawi Publishing Corporationhttp://www.hindawi.com Volume 2014
Oxidative Medicine and Cellular Longevity
Hindawi Publishing Corporationhttp://www.hindawi.com Volume 2014
PPAR Research
The Scientific World JournalHindawi Publishing Corporation http://www.hindawi.com Volume 2014
Immunology ResearchHindawi Publishing Corporationhttp://www.hindawi.com Volume 2014
Journal of
ObesityJournal of
Hindawi Publishing Corporationhttp://www.hindawi.com Volume 2014
Hindawi Publishing Corporationhttp://www.hindawi.com Volume 2014
Computational and Mathematical Methods in Medicine
OphthalmologyJournal of
Hindawi Publishing Corporationhttp://www.hindawi.com Volume 2014
Diabetes ResearchJournal of
Hindawi Publishing Corporationhttp://www.hindawi.com Volume 2014
Hindawi Publishing Corporationhttp://www.hindawi.com Volume 2014
Research and TreatmentAIDS
Hindawi Publishing Corporationhttp://www.hindawi.com Volume 2014
Gastroenterology Research and Practice
Hindawi Publishing Corporationhttp://www.hindawi.com Volume 2014
Parkinson’s Disease
Evidence-Based Complementary and Alternative Medicine
Volume 2014Hindawi Publishing Corporationhttp://www.hindawi.com