lipid14: the amber lipid force field - ross walker€¦ · lipid14: the amber lipid force field ......
TRANSCRIPT

Lipid14: The Amber Lipid Force FieldCallum J. Dickson,§,† Benjamin D. Madej,‡,±,† Åge A. Skjevik,‡,¶ Robin M. Betz,‡ Knut Teigen,¶
Ian R. Gould,*,§ and Ross C. Walker*,‡,±
§Department of Chemistry and Institute of Chemical Biology, Imperial College London, South Kensington SW7 2AZ, UnitedKingdom‡San Diego Supercomputer Center, University of California San Diego, 9500 Gilman Drive MC0505, La Jolla, California 92093-0505,United States¶Department of Biomedicine, University of Bergen, N-5009 Bergen, Norway±Department of Chemistry and Biochemistry, University of California San Diego, 9500 Gilman Drive MC0505, La Jolla, California92093-0505, United States
*S Supporting Information
ABSTRACT: The AMBER lipid force field has been updated to create Lipid14, allowing tensionlesssimulation of a number of lipid types with the AMBER MD package. The modular nature of this forcefield allows numerous combinations of head and tail groups to create different lipid types, enabling theeasy insertion of new lipid species. The Lennard-Jones and torsion parameters of both the head and tailgroups have been revised and updated partial charges calculated. The force field has been validated bysimulating bilayers of six different lipid types for a total of 0.5 μs each without applying a surfacetension; with favorable comparison to experiment for properties such as area per lipid, volume per lipid,bilayer thickness, NMR order parameters, scattering data, and lipid lateral diffusion. As the derivation ofthis force field is consistent with the AMBER development philosophy, Lipid14 is compatible with theAMBER protein, nucleic acid, carbohydrate, and small molecule force fields.
■ INTRODUCTION
Membranes are integral components of the cell, separatingintracellular compartments from the cytosol. Such membranesconsist of a back-to-back arrangement of lipid molecules, driveninto a bilayer structure by the hydrophobic effect, leaving thepolar lipid head groups exposed to water, and bringing thenonpolar lipid tail groups together. The composition of cellmembranes is complex, with constituent species including, butnot limited to, saturated and unsaturated PC and PE lipids,sphingomyelin and cholesterol, which serve as a matrix in whichmembrane proteins may reside.1 Cell membranes possessfunctions such as regulating transport in to and out of the celland modulating the activity of membrane embedded ionchannels and proteins.2,3
In order to probe the many roles of membranes in the cell,membrane structures are studied experimentally usingtechniques such as X-ray and neutron scattering, IR/Raman,and NMR spectroscopy.4,5 To gain atomic-level resolution,however, membranes may also be simulated computationallyusing molecular dynamics (MD). The validity of resultsobtained using MD methods depends, to a large extent, onthe potential energy function, or force field, that is used.Membranes can be simulated using all-atom, united-atom, or
coarse-grained models,6−13 with the increasing simplicity ofeach representation allowing access to larger models and longertime scales, at the expense of atomic detail. All-atom modelsmay be preferred for bilayer simulations due to their ability toreproduce NMR order parameters and easy combination withall-atom protein, nucleic acid, carbohydrate, and small molecule
force fields.14−16 One such MD software package that includesall-atom simulations is AMBER,17,18 which contains extensivelyvalidated protein, nucleic, carbohydrate, and small moleculeforce fields. The AMBER simulation code has also been portedto NVIDIA GPU cards, making simulation speeds in excess of100 ns per day possible for systems of 25,000 to 50,000 atoms,with systems of up to 4 million atoms possible on the latestgeneration hardware.19−21 Although the AMBER force fieldsuite includes numerous different species of biological interest,parameters for the simulation of lipids have traditionally beenlacking. Recently the Lipid11 framework was introduced, whichis a modular lipid AMBER force field, allowing the simulationof a number of lipids via the combination of different head andtail groups.22 Lipid11 used force field parameters predom-inantly taken directly from the General Amber Force Field(GAFF).16 Although previous studies found some success insimulating lipid bilayers using GAFF parameters,23−25 longertime scale simulations required a surface tension term in orderto keep a bilayer in the correct phase at a given temperature.22
In this paper we draw inspiration from previous work26 toupdate Lipid11 headgroup and tail group charges andparameters to enable proper tensionless simulation of lipidbilayers, thereby creating a modular AMBER lipid force field.Lennard-Jones and torsion parameters are revised, whilecharges are derived according to the standard AMBERconvention, as was implemented in Lipid11 with minor
Received: November 27, 2013
Article
pubs.acs.org/JCTC
© XXXX American Chemical Society A dx.doi.org/10.1021/ct4010307 | J. Chem. Theory Comput. XXXX, XXX, XXX−XXX

improvements in sampling for Lipid14. As such, the resultingparameters are expected to be compatible with other forcefields in the AMBER package.We validate these parameters for a number of PC and PE
lipids − six different lipid types are simulated for a total of 500ns each, with resulting area per lipid, volume per lipid,isothermal compressibility, NMR order parameters, scatteringform factors, and lipid lateral diffusion finding favorablecomparison to experiment, particularly for PC lipids. We alsoassess the conformation of the lipid tails by examining thenumber of rotamers and rotamer sequences. To fully test thereproducibility of the results, a number of additional GPU andCPU runs were performed. We believe that these parameterswill be transferable thus allowing the easy insertion of new lipidtypes into Lipid14 owing to the modular nature of the forcefield. The Lipid14 force field will be released with the upcomingAmberTools14. It is our intention to incorporate support foradditional lipid types and other residues commonly found inbilayers, as part of the upcoming release. The derivation ofthese parameters will be described elsewhere.
■ PARAMETERIZATION STRATEGYGeneration of Lipid14 Parameters. Lipid14 aims to
extend the Lipid1122 framework to allow accurate, tensionlesssimulation of numerous lipid types via a modular lipid forcefield. Bond, angle, torsion, and Lennard-Jones (LJ) parametersin Lipid11 were taken directly from the General Amber ForceField (GAFF).16 Although bond and angle parameters shouldnot require updating, it was expected that torsion and LJparameters would need modification to realize this aim.Previous work on lipid simulation with AMBER indicated
that the Lennard-Jones and torsion parameters of the lipidaliphatic tails are intricately linked to the ability of the forcefield to reproduce experimentally observed bilayer properties.26
Indeed, the majority of all-atom lipid force field parameter-ization has involved the modification of the LJ and torsionparameters used to model the aliphatic tail regions of thelipids.7,8,10,27
Simulating a box of 144 pentadecane chains using thestandard GAFF LJ and torsion parameters at constant pressure(1 atm) and temperature (298.15 K) causes the hydrocarbonchains to ‘freeze’ into a crystalline state in under 2 ns (seeFigure 1). Such a scenario has previously been observed byKlauda et al. using a box of tetradecane molecules and theAMBER99 force field.28 Consequently, the calculated densityand heat of vaporization are much higher and the diffusionmuch lower than experiment.In light of this, LJ and torsion parameters were modified to
reproduce the experimental density (ρ) and heat of vapor-ization (ΔHvap) of alkanes covering a range of chain lengths.Given that both the torsion and LJ parameters affected thesimulated ρ and ΔHvap, these parameters were alteredsimultaneously, with the CH2−CH2−CH2−CH2 torsion beingfitted to ab initio data using Paramfit.17,29 Satisfactoryagreement was found by modifying only the LJ parameters ofthe hydrogen atom on the alkane chains.The modified LJ and torsion parameters were tested by
examining the density ρ, heat of vaporization ΔHvap, thediffusion D, the 13C NMR T1 relaxation times, and the trans/gauche conformer populations of a selection of hydrocarbonchains.The parameters of the ester linkage region connecting
headgroup and tail residues in the lipids were then examined
using methyl acetate as a model compound. The density andheat of vaporization of methyl acetate were calculated andΔHvap found to be in poor agreement with experiment. Hencethe Lennard-Jones parameters of a number of atoms in thisregion were also adjusted until better agreement withexperiment was achieved.Once optimal hydrocarbon and glycerol parameters were
identified, attention turned to the lipid partial charges. TheLipid11 force field used a capping procedure, separating thelipid head and tail groups into ‘residues’, thus creating amodular lipid force field.22 The standard AMBER RESPprotocol30 was used to generate partial charges from quantummechanical (QM) optimized structures, using six differentorientations of a single conformation.This methodology was kept for Lipid14. However, in line
with other all-atom lipid force field parameterizations,10,31 agreater number of conformations were used per residue(twenty-five headgroup conformations, fifty tail conforma-tions), with the partial charges calculated as an average over allconformations. The head and tail group starting structures wereextracted from previous in-house bilayer simulations. Thisallows one to obtain Boltzmann weighted charges, introducinga temperature dependence.10,31 The electrostatic potential(ESP) was calculated directly from the conformations extractedfrom a bilayer simulation, with no QM optimization performedon those structures. Charges were derived using the standardAMBER RESP protocol (at the HF/6-31G* level in gasphase).30
Finally, on identification of appropriate LJ parameters andcalculation of lipid partial charges, torsions involving the esterlinkage in the glycerol region were fitted to QM scansperformed on a capped lauroyl (LA) tail moiety.
Hydrocarbon Tail Parameters. The alkane CH2−CH2−CH2−CH2 torsion potential was refitted using torsion scansperformed on hexane and octane molecules using an estimation
Figure 1. A box of 144 pentadecane molecules simulated in the NPTensemble at 298.15 K using the General Amber Force Field16 to modelthe carbon chains.
Journal of Chemical Theory and Computation Article
dx.doi.org/10.1021/ct4010307 | J. Chem. Theory Comput. XXXX, XXX, XXX−XXXB

of the CCSD(T)/cc-pVQZ level of theory via the HM-IErelation32
= +
−
≅ +
− ≡
E
E E
E
E E
E E
[CCSD(T)/LBS]
[CCSD(T)/SBS] ( [CCSD(T)/LBS]
[CCSD(T)/SBS])
[CCSD(T)/SBS] ( [MP2/LBS]
[MP2/SBS]) [MP2: CC]
conf
conf conf
conf
conf conf
conf conf
where the small basis set (SBS) was cc-pVDZ and the largebasis set (LBS) was cc-pVQZ. Consequently molecules wereoptimized at the MP2/cc-pVDZ level before single-pointenergy calculations were performed at the CCSD(T)/cc-pVDZ and MP2/cc-pVQZ levels. In order to obtain arepresentative torsion fit, it was ensured that torsion scans,conducted at increments of 15°, included local minima ofhexane and octane.10,28,33 The Paramfit program of Amber-Tools1317,29 was used to perform a multiple molecule weightedtorsion fit, with the tgt local minima of hexane and tgttt localminima of octane given a weighting of 10, all other localminima given a weighting of 4 and cis conformers given aweighting of 0.1; all other structures were assigned a weightingof 1. These weighting values have previously given good resultsfor alkane torsion fitting.33 Torsions were fitted using a geneticalgorithm.Lennard-Jones parameters were modified while simulta-
neously refitting the torsion parameters (see Table 1) untilgood agreement with experiment was achieved for heats ofvaporization and densities for a range of alkane chains. Theseproperties were monitored by performing liquid phasesimulations of pentane, hexane, heptane, octane, decane,tridecane, and pentadecane. The alkane trajectories alsoenabled the calculation of a number of other properties forcomparison to experiment.Initial charges for each hydrocarbon chain were generated
using the standard AMBER RESP protocol (optimization andcalculation of the ESP at HF/6-31G* level in gas phase). A boxof 288 (pentane, hexane and heptane) or 144 (octane, decane,tridecane, and pentadecane) molecules were then simulated inthe liquid phase at 298.15 K for 10 ns using updated LJ andtorsion parameters. From each liquid phase simulation, fiftydifferent chains were extracted and used for the chargecalculation, with the ESP calculated directly from each structureat the HF/6-31G* level, and partial charges derived using theRESP fitting procedure. Charges were taken as an average overall fifty RESP fits.The heat of vaporization was calculated according to34
Δ = − +H E g E l RT( ) ( )vap pot pot (1)
where Epot(g) is the average molecular potential energy in thegas phase, Epot(l) is the average molecular potential energy inthe liquid phase, R is the gas constant, and T is temperature. Inorder to calculate the heat of vaporization, two simulationswere performed in a similar manner to previous work.26 A gasphase simulation consisting of a single alkane molecule was runfor 10 ns equilibration and 50 ns production under the NPTensemble, at a temperature of 298.15 K to obtain Epot(g). Aliquid phase simulation consisting of a box of either 144 or 288chains, run under the NPT ensemble with periodic boundaryconditions using particle mesh Ewald to treat long-rangeelectrostatics35 and a real space cutoff of 10 Å, was alsoperformed for 60 ns with the first 10 ns removed forequilibration to obtain Epot(l). The temperature was maintainedat 298.15 K using Langevin dynamics and a collision frequencyof 5 ps−1. Bonds involving hydrogen were constrained using theSHAKE algorithm.36 Pressure regulation was achieved withisotropic position scaling, a Berendsen barostat,37 and apressure relaxation time of 1 ps. The system was heated from0 to 298.15 K over 20 ps, with a force constant of 20 kcal/mol/Å2 restraining the chains. This restraint was gradually decreasedto 10, 5 and finally 1 kcal/mol/Å2 and the system simulated for20 ps at each value of the force constant. The heat ofvaporization was then calculated using eq 1, with resultsreported as block averages ± standard deviation using five equalblocks of 10 ns.By reducing the van der Waals radius (R) and well-depth (ε)
of the alkane hydrogen atom type while simultaneouslycorrecting the torsion fit, satisfactory agreement with experi-ment was achieved for ρ and ΔHvap for the alkane chains understudy.Three torsion scans about the CC double bond were also
performed on a cis-5-decene molecule using the MP2:CCextrapolation method − see Figure 2. When fitting the CCdouble bond torsions, the LJ parameters of the alkene hydrogenatom (Lipid14 atom type hB) were scaled until satisfactoryagreement with experiment was found for ρ and ΔHvap of cis-2-hexene, cis-5-decene, and cis-7-pentadecene. Reducing both thevan der Waals radius (R) from 1.459 to 1.25 and the well-depth(ε) from 0.015 to 0.007 resulted in far better agreement for thedensity values (ρ); however, it proved difficult to correct theheat of vaporization (ΔHvap) of cis-5-decene to that of theexperimental value by only modifying the LJ parameters. This isdue to the high charge on the double bond atoms. A similarproblem has previously been encountered by Chiu et al.13 andJambeck et al.10
The uncorrected diffusion DPBC was calculated for eachalkane using the slope of a mean-square displacement (MSD)
Table 1. Modification of LJ and Torsion Parameters of Alkane Chains
LJ parameters CH2−CH2−CH2−CH2 torsion
atom type radius R (Å) well-depth ε (kcal mol−1) force constant PK (kcal mol−1) periodicity PN phase (deg)
Lipid11 cA 1.9080 0.1094 0.20 1 180hA 1.4870 0.0157 0.25 2 180
0.18 3 0Lipid14 cD 1.9080 0.1094 0.3112 1 180
hL 1.4600 0.0100 −0.1233 2 1800.1149 3 0−0.2199 4 00.2170 5 0
Journal of Chemical Theory and Computation Article
dx.doi.org/10.1021/ct4010307 | J. Chem. Theory Comput. XXXX, XXX, XXX−XXXC

plot versus time for the centers of mass, averaged over thetrajectories of each molecule via the Einstein relation
= ⟨Δ ⟩→∞D
r tn t
lim( )
2tPBC
2
f (2)
where nf is the number of dimensions (in this instance nf = 3),and Δr(t)2 is the distance that the molecule travels in time t. Itis then possible to correct for the system size dependence of adiffusion coefficient calculated under periodic boundaries(DPBC) to yield the corrected diffusion coefficient Dcorr byadding the correction term derived by Yeh and Hummer38
επη
= +D Dk Tn L2corr PBC
B
f (3)
where kB is Boltzmann’s constant, T is the temperature, ε =2.837297, η is the viscosity, and L is the length of thesimulation box.The diffusion was calculated from 100 ns NVE ensemble
simulations (extended from the 50 ns NPT runs). PME wasused, along with a 10 Å cutoff, at a temperature of 298.15 K. Inorder to avoid energy and temperature drift, it was necessary toremove the center of mass motion every 500 steps (nscm =500), make both the shake tolerance and Ewald direct sumtolerance more stringent, and reduce the time step to 1 fs.Diffusion values were then calculated by taking the slope of thelinear 2−5 ns region of the MSD versus time curve and thecorrection calculated using experimental viscosity values.Diffusion results are reported with standard deviationscalculated by block averaging, with each 100 ns run dividedinto five 20 ns blocks.The trans, gauche, end gauche, double gauche, and kinked
gtg′+gtg conformer populations were evaluated from the 50 nsNPT runs by classifying torsion angles as either gauche plus (g+) 0−120°, trans (t) 120−240°, or gauche minus (g−) 240−360°.
13C NMR T1 relaxation times were calculated from the NPTalkane simulations using the following formula for dipolarrelaxation from the reorientation correlation functions of theCH vectors:39
∫ μ μ= × ⟨ ⟩−∞
NTP t t
1(1.855 10 s ) ( (0) ( ) d
1
10 2
02
(4)
This assumes motional narrowing and an effective C−Hbond length of 1.117 Å,40 with N specifying the number ofprotons bonded to the carbon and μ the CH vector. T1relaxation times were calculated from simulations of alkanesof four different chain lengths. These simulations were repeatedusing the same NPT alkane protocol at the experimentallyrelevant temperature of 312 K and production runs extended to200 ns to improve sampling.
Head Group Parameters. It was found that the heat ofvaporization of methyl acetate, a model compound representingthe ester linkage region connecting the lipid head and tailgroups, was not sufficiently close to experiment using GAFF/Lipid11 parameters. In order to correct for this discrepancywith experiment, the Lennard-Jones well-depths of the carbonyloxygen (oC), carbonyl carbon (cC), and ester oxygen (oS)atoms were scaled until better agreement with experiment wasobtained (see Table 2). The ester oxygen parameters were alsoapplied to oxygen atoms in the phosphate region.The density and heat of vaporization of methyl acetate were
calculated using an identical procedure as for the hydrocarbon
Figure 2. The energy profile for rotating about selected torsions of acis-5-decene molecule. Energy evaluated using QM and the HM-IEmethod (filled triangle ▲), AMBER with standard GAFF parameters(dotted line), and AMBER with Lipid14 parameters (black line).Torsion fits from the top are as follows: CH2−CH−CH−CH2, CH−CH−CH2−CH2, and CH−CH2−CH2−CH2.
Table 2. Thermodynamic Properties of Methyl Acetate Simulated with GAFF/Lipid11 and Lipid14 and Comparison toExperimenta
LJ parameters
atom type radius R (Å) well-depth ε (kcal mol−1) ΔHvap (kJ mol‑1) ρ (kg m‑3)
Lipid11 oC 1.6612 0.210 39.11 ± 0.04 928.38 ± 0.09oS 1.6837 0.170cC 1.9080 0.086
Lipid14 oC 1.6500 0.140 33.0 ± 0.07 925.8 ± 0.05oS 1.6500 0.120cC 1.9080 0.070
Expt 32.2941 934.241
aAll values at 298.15 K.
Journal of Chemical Theory and Computation Article
dx.doi.org/10.1021/ct4010307 | J. Chem. Theory Comput. XXXX, XXX, XXX−XXXD

chains, with a box of 288 methyl acetate molecules applied forthe liquid phase calculation. Simulations were run for 60 ns andthe final 50 ns used for sampling. Results are reported as blockaverages (five blocks of 10 ns).Partial Charges. RESP fitting was performed in exactly the
same manner to Lipid11,22 using the capping groups shown inFigure 3. However a greater number of conformations wereused to calculate the average charges for each unit.
Twenty-five phosphatidylcholine (PC) and twenty-fivephosphatidylethanolamine (PE) head groups were extractedfrom previous bilayer simulations of DOPC and POPE; whilefifty lauroyl (LA), myristoyl (MY), palmitoyl (PA), and oleoyl(OL) tails were extracted from bilayer simulations of DLPC,DMPC, DPPC, and DOPC, respectively. Each headgroup wasthen capped with a methyl group and each tail capped with anacetate moiety (Figure 3), according to the Lipid11 chargederivation methodology.22 For each conformation, the ESP wascalculated directly from each structure at the HF/6-31G* levelusing Gaussian 09.42 Charges were taken as an average over allconformations for each residue. Resulting charges for the PCand PE headgroup residues and the LA, MY, PA, and OL tailgroup residues are detailed in the Supporting Information.Head Group Torsion Fits. Two torsions involving the
ester linkage region (see Figure 4) were fitted to QM data. The
scans were performed on a capped lauroyl (LA) tail residue, at15° increments using the HM-IE method with Gaussian 09.42
These were then fitted using Paramfit17,29 for periodicity n = 1to n = 5 using the genetic algorithm implemented in Paramfit.As can be seen from Figure 5 Paramfit brings the oS-cC-cD-
cD and oC-cC-cD-cD torsions into substantially betteragreement with the QM data.
■ PARAMETERIZATIONHydrocarbon Parameters. The results for the alkane
properties calculated using the updated torsion and LJparameters are shown in Table 3. The heat of vaporizationvalues increase with alkane chain length, following the
experimental trend and converging with experiment as thenumber of carbon atoms in the chain increases. The simulationvalues match experiment with an RMS error of 7.67%. Thesimulated densities are reproduced somewhat better thanΔHvap, with an RMS error of 2.60% when compared toexperiment. The diffusion values lie close to experiment anddecrease with increasing chain length, following the exper-imental trend; however, the RMS error between simulation andexperiment remains significant at 20.92%. As is also the casewith the heat of vaporization results, the main source of thisdiscrepancy is the result for the shorter alkane chains. Thebetter agreement with experiment of these parameters atmodeling longer hydrocarbon chains may arise from the use ofa high number of octane structures during torsion fitting.Furthermore, this parameter set is intended for the simulationof membrane lipids, which typically contain aliphatic tails thatare ten carbon atoms or greater in length.Thermodynamic properties for a selection of alkenes
calculated using the updated LJ and torsion parameters areshown in Table 4. As previously stated, properties ofunsaturated chains are not as well reproduced as for alkanesdue to the difficulty in tuning LJ parameters to achieve theexperimental heat of vaporization, resulting in an RMS error of13.80% for ΔHvap when compared to experiment. The densityvalues are again better reproduced with an RMS error of 2.35%.The fractions of trans, gauche, end gauche, double gauche, and
kinked gtg′+gtg conformers per molecule were computed forthe selection of alkanes under study (see Table 5).Experimental data, estimated by FTIR, exists only fortridecane;46 however, the updated Lipid14 parametersreproduce these results extremely well with an overestimationof the end gauche and double gauche conformations only.Furthermore, the population of gauche conformations permolecule falls close to the experimental value of 35% for allchains investigated (t/g ratio ∼1.86), meaning that the
Figure 3. Structure and charges of Lipid11/Lipid14 headgroup and tailgroup caps.22
Figure 4. A capped lauroyl tail group residue was used to fit the oS-cC-cD-cD and oC-cC-cD-cD torsions.
Figure 5. The energy profiles for rotating about selected torsions of acapped lauroyl tail group residue. Energy evaluated using QM and theHM-IE method (filled triangle ▲), AMBER with standard GAFF/Lipid11 parameters (dotted line), and AMBER with Lipid14parameters (black line). Torsion fits from the top are oC-cC-cD-cDand oS-cC-cD-cD.
Journal of Chemical Theory and Computation Article
dx.doi.org/10.1021/ct4010307 | J. Chem. Theory Comput. XXXX, XXX, XXX−XXXE
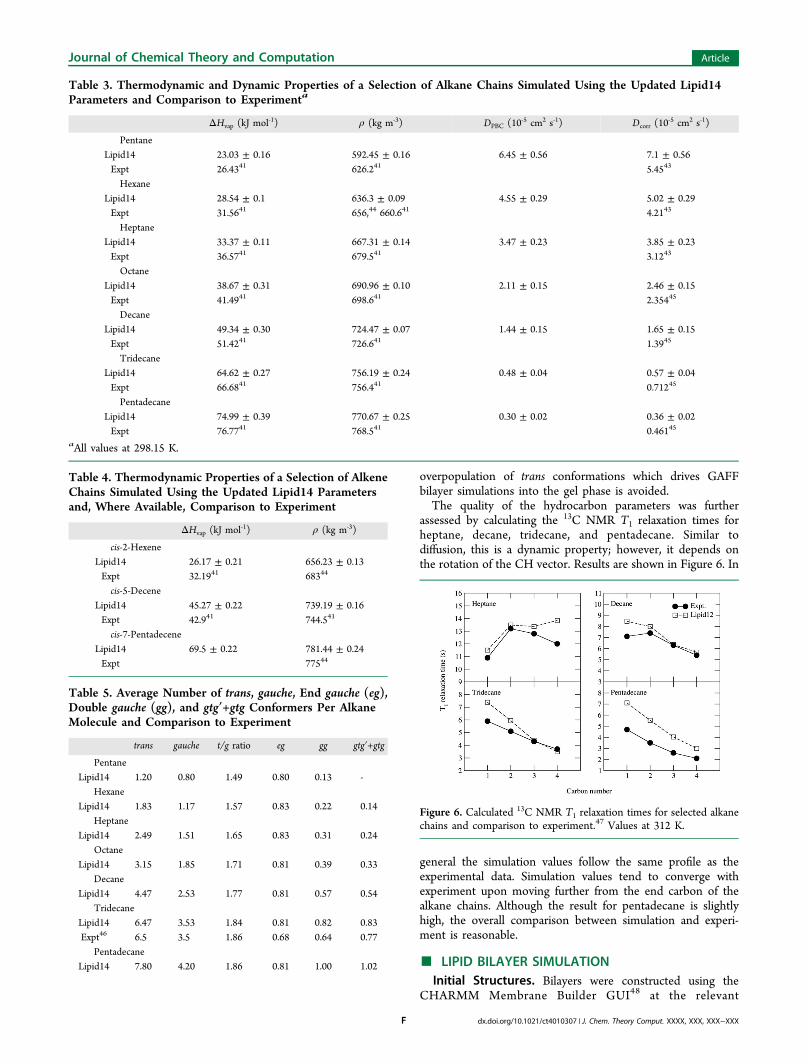
overpopulation of trans conformations which drives GAFFbilayer simulations into the gel phase is avoided.The quality of the hydrocarbon parameters was further
assessed by calculating the 13C NMR T1 relaxation times forheptane, decane, tridecane, and pentadecane. Similar todiffusion, this is a dynamic property; however, it depends onthe rotation of the CH vector. Results are shown in Figure 6. In
general the simulation values follow the same profile as theexperimental data. Simulation values tend to converge withexperiment upon moving further from the end carbon of thealkane chains. Although the result for pentadecane is slightlyhigh, the overall comparison between simulation and experi-ment is reasonable.
■ LIPID BILAYER SIMULATIONInitial Structures. Bilayers were constructed using the
CHARMM Membrane Builder GUI48 at the relevant
Table 3. Thermodynamic and Dynamic Properties of a Selection of Alkane Chains Simulated Using the Updated Lipid14Parameters and Comparison to Experimenta
ΔHvap (kJ mol‑1) ρ (kg m‑3) DPBC (10‑5 cm2 s‑1) Dcorr (10
‑5 cm2 s‑1)
PentaneLipid14 23.03 ± 0.16 592.45 ± 0.16 6.45 ± 0.56 7.1 ± 0.56Expt 26.4341 626.241 5.4543
HexaneLipid14 28.54 ± 0.1 636.3 ± 0.09 4.55 ± 0.29 5.02 ± 0.29Expt 31.5641 656,44 660.641 4.2143
HeptaneLipid14 33.37 ± 0.11 667.31 ± 0.14 3.47 ± 0.23 3.85 ± 0.23Expt 36.5741 679.541 3.1243
OctaneLipid14 38.67 ± 0.31 690.96 ± 0.10 2.11 ± 0.15 2.46 ± 0.15Expt 41.4941 698.641 2.35445
DecaneLipid14 49.34 ± 0.30 724.47 ± 0.07 1.44 ± 0.15 1.65 ± 0.15Expt 51.4241 726.641 1.3945
TridecaneLipid14 64.62 ± 0.27 756.19 ± 0.24 0.48 ± 0.04 0.57 ± 0.04Expt 66.6841 756.441 0.71245
PentadecaneLipid14 74.99 ± 0.39 770.67 ± 0.25 0.30 ± 0.02 0.36 ± 0.02Expt 76.7741 768.541 0.46145
aAll values at 298.15 K.
Table 4. Thermodynamic Properties of a Selection of AlkeneChains Simulated Using the Updated Lipid14 Parametersand, Where Available, Comparison to Experiment
ΔHvap (kJ mol‑1) ρ (kg m‑3)
cis-2-HexeneLipid14 26.17 ± 0.21 656.23 ± 0.13Expt 32.1941 68344
cis-5-DeceneLipid14 45.27 ± 0.22 739.19 ± 0.16Expt 42.941 744.541
cis-7-PentadeceneLipid14 69.5 ± 0.22 781.44 ± 0.24Expt 77544
Table 5. Average Number of trans, gauche, End gauche (eg),Double gauche (gg), and gtg′+gtg Conformers Per AlkaneMolecule and Comparison to Experiment
trans gauche t/g ratio eg gg gtg′+gtgPentane
Lipid14 1.20 0.80 1.49 0.80 0.13 -Hexane
Lipid14 1.83 1.17 1.57 0.83 0.22 0.14Heptane
Lipid14 2.49 1.51 1.65 0.83 0.31 0.24Octane
Lipid14 3.15 1.85 1.71 0.81 0.39 0.33Decane
Lipid14 4.47 2.53 1.77 0.81 0.57 0.54Tridecane
Lipid14 6.47 3.53 1.84 0.81 0.82 0.83Expt46 6.5 3.5 1.86 0.68 0.64 0.77
PentadecaneLipid14 7.80 4.20 1.86 0.81 1.00 1.02
Figure 6. Calculated 13C NMR T1 relaxation times for selected alkanechains and comparison to experiment.47 Values at 312 K.
Journal of Chemical Theory and Computation Article
dx.doi.org/10.1021/ct4010307 | J. Chem. Theory Comput. XXXX, XXX, XXX−XXXF
experimental hydration level (see Table 6) and converted toLipid14 PDB format using the charmmlipid2amber.x script.17
All systems used the TIP3P water model49 and had 0.15 M KClsalt concentration added to the water layer, modeled usingsuitable AMBER parameters.50
Equilibration Procedure. The full system was minimizedfor 10000 steps, of which the first 5000 steps used the steepestdescent method and the remaining steps used the conjugategradient method.51
The system was then heated from 0 K to 100 K usingLangevin dynamics52 for 5 ps at constant volume, with weakrestraints on the lipid (force constant 10 kcal mol−1 Å−2).Following this, the volume was allowed to change freely and
the temperature increased to a lipid dependent value (see Table6) with a Langevin collision frequency of γ = 1.0 ps−1, andanisotropic Berendsen regulation37 (1 atm) with a timeconstant of 2 ps for 100 ps. The same weak restraint of 10kcal mol−1 Å−2 was maintained on the lipid molecules.Production Runs. Constant pressure and constant temper-
ature (NPT) runs were performed on the six bilayers using theAMBER 12 package.17 The GPU implementation of theAMBER 12 code (bugfix 21) was used to run the simulationson NVIDIA GPU cards, achieving approximately 30 ns per dayfor the 128-lipid bilayer systems.17,19 Three dimensional
periodic boundary conditions with the usual minimum imageconvention were employed. Bonds involving hydrogen wereconstrained using the SHAKE algorithm,36 allowing a 2 fs timestep. Structural data was recorded every 10 ps. PME was usedto treat all electrostatic interactions with a real space cutoff of10 Å. A long-range analytical dispersion correction was appliedto the energy and pressure. All simulations were performed atconstant pressure of 1 atm and constant target temperature(Table 6). Temperature was controlled by the Langevinthermostat,52 with a collision frequency of γ = 1.0 ps−1, asthis method was identified as the most suitable in previouswork.25 Pressure was regulated by the anisotropic Berendsenmethod37 (1 atm) with a pressure relaxation time of 1.0 ps.Each lipid type was simulated for 125 ns with five repeats.
The first 25 ns of each run was removed for equilibration,resulting in a total of 500 ns of data per lipid system, anaggregate of 3 μs of data. Results are presented as blockaverages over the five repeats ± standard deviation. Themajority of analysis in this paper used PTRAJ or CPPTRAJanalysis routines.17,53
To check stability over time of the lipid bilayer systems, thesimulations were extended from 125 ns to 250 ns. AdditionalGPU and CPU validations were also performed, and in all casesthe GPU results were consistent with CPU results (see theSupporting Information).
■ VALIDATION
Bilayer Structural Properties. Despite the degree ofuncertainty in obtaining accurate experimental values,72 thebilayer surface area each lipid occupies, or area per lipid, iseasily calculated from membrane simulations and gives a quickindication of whether a bilayer is in the correct phase at a giventemperature. The area per lipid for each system was calculatedusing the dimensions of the simulation box as per previouswork.22,26 The AL for each lipid type is reported in Table 7,with all simulation values within 3% of experimental values,
Table 6. System Size, Hydration, Temperature, andSimulation Time for the Lipid Bilayer Systems
no. of lipids simulation time (ns) temp (K) waters/lipid nW
DLPC 128 5 × 125 303 31.3DMPC 128 5 × 125 303 25.6DPPC 128 5 × 125 323 30.1DOPC 128 5 × 125 303 32.8POPC 128 5 × 125 303 31POPE 128 5 × 125 310 32
Table 7. Average Structural Properties over Five Repeats of the Six Lipid Systems Simulated with Lipid14 and Comparison toExperiment
lipidsystem
area per lipid AL(Å2)
volume perlipid VL (Å
3)
isothermal areacompressibility modulus KA
(mNm‑1)bilayer thickness
DHH (Å)bilayer Luzzati
thickness DB (Å)
ΔDB-H =(DB−DHH)/2
(Å)ratio r of terminal methylto methylene volume
DLPCLipid14 63.0 ± 0.2 948.9 ± 0.3 281 ± 37 30.4 ± 0.4 30.2 ± 0.1 −0.1 ± 0.2 1.9Expt 63.2,5460.855 99154 - 30.854 31.454 0.856 1.8−2.157
DMPCLipid14 59.7 ± 0.7 1050.2 ± 1.5 264 ± 90 34.7 ± 0.6 35.2 ± 0.4 0.3 ± 0.2 2.2Expt 60.6,5459.955 11014,54 23458 34.4,59 35.360 36.3,54 36.7,55 0.856 1.8−2.157
36.959
DPPCLipid14 62.0 ± 0.3 1177.3 ± 0.5 244 ± 50 37.9 ± 0.5 38.0 ± 0.2 0.1 ± 0.2 2.1Expt 63.1,5564.361 12324 2314 38,62 38.34 39.055,62 0.856 1.8−2.157
DOPCLipid14 69.0 ± 0.3 1249.6 ± 0.2 338 ± 31 37.0 ± 0.2 36.2 ± 0.2 −0.4 ± 0.1 2.1Expt 67.4,62 72.54 13034 265,58 300,63 31864 35.3,65 36.7,62,66
36.9,4 37.16735.9,4 36.1,65,67
38.7621.0−1.757 1.8−2.157
POPCLipid14 65.6 ± 0.5 1205.4 ± 0.4 257 ± 47 36.9 ± 0.6 36.8 ± 0.3 −0.1 ± 0.2 1.9Expt 64.3,55 68.368 125668 180−33069 3768 36.8,68 39.155 0.856 1.8−2.157
POPELipid14 55.5 ± 0.2 1138.7 ± 0.3 350 ± 81 42.4 ± 0.2 41.0 ± 0.1 −0.7 ± 0.1 2.0Expt 56.6,70 59−6071 118071 23370 39.571 - - 1.8−2.157
Journal of Chemical Theory and Computation Article
dx.doi.org/10.1021/ct4010307 | J. Chem. Theory Comput. XXXX, XXX, XXX−XXXG

indicating that all the bilayers are in the correct Lα-phase. Theresult for POPE is closer to the older experimental AL value of56.6 Å2 than the more recent AL value 59−60 Å2. Nevertheless,the AL should be but one of a number of properties calculatedto validate a lipid force field.73,74
Experimentally, the volume per lipid VL is more accuratelymeasured and is thus a better comparison for simulation resultsthan AL. The volume per lipid was calculated using thedimensions of the simulation box26 and the volume of a watermolecule as determined by simulating 1936 TIP3P waters inthe NPT ensemble for 50 ns using an identical procedure to thebilayer simulations at the relevant temperature.VL values for each lipid are reported in Table 7, which
although systematically underestimated, are within 5% ofexperimental values. It is likely that the headgroup LJparameters could be further tuned to remedy this discrepancy,as the thorough reparamaterization of the hydrocarbon chainsmakes it unlikely that the tail groups are causing this lack ofagreement.This intuition is confirmed when studying the lipid
component volumes calculated with the SIMtoEXP software.75
The headgroup volume of DOPC was found to be 305.41 Å3,which is below the experimental estimate of 319−331 Å3, whilethe hydrocarbon chain volume of 965.88 Å3 is closer to theexperimental range of 972−984 Å3.57
The volume breakdown provided by SIMtoEXP was used tocalculate the ratio r of terminal methyl to methylene volume.All lipid systems report a value of r = 1.85−2.17, within or veryclose to the experimental range of 1.8−2.1.Isothermal area compressibility modulus, KA, was calculated
from the fluctuation in the area per lipid.26 In general, KA valuesfall close to experiment, with experimental values falling withinthe standard deviation of DMPC, DPPC, DOPC and POPCsimulation results; however the POPE value comes out highand there is a large standard deviation in all values. Althoughthe DOPC value is above the published experimental value of300 mN m−1,63 a personal communication with E. Evansrevealed that this KA value has recently been revised upward to318 mN m−1,64 closer to the Lipid14 simulation result. Thiswas not known prior to the lipid simulations.
In this work, the Berendsen method was used for pressurecoupling, given that it is the only barostat currently available inthe AMBER MD package. It has recently been shown thatBerendsen pressure control is not ideal for simulations in whichvolume fluctuations are important,76 thus by implementingother barostats into AMBER better KA results may potentiallybe achieved. This is a work in progress, the results of which willbe shown elsewhere. Furthermore, larger system sizes andlonger simulation times could also be investigated, as suchchanges have been shown to speed up the convergence of KAvalues.74
The membrane thickness was examined by calculating DHH,the peak-to-peak distance, from electron density profiles of themembranes. Again, satisfactory agreement with experiment isachieved for all lipids, though the POPE value is a little high,indicating that this system is slightly too ordered.An alternative bilayer thickness, the Luzzati thickness DB, was
calculated using the z-dimension of the simulation box and theintegral of the probability distribution of the water densityalong the z-axis.9,10 DB values are found to lie close toexperimental values, though the DB thicknesses for thesaturated lipids are slightly underestimated. Given that DB isthe distance between the points along the membrane normal atwhich the water density is half of its bulk value, this suggeststhat water is penetrating slightly too far into the hydrophobicregion of the bilayer, thereby lowering the value of DB.
Ordering and Conformation of Lipid Acyl Chains. Theordering of the lipid acyl chains may be determined bycalculation of the order parameter SCD. This quantity can bedirectly compared to experimental SCD values determined by2H NMR or 1H−13C NMR.77−80 SCD is a measure of therelative orientation of the C−D bonds with respect to thebilayer normal and was calculated according to
θ= ⟨ − ⟩S12
3cos 1CD2
(5)
where θ is the angle between the bilayer normal and the vectorjoining Ci to its deuterium atom, and < > represents anensemble average.Figure 7 shows the Lipid14 order parameters with
comparison to experiment. All lipid systems follow the
Figure 7. Simulation NMR order parameters for the six lipid systems and comparison to experiment.77,78,80−84
Journal of Chemical Theory and Computation Article
dx.doi.org/10.1021/ct4010307 | J. Chem. Theory Comput. XXXX, XXX, XXX−XXXH

experimental order parameter trend. The carbon-2 atom of thesn-1 and sn-2 chains display markedly different orderparameters owing to the different alignment of the acyl chainsin this region. Experimentally, it has been found that the SCDorder parameter of the C-D bonds near the headgroup in thesn-1 chains are greater than the sn-2 chains.85,86 Splitting of theorder parameter value of the sn-2 chain from the sn-1 chain isobserved for the simulated lipid systems. The unsaturated chainof the DOPC, POPC and POPE lipids show a distinctive dropat the carbon-9 and -10 positions due to the cis double bond.The SCD values for the sn-1 chain of POPE are a little high,indicating that POPE may be slightly too ordered. In agreementwith Jambeck et al., the two chains of DOPC show differingbehavior, the sn-1 chain having higher SCD values about thedouble bond than the sn-2 chain.87
The conformation of the acyl chains may be examined byanalyzing the rotamers and rotamer sequences along the lipid
tails and comparing results to experimental data collected byFourier transform infrared (FTIR) spectroscopy.88 FTIR candetermine the number of trans (t) and gauche (g) conformersand sequences of t and g (end gauche eg, double gauche gg, gtg,and kinks gtg′). The lipid bilayer simulations were analyzed bydenoting torsion angles φ in the acyl chains as either t (φ<−150° or φ> 150°), g- (−90°≤ φ< −30°) or g+ (30°<φ≤90°).89 The rotamer sequence gtg correspond to g+tg+ or g-tg- while the sequence (or kinks) gtg′ corresponds to g+tg- or g-tg+.Results are shown in Table 8 and are in general satisfactorily
close to available experimental values. The discrepanciesobserved between simulation and experimental values of gtg′for DLPC and DPPC may result from the experimentalambiguity in assigning gtg and gtg′ wagging modes.90 Theseresults also confirm that the bilayers are in the correct phase, asthe gel-to-liquid phase transition is associated with an increase
Table 8. Analysis of Rotamers and Rotamer Sequences in the Acyl Chains of the Six Lipid Systems − End gauche (eg), Doublegauche (gg), Kinks (gtg′), gtg′+gtg, and Number of gauche (ng)
lipid system eg gg gtg′ gtg′+gtg ng
DLPCLipid14 0.35 0.44 0.28 0.52 2.50Expt93 0.45 0.32 0.88* - 2.85DMPCLipid14 0.34 0.48 0.35 0.62 2.82Expt94 0.38 0.67 - 0.44 2.6DPPCLipid14 0.36 0.66 0.47 0.83 3.58Expt 0.38,94 0.4,88 0.5493 0.4,88,93 0.5794 1.1993a 0.46,94 1.088 2.44,94 3.6−4.2,95 3.7,93 3.882
DOPCLipid14 0.36 0.75 0.37 0.70 3.93POPCLipid14 0.36 0.69 0.41 0.75 3.73POPELipid14 0.35 0.60 0.42 0.73 3.50Expt88 0.05 0.2 - 0.8 -
aThe gtg′ sequence may be ascribed to a gtg′+gtg sequence.90
Figure 8. The total and decomposed electron density profiles for each of the six lipid bilayer systems with contributions from water, choline(CHOL), phosphate (PO4), glycerol (GLY), carbonyl (COO), methylene (CH2), unsaturated CHCH and terminal methyls (CH3).
Journal of Chemical Theory and Computation Article
dx.doi.org/10.1021/ct4010307 | J. Chem. Theory Comput. XXXX, XXX, XXX−XXXI

in the number of gauche rotamers and kink rotamersequences.90−92 However the eg and gg results for POPE arenot in accordance with the experimental values obtained bySenak et al. using FTIR,88 who found a marked increase in eg,gg, and gtg′+gtg values going from DPPE to DPPC because ofthe tighter packing of the PE lipid in the Lα phase. The presentsimulation values for POPE and POPC, though, are similar.Electron Density Profiles. The electron density profiles
(EDP) were calculated by assuming an electron charge equal tothe atomic number minus the atomic partial charge, located atthe center of each atom. Profiles have also been decomposedinto contributions from the following groups: water, choline(CHOL), phosphate (PO4), glycerol (GLY), carbonyl (COO),methylene (CH2), unsaturated CHCH and terminal methyls(CH3). These profiles, shown in Figure 8, are all symmetrical,with water penetrating up to the carbonyl groups, leaving theterminal methyl groups dehydrated in agreement withexperimental findings.54,68,61 The electron density profileswere then utilized for the calculation of scattering form factorsusing the SIMtoEXP software.75
Scattering Form Factors. Scattering data allow directcomparison between lipid bilayer simulation and experiment,avoiding any intermediate modeling of experimental raw data.57
X-ray and neutron scattering form factors can be computed byFourier transformation of simulation electron density profilesand compared to experimental scattering data.Recent work determined the areas per lipid (AX and AN) at
which DOPC bilayer simulations best replicate the exper-imental X-ray scattering and neutron scattering data by varyingthe area per lipid through application of a surface tension, withthe ideal situation being AX = AN = ANPT (bilayer is run in thetensionless NPT ensemble).57 In this work we were concernedwith validating the Lipid14 parameters for tensionless bilayersimulation only; thus we report the X-ray and neutronscattering form factors for ANPT only.It can be seen from Figure 9 that there is general agreement
between both the X-ray and neutron scattering form factors for
all lipids for which there is experimental scattering dataavailable, indicating that the simulated bilayers have the correctstructure. In general the minima of the experimental F(q)profiles are correctly reproduced, as are the relative lobeheights.The quantity ΔDB-H was computed from the membrane
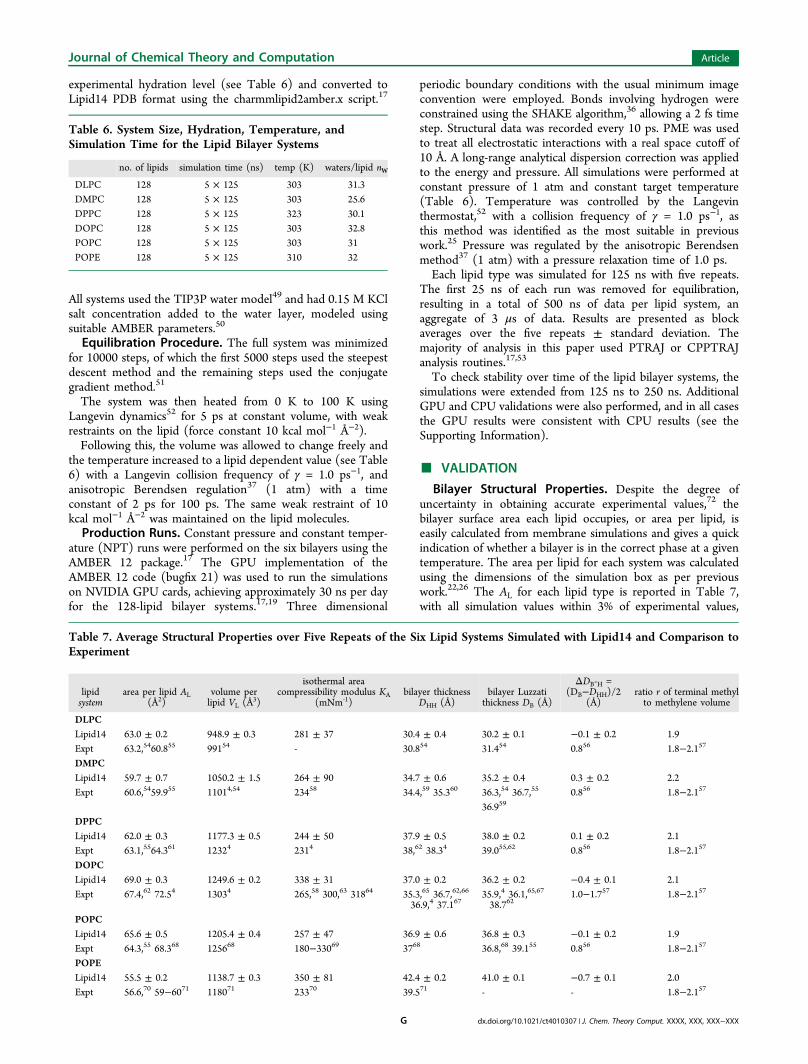
thickness values (see Table 7). Agreement with X-ray scatteringdata is sensitive to the value of DHH, while agreement withneutron scattering data is sensitive to the value of DB. Thereforeit has been proposed that bilayer simulations should aim toreplicate experimental ΔDB-H values to best achieve agreementwith both types of scattering data, where ΔDB-H = (DB-DHH)/2.57 The GROMOS united-atom lipid force field has beenshown to match experiment for simulation ΔDB-H results.56,57
As evidenced by Table 7, Lipid14 ΔDB-H values are lower thanthose found by experiment, though all simulation values domaintain a large standard deviation. In fact, analysis of ΔDB-Hresults for two other all-atom lipid force fields, CHARMM368
and Slipids10,87 indicates that this quantity is difficult toreproduce using all-atom models, with only the Slipids POPCresult falling close to experiment. Figure 10 plots ΔDB-H valuesagainst area per lipid for CHARMM36,56 Slipids,10,87 andAMBER Lipid14, displaying a downward trend in ΔDB-H withincreasing area per lipid, in disagreement with the experimentaltrend. Results for Lipid14 are similar to CHARMM36 and mostSlipids values. Improving this discrepancy with experiment forLipid14 may further improve the comparison with scatteringdata; however, present simulation scattering profiles are stillseen to be in satisfactory agreement with experiment.
Lipid Lateral Diffusion. To assess the ability of the Lipid14parameters to reproduce dynamic lipid properties, the lipidlateral diffusion coefficient Dxy was calculated using the Einsteinrelation (eq 2) with two degrees of freedom (nf = 2). Diffusioncoefficients were computed for each lipid as a block averageover the five NPT production runs. The mean-square-displacement (MSD) curves were determined using windowlengths spanning 20 ns and averaged over different time origins
Figure 9. Simulation X-ray scattering form factors for the six lipid systems (black line) and comparison to experiment54,55,62,66,68 (cyan circles).Inset: Simulation neutron scattering form factors at 100% D2O (black line), 70% D2O (red line), and 50% D2O (blue line) and comparison toexperiment55,96 (black, red, and blue circles, respectively).
Journal of Chemical Theory and Computation Article
dx.doi.org/10.1021/ct4010307 | J. Chem. Theory Comput. XXXX, XXX, XXX−XXXJ
separated by 200 ps. The slope of this curve yields the diffusioncoefficient using eq 2, with the linear 10−20 ns region used toperform the fit. Prior to the MSD calculation, the lipidcoordinates were corrected to remove the artificial center ofmass drift of each monolayer.73
Results are of the same order of magnitude as experimentalvalues; although in general they are underestimated. Unlike thebulk alkane work there is no correction term to account forcollective motion which cannot be sampled using a periodic boxof limited size. Accordingly, the underestimation may be aresult of size effects. As highlighted by Poger et al. there is awidespread in experimental lipid lateral diffusion values in theliterature, with a range of experimental techniques applied tothe calculation of diffusion values.105 Even different groupsapplying the same experimental technique do not necessarilyyield comparable diffusion coefficients. Our calculated diffusioncoefficients are nonetheless found to be in good agreementwith other simulation values.10,23,87,105−107
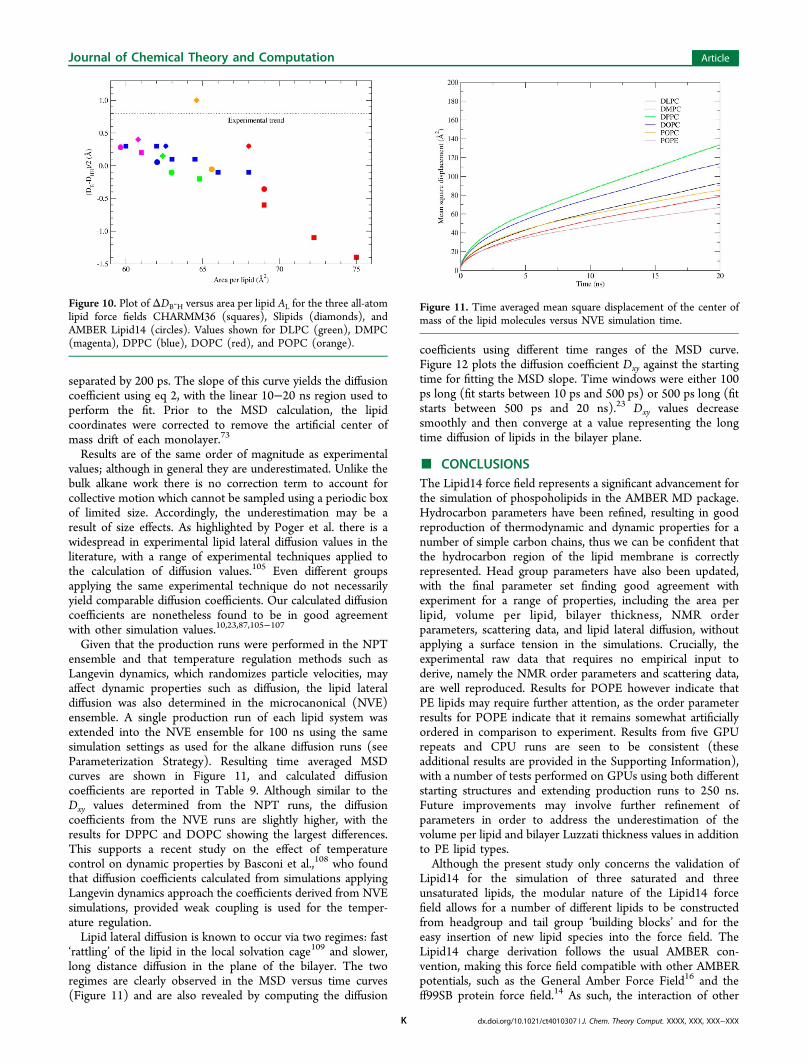
Given that the production runs were performed in the NPTensemble and that temperature regulation methods such asLangevin dynamics, which randomizes particle velocities, mayaffect dynamic properties such as diffusion, the lipid lateraldiffusion was also determined in the microcanonical (NVE)ensemble. A single production run of each lipid system wasextended into the NVE ensemble for 100 ns using the samesimulation settings as used for the alkane diffusion runs (seeParameterization Strategy). Resulting time averaged MSDcurves are shown in Figure 11, and calculated diffusioncoefficients are reported in Table 9. Although similar to theDxy values determined from the NPT runs, the diffusioncoefficients from the NVE runs are slightly higher, with theresults for DPPC and DOPC showing the largest differences.This supports a recent study on the effect of temperaturecontrol on dynamic properties by Basconi et al.,108 who foundthat diffusion coefficients calculated from simulations applyingLangevin dynamics approach the coefficients derived from NVEsimulations, provided weak coupling is used for the temper-ature regulation.Lipid lateral diffusion is known to occur via two regimes: fast
‘rattling’ of the lipid in the local solvation cage109 and slower,long distance diffusion in the plane of the bilayer. The tworegimes are clearly observed in the MSD versus time curves(Figure 11) and are also revealed by computing the diffusion
coefficients using different time ranges of the MSD curve.Figure 12 plots the diffusion coefficient Dxy against the startingtime for fitting the MSD slope. Time windows were either 100ps long (fit starts between 10 ps and 500 ps) or 500 ps long (fitstarts between 500 ps and 20 ns).23 Dxy values decreasesmoothly and then converge at a value representing the longtime diffusion of lipids in the bilayer plane.
■ CONCLUSIONSThe Lipid14 force field represents a significant advancement forthe simulation of phospoholipids in the AMBER MD package.Hydrocarbon parameters have been refined, resulting in goodreproduction of thermodynamic and dynamic properties for anumber of simple carbon chains, thus we can be confident thatthe hydrocarbon region of the lipid membrane is correctlyrepresented. Head group parameters have also been updated,with the final parameter set finding good agreement withexperiment for a range of properties, including the area perlipid, volume per lipid, bilayer thickness, NMR orderparameters, scattering data, and lipid lateral diffusion, withoutapplying a surface tension in the simulations. Crucially, theexperimental raw data that requires no empirical input toderive, namely the NMR order parameters and scattering data,are well reproduced. Results for POPE however indicate thatPE lipids may require further attention, as the order parameterresults for POPE indicate that it remains somewhat artificiallyordered in comparison to experiment. Results from five GPUrepeats and CPU runs are seen to be consistent (theseadditional results are provided in the Supporting Information),with a number of tests performed on GPUs using both differentstarting structures and extending production runs to 250 ns.Future improvements may involve further refinement ofparameters in order to address the underestimation of thevolume per lipid and bilayer Luzzati thickness values in additionto PE lipid types.Although the present study only concerns the validation of
Lipid14 for the simulation of three saturated and threeunsaturated lipids, the modular nature of the Lipid14 forcefield allows for a number of different lipids to be constructedfrom headgroup and tail group ‘building blocks’ and for theeasy insertion of new lipid species into the force field. TheLipid14 charge derivation follows the usual AMBER con-vention, making this force field compatible with other AMBERpotentials, such as the General Amber Force Field16 and theff99SB protein force field.14 As such, the interaction of other
Figure 10. Plot of ΔDB-H versus area per lipid AL for the three all-atomlipid force fields CHARMM36 (squares), Slipids (diamonds), andAMBER Lipid14 (circles). Values shown for DLPC (green), DMPC(magenta), DPPC (blue), DOPC (red), and POPC (orange).
Figure 11. Time averaged mean square displacement of the center ofmass of the lipid molecules versus NVE simulation time.
Journal of Chemical Theory and Computation Article
dx.doi.org/10.1021/ct4010307 | J. Chem. Theory Comput. XXXX, XXX, XXX−XXXK

species, such as small molecules or proteins, with lipidmembranes can be studied in AMBER using the Lipid14force field.
■ ASSOCIATED CONTENT*S Supporting InformationDetails of the Lipid14 atom types, partial charges, and forcefield parameters. Also included are the bilayer results foradditional GPU and CPU runs. This material is available free ofcharge via the Internet at http://pubs.acs.org.
■ AUTHOR INFORMATIONCorresponding Authors*E-mail: [email protected].*E-mail: [email protected] Contributions†These authors contributed equally.NotesThe authors declare no competing financial interest.
■ ACKNOWLEDGMENTSWe are very grateful to Dr. Hannes Loeffler of the Science andTechnology Facilities Council, UK, for writing and maintainingthe modified PTRAJ/CPPTRAJ routines which were used formuch of the analysis in this work. C.J.D. wishes to thank theInstitute of Chemical Biology, UK Biotechnology and Bio-logical Sciences Research Council (BBSRC) and GlaxoSmithK-line for the award of a studentship, and the High PerformanceComputing centre of Imperial College London for theprovision of computing time. B.D.M. would like to acknowl-edge funding for this work provided by the NIH MolecularBiophysics Training Grant (T32 GM008326) and the NVIDIAGraduate Fellowship Program. R.M.B. was supported by a grant
from the University of California Institute for Mexico and theUnited States (UC MEXUS) and the Consejo Nacional deCiencia y Tecnologia de Mexico (CONACYT) (R.C.W.). Weacknowledge the support of the Strategic Programme forInternational Research and Education (SPIRE) and the MeltzerFoundation for travel grants provided to Å.A.S. The NorwegianMetacenter for Computational Science (NOTUR) is acknowl-edged for allocation of computational resources. This work wassupported by NSF SI2-SSE grants (NSF-1047875 and1148276) to R.C.W. and by the University of California (UCLab 09-LR-06-117793) grant to R.C.W. R.C.W. also acknowl-edges funding through the NSF XSEDE program and through afellowship from NVIDIA, Inc. Additional computer time wasprovided by the San Diego Supercomputer Center and byXSEDE and TG-CHG13W10 to R.C.W.
■ REFERENCES(1) van Meer, G.; Voelker, D. R.; Feigenson, G. W. Membrane lipids:where they are and how they behave. Nat. Rev. Mol. Cell Biol. 2008, 9(2), 112−124.(2) Lodish, H.; Berk, A.; Kaiser, C. A.; Scott, M. P.; Bretscher, A.;Ploegh, H.; Matsudaira, P. Molecular Cell Biology, 6th ed.; W. H.Freeman: New York, 2007.(3) Phillips, R.; Ursell, T.; Wiggins, P.; Sens, P. Emerging roles forlipids in shaping membrane-protein function. Nature 2009, 459(7245), 379−385.(4) Nagle, J. F.; Tristram-Nagle, S. Structure of lipid bilayers. Biochim.Biophys. Acta 2000, 1469 (3), 159−195.(5) Katsaras, J.; Gutberlet, T. Lipid bilayers: Structure and interactions;Springer-Verlag: Berlin, 2001.(6) Tieleman, D. P.; Marrink, S. J.; Berendsen, H. J. A computerperspective of membranes: molecular dynamics studies of lipid bilayersystems. Biochim. Biophys. Acta 1997, 1331, 235−270.(7) Berger, O.; Edholm, O.; Jahnig, F. Molecular dynamicssimulations of a fluid bilayer of dipalmitoylphosphatidylcholine atfull hydration, constant pressure, and constant temperature. Biophys. J.1997, 72, 2002−2013.(8) Klauda, J. B.; Venable, R. M.; Freites, J. A.; O’Connor, J. W.;Tobias, D. J.; Mondragon-Ramirez, C.; Vorobyov, I.; MacKerell, A. D.;Pastor, R. W. Update of the CHARMM all-atom additive force field forlipids: Validation on Six lipid types. J. Phys. Chem. B 2010, 114 (23),7830−7843.(9) Poger, D.; Van Gunsteren, W. F.; Mark, A. E. A new force fieldfor simulating phosphatidylcholine bilayers. J. Comput. Chem. 2010, 31(6), 1117−1125.(10) Jambeck, J. P. M.; Lyubartsev, A. P. Derivation and systematicvalidation of a refined all-atom force field for phosphatidylcholinelipids. J. Phys. Chem. B 2012, 116 (10), 3164−3179.(11) Marrink, S. J.; Risselada, H. J.; Yefimov, S.; Tieleman, D. P.; deVries, A. H. The MARTINI force field: Coarse grained model forbiomolecular simulations. J. Phys. Chem. B 2007, 111 (27), 7812−7824.(12) Orsi, M.; Essex, J. W. The ELBA force field for coarse-grainmodeling of lipid membranes. PLoS One 2011, 6 (12), e28637.
Table 9. Lipid Lateral Diffusion Coefficients Calculated from NPT Runs, NVE Runs, and Experimental Values
lipid system calcd NPT Dxy (10‑8 cm2 s‑1) calcd NVE Dxy (10
‑8 cm2 s‑1) simulation temp (K) exptl Dxy (10‑8 cm2 s‑1) exptl temp (K)
DLPC 7.65 7.78 303 8.597 298DMPC 5.05 6.32 303 5.95,98 999,100 303, 303DPPC 9.21 11.94 323 12.5,101 15.2102 323, 323DOPC 6.48 9.49 303 11.5,100 17103 303, 308POPC 5.74 6.54 303 10.7100 303POPE 4.67 4.85 310 5.2104a 305
aCell culture membrane containing 78% POPE at 305 K.
Figure 12. Lateral diffusion coefficients for the six lipid typescalculated using different time ranges of the mean square displacementcurve for the linear fit.
Journal of Chemical Theory and Computation Article
dx.doi.org/10.1021/ct4010307 | J. Chem. Theory Comput. XXXX, XXX, XXX−XXXL

(13) Chiu, S.-W.; Pandit, S. A.; Scott, H. L.; Jakobsson, E. Animproved united atom force field for simulation of mixed lipid bilayers.J. Phys. Chem. B 2009, 113 (9), 2748−2763.(14) Hornak, V.; Abel, R.; Okur, A.; Strockbine, B.; Roitberg, A.;Simmerling, C. Comparison of multiple Amber force fields anddevelopment of improved protein backbone parameters. Proteins:Struct., Funct., Bioinf. 2006, 65 (3), 712−725.(15) Kirschner, K. N.; Yongye, A. B.; Tschampel, S. M.; Gonzalez-Outeirino, J.; Daniels, C. R.; Foley, B. L.; Woods, R. J. GLYCAM06: Ageneralizable biomolecular force field. Carbohydrates. J. Comput.Chem. 2008, 29 (4), 622−655.(16) Wang, J.; Wolf, R. M.; Caldwell, J. W.; Kollman, P. A.; Case, D.A. Development and testing of a general amber force field. J. Comput.Chem. 2004, 25, 1157−1174.(17) Case, D. A.; Darden, T. A.; Cheatham, T. E., III; Simmerling, C.L.; Wang, J.; Duke, R. E.; Luo, R.; Walker, R. C.; Zhang, W.; Merz, K.M.; Roberts, B.; Hayik, S.; Roitberg, A.; Seabra, G.; Swails, J.; Goetz, A.W.; Kolossvary, I.; Wong, K. F.; Paesani, F.; Vanicek, J.; Wolf, R. M.;Liu, J.; Wu, X.; Brozell, S. R.; Steinbrecher, T.; Gohlke, H.; Cai, Q.; Ye,X.; Wang, J.; Hsieh, M.-J.; Cui, G.; Roe, D. R.; Mathews, D. H.; Seetin,M. G.; Salomon-Ferrer, R.; Sagui, C.; Babin, V.; Luchko, T.; Gusarov,S.; Kovalenko, A.; Kollman, P. A. AMBER 12; University of California:San Francisco, 2012.(18) Salomon-Ferrer, R.; Case, D. A.; Walker, R. C. An overview ofthe Amber biomolecular simulation package. Wiley Interdiscip. Rev.:Comput. Mol. Sci. 2013, 3 (2), 198−210.(19) Gotz, A. W.; Williamson, M. J.; Xu, D.; Poole, D.; Le Grand, S.;Walker, R. C. Routine microsecond molecular dynamics simulationswith AMBER on GPUs. 1. Generalized Born. J. Chem. Theory Comput.2012, 8 (5), 1542−1555.(20) Salomon-Ferrer, R.; Gotz, A. W.; Poole, D.; Le Grand, S.;Walker, R. C. Routine microsecond molecular dynamics simulationswith Amber on GPUs. 2. Explicit solvent particle mesh Ewald. J. Chem.Theory Comput. 2013, 9 (9), 3878−3888.(21) Le Grand, S.; Gotz, A. W.; Walker, R. C. SPFP: Speed withoutcompromiseA mixed precision model for GPU acceleratedmolecular dynamics simulations. Comput. Phys. Commun. 2013, 184(2), 374−380.(22) Skjevik, Å. A.; Madej, B. D.; Walker, R. C.; Teigen, K. LIPID11:A modular framework for lipid simulations using Amber. J. Phys. Chem.B 2012, 116 (36), 11124−11136.(23) Siu, S. W.; Vacha, R.; Jungwirth, P.; Bockmann, R. A.Biomolecular simulations of membranes: physical properties fromdifferent force fields. J. Chem. Phys. 2008, 128 (12), 125103.(24) Jojart, B.; Martinek, T. A. Performance of the general amberforce field in modeling aqueous POPC membrane bilayers. J. Comput.Chem. 2007, 28 (12), 2051−2058.(25) Rosso, L.; Gould, I. R. Structure and dynamics of phospholipidbilayers using recently developed general all-atom force fields. J.Comput. Chem. 2008, 29 (1), 24−37.(26) Dickson, C. J.; Rosso, L.; Betz, R. M.; Walker, R. C.; Gould, I. R.GAFFlipid: A general Amber force field for the accurate moleculardynamics simulation of phospholipid. Soft Matter 2012, 8, 9617−9627.(27) Siu, S. W. I.; Pluhackova, K.; Bockmann, R. A. Optimization ofthe OPLS-AA force field for long hydrocarbons. J. Chem. TheoryComput. 2012, 8 (4), 1459−1470.(28) Klauda, J. B.; Brooks, B. R.; MacKerell, A. D.; Venable, R. M.;Pastor, R. W. An ab initio study on the torsional surface of alkanes andits effect on molecular simulations of alkanes and a DPPC bilayer. J.Phys. Chem. B 2005, 109 (11), 5300−5311.(29) Betz, R. M.; Walker, R. C. Paramfit: Optimization of potentialenergy function parameters for molecular dynamics. Manuscript inpreparation.(30) Bayly, C. I.; Cieplak, P.; Cornell, W.; Kollman, P. A. A well-behaved electrostatic potential based method using charge restraintsfor deriving atomic charges: the RESP model. J. Phys. Chem. 1993, 97(40), 10269−10280.(31) Sonne, J.; Jensen, M. Ø.; Hansen, F. Y.; Hemmingsen, L.;Peters, G. H. Reparameterization of all-atom dipalmitoylphosphati-
dylcholine lipid parameters enables simulation of fluid bilayers at zerotension. Biophys. J. 2007, 92 (12), 4157−4167.(32) Klauda, J. B.; Garrison, S. L.; Jiang, J.; Arora, G.; Sandler, S. I.HM-IE: Quantum chemical hybrid methods for calculating interactionenergies. J. Phys. Chem. A 2003, 108 (1), 107−112.(33) Davis, J. E.; Warren, G. L.; Patel, S. Revised charge equilibrationpotential for liquid alkanes. J. Phys. Chem. B 2008, 112 (28), 8298−8310.(34) Wang, J.; Hou, T. Application of molecular dynamicssimulations in molecular property prediction. 1. density and heat ofvaporization. J. Chem. Theory Comput. 2011, 7 (7), 2151−2165.(35) Darden, T.; York, D.; Pedersen, L. Particle mesh Ewald: An N-log(N) method for Ewald sums in large systems. J. Chem. Phys. 1993,98 (12), 10089−10092.(36) Ryckaert, J.-P.; Ciccotti, G.; Berendsen, H. J. C. Numericalintegration of the cartesian equations of motion of a system withconstraints: molecular dynamics of n-alkanes. J. Comput. Phys. 1977,23 (3), 327−341.(37) Berendsen, H. J. C.; Postma, J. P. M.; van Gunsteren, W. F.;DiNola, A.; Haak, J. R. Molecular dynamics with coupling to anexternal bath. J. Chem. Phys. 1984, 81 (8), 3684−3690.(38) Yeh, I.-C.; Hummer, G. System-size dependence of diffusioncoefficients and viscosities from molecular dynamics simulations withperiodic boundary conditions. J. Phys. Chem. B 2004, 108 (40),15873−15879.(39) Lipari, G.; Szabo, A. Effect of librational motion on fluorescencedepolarization and nuclear magnetic resonance relaxation in macro-molecules and membranes. Biophys. J. 1980, 30 (3), 489−506.(40) Ottiger, M.; Bax, A. Determination of Relative N−HN, N−C′,Cα−C′, and Cα−Hα effective bond lengths in a protein by NMR in adilute liquid crystalline phase. J. Am. Chem. Soc. 1998, 120 (47),12334−12341.(41) Haynes, W. M. CRC Handbook of Chemistry and Physics, 93rded.; CRC Press: Boca Raton, FL, 2012−2013.(42) Frisch, M. J.; Trucks, G. W.; Schlegel, H. B.; Scuseria, G. E.;Robb, M. A.; Cheeseman, J. R.; Scalmani, G.; Barone, V.; Mennucci,B.; Petersson, G. A.; Nakatsuji, H.; Caricato, M.; Li, X.; Hratchian, H.P.; Izmaylov, A. F.; Bloino, J.; Zheng, G.; Sonnenberg, J. L.; Hada, M.;Ehara, M.; Toyota, K.; Fukuda, R.; Hasegawa, J.; Ishida, M.; Nakajima,T.; Honda, Y.; Kitao, O.; Nakai, H.; Vreven, T.; Montgomery, J. A., Jr.;Peralta, J. E.; Ogliaro, F.; Bearpark, M.; Heyd, J. J.; Brothers, E.; Kudin,K. N.; Staroverov, V. N.; Kobayashi, R.; Normand, J.; Raghavachari, K.;Rendell, A.; Burant, J. C.; Iyengar, S. S.; Tomasi, J.; Cossi, M.; Rega,N.; Millam, N. J.; Klene, M.; Knox, J. E.; Cross, J. B.; Bakken, V.;Adamo, C.; Jaramillo, J.; Gomperts, R.; Stratmann, R. E.; Yazyev, O.;Austin, A. J.; Cammi, R.; Pomelli, C.; Ochterski, J. W.; Martin, R. L.;Morokuma, K.; Zakrzewski, V. G.; Voth, G. A.; Salvador, P.;Dannenberg, J. J.; Dapprich, S.; Daniels, A. D.; Farkas, O.;Foresman, J. B.; Ortiz, J. V.; Cioslowski, J.; Fox, D. J. Gaussian 09,Revision A.1; Gaussian Inc.: Wallingford, CT, 2009.(43) Douglass, D. C.; McCall, D. W. Diffusion in paraffinhydrocarbons. J. Phys. Chem. 1958, 62 (9), 1102−1107.(44) Yaws, C. L. Yaws’ Handbook of Physical Properties forHydrocarbons and Chemicals. http://www.knovel.com/web/portal/browse/display?_EXT_KNOVEL_DISPLAY_bookid=2147 (accessedFebruary 19, 2013).(45) Tofts, P. S.; Lloyd, D.; Clark, C. A.; Barker, G. J.; Parker, G. J.M.; McConville, P.; Baldock, C.; Pope, J. M. Test liquids forquantitative MRI measurements of self-diffusion coefficient in vivo.Magn. Reson. Med. 2000, 43 (3), 368−374.(46) Holler, F.; Callis, J. B. Conformation of the hydrocarbon chainsof sodium dodecyl sulfate molecules in micelles: an FTIR study. J.Phys. Chem. 1989, 93 (5), 2053−2058.(47) Lyerla, J. R.; McIntyre, H. M.; Torchia, D. A. A 13C nuclearmagnetic resonance study of alkane motion. Macromolecules 1974, 7(1), 11−14.(48) Jo, S.; Lim, J. B.; Klauda, J. B.; Im, W. CHARMM-GUImembrane builder for mixed bilayers and its application to yeastmembranes. Biophys. J. 2009, 97 (1), 50−58.
Journal of Chemical Theory and Computation Article
dx.doi.org/10.1021/ct4010307 | J. Chem. Theory Comput. XXXX, XXX, XXX−XXXM

(49) Jorgensen, W. L.; Chandrasekhar, J.; Madura, J. D.; Impey, R.W.; Klein, M. L. Comparison of simple potential functions forsimulating liquid water. J. Chem. Phys. 1983, 79 (2), 926−935.(50) Joung, I. S.; Cheatham, T. E. Determination of alkali and halidemonovalent ion parameters for use in explicitly solvated biomolecularsimulations. J. Phys. Chem. B 2008, 112 (30), 9020−9041.(51) Press, W. H.; Teukolsky, S. A.; Vetterling, W. T.; Flannery, B. P.Numerical Recipes: The Art of Scientific Computing, 3rd ed. ed.;Cambridge University Press: New York, 2007.(52) Pastor, R.; Brooks, B.; Szabo, A. An analysis of the accuracy ofLangevin and molecular dynamics algorithms. Mol. Phys. 1988, 65 (6),1409−1419.(53) Roe, D. R.; Cheatham, T. E. PTRAJ and CPPTRAJ: Softwarefor processing and analysis of molecular dynamics trajectory data. J.Chem. Theory Comput. 2013, 9 (7), 3084−3095.(54) Kucerka, N.; Liu, Y.; Chu, N.; Petrache, H. I.; Tristram-Nagle,S.; Nagle, J. F. Structure of fully hydrated fluid phase DMPC andDLPC lipid bilayers using X-ray scattering from oriented multilamellararrays and from unilamellar vesicles. Biophys. J. 2005, 88 (4), 2626−2637.(55) Kucerka, N.; Nieh, M.-P.; Katsaras, J. Fluid phase lipid areas andbilayer thicknesses of commonly used phosphatidylcholines as afunction of temperature. Biochim. Biophys. Acta 2011, 1808 (11),2761−2771.(56) Nagle, J. F. Introductory lecture: Basic quantities in modelbiomembranes. Faraday Discuss. 2013, 161 (0), 11−29.(57) Braun, A. R.; Sachs, J. N.; Nagle, J. F. Comparing simulations oflipid bilayers to scattering data: The GROMOS 43A1-S3 force field. J.Phys. Chem. B 2013, 117 (17), 5065−5072.(58) Rawicz, W.; Olbrich, K. C.; McIntosh, T.; Needham, D.; Evans,E. Effect of chain length and unsaturation on elasticity of lipid bilayers.Biophys. J. 2000, 79 (1), 328−339.(59) Petrache, H. I.; Tristram-Nagle, S.; Nagle, J. F. Fluid phasestructure of EPC and DMPC bilayers. Chem. Phys. Lipids 1998, 95 (1),83−94.(60) Klauda, J. B.; Kucerka, N.; Brooks, B. R.; Pastor, R. W.; Nagle, J.F. Simulation-based methods for interpreting X-ray data from lipidbilayers. Biophys. J. 2006, 90 (8), 2796−2807.(61) Kucerka, N.; Tristram-Nagle, S.; Nagle, J. F. Closer look atstructure of fully hydrated fluid phase DPPC bilayers. Biophys. J. 2006,90 (11), L83−L85.(62) Kucerka, N.; Nagle, J. F.; Sachs, J. N.; Feller, S. E.; Pencer, J.;Jackson, A.; Katsaras, J. Lipid bilayer structure determined by thesimultaneous analysis of neutron and X-ray scattering data. Biophys. J.2008, 95 (5), 2356−2367.(63) Evans, E.; Rawicz, W.; Smith, B. A. Concluding remarks back tothe future: mechanics and thermodynamics of lipid biomembranes.Faraday Discuss. 2013, 161 (0), 591−611.(64) Evans, E. Personal Communication - DOPC isothermalcompressibility modulus from X-ray data at 293 K; 2014.(65) Tristram-Nagle, S.; Petrache, H. I.; Nagle, J. F. Structure andinteractions of fully hydrated dioleoylphosphatidylcholine bilayers.Biophys. J. 1998, 75 (2), 917−925.(66) Pan, J.; Tristram-Nagle, S.; Kucerka, N.; Nagle, J. F.Temperature dependence of structure, bending rigidity, and bilayerinteractions of dioleoylphosphatidylcholine bilayers. Biophys. J. 2008,94 (1), 117−124.(67) Liu, Y.; Nagle, J. F. Diffuse scattering provides materialparameters and electron density profiles of biomembranes. Phys. Rev. E2004, 69 (4), 040901.(68) Kucerka, N.; Tristram-Nagle, S.; Nagle, J. F. Structure of fullyhydrated fluid phase lipid bilayers with monounsaturated chains. J.Membr. Biol. 2006, 208 (3), 193−202.(69) Binder, H.; Gawrisch, K. Effect of unsaturated lipid chains ondimensions, molecular order and hydration of membranes. J. Phys.Chem. B 2001, 105 (49), 12378−12390.(70) Rand, R. P.; Parsegian, V. A. Hydration forces betweenphospholipid bilayers. Biochim. Biophys. Acta 1989, 988 (3), 351−376.
(71) Rappolt, M.; Hickel, A.; Bringezu, F.; Lohner, K. Mechanism ofthe lamellar/inverse hexagonal phase transition examined by highresolution X-ray diffraction. Biophys. J. 2003, 84 (5), 3111−3122.(72) Nagle, J. F.; Tristram-Nagle, S. Lipid bilayer structure. Curr.Opin. Struct. Biol. 2000, 10 (4), 474−480.(73) Anezo, C.; de Vries, A. H.; Holtje, H.-D.; Tieleman, D. P.;Marrink, S.-J. Methodological issues in lipid bilayer simulations. J. Phys.Chem. B 2003, 107 (35), 9424−9433.(74) Poger, D.; Mark, A. E. On the validation of molecular dynamicssimulations of saturated and cis-monounsaturated phosphatidylcholinelipid bilayers: A comparison with experiment. J. Chem. Theory Comput.2009, 6 (1), 325−336.(75) Kucerka, N.; Katsaras, J.; Nagle, J. Comparing membranesimulations to scattering experiments: Introducing the SIMtoEXPsoftware. J. Membr. Biol. 2010, 235 (1), 43−50.(76) Shirts, M. R. Simple quantitative tests to validate sampling fromthermodynamic ensembles. J. Chem. Theory Comput. 2012, 9 (2),909−926.(77) Seelig, J.; Waespe-Sarcevic, N. Molecular order in cis and transunsaturated phospholipid bilayers. Biochemistry 1978, 17 (16), 3310−3315.(78) Perly, B.; Smith, I. C. P.; Jarrell, H. C. Acyl chain dynamics ofphosphatidylethanolamines containing oleic acid and dihydrosterculicacid: deuteron NMR relaxation studies. Biochemistry 1985, 24 (17),4659−4665.(79) Lafleur, M.; Bloom, M.; Eikenberry, E. F.; Gruner, S. M.; Han,Y.; Cullis, P. R. Correlation between lipid plane curvature and lipidchain order. Biophys. J. 1996, 70 (6), 2747−2757.(80) Warschawski, D.; Devaux, P. Order parameters of unsaturatedphospholipids in membranes and the effect of cholesterol: a 1H-13Csolid-state NMR study at natural abundance. Eur. Biophys. J. 2005, 34(8), 987−96.(81) Petrache, H. I.; Dodd, S. W.; Brown, M. F. Area per lipid andacyl length distributions in fluid phosphatidylcholines determined by(2)H NMR spectroscopy. Biophys. J. 2000, 79 (6), 3172−92.(82) Douliez, J. P.; Leonard, A.; Dufourc, E. J. Restatement of orderparameters in biomembranes: calculation of C-C bond orderparameters from C-D quadrupolar splittings. Biophys. J. 1995, 68(5), 1727−1739.(83) Aussenac, F.; Laguerre, M.; Schmitter, J.-M.; Dufourc, E. J.Detailed structure and dynamics of bicelle phospholipids usingselectively deuterated and perdeuterated labels. 2H NMR andmolecular mechanics study. Langmuir 2003, 19 (25), 10468−10479.(84) Shaikh, S. R.; Brzustowicz, M. R.; Gustafson, N.; Stillwell, W.;Wassall, S. R. Monounsaturated PE does not phase-separate from thelipid raft molecules sphingomyelin and cholesterol: Role forpolyunsaturation? Biochemistry 2002, 41 (34), 10593−10602.(85) Hitchcock, P. B.; Mason, R.; Thomas, K. M.; Shipley, G. G.Structural chemistry of 1,2 dilauroyl-DL-phosphatidylethanolamine:Molecular conformation and intermolecular packing of phospholipids.Proc. Natl. Acad. Sci. U.S.A. 1974, 71 (8), 3036−3040.(86) Seelig, A.; Seelig, J. Bilayers of dipalmitoyl-3-sn-phosphatidyl-choline: Conformational differences between the fatty acyl chains.Biochim. Biophys. Acta 1975, 406 (1), 1−5.(87) Jambeck, J. P. M.; Lyubartsev, A. P. An extension and furthervalidation of an all-atomistic force field for biological membranes. J.Chem. Theory Comput. 2012, 8 (8), 2938−2948.(88) Senak, L.; Davies, M. A.; Mendelsohn, R. A quantitative IRstudy of hydrocarbon chain conformation in alkanes and phospholi-pids: CH2 wagging modes in disordered bilayer and HII phases. J.Phys. Chem. 1991, 95 (6), 2565−2571.(89) Moss, G. P. Basic terminology of stereochemistry. Pure Appl.Chem. 1996, 68 (12), 2193−2222.(90) Cates, D. A.; Strauss, H. L.; Snyder, R. G. Vibrational modes ofliquid n-alkanes: Simulated isotropic raman spectra and bandprogressions for C5H12-C20H42 and C16D34. J. Phys. Chem. 1994,98 (16), 4482−4488.
Journal of Chemical Theory and Computation Article
dx.doi.org/10.1021/ct4010307 | J. Chem. Theory Comput. XXXX, XXX, XXX−XXXN

(91) Snyder, R. G.; Strauss, H. L.; Elliger, C. A. C-H stretchingmodes and the structure of n-alkyl chains. 1. Long, disordered chains.J. Phys. Chem. 1982, 86, 5145−5150.(92) Mendelsohn, R.; Senak, L. Quantitative determination ofconformational disorder in biological membranes by FTIR spectros-copy. In Biomolecular spectroscopy; Clark, R. J. H. ,Hester, R. E., Eds.;Wiley: New York, 1993; pp 339−380.(93) Casal, H. L.; McElhaney, R. N. Quantitative determination ofhydrocarbon chain conformational order in bilayers of saturatedphosphatidylcholines of various chain lengths by Fourier transforminfrared spectroscopy. Biochemistry 1990, 29 (23), 5423−5427.(94) Tuchtenhagen, J.; Ziegler, W.; Blume, A. Acyl chain conforma-tional ordering in liquid-crystalline bilayers: comparative FT-IR and2H-NMR studies of phospholipids differing in headgroup structureand chain length. Eur. Biophys. J. 1994, 23 (5), 323−335.(95) Mendelsohn, R.; Davies, M. A.; Brauner, J. W.; Schuster, H. F.;Dluhy, R. A. Quantitative determination of conformational disorder inthe acyl chains of phospholipid bilayers by infrared spectroscopy.Biochemistry 1989, 28 (22), 8934−8939.(96) Kucerka, N.; Gallova, J.; Uhríkova, D.; Balgavy, P.; Bulacu, M.;Marrink, S.-J.; Katsaras, J. Areas of Monounsaturated Diacylphospha-tidylcholines. Biophys. J. 2009, 97 (7), 1926−1932.(97) Ratto, T. V.; Longo, M. L. Obstructed diffusion in phase-separated supported lipid bilayers: A combined atomic forcemicroscopy and fluorescence recovery after photobleaching approach.Biophys. J. 2002, 83 (6), 3380−3392.(98) Almeida, P. F. F.; Vaz, W. L. C.; Thompson, T. E. Lateraldiffusion in the liquid phases of dimyristoylphosphatidylcholine/cholesterol lipid bilayers: a free volume analysis. Biochemistry 1992, 31(29), 6739−6747.(99) Oradd, G.; Lindblom, G.; Westerman, P. W. Lateral diffusion ofcholesterol and dimyristoylphosphatidylcholine in a lipid bilayermeasured by pulsed field gradient NMR spectroscopy. Biophys. J.2002, 83 (5), 2702−2704.(100) Filippov, A.; Oradd, G.; Lindblom, G. Influence of cholesteroland water content on phospholipid lateral diffusion in bilayers.Langmuir 2003, 19 (16), 6397−6400.(101) Vaz, W. L. C.; Clegg, R. M.; Hallmann, D. Translationaldiffusion of lipids in liquid crystalline phase phosphatidylcholinemultibilayers. A comparison of experiment with theory. Biochemistry1985, 24 (3), 781−786.(102) Scheidt, H. A.; Huster, D.; Gawrisch, K. Diffusion ofcholesterol and its precursors in lipid membranes studied by 1Hpulsed field gradient magic angle spinning NMR. Biophys. J. 2005, 89(4), 2504−2512.(103) Kusba, J.; Li, L.; Gryczynski, I.; Piszczek, G.; Johnson, M.;Lakowicz, J. R. Lateral diffusion coefficients in membranes measuredby resonance energy transfer and a new algorithm for diffusion in twodimensions. Biophys. J. 2002, 82 (3), 1358−1372.(104) Jin, A. J.; Edidin, M.; Nossal, R.; Gershfeld, N. L. A singularstate of membrane lipids at cell growth temperatures. Biochemistry1999, 38 (40), 13275−13278.(105) Poger, D.; Mark, A. E. Lipid bilayers: The effect of force fieldon ordering and dynamics. J. Chem. Theory Comput. 2012, 8 (11),4807−4817.(106) Wohlert, J.; Edholm, O. Dynamics in atomistic simulations ofphospholipid membranes: Nuclear magnetic resonance relaxation ratesand lateral diffusion. J. Chem. Phys. 2006, 125 (20), 204703.(107) Wang, Y.; Markwick, P. R. L.; de Oliveira, C. A. F.;McCammon, J. A. Enhanced lipid diffusion and mixing in acceleratedmolecular dynamics. J. Chem. Theory Comput. 2011, 7 (10), 3199−3207.(108) Basconi, J. E.; Shirts, M. R. Effects of temperature controlalgorithms on transport properties and kinetics in molecular dynamicssimulations. J. Chem. Theory Comput. 2013, 9 (7), 2887−2899.(109) Konig, S.; Bayerl, T. M.; Coddens, G.; Richter, D.; Sackmann,E. Hydration dependence of chain dynamics and local diffusion in L-alpha-dipalmitoylphosphtidylcholine multilayers studied by incoherentquasi-elastic neutron scattering. Biophys. J. 1995, 68 (5), 1871−1880.
Journal of Chemical Theory and Computation Article
dx.doi.org/10.1021/ct4010307 | J. Chem. Theory Comput. XXXX, XXX, XXX−XXXO