lipid productivity of algae - cal...
TRANSCRIPT
LIPID PRODUCTIVITY OF ALGAE GROWN ON DAIRY WASTEWATER
AS A POSSIBLE FEEDSTOCK FOR BIODIESEL
A Master’s Thesis Presented to the Faculty California Polytechnic University, San Luis Obispo
In Partial Fulfillment
of the Requirements for the Degree Master of Science in
Civil and Environmental Engineering
by
Ian Charles Woertz
December 2007

AUTHORIZATION FOR REPRODUCTION OF MASTER’S THESIS I grant permission for the reproduction of this thesis in its entirety or any parts, without further authorization from me, provided the author and major advisor are properly referenced. ___________________________________ Signature ___________________________________ Date
ii

APPROVAL PAGE
LIPID PRODUCTIVITY OF ALGAE GROWN ON DAIRY WASTEWATER AS A POSSIBLE FEEDSTOCK FOR BIODIESEL IAN WOERTZ
SUBMITTED: _________________________
___________________________________ _________________________ Committee Chair: Yarrow Nelson, Ph.D. Date ___________________________________ _________________________ Committee Member: Tryg Lundquist, Ph.D. Date ___________________________________ _________________________ Committee Member: Andrew Kean, Ph.D. Date
iii

ABSTRACT
Lipid Productivity of Algae Grown on Dairy Wastewater as a Possible Feedstock for
Biodiesel
Ian Woertz
The objective of this thesis is to develop a biological wastewater treatment system that
utilizes algal growth to simultaneously create renewable energy in the form of biodiesel
and digester biogas, remove polluting nutrients, and abate greenhouse gases. Research
under the Department of Energy Aquatic Species Program during 1978-1996 concluded
that cultivating algae for biofuels was cost prohibitive at that time and that an integrated
approach should be studied that combined wastewater treatment with algal biofuel
production. Nutrient removal, in particular nitrogen and phosphorus, from wastewater is
a growing regulatory need and the use of algae cultivation could create a unique marriage
between waste treatment and biofuel production. To investigate this possible synergy,
bench-scale tests were conducted to determine potential algal lipid productivity with
mixed-cultures of algae grown on anaerobically-pretreated dairy wastewater in batch
mode. The total lipid content of the algae ranged from 8% to 29% of algal mass.
Maximum biomass concentration reached 920 mg/L, measured as volatile suspended
solids, on Day 13 of incubation. In contrast, maximum total lipid content was reached at
Day 6, corresponding to a lipid productivity of 2.8 g/m2/day, or 1,200 gallons/acre/year if
scaled up. Nutrient removal over 12 days of incubation was nearly complete. Total
ammonia (NH3+NH4+) was reduced 96% to 1.1 mg/L as N, and phosphate (PO4
3-) was
reduced >99% from an initial concentration of 2.5 mg/L PO4 as P.
iv

ACKNOWLEDGMENTS
I would like to thank my thesis advisors for their support during the work of this thesis. I would like to thank Dr. Yarrow Nelson for his inspiration, dedication and friendship throughout the creation of this master’s thesis. Without Dr. Nelson I would not have made it through the many late hours of experimentation and the countless drafts that it took to get to this point. I would also like to thank Dr. Tryg Lundquist who made this project possible with his endless knowledge of algae and wastewater. I feel incredibly fortunate to have met someone as talented and passionate about algae as Dr. Lundquist and I look forward to what the future of algae-biofuels will bring. In addition, I would like to thank Dr. Andrew Kean for his support during all the presentations that led up to my defense as well as his contribution in editing this thesis. I would like to thank my co-workers and friends here at Cal Poly: Adam Feffer and Kyle Poole for their analytical support and endless laughs in lab, Laleh Rastegarzadeh for her enthusiasm and support in DC, and the rest of my friends here at school that always believed in me. And finally, I would like to thank my family for their love and sacrifice throughout my college career and better part of two decades of education. Joint funding for this project was provided by the U.S. Environmental Protection Agency’s People, Prosperity, and Planet (P3) student competition and the U.S. Department of Energy’s Small Business Innovative Research (SBIR) Program.
v

TABLE OF CONTENTS
LIST OF FIGURES ........................................................................................................... ix
LIST OF TABLES............................................................................................................ xii
CHAPTER 1: INTRODUCTION....................................................................................... 1
CHAPTER 2: BACKGROUND......................................................................................... 6
2.1. Biofuels ............................................................................................................... 6
2.1.1. Renewable Energy .......................................................................................6
2.1.2. Biodiesel and the Feedstock Dilemma.........................................................9
2.2. Algae to Biodiesel History................................................................................ 12
2.3. Wastewater Treatment ...................................................................................... 13
2.3.1. Algae-Based Wastewater Treatment vs. Traditional Methods ..................13
2.3.2. Anaerobic Digestion and Biogas Production.............................................15
2.4. Other Algae Products and Commercial Algae Production ............................... 16
2.5. Lipid Chemistry ................................................................................................ 19
CHAPTER 3: MATERIALS AND METHODS .............................................................. 21
3.1. Collection and Pretreatment of Dairy Wastewater ........................................... 21
3.2. Outdoor Algal Growth Containers.................................................................... 24
3.2.1. Operation of Initial Semi-Continuous experiments ...................................26
3.2.2. Batch Experiment.......................................................................................28
3.3. Operating Conditions and Additional Testing .................................................. 29
3.4. Algae Analysis .................................................................................................. 30
3.4.1. Algae Identification ...................................................................................30
3.4.2. Total Suspended Solids..............................................................................30
vi

3.5. Nutrient Analyses.............................................................................................. 31
3.5.1. Ammonia....................................................................................................31
3.5.2. Total Kjeldahl Nitrogen .............................................................................31
3.5.3. Nitrate, Nitrite, and Phosphate by Ion Chromatography ...........................32
3.6. Total Lipid Analysis ......................................................................................... 34
3.7. Dissolved Oxygen Measurement ...................................................................... 38
CHAPTER 4: RESULTS AND DISCUSSION................................................................ 39
4.1. Semi-Continuous Experiment........................................................................... 39
4.1.1. Biomass Results for Semi-Continuous Experiment...................................39
4.1.2. Biochemical Oxygen Demand during Semi-Continuous Experiment .......40
4.1.3. Nutrient Removal Semi-Continuous Experiment ......................................41
4.1.4. Initial Total Lipid Content during the Semi-Continuous Experiment ......44
4.2. Batch Experiment Results................................................................................. 45
4.2.1. Algae Identification ...................................................................................45
4.2.2. Initial Conditions .......................................................................................48
4.2.3. Biomass Results for Batch Experiments and Growth Curves ...................49
4.2.4. Total Lipid Percentages and Productivity..................................................52
4.2.5. Nutrient Removal.......................................................................................57
4.2.6. Dissolved Oxygen and pH Changes During Batch Experiments...............61
CHAPTER 5: CONCLUSIONS ....................................................................................... 63
5.1. Experimental Conclusions .........................................................................63
5.2. Future Research .........................................................................................65
REFERENCES ................................................................................................................. 68
vii

APENDIX A ..................................................................................................................... 73
Ammonia testing........................................................................................................... 73
APPENDIX B ................................................................................................................... 74
Kjeldahl Nitrogen Testing............................................................................................. 74
APPENDIX C ................................................................................................................... 75
Lipid Extraction Data.................................................................................................... 75
viii

LIST OF FIGURES
Figure 1.1 Combined dairy wastewater treatment and algae-biodiesel feedstock
production ..........................................................................................................5
Figure 2.1: US energy use sector breakdown, 2005 (EIA, 2005) ....................................... 7
Figure 2.2: U.S. renewable energy as share of total energy, (EIA, 2005) .......................... 8
Figure 2.3: U. S. Transportation sector energy consumption (EIA, 2005)......................... 9
Figure 2.4: Algae-bacteria symbiosis in wastewater treatment (Lundquist, 2007) .......... 14
Figure 2.5: High rate ponds for Spirulina ......................................................................... 18
Figure 2.6: Paddle wheel mixer in HRP for wastewater treatment Hilmar,
California (photo credit: T. Lundquist)............................................................18
Figure 3.1: Cal Poly Dairy, San Luis Obispo with ........................................................... 21
Figure 3.2: Wedge wire sloped screen at the Cal Poly Dairy. .......................................... 22
Figure 3.3: Anaerobic digester.......................................................................................... 23
Figure 3.4: Algae bioreactors (and anaerobic digester in background) ............................ 25
Figure 3.5: Diagram of an algae bioreactor. ..................................................................... 25
Figure 3.6 Algae bioreactor with air mixing and CO2 sparging....................................... 26
Figure 3.7: Algae bioreactor media. ................................................................................. 29
Figure 3.8: Lipid extraction diagram ................................................................................ 36
Figure 3.9: Fume hood with lipid extraction equipment................................................... 37
Figure 3.10: Dried lipid extract......................................................................................... 37
ix

Figure 4.1: Biomass and pH for semi-continuous experiment for R1 tank. ..................... 40
Figure 4.2: Nitrite concentrations during the semi-continuous experiment. .................... 42
Figure 4.3: Nitrate removal during the semi-continuous experiment. .............................. 43
Figure 4.4: Phosphate removal during the semi-continuous experiment.......................... 44
Figure 4.5: Photomicrograph of Scenedesmus at 1000x (phase contrast) at Day 45
of the semi-continuous experiment R5. ...........................................................46
Figure 4.6: Photomicrograph of Micractinium at 100x (phase contrast) on Day 45
of the semi-continuous experiment R5. ...........................................................46
Figure 4.7: Photomicrograph of Actinastrum at 1000x (phase contrast) on Day 27
of the semi-continuous experiment R1. ...........................................................47
Figure 4.8: Photomicrograph of flocculated Scenedesmus at 400x (Dark Phase) on
Day 45 of the semi-continuous experiment R4................................................48
Figure 4.9 Biomass and pH for batch experiment for 25% WW dilution. ....................... 50
Figure 4.10 Biomass and pH for batch experiment for 25% WW dilution. ..................... 51
Figure 4.11 Log phase of biomass for 25% WW dilution algae growth reactor .............. 51
Figure 4.12 Log phase of biomass for 10% WW dilution algae growth reactor .............. 52
Figure 4.13: 25% WW Dilution algae growth and lipid content during batch run........... 54
Figure 4.14: 10% WW Dilution algae growth and lipid content during batch run........... 55
Figure 4.15: Nutrient reduction in 25% dilution culture................................................... 58
Figure 4.16: Nutrient reduction in 10% dilution culture................................................... 59
Figure 4.17: Dissolved oxygen and pH change in 25% dilution culture through
sunrise on March 24th, 2007.............................................................................62
x

Figure 4.18: Dissolved oxygen and pH change in 10% dilution culture through
sunrise March 24th, 2007..................................................................................62
xi

LIST OF TABLES
Table 4.1: Lipid percentage in biomass during semi-continuous experiment .................. 45
Table 4.2: Initial characteristics of diluted dairy wastewater. .......................................... 49
Table 4.3: Lipid productivity of algae reported in the literature....................................... 56
Table 4.4: Ammonia removal comparison for algae treatment systems........................... 60
Table 4.5: Nitrogen balance for all species of N .............................................................. 61
xii

CHAPTER 1: INTRODUCTION
“We, the human species, are confronting a planetary emergency — a threat to the
survival of our civilization (climate change) that is gathering ominous and destructive
potential even as we gather here. But there is hopeful news as well: we have the ability to
solve this crisis and avoid the worst — though not all — of its consequences, if we act
boldly, decisively and quickly” (Al Gore, acceptance speech for the Nobel Peace Prize,
2007). Global atmospheric concentrations of carbon dioxide, methane and nitrous oxide
have increased markedly as a result of human activities since 1750 and now far exceed
pre-industrial industrial values (IPCC, 2007). The global increase in carbon dioxide
concentration is due primarily to fossil fuel use and land use change, while those of
methane and nitrous oxide are primarily due to agriculture (IPCC, 2007). With these
concerns of pollution, global warming, and energy shortages society is beginning to look
to biofuels as a replacement energy source.
Biofuels produced from plants have the potential to replace a portion of our fossil fuel
consumption with a renewable alternative. However, there is growing concern that the
use of food crops for biodiesel and other renewable fuels may be an uneconomical long
term solution (Patzek and Pimentel, 2005). Previous research in the early 1990’s by the
National Renewable Energy Laboratory (NREL) showed that under controlled conditions
algae are capable of producing 40 times the amount of oil for biodiesel per unit area of
land, compared to terrestrial oilseed crops such as soy and canola (Sheehan et al., 1998).
However, their results also showed that large-scale algae cultivation for energy
production was uneconomical at that time and suggested future research into waste-
1

stream integration (Sheehan et al., 1998). It is hoped that the economics will be
ultimately improved by combining biodiesel feedstock production with agricultural or
municipal wastewater treatment and CO2 fixation. The research presented here was
conducted to determine the feasibility of producing biodiesel feedstock in the form of
microalgae grown in dairy wastewater ponds as one approach to waste-stream
integration. Further, the rapidly increasing price of petroleum and weakening US dollar
are improving the economic feasibility of alternative fuels since the conclusion of the
NREL study.
Biodiesel production from algae grown in dairy wastewater has the potential to address
three important societal needs: Development of new energy sources, management of
agricultural wastes to protect aquatic environments and reduction of the global
anthropogenic greenhouse effect. Due to dwindling domestic petroleum reserves and
dependence on foreign oil from unstable regions it is imperative for the U.S. to develop
new domestic energy sources. Biodiesel production is one possible route to supplement
our energy production (Tickell, 2006). Agricultural waste is also becoming recognized as
an important environmental problem as the use of high-capacity confined animal farming
and intensive plant farming increases. Of particular concern is nutrient run-off from
manure and chemical fertilizer, which contributes to eutrophication and hypoxia of
receiving water bodies (NRC, 2007). Algal treatment ponds have the potential to reduce
nitrogen and phosphorus nutrients through assimilation into algal biomass followed by
biomass harvesting. The third issue, global warming, as stated before, is important
because atmospheric concentrations of carbon dioxide, methane and nitrous oxide are
2

increasing (IPCC, 2007). Biomass energy sources can be carbon neutral, meaning that
the CO2 that is emitted during combustion of the biofuel will be absorbed into the next
crop of plants that are grown as biofuel feedstock, thus creating a closed carbon cycle.
Algae feedstock production on wastewater is likely to have a much more beneficial
carbon balance than feedstock produced with chemical fertilizers, which require fossil
fuel in their manufacture. In addition, the use of chemical fertilizers, such as nitrogen
and phosphorus, have significant costs associated with them which are avoided through
the combination of wastewater acting as the fertilizer.
The goal of this research is to contribute to the development of an integrated algae
biofuel and wastewater treatment process. This process would simultaneously create
algae feedstock for biogas or biodiesel and remove nutrients from dairy lagoon
wastewater. Algae production and nutrient removal would be accelerated by addition of
CO2 from digester gas combustion in a boiler or generator. There was a companion study
performed by fellow graduate student Adam Feffer examining the effects of CO2 addition
on algae based municipal wastewater treatment (Feffer, 2007).
The ultimate vision for the proposed integrated algae-based treatment production process
is shown in Figure 1.1. Wastewater is first screened and transferred to an anaerobic
digester. The anaerobic digester breaks down organic carbon into methane gas which can
be used as an energy source in a biogas generator. The effluent from the anaerobic
digester, which remains rich in nutrients, is then transferred to algae ponds. Exhaust gas
from the generator, rich in CO2, is sparged into the algae ponds. The CO2 sparging
3

accelerates the treatment and algal growth, balances the high nitrogen in the wastewater
with carbon, and fixes the CO2 in the algal biomass, which abates greenhouse gas
releases once the algae biofuel is used. The algae are then harvested, and the lipids are
extracted and converted into biodiesel. The residual algal biomass after lipid extraction
can also be used as a fertilizer for crop production.
The purpose of the research described in this thesis is to determine the direct feasibility of
producing biodiesel from algae grown on agricultural wastewater for simultaneous
energy production and nutrient removal. The specific objectives include:
1. Operate bench-scale algal growth ponds to determine the feasibility of producing
lipids from algae grown from dairy wastewater.
2. Determine growth rates and lipid content of mixed algae cultures grown in dairy
wastewater.
3. Determine the efficiency of nutrient removal from dairy wastewater using bench-
scale algae ponds.
4

Anaerobic Digester Methane
Dairy Wastewater
Figure 1.1 Combined dairy wastewater treatment and algae-biodiesel feedstock production
High-Rate Algae Pond
Biogas Generator
Algae Harvester
Algae Feedstock for Biofuel
Exhaust CO2
Effluent Rich in
Nutrients Heat Electricity
Sunlight
5

CHAPTER 2: BACKGROUND
This section gives a breakdown of U.S. energy use with discussion of the U.S. biodiesel
feedstock outlook, a review of at wastewater treatment methods with emphasis on algae-
based systems, anaerobic digestion/ biogas production, algae products and production,
and lipid chemistry.
2.1. Biofuels
2.1.1. Renewable Energy
To understand the impact that biofuels can have in the U.S. we will first discuss where
energy is used by sector, the sources of that energy, and the trends in liquid fuel
consumption. The energy consumed in the U.S. is split between residential, commercial,
industrial, and transportation uses (Figure 2.1). Our residential and commercial sectors
combined consume 40% of our total energy. Our industrial processes consume 32% of
our total energy and our transportation consumes 28% of the total energy consumption.
6

Figure 2.1: US energy use sector breakdown, 2005 (EIA, 2005)
Our breakdown of current sources of energy in the U.S. is shown in Figure 2.2.
Renewable energy contributes only 6% of our total energy production (EIA, 2005). The
largest portion of our energy is produced from petroleum at 40% followed by natural gas,
coal and nuclear power (Figure 2.2). Of the total amount of renewable energy produced,
the largest portion (45%) comes from hydroelectric power and only 6% comes from
alcohol fuels for transportation (Figure 2.2). The amount of energy produced from
biodiesel is so small it is not even included in the breakdown.
7
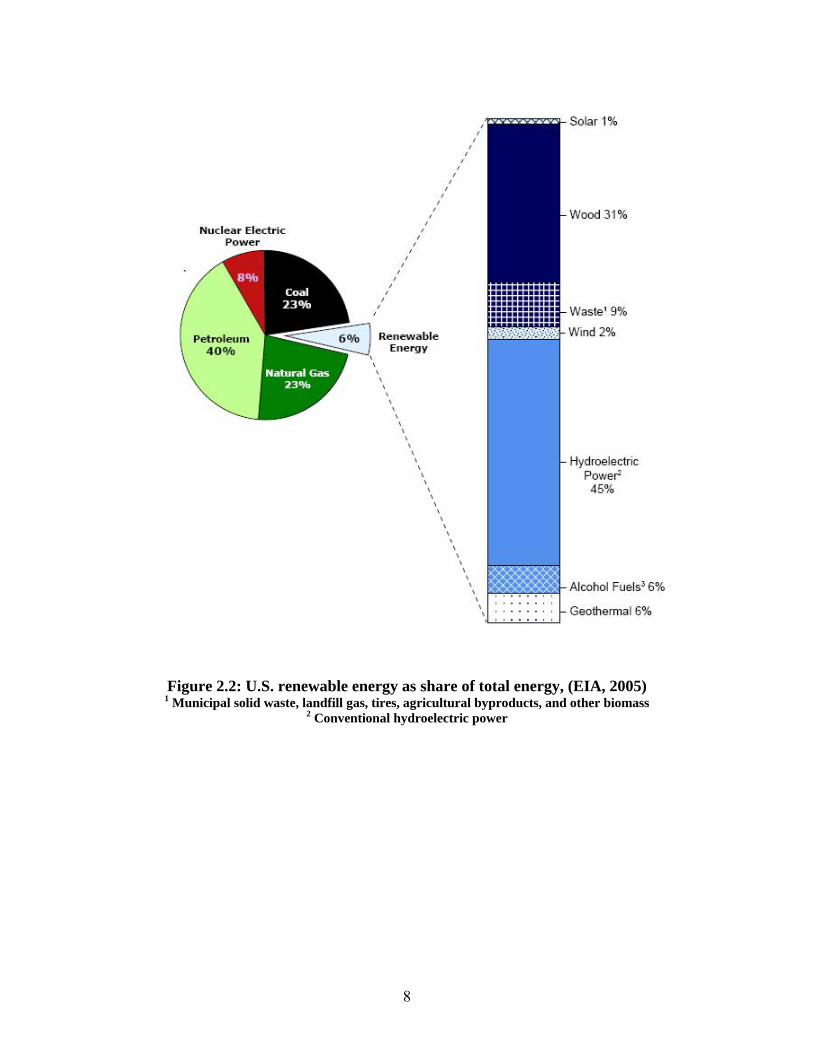
Figure 2.2: U.S. renewable energy as share of total energy, (EIA, 2005) 1 Municipal solid waste, landfill gas, tires, agricultural byproducts, and other biomass
2 Conventional hydroelectric power
8

Over three times as much motor gasoline is consumed compared to middle distillate fuel
such as diesel (EIA, 2005). Over 9 million barrels of gasoline and less than three million
barrels of distillate fuel are consumed every day. Both of these numbers have been
steadily increasing for the past 50 years (Figure 2.3).
Figure 2.3: U. S. Transportation sector energy consumption (EIA, 2005) 2.1.2. Biodiesel and the Feedstock Dilemma
Biodiesel is a fuel that is derived from lipids, which are fatty acids produced from plants
or animals. Biodiesel can be used in any diesel engine with little to no modification
(National Biodiesel Board, 2007). Compared with petroleum diesel fuel, biodiesel tail
pipe emissions of total hydrocarbons, particulates and carbon monoxide are reduced 55%,
53%, and 48% respectively (Haas et al., 2001). Biodiesel is also more readily
biodegradable than petroleum diesel (Zhang et al., 1998). Total U.S. production of
biodiesel in 2006 was over 250 million gallons (USDA, 2006) while manufacturing
9

capacity was estimated at close to 600 million gallons annually (National Biodiesel
Board, 2007). However, biodiesel production is currently only a small fraction of the
estimated 50 billion gallons of distillate fuel and 128 billion gallons of all other
transportation fuels that the U.S. consumes annually (EIA, 2005).
As the capacity and demand for biodiesel production increases, so will the demand for an
economical feedstock for biodiesel production. The single largest energy cost for
production of biofuels is the feedstock (Pimentel and Patzek, 2005). Soy is the most
common vegetable oil used due to its availability and high quality of the fuel produced,
however, there is increasing interest in alternative feedstocks because of competition with
the food industry, which has increased the feedstock cost. Also, the energy intensity of
soybean production limits the economic feasibility and energy savings. Some studies
have indicated that production of biodiesel from soy and ethanol from corn represents a
net energy loss due to energy required for crop production (Patzek and Pimentel, 2005,
Talens et al., 2007). However, other studies indicate that there is a modest gain in net
energy for biofuels, up to 40% for corn ethanol and biodiesel (Adler et al., 2007). There
are many discrepancies in the reported calculations of net energy production due to
variables that change from case to case such as fertilizer source and application,
transportation costs for feedstocks, and the value of byproducts from the conversion to
biofuels, etc. Further research is needed to calculate the full life cycle emissions and net
energy of all fuels, including biofuels.
10

Production of biofuel feedstock crops has similar environmental impacts to production of
feed and food crops. There is a significant problem with over fertilization in industrial
farming and the water runoff causing eutrophication in receiving water bodies as
observed in the Gulf of Mexico (NRC, 2007). There are also growing concerns that the
industrial farming of corn and soy are causing more pollution than previously thought in
the form of air emissions from fertilizers and on-farm nitrogen flows (e.g., N2O, and NO)
(Landis et al., 2007).
Soy beans have relatively low oil productivity at 40-50 gallons/acre/year (Pimentel and
Patzek, 2005). Canola produces slightly higher oil yields at 100-120 gallons/acre/year,
and is being grown mostly in Canada (Pimentel and Patzek, 2005). Palm oil can have
productivities up to 636 gallons/acre/year (Chisti et al., 2007). However, there are
serious environmental effects being felt in Indonesia due to the enormous export of palm
oil to Western Europe for biodiesel production. Land conversion for oil-palm plantations
is causing deforestation, leading to long-term soil degradation, loss of precious habitats
and extinction of native species in rainforests (Glastra, 2002).
Totaling the current production of crop oil, recycled grease, and animal fat only yields a
total of approximately 4.4 billion gallons per year in the U.S. (Duffield USDA, 2007,
Tyson NREL, 2002). Assuming all of these oils were diverted to biodiesel it would
provide less than 10% of the 50 billion gallons of diesel fuel consumed annually (EIA,
2005). Therefore it is essential to develop new sources of industrial biomass production
for biofuels conversion.
11

2.2. Algae to Biodiesel History
Microalgae are known to make far more efficient use of solar energy than conventional
agriculture (Benemann, 2007) and therefore there is a larger potential for biomass
production from algae with less land requirement. Experiments have shown average
algae biomass productivities of 30 dry tons/acre/year (Oswald et al., 1957), which is 10
times more productive than wheat (Oswald, 1962). Renewable energy production from
algae is not a new concept. Early work was carried out by Golueke et al. (1957) on the
anaerobic digestion of algae for producing methane fuel. The most extensive research
into the development of biofuels from algae was performed by the National Renewable
Energy Laboratory (NREL) from 1978 to 1996 (Sheehan et al. 1998). NREL concluded
that a more practical approach for near term production of algae biodiesel is to utilize
wastewater treatment for algae propagation (Sheehan et al. 1998), an already well
developed technology (Oswald, 2003). Other analyses of full-scale algae to biodiesel
production have been conducted by Benemann et al. (1982), Weissman et al. (1987), and
more recently Chisti (2007), with differing conclusions. Analysis by Chisti (2007)
concludes that the economics of algae-biodiesel will be achievable with improvements to
algal biology through genetic and metabolic engineering, and the use of photobioreactors
which can provide a controlled environment. However, Benemann (1982) concludes that
algae to biodiesel will have a large impact with combination of wastewater treatment in
agreement with the NREL study.
12

2.3. Wastewater Treatment
Municipal and industrial wastewater treatment is a key infrastructural process that keeps
our cities, communities and ecosystems sanitary. A great deal of money and effort is
spent on the removal of pollutants such as biochemical oxygen demand, turbidity, and
nutrients. In addition to these sectors, regulation of farm water pollution is becoming
more intense in recent years (California Water Board, 2003). Large confined animal
feeding operations such as dairies with over 1,000 head can be major sources of water
and air pollution (Centner, 2001). In response, nutrient discharge requirements are being
implemented as problems with run-off and ground water contamination becomes more
prevalent (California Water Board, 2003).
Nutrients, such as nitrogen and phosphorus, can be removed from wastewater in several
ways. The most common way of removing nitrogen is though denitrification leading to
reduction of nitrate to nitrogen gas, which is released to the atmosphere (e.g. Metcalf &
Eddy et al., 2003). Phosphorus, on the other hand, is often removed by chemical
precipitation using FeCl3, etc. However, both phosphorus and nitrogen can be removed
by assimilation. This can be accomplished though the growth of bacteria or algae in the
wastewater and then the removal of that biomass. The technique of promoting algae
growth for nutrient removal was first developed by Oswald et al., (1957).
2.3.1. Algae-Based Wastewater Treatment vs. Traditional Methods
Using algae for wastewater treatment offers some interesting advantages over
conventional wastewater treatment. It has been shown to be a more cost effective way to
13

remove biochemical oxygen demand, pathogens, phosphorus and nitrogen than activated
sludge (Green et al., 1996). Traditional wastewater treatment processes involve the high
energy costs of mechanical aeration to provide oxygen to aerobic bacteria to consume the
organic compounds in the wastewater. Algae provide an efficient way to consume
nutrients and provide the aerobic bacteria with the needed oxygen through photosynthesis
(Oswald et al, 1953) (Figure 2.4). Roughly one kg of BOD removed in an activated
sludge process requires one kWh of electricity for aeration, which produces one kg of
fossil CO2 from power generation (Oswald, 2003). By contrast, one kg of BOD removed
by photosynthetic oxygenation requires no energy inputs and produces enough algal
biomass to generate methane that can produce one kWh of electric power (Oswald,
2003).
Algae
Figure 2.4: Algae-bacteria symbiosis in wastewater treatment (Lundquist, 2007)
Bacteria
OO2 2
CO2
N
Organics
N P
CO2P
CO2
Waste
Water
Biomass
Treated
Sun O2
Water
14

Through the process of algae wastewater treatment very large amounts of algal biomass
can be grown. However, it has proven to be difficult to harvest, and even when harvested
it is typically not used in a beneficial way (Lundquist et al., 2007). Converting this algal
biomass into a higher value energy product in the form of biodiesel is a promising
prospect, but there is a need to determine the amount of lipids available from the algae
that is grown in wastewater to determine the feasibility of this technology. It will also be
important in the future to improve harvesting technology.
2.3.2. Anaerobic Digestion and Biogas Production
There are two possible uses for anaerobic digestion and biogas production in combination
with algae-based wastewater treatment. One is the use of anaerobic digestion as a
pretreatment for the wastewater prior to treatment with algae (which is what was used
here in this experiment). This can be an important step because often agricultural
wastewaters have very high BOD, which is costly to treat aerobically. The second use is
to anaerobically digest the algae biomass produced during treatment. This biomass
digestion could provide significant biogas production. Algae digestion is not considered
further in this work, however, it is worth noting for future energy output comparisons
with algae biodiesel production.
Anaerobic digestion of wastewater is a well-known technology and is widely used in
agro-industrial processes such as dairy lagoons. In traditional treatment ponds,
wastewater will undergo anaerobic digestion when not properly aerated, releasing
15

methane gas, a potent greenhouse gas, into the atmosphere as well as hydrogen sulfide,
which has an offensive odor. Creating a controlled anaerobic environment, such as a
covered pond or tank, allows the methane to be captured and combusted for energy
production. In the biochemical process of anaerobic digestion, the waste goes through
three steps as it is converted to methane: hydrolysis, fermentation, and methanogenesis
(Metcalf & Eddy et al., 2003).
Anaerobic digestion is a very effective process for BOD removal, but is not an effective
way to remove nutrients (Metcalf & Eddy et al., 2003). There is thus a need for further
treatment of the effluent from anaerobic digesters before it can be discharged into the
environment.
2.4. Other Algae Products and Commercial Algae Production
Finding uses for algae grown in wastewater has been explored in the past. One of the
most valuable products that could be produced would be a protein source for animals. Of
course there are many difficulties with this proposal such as prevention of pathogen
transmission and contamination with blue-green algae toxins. An observation made by
Dugan et al. (1972) was that during the pelletization of algae-barley feed, the heat of the
process caused pasteurization of the feed preventing disease transmission from waste-
grown algae to animals and later humans. This process may be applied to algae biomass
after the oil has been extracted. The algae biomass will still be wet and a heat source is
required for drying prior to pelletization.
16
Algae biomass can also be used as a fertilizer. This use offers advantages over direct
application of nutrient-rich wastewater, which may cause indirect runoff or
contamination of ground water. Algae biomass degrades slowly thereby releasing
nutrients slowly, which can improve plant uptake (Mulbry et al., 2005), although the
timing of nutrient release may not be optimal for some crops.
Currently, over 5,000 dry tons of microalgal biomass are produced annually in the world,
mostly in “race way” or “high rate” type ponds (Figure 2.5, and Figure 2.6) for high-
value nutritional supplements (Spolaore et al. 2006). Spirulina is one of the most popular
microalgae that is grown for human and animal food and cosmetics, followed by
Chlorella and Dunaliella salina (Spolaore et al. 2006). Spirulina, Chlorella and
Dunaliella salina have very high protein contents compared to traditional sources of
protein (eggs, meat, milk, soybeans, etc.).
Cultures of these algae are kept relatively pure by using culture media that is specific to
the organisms (Spolaore et al. 2006). A high bicarbonate concentration allows Spirulina
to be grown in open ponds with few invasive algae, and a high saline environment allows
Dunaliella salina to be grown in “relative pure cultures” (Anderson, 2005). Producers
keep Chlorella cultures somewhat pure by use of large inoculum doses and by operating
in short batches with harvesting occurring before major contamination can take place
(Benemann, pers. com., 2008).
17

Figure 2.5: High rate ponds for Spirulina
production in India (photo credit: Perry Nutriceuticals)
Figure 2.6: Paddle wheel mixer in HRP for wastewater treatment Hilmar,
California (photo credit: T. Lundquist)
Algae can also be grown in closed systems allowing single strains of algae to be grown
more reliably. There are many different designs of closed system photo-bioreactors that
have been researched and used to grow algae (Ono and Cuello, 2004, Wantanabe et al.,
2004, Chisti et al., 2001). The products from algae that are grown in the closed
18
photobioreactors are specialty food sources as well as pharmaceuticals and pigments.
These are closely controlled systems that require costly media inputs.
Due to the popularity and the tremendous recent growth of biofuels use, start-up
companies are emerging around the world with the claims of producing biodiesel from
algae, most employing some sort of closed-system photobioreactor. However, algae
biodiesel has yet to be produced at a commercial scale (Benemann, 2007). It is again
important to note that previous studies by the NREL concluded that it would be more
economical, at present, to pursue simultaneous wastewater treatment to improve the
economics of algae-biodiesel (Sheehan et al., 1998).
Experiments have been conducted that combined the use of wastewater from a piggery as
a medium for algae growth for the purpose of producing liquid fuels (An et al., 2003). In
that study, the wastewater was first treated with a membrane bioreactor to allow for
monoculture of a pure-species of algae. To date, there appears to be no published study
on lipid yield from mixed cultures of algae grown on agricultural waste. Lipid
percentages for pure cultures of algae are reported in numerous publications, however
there has not been any documentation of lipid percentages of mixed cultures of algae that
are commonly found in wastewater.
2.5. Lipid Chemistry
Lipids are fatty acids and their derivatives, as well as substances related biosynthetically
or functionally to these compounds (Christie, 2003). Fatty acids generally contain even
19

numbers of carbon atoms in straight chains normally in the range of C14 to C24, with a
caroboxyl group at one end. Unsaturated fatty acids occur when there are double bonds
of the cis configuration in specific positions. Fatty acids from microalgae have been
found to contain combinations of zero to five cis double bonds (Thompson, 1996).
Shorthand designation of fatty acids for a saturated chain may look like ‘16:0’, the
number before the colon specifying the number of carbon atoms and the number after the
colon specifying the number of double bonds. The highly saturated acids are more solid
at room temperature. The most typical lipid classes of plant and animal origin consist of
fatty acids linked by an ester bond to the trihydric alcohol, glycerol, or to other alcohols
such as cholesterol, or by amide bonds to long-chain bases, or on occasion to other
amines (Christie, 2003). Lipid type is important to biodiesel production because the
quality and variety of lipids will determine the need for pretreatment before it is
converted to biodiesel, as well as the final fuel properties. Different processing (i.e.
thermal depolymerization) may be required in the case of very poor quality lipids (high
free fatty acid content, high degree of unsaturation, etc) to transform the lipids into
transportation fuel. It is known that pure cultures of green algae contain primarily C16
C18 fatty acids with a high degree of unsaturation (Thompson, 1996). In the present
research, total lipid content rather than lipid type was determined. Lipid type should be
determined in future studies as there are no known studies of lipid profiles from mixed
cultures grown in wastewater.
20

CHAPTER 3: MATERIALS AND METHODS
3.1. Collection and Pretreatment of Dairy Wastewater
The wastewater used in the present study was flush water from the 400-head Cal Poly
Dairy. The Cal Poly Dairy facility has a water-based flush system which collects the
urine and feces from the free stalls (Figure 3.1). The wastewater is first collected in a
settling basin with a 2” x 2” screen to remove any large solids. The effluent from the
basin is transferred to a covered sump. The wastewater is then pumped over a wedge
wire sloped screen (Figure 3.2), which removes grasses and other fine solids, before
being discharged to a large open storage pond. The wastewater undergoes partial
treatment while being stored in the pond by aerobic and anaerobic bacteria. The
wastewater in this pond is the feed for proposed larger algae ponds and was used for all
the bench-scale experiments described below.
Figure 3.1: Cal Poly Dairy, San Luis Obispo with loafing pens in the foreground and a flush water storage tank and free stall barn in
the background.
21

Figure 3.2: Wedge wire sloped screen at the Cal Poly Dairy.
Initial collections of wastewater were performed by hand using plastic 19-liter buckets to
collect water from the surface of the holding pond. Later, wastewater was collected at
the effluent of the sloped screen as this proved to be easier. This wastewater was first fed
to a bench-scale anaerobic digester in the lab (Figure 3.3). The anaerobic digester
consisted of a 208-liter plastic drum wrapped in 2-cm-thick foam insulation. The
insulation provided a more stable temperature during ambient temperature swings.
Attached through the bung hole in the drum lid was a 75-cm tube that extended down
2/3rds of the total height of the drum. This tube was used for feeding the digester as well
as pumping out effluent to feed the algae tanks. Initially, the digester was loaded using a
peristaltic pump, but this was later replaced by manual gravity feeding to improve
operational reliability. The approximate volume of wastewater in the digester was 130
liters. Wastewater was removed using a peristaltic pump. Biogas produced by the
22

digester was collected using a 4.7-L Chemware® FEP gas sampling bag connected to the
lid of the drum. An isolation valve was used in-between the gas collection bag and the
digester to allow the bags to be exchanged with minimal air intrusion. A 91-cm long
thermometer was threaded through the smaller bung on the lid of the drum to monitor
temperature inside the digester; however this stopped working almost immediately after
installation. Loadings of wastewater to the digester were typically done in 10 gallon
batches once per week.
Figure 3.3: Anaerobic digester
23

3.2. Outdoor Algal Growth Containers
The effluent from the digester was transferred to six 40-L glass tanks used as simulated
pond bioreactors for algal growth (Figure 3.4). The water volume was 20 L in each
bioreactor. The bioreactors were covered around the sides with black tape up to the
height of the water surface so that light penetration was from the top only to better
simulate lighting conditions in a large pond (Figure 3.5). A Plexiglas® cover was
constructed to exclude rainfall from all the tanks. Space was given between the cover
and the bioreactors to allow for ventilation. Air stones, 12” inches long, were placed in
the middle of each bioreactor to provide mixing and gas exchange. Air-sparging was at a
rate of 1.5 L/min divided among all of the algal growth containers. Additional CO2 was
used in the batch experiments and sparged in with separate aquarium diffusers at a rate of
0.015 L/min or approximately 1% the volume of air provided (Figure 3.6). It was
determined using an LX-101 Lux Meter (Lutron Corporation) that the decrease of lux
from the sunlight passing through the walls of each bioreactor and through the plastic
cover was balanced out by the reflection from the white wall in the background.
24

Figure 3.4: Algae bioreactors (and anaerobic digester in background)
50 cm 25 cm
Clear plastic cover
Water level
(Side view) (Front view)
16 cm
Support for ventilation
Clear glass
Covered Sides
Figure 3.5: Diagram of an algae bioreactor.
25

Figure 3.6 Algae bioreactor with air mixing and CO2 sparging
Preliminary experiments were performed using semi-continuous cycles of feeding
anaerobic digester effluent to the bioreactors. Later experiments were performed in batch
mode, which allowed for observation of algal growth curves.
3.2.1. Operation of Initial Semi-Continuous experiments
Initially, the algae bioreactors were run in a semi-continuous mode for 48 days. The
bioreactors’ retention times were initially 15, 10 and 5 days, and each was run in
duplicate (Table 3.1). The different algae bioreactors were started with 1.3, 2.0, and 4.0
liters of wastewater diluted with tap water to make a total volume of 20 L each (Table
3.1). Algae inoculum was gathered from a local wastewater treatment pond located in the
26

nearby town of Templeton. Inoculum was added to the algae bioreactors at
approximately 500-mL volumes. The routine loadings made following the start up and
inoculation were 1.3, 2.0 and 4.0 liters of wastewater per day to achieve the different
retention times (Table 3.1). Prior to adding new wastewater from the anaerobic digester
to the algae bioreactors, tap water was added to compensate for evaporation and to bring
the total volume back to 20 L per bioreactor. The algae bioreactors were then rapidly
mixed with glass stir rods and the volume of new wastewater that was to be added was
removed using a 1-L beaker. The new wastewater was then added in the appropriate
volumes using a beaker.
The initially chosen retention times using wastewater proved too short and did not allow
for sufficient algal growth. Later, these predetermined loadings were replaced with
variable-timed loadings determined by algal concentrations. If the algae bioreactors were
not green with algae, new wastewater was not added again until a healthy green color
returned. This initial semi-continuous experiment was used only to better design the later
batch experiments. This initial period of testing also allowed the author to gain
familiarity in the multiple analytical testing methods.
27

Table 3.1 Initial and routine loadings for semi-continuous experiment
Cont. Loading
Wastewater (L)
Tap water (L)
Wastewater (L/day)
R1 15 1.3 18.7 1.3R2 15 1.3 18.7 1.3R3 10 2.0 18.0 2.0R4 10 2.0 18.0 2.0R5 5 4.0 16.0 4.0R6 5 4.0 16.0 4.0
ReactorRetention
Time (days)
Initial Loading
3.2.2. Batch Experiment
Two batch experiments were run after the semi-continuous experiment. Two dilutions of
wastewater were made in order to ensure that the light would not be limited due to the
high turbidity of the wastewater and to insure that a full growth curve would be observed
with the available. Tap water was used to dilute the wastewater to 25% wastewater in
one set of triplicate tanks and to 10% wastewater in the other set of triplicate tanks. The
tap water was sparged with air for approximately 30 min. to strip chlorine prior to mixing
with wastewater. Inoculum was provided from cultures of algae from previous
experiments. Inoculum volume was selected to provide an initial VSS concentration of
about 10% of the expected final VSS (assumed to be ~ 500 mg/L based on earlier
experiments). Therefore with an inoculum concentration of 500 mg/L VSS and a 20 L
total bioreactor volume, 2 L of inoculum were used per algae bioreactor. For each of the
two feed concentrations, the three constituents (tap water, algae inoculum, and anaerobic
effluent) were mixed to obtain a uniform feed solution for the triplicates of each dilution.
A diagram of the dilutions and the numbering system used for each bioreactor is shown
28

in Figure 3.7. The analytical testing that was performed consisted of TSS, VSS, pH,
ammonia as N, nitrate as N, nitrite as N, organic nitrogen, TKN, total nitrogen, and
phosphate as P.
10% WW Dilution 25% WW Dilution
R5 R6 R3 R4 R2 R1
Individual Bioreactors • 2 L Inoculum • 2 L Wastewater • 16 L H2O
Individual Bioreactors • 2 L Inoculum • 5 L Wastewater • 13 L H2O
Figure 3.7: Algae bioreactor media. 3.3. Operating Conditions and Additional Testing
Both experiments were started on March 19th 2007. The 25% dilution tanks were run for
15 days and the 10% dilution tanks for 13 days. Mixing was continuously provided by
the air and CO2 sparging. Additional mechanical mixing was performed daily prior to
sampling by hand using three or four glass stir rods bundled together. Temperature and
pH were recorded at the time of each sampling after mixing. Tap water, which had been
sparged with air to stripe any chlorine, was added to each bioreactor to replace the water
that had been removed due to sampling. During the batch experiment, the average air
temperature was 12.3ºC, and the average daily solar radiation was 203 W/m2, which is
typical for the San Luis Obispo area during that time of year (March-April). The weather
29

data was provided by the California Irrigation Management Information System from
Station 52 located in San Luis Obispo at Latitude 35º18'22"N/35.31 and Longitude:
120º39'37"W / -120.66. The elevation was 330 ft.
3.4. Algae Analysis
3.4.1. Algae Identification
Samples were taken periodically from the algae bioreactors to identify the species
growing in the cultures. A trinocular Olympus CX 41 optical microscope with phase
contrast and an Infinity 2 digital camera were used for algae identification.
Photomicrographs were taken to document the species present and were then used for
comparison with micrograph catalogs of known genera.
3.4.2. Total Suspended Solids
In the batch experiments, the total suspended solids (TSS) and volatile suspended solids
(VSS) were determined daily. Samples were taken from the algae bioreactors at 3 PM
each day and immediately tested for TSS and VSS. The testing for both TSS and VSS
was conducted according to Standard Methods 2540 D (APHA, 1995). The filters used
for solids testing were 1.2-micron Fisher G4 glass fiber filters with 47-mm diameters.
Mass measurements were made using a 5-decimal point electronic balance. Samples
were also stored in HDPE containers at 4°C for nitrite, nitrate, phosphate, ammonia, and
lipid analytes. Additional samples were acidified to less than a pH of 2 and stored at 4°C
for Total Kjeldahl Nitrogen analysis.
30

Filters were first rinsed with DI water using a Millipore filter apparatus and then ashed in
a muffle furnace at 525°C for 15 min. The filters were then cooled in a dessicator and
stored until needed in a 105°C oven. Just prior to analysis, filters were individually
placed into aluminum foil trays and weighed. After weighing, the filter was placed on
the Millipore filter apparatus and a known aliquot of sample was passed through the
filter. The filter was then removed using tweezers and placed back into its individual
tray. Trays were then placed in the 105°C oven for at least 2 hours, but typically over
night. Trays were again weighed to obtain a TSS. After weighing for TSS the trays were
placed in the muffle furnace at 525°C for 15 min. The trays were removed and placed in
the dessicator to allow cooling. The samples were again weighed, this time to obtain a
VSS.
3.5. Nutrient Analyses
3.5.1. Ammonia
Ammonia was measured using an ammonia-specific electrode. This analytical procedure
was carried out by Adam Feffer, a fellow M.S. student at Cal Poly. The details of the
method can be found in Appendix A, which was written by Mr. Feffer.
3.5.2. Total Kjeldahl Nitrogen
Total Kjeldahl nitrogen (TKN) analyses were carried out with the assistance of Adam
Feffer and Kyle Poole (another M.S. student) to determine total organic nitrogen. Details
of the method can be found in Appendix B, which was written by Mr. Feffer.
31
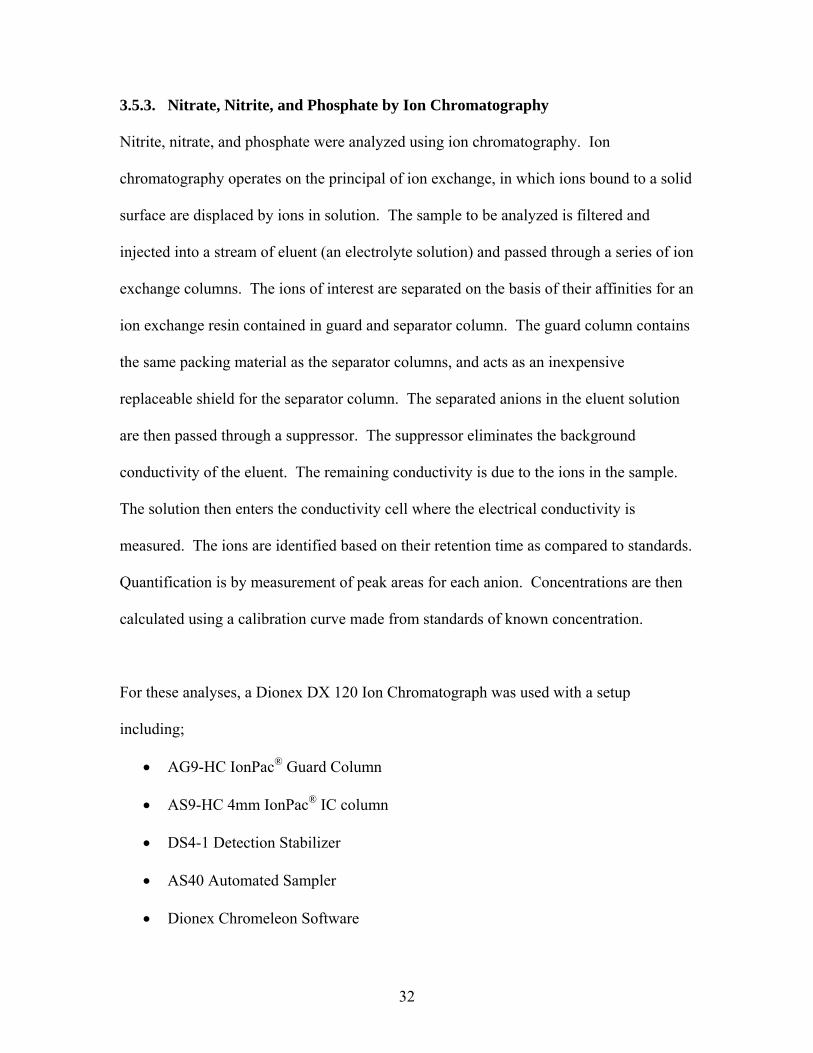
3.5.3. Nitrate, Nitrite, and Phosphate by Ion Chromatography
Nitrite, nitrate, and phosphate were analyzed using ion chromatography. Ion
chromatography operates on the principal of ion exchange, in which ions bound to a solid
surface are displaced by ions in solution. The sample to be analyzed is filtered and
injected into a stream of eluent (an electrolyte solution) and passed through a series of ion
exchange columns. The ions of interest are separated on the basis of their affinities for an
ion exchange resin contained in guard and separator column. The guard column contains
the same packing material as the separator columns, and acts as an inexpensive
replaceable shield for the separator column. The separated anions in the eluent solution
are then passed through a suppressor. The suppressor eliminates the background
conductivity of the eluent. The remaining conductivity is due to the ions in the sample.
The solution then enters the conductivity cell where the electrical conductivity is
measured. The ions are identified based on their retention time as compared to standards.
Quantification is by measurement of peak areas for each anion. Concentrations are then
calculated using a calibration curve made from standards of known concentration.
For these analyses, a Dionex DX 120 Ion Chromatograph was used with a setup
including;
• AG9-HC IonPac® Guard Column
• AS9-HC 4mm IonPac® IC column
• DS4-1 Detection Stabilizer
• AS40 Automated Sampler
• Dionex Chromeleon Software
32

Sodium bicarbonate with a concentration of 9 mM was used as eluent. The eluent was
prepared by degassing Grade 1 DI water with Ultra High Purity helium for 30 minutes
and diluting concentrated 0.5 M sodium carbonate to create 9 mM eluent. Ultra High
Purity Helium was supplied to the IC at a pressure of 40 psi. Internal pressure of the IC
was maintained between 2300 and 2500 psi. Flow of eluent was set to 1.10 mL/min. The
eluent was allowed to flow for at least 1 hour prior to running any samples through the
column. The total run time for each sample was 30 minutes.
Standards were prepared using Dionex 7-Anion standard solution. Three separate
dilutions (1%, 5%, and 10%) were made to create a 3-point calibration curve for each of
the anions analyzed. These dilutions created three separate concentrations for each anion.
Nitrite as N had concentrations of 0.20, 1.00, and 2.03 mg/L. Nitrate as N had
concentrations of 0.14, 0.81, and 1.65 mg/L. Phosphate as P had concentrations of 0.46,
2.24, 4.57 mg/L. Samples were filtered through 0.22-µm Millipore Express PLUS®
Membrane filters with the assistance of a HDPE plunger. Samples were placed into 5-
mL Dionex poly vials and caped with Dionex 20-µm filter caps. A spike of 7-anion
solution was added to one sample for each set of samples analyzed for quality control. At
the start of each run, a DI rinse was used prior to running any samples. After any
standards were run, a DI blank was analyzed to confirm that there had been no
contamination and to show any background noise from the instrument. If more than 15
samples were run in one set, a second 3-point calibration curve was created to assess any
calibration drift.
33

3.6. Total Lipid Analysis
Lipid content of the algae was measured during various growth stages to determine lipid
productivity. Lipid content was analyzed gravimetrically by a procedure adapted from
Bligh and Dyer (1959) and modified using Benemann and Tillett (1987). This method
consisted of a solvent extraction to isolate lipids from cell biomass and water. At the
time of sample collection, VSS was measured to determine the concentration of algae
biomass in the water sample. A 200-mL aliquot of the same sample was also
concentrated into a small pellet by centrifuging in 50-mL PTFE centrifuge tubes. To
accomplish this, a portion of each sample was poured into a single 50-mL centrifuge
tube, which was then centrifuged at approximately 7000 rpm for 2 minutes. The
centrifuge tubes were then removed and the supernatant was then decanted. The tubes
were then filled again with remaining sample. This procedure was repeated until the
entire sample had been centrifuged. The samples were then re-suspended with 4 mL of
DI water and frozen until enough samples were collected to run a set of extractions. The
frozen samples were thawed and 5 mL of chloroform and 10 mL of methanol were added.
The samples were then sonicated using a Branson Sonifier 250 with a Model #102 tip
continuously submerged in the centrifuge tube liquid for 1 min. at the maximum power
output setting of 8. The centrifuge tubes containing the samples were then placed
horizontally on a shaker table over night (~ 6-cm oscillation at ~2 cycles per second).
The next day, an additional 5 mL of chloroform and 5 mL of DI water were added to
make the final ratio of chloroform:methanol:water to be 10:10:9. The samples were then
vortex mixed for 30 seconds. After the samples had been completely homogenized, they
were centrifuged at 7000 rpm for 4 minutes. The lipids are soluble in the chloroform,
34

which forms a dense layer at the bottom of the centrifuge tube. The remaining cell debris
creates a middle layer, while the methanol and water create a uniform top layer. A
diagram of the extraction is shown in Figure 3.8. The lipid-chloroform layer was then
removed using a pipette and filtered through 0.2 µm nylon filter (using a syringe) and
deposited into a tared aluminum tray. The tray was then placed into a dessicator box
sparged with nitrogen gas to allow the chloroform to evaporate. A second extraction was
performed by adding an additional 10 mL of chloroform to the centrifuge tube and the
mixture was again vortexed and centrifuged. This second extraction was placed into a
separate tared tray. A photograph of the fume hood with most of the extraction
equipment used is shown in Figure 3.9. The trays were then placed in an oven at 105°C
under a fume hood for one hour to drive off any water and remaining chloroform. After
allowing the trays to cool, they were weighed to the nearest 0.1 mg. A photograph of the
lipids after the chloroform has been evaporated is shown in Figure 3.10. Judging from
the green color of the dried lipids some chlorophyll has remained in the lipid fraction.
35

Centrifuge Tube
Lipid + Chloroform
Water + MeOH
Algae Cells
Water + MeOH 100x
Algae layer 1000x Algae layer 100x
Lipid layer 400x
Figure 3.8: Lipid extraction diagram
36
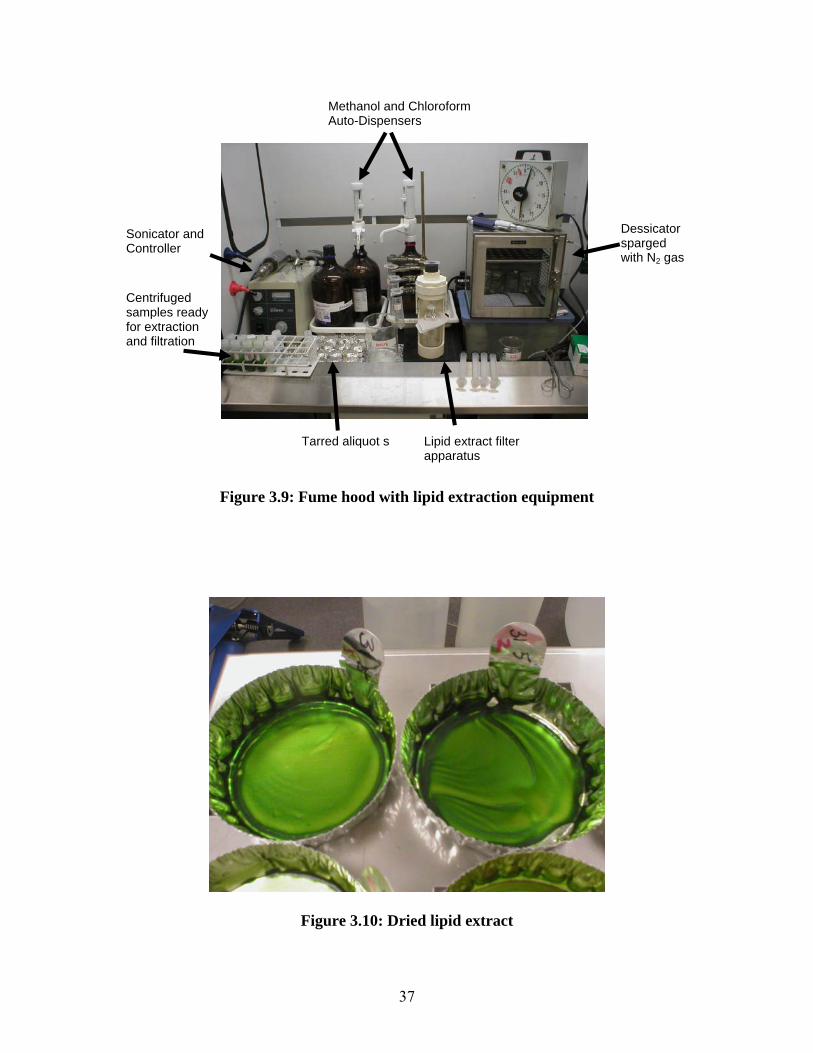
Methanol and Chloroform Auto-Dispensers
Centrifuged samples ready for extraction and filtration
Dessicator sparged with N2 gas
Sonicator and Controller
Tarred aliquot s Lipid extract filter apparatus
Figure 3.9: Fume hood with lipid extraction equipment
Figure 3.10: Dried lipid extract
37

3.7. Dissolved Oxygen Measurement
The amount of dissolved oxygen (DO) present in water is an indication of the health of
that aquatic environment and can be used as an indicator of algae photosynthesis. In
order to obtain an estimate of the lowest DO concentrations in the algae tanks, during one
day, DO was measured periodically from before dawn to mid-morning. DO was
measured using a portable Thermo Orion Model 810 with and Orion DO probe.
38

CHAPTER 4: RESULTS AND DISCUSSION
This section presents results for the preliminary semi-continuous experiment first
followed by the batch experiment results.
4.1. Semi-Continuous Experiment
The initial goal of the semi-continuous experiment was to reach a steady state of algal
biomass with timed feedings of wastewater, however this could not be achieved. A few
of the algae bioreactors experienced “culture crashes” where there would be healthy
populations of algae one day and then a heavily diminished population of algae the next.
Other algae bioreactors failed to grow algae despite repeated inoculations. Results are
presented below only for algae bioreactor R1, which was one of the only algae
bioreactors that sustained high algae concentrations through the 48 days of the
experiment.
4.1.1. Biomass Results for Semi-Continuous Experiment
After a 10-day lag phase, the solids concentrations increased steadily in the R1 bioreactor
(Figure 4.1). The biomass concentration reached a high of 1.1 g/L VSS on Day 39
(Figure 4.1). Because of slow growth of algae, the amount of time in between loadings
was increased up to 10 days, making equivalent retention times of over 105 days. Also of
interest is how the difference between TSS and VSS increased over time (Figure 4.1).
The increase in TSS may have been due to the anaerobic digester not performing
properly. The pH remained level just below 10 for the majority of the experiment
(Figure 4.1). The high pH was primarily due to CO2 uptake by the algae as lower pHs
39

were observed in later experiments with CO2 sparging. This lack of CO2 sparging could
account for the slower growth rates observed.
0
200
400
600
800
1000
1200
1400
1600
0 10 20 30 40 50
Time (days)
Con
cent
ratio
n (m
g/L)
0
2
4
6
8
10
12
14
pHTSSVSSpH
Figure 4.1: Biomass and pH for semi-continuous experiment for R1 tank.
One other reason for the slow growth of the algae was probably the high opacity of the
influent causing light limitation and allowing aerobic heterotrophic bacteria to dominate.
The opacity was cause by the high suspended solids concentration of the dairy
wastewater. Therefore, the subsequent batch experiments were run with 10% and 25%
dilutions of wastewater to prevent light limitations as well as supplementation with
sparged CO2.
4.1.2. Biochemical Oxygen Demand during Semi-Continuous Experiment
Biochemical oxygen demand (BOD) measurements were performed during this initial
semi-continuous experiment. The BOD tests were performed on samples taken directly
from the algae bioreactors without separation of algae from the effluent. The measured
BOD therefore included the respiration and degradation of the algae present in the
40

sample. Algae tank R1 had an average BOD5 of 146 mg/L with a standard deviation of
9.3 mg/L. Again, this includes the particulate BOD from the VSS, so it is not indicative
of wastewater effluent since BOD would not be so extensive in full-scale production
because the algae would have been harvested from the wastewater before discharge. In
retrospect, a soluble BOD test should have been performed by first filtering the samples
to remove the algae. Soluble BOD would have given a better perspective on what the
BOD effluents would have actually been.
4.1.3. Nutrient Removal Semi-Continuous Experiment
Nutrient removal was determined by comparing the influent and effluent concentrations
of nitrite, nitrate and phosphate throughout the 48-day experiment. Ammonia was not
analyzed for this initial experiment. The influent nitrite was non-detect, however a spike
of nitrite was observed in the effluent up to 4 mg/L NO2- as N at Day 25 (Figure 4.2).
The increase in nitrite suggests that partial nitrification could have occurred in the middle
of the experiment.
41

0.00
1.00
2.00
3.00
4.00
5.00
0 10 20 30 40 50
Time (days)
Con
cent
ratio
n N
O2
(N) m
g/L
InfluentEffluent
Figure 4.2: Nitrite concentrations during the semi-continuous experiment.
The amount of nitrate in the influent was relatively small, with the highest concentration
being recorded at less than 0.7 mg/L (Figure 4.3). The effluent was reduced to below 0.1
mg/L NO3- as N except for an initial spike (Figure 4.3). Again these concentrations are
relatively small and are not of much importance when compared to the amount of
ammonia that is present as observed in later batch experiments.
42
0.00
0.10
0.20
0.30
0.40
0.50
0.60
0.70
0 10 20 30 40 50
Time (days)
Con
cent
ratio
n N
O3
(N) m
g/L
InfluentEffluent
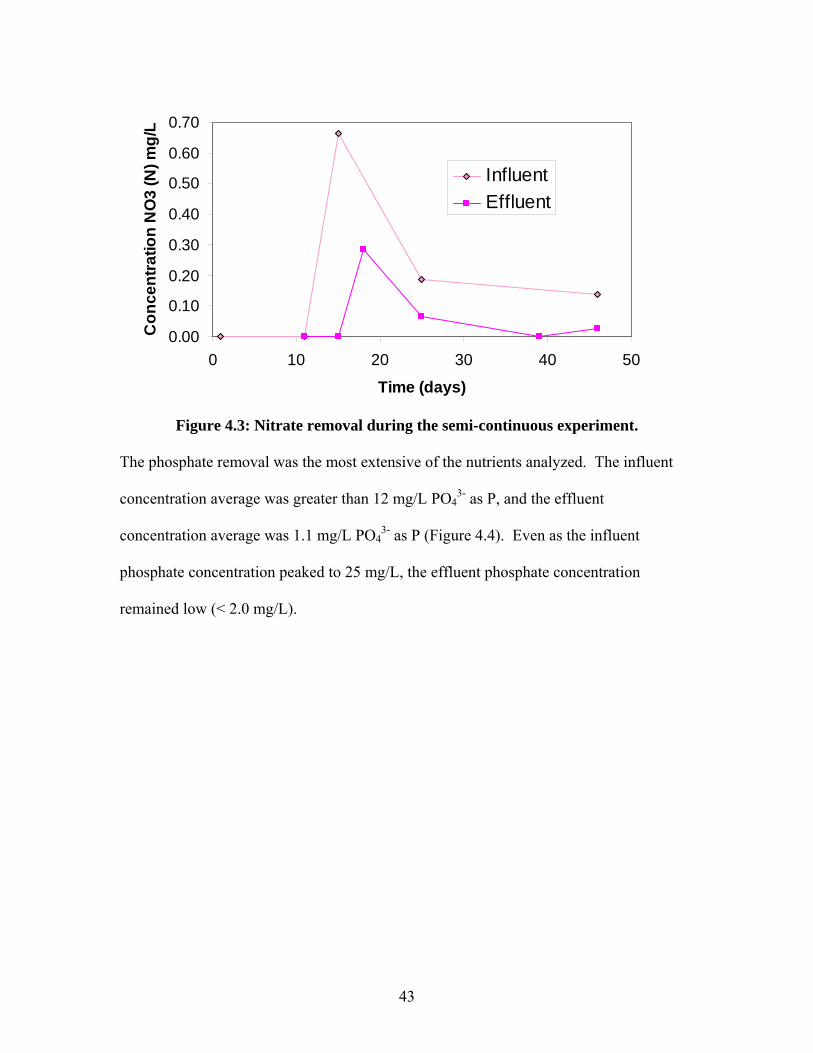
Figure 4.3: Nitrate removal during the semi-continuous experiment.
The phosphate removal was the most extensive of the nutrients analyzed. The influent
concentration average was greater than 12 mg/L PO43- as P, and the effluent
concentration average was 1.1 mg/L PO43- as P (Figure 4.4). Even as the influent
phosphate concentration peaked to 25 mg/L, the effluent phosphate concentration
remained low (< 2.0 mg/L).
43

0.00
5.00
10.00
15.00
20.00
25.00
30.00
0 10 20 30 40 50
Time (days)
Con
cent
ratio
n PO
4 m
g/L
InfluentEffluent
Figure 4.4: Phosphate removal during the semi-continuous experiment.
4.1.4. Initial Total Lipid Content during the Semi-Continuous Experiment
Lipid was extracted from samples from four of the six algae bioreactors. On Day 25 of
the semi continuous experiment, the total lipid percentages ranged from 9-23% by weight
(Table 4.1). Duplicate lipid determinations were not made during this initial experiment.
In addition, it is difficult to determine actual lipid productivity due to the sporadic
loading rates, so a batch experiment was conducted subsequently to facilitate
determination of lipid productivity.
44

Table 4.1: Lipid percentage in biomass during semi-continuous experiment
R2 440 18%
R3 660 23%
R4 520 14%
R5 710 9%
Lipid %VSS (mg/L)Algal Bioreactor
4.2. Batch Experiment Results
This subsequent experiment was performed in batch mode as compared to the initial
semi-continuous experiment. The wastewater was diluted to 25% or 10% at the start of
the experiment and there were no additional loadings of wastewater. The algae
bioreactors were sparged with CO2 to increase the algae growth rate. An average pH of
7.6 was maintained for both dilutions. The results for the batch experiment were
analyzed to a greater extent than the semi-continuous experiment.
4.2.1. Algae Identification
The algae species present in the batch reactors were dominated by Scenedesmus (Figure
4.5), followed by Micractinium (Figure 4.6), Chlorella, and Actinastrum (Figure 4.7).
Algae identifications were made throughout the experiment, and the photomicrographs
shown are a typical representation of the algae that were observed.
45
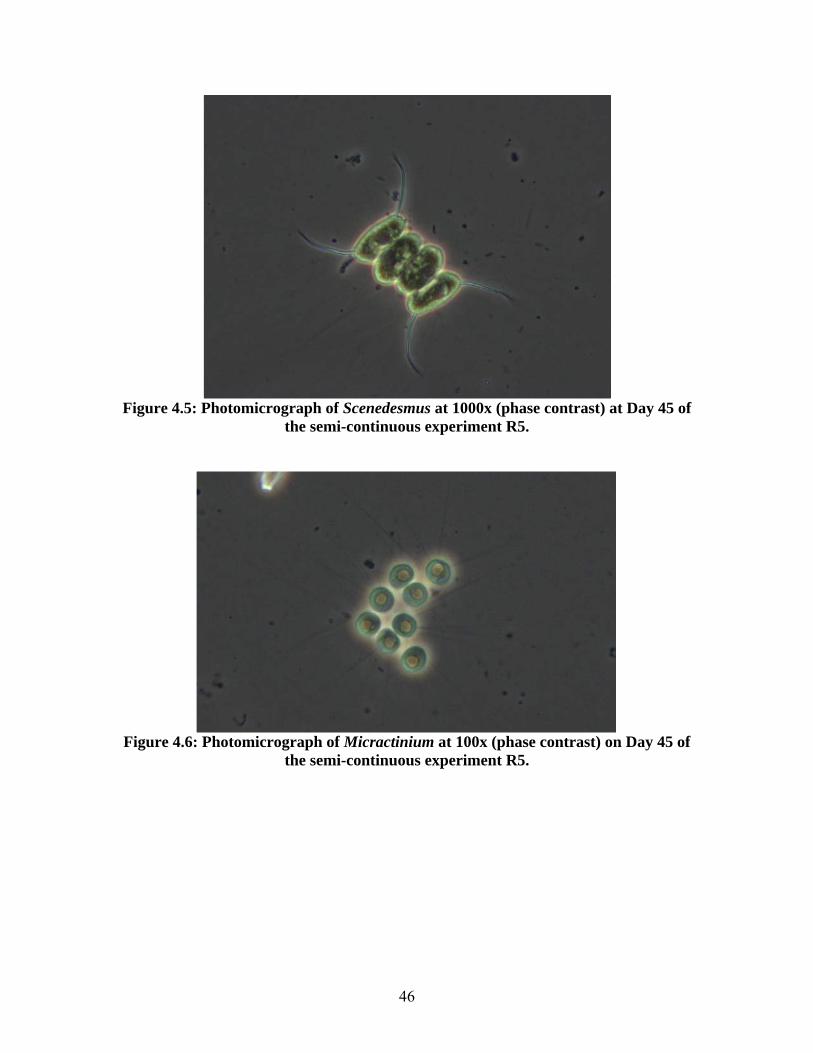
Figure 4.5: Photomicrograph of Scenedesmus at 1000x (phase contrast) at Day 45 of
the semi-continuous experiment R5.
Figure 4.6: Photomicrograph of Micractinium at 100x (phase contrast) on Day 45 of
the semi-continuous experiment R5.
46

Figure 4.7: Photomicrograph of Actinastrum at 1000x (phase contrast) on Day 27 of
the semi-continuous experiment R1.
In addition to algae being identified as single cells, it is important to note that there were
also flocculations of algae which agglomerated together. A photomicrograph of a
flocculation of Scenedesmus is shown in Figure 4.8. Flocculation is an important factor
in settling and removal of algae from wastewater because as the mass of this flocculation
gets larger so does the potential for it to settle to the bottom. This process and its use as a
low cost and effective practice for harvesting and meeting discharge requirements may be
a key component for making an economical algae-to-biofuels system.
47

Figure 4.8: Photomicrograph of flocculated Scenedesmus at 400x (Dark Phase) on
Day 45 of the semi-continuous experiment R4.
4.2.2. Initial Conditions
The initial characteristics of the wastewater are reported in Table 4.2. Nitrogen was all in
the form of ammonia and organic nitrogen, with nitrate and nitrite near their detection
limits. This is typical of the reduced conditions expected in the anaerobic wastewater.
The TSS concentration was 283 and 135 mg/L for the 25% and 10% dilution tanks. The
initial pH of both wastewater dilutions were a little above a neutral pH of 7.
48

Table 4.2: Initial characteristics of diluted dairy wastewater.
Wastewater characteristics 25% Wastewater 10% Wastewater
TSS (mg/L) 283 135
VSS (mg/L) 220 120
pH 7.9 7.7
Ammonia as N (mg/L) 30.5 16.3
Nitrate as N (mg/L) 0.01 0.05
Nitrite as N (mg/L) < 0.01 0.04
Organic Nitrogen (mg/L) 50.7 20.2
TKN (mg/L) 81.0 36.5
Total Nitrogen (mg/L) 81.0 36.6
Phosphate as P (mg/L) 2.55 1.8
4.2.3. Biomass Results for Batch Experiments and Growth Curves
Biomass concentrations followed a typical microbial growth curve with a lag,
exponential, stationary and death phase (Figure 4.9 and Figure 4.10). The maximum
biomass concentration of 915 mg VSS/L was reached by Day 13 for the 25% batch
reactors (Figure 4.9), and 490 to 520 mg VSS/L was reached from Days 6-10 for the 10%
batch reactors (Figure 4.10). The higher biomass production for the 25% dilution is
likely due to the higher nutrient concentrations available (Table 4.2), since algal growth
was likely nutrient limited, as described below. The maximum specific growth rate
(μmax) for both dilutions was calculated by plotting the natural log of the cell
concentration versus time. The maximum specific growth rate is equivalent to the slope
49

of the trend line for the plot and was equal to 0.13 (day-1) for the 25% dilution reactor
(Figure 4.11) and 0.24 (day-1) for the 10% dilution (Figure 4.12). The lower μmax in the
25% dilution reactor was probably due to the higher initial turbidity, which can be
observed through TSS (Table 4.2), decreasing the available light compared to the 10%
dilution reactor. These maximum specific growth rates observed here are greater than
those calculated for algae by Feffer (2007) of 0.056 (day-1) but 3.5 times lower than those
observed by Shelef (1968) of 0.85 (day-1).
0
200
400
600
800
1000
1200
0 2 4 6 8 10 12 14 16
Time (days)
Con
cent
ratio
n (m
g/L)
0.0
2.0
4.0
6.0
8.0
10.0
12.0
14.0
pH
TSSVSSpH
Figure 4.9 Biomass and pH for batch experiment for 25% WW dilution.
50

0
100
200
300
400
500
600
700
0 2 4 6 8 10 12 14
Time (days)
Con
cent
ratio
n (m
g/L)
0.0
2.0
4.0
6.0
8.0
10.0
12.0
14.0
pH
TSSVSSpH
Figure 4.10 Biomass and pH for batch experiment for 25% WW dilution.
y = 0.1301x + 5.2035R2 = 0.9751
0.00
1.00
2.00
3.00
4.00
5.00
6.00
7.00
8.00
0 2 4 6 8 10 12
Time (days)
ln V
SS
14
Figure 4.11 Log phase of biomass for 25% WW dilution algae growth reactor
51

y = 0.238x + 4.8469R2 = 0.9391
0.00
1.00
2.00
3.00
4.00
5.00
6.00
7.00
0 1 2 3 4 5 6 7
Time (days)
ln V
SS
Figure 4.12 Log phase of biomass for 10% WW dilution algae growth reactor
4.2.4. Total Lipid Percentages and Productivity
The total lipid concentrations were measured throughout the batch experiment to
determine productivity of lipids. The total lipid content of biomass from the 10%
wastewater dilution ranged from 8-14%, and the lipid content of biomass grown in the
25% dilution of wastewater ranged from 10-29%, by weight (Figure 4.13 and Figure
4.14). The highest oil percentage was observed in the middle of the exponential growth
phase for both the 10% and 25% dilution wastewater experiments (Figure 4.13 and
Figure 4.14). 5% of the samples were spiked with a known weight of canola triglycerides
and had an average recovery of 84%.
The lipid content of the algae in this experiment compare favorably to values reported in
the literature. Total lipid percentages have been reported as high as 45% for pure cultures
of Scenedesmus and Chlorella by Thompson (1996). It is remarkable that this
experiment was able to achieve such high lipid percentages (29%) without optimization
52

53
of the algal cultures or the operating conditions. This result suggests that even higher
lipid percentages could be achieved in the wastewater treatment application with
optimization.

0%
5%
10%
15%
20%
25%
30%
35%
0 1 2 3 4 5 6 7 8 9 10 11 12 13 14 15 16
Time (days)
Lipi
d Pe
rcen
tage
s
01002003004005006007008009001000
Bio
mas
s VS
S (m
g/L)
Lipids Percentage Biomass VSS (mg/L)
Figure 4.13: 25% WW Dilution algae growth and lipid content during batch run.
(Averages from triplicate batch reactors are shown with error bars indicating standard deviation.)
54

0%
5%
10%
15%
20%
25%
30%
35%
0 1 2 3 4 5 6 7 8 9 10 11 12 13
Time (days)
Lipi
d Pe
rcen
tage
s
01002003004005006007008009001000
Bio
mas
s VS
S (m
g/L)
Lipids Percentage Biomass VSS (mg/L)
Figure 4.14: 10% WW Dilution algae growth and lipid content during batch run.
(Averages from triplicate batch reactors are shown with error bars indicating standard deviation.)
55

Based on the results for the lipid extraction and the surface area of the algae bioreactor,
the maximum production rate of lipids of 2.8 g/m2/day was reached at Day 6 for the 25%
wastewater dilution, and 2.0 g/m2/day was reached at Day 3 for the 10% wastewater
dilution. Somewhat higher productivities have been found in open systems using pure
cultures (Table 4.3). Laws (1984) found that a pure culture of Platymonas sp. had a lipid
productivity of 7.9 g/m2/day, Thomas et al. (1984) through the NREL study found that a
pure culture of Tetraselmis suecica had a lipid productivity of 4.5 g/m2/day, and Brown et
al. (1990) found that a pure culture of Cyclotella cryptica had a maximum lipid
productivity of 4 g/m2/day.
Table 4.3: Lipid productivity of algae reported in the literature
StudyLipid
productivity (g/m2/d)
Algal Species Growth vessel Media
Laws (1984) 7.9 Platymonas sp. Air lift flume Sea water
Thomas (1984) NREL 4.5 Tetraselmis suecica Indoor reactor Nutrient enriched seawater
Brown (1990) 4 Cylcotella cryptica Open pond Si defficient media
This study 2.8 Mixed Open reactor Anaerobic treated dairy wastewater
In both batch experiments the highest lipid percentages were achieved in the early part of
the growth phase, which may suggest that lipids were produced as a growth-associated
product. Roessler (1990) has discussed similar results of increased lipid percentage in the
exponential growth phase of microalgae and theorized that at lower biomass
concentrations, where light is at a higher intensity, algae biosynthesize lipids as a means
of converting excess light into reserve energy in the form of lipids.
56
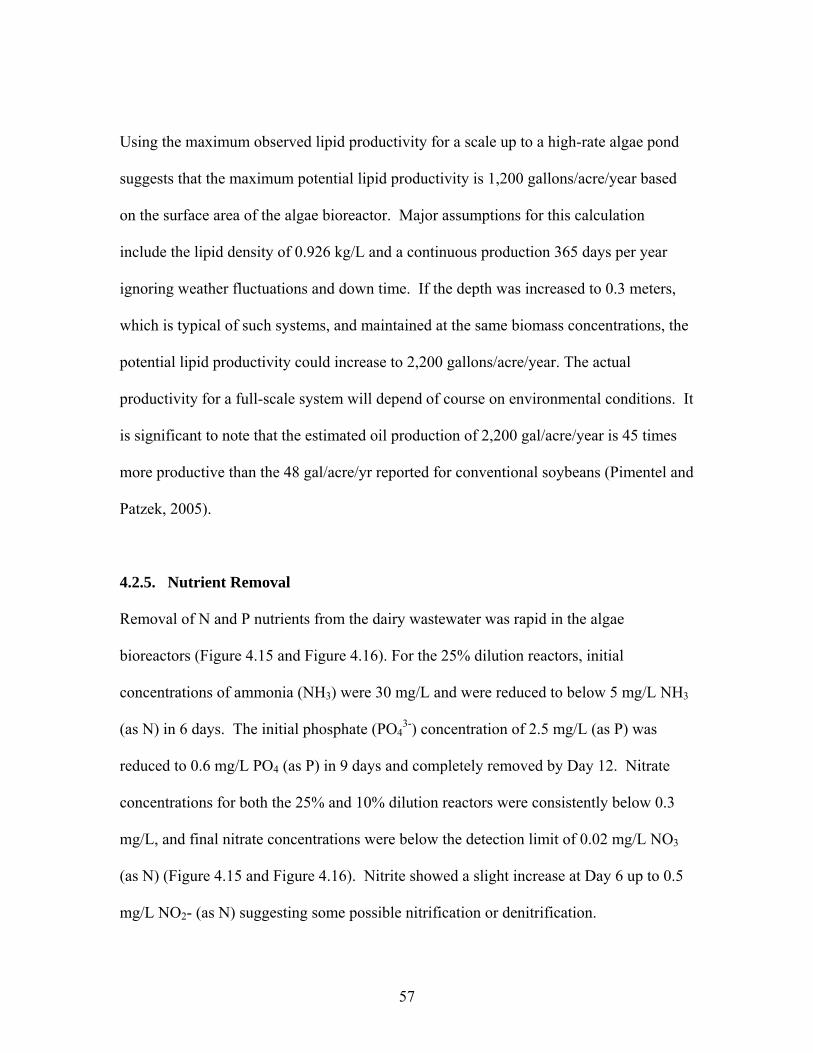
Using the maximum observed lipid productivity for a scale up to a high-rate algae pond
suggests that the maximum potential lipid productivity is 1,200 gallons/acre/year based
on the surface area of the algae bioreactor. Major assumptions for this calculation
include the lipid density of 0.926 kg/L and a continuous production 365 days per year
ignoring weather fluctuations and down time. If the depth was increased to 0.3 meters,
which is typical of such systems, and maintained at the same biomass concentrations, the
potential lipid productivity could increase to 2,200 gallons/acre/year. The actual
productivity for a full-scale system will depend of course on environmental conditions. It
is significant to note that the estimated oil production of 2,200 gal/acre/year is 45 times
more productive than the 48 gal/acre/yr reported for conventional soybeans (Pimentel and
Patzek, 2005).
4.2.5. Nutrient Removal
Removal of N and P nutrients from the dairy wastewater was rapid in the algae
bioreactors (Figure 4.15 and Figure 4.16). For the 25% dilution reactors, initial
concentrations of ammonia (NH3) were 30 mg/L and were reduced to below 5 mg/L NH3
(as N) in 6 days. The initial phosphate (PO43-) concentration of 2.5 mg/L (as P) was
reduced to 0.6 mg/L PO4 (as P) in 9 days and completely removed by Day 12. Nitrate
concentrations for both the 25% and 10% dilution reactors were consistently below 0.3
mg/L, and final nitrate concentrations were below the detection limit of 0.02 mg/L NO3
(as N) (Figure 4.15 and Figure 4.16). Nitrite showed a slight increase at Day 6 up to 0.5
mg/L NO2- (as N) suggesting some possible nitrification or denitrification.
57

0
5
10
15
20
25
30
35
0 2 4 6 8 10 12
Time (days)
Con
cent
ratio
n (m
g/L)
PO4
NO2
NO3
NH3
Figure 4.15: Nutrient reduction in 25% dilution culture.
For the 10% dilution reactor, nutrient removal was also rapid (Figure 4.16). The initial
concentration of ammonia (NH3) was 16.3 mg/L and was reduced to less than 1 mg/L
NH3 (as N) in 3 days. The initial phosphate (PO43-) concentration of 1.8 mg/L was
reduced below detection limits in 9 days.
58

0
2
4
6
8
10
12
14
16
18
0 2 4 6 8 10 12
Time (days)
Con
cent
ratio
n (m
g/L)
PO4NO2NO3NH3
Figure 4.16: Nutrient reduction in 10% dilution culture.
The ammonia removal efficiency observed in this experiment is comparable to other
algae based treatments systems (Table 4.4). Previous studies have shown that algae is
very effective (80-100%) in the removal of NH3 (as N) from a variety of wastewaters
(Martinez et al., 2000, Lincoln et al., 1996, Green et al., 1995).
59

Table 4.4: Ammonia removal comparison for algae treatment systems
Study % NH3-N Removal Algae Species Media
Martinez (2000) 80-100 Scenedemus obliques Autoclaved municipal wastewater
Lincoln (1996) 99 Arthrouspira plantensis Anaerobic treated dairy wastewater
Green (1995) 99 Mixed culture Municipal wastewater
This study 96 Mixed culture Anaerobic treated dairy wastewater
A nitrogen balance was conducted to determine the fate of the different species of
nitrogen (Table 4.5). The nitrogen balance includes nitrogen as ammonia or ammonium
(NHx), nitrite (NO2-), nitrate (NO3
-), organic nitrogen (ON), total Kjeldahl nitrogen
(TKN), and total nitrogen (TN). Organic nitrogen measurements include the nitrogen
that was assimilated by the algae. Organic nitrogen was calculated by subtracting the
NHx from the TKN. Total nitrogen is the sum of TKN, NO2-, and NO3
-. There was a
reduction in total nitrogen from 81 mg/L to 56 mg/L in the 25% dilution and a reduction
from 37 mg/L to 15 mg/L for 10% dilution (Table 4.5). There was only a slight increase
in organic nitrogen of 4 mg/L (as N) from the initial (Day 0) to the final (Day 15) for the
25% dilution. A higher concentration of organic nitrogen was expected as the result of
algae growth. There was a decrease in organic nitrogen in the 10% dilution observed.
There are two probable explanations for the loss or lack of increase in ON: (1) the initial
ON was high and composed of waste solids that were replaced by algae ON, and (2) the
reduction in total nitrogen suggests that not all of the nitrogen was assimilated by the
algae or bacteria present in the bioreactors and that there was volatilization of nitrogen
either as NH3 or as N2 resulting from denitrification.
60

In future testing it would be advantageous to sample for TKN throughout the experiment
to provide a more thorough picture of the nitrogen fate.
Table 4.5: Nitrogen balance for all species of N
NHx NO2 NO3 ON TKN TN NHx NO2 NO3 ON TKN TNInitial (Day 0) 16.33 0.04 0.05 20.20 36.53 36.61 30.50 0.00 0.01 50.69 80.99 80.99
Final (Day 15) 0.63 0.00 0.02 14.15 14.77 14.79 1.07 0.00 0.01 54.59 55.69 55.69N volatilized = 60% N volatilized = 30%
10% Dilution 25% Dilution
4.2.6. Dissolved Oxygen and pH Changes During Batch Experiments
Dissolved oxygen concentrations in the both 10% and 25% dilution bioreactors were
measured over time to observe diurnal effects on dissolved oxygen. Results show an
accelerated increase in dissolved oxygen during sunrise at approximately 6:45 am (Figure
4.17 and Figure 4.18). pH decreased during the pre-dawn to late morning period. A pH
rise would be expected due to increased photosynthesis, but apparently the media were
buffered well enough to mask this effect in the early hours of the day.
61

4.00
6.00
8.00
10.00
12.00
14.00
16.00
18.00
4:00 AM 5:12 AM 6:24 AM 7:36 AM 8:48 AM 10:00 AM 11:12 AM
Time
DO
(mg/
L)
5.00
5.50
6.00
6.50
7.00
7.50
8.00
pH
Dissolved OxygenpH
Figure 4.17: Dissolved oxygen and pH change in 25% dilution culture through
sunrise on March 24th, 2007
4.00
6.00
8.00
10.00
12.00
14.00
16.00
18.00
20.00
4:00 AM 5:12 AM 6:24 AM 7:36 AM 8:48 AM 10:00 AM 11:12 AM
Time
DO
(mg/
L)
5.00
5.50
6.00
6.50
7.00
7.50
8.00
pHDissolved OxygenpH
Figure 4.18: Dissolved oxygen and pH change in 10% dilution culture through
sunrise March 24th, 2007.
62

CHAPTER 5: CONCLUSIONS
5.1. Experimental Conclusions
The oil productivity of the mixed species of algae observed in the bench-scale bioreactors
is significantly higher than that of terrestrial crops. When scaled up, the expected
production rate is between 1,200 and 2,200 gal/acre/year, assuming the same
environmental conditions as those in the experiments year round. In comparison, soy can
currently produce 48 gal/acre/year (Pimental and Patzek, 2005). Thus, production of
biodiesel from algae is 45 times more efficient than from soy, based on area of land used.
Previous NREL studies demonstrated biodiesel production rates of 1,900 gal/acre/year
using pure cultures of high-yield algae grown under controlled conditions (Thompson,
1996). It is remarkable that similar production efficiencies were observed in this project
with mixed cultures of native algae grown on dairy wastewater under relatively
uncontrolled conditions.
To put the bench-scale results of lipid productivity into perspective, if all of the 50 billion
gallons of U.S. diesel fuel that is consumed annually were to come from algal oil, at
productivity of 1,200 gal/acre/yr it would take a total area of 43 million acres or the
equivalent size of Tennessee. However, the large scale implementation of algal ponds
will not be concentrated in one location. Algae ponds will be have to be decentralized to
utilize wastewater from agricultural operations and municipalities.
The bench-scale experiments also demonstrated the effectiveness of algae at nutrient
removal from wastewater by reducing the total ammonia-N concentrations from 30 mg/L
63

(as N) to below 1 mg/L (as N) and removing phosphate with nearly 100% efficiency in 9
days from 2.55 mg/L (as P) to <0.1 mg/L (as P). This utilization of nutrients from
wastewater demonstrates the potential cost savings when compared to the purchase of
fertilizers. The large uptake of nutrients by biomass also indicates that the biomass
debris left after oil extraction will have potential as crop fertilizer.
This thesis provided a large step towards creating biodiesel fuel from algae by
demonstrating high productivities and excellent nutrient removal. However, there are a
few things that could have made this thesis more definitive. Instead of performing the
semi-continuous experiments first and the batch experiments second it would have been
advantageous to use the batch experiments first to allow an optimization of lipid
productivity during a semi-continuous experiment. In addition, to validate the annual
lipid productivity a year round study should be performed to account for seasonal
changes.
In conclusion biodiesel can be an important part in our nation’s solution to global
warming and energy independence. However, it is not the only solution and
unsustainable crop production threatens to generate even more pollution. The use of
algae as a feedstock for biodiesel greatly increases the yields that can be achieved.
Further, through simultaneous wastewater treatment and biofuel production a more
sustainable model can be achieved.
64

It should be noted that the greatest strategy for reducing greenhouse gases and creating
energy independence is not simply to replace our petroleum consumption with biofuels
consumption, but to conserve and improve efficiencies of energy usage and production.
Biofuels, produced properly, can help contribute to creating a sustainable and energy
independent society.
5.2. Future Research
There are still many hurdles that must be overcome before the proposed system can be
operated economically on full-scale. The lipid composition of algal lipids should be
investigated as well as developing passive harvesting techniques. There is also the need
to demonstrate pilot scale testing with optimization of growth conditions in a year round
study. In addition, an analysis of potential climate and location restrictions will be
needed to understand the large-scale implementation potential.
Further study is needed in the classification of the lipids that are found in algae grown in
wastewater. The experiments conducted here only looked at total lipid content. It will be
necessary to determine the lipid structure derived from waste-grown algae to determine
the direct fuel quality that would be achieved. The quality of oil produced from algae
will affect the value of the final product and the processing required to create a
transportation fuel. The oil produced from algae grown in wastewater might not be
suitable for traditional biodiesel processing (transesterification). In addition to multiple
algae species present there is also the presence of bacteria which may have oil that is not
preferable for biodiesel production. The oil might be more compatible with newer
65

technologies such as renewable diesel (thermal depolymerization) which processes the oil
in a similar fashion as petroleum. In future experiments, the lipids extracted from the
algal biomass should be analyzed by mass spectrometry to identify the fatty-acid
composition and the degree of unsaturation.
The harvesting and processing of the algae will be major inputs into the practicality of
this technology. The use of forced separation (centrifugation) is a highly energy-
intensive process and greatly affects the energy balance of the biofuel. More passive
systems of harvesting such as natural settling by use of a return activated sludge
bioflocculation technique is currently being investigated by fellow Cal Poly graduate
student Dan Frost. In this method algae growth tanks are inoculated with developed
bioflocculations of return activated sludge (RAS). The developed bioflocculations
enhance the settling of the algae that are present. Variations of the activated sludge
flocculation technique such as “activated algae” should be investigated because RAS may
not be available for certain situations.
Pilot-scale systems should be investigated into how the performance of algae production
and lipid productivities are affected by scale-up. There are no known studies of open
wastewater ponds where CO2 is added to enhance algae productivities. Research has
been conducted in lab by fellow Cal Poly graduate student Adam Feffer into the effect of
CO2 addition in municipal wastewater (Feffer, 2007). Following pilot scale experiments
it would be necessary to create a prototype system with the integration of an anaerobic
digester and co-generation system.
66
During the development of this technology it will be imperative to determine the
potential for implementation of the proposed system on a wide-scale. The largest
obstacle in the implementation of this will be location. An analysis will be required to
determine how many communities and agro-industrial sites, in appropriate climates
(average temperature and solar insolation), have the need for wastewater treatment
upgrades. In addition, there would be the need to have information about the land
available for large open ponds at each of these locations. Furthermore, once algae
biomass is being produced in large quantities the conversion to useful biofuel will require
further processing which might be most cost-effective offsite. The extraction of lipids
from the algae will probably be done with solvent extractions that would be carried out
by production facilities already in use for oil seed extraction. The location proximities of
algae production to oil extraction plants as well as biodiesel production sites will need to
be analyzed.
Another consideration is the value of CO2 fixation. CO2 credits are still being developed
and standardized but the ultimate value will have a large impact on the economic value of
the proposed system.
67

REFERENCES
Adler, P.R., Del Grosso, S.J., Parton, W.J., (2007) “Life-cycle assessment of net greenhouse-gas flux for bioenergy cropping systems.” Ecological Applications: 17:3 pp. 675–691. American Public Health Association, (1995) Standard Methods for the Examination of Water and Wastewater. American Public Health Association Washington, DC. An, J.Y., Sim, S.J., Lee, J.S., Kim, B., (2003) “Hydrocarbon production from secondary treated piggery wastewater by the green alga Botryococcus braunii.” Journal of Applied Phycology 15: pp. 185-191. Anderson, R.A. (2005) Algal Culturing Techniques Phycological Society of America Elsevier Inc. Benemann, J.R., (2007) “Biofuel, Peak Oil, and Global Warming 1977-2037” Presentation at California Polytechnic State University, San Luis Obispo, 1-18-07. Benemann, J., Goebel, P., Weissman, J., Augenstein, D., (1982) “Microalgae as a source of liquid fuels. Final technical report.” USDOE-OER. http://www.osti.gov/bridge/product.biblio.jsp?query_id=0&page=0&osti_id=6374113. Benemann, J.R., Tillett, D.M., (1987) “Microalgae lipid production” In Energy from Biomass and Waste XI, Conference Proceding, (Klass, D.L., ed), Institute of Gas Technology, Chicago. Bligh, E.G., Dyer, W.J., (1959) “Extraction of Lipids in Solution by the Method of Bligh and Dyer” Canadian Journal of Biochemical Physiology. 37: pp. 911-917. Brown, L.M., Sprague, S., (1990) “Aquatic Species Project Report FY 1989-90” NREL/TP-232-4174 DE92001207 Report by Weissman, J.C., Tillet, D., “Design and Operation of an Outdoor microalgae test facility: Large scale system results. California Water Board, (2003) Nonpoint Source Pollution, Agricultural Category Five-Year Implementation Plan. http://www.waterboards.ca.gov/nps/docs/5yrplan/2_agri_category.pdf. Centner, T.J., (2001) “Evolving Policies to Regulate Pollution from Animal Feeding Operations” Environmental Management. 28:5 pp. 599-609. Chisti, Y., (2007) “Biodiesel from Microalgae” Biotechnology Advances 25: pp. 294-306. Chisti, Y., Molina, E., Feranadez, J., Acien, F.G., (2001) “Tubular photobioreactor design for algal cultures” Journal of biotechnology: 92: pp 113-131.
68

Christie, W., (2003) Lipid Analysis, Isolation, Separation, Identification and Structural Analysis of Lipids 3rd Edition The Oily Press, PJ Barnes and Associates, England. Duffield, J.A., (2007) U.S. Department of Agriculture Office of Energy Policy and New Uses Proceedings from National Biodiesel Conference, San Antonio, TX Feb 4-8, 2007. Dugan, G.L., Golueke, C.G., Oswald, W.J., (1972) “Recycle system for poultry waste” Journal Water Pollution Control Federation 44(3): 432. Energy Information Agency (2005) Annual Energy Review Report No. DOE/EIA-0384(2005). http://www.eia.doe.gov/. Feffer, A.S. (2007). The Effects of CO2 Addition on Algae Wastewater Treatment, M.S. thesis, Department of Civil and Environmental Engineering, California Polytechnic State University, San Luis Obispo. Glastra, R., (2002), Oil Palm Plantations and deforestation in Indonesia, assets.panda.org/downloads/oilpalmindonesia.pdf. Golueke, C.G., Oswald, W.J., Gotaas, H.B. (1957) “Anaerobic digestion of algae” Applied Microbiology 5(1): pp. 47-55. Green, F.B., Bernstone, L.S., Lundquist, T.J., Oswald, W.J., (1996) “Advanced Integrated Wastewater Pond Systems for Nitrogen Removal.” Wat. Sci. Tech. 33:7 pp. 207-217. Green, F.B., Lundquist, T.J., Oswald, W.J., (1995). "Energetics of advanced integrated wastewater pond systems," Water Science and Technology: 31:12, pp. 9-20. Haas, M.J., Scott, K.M., Alleman, T.L., McCormick, R.L., (2001) “Engine Performance of Biodiesel Fuel Prepared from Soybean Soapstock: A High Quality Renewable Fuel Produced from Waste Feedstock” Energy and Fuels: 15: pp 1207-1212. Intergovernmental Panel on Climate Change (2007) “IPCC Summary for Policymakers. In: Climate Change 2007: The Physical Science Basis. Contribution of Working Group I to the Fourth Assessment Report of the Intergovernmental Panel on Climate Change, Solomon, S., D. Qin, M. Manning, Z. Chen, M. Marquis, K.B. Averyt, M. Tignor and H.L. Miller. Cambridge University Press, Cambridge, United Kingdom and New York, NY, USA. Landis, A. E., Miller, S. A, Theis, T.L., (2007) “Life Cycle of the Corn-Soybean Agroecosystem for Biobased Production.” Environ. Sci. Technol.: 41, 1457-1664.
69

Laws, E. (1984) “Research and Development of Shallow Algal Mass Culture Systems for the Production of Oils” Solar Energy Research Institute, Subcontract No. XK-3-03136 report. Lincoln, E.P., Wilkie, A.C., French, B.T., (1996) “ Cyanobacterial process for renovating dairy wastewater” Biomass and Bioenergy” 10:(1) pp. 63-68. Lundquist, T., Benemann, J., Feffer, A., Woertz, I., (2007) “Presentation on Nutrient Removal and Biofuel Production through Microalgae-Based Wastewater Treatment” First Western Forum on Energy & Water Sustainability University of California Santa Barbara March 22-23, 2007. Matinez, M.E., Sanchez, S., Jimenez, J.M. El Yousfi, F., Munoz, L., (2000) “Nitrogen and phosphorus removal from urban wastewater by the microalga Scenedesmus obliquus” Bioresource Technology 73: pp. 263-272. Metcalf and Eddy, Tchobanoglous, G., Burton, F.L., Stensel, H.D., (2003) Wastewater Engineering: Treatment and Reuse. 4th Eddition. McGraw HIl ISBN-13: 978-0-07-041878-3. Mulbry, W., Westhead, E.K., Pizarro, C., Sikora, L., (2005) “Recycling of manure nutrients: use of algal biomass from dairy manure treatment as a slow release fertilizer” Bioresource Technology 96 pp. 451-458. National Biodiesel Board, NBB website (retrieved October 2007). www.biodiesel.org. National Research Council, (2007) Committee on Water Implications of Biofuels Production in the United States, “Water Implication of Biofuels Production in the United States” National Academies Press http://www.nap.edu/catalog/12039.html. Ono, E., Cuello, J. (2004) “Development of Microalgal CO2 Biofixation Photobioreactor” The Canadian Soc. For Eng and Ag Food, and Bio Sci Paper # 044103. Oswald, W.J., (Feb 1962) “The Coming Industry of Controlled Photosynthesis” American Journal of Public Health 52:2. Oswald, W.J., (2003) “My sixty years in applied algology” Journal of Applied Phycology 15: pp. 99-106. Oswald, W.J., Gotaas, H.B. (1957) “Photosynthesis in Sewage Treatment” Paper presented before the Sanitary Engineering Division, American Society of Civil Engineers, New York, N.Y., (October 1954). Reprinted in Transactions of the American Society of Civil engineers, Volume 122, (1957).
70

Oswald, W.J., Gotaas, H.B., Ludwig, H.F., Lynch, V. (1953) “Algae Symbiosis in Oxidation Ponds. Photosynthetic Oxygenation” Sewage and Industrial Wastes 25(6): pp. 692-705. Patzek, T., and Pimentel, D., (September, 2005), "Is Ethanol from Veggies a Waste of Fossil Energy Sources", Natural Resources Research: 163, Issue 9, pp.84-85. Pimentel, D., and Patzek, T.W., (March, 2005) “Ethanol Production Using Corn, Switchgrass, and Wood; Biodiesel Production Using Soybean and Sunflower.” Journal of Natural Resources Research: 14:1 pp. 65-76. Roessler, P., (1990) “Environmental control of glycerolipid metabolism in microalgae: commercial implications and future research directions” Journal of Phycology 26: pp. 393-399. Sheehan, J., Dunahay, T., Benemann, J., Roessler, P., (1998) “A Look Back at the U.S. Department of Energy’s Aquatic Species Program-Biodiesel from Algae” National Renewable Energy Program. Shelef, G. (1968). Kinetics of algal biomass production systems with respect to light intensity and nitrogen concentration. Engineering. Berkeley, University of California, Berkeley. Spolaore, P., Joannis-Cassan, C., Duran, E., Isambert, A., (2006) “Review: Comercial Applications of Microalgae” Journal of Bioscience and Bioengineering: 101:2 pp 87-96. Talens, L., Villalba, G., Gabarell, X., (2007) “Exergy analysis applied to biodiesel production” Resources, Conservation and Recycling 51: pp. 397-407. Thomas, W.H., Seibert, D.L.R., Aldem, M., Neori, A., Eldridge, P., (1984) “Yields, photosynthetic efficiency, and proximate composition of dense marine microalgal cultures. II Dunaliella primolecta and Tetraselmis suecica experiments.” Biomass 5: pp 211-225. Thompson, G.A., (1996) “Lipids and membrane function in green algae” Biochemica et Biophysica 1306: pp. 17-45. Tickell, J., (2006) Biodiesel America: How to Achieve Energy Security, Free America from Middle-East Oil Dependence and Make Money Growing Fuel Yorkshire Press ISBN: 978-0-9707227-4-4. Tyson, S. (2002) National Renewable Energy Laboratory “Brown Grease Feedstocks for Biodiesel” presentation in collaboration with NRBP 2002.
71

USDA, (2006) Statement of Keith Collins Chief Economist, U.S Department of Agriculture Before the U.S. Senate Committee on Environment and Public Works. www.usda.gov. Watanabe, Y., Noue, J. de la., Hall, D.O., (2004) “Photosynthetic performance of helical tubular photobioreactor incorporating the cyanobacterium spiulina platensis” Biotechnology and Bioengineering 42:2 pp 261-269. Weissman, J.C., Goebel, R.P. (1987) “Design and analysis of microalgal open pond systems for the purpose of producing fuels: A subcontract report.” USDOE. Subcontract No.XK-3-03153-1. http://www.osti.gov/bridge/product.biblio.jsp?query_id=0&page=0&osti_id=6546458. Zhang, X., Peterson, C., Reece, D., Haws, R., Möller, G., (1998) “Biodegradability of Biodiesel in the Aquatic Environment.” American Society of Agricultural Engineers: 41(5): pp 1423-1430.
72

APENDIX A
Ammonia testing
Analyses and method description by Adam Feffer (2007) “The Effects of CO2 Addition on Algae Wastewater Treatment” Ammonia levels were determined through Experiments I-III using the Ammonia-Selective Electrode Method (APHA 4500-NH3 D.) with some process modifications and minor additions. The specific apparatus used was as follows:
- Hanna Instruments 209 pH Meter and Electrometer - Orion 95-12 Ammonia-selective electrode - Oakton pH/mV/°C 11 Series Meter with EE6 pH/Temp probe - Fisher Thermix Model 120 MR Stirrer
Through initial testing before the start of Experiment I, the Orion probe was found to be inconsistent in determining concentrations below 0.5 mg/L ammonia as N. As a result of this inconsistency at low concentrations, instead of calibrating with decimal variations in ammonia standard from 0.1 mg/L to 1000 mg/L ammonia as N, calibration standards used were 1 mg/L, 10 mg/L, 50 mg/L, and 100 mg/L. Additionally, it was found that the probe yielded more consistent results when, in addition to deionized water rinsing, it was soaked in deionized water for 15-30 seconds after being exposed to concentrations of more than 100 mg/L-N or when the probe was moved from a sample with high concentration to a sample with significantly lower concentration. The Orion 95-12 Electrode manual noted that the probe was subject to 2% fluctuation in reading per 1°C temperature change, therefore it was important that temperature of all samples and standards was recorded. If fluctuation of more than 2°C was observed while waiting for a probe to stabilize, then a new trial was conducted. Temperature change among samples and standards was minimized by using a stirrer that does not heat up during use, and also by bringing samples and standards to room temperature before testing. Orion Ammonia pH-adjusting ISA (#1310-73-2) was used in place of the NaOH reagent described in APHA 4500- NH3 D.
73

74
APPENDIX B
Kjeldahl Nitrogen Testing
Analyses by Kyle Poole and Adam Feffer, method description by Adam Feffer (2007) “The Effects of CO2 Addition on Algae Wastewater Treatment” Kjeldahl nitrogen testing was used to determine the levels of organic nitrogen using APHA Method 4500-Norg Macro-Kjeldahl Method. Ammonia levels were measured by ammonia selective electrode (as described below), so Macro-Kjeldahl Method Step 4b. Ammonia removal was omitted. The remainder of the procedure was conducted in full, and after Kjeldahl nitrogen was determined, ammonia concentration was subtracted to yield organic nitrogen. One slight change in the standard method was to use 0.01-N acid as a titrant for the ammonia titration in Step 4e, instead of the 0.02-N recommended. This lower concentration acid gave greater resolution in determining the end point of titration. Additionally, a procedure was added in order to rinse the Kjeldahl distillation apparatus with deionized water upon completion of ammonia distillation. While the Kjeldahl flasks were still hot, and burners still turned on, the stoppers of the distillation apparatus were disconnected from the Kjeldahl flasks. Erlenmeyer flasks containing boric acid solution and distilled ammonia were removed, and clean beakers with 150 mL of deionized water were placed under each distillation tube. Stoppers from the ammonia distillation apparatus were resealed to the Kjeldahl flasks, and burners were turned off. This action created a suction from the flask to the beaker that results in the siphoning of the 150 mL of deionized water fully through the distillation tube, into the Kjeldahl flask

APPENDIX C
Lipid Extraction Data
S a m p l e D a y
S a m p l e C o d e
S a m p l e D e s c r i p t i o n
V S S ( m g / L )
V o lu m e C e n t r i f u g e d
( m L )
B i o m a s s ( m g )
1 s t T a r e ( g )
1 s t T a r e + L i p i d s
( g )
1 s t F i n a l E x t r a c t i o n
( m g )
2 n d T a r e ( g )
2 n d T a r e + L ip i d s ( g )
2 n d F i n a l E x t r a c t i o n
( m g )
T o t a l L i p i d s ( m g ) L i p i d s %
L ip i d c o n t e n t o f
W W ( m g / L )
L i p i d P r o d u c t i v i t y
( m g /L / d a y )3 2 2 - 1 R 1 2 8 0 2 0 0 5 6 1 . 1 0 7 1 1 . 1 1 3 1 6 1 . 0 8 7 5 1 . 0 8 8 5 1 7 1 2 . 5 % 3 5 . 0 1 1 . 73 2 2 - 2 R 1 2 8 0 2 0 0 5 6 1 . 1 0 2 7 1 . 1 0 9 4 6 . 7 1 . 0 9 4 8 1 . 0 9 5 6 0 . 8 7 . 5 1 3 . 4 % 3 7 . 5 1 2 . 53 2 2 - 3 R 2 3 0 0 2 0 0 6 0 1 . 1 0 4 1 1 . 1 1 0 4 6 . 3 1 . 1 0 1 1 1 . 1 0 2 0 . 9 7 . 2 1 2 . 0 % 3 6 . 0 1 2 . 03 2 2 - 4 R 2 3 0 0 2 0 0 6 0 1 . 0 8 1 7 1 . 0 9 1 9 1 0 . 2 1 . 0 9 0 8 1 . 0 9 3 3 2 . 5 1 2 . 7 2 1 . 2 % 6 3 . 5 2 1 . 23 2 2 - 1 R 3 2 5 0 2 0 0 5 0 1 . 1 0 7 5 1 . 1 1 3 7 6 . 2 1 . 0 6 7 3 1 . 0 6 9 8 2 . 5 8 . 7 1 7 . 4 % 4 3 . 5 1 4 . 53 2 2 - 2 R 3 2 5 0 2 0 0 5 0 1 . 1 0 2 3 1 . 1 0 8 3 6 1 . 0 8 5 6 1 . 0 8 6 9 1 . 3 7 . 3 1 4 . 6 % 3 6 . 5 1 2 . 2
3 2 2 - 3 R 4 2 8 0 2 0 0 5 6 1 . 0 9 1 5 1 . 0 9 9 0 7 . 5 1 . 1 0 1 1 1 . 1 2 0 6 1 9 . 5 2 7 4 8 . 2 % 1 3 5 . 0 4 5 . 03 2 2 - 4 R 4 2 8 0 2 0 0 5 6 1 . 0 9 9 7 1 . 1 0 5 5 5 . 8 1 . 0 7 7 8 1 . 0 7 9 5 1 . 7 7 . 5 1 3 . 4 % 3 7 . 5 1 2 . 53 2 2 - 1 R 5 2 7 0 2 0 0 5 4 1 . 0 8 6 1 1 . 0 9 5 5 9 . 4 1 . 0 7 4 3 1 . 0 7 6 6 2 . 3 1 1 . 7 2 1 . 7 % 5 8 . 5 1 9 . 53 2 2 - 2 R 5 2 7 0 2 0 0 5 4 1 . 1 0 2 7 1 . 1 0 8 5 5 . 8 1 . 0 7 9 1 1 . 0 8 0 5 1 . 4 7 . 2 1 3 . 3 % 3 6 . 0 1 2 . 03 2 2 - 3 R 6 2 6 0 2 0 0 5 2 1 . 0 6 3 7 1 . 0 6 9 6 5 . 9 1 . 0 6 9 1 1 . 0 6 9 9 0 . 8 6 . 7 1 2 . 9 % 3 3 . 5 1 1 . 23 2 2 - 4 R 6 2 6 0 2 0 0 5 2 1 . 0 9 2 2 1 . 0 9 7 6 5 . 4 1 . 0 9 4 7 1 . 0 9 6 2 1 . 5 6 . 9 1 3 . 3 % 3 4 . 5 1 1 . 5
6 2 5 - 1 R 1 5 1 0 2 0 0 1 0 2 1 . 0 8 7 5 1 . 0 9 4 4 6 . 9 1 . 0 9 2 8 1 . 0 9 4 2 1 . 4 8 . 3 8 . 1 % 4 1 . 5 6 . 96 2 5 - 2 R 1 5 1 0 2 0 0 1 0 2 1 . 0 9 9 5 1 . 1 0 6 3 6 . 8 1 . 1 0 0 3 1 . 1 0 1 7 1 . 4 8 . 2 8 . 0 % 4 1 . 0 6 . 86 2 5 - 3 R 2 5 0 0 2 0 0 1 0 0 1 . 0 7 9 7 1 . 0 8 4 3 4 . 6 1 . 1 1 9 7 1 . 1 2 2 4 2 . 7 7 . 3 7 . 3 % 3 6 . 5 6 . 16 2 5 - 4 R 2 5 0 0 2 0 0 1 0 0 1 . 1 0 0 7 1 . 1 1 6 8 1 6 . 1 1 . 0 9 5 6 1 . 1 0 1 5 . 4 2 1 . 5 2 1 . 5 % 1 0 7 . 5 1 7 . 96 2 5 - 1 R 3 4 5 0 2 0 0 9 0 1 . 1 0 5 2 1 . 1 1 4 2 9 1 . 0 8 4 5 1 . 0 8 7 6 3 . 1 1 2 . 1 1 3 . 4 % 6 0 . 5 1 0 . 16 2 5 - 2 R 3 4 5 0 2 0 0 9 0 1 . 1 0 0 7 1 . 1 1 1 8 1 1 . 1 1 . 0 9 2 7 1 . 0 9 4 4 1 . 7 1 2 . 8 1 4 . 2 % 6 4 . 0 1 0 . 7
6 2 5 - 3 R 4 3 4 5 2 0 0 6 9 1 . 0 7 2 6 1 . 0 9 0 2 1 7 . 6 1 . 0 8 9 6 1 . 0 9 4 5 4 . 9 2 2 . 5 3 2 . 6 % 1 1 2 . 5 1 8 . 86 2 5 - 4 R 4 3 4 5 2 0 0 6 9 1 . 0 8 9 0 1 . 1 0 3 7 1 4 . 7 1 . 0 9 9 8 1 . 1 0 3 8 4 1 8 . 7 2 7 . 1 % 9 3 . 5 1 5 . 66 2 5 - 1 R 5 3 7 5 2 0 0 7 5 1 . 0 7 8 8 1 . 0 9 2 1 1 3 . 3 1 . 0 8 9 6 1 . 1 0 1 1 1 . 4 2 4 . 7 3 2 . 9 % 1 2 3 . 5 2 0 . 66 2 5 - 2 R 5 3 7 5 2 0 0 7 5 1 . 0 9 7 8 1 . 1 1 1 3 1 3 . 5 1 . 0 9 9 1 1 . 1 0 1 9 2 . 8 1 6 . 3 2 1 . 7 % 8 1 . 5 1 3 . 66 2 5 - 3 R 6 3 7 0 2 0 0 7 4 1 . 0 6 5 8 1 . 0 8 4 9 1 9 . 1 1 . 1 0 8 7 1 . 1 1 3 3 4 . 6 2 3 . 7 3 2 . 0 % 1 1 8 . 5 1 9 . 76 2 5 - 4 R 6 3 7 0 2 0 0 7 4 1 . 0 6 6 2 1 . 0 7 9 4 1 3 . 2 1 . 0 8 0 9 1 . 0 8 7 4 6 . 5 1 9 . 7 2 6 . 6 % 9 8 . 5 1 6 . 4
9 2 8 - 1 - R 1 5 8 5 2 0 0 1 1 7 1 . 1 0 2 6 1 . 1 1 2 9 1 0 . 3 0 1 0 . 3 8 . 8 % 5 1 . 5 5 . 79 2 8 - 2 - R 1 s p k 5 8 5 2 0 0 1 1 7 1 . 0 8 9 0 1 . 1 1 4 3 2 5 . 3 1 . 0 8 6 6 1 . 0 9 1 4 . 4 2 9 . 7 0 . 09 2 8 - 3 - R 2 4 8 5 2 0 0 9 7 1 . 0 9 9 9 1 . 1 0 5 0 5 . 1 1 . 0 9 1 5 1 . 0 9 3 8 2 . 3 7 . 4 7 . 6 % 3 7 . 0 4 . 19 2 8 - 4 - R 2 4 8 5 2 0 0 9 7 1 . 0 9 6 7 1 . 1 0 6 4 9 . 7 1 . 0 8 3 1 1 . 0 8 6 1 3 1 2 . 7 1 3 . 1 % 6 3 . 5 7 . 19 2 8 - 1 - R 3 5 0 0 2 0 0 1 0 0 1 . 0 7 7 5 1 . 0 8 3 2 5 . 7 1 . 1 0 8 5 1 . 1 1 0 6 2 . 1 7 . 8 7 . 8 % 3 9 . 0 4 . 39 2 8 - 2 - R 3 5 0 0 2 0 0 1 0 0 1 . 0 9 5 4 1 . 1 0 0 7 5 . 3 1 . 0 9 4 6 1 . 0 9 6 7 2 . 1 7 . 4 7 . 4 % 3 7 . 0 4 . 1
9 2 8 - 3 - R 4 6 3 0 2 0 0 1 2 6 1 . 0 9 8 9 1 . 1 1 3 0 1 4 . 1 1 . 0 9 1 1 1 . 0 9 4 2 3 . 1 1 7 . 2 1 3 . 7 % 8 6 . 0 9 . 69 2 8 - 4 - R 4 6 3 0 2 0 0 1 2 6 1 . 0 9 8 4 1 . 1 1 0 9 1 2 . 5 1 . 0 9 0 3 1 . 0 9 4 4 4 . 1 1 6 . 6 1 3 . 2 % 8 3 . 0 9 . 29 2 8 - 1 - R 5 6 1 0 2 0 0 1 2 2 1 . 0 7 5 3 1 . 0 9 3 1 1 7 . 8 1 . 1 0 6 5 1 . 1 0 9 4 2 . 9 2 0 . 7 1 7 . 0 % 1 0 3 . 5 1 1 . 59 2 8 - 2 - R 5 6 1 0 2 0 0 1 2 2 1 . 0 9 1 1 1 . 1 0 5 3 1 4 . 2 1 . 0 8 8 3 1 . 0 9 3 9 5 . 6 1 9 . 8 1 6 . 2 % 9 9 . 0 1 1 . 09 2 8 - 3 - R 6 6 0 0 2 0 0 1 2 0 1 . 1 2 1 7 1 . 1 3 9 1 1 7 . 4 1 . 0 9 3 2 1 . 0 9 6 6 3 . 4 2 0 . 8 1 7 . 3 % 1 0 4 . 0 1 1 . 69 2 8 - 4 - R 6 s p k 6 0 0 2 0 0 1 2 0 1 . 1 0 6 1 1 . 1 3 2 9 2 6 . 8 1 . 1 0 7 6 1 . 1 1 8 2 1 0 . 6 3 7 . 4
1 2 3 1 - 1 - R 1 4 8 5 2 0 0 9 7 0 0 . 0 0 . 01 2 3 1 - 2 - R 1 4 8 5 2 0 0 9 7 1 . 0 8 8 1 1 . 0 9 1 8 3 . 7 1 . 1 0 3 5 1 . 1 0 6 9 3 . 4 7 . 1 7 . 3 % 3 5 . 5 3 . 01 2 3 1 - 3 - R 2 2 5 0 2 0 0 5 0 1 . 0 9 5 7 1 . 0 9 8 8 3 . 1 1 . 0 8 8 0 1 . 0 8 9 6 1 . 6 4 . 7 9 . 4 % 2 3 . 5 2 . 01 2 3 1 - 4 - R 2 2 5 0 2 0 0 5 0 1 . 0 7 9 1 1 . 0 8 2 3 3 . 2 1 . 0 6 8 2 1 . 0 6 9 3 1 . 1 4 . 3 8 . 6 % 2 1 . 5 1 . 81 2 3 1 - 1 - R 3 3 2 0 2 0 0 6 4 1 . 0 9 8 5 1 . 1 0 0 4 1 . 9 1 . 0 8 3 4 1 . 0 8 4 0 . 6 2 . 5 3 . 9 % 1 2 . 5 1 . 01 2 3 1 - 2 - R 3 3 2 0 2 0 0 6 4 1 . 0 9 4 0 1 . 0 9 7 3 3 . 3 1 . 0 9 6 5 1 . 0 9 8 4 1 . 9 5 . 2 8 . 1 % 2 6 . 0 2 . 2
1 2 3 1 - 3 - R 4 s p k 8 5 0 2 0 0 1 7 0 1 . 0 7 1 7 1 . 0 8 9 0 1 7 . 3 1 . 1 1 2 9 1 . 1 2 1 4 8 . 5 2 5 . 81 2 3 1 - 4 - R 4 8 5 0 2 0 0 1 7 0 1 . 0 9 2 5 1 . 1 0 5 2 1 2 . 7 1 . 1 0 8 3 1 . 1 1 3 5 5 . 2 1 7 . 9 1 0 . 5 % 8 9 . 5 7 . 51 2 3 1 - 1 - R 5 8 3 5 2 0 0 1 6 7 1 . 1 1 5 4 1 . 1 2 9 3 1 3 . 9 1 . 0 9 9 8 1 . 1 0 4 8 5 1 8 . 9 1 1 . 3 % 9 4 . 5 7 . 91 2 3 1 - 2 - R 5 8 3 5 2 0 0 1 6 7 1 . 0 7 5 5 1 . 0 9 0 3 1 4 . 8 1 . 0 9 8 7 1 . 1 0 2 6 3 . 9 1 8 . 7 1 1 . 2 % 9 3 . 5 7 . 81 2 3 1 - 3 - R 6 8 4 5 2 0 0 1 6 9 1 . 0 9 2 3 1 . 1 0 1 0 8 . 7 1 . 0 8 2 4 1 . 0 8 7 6 5 . 2 1 3 . 9 8 . 2 % 6 9 . 5 5 . 81 2 3 1 - 4 - R 6 8 4 5 2 0 0 1 6 9 1 . 0 6 7 7 1 . 0 8 1 0 1 3 . 3 1 . 0 8 5 4 1 . 0 8 8 3 2 . 9 1 6 . 2 9 . 6 % 8 1 . 0 6 . 8
1 5 3 - 1 - R 4 6 6 0 2 0 0 1 3 2 1 . 0 9 3 3 1 . 0 9 9 6 6 . 3 1 . 1 0 0 3 1 . 1 0 2 7 2 . 4 8 . 7 6 . 6 % 4 3 . 5 2 . 91 5 3 - 2 - R 5 6 9 0 2 0 0 1 3 8 1 . 0 9 0 9 1 . 0 9 7 1 6 . 2 1 . 0 8 4 7 1 . 0 8 8 7 4 1 0 . 2 7 . 4 % 5 1 . 0 3 . 41 5 3 - 3 - R 5 6 9 0 2 0 0 1 3 8 1 . 0 8 8 1 1 . 0 9 5 9 7 . 8 1 . 0 7 1 2 1 . 0 7 4 5 3 . 3 1 1 . 1 8 . 0 % 5 5 . 5 3 . 71 5 3 - 4 - R 6 6 9 0 2 0 0 1 3 8 1 . 0 9 2 3 1 . 1 0 1 5 9 . 2 1 . 1 0 2 2 1 . 1 0 7 4 . 8 1 4 1 0 . 1 % 7 0 . 0 4 . 7
2 5 % W W D i lu t io n
1 0 % W W D i lu t io n
2 5 % W W D i lu t io n
1 0 % W W D i lu t io n
2 5 % W W D i lu t io n
1 0 % W W D i lu t io n
2 5 % W W D i lu t io n
1 0 % W W D i lu t io n
2 5 % W W D i lu t io n
75