lipid phase behavior and calcium-induced fusion of phosphatidylethanolamine-phosphatidylserine...
TRANSCRIPT

3232 Biochemistry 1984, 23, 3232-3240
Lipid Phase Behavior and Calcium-Induced Fusion of Phosphatidylethanolamine-Phosphatidylserine Vesicles. Calorimetric and Fusion Studies? John R. Silvius* and Jeannine Gagni
ABSTRACT: Pure dioleoyl-, dielaidoyl-, and dimyristoyl- phosphatidylserines have been synthesized, along with the corresponding phosphatidylethanolamines (PE's). High-sen- sitivity differential scanning calorimetry of PE-phosphati- dylserine (PS) mixtures of like acyl composition indicates very high miscibility of these species in the absence of calcium but substantial lateral phase separation at high calcium levels. Calorimetrically derived phase diagrams for these systems indicate that mixtures containing <20% or >80% PS in PE do not phase separate in the presence of calcium ion, while mixtures of intermediate PS content separate into domains of these limiting PS contents. Pure PS bilayers incubated with increasing concentrations of calcium ion first show an elevation of the gel to liquid-crystalline transition temperature at low calcium levels, followed by a complete abolition of the tran- sition at slightly higher calcium concentrations. The rate and
%e interaction of calcium ions with lipid vesicles containing anionic phospholipids can lead to lateral phase separations or, for certain types of lipids, to fusion of the vesicles (Papa- hadjopoulos et al., 1980; Wilschut et al., 1980; Sundler & Papahadjopoulos, 198 1). These phenomena are presently under study by a variety of methods to elucidate the mecha- nism(s) of membrane fusion and to evaluate the possible significance of ionogenic lateral phase separations in fusion and other membrane functions (Ohnishi & Ito, 1974; van Dijck et al., 1978; Tilcock & Cullis, 1981; Hui et al., 1983). The effects of calcium (and other divalent metal ions) on the be- havior of lipid mixtures containing phosphatidylserine (PS) l are of particular interest, as PS alone of the major phospho- lipids of mammalian membranes is capable of fusion in the pure state in the presence of calcium. This fusion process, which requires calcium concentrations above a characteristic threshold level (Papahadjopoulos et al., 1977; Wilschut et al., 1980), appears to be mediated by the formation of interbilayer (PS)*-Ca complexes and by the substantial dehydration of the vesicle surfaces at sites where fusion takes place (Hauser et al., 1977; Portis et al., 1979).
Mixtures of phosphatidylserine with phosphatidylethanol- amine have been found to exhibit calcium-induced fusion at PE contents up to at least 7 5 mol % (Miller & Racker, 1976; Duzgunes et al., 1981). Furthermore, combination of PE with PS in the presence of magnesium, or with phosphatidylinositol in the presence of calcium, can promote vesicle fusion under conditions where the anionic phospholipid alone cannot (Duzgunes et al., 1981; Sundler et al., 1981). As the inner surface of the plasma membrane of at least some mammalian cells and the cytoplasmic surface of synaptic and possibly other
From the Department of Biochemistry, McGill University, MontrCal, QuBbec, Canada H3G 1Y6. Received November 28,1983. This research was supported by grants from the Medical Research Council of Canada (Grants ME-7580 and MA-7776) and Le Conseil de la Recherche en Sante du Quebec (Grant 820040).
0006-2960/84/0423-3232$0 1.5010
calcium concentration dependence of the fusion of PS and PS-PE vesicles do not vary strongly with changes in lipid acyl chain composition so long as the lipids are liquid crystalline in the absence of calcium. However, the fusion rate increases markedly with increasing temperature, even well above the lipid transition temperature. At very low mole fractions of PS in PE, where a single PS-PE phase is expected in the presence or absence of calcium, calcium-induced fusion is still observed, and the threshold concentration of calcium required for fusion is significantly less than for vesicles of higher PS content. These results suggest that the calcium-induced fusion of membranes rich in PE can occur without lateral separation of a PS-rich phase, a process that is not thermodynamically favored when the PE-PS model membranes contain physio- logical levels of PS.
exocytic vesicles contain large amounts of PE and PS, the physical properties of mixtures of these lipids are of consid- erable interest in relation to the mechanisms of such processes as exocytosis and intracellular fusion events (Rothman & Lenard, 1977; Op den Kamp, 1979; Deutsch & Kelly, 1981).
In this study, we have combined high-sensitivity differential scanning calorimetry with assays of fusion for mixtures of pure PE and PS species of homogeneous fatty acyl composition. Calorimetrically determined phase diagrams for PE-PS mixtures in the presence and absence of calcium ion have been correlated with measurements of the rate and threshold cal- cium concentration for fusion of PS-PE vesicles of varying composition. Our results indicate that the fusion of PE-PS vesicles of physiological PS content can occur without lateral phase separation of the PS component. Under these conditions, the PE component clearly plays a major role in fusion, sup- porting and even enhancing the physical behavior of the PS component that leads to membrane coalescence.
Materials and Methods
Materials Glycero-3-phosphocholine-cadmium chloride adduct and
N-t-Boc-L-serine were obtained from Sigma (St. Louis, MO). sn-Glycerol 3-phosphate dicyclohexylammonium salt and antibiotic A23187 (free acid) were obtained from Calbiochem (La Jolla, CA). Elaidic and myristic acids were purchased
I Abbreviations: r-Boc, tert-butoxycarbonyl; DE, dielaidoyl; DM, dimyristoyl; DO, dioleoyl; DSC, differential scanning calorimetry; EDTA, ethylenediaminetetraacetic acid trisodium salt; NBD-PE, N-(7- nitro-2,1,3-benzoxadiazol-4-yI)phosphatidylethanolamine; PA, 1,2-di- acyl-sn-glycerol3-phosphate; PC, 1,2-diacyl-sn-glycer0-3-phosphocholine; PE, 1,2-diacyl-sn-glycero-3-phosphoethanolamine; PS, 1.2-diacyl-sn- glycero-3-phosphoserine; rhodaminyl-PE, N-(lissamine Rhodamine B su1fonyl)dioleoylphosphatidylethanolamine; Tes, N-[tris(hydroxy- methyl)methyl]-2-arnincethanesulfonic acid sodium salt; TLC, thin-layer chromatography.
0 1984 American Chemical Society

A M I N O P H O S P H O L I P I D M I X I N G A N D M E M B R A N E F U S I O N V O L . 2 3 , N O . 1 4 , 1 9 8 4 3233
from NuChek Prep. (Elysian, MN). 4-Pyrrolidinopyridine (98%) was purchased from Aldrich (Milwaukee, WI), re- crystallized from 10% diethyl ether in hexane, and then stored under N2 at -20 OC until ready for use. All organic reagents and inorganic chemicals used were of at least analytical grade purity. All solvents were redistilled before use. Calcium chloride solutions were standardized by titration with a primary EDTA standard, using calcein as an indicator (Diehl & El- lingboe, 1956).
Phospholipase D was prepared as a crude extract of the inner yellow-white leaves of savoy cabbage by the procedure of Davidson & Long (1958) up to the stage of acetone precip- itation. The resolubilized and centrifuged extract was dialyzed against 2 mM histidine, pH 6.5, and then quickly frozen and stored at -70 ‘C.
Methods Lipid Syntheses. Phosphatidylcholines were synthesized
from anhydrous sn-glycero-3-phosphoholine-cadmium chlo- ride adduct and the acyl anhydride by using 4-pyrrolidino- pyridine as the catalyst, as described by Patel et al. (1979). PC was purified by chromatography on neutral alumina es- sentially as described by Singleton et al. (1965).
Phosphatidylethanolamines were synthesized from the corresponding PC’s by enzymatic transphosphatidylation as described by Comfurius & Zwaal(l977). The crude PE was purified by chromatography on a silicic acid column that was washed with 95:5:0.5 (v/v) CHC1,:methanol:concentrated N H 4 0 H and then with 9 5 5 CHC13:methanol before appli- cation of the sample. The column was eluted with increasing percentages of methanol in chloroform, with pure PE eluting at - 16% methanol.
For the synthesis of phosphatidylserines, the phospholipase D catalyzed conversion of PC to PS in the presence of high levels of L-serine (Comfurius & Zwaal, 1977) was initially utilized. However, substantial amounts of phosphatidic acid inevitably contaminated the products of this reaction, and complete separation of this lipid from PS was very difficult to achieve with good PS recovery on either silicic acid or carboxymethylcellulose columns. Therefore, the following procedure, based largely on the PC synthesis of Patel et al. (1979) and the PS synthesis of Hermetter et al. (1982), was devised.
Synthesis of Phosphatidic Acids. sn-Glycerol 3-phosphate dicyclohexylammonium salt (1 mmol) was converted to the dipyridinium form by passage through a column of Rexyn- 101 (pyridinium form) in 1:l methanol:water, then concentrated in vacuo, and dried overnight over P205. The dried glycerol 3-phosphate dipyridinium salt in 4 mL of anhydrous dimethyl sulfoxide was combined with 4 mmol of fatty acid anhydride and 0.3 g of 4-pyrrolidinopyridine (and, for syntheses of un- saturated species, 2 mg of butylated hydroxytoluene) in 4 mL of dry benzene. The mixture was stirred for 4-6 h at 42 OC under nitrogen. The reaction products were partitioned be- tween 200 mL of CHCl, and 100 mL of methanol plus 125 mL of 100 mM aqueous HCOONa, pH 3.0. The chloroform phase was concentrated in vacuo, and the residue was stirred overnight at room temperature in 30:30: 1O: lO CHC1,: methano1:triethylamine:water to decompose the phospho- carboxy mixed anhydride (Gupta et al., 1977). After careful removal of the solvents in vacuo, the crude phosphatidic acid was partitioned between chloroform and methanol-formate buffer as described above, and the chloroform phase was washed with 5:4 (v/v) methano1:lOO mM Tes, pH 6.5, and then concentrated in vacuo. The crude phosphatidic acid was purified on a column of silicic acid, eluting with an ascending
gradient of methanol in chloroform. The pure phospholipid was obtained in the 15-25% methanol fractions in a typical yield of 6 5 7 0 % based on glycerol 3-phosphate.
Synthesis of Phosphatidylserines. Phosphatidic acids were converted to the dipyridinium form by passage through a column of Rexyn- 10 1 (pyridinium form) in 1 : 1 chloroform: methanol, then concentrated in vacuo, and dried overnight over P205 under high vacuum. The dipyridinium phosphatidate was coupled to N-t-Boc-L-serine benzhydryl ester and purified as described by Hermetter et al. (1982). We found depro- tection of N-t-Boc-phosphatidylserine benzhydryl ester ac- cording to the protocol of Hermetter et al. to give substantial amounts of phosphatidate in the reaction products, which greatly complicated subsequent purification of the PS. Therefore, the deprotection conditions were modified as fol- lows. The protected PS, dried overnight under high vacuum in the presence of P2OS, was dissolved in dry, alcohol-free chloroform. The solution was bubbled with dry N2 for 15 min, then with dry HC1 for 20 min at 0 OC, and, after a further 30 min at 0 OC, with dry N2 for 15 min; 0.2 mL of tri- ethylamine was added to neutralize any remaining HCl, and the chloroform phase was washed successively with cold 2: 1: 1 methano1:water:saturated NaHCO,, cold 4 5 methano1:lOO mM HCOONa, pH 3.0, and 4 5 methano1:lOO mM Tes, pH 7.4. The crude products (which contained little or no phos- phatidate) were applied in 955:O.l ch1oroform:methanol: concentrated N H 4 0 H to a column of silicic acid, which was eluted with an ascending gradient of methanol in chloroform. PS was eluted between 25 and 35% methanol, with traces of contaminating phosphatidate, if any was present, eluting in the initial PS-containing fractions. PS fractions that were homogeneous by TLC in both acidic and basic solvent systems (50:20: 10: 105 CHC1,:acetone:methanol:acetic acid:H20 and 65:35:2.5:2.5 CHC13:methanol:concentrated NH40H:H20) were pooled and concentrated in vacuo and then redissolved in a small volume of chloroform and twice “Folch washed” (Folch et al., 1957), first with 100 mM HCOONa and 500 mM NaC1, pH 3.0, and then with 100 mM EDTA, pH 7.4, as the aqueous components.
All of the phospholipid species synthesized were Folch washed with 100 mM EDTA as the aqueous component and then finally purified by dissolving them in the minimum amount of chloroform or 1 : 1 hexane:chloroform and precip- itating them with 10 volumes of acetone at 0 OC. Lipid so- lutions in benzene (for dioleoyl and dielaidoyl lipids) or chloroform (for dimyristoyl species) were centrifuged for 20 min at lOOOOg to remove any remaining particles of chro- matographic adsorbent. Lipids stocks were stored in these solvents at -70 OC under nitrogen and periodically rechecked for purity by thin-layer chromatography.
Preparation of Lipid Dispersions for Calorimetry. Lipid mixtures were dissolved in benzene or 96:4 benzene:ethanol, quick-frozen in ethanol4ry ice, and lyophilized. For samples to be incubated with calcium ion, the calcium ionophore A23 187 was also added to the dissolved lipids at a 1ipid:ion- ophore molar ratio of 250: 1. The lipids were redispersed by vortexing under nitrogen above the transition temperature, using either 200 mM NaCl, 5 mM histidine, 5 mM Tes, and 1 mM EDTA, pH 7.4 (“calcium-free buffer”), or 100 mM NaC1, 5 mM histidine, and 5 mM Tes, pH 7.4 (for samples to which calcium chloride was to be added). After the lipids were dispersed and hydrated, and calcium chloride was added to 30 mM for calcium-containing samples, the lipid dispersions were incubated under nitrogen for varying times above and below the lipid transition temperature, as described below.
3234 B I O C H E M I S T R Y SILVIUS A N D G A G N E
In preliminary experiments, the following pretreatments were established to give highly reproducible calorimetric be- havior of the lipid samples. For DMPE-DMPS mixtures without calcium, the sample was incubated for 30-60 s at 65 OC, rapidly cooled to 55 "C, and, after 10 min, slowly cooled (at <0.3 OC/min) to 20 OC. After incubation at 20 OC for 1 h, the sample was slowly cooled to - 10 "C to begin the calorimeter run. DMPE-DMPS (calcium) samples were treated similarly, but calcium chloride was added to 30 mM at 65 OC, and the 20 OC incubation time was lengthened to 3 h. DEPE-DEPS mixtures were heated to 50 OC for 1 min, quickly cooled to 40 OC, and, after 30 min, slowly cooled from this temperature to 0 "C. The samples were incubated for 1 h at this temperature before the calorimeter run began. DEPE-DEPS (calcium) samples were similarly prepared, with calcium chloride added at 50 "C, but the upper temperature incubation was done at 45 "C, and the 0 "C incubation was extended to 3 h. Extension of the higher temperature incu- bations to 1 h did not appreciably alter the calorimetric be- havior of the samples but was normally avoided to ensure that lipid breakdown (routinely monitored by thin-layer chroma- tography) would not occur.
Samples containing 2-5 pmol of lipid phosphorus in 0.7 mL were analyzed in a M i c r a 1 MC- 1 high-sensitivity differential scanning calorimeter, normally at a temperature scan rate of 20-25 OC/h. An aliquot of the lipid dispersion was taken for phosphorus analysis by the method of Lowry & Tinsley (1974), using a spectrophotometrically calibrated solution of adenosine monophosphate as the phosphorus standard. Calorimetric traces were superimposed on base-line traces recorded with only buffer in the sample cell, and the entire transition en- dotherms (and calibration pulses of known heat content) were traced, cut out, and weighed in triplicate (with a reproducibility of 2-3%) to determine the heat of transition.
Fusion Assays. Large unilamellar lipid vesicles were pre- pared by the reverse-phase evaporation method and sized by extrusion through a 0.1-pm pore size Unipore membrane (Bio-Rad Laboratories, Mississauga, Ontario), as described by Wilschut et al. (1980). Thin-layer chromatography and quantitative phosphorus assay of the resolved lipids showed that the lipid composition of the vesicles after ultrafiltration was not significantly different from that of the lipid mixture used to prepare the vesicles, even for vesicles of low PS content (C25 mol 9%). Vesicle fusion was assayed by two procedures. To measure the mixing of vesicle contents, we used the assay of Wilschut et al. (1980), which is based on the formation of the terbium-dipicolinate complex by the fusion of two vesicle types, each containing one of the components of the complex. The formation of the complex was monitored by measuring its phosphorescence with a Perkin-Elmer LS-5 spectrofluo- rometer with a pulsed light source, using a delay time of 80 ps and a gating time of 1 ms for collection of emitted light after each pulse and using excitation and emission wavelengths of 276 and 550 nm, respectively. Lipid vesicle fusion was also assayed by the mixing of the vesicle wall components, ac- cording to the assay of Struck et al. (1981) as modified by Hoekstra (1982), which is based on the measurement of resonance energy transfer between two fluorescent and non- diffusible lipid labels (NBD-PE and rhodaminyl-PE) initially incorporated in separate vesicles. Where necessary, initial fusion rates determined by this assay were corrected for small calcium-induced changes in the fluorescence of NBD-PE- containing vesicles alone.
Results Thermotropic Properties of Pure Lipid Species. Repre-
DEPE ( A ) il 3 8 3 0
50 %
DEPS
35.5"
30 YO
30.8" 70 %
1 26.6"
yo J
2 0" 30' 40' 50" T ("C)
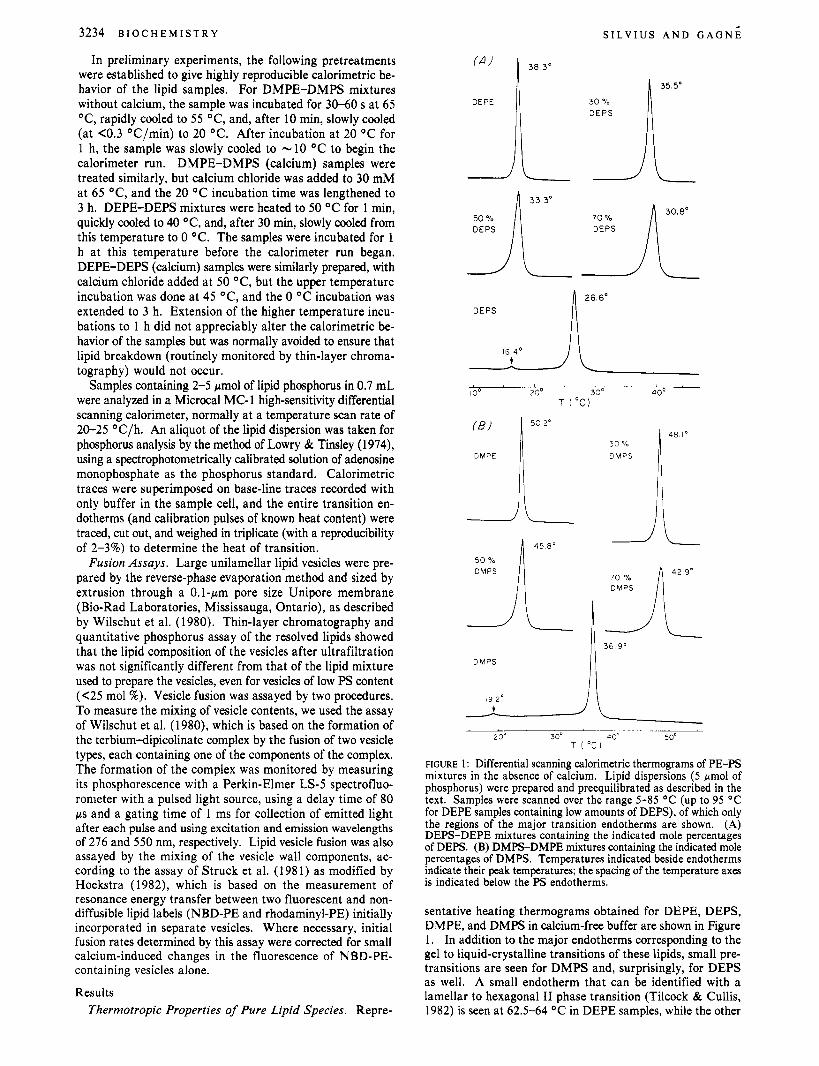
FIGURE 1 : Differential scanning calorimetric thermograms of PE-PS mixtures in the absence of calcium. Lipid dispersions ( 5 pmol of phosphorus) were prepared and preequilibrated as described in the text. Samples were scanned over the range 5-85 O C (up to 95 O C
for DEPE samples containing low amounts of DEPS), of which only the regions of the major transition endotherms are shown. (A) DEPS-DEPE mixtures containing the indicated mole percentages of DEB. (B) DMPS-DMPE mixtures containing the indicated mole percentages of DMPS. Temperatures indicated beside endotherms indicate their peak temperatures; the spacing of the temperature axes is indicated below the PS endotherms.
sentative heating thermograms obtained for DEPE, DEPS, DMPE, and DMPS in calcium-free buffer are shown in Figure 1. In addition to the major endotherms corresponding to the gel to liquid-crystalline transitions of these lipids, small pre- transitions are seen for DMPS and, surprisingly, for DEPS as well. A small endotherm that can be identified with a lamellar to hexagonal I1 phase transition (Tilcock & Cullis, 1982) is seen at 62.5-64 OC in DEPE samples, while the other

A M I N O PHOSPHOLIPID M I X I N G A N D M E M B R A N E F U S I O N VOL. 2 3 , N O . 1 4 , 1 9 8 4 3235
Table I: Phase Transition Temperatures and Enthalpies ofPure Phospholipids
pre- main transi- transition
tion enthalpy" temp' main transition (kcal
lipid ("C) temp' (OC) mol-') DEPC DEPE DEPS DEPC (30 mM CaC1,) DEPE (30 mM CaC1,) DEPS (30 mM CaC1,) DMPC DMPE DMPS DMPC (30 mM CaCI2) DMPE (30 mM CaCl,) DMPS (30 mM CaC1,)
8-9 11.9 8.4 i 0.5 38.3 8.4 i 0.2
16-17 26.7 8.2 f 0.4 12.4/13.26 9.6 f 0.6 38.3 9.1 & 0.1 transition abolished
14.1 23.9 6.5 i 0.4 50.3 5.9 f 0.6
19-20 36.9 7.2 f 0.4 16.6 24.8 1.5 * 0.3
50.6 6.1 & 0.5 transition abolished
OMean values determined for at least triplicate samples. Transition temperatures are reproducible to within 0.1 OC except when otherwise indicated. Double transition observed.
lipids show no endotherms above the main transition up to at least 80 OC.
In Table I are given the transition temperatures and en- thalpies of DEPE, DEPS, DMPE, and DMPS, and of the Pc's from which the PE's were synthesized. In all cases, the values shown were determined by using at least three samples from a minimum of two (in some cases, as many as five) inde- pendent preparations of the lipid species. The transition temperatures agree well in most cases with previously reported values (Cevc et al., 1981; Silvius, 1982; Hauser & Shipley, 1983), although the value for DEPS (26.6 "C) is somewhat higher than that of 22.5 OC reported by Comfurius & Zwaal (1977) in a similar aqueous medium. The enthalpies of the major transitions of the various phospholipids generally lie within the range of reported values, with the prominent ex- ception of DEPE, which we find to give a transition enthalpy almost twice as great as previously reported (Jackson & Sturtevant, 1977; Yang et al., 1979). However, since the value we obtain is quite consistent over three separate preparations of this lipid, and since the transition peaks we observe are quite symmetrical and comparable in width to those for the other lipids studied, we feel that our measured enthalpy of transition for this compound is reliable.
Representative heating thermograms for dielaidoyl- and dimyristoyl-PE and dielaidoyl- and dimyristoyl-PS in the presence of high-calcium buffer are shown in Figure 5 . As has previously been reported for bovine brain PS (Jacobson & Papahadjopoulos, 1975) and for DMPS (Van Dijck et al., 1978), both DMPS and DEPS show no significant endo- or exothermic transitions in the temperature range 0-90 "C in the presence of high levels of calcium. Representative ther- mograms for DMPS samples equilibrated with lower levels of calcium by dialysis at 45 OC are shown in Figure 2. Comparable results were obtained for DEPS under the same conditions. The main transition peak is shifted upward by low levels of calcium, indicating that PS in the gel state binds calcium ion with greater affinity than it does in the liquid- crystalline state. This finding is in contrast to the manganese binding data of Puskin & Martin (1979) and suggests that this ion cannot be taken as a congener of calcium in PS binding studies. As shown in the inset to Figure 2, the total transition enthalpy first rises somewhat and then falls dramatically as the calcium level is increased. As the calcium concentration added during the dialysis is increased to slightly higher levels
20 30 40 50 60 T ( " C )
FIGURE 2: Thermograms for DMPS dispersions equilibrated at 45 OC with varying concentrations of calcium chloride by dialysis. Samples were dialyzed for 3 h against 200 mM NaCl, 5 mM histidine, and 5 mM Tes, pH 7.4, containing the indicated concentrations of calcium chloride and then slowly cooled to 5 OC after removal from the dialysis bag in preparation for calorimetry. The calcium con- centrations used were (-) 0, (---) 0.1, (---) 0.2, (-) 0.5, and (--) 0.8 mM. Inset: Variation of the integrated transition enthalpy with the calcium concentration in the dialysis medium. (-0.8 mM for DMPS and -1.0 mM for DEPS), the up- ward-shifted transition disappears completely. As discussed below, these calcium concentrations correspond to those at which membrane fusion is first observed.
The effects of calcium chloride on the phase transitions of DEPE and DMPE are relatively slight in comparison with the effects on the PS species (Figure 5). The transition temper- atures are virtually unchanged between calcium-free buffer and buffer containing 30 mM calcium, and the transition enthalpies appear to increase only very slightly at high calcium levels (Table I). However, the transition endotherms in the high-calcium medium show distinct low-temperature shoulders, while the endotherms appear quite symmetrical in calcium-free buffer. The clearly observable endotherm seen at -63 OC for DEPE dispersions in the absence of calcium ion is replaced by a relatively indistinct excess heat absorption over the tem- perature interval 52-61 OC in the high-calcium buffer.
Mixing of PS and PE in the Absence of Calcium. DSC thermograms for several mixtures of DEPS with DEPE, and of DMPS with DMPE, in calcium-free buffer are shown in Figure 1 . The transition peaks for the PE-PS mixtures are only slightly broadened in comparison with those of the pure compounds, with no indications of multiple overlapping transitions in any of the mixtures. A small endotherm, possibly representing a lamellar to nonlamellar transition, was seen at 73 OC for 10% DEPS-DEPE samples but was not visible up to 95 OC in 20% PS-containing samples.
In Figure 3, the phase diagrams for these two PE-PS mixtures in calcium-free buffer are plotted. The liquidus and solidus lines have been corrected to account for the finite transition widths for the pure compounds by the method de- scribed by Mabrey & Sturtevant (1976). Theoretical liquidus and solidus curves, calculated by using the data given in Table I with the assumption of ideal mixing of the lipids in both the gel and the liquid-crystalline phases, are also shown in Figure 3. It can be seen that the experimental results reflect very good mixing of each PS with the corresponding PE in both phases.

3236 B I O C H E M I S T R Y S I L V I U S A N D G A G N E
r ~ --___-
40 ~ i ( A I
36L
I 1 0 20 40 60 80
MOLE % DEPE
5-L 27.5 ‘IO PS
0 20 40 60 80 MOLE %o DMPE
FIGURE 3: Phase diagrams determined by calorimetry for the (A) DEPE-DEPS and (B) DMPE-DMPS systems in calcium-free buffer. Dashed lines represent the phase diagrams predicted from ideal mixing of the lipids. Phases are denoted as L (liquid crystalline) and S (gel).
( A l
O d 20 40 6 0 e0 0; 2b 40 60 8 0 MOLE % DEPS MOLE % DMPS
FIGURE 4: Enthalpies of the gel to liquid-crystalline phase transitions of PS-PE mixtures in the absence of calcium. Calorimetric traces were integrated as described in the text, and the transition enthalpies determined were then converted to molar quantitities by using the sample lipid contents determined by organic phosphorus assay. (A) Transition enthalpies for DEPE-DEPS mixtures; (B) transition en- thalpies for DMPE-DMPS mixtures.
The heat contents of the transition endotherms for various DEPE-DEPS and DMPE-DMPS mixtures in the absence of calcium are plotted as functions of lipid composition in panels A and B, respectively, of Figure 4. In all cases, the transition enthalpies of the mixtures are equal, within experimental error, to the weighted sum of the transition enthalpies of the pure components. While small differences in the enthalpies of lipid mixing in the gel and liquid-crystalline phases (on the order of at most a few hundreds of calories per mole) could be masked by the scatter of the data points, consideration of all the data points for both PE-PS mixtures gives no indication of a systematic deviation of the transition enthalpies of the mixtures from the simple linear relationship expected for the cas2 of ideal mixing (or of a constant enthalpy of mixing in both phases). These enthalpy results are thus consistent with the phase diagrams shown in Figure 3 in reflecting a fairly simple mixing behavior in the DEPE-DEPS and DMPE- DMPS systems in the absence of calcium.
Effects of Calcium on PS-PE Thermotropic Behavior. To examine the calorimetric properties of PE-PS mixtures in the presence of calcium ion, conditions were systematically es- tablished to permit proper equilibration of the samples with respect to hydration, calcium distribution, and lipid lateral distribution prior to calorimetric analysis. The sample equilibration times described under Materials and Methods are in fact considerably longer than the minimum required to produce calorimetric results almost identical with those presented below. For example, 50% DEPE-DEPS samples that were quenched rapidly from 45 to 0 O C only 5 min after
J ..... \- . 35% PS
5 0 Ole P s
65 % PS
72 5 % PS
8 0 % DEPS
_.
-
2 0 30 40 50 60 70 T ( “C)
OMPE iI A 3 5 % P S J.L. 2 . L
50% PS -...
65% PS -. .
8 0 % P S w
.- 40 50 60 70 40 50 60 70
T ( “ C i
FIGURE 5: Thermograms for (A) DEPE-DEPS and (B) DMPE- DMPS mixtures in the presence of 30 mM calcium ion. Samples were scanned from 0-5 O C up to at least 90 O C . Details of sample prep- aration and calorimetric analysis are given under Materials and Methods. Dashed lines represent base lines determined in parallel runs without lipid.
addition of calcium ion gave thermograms comparable to those shown for the same mixture (equilibrated for a considerably longer time) in Figure 5.
Representative heating thermograms for DEPE-DEPS and DMPE-DMPS mixtures in high-calcium buffer are shown in Figure 5. As the proportion of PS in each mixture is increased, the transition endotherm of the PE shifts very slightly upward with almost no broadening up to -20% PS and then broadens and shifts slightly downward while decreasing rapidly in am- plitude up to -72.5% PS. Additional small endothermic peaks are visible from -20% to 72.5% PS, while no distinct endo- thermic transitions are observed at 180% PS. Assuming that transformations of gel state and cochleate phases to a liq- uid-crystalline phase lead to appreciable heat absorption [which is reasonable, given the substantial enthalpy decrease attending formation of PS cochleate structures from liquid- crystalline PS (Portis et al., 1979; Rehfeld et al., 1982)], these

A M I N O P H O S P H O L I P I D M I X I N G A N D M E M B R A N E F U S I O N V O L . 2 3 , N O . 1 4 , 1 9 8 4 3237
T( "C
i
i C i
I ~
C
0 20 40 60 80 0 20 40 60 80
MOLE '/o DEPS MOLE % DMPS FIGURE 6: Calorimetrically determined phase diagrams for PE-PS mixtures in the presence of 30 mM calcium ion. Phases are denoted as follows: L, liquid-crystalline hydrated lipid C, dehydrated lamellar phase (cochleates); SI, a PE-rich gel-state hydrated lipid phase; SII, a relatively PS-rich gel-state hydrated lipid phase. (A) DEPE-DEPS system; (B) DMPE-DMPS system. The derivation of these phase diagrams from the calorimetric data is described in the text.
calorimetric results can be used to generate the phase diagrams shown in Figure 6A,B. To illustrate the derivations of the phase diagrams, the construction of the DEPE-DEPS phase diagram from the calorimetric data is described below.
The limits of the phase diagram are known to be (a) gel and liquid-crystalline phases of pure DEPE, interconverting at T, = 38.3 OC, and (b) dehydrated "cochleate" cylinders, exhib- iting no endothermic transitions between 0 and 90 "C, for DEPS. (The possible formation of nonlamellar phases at higher temperatures, which may be the source of the small endotherms at -55-60 OC in the 0-27.5% DEPS-containing samples, is not explicitly considered in this analysis.) The virtual invariance of the temperature of the major endothermic transition for samples containing 0-72.5% PS suggests that it represents the melting of solid phase domains of nearly pure PE. This calorimetric feature by itself might suggest that pure solid PE Coexists with ccchleate structures at low temperatures, while a liquid-crystalline phase very rich in PE coexists with the cochleates at higher temperatures up to -80 mol 5% PE. However, a second smaller endotherm is present at a constant temperature of 43 OC in PE-PS mixtures containing >20% and 4 0 % PE. To account for the presence of this endotherm, we must postulate a line of three-phase coexistence at 43 OC extending over this range of compositions. The simplest phase diagram that can incorporate this additional feature is that shown in Figure 6A. We note that this phase diagram contains the same regions of single phases and phase coexistence as do the PC-PS phase diagrams discussed in the following paper (Silvius & GagnE, 1984), for which freeze-fracture electron microscopic evidence is available to support the conclusions derived from the calorimetric experiments (van Dijck et al., 1978).
The absence of detectable heat absorption above 43 OC for samples containing coexisting liquid-crystalline and cochleate phases suggests that these phases remain virtually constant in extent with increasing temperature, Le., that the boundary lines denoted I and I1 in the phase diagram are essentially vertical. The limit of solubility of PS in liquid-crystalline PE bilayers at high calcium concentrations is thus -20 mol %. Conversely, the limit of solubility of PE in the PS-rich co- chleate phase is also -20 mol % when high levels of calcium are present.
,$? 50
a 'A
1
\ \
'4 I
20 40 60 80 20 40 60 80 MOLE '10 DEPS MOLE Yo DMPS
FIGURE 7: Integrated excess heat absorption in the temperature range 10-90 OC (normalized to the total phospholipid content) for PE-PS mixtures in the presence of 30 mM calcium ion. Details of the integration of the sample thermograms and analysis of the sample phospholipid contents are given in the text. (A) DEPE-DEPS mixtures; (B) DMPE-DMPS mixtures.
One aspect of the phase diagram shown in Figure 6A re- mains to be reconciled with the calorimetric results, namely, the fact that the peak of the major transition in samples containing - 10-20% PS lies slightly above 39 OC. As the discrepancy is small and the major transition shows a very regular diminution of amplitude with increasing PS content up to -80% PS, attempts to construct alternative phase di- agrams incorporating this slight shift in the transition peak became quite cumbersome. We suggest that mixtures con- taining low proportions of PS (<20%), which will be entirely liquid crystalline above 43 OC, have a strong tendency to form a supersaturated solid solution when cooled below 39 "C. In agreement with this suggestion, we have occasionally observed samples containing 20% PS which show the transition peak as high as 42 OC, and for such samples, a shallow exotherm (which suggests the return of a metastable state to equilibrium) invariably follows the anomalously upward-shifted transition peak. Unfortunately, attempts to facilitate the attainment of solid phase equilibrium in these samples by very slow cooling and by prolonged incubation at 20 OC (for up to 24 h) were unsuccessful.
Calorimetric traces like those shown in Figure 5 were in- tegrated to determine the total heats of transition of the PE-PS mixtures in the presence of calcium. The results of such determinations are plotted as functions of lipid composition for the DEPE-DEPS (calcium) and DMPE-DMPS (calcium) systems in Figure 7. For both systems, the total enthalpy of transition declines with increasing PS content, particularly above - 1 5 2 0 % PS, and falls off to zero at -80% PS. Assuming that the cochleate phase makes no contribution to the overall transition enthalpy and that the solid to cochleate transition enthelpy is small in these systems (Rehfeld et al., 1982), this result suggests that the proportion of lipid in co- chleate structures increases steadily over the range -20-80% PS and includes all of the lipid at >80% PS. As the enthalpies of the gel to liquid-crystalline and gel to cochleate transitions of the hydrated solid phases may vary with composition, more rigorous analysis of the data of Figure 7 is difficult. However, the transition enthalpy based estimates of the proportion of cochleate structures present at various mole fractions of PS in these two systems agree well with predictions based on the phase diagrams of Figure 7.
Fusion Studies. Studies of the fusion of PS vesicles reported to date have utilized bovine brain PS, which contains a variety of molecular species and in the absence of divalent cations exhibits a broad calorimetric transition centered at -6 O C
(Jacobson & Papahadjopoulos, 1975). We therefore examined the relationship of the fusion rate to the calcium concentration
3238 B I O C H E M I S T R Y S I L V I U S A N D G A G N E
[ C o " ] , rnM
FIGURE 8: (A) Initial rates of fusion of DOPS vesicles at 25 'C at various calcium concentrations in 200 mM NaCI, 2 mM histidine, and 2 mM Tes, pH 7.4 (0). Fusion was assayed by the vesicle contents mixing assay of Wilschut et al. (1980). (0) Fusion monitored by the vesicle wall coalescence assay of Hoekstra (1982); (A) fusion assayed by the procedure of Hoesktra with calcium ionophore A23187 (1:lOO lipids) incorporated in the vesicle membranes. The concentration of phospholipid was 40 fiM in all fusion assays. (B) Initial rates of fusion of DOPS, DEPS, and DMPS vesicles at 45 'C when calcium is added to varying concentrations in the same buffer as described for (A). Fusion was assayed by the procedure of Hoekstra (1982). (0) DOPS vesicles; (A) DEPS vesicles; (0) DMPS vesicles. Phospholipid concentration = 40 fiM.
for vesicles of pure DOPS, DEPS, and DMPS to compare with previous results for bovine brain PS and to assess the effect of varying the acyl chain composition of PS on its fusing ability. Representative data for vesicles composed of pure DOPS at 25 "C are shown in Figure 8A, where the rate of vesicle fusion as assayed by both the contents-mixing and the resonance energy transfer methods is plotted vs. the calcium concentration. The results of the two assays are in excellent agreement, showing detectable fusion to begin at - 1 .O mM calcium. From this liftoff concentration of calcium, the rate of fusion increases progressively more steeply with increasing calcium levels to - 1.6 mM, above which point the fusion rate rises linearly with calcium concentration. Extrapolation of this linear portion of the rate vs. calcium concentration curve to zero rate gives the "threshold" concentration as defined by other workers [see, e.g., Wilschut et al. (1980) and Bentz et al. (1983)], which for DOPS at 25 "C is 1.4 mM. Addition of the calcium ionophore A23187 to the vesicle lipids at a molar ratio of 1:lOO (moles per mole of lipid) changes the relationship of fusion rate to calcium concentration to that shown by the open triangles in Figure 8A. The rate of fusion is moderately enhanced by the ionophore at all calcium con- centrations above the liftoff level, which has become essentially equivalent to the threshold level.
The calcium concentration at which vesicle fusion is first observed (- 1 .O mM in the case of the DOPS large unilamellar vesicles) appears to be a more fundamental parameter in a thermodynamic sense than is the threshold concentration determined by extrapolation of the steep phase of the fusion rate vs. calcium concentration curve. As noted above, the liftoff calcium concentrations for D E S (1 .O mM) and DMPS (0.8 mM) correspond to the calcium concentrations at which the lipid gel to liquid-crystalline phase transition disappears entirely.
In Figure 8B, the fusion rate is plotted vs. calcium con- centration for DOPS, DEPS, and DMPS vesicles at temper- atures well above the phase transition temperatures of the PS sodium salts. The fusion threshold and liftoff concentrations, defined as discussed above, are similar for DOPS, DEPS, and
X I
E lJ
I / / , ~ -I dy ~
oL . - .L&2L 0' '. ' L 1 I O 2 0 3 0 I O 2 0 3 0
[ C o 2 ' ] , rnM
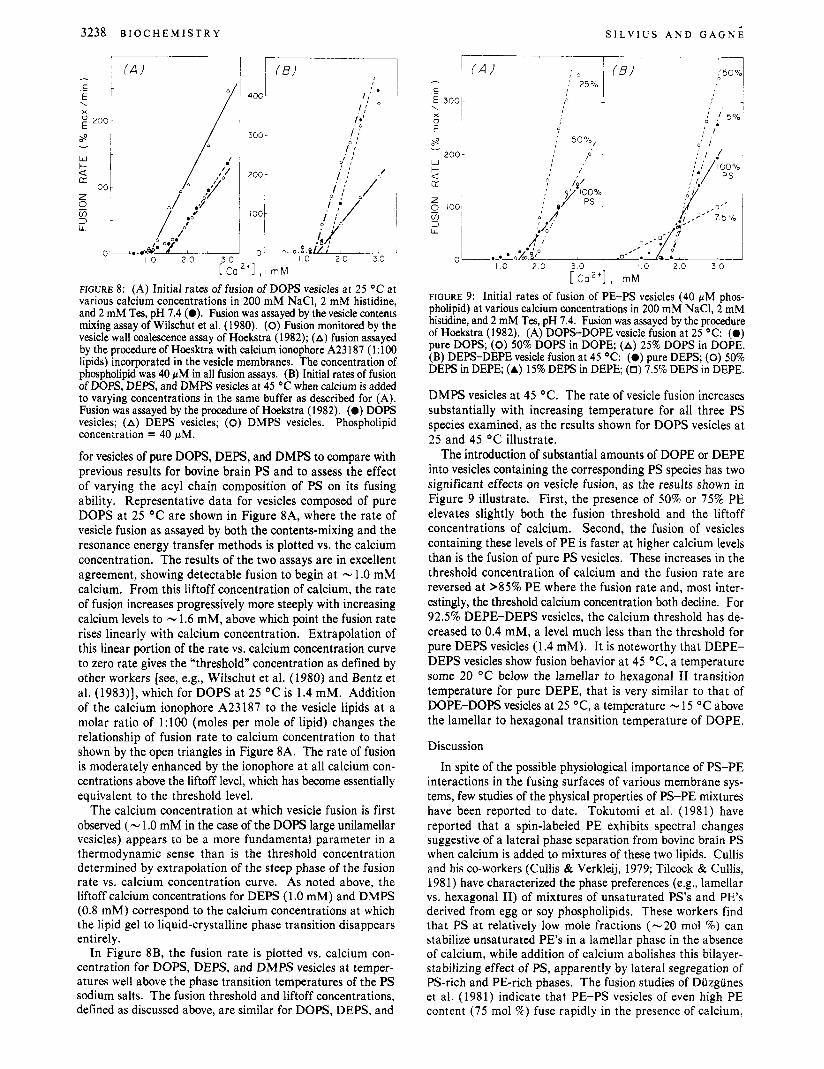
FIGURE 9: Initial rates of fusion of PE-PS vesicles (40 fiM phos- pholipid) at various calcium concentrations in 200 mM NaC1, 2 mM histidine, and 2 mM Tes, pH 7.4. Fusion was assayed by the procedure of Hoekstra (1982). (A) DOPS-DOPE vesicle fusion at 25 "C: (0) pure DOPS; (0) 50% DOPS in DOPE (A) 25% DOPS in DOPE. (B) DEPS-DEPE vesicle fusion at 45 'C: (0) pure DEPS; (0) 50% DEPS in DEPE (A) 15% DEPS in DEPE (0) 7.5% DEPS in DEPE.
DMPS vesicles at 45 "C. The rate of vesicle fusion increases substantially with increasing temperature for all three PS species examined, as the results shown for DOPS vesicles at 25 and 45 O C illustrate.
The introduction of substantial amounts of DOPE or DEPE into vesicles containing the corresponding PS species has two significant effects on vesicle fusion, as the results shown in Figure 9 illustrate. First, the presence of 50% or 75% PE elevates slightly both the fusion threshold and the liftoff concentrations of calcium. Second, the fusion of vesicles containing these levels of PE is faster at higher calcium levels than is the fusion of pure PS vesicles. These increases in the threshold concentration of calcium and the fusion rate are reversed at >85% PE where the fusion rate and, most inter- estingly, the threshold calcium concentration both decline. For 92.5% DEPE-DEPS vesicles, the calcium threshold has de- creased to 0.4 mM, a level much less than the threshold for pure DEPS vesicles (1.4 mM). It is noteworthy that DEPE- DEPS vesicles show fusion behavior at 45 OC, a temperature some 20 "C below the lamellar to hexagonal I1 transition temperature for pure DEPE, that is very similar to that of DOPE-DOPS vesicles at 25 "C, a temperature - 15 "C above the lamellar to hexagonal transition temperature of DOPE.
Discussion In spite of the possible physiological importance of PS-PE
interactions in the fusing surfaces of various membrane sys- tems, few studies of the physical properties of PS-PE mixtures have been reported to date. Tokutomi et al. (1981) have reported that a spin-labeled PE exhibits spectral changes suggestive of a lateral phase separation from bovine brain PS when calcium is added to mixtures of these two lipids. Cullis and his co-workers (Cullis & Verkleij, 1979; Tilcock & Cullis, 198 1) have characterized the phase preferences (e.g., lamellar vs. hexagonal 11) of mixtures of unsaturated PS's and PE's derived from egg or soy phospholipids. These workers find that PS at relatively low mole fractions (-20 mol %) can stabilize unsaturated PE's in a lamellar phase in the absence of calcium, while addition of calcium abolishes this bilayer- stabilizing effect of PS, apparently by lateral segregation of PS-rich and PE-rich phases. The fusion studies of Duzgiines et al. (1981) indicate that PE-PS vesicles of even high PE content (75 mol %) fuse rapidly in the presence of calcium,

A M I N O P H O S P H O L I P I D M I X I N G A N D M E M B R A N E F U S I O N V O L . 2 3 , N O . 1 4 , 1 9 8 4 3239
in striking contrast to the behavior of vesicles in which PS is mixed with PC, a lipid that strongly antagonizes the fusion- promoting activity of PS.
Taken together, the observations just described could be taken to support the concept that PE supports the fusion of PS-containing vesicles by readily phase separating in the presence of calcium, allowing fusion to proceed through PS- rich domains. However, the investigations of Sundler et al. (198 1) and Duzgiines et al. (198 1) have also produced exam- ples of mixtures of PE with anionic lipids that allow fusion under conditions where vesicles containing the anionic species alone do not. These results strongly suggest that at least in these cases, PE is a significant component of the microscopic regions of the membrane surface that are directly involved in the fusion process. Therefore, the question of the relative significance of lateral phase separations vs. an intrinsic “fusion-supporting” ability of PE in the calcium-triggered fusion of biological membranes has remained an open one. In this study, we have compared the mixing and the fusion be- havior of PE-PS model systems (lipid vesicles) in an effort to assess the possible importance of lateral phase separations in the calcium-triggered fusion of membranes that are rich in these lipids.
It was essential for these studies that pure lipid preparations of homogeneous fatty acyl composition be used, and we therefore generated homogeneous PS species whose fusion behavior has not previously been characterized. Using dioleoyl, dielaidoyl, and dimyristoyl phospholipid species, we have found that the fusion of liquid-crystalline PS and PS-PE vesicles is not strongly affected by the nature of the lipid acyl chains. [The results of Sklar et al. (1979) with retinal rod outer segment PS, and of Tilcock & Cullis (1981), may indicate, however, that highly polyunsaturated PS species are more refractory to calcium-induced fusion.] The fusion of PS- containing vesicles was also found to increase steadily with increasing temperature, in contrast to the results of Sun et al. (1978), who suggested that the rate of fusion is maximal at the phase transition temperature of the PS component. Therefore, it appears that the rate of fusion of PS-containing vesicles has little if any dependence on the proximity of the experimental temperature to the transition temperature of the PS component, so long as the vesicle lipids are in a liquid- crystalline state.
To relate the phase diagrams shown in Figure 6 for PE-PS (calcium) systems to the fusion of liquid-crystalline PE-PS vesicles, it is important to identify the lipid compositions that mark the limits of the region of coexistence of liquid-crystalline (PE-rich) and cochleate (PS-rich) phases in the presence of calcium. As discussed under Results, these limits appear to lie at -20% PE in the PS cochleate phase and 1 5 2 0 % PS in the liquid-crystalline phase of PE. The rough equivalence of the solubilities of PE in PS-rich cochleates and of PS in the PE-rich hydrated bilayer phase may explain why some previous studies, in which the proportions of cochleate and liquid- crystalline phases were determined in the presence of calcium for roughly equimolar PE-PS mixtures (Tokutomi et al., 1981; Tilcock & Cullis, 1981), have concluded that compositional segregation in such mixtures was absolute. In fact, the data reported can be explained equally well by the assumption of roughly equal solubilities of PE in PS (cochleate), and of PS in PE (liquid-crystalline) phases, as our data would indicate.
Perhaps the most significant consequence of our finding of a finite solubility of PS in liquid-crystalline PE in the presence of calcium is that the fusion of vesicles that are very rich in PE clearly can occur without lateral separation of a PS-en-
riched phase. This is most clear for the case of vesicles con- taining only 7.5% DEPS in DEPE, where the threshold con- centration of calcium for fusion is much less that that for any of the more PS-rich mixtures examined. This result is possible only if fusion is occurring between PE-rich areas of the vesicle surface and not between hypothetical phase-segregated PS-rich domains. We do not find, as Dugzunes et al. (1981) reported for mixtures of bovine brain PS and PE derived from egg PC, that the efficiency of fusion decreases with increasing PE content in DOPE-DOPS or DEPE-DEPS vesicles. Instead, the efficiency of fusion shows a substantial increase up to -75% PE, after which point it begins to decline. However, as just noted, the decreased efficiency of fusion at high PE contents is accompanied by a decreased threshold calcium concentration. The PS content of a PE-rich membrane thus seems to influence fusion in two opposing ways. First, in- creasing PS content enhances the rate of fusion at higher calcium levels, probably by increasing the number of inter- bilayer PS-Ca-PS contacts that bring the bilayers into close apposition and that may well serve as nucleating sites for the lipid rearrangements involved in the fusion process. Second, however, increasing amounts of PS in a PE-rich bilayer will increase the surface charge, thereby increasing the fraction of PS that must be charge neutralized by calcium binding before the surface charge is reduced sufficiently to allow the vesicle surfaces to come into close proximity (Ohki et al., 1982). This effect will be manifested as a requirement for higher calcium concentrations to induce fusion in vesicles of higher PS content, as is observed experimentally.
These results indicate that the fusion-supporting properties of PE play an important role in the calcium-induced fusion of membranes of low PS content, in accord with the results previously reported by Dugzunes et al. (1981) for Mgz+-in- duced fusion of PS-PE membranes and by Sundler et al. (198 1) for phosphatidylinositol-PE vesicle fusion. A PE-rich phase containing even low levels of PS is itself clearly “fusion competent” with no requirement for separation of a PS-rich phase. Factors that promote interbilayer contacts or surface charge reduction have previously been shown to potentiate strongly the effects of calcium in inducing the fusion of PE-PS vesicles (Duzgiines et al., 1981; Hong et al., 1981). This result would not be expected if calcium was additionally required to trigger lateral phase separations in such vesicles before fusion could occur. The fast rates and low calcium thresholds associated with such in vivo fusion events as exocytosis (Reichart & Kelly, 1983) may therefore not indicate any fundamental differences in the behavior of the lipid phase when lipid vesicle fusion and biological membrane fusion are com- pared. Instead, the relatively high calcium threshold and low efficiency that characterize the fusion of pure lipid (PE-PS) vesicles may reflect a need for high levels of calcium to pro- mote interbilayer contacts and neutralize surface charges, functions that can be performed by other cellular constituents in vivo. With these functions accomplished, the specific re- arrangements of the lipid phase that accompany the fusion of PE-PS-rich vesicles and membranes may require much lower calcium levels, comparable to those that would occur in vivo, without any need for additional factors to influence the local composition or physical state of the lipid phase.
Acknowledgments We thank Adel Youakim and Mary Louise McNaughton
for their early contributions to the development of the chemical syntheses used in this study.
Registry No. DEPC, 56782-46-8; DEPE, 19805-1 8-6; DEPS, 63976-14-7; DMPC, 18 194-24-6; DMPE, 998-07-2; DMPS, 64023-

3240 B I 0 C H E M I S T R Y S I L V I U S A N D G A G N E
32-1; DOPS, 70614-14-1; DOPE, 4004-05-1; calcium, 7440-70-2; glycerol 3-phosphate, 57-03-4.
References
Bentz, J., Diizgiines, N., & Nir, S. (1983) Biochemistry 22, 3320.
Cevc, G., Watts, A., & Marsh, D. (1981) Biochemistry 20, 4955.
Comfurius, P., & Zwaal, R. F. A. (1977) Biochim. Biophys. Acta 488, 36.
Cullis, P. R., & Verkleij, A. J. (1979) Biochim. Biophys. Acta 552, 546.
Davidson, F. M., & Long, C. (1958) Biochem. J . 69, 458. Deutsch, J. W., & Kelly, R. B. (1981) Biochemistry 20, 378. Diehl, H., & Ellingboe, J. L. (1956) Anal. Chem. 28, 882. Duzgiines, N., Wilschut, J., Fraley, R., & Papahadjopoulos,
Folch, J., Lees, M., & Stanley, G. H. (1957) J . Biol. Chem.
Gupta, C. M., Radhakrishnan, R., & Khorana, H. G. (1977)
Hauser, H., & Shipley, G. G. (1 983) Biochemistry 22, 2 17 1. Hauser, H., Finer, E. G., & Darke, A. (1977) Biochem.
Hermetter, A,, Paltauf, F., & Hauser, H. (1982) Chem. Phys.
Hoekstra, D. (1982) Biochemistry 21, 2833. Hong, K., Diizgiines, N., & Papahadjopoulos, D. (1981) J .
Hui, S. W., Boni, L. T., Stewart, T. P., & Isac, T. (1983)
Jackson, M. B., & Sturtevant, J. M. (1977) J . Biol. Chem.
Jacobson, K., & Papahadjopoulos, D. (1975) Biochemistry
Lowry, R. J., & Tinsley, I. J. (1974) Lipids 9 , 491. Mabrey, S. J., & Sturtevant, J. M. (1976) Proc. Natl. Acad.
Miller, C., & Racker, E. (1976) J . Membr. Biol. 26, 319. Ohki, S., Diizgiines, N., & Leonards, K. (1982) Biochemistry
Ohnishi, S., & Ito, T. (1974) Biochemistry 13, 881. Op den Kamp, J. A. F. (1979) Annu. Rev. Biochem. 48,47. Papahadjopoulos, D., Vail, W. J., Newton, C., Nir, S . , Ja-
cobson, K., Poste, G., & Lazo, R. (1 977) Biochim. Biophys.
D. (1981) Biochim. Biophys. Acta 642, 182.
226, 497.
Proc. Natl. Acad. Sci. U.S.A. 74, 4315.
Biophys. Res. Commun. 76, 267.
Lipids 30, 35.
Biol. Chem. 256, 3641.
Biochemistry 22, 35 1 1.
252, 4749.
14, 152.
Sci. U.S.A. 73, 3862.
21, 2127.
Acta 465, 579. Papahadjopoulos, D., Poste, G., & Vail, W. J. (1979) Methods
Membr. Biol. 10, 1-121. Patel, K. M., Morrisett, J. D., & Sparrow, J . T. (1979) J .
Lipid Res. 20, 674. Portis, A., Newton, C., Pangborn, W., & Papahadjopoulos,
D. (1979) Biochemistry 18, 780-790. Puskin, J. S., & Martin, T. (1979) Biochim. Biophys. Acta
552, 53. Rehfeld, S . J., Hansen, L. D., Lewis, E. A., & Eatough, D.
J. (1982) Biochim. Biophys. Acta 691, 1. Reichart, L. F., & Kelly, R. B. (1983) Annu. Rev. Biochem.
52, 871. Rothman, J. E., & Lenard, J. (1975) Science (Washington,
D.C.) 195, 743. Silvius, J . R. (1982) in Lipid-Protein Interactions (Jost, P.,
& Griffith, 0. H., Eds.) pp 239-281, Wiley, New York. Silvius, J. R., & Gagni, J. (1984) Biochemistry (following
paper in this issue). Singleton, W. S. , Gray, M. S. , Brown, M. L., & White, J. L.
(1965) J . Am. Oil Chem. SOC. 42, 53. Sklar, L. A., Miljanich, G. P., & Dratz, E. A. (1979) J . Biol.
Chem. 254, 9592. Struck, D. K., Hoekstra, D., & Pagano, R. E. (1981) Bio-
chemistry 20, 4093. Sun, S., Day, E. P., & Ho, J. T. (1978) Proc. Natl. Acad. Sci.
U.S.A. 75, 4325. Sundler, R., & Papahadjopoulos, D. (1981) Biochim. Biophys.
Acta 649, 743. Sundler, R., Diizgiines, N., & Papahadjopoulos, D. (1981)
Biochim. Biophys. Acta 649, 751. Tilcock, C. P. S . , & Cullis, P. R. (1981) Biochim. Biophys.
Acta 641, 189. Tilcock, C. P. S . , & Cullis, P. R. (1982) Biochim. Biophys.
Acta 643, 2 12. Tokutomi, S., Lew, R., & Ohnishi, S. (1981) Biochim. Bio-
phys. Acta 643, 276. van Dijck, P. W. M., de Kruijff, B., Verkleij, A. J., van
Deenen, L. L. M., & de Gier, J. (1978) Biochim. Biophys. Acta 512, 84.
Wilschut, J., Diizgiines, N., Fraley, R., & Papahadjopoulos, D. (1980) Biochemistry 19, 601 1.
Yang, R. D., Patel, K. M., Pownall, H. J., Knapp, R. D., Sklar, L. A., Crawford, R. B., & Morrisett, J. D. (1979) J . Biol. Chem. 254, 8256.