linux observability superpowers · linux observability superpowers sthima. customer why is my...
TRANSCRIPT
Matheus Marchini@mmarkini
Linux Observability Superpowers
sthima

Customer
Why is my application running so slow?
You

Customer
I don’t know. Let me check and get back to you.
You

Check monitoring

If you find the problem

Customer
We found and fixed the problem.
You

Customer
You’re the best! Thank you
You

If you don’t find the problem

Customer
I have no idea…
You

Customer
Ok then, I’m switching to Acme.
You

The Knowns
•Known-knowns
•things you know exist and you already checked
•Known-unknowns
•things you know exist but you haven’t checked yet
•Unknown-unknowns
•things you don’t know exist or are not aware they are important

The Knowns examples
•Known-knowns
•CPU usage is 10%
•Known-unknowns
•Have’t checked packages latency yet
•Unknown-unknowns
•Don’t know device interrupts could be heavy CPU consumers, therefore haven’t checked it yet

USE Method
•Utilization
•Saturation
•Errors

60 seconds performance analysis
•uptime
•dmesg | tail
•vmstat 1
•mpstat -P ALL 1
•pidstat 1
•iostat -xz 1
•free -m
•sar -n DEV 1
•sar -n TCP,ETCP 1
•top
https://medium.com/netflix-techblog/linux-performance-analysis-in-60-000-milliseconds-accc10403c55


"it’s a measure of how well
internal states of a system can
be inferred from knowledge of
its external outputs. So in
contrast to monitoring which is
something we actually do,
observability (as a noun), is
more a property of a system.”
Observability
https://thenewstack.io/monitoring-and-observability-whats-the-difference-and-why-does-it-matter/


If high-level metrics aren’t enough, drill-down the offending
resource

Drill-down analysis
•Generates a lot of data
•Hard to consume
•Aggregate and/or filter data for better visualization

FlameGraphs
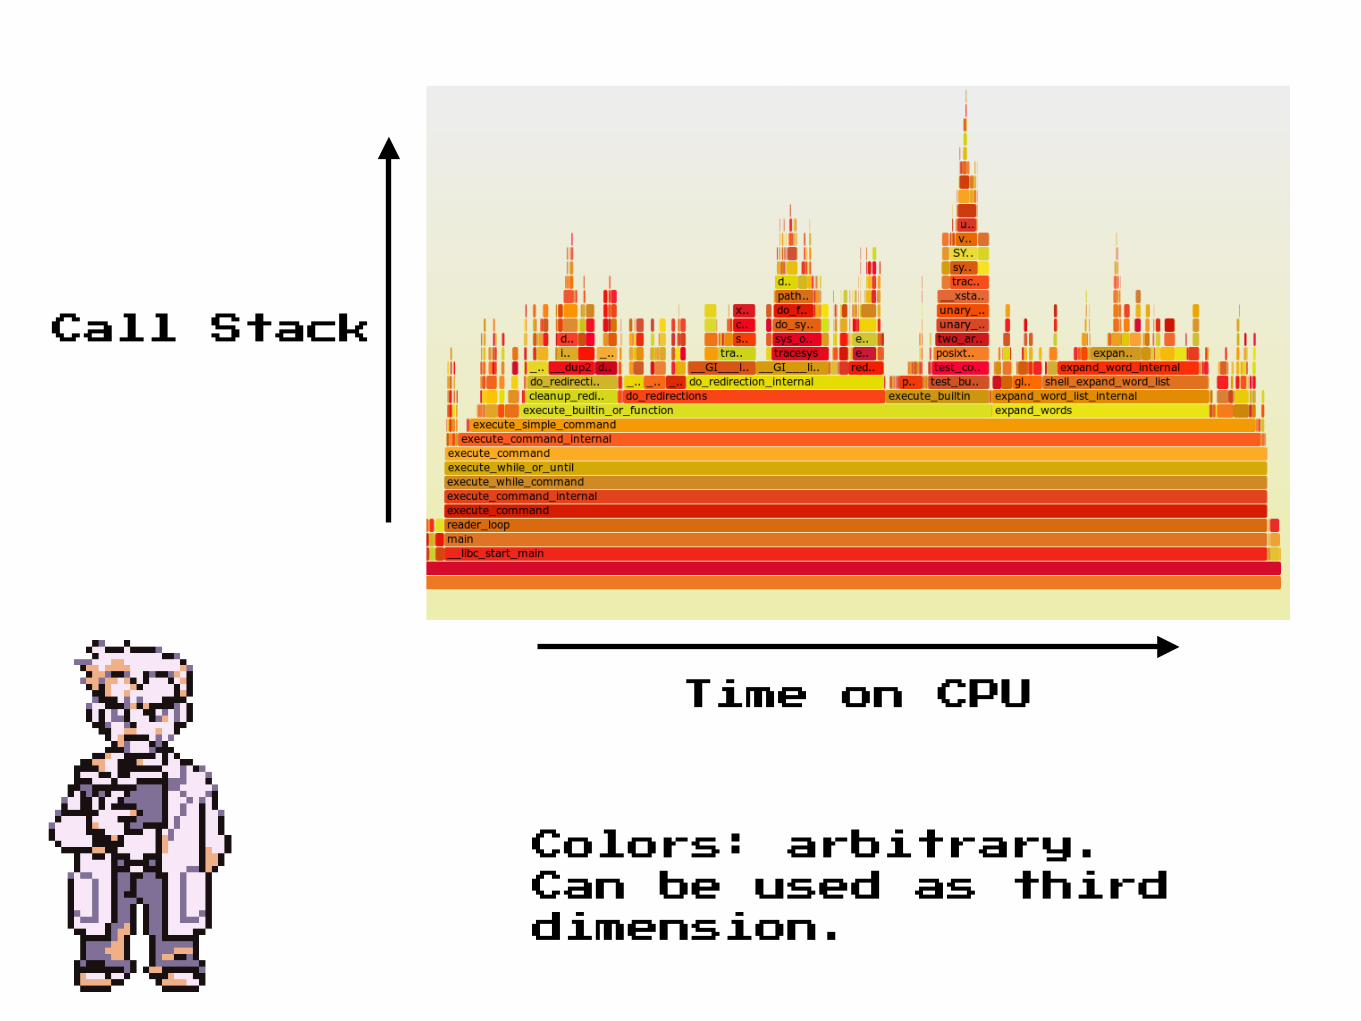
Call Stack
Time on CPU
Colors: arbitrary. Can be used as third dimension.

FlameGraphs visualization tools
•brendangregg/FlameGraph
•Netflix/flamescope
•npm install flamegraph
•Chrome DevTools
•etc…

What about sampling?
•Linux perf
•Runtime specific profilers
•For example: V8 CpuProfiler

FlameGraphs: not only for CPU time
•Cycles per Instruction (CPI)
•Off-CPU time
•Waiting for I/O, mutex lock, etc.
•Off-Wake time
•Memory usage

FlameGraphs
•CPU time
•CPI
•Off-CPU time
•Wakeup time
•Off-Wake
•Memory usage
Wasn’t possible or practical before

Berkeley Packet Filter
•Kernel-space Virtual Machine
•Versatile
•Performant
•Safe

“crazy stuff”Alexei Starovoitov,
BPF: what is it used for?
BPF: Versatile
•Write Kernel-space programs without touching Kernel code

BPF: Performance
•Simple assembly instruction set
•Usually maps 1-1 to x64
•Runs in Kernel-space
•Validator guarantees BPF program simplicity

BPF: Safety
•Validator guarantees:
•Only read from initialized memory
•Including offsets in some cases
•No direct memory access outside the VM
•No loops, max instructions, etc.
•No destructive operations
•For example: can’t kill a process from a BPF program


Writing BPF programs
0: (bf) r6 = r1 1: (b7) r1 = 0 2: (7b) *(u64 *)(r10 -32) = r1 3: (7b) *(u64 *)(r10 -40) = r1 4: (bf) r3 = r6 5: (07) r3 += 8 6: (bf) r1 = r10 7: (07) r1 += -8 8: (b7) r2 = 4 9: (85) call bpf_probe_read#4 10: (61) r1 = *(u32 *)(r10 -8) 11: (63) *(u32 *)(r10 -32) = r1

The IO Visor Project is an open source project and a community of developers to accelerate the innovation, development, and sharing of virtualized in-kernel IO services for tracing, analytics, monitoring, security and networking functions.

BPF Compiler Collection: BCC
https://github.com/iovisor/bcc

BCC Python Example# load BPF program b = BPF(text=""" TRACEPOINT_PROBE(random, urandom_read) { bpf_trace_printk("%d\\n", args->got_bits); return 0; } """)
# format output while 1: try: (task, pid, cpu, flags, ts, msg) = b.trace_fields() except ValueError: continue print("%-18.9f %-16s %-6d %s" % (ts, task, pid, msg))

BCC tools• tools/argdist: Display function parameter values as a histogram or frequency count. Examples.• tools/bashreadline: Print entered bash commands system wide. Examples.• tools/biolatency: Summarize block device I/O latency as a histogram. Examples.• tools/biotop: Top for disks: Summarize block device I/O by process. Examples.• tools/biosnoop: Trace block device I/O with PID and latency. Examples.• tools/bitesize: Show per process I/O size histogram. Examples.• tools/bpflist: Display processes with active BPF programs and maps. Examples.• tools/btrfsdist: Summarize btrfs operation latency distribution as a histogram. Examples.• tools/btrfsslower: Trace slow btrfs operations. Examples.• tools/capable: Trace security capability checks. Examples.• tools/cachestat: Trace page cache hit/miss ratio. Examples.• tools/cachetop: Trace page cache hit/miss ratio by processes. Examples.• tools/cpudist: Summarize on- and off-CPU time per task as a histogram. Examples• tools/cpuunclaimed: Sample CPU run queues and calculate unclaimed idle CPU. Examples• tools/criticalstat: Trace and report long atomic critical sections in the kernel. Examples• tools/dbslower: Trace MySQL/PostgreSQL queries slower than a threshold. Examples.• tools/dbstat: Summarize MySQL/PostgreSQL query latency as a histogram. Examples.• tools/dcsnoop: Trace directory entry cache (dcache) lookups. Examples.• tools/dcstat: Directory entry cache (dcache) stats. Examples.• tools/deadlock_detector: Detect potential deadlocks on a running process. Examples.• tools/execsnoop: Trace new processes via exec() syscalls. Examples.• tools/ext4dist: Summarize ext4 operation latency distribution as a histogram. Examples.• tools/ext4slower: Trace slow ext4 operations. Examples.• tools/filelife: Trace the lifespan of short-lived files. Examples.• tools/fileslower: Trace slow synchronous file reads and writes. Examples.• tools/filetop: File reads and writes by filename and process. Top for files. Examples.• tools/funccount: Count kernel function calls. Examples.• tools/funclatency: Time functions and show their latency distribution. Examples.• tools/funcslower: Trace slow kernel or user function calls. Examples.• tools/gethostlatency: Show latency for getaddrinfo/gethostbyname[2] calls. Examples.• tools/hardirqs: Measure hard IRQ (hard interrupt) event time. Examples.• tools/inject: Targeted error injection with call chain and predicates Examples.• tools/killsnoop: Trace signals issued by the kill() syscall. Examples.• tools/llcstat: Summarize CPU cache references and misses by process. Examples.• tools/mdflush: Trace md flush events. Examples.• tools/mysqld_qslower: Trace MySQL server queries slower than a threshold. Examples.• tools/memleak: Display outstanding memory allocations to find memory leaks. Examples.• tools/nfsslower: Trace slow NFS operations. Examples.• tools/nfsdist: Summarize NFS operation latency distribution as a histogram. Examples.• tools/offcputime: Summarize off-CPU time by kernel stack trace. Examples.• tools/offwaketime: Summarize blocked time by kernel off-CPU stack and waker stack. Examples.• tools/oomkill: Trace the out-of-memory (OOM) killer. Examples.
• tools/opensnoop: Trace open() syscalls. Examples.• tools/pidpersec: Count new processes (via fork). Examples.• tools/profile: Profile CPU usage by sampling stack traces at a timed interval. Examples.• tools/reset-trace: Reset the state of tracing. Maintenance tool only. Examples.• tools/runqlat: Run queue (scheduler) latency as a histogram. Examples.• tools/runqlen: Run queue length as a histogram. Examples.• tools/runqslower: Trace long process scheduling delays. Examples.• tools/shmsnoop: Trace System V shared memory syscalls. Examples.• tools/sofdsnoop: Trace FDs passed through unix sockets. Examples.• tools/slabratetop: Kernel SLAB/SLUB memory cache allocation rate top. Examples.• tools/softirqs: Measure soft IRQ (soft interrupt) event time. Examples.• tools/solisten: Trace TCP socket listen. Examples.• tools/sslsniff: Sniff OpenSSL written and readed data. Examples.• tools/stackcount: Count kernel function calls and their stack traces. Examples.• tools/syncsnoop: Trace sync() syscall. Examples.• tools/syscount: Summarize syscall counts and latencies. Examples.• tools/tcpaccept: Trace TCP passive connections (accept()). Examples.• tools/tcpconnect: Trace TCP active connections (connect()). Examples.• tools/tcpconnlat: Trace TCP active connection latency (connect()). Examples.• tools/tcpdrop: Trace kernel-based TCP packet drops with details. Examples.• tools/tcplife: Trace TCP sessions and summarize lifespan. Examples.• tools/tcpretrans: Trace TCP retransmits and TLPs. Examples.• tools/tcpstates: Trace TCP session state changes with durations. Examples.• tools/tcpsubnet: Summarize and aggregate TCP send by subnet. Examples.• tools/tcptop: Summarize TCP send/recv throughput by host. Top for TCP. Examples.• tools/tcptracer: Trace TCP established connections (connect(), accept(), close()). Examples.• tools/tplist: Display kernel tracepoints or USDT probes and their formats. Examples.• tools/trace: Trace arbitrary functions, with filters. Examples.• tools/ttysnoop: Watch live output from a tty or pts device. Examples.• tools/ucalls: Summarize method calls or Linux syscalls in high-level languages. Examples.• tools/uflow: Print a method flow graph in high-level languages. Examples.• tools/ugc: Trace garbage collection events in high-level languages. Examples.• tools/uobjnew: Summarize object allocation events by object type and number of bytes allocated. Examples.• tools/ustat: Collect events such as GCs, thread creations, object allocations, exceptions and more in high-level languages. Examples.• tools/uthreads: Trace thread creation events in Java and raw pthreads. Examples.• tools/vfscount tools/vfscount.c: Count VFS calls. Examples.• tools/vfsstat tools/vfsstat.c: Count some VFS calls, with column output. Examples.• tools/wakeuptime: Summarize sleep to wakeup time by waker kernel stack. Examples.• tools/xfsdist: Summarize XFS operation latency distribution as a histogram. Examples.• tools/xfsslower: Trace slow XFS operations. Examples.• tools/zfsdist: Summarize ZFS operation latency distribution as a histogram. Examples.• tools/zfsslower: Trace slow ZFS operations. Examples.
100+ tools


bpftrace: high-level tracing language
# Files opened by process bpftrace -e 'tracepoint:syscalls:sys_enter_open { printf("%s %s\n", comm, str(args->filename)); }'
# Syscall count by syscall bpftrace -e 'tracepoint:syscalls:sys_enter_* { @[probe] = count(); }'
# Syscall count by process bpftrace -e 'tracepoint:raw_syscalls:sys_enter { @[pid, comm] = count(); }'
# Read size distribution by process: bpftrace -e 'tracepoint:syscalls:sys_exit_read { @[comm] = hist(args->ret); }'
# Disk size by process bpftrace -e 'tracepoint:block:block_rq_issue { printf("%d %s %d\n", pid, comm, args->bytes); }'
# Pages paged in by process bpftrace -e 'software:major-faults:1 { @[comm] = count(); }'
# Page faults by process bpftrace -e 'software:faults:1 { @[comm] = count(); }'


What else can we do with BPF?


Who is using BPF?

Can I run it anywhere?
•Nope
•Kernel version matters
•Architecture also matters

How can I leverage BPF?
•Use existing project powered by BPF
•Observability: bcc tools, bpftrace
•Load balancer: Katran
•What about GUI?
•Early stages, no tools available
•Help us write some :D

Questions?