linking the poor to opportunity: the microenterprise
TRANSCRIPT
Linking the Poor to Opportunity:
The Microenterprise Development Initiative
Microenterprise Results Reporting for 2001Report
The USAID microenterprise web site,
www.USAIDMicro.org, contains the latest
microenterprise research and reports, and
links to other informative web sites.
Produced by Weidemann Associates, Inc.
under the USAID-funded MicroServe
Indefinite Quantity Contract Numbers:
PCE-0406-I-00-6012-00, PCE-I-00-96-90012-00
and USAID Contract No. PCE-I-00-98-00012-00,
Task Order No. 06, with the Barents Group
of KPMG Consulting, LLC under Subcontract
No. AID-99-I-00012-000-0029, Technical
Assistance Order #3
By
Weidemann Associates, Inc.
933 North Kenmore Street, Suite 405
Arlington, Virginia 22201 USA
Tel: 703-522-3075 Fax: 703-525-6169
Email: [email protected]
Internet: www.weidemann.org.
December 2002
Cover photo courtesy of Geoffrey Chalmers
U. S. AG E N C Y F O R I N T E R N AT I O N A L D E V E L O P M E N TFor more information, contact
U.S. Agency for International Development
Washington, DC 20523-1000
Telephone: 202-712-4810
www.usaid.gov

The cover features a client of Pro Mujer Peru. With USAID
funding, Pro Mujer International opened a third country
program in Puno, Peru, successfully transferring credit and
training methodology, policies and procedures, and lessons
learned in Bolivia and Nicaragua to Pro Mujer Peru.
The Peru program has been a model start-up program for
Pro Mujer, demonstrating efficiency in the preliminary
start-up process, quality of services to its clients,
responsible growth in portfolio, and a clear vision for the
future of the program. The program started in April 2000
and has surpassed its first year targets. As of December
2001 they had 9,985 loans outstanding totaling $685,161.
Photograph: Geoffrey Chalmers

March 2003
Ph
oto
by
Ro
han
na
Mer
ten
s fo
r A
CC
ION
.
Fatouma Djibril Issifou, a client of PADME in Benin, used her loan to buy vegetablesin bulk.
Linking the Poor to Opportunity:
The Microenterprise Development Initiative
Microenterprise Results Reporting for 2001Report
U. S. AG E N C Y F O R I N T E R N AT I O N A L D E V E L O P M E N T

USAID Microserve Indefinite Quantity Contract Numbers: PCE-0406-I-00-60120-00, PCE-I-00-96-90012-00, Delivery Order #5, Microenterprise Results Reporting; and,
USAID Contract No. PCE-I-00-908-00012-00, Task Order # 06, with the Barents Group ofKPMG, LLC, Under Subcontract No. AID-99-I-00012-000-0029, Technical Assistance Order #3
Submitted by Weidemann Associates, Inc.To USAID/Bureau for Economic Growth, Agriculture, and Trade/
Office of Poverty Reduction/Microenterprise Development Division (USAID/EGAT/MD)
By Catherine Neill, Weidemann Associates, Inc. under the direction ofKatharine McKee, Director USAID/EGAT/MD, with assistance from
Mark Engman and Geoffrey Chalmers.

LINKING THE POOR TO OPPORTUNITY III
CONTENTS
Acronyms. . . . . . . . . . . . . . . . . . . . . . . . . . . . . . . . . . . . . . . . . . . . . . . . . . . . . . . . . . . . . . . . . . . . v
Executive Summary. . . . . . . . . . . . . . . . . . . . . . . . . . . . . . . . . . . . . . . . . . . . . . . . . . . . . . . . . . . . 1
Linking the Poor to Opportunity . . . . . . . . . . . . . . . . . . . . . . . . . . . . . . . . . . . . . . . . . . . . . . . . . 4
USAID’s Microenterprise Development Strategy – The New Challenges. . . . . . . . . . . . . . . . . . 7
The Three Pillars of USAID’s Microenterprise Development Support . . . . . . . . . . . . . . . . . . . . 8
Microfinance. . . . . . . . . . . . . . . . . . . . . . . . . . . . . . . . . . . . . . . . . . . . . . . . . . . . . . . . . . . . . . 8
How Does USAID Support Microfinance? . . . . . . . . . . . . . . . . . . . . . . . . . . . . . . . . . . . 8
By Scaling Up Microfinance Programs . . . . . . . . . . . . . . . . . . . . . . . . . . . . . . . . . . . . . . 9
By Reaching Out to Poorer, Hard-to-Reach Clients . . . . . . . . . . . . . . . . . . . . . . . . . . . 11
By Improving the Quality of Services. . . . . . . . . . . . . . . . . . . . . . . . . . . . . . . . . . . . . . . 14
By Achieving Sustainable Impacts . . . . . . . . . . . . . . . . . . . . . . . . . . . . . . . . . . . . . . . . . 14
Business Development Services . . . . . . . . . . . . . . . . . . . . . . . . . . . . . . . . . . . . . . . . . . . . . . 15
How Does USAID Support BDS? . . . . . . . . . . . . . . . . . . . . . . . . . . . . . . . . . . . . . . . . . 15
By Supporting Services that Boost Microenterprise Income . . . . . . . . . . . . . . . . . . . . . 16
By Supporting Appropriate Services for Poorer Clients. . . . . . . . . . . . . . . . . . . . . . . . . 17
By Supporting Sustainable and Competitive Markets . . . . . . . . . . . . . . . . . . . . . . . . . . 18
Creating an Enabling Environment for Microenterprises . . . . . . . . . . . . . . . . . . . . . . . . . . 19
Microenterprise Funding in FY 2001 . . . . . . . . . . . . . . . . . . . . . . . . . . . . . . . . . . . . . . . . . . . . . 24
Funds for the Poor . . . . . . . . . . . . . . . . . . . . . . . . . . . . . . . . . . . . . . . . . . . . . . . . . . . . . . . . 26
Funds for Private Voluntary Organizations . . . . . . . . . . . . . . . . . . . . . . . . . . . . . . . . . . . . . 27
Results from USAID-Supported Microenterprise Institutions in 2001 . . . . . . . . . . . . . . . . . . . 29
Microfinance. . . . . . . . . . . . . . . . . . . . . . . . . . . . . . . . . . . . . . . . . . . . . . . . . . . . . . . . . . . . . 29
Business Development Services . . . . . . . . . . . . . . . . . . . . . . . . . . . . . . . . . . . . . . . . . . . . . . 35
Policy Advocacy and Reform . . . . . . . . . . . . . . . . . . . . . . . . . . . . . . . . . . . . . . . . . . . . . . . . . . . 39
Conclusions. . . . . . . . . . . . . . . . . . . . . . . . . . . . . . . . . . . . . . . . . . . . . . . . . . . . . . . . . . . . . . . . . 40
Appendix I: Methodology to Calculate Percentage of Funds for the Poor. . . . . . . . . . . . . . . . . 41
Appendix II: USAID’s Annual Microenterprise Survey . . . . . . . . . . . . . . . . . . . . . . . . . . . . . . . 42
Appendix III: USAID Microenterprise Funding by Country, 1992–2001 . . . . . . . . . . . . . . . . . 44

IV LINKING THE POOR TO OPPORTUNITY
Tables and Figures
Table 1. Sources of USAID Funds for Microenterprise
by Appropriation Account, 1991-2001 . . . . . . . . . . . . . . . . . . . . . . . . . . . . . . . . . . . 24
Table 2. FY 2001 Funding by Region of Use . . . . . . . . . . . . . . . . . . . . . . . . . . . . . . . . . . . . . 25
Table 3. Uses of FY 2001 Funding by USAID Bureau . . . . . . . . . . . . . . . . . . . . . . . . . . . . . . 26
Table 4. Percentage of Funds Committed to Poverty Lending, FY 2001. . . . . . . . . . . . . . . . 27
Table 5. Average Annual Funding to PVOs for 1997-2001
with Clients Then and Now . . . . . . . . . . . . . . . . . . . . . . . . . . . . . . . . . . . . . . . . . . . 28
Table 6. Clients of Lending Institutions in 2000 and 2001 . . . . . . . . . . . . . . . . . . . . . . . . . . . 29
Table 7. Average Loan Balance and Percentage of Women Clients in 2001. . . . . . . . . . . . . . 30
Table 8. Clients with Poverty Loans in 2001 . . . . . . . . . . . . . . . . . . . . . . . . . . . . . . . . . . . . . 32
Table 9. Number of Savers and Savings Amounts in 2001 . . . . . . . . . . . . . . . . . . . . . . . . . . . 32
Table 10. Leading Savings Institutions or Networks Supported by USAID. . . . . . . . . . . . . . . 33
Table 11. Location of Microfinance Clients, 2001 . . . . . . . . . . . . . . . . . . . . . . . . . . . . . . . . . . 34
Table 12. Average Repayment and Loan Loss Rates, 2001 . . . . . . . . . . . . . . . . . . . . . . . . . . . . 35
Table 13. Sustainability of USAID-Supported Institutions, 2001 . . . . . . . . . . . . . . . . . . . . . . . 35
Table 14. Clients of USAID-Supported BDS Programs, 2001 . . . . . . . . . . . . . . . . . . . . . . . . . 37
Table 15. USAID’s Microenterprise Survey Respondents, 2001 . . . . . . . . . . . . . . . . . . . . . . . . 42
Table 16. USAID Funding for Microenterprise Institutions, 2001. . . . . . . . . . . . . . . . . . . . . . 43
Table 17. USAID Microenterprise Funding by Country, 1992–2001. . . . . . . . . . . . . . . . . . . . 44
Figure 1. Amount of Portfolio for Lending Institutions in 2001 . . . . . . . . . . . . . . . . . . . . . . . 30

LINKING THE POOR TO OPPORTUNITY V
ACRONYMS
ACDI/VOCA Agricultural Cooperative Development International/Volunteers in OverseasCooperation and Assistance
AFE Action for Enterprise
AIMS Assessing the Impacts of Microenterprise Services
ANE Asia and the Near East Region (USAID)
ATA Aid to Artisans
BDS Business Development Services
BRI Bank Rakyat Indonesia
CAMFA Central Asian Microfinance Alliance
CAR Central Asian Republics
CHF Cooperative Housing Foundation
CPIP Credit Policy Improvement Program
CRS Catholic Relief Services
DA Development Assistance
DCA Development Credit Authority
DdG Diálogo de Gestiones
E&E Europe & Eurasia Region (USAID)
EGAT Bureau of Economic Growth, Agriculture and Trade (USAID)
ESF Economic Support Funds
FSA Freedom Support Act
FY Fiscal Year
GDP Gross Domestic Product
IDE International Development Enterprise
IRIS Center for Institutional Reform and the Informal Sector
JOBS Job Opportunities and Business Support
LAC Latin America and Caribbean Region (USAID)
MBP Microenterprise Best Practices
MFI Microfinance Institution
MRR Microenterprise Results Reporting
NGO Non-governmental Organization
NOA New Obligating Authority
ODC Office of Development Credit (USAID)
OI Opportunity International

VI LINKING THE POOR TO OPPORTUNITY
PVC Office of Private and Voluntary Cooperation (USAID)
PVO Private Voluntary Organization
SAI Special Assistance Initiative
SEED Support for Eastern European Democracy
SEEP Small Enterprise Education and Promotion Network
SEPA Support Program for Artisanal Product Exports
SEWA Self-Employed Women’s Association
USAID United States Agency for International Development
VITA Volunteers in Technical Assistance
WEP Women’s Empowerment Program (PACT Nepal)
WOCCU World Council of Credit Unions

LINKING THE POOR TO OPPORTUNITY 1
EXECUTIVE SUMMARY
Global markets thrive on connectivity.Advanced communications and technolo-
gies move data, services, and informationaround the world for 24-hour operations.Transport and logistics management systemsmake it possible to spread manufacturing pro-cesses among multiple continents and connectproducers and consumers in dense networks oftrade. Financial systems transmit unprecedent-ed volumes of savings, investments, and profitsworldwide. Such integrated systems createenormous opportunities for producers andconsumers who can access markets for a richand varied supply of goods and services.
Unfortunately, most of the world’s populationcannot enjoy the benefits of this connectivity.The vast majority of microenterprises1 — theinformal businesses that are the predominantsource of income and employment in mostdeveloping countries today2 — are isolatedfrom wider markets by poor infrastructure.They are therefore deprived of the informationthat would enable them to produce and marketmore effectively. Without these basics, theseenterprises struggle to stay viable — and theirowners often struggle to survive. This is partic-ularly the case in remote rural areas.
Even microenterprises in urban areas areseverely constrained by lack of formal businessregistration and title to premises, compromis-ing their ability to grow and access formalfinancial markets with collateral. They are fur-ther constrained by poor public services —
telephones, mail, water, sewage — that limitthe use of technologies with the potential toimprove product quality and extend marketoutreach. Private business service providersthat could help connect microenterprises withessential tools and resources — like marketintelligence, advertising, communications, andaccounting skills — often pay scant attention tothe needs of such tiny businesses. The result isthat few of the benefits of increasing connec-tivity are felt by poor microentrepreneurs andtheir households.
The United States Agency for InternationalDevelopment (USAID) has been working overthe past three decades to expand opportunitiesfor hundreds of millions of people who rely onmicroenterprises in the informal sector fortheir livelihoods. USAID has invested in hun-dreds of private microenterprise developmentorganizations around the world; organizationsthat are reshaping financial and business ser-vice markets to better serve poorer clients.Improved and expanded service to many moreof the poor is needed so they may access variedsources of capital, information, inputs, tech-nologies, and markets. By linking to theseresources, poor entrepreneurs will be betterable to seize opportunities they have not hadand to create better lives for themselves andtheir families.
USAID’s microenterprise development strate-gy must address two pressing challenges:
1 Microenterprises are defined by USAID as businesses with fewer than ten employees that are owned and operated by poorpeople.
2 For example, in Nigeria and Egypt 60-80% of GDP comes from the informal sector; in Morocco, Mexico, and Peru 40-60% ofGDP is from the informal sector. See Schneider, Frederich and Dominik Enste, “Shadow Economies: Size, Causes, andConsequences, Journal of Economic Literature, Vol. XXXVIII (March 2000) p.80.

2 LINKING THE POOR TO OPPORTUNITY
■ To link microenterprises to greater oppor-tunities for growth, which includes inte-grating them on more favorable terms intothe formal economies of their countriesand connecting them to expanded informa-tion and resource networks.
■ To bring the benefits of microfinance andbusiness development services to poorerpeople (“reaching down”), ensuring thatthe positive impacts of microenterprisedevelopment programs reach those in themost need.
USAID works in partnership with private vol-untary organizations (PVOs), local non-governmental organizations (NGOs) and otherorganizations to extend much-needed servicesto an expanding circle of underserved clients,especially women, the rural poor, and small-holder farm families. The track record ofUSAID and other donors proves that, despitethe challenges of extending services to thepoor, microenterprise development can be car-ried out effectively and sustainably, even whilefocusing on reaching poorer and more vulner-able clients.
Highlights of USAID support to the microen-terprise development sector in FY 2001include:
■ More than $155 million in financialsupport went to microenterprise devel-opment programs worldwide. In FY2001, USAID committed $158.7 million tomicroenterprise. USAID’s average annualfunding to microenterprise developmentover the last five years is $155 million.
■ Two-thirds (67%) of all USAIDmicroenterprise funding was for finan-
cial services. Assistance to microfinanceinstitutions (MFIs) and microfinance net-works took the form of funds for loan capi-tal, operational expenses, technicalassistance and institutional capacity build-ing. Support also includes strengtheningthe financial infrastructure that will allowmicrofinance to flourish, for example, bybuilding national practitioner networks,credit bureaus, credit ratings agencies, andsound regulatory and supervisory systems.
■ More than half of all USAID fundingwas directed to very poor entrepren-eurs. Thus, USAID met the target established in the Microenterprise for Self-Reliance Act of 2000 that at least 50 per-cent of all microenterprise developmentfunds be directed to the very poor. Loansize serves as the proxy to estimate thepoverty level of microenterprise clients.3
■ Many MFIs supported by USAID arenow offering new and innovative ser-vices designed to meet the needs ofpoorer clients. In addition to workingcapital and fixed asset loans for enterprises,many institutions now offer an array ofproducts designed to help households buildassets, reduce vulnerability, and invest inthe future. USAID-supported institutionsprovide savings and deposit services, insur-ance, remittance and payment services, aswell as loans tailored to farmers, housing,family emergencies, and school fees.
■ More than 5.6 million microen-trepreneurs received loans throughUSAID-assisted microfinance institu-tions. Of these, 2.8 million clients receivedloans through USAID-supported institu-tions, which had outstanding portfolios of
3 The Microenterprise for Self-Reliance Act of 2000 defined poverty loans, by region, as: $300 or less in Asia, the Near East,and Africa; $400 or less in Latin America and the Caribbean; and $1,000 or less in Eastern Europe and Eurasia. USAID and itspartners are beginning work on additional poverty measurement proxies for microenterprise clients.

LINKING THE POOR TO OPPORTUNITY 3
$918 million and average loan size of $317.Another 2.8 million borrowers receivedloans through a single institution, the BankRakyat Indonesia (BRI)4 with an outstand-ing portfolio of $963 million and averageloan size of $345.
■ The clients of the vast majority ofUSAID-assisted microfinance institu-tions were women and the very poor. Ofthe clients of all USAID-assisted institu-tions excluding BRI, more than two-thirds(73%) were women. More than two-thirds(69%) of these loans were also in amountsdefined as poverty loans. While BRI’sclients are predominately male (16%women), more than half received povertyloans (51%).
■ More than 30 million savers benefitedfrom USAID assistance to ensure thatthe poor have access to safe and reliablesavings services. BRI held savings for 27million clients, with accumulated savings of $2.15 billion, or $79 per client. Another3.5 million savers had savings valued at$425 million in other USAID-assistedinstitutions, with average individual savingsof $121.
■ More than one-half of all the MFIs withUSAID support were either opera-tionally or fully sustainable. USAID’scommitment to building sustainable ser-vices for the poor is reflected in the num-ber of institutions that are making steadyprogress toward the goal of covering alltheir operational expenses, including thecost of the funds.
■ More than 800,000 microenterprisesbenefited from USAID support to busi-ness development services (BDS) pro-grams. The vast majority (80%) of BDSclients live in rural areas where access to
markets is extremely limited. USAID-supported BDS programs are helping tolink poor microentrepreneurs to growingmarkets; increase productivity through newtechnologies; offer appropriate and afford-able services for poorer enterprises; andbuild sustainable and competitive businessservice markets.
■ USAID provided $13.1 million to insti-tutions that do policy advocacy andreform on behalf of microentrepreneursand microenterprise institutions. Of thisamount, $5.9 million supported policyreforms that improve the business environ-ment for microenterprises, in areas such asbusiness registration and licensing, tradepolicy, and cooperative regulation. Another$7.2 million went for policy and regulatoryreform in the financial sector that benefitedmicrofinance institutions and their clients.
USAID’s microenterprise support is helping tolink microentrepreneurs and microenterpriseinstitutions to many more opportunities forgrowth and expansion. As programs expandand achieve sustained impact, the world bene-fits from the increased growth and economicstability of the microenterprises owned andoperated by the poor. This trend serves toexpand economic opportunity and mitigateextreme poverty, which contributes to politicalinstability, conflict, and the intractability ofsuch problems as rapid population growth, thespread of infectious diseases, drug trafficking,and environmental degradation. Linkingmicroenterprises to opportunity is helping tobuild stronger, more vibrant economies andsocieties while giving hope to millions of poorhouseholds throughout the world.
4 Bank Rakyat Indonesia (BRI) currently has a cooperative agreement with USAID to promote increased efficiency and com-petitiveness of BRI units and to facilitate economic recovery by expanding services to the microenterprise sector. Fundingto BRI in FY2000 was $300,000. No additional funding was provided in FY2001.

4 LINKING THE POOR TO OPPORTUNITY
LINKING THE POOR TO OPPORTUNITY
In a world where markets thrive onconnectivity, most of the world’s
population can neither participate innor enjoy the benefits of the integra-tion of markets and commercialactivity. In most developing andemerging market economies, themicroenterprise sector constitutes ahigh proportion of economic activityfor poor households. The vast major-ity of microenterprises — the infor-mal businesses that are the pre-dominant source of income andemployment in most developingcountries today (see, for example, boxon page 5) — are isolated from widermarkets by poor infrastructure, and deprived ofthe information that would provide for moreefficient production and marketing. Withoutthese basics, these enterprises struggle to stayviable — and their owners often struggle tosurvive. This is particularly the case in remote,rural areas.
Even microenterprises in urban areas areseverely constrained by lack of formal business
registration and title to premises, compromis-ing their ability to grow and access formalfinancial markets with collateral. They are fur-ther constrained by poor public services —telephones, mail, water, sewage — that limitthe use of technologies with the potential toimprove product quality and extend marketoutreach. Private business service providersthat could help connect microenterprises withessential tools and resources, like market intel-
In Azerbaijan, CHF’s BDS programs help clients access new markets.
Ph
oto
co
urt
esy
of
CH
F In
tern
atio
nal
.
What are Microenterprises?Microenterprises are small, often informally organized businesses that are owned and
operated by poor and very poor entrepreneurs. USAID defines a microenterprise as one
that comprises 10 or fewer employees, including unpaid family workers, in which the
owner/operator of the enterprise (the “microentrepreneur”) is considered poor. By lim-
iting its definition of microenterprises to those whose owner/operators are poor,
USAID ensures that the focus of its efforts remains on the most vulnerable households
in higher-risk environments.

LINKING THE POOR TO OPPORTUNITY 5
ligence, advertising, communications, andaccounting skills, often pay scant attention tothe needs of such tiny businesses.
The importance of microenterprises to theincome and welfare of poor households canhardly be overstated. Families use microenter-prise earnings for essentials such as food, cloth-ing, medical care, school fees, to build upsavings, or as a cushion against sudden shocks.Such benefits to the poor, particularlyimprovements in health and education, con-tribute powerfully to several MillenniumDevelopment Goals, the measurable targets setby world leaders to combat poverty, hunger,disease, illiteracy, environmental degradation,and discrimination against women.
Microenterprises, which largely belong to theinformal sector, also constitute a significantpart of the overall economy in many nations.Given the impressive contribution to employ-ment (as well as GDP) of microenterprises inmany developing economies, even moderate
increases in microenterprise income can havesignificant effects on a country’s prosperity.Similarly, given their share of economic activi-ty, productivity and employment gainsachieved by these tiny firms can contribute asmuch to economic growth as can larger firms.
Yet, the full potential of this sector — in bothpoverty reduction and economic growth —cannot be realized as long as households areconfined to using underdeveloped markets andproducing simple products with rudimentarytechnologies for sale to equally poor con-sumers. Neither can the sector contribute tothe growth and dynamism of the economyuntil their principle constraints are removed.One very promising avenue to boost theincomes of tens of millions of poor householdsaround the world is to break their economicisolation — by linking them to the formalfinancial sector, and by linking their microen-terprises to higher-value markets, better tech-nologies, and essential information andknowledge. Furthermore, emerging evidence
Importance of the Informal Sector Every economy has an informal sector, a “shadow” economy that does not figure into
official calculations. The tiny firms and self-employed individuals in this sector are not
registered. Typically, their operations are below the radar screen of taxing authorities
and other regulators. Their access to publicly-supported services is often minimal or
non-existent. In poor countries the informal sector, which is comprised primarily of
microenterprises, contributes significantly to the overall economy.
■ In Nigeria, Egypt, and the Philippines the shadow economy is estimated to be
about 70% as large as the reported GDP.
■ In Morocco, Mexico, and Peru the informal sector is estimated to be 50% as large as
reported GDP.
From Schneider, Frederich and Dominik Enste, “Shadow Economies: Size Causes and
Consequences, Journal of Economic Literature, Vol. XXXVIII (March 2000) p.80.

shows that even very poor households benefitfrom market linkage activities, especially if pro-grams are designed and implemented proac-tively with their circumstances in mind.
For 40 years, the U.S. Agency for InternationalDevelopment (USAID) has led our nation’sefforts to help improve the lives of poor peoplearound the world. Microenterprise develop-ment has played a key role in the gains made on
this front. For the past two decades, USAIDhas been the leading bilateral donor in thisfield.
By creating more effective markets and linkingpoor entrepreneurs to resources and marketsthat work for them, USAID is helping toaddress the ways microentrepreneurs havebeen marginalized from economic growth.
6 LINKING THE POOR TO OPPORTUNITY

LINKING THE POOR TO OPPORTUNITY 7
USAID’S MICROENTERPRISE
DEVELOPMENT STRATEGY — THE NEW CHALLENGES
Despite the impressive achievements andsuccesses of the past 40 years, the
microenterprise development field is at a chal-lenging crossroads. USAID is committed topursuing a strategy in the coming years thatreflects the most pressing needs of themicroenterprise development field. This strat-egy, which will be pursued throughoutUSAID’s three “pillars” (microfinance, busi-ness development services, and enabling envi-ronment), focuses on two broad priorities:
■ First, to link microenterprises to greateropportunities for growth, which includesintegrating them on more favorable termsinto the formal economies of their coun-tries and connecting them to expandedinformation and resource networks.
■ Second, to bring the benefits of microfi-nance and business development services topoorer enterprises and households (“reach-ing down”).
USAID’s investments in the coming years willtest diverse approaches, helping microenter-
prise development programs innovate andadapt to more successfully meet the needs ofthe poorest microentrepreneurs. (For exam-ples, refer to the insert on “Reaching FurtherDown Market,” page 22.)
Aveladra Sabon Sajquill, client of ACCION affiliate Génesisin Guatemala.
Ph
oto
co
urt
esy
of
Reb
ecca
Jan
es f
or
AC
CIO
N.

8 LINKING THE POOR TO OPPORTUNITY
THE THREE PILLARS OF
USAID’S MICROENTERPRISE
DEVELOPMENT SUPPORT
USAID is a world leader in pushing thefrontiers of microenterprise development
to build markets that work for the very poor,the rural poor, and women. To maximize theeffectiveness of its funding, USAID supportsthe three building blocks for successfulmicroenterprise development: microfinance,business development services, and policy andregulatory development.
Microfinance
How does USAID supportmicrofinance?
USAID’s support for microfinance focuses ontwo equally important objectives. The first ofthese is the development and expansion ofstrong microfinance institutions (MFIs) —those with effective governance structures andcredible business plans to cover all operatingexpenses, including the cost of capital, throughoperating income within a reasonable time-
frame. The second objective is the promotionof client-responsive products and serviceswith the potential to reach more poor and verypoor entrepreneurs, especially underservedpopulations such as the rural poor, women, andthose in conflict or crisis situations.
In supporting strong MFIs and promotinginnovations in services, USAID follows thefour fundamentals of successful poverty allevi-ation programs:
■ Scaling up to reach dramatically greaternumbers of poor and very poor households;
■ Expanding the outreach of micro-enterprise development to underserved households;
■ Improving the quality of microenterpriseservices, making sure they add value tomicroenterprises and increase net incomeand security; and
■ Achieving impacts that are sustainableover the long term.
What is Microfinance?“Microfinance” refers to the provision of financial services to poor and very poor house-
holds. Microcredit is the most visible and well-known microfinance product. Other
equally important financial services include savings and deposit services, insurance and
remittance services. The list grows as microfinance institutions develop new products
in response to client demand and increasing competition.

LINKING THE POOR TO OPPORTUNITY 9
By Scaling Up MicrofinancePrograms
In its World Development Indicators 2000, theWorld Bank estimates that 1.2 billion peoplearound the world live on less than $1 a day. Itis estimated that the number of poor house-holds worldwide who depend on income frommicroenterprise is in the hundreds of millions,yet it is likely that less than 10 percent of thesepotential clients actually have access to finan-cial services. Thus, for USAID to make a sig-nificant contribution to poverty reduction, itspartners must be capable of achieving signifi-cant scale of outreach — that is, reaching largenumbers of the poor. Furthermore, buildingvibrant markets for financial services in thelong term will require MFIs to reach sustain-ability through reaching large numbers ofclients.
CARD in the Philippines is an example of anMFI that has been able to scale up, with thesupport of USAID-Philippines, while holdingto its objective to reach poor clients. Initiatingactivities to extend services to the rural poor in1990, today CARD has 25 branches and servesmore than 42,000 women clients, with an aver-
age loan size of US $94. Almost all of CARD’sclients have income below the poverty line.About half belong to smallholder farm families.CARD offers a variety of loan products to its
Does Microfinance Work?Evidence from around the world (see, for example, publications from USAID’s AIMS pro-
ject, www.usaidmicro.org) strongly suggests that well-designed microfinance is an
essential tool for helping poor households improve net income and cope with risk and
vulnerability. Research has shown that access to appropriate credit products and a safe,
convenient place to save have positive impacts on microenterprise households. Such
services increase and diversify household income. Families are also able to build assets
that may be needed as a cushion when they face natural disasters, or the death or dis-
ability of a breadwinner. In short, access to microfinance helps families to be proactive
rather than reactive, to invest in their businesses when new opportunities arise, to put
kids through school, to improve housing, and to plan for old age.
Tekla Ngwerume used her loan from Zambuko Trust to buymaterial for her sewing business. Profits have been so goodthat she can better provide for her family. She has even beenable to buy her own sewing machine.
Ph
oto
co
urt
esy
of
Op
po
rtu
nit
y In
tern
atio
nal
(O
I).

10 LINKING THE POOR TO OPPORTUNITY
clients, including savings, working capitalloans, housing loans, and multi-purpose loans.
One way USAID’s partners have been able togrow quickly is through gaining access to com-mercial capital. Such commercialization facili-tates a dramatic expansion of resources andservices available to microenterprises. InBolivia, for example, a decade of investment inmicroenterprise support institutions, includingformal financial institutions, has led to theimpressive expansion of financial services to thelow end of the market. In 1990, the entireBolivian financial system had only 195,000borrowers and 460,000 savers. By 2001, thefinancial sector served 616,000 borrowers and1.4 million savers, largely reflecting the growthin microfinance.
To further integrate microfinance into formalcommercial finance markets, USAID fundsinnovative market-building activities. Forexample, USAID fosters the development ofcredit ratings agencies that analyze risk for
potential financiers of MFIs. Ratings agenciesencourage greater transparency and removecritical information barriers, crucial to attractthe private investment that MFIs need to fundportfolio expansion.
Another innovation is to assist in the develop-ment of credit bureaus. Well-functioning cred-it bureaus incorporate the repayment patternsof clients across institutions and allow lendersto better assess individual credit risk. This ulti-mately leads to service expansion, helps protectclients against over indebtedness, and reducesthe cost of credit to deserving borrowers.USAID funding for research and experimenta-tion is helping to determine effective ways tosupport credit bureaus that are linked to privatesector initiatives in places such as El Salvadorand Jordan.
USAID also uses grant and credit instrumentsto help mature retail MFIs cross the bridgefrom donor subsidy to commercial credit.USAID’s Development Credit Authority
AFRICAP Microfinance FundMicrofinance is poised for rapid expansion in Africa, with increasing evidence of com-
mercial potential in developing financial services to low-income communities. A num-
ber of leading MFIs in Africa are at a critical stage between grant funding and com-
mercial capital and urgently need investment capital and management support.
Based on the success of ProFund in Latin America and increasing evidence of the
potential for commercial microfinance in Africa, a number of donors and private insti-
tutions including USAID provided seed funding for the AFRICAP Microfinance Fund,
launched in 2001 by Calmeadow. AFRICAP’s goal is to build successful, sustainable com-
mercial MFIs in Africa by providing patient venture capital, active oversight, and capaci-
ty building support. AFRICAP also supports overall industry development activities.
AFRICAP is the first equity investment fund focused on MFIs in Africa. The fund is
expected to invest in about ten MFIs over five years, then divest and liquidate within
ten years.

LINKING THE POOR TO OPPORTUNITY 11
(DCA) can offer MFIs “portable guarantees”that guarantee up to 50 percent of the riskexposure of a commercial bank willing to lendto the MFI. To date, USAID has authorized$21 million in DCA guarantees to supportmicrofinance institutions and microenterprisesin Mexico, Guatemala, Ecuador, Honduras,Peru, Uganda, and Morocco. USAID has alsocreated innovative credit instruments to sup-port bond issues and risk-sharing arrange-ments. DCA provides a useful and cost-
effective tool to demonstrate to commercialbanks and other investors that loans and credit lines to MFIs are secure, solidinvestments.
By Reaching Out to Poorer,Hard-to-Reach Clients
Many microfinance programs were born froma social mission, and most retain dual goals ofimpact (enterprise growth and poverty reduc-tion) and sustainability (long-term viability ofthe institution). After many years of successfulimplementation of financial services, however,the industry is now seeing sustainability asmore of a means than an end. To push the“downreach” frontier, much more needs to bedone to ensure that the very poorest microen-trepreneurs benefit from access to these vitalservices.
While the growth and success of microenter-prise development means that millions of poorpeople have economic opportunities oncecompletely out of reach, the fact is that mostmicroenterprise programs have difficultyreaching large numbers of extremely poorhouseholds. USAID is committed to exploring
Development Credit Expands Access to Commercial FundsThere are an estimated 1.2 million microenterprises in Morocco, yet only 175,000 pri-
marily urban clients are served by 12 MFIs. To expand the operations of two prominent
MFIs, Al Amana and Fondation Zakoura, USAID has extended portable loan guarantees
to allow these institutions to obtain capital at favorable rates. A total of US $2 million
will be authorized for this purpose. The guarantees will add loan capital from private
lenders, while diversifying fund sources for the institutions. The institutions will seek to
develop additional loan products, such as housing loans, for their clients.
Rachida, a client of Al Amana in Morocco, used herloan to purchase a weaving loom.
Ph
oto
co
urt
esy
of
Al A
man
a.

12 LINKING THE POOR TO OPPORTUNITY
financial products and low-cost service deliv-ery mechanisms that allow MFIs to address theneeds of risk-averse,5 extremely poor house-holds through cost-effective institutions thatwill survive when donor funding fades away.To achieve this, USAID and its partners willneed to be innovative and carefully considerthe characteristics of the world’s pooresthouseholds. In general, additional “down-reach” will occur only by addressing the rea-sons why many poorer households are eitherreluctant to participate in microfinance pro-grams or are excluded from them.
USAID pursues an aggressive “actionresearch” agenda by encouraging practitionersto explore innovative models that tailormicroenterprise products and services to verypoor clients. With USAID support, microfi-nance institutions developed and implementeda number of approaches that target the verypoor, such as village banking methodologies,community-based self-help groups, creditcombined with education services, and flexiblesavings services.
A client of CRECER selling spices and fruit.
© 1
995–
2002
Fre
edo
m f
rom
Hu
ng
er
CRECER Sets an Example in BoliviaIn 1990, Freedom from Hunger began an organization in Bolivia called CRECER (Crédito
con Educación Rural) to implement its Credit with Education program. CRECER is now a
successful, independent Bolivian nonprofit organization. It continues to work with
Freedom from Hunger to expand the program to an ever-increasing number of women
and their families. CRECER offers credit with education to over 31,000 participants who
have borrowed more than US$43 million. Non-formal adult education is provided in the
areas of health, nutrition, family planning and microenterprise management. As of
December 31, 2001, the program had an outstanding loan portfolio of US $4.2 million and
was covering 99 percent of its operating costs. CRECER maintains the lowest average
loan size of any program in Bolivia, reflecting its commitment to reaching the very poor.
5 Poorer households tend to be more risk averse because they have fewer assets to draw on in times of crisis. Taking out aloan, which could result in loan default and a loss of assets, has inherent risk that is avoided by many.

LINKING THE POOR TO OPPORTUNITY 13
Conflict, natural disasters, and other crises candeepen poverty sharply. Microenterprise development has proven itself as a strategy thatcan work in particularly challenging and unsta-ble circumstances, giving vulnerable people achance to increase and stabilize incomes evenduring times of crisis. There are many exam-ples of successful efforts to support microen-
trepreneurs in immediatepost-conflict situations, fol-lowing natural disasters suchas Hurricanes Mitch andGeorges, and in regions, likesouthern Africa, now copingwith extremely high rates ofHIV/AIDS infection.
In the future, USAID willwork in collaboration withorganizations to identify andassess innovative models inagricultural microfinance.One such model couldinclude enhancing the roles
of traders and retailers that serve as importantsources of credit to microentrepreneurs, smallfarmers, and poor rural households. Thisresearch will likely lead to recommendationson how donors and practitioners can engagewith non-institutional credit providers to deliv-er services to underserved rural communities.
FINCA Uganda: Adapting Services to Help PoorClients Overcome AdversityFINCA Uganda has grown to become one of FINCA’s largest programs, serving more than
35,000 clients. In doing so, it has developed new products such as life and health insur-
ance. FINCA has also incorporated product improvements, including a lower savings
requirement that allows clients to ‘grow’ faster. Microcare, a health care financing pro-
gram, was designed to provide clients with a full range of health care services through
hospitals.
One client of the Kawempe Village Banking group, Lukia Ssemanobe, was barely surviving
running a street food business after her husband died of AIDS. Six years ago, Lukia took
her first small, four-month loan from the village bank. Eighteen loans later, Lukia now
runs two restaurants and employs 11 people. In the process, she built two houses for her
extended family, and supports four AIDS orphans.
In Uganda, many village banking groups create their own uniforms and wear them to meetings as a statement of solidarity.
Ph
oto
co
urt
esy
of
Joh
n G
ibb
on
s fo
r FI
NC
A.

14 LINKING THE POOR TO OPPORTUNITY
By Improving the Quality ofServices
As institutions expand and extend services tounderserved communities, USAID is commit-ted to helping them offer microenterprise ser-vices that meet the real needs of poor and verypoor households. Practitioners increasinglyrecognize that to succeed and grow, servicesneed to be demand-driven. Furthermore, it isnecessary to invest in market research andproduct innovations to adequately respond toclient needs.
USAID encourages its microfinance partnersto understand their clientele and to reach outto poorer and more rural clients with servicesthose clients demand. Too often, MFIs havesimply provided credit, rather than a range ofservices that may be desired by its clients. Thetypes of financial services needed by poor peo-ple extend far beyond working capital loans, toinclude savings, housing loans, insurance, andmoney transfer services. Convenient, safe andflexible deposit services are a particularly cru-cial need.
USAID supports groundbreaking work byMFIs to develop more capacity for respondingto client feedback and integrating demand-driven services. For example, in Latin Americamany MFIs now offer clients housing loans,enabling them to finance the expansion orimprovement of their home. For manymicroentrepreneurs, their home is their work-place, so this represents an important enter-prise-related investment and family asset.
By Achieving Sustainable Impacts
Until just a few years ago, many microfinanceinstitutions had little more than anecdotal evi-dence to support the claim that their programsmade a difference in the lives of their clients.To help practitioners and donors better under-stand the effects of microenterprise services onclients, USAID supported the development ofa set of flexible tools for microenterprise insti-tutions through the AIMS6 activity. Under thisactivity several major impact assessments wereundertaken to show the ways in which microfi-nance services affect individuals, households,and communities.
SEWA (Self-Employed Women’s Association) IndiaUsing the AIMS tools (see footnote below), SEWA Bank developed a number of new prod-
ucts and services for its clients. SEWA recently introduced a one-day loan to meet the
credit needs of vegetable vendors. In addition, it now offers a special savings account
designed to pay for marriage expenses, and has started a financial literacy program to
help its members improve their personal financial management. In addition, SEWA is
reviewing the appropriateness of its products for workers in each of the major subsec-
tors in which its members work. Future plans may include a loan product to finance girls’
education.
6 USAID’s Assessing the Impacts of Microenterprise Services (AIMS) project developed the manual “Learning from Clients:Assessment Tools for Microfinance Practitioners” to help practitioners better understand clients and improve product ser-vices and client impact. It contains a set of five assessment tools and provides step-by-step instructions for the use of thetools, from initial planning to data collection and analysis.

LINKING THE POOR TO OPPORTUNITY 15
One such assessment was performed byOrganization el Desarrollo Empresarial Feme-nino (ODEF) in Honduras. ODEF, in collabo-ration with Katalysis, SEEP, and AIMS,conducted an impact assessment of itsmicroenterprise program in 1997, revealingbenefits to businesses and their owners andfamilies. At the enterprise level, client business-es grew faster and were more profitable thannon-client businesses. Positive results at theclient household level were demonstratedthrough increased levels of savings amongclients, as well as improved food consumption.Qualitative indicators demonstrated improvedself-esteem and self-confidence of ODEF’s pri-marily women clients. ODEF’s clients werealso found to be more productive than non-clients, spending less time on business activitieswhile generating more profits.
Evidence from other microfinance institutionssuggests similar benefits to microentrepreneursand their households, though not all institu-tions are equally capable of delivering services.
Further research will reveal the extent to whichthese benefits are maintained over the longterm.
The AIMS tools, which include a main impactsurvey, a client exit survey, and surveys of loanuse, client satisfaction, and client empower-ment, are in great demand among institutionsthat want to improve the impact of services onclients. These tools can also be used to assistinstitutions in expanding their outreach topoorer clients and improving client retention ordelinquency to reach financial sustainabilitymore quickly. Institutions need support toincorporate such client and market assessmenttools into their daily operations, informationsystems, and product design processes. USAIDsupports demonstration projects that showpractitioners how effective use of client assess-ment and monitoring helps expand services tounderserved groups, and improve client reten-tion, repayment, and growth rates.
Business DevelopmentServices (BDS)
How does USAID support BDS?
In many cases, microfinance alone cannot gen-erate real income and employment growth,particularly in poorer rural areas. Even withaccess to financial services, poor microen-trepreneurs still face major barriers: lack ofinformation about more lucrative markets;inability to improve quality of products or effi-ciency of production; expensive or poor qualityinputs; weak infrastructure; and lack of accessto business skills and basic services.
Rather than subsidizing BDS providers direct-ly, USAID increasingly focuses on using BDS“facilitators” to build markets in which privatebusinesses (often themselves small or microscale) provide appropriate services to poorermicroenterprises on a commercial basis. This
Technoserve is linking El Salvador’s small-scale shrimpgrowers to processing and export markets.
Ph
oto
co
urt
esy
of
Ric
har
d L
ord
fo
r Te
chn
ose
rve.

16 LINKING THE POOR TO OPPORTUNITY
helps ensure that sustainable local capacityremains behind after the program ends.
USAID-supported programs devise ways ofmaking BDS affordable to microenterprises,and profitable to service providers. Theyachieve this through development of new ser-vices, innovative payment mechanisms tailoredto the cash flow of clients, and the promotionof linkages between different sized firms. BDS“facilitators” base their interventions on mar-ket assessments; most have a clear, upfront exitstrategy, or plan to leave once the business ser-vices are in place and profitable.
In supporting BDS programs, USAID tries tocreate:
■ A significant impact on microenterpriseincome;
■ Appropriate services, including paymentoptions, for poorer enterprises; and
■ Sustainable and competitive markets.
By Supporting Services thatBoost Microenterprise Income
In identifying key services to promote, thefocus has been on services that have an almostimmediate impact on microenterprise income.Unlike larger firms that can afford to invest in
long-term training and management consult-ing, poorer entrepreneurs tend to demand ser-vices with clear benefits that can be realized ina short time frame. For example, in India andKenya, the dairy industry is extremely impor-tant to very poor, rural villagers who rely onmilk production for household income as wellas for consumption. In rural India, USAID willsupport a program implemented by AT-Indiathat works with wholesale milk buyers to sup-ply veterinary and improved feed services tomilk producers. Milk collectors and processors,who buy from small women farmers, providethe technical assistance enabling the producersto increase their milk yields and hence theirincomes.
Because most very poor households are locatedin rural areas, a key priority for USAID’s BDSprograms is to build up agricultural servicemarkets, which in turn can strengthen thediverse agro-related enterprises required togenerate a thriving rural economy. For exam-ple, USAID funded a project by ApproTec inKenya to boost rural livelihoods throughimproved technologies delivered in commer-cially viable ways. ApproTec helped subsistencefarmers to improve and commercialize theiroperations, by facilitating the sale and distribu-tion of 18,000 low-cost irrigation pumps.Farmers’ use of these pumps has increased netincomes from horticulture and related
What is BDS?BDS refers to the wide range of non-financial services that help poor entrepreneurs start
new businesses and grow existing ones. Examples of BDS provided to microenterprises
include skills training; market research and linkages; input sourcing; product develop-
ment; accounting and financial management; communications and brokering services;
business advice; and technology development aimed at productivity increases, like
micro-scale irrigation pumps and mobile telephones.

LINKING THE POOR TO OPPORTUNITY 17
microenterprises by more than $21 million inthe last five years.
By Supporting AppropriateServices for Poorer Clients
Poorer microentrepreneurs face a wide varietyof constraints to improving their businesses,some of which are particular to their sector.Successful BDS providers, therefore, must tai-lor their services to address the constraints feltby poor clients. Specifically, many poorermicroentrepreneurs need different servicesthan better-off clients; thus, BDS providers
interested in reaching this market segmentmust adapt their products and services appro-priately. For example, a training providermight offer shorter and more focused skillstraining for poor microentrepreneurs, in placeof a more in-depth financial managementcourse.
Microenterprises also find it difficult to pay up-front in cash for the services they need, due tothe realities of their enterprise or householdcash flow. As a result BDS providers often haveto modify their payment mechanisms.
Mercy Corps Addresses Low Incomes in AzerbaijanIn 2002 Mercy Corps/
Azerbaijan began by con-
ducting an extensive market
assessment in remote rural
areas that analyzed con-
straints to growth for poor
women engaged in poultry
farming (average income:
$34/month). Based on the
assessment, Mercy Corps dis-
covered that poor quality
feeding and breeding were
responsible for low prices
and high rates of rejection
by the State Animal Health
Board. Mercy Corps is now
working to develop the
capacity of local veterinarians who are dispatched to remote areas, while facilitating
group formation to increase awareness of the importance of veterinarian services and
bring down delivery costs. Mercy Corps is also helping the women to set up a basic
insurance scheme, where the women make regular savings so they have money for the
vet services as they are needed. In the next three years, Mercy Corps expects this pro-
gram to achieve a 35% increase in sales for 4,158 micro-entrepreneurs, an 87% increase in
sales for 54 veterinarians, and a 22% increase in sales volume for meat products in the
target area.
Poultry producer, Mrs. Tahira Ismayilova, providing vaccines to herstock of chickens.
Ph
oto
co
urt
esy
of
Mer
cy C
orp
s A
zerb
aija
n.

18 LINKING THE POOR TO OPPORTUNITY
PRIDE/Formation, begun by Volunteers in Technical Assistance (VITA), offers short-termevening courses in several local languagesgeared toward its semi-literate Guinean clients.It has developed an affordable, cost-effective,two-tiered pricing structure that has madebusiness training affordable to a large num-ber of microentrepreneurs, including manywomen. This is an example of a BDS provideradapting both its product (by making it shorterand more convenient) and its pricing (by intro-ducing a new pricing structure) to meet theneeds of its target market.
Another very important solution for the cashpayment challenge is to provide services on a commission basis or “embedded” within a commercial transaction. For example, aUSAID-funded program supporting smallfarmers in Honduras offers training on farmingtechniques to input supply shops. These shopsthen offer technical advice to their clients, whopurchase seeds, fertilizers and other farminputs from them — all without any direct cashpayment for the service. Because most verypoor households are located in rural areas,strengthening these embedded service marketsgoes a long way towards ensuring that the mostappropriate and relevant services are availableto the microenterprise sector.
By SupportingSustainable andCompetitiveMarkets
Careful planning and anal-ysis by BDS facilitators canlead to surprisingly large-scale returns to microen-trepreneurs — and tomore efficient marketswith a more level “playingfield”. For example, Actionfor Enterprise (AFE) inMali sought to addressconstraints felt by micro-
enterprise artisans. Using subsector analysisand market assessments, they identified strate-gic program interventions that have had a sig-nificant effect on local handicrafts markets.The interventions focused on developing thecapacity of BDS providers to provide marketaccess, product design, input supply, and finan-cial services to small and microenterprises. Todate, AFE has provided technical assistance toeight importers, six exporters, and over 1,000microenterprises. These efforts have resultedin more than $600,000 in increased export salesand 100 percent increases in revenues for participating businesses. Importantly, key mar-ket linkages have been established amongimporters, exporters, and producers that willlikely last for years to come.
To promote better functioning, more competi-tive markets, USAID-supported BDS pro-grams place particular emphasis on increasingthe leverage of microenterprises in the market-place, or enhancing their bargaining position inthe commercial arena. In Bangladesh, theUSAID Mission has adopted an integratedapproach to development, in which microen-terprises are organized into producer associa-tions or clusters through which they acquirebusiness skills, financial services, and marketing
With USAID funding ATA has helped many Haitian craftspeople bring their home-made goods to the international market.
Ph
oto
co
urt
esy
of
Ch
anta
l Reg
nau
lt f
or
Aid
to
Art
isan
s (A
TA).

LINKING THE POOR TO OPPORTUNITY 19
assistance (see box on page 38). Leverage isenhanced in a few strategic subsectors, such ashandicrafts, shoes, and agricultural produce, byimproving access to information, and by pro-moting linkages with a variety of larger firms,resulting in multiple purchasers for microen-terprise goods.
Creating an EnablingEnvironment forMicroenterprises
To complete the foundation for sustainable,poverty-focused microenterprise development,USAID supports activities to reform govern-ment laws, policies, and regulations in waysthat foster entrepreneurship and expand accessto financial and other services by the under-served poor. Currently USAID works withgovernments, regulatory bodies, business asso-ciations, research institutions, and non-govern-mental organizations (NGOs) to build astronger enabling environment for microenter-prises and microenterprise support institutions.
Improvements in the policy environment arecrucial to addressing the principal challengesfacing USAID in its microenterprise strategy
— namely, integrating microenterprises intothe formal economy and ensuring sustainablebenefits for the poorest microenterprises. Theenabling environment for microenterprisesincludes appropriate legal, regulatory andsupervisory practices for both public and pri-vate microfinance institutions. In addition, itincludes the policies, regulations, and adminis-trative practices governing the business envi-ronment in which microenterprises operate. Tosurvive and succeed, microenterprises need asupportive operating and investment environ-ment, as well as access to capital and other ser-vices. In many countries, inappropriate laws,regulations and policies discourage entre-preneurship, the competitiveness of the small-est businesses, and the growth of micro-enterprise development institutions.
USAID-supported institutions help nationaland local governments develop and implementappropriate microfinance laws and regulations.They also address issues of business registra-tion and licensing, foreign trade, non-govern-mental organization (NGO) regulation, andequitable access to services. The number ofmicroentrepreneurs benefiting from such poli-cy changes often far exceeds the number assist-ed directly through microenterprise insti-
Diálogo de Gestiones (DdG) Markets BDSDiálogo de Gestiones (DdG), a microenterprise training program in Colombia, was
designed by ACCION to help microentrepreneurs manage their small businesses more
effectively. Through interactive role-playing, games and discussions that incorporate the
life experiences of participants, Diálogo teaches business basics in a way that is accessi-
ble and practical. DdG was developed after extensive input from microentrepreneurs
themselves and is in wide demand. DdG’s goal is to produce a package of affordable
training modules that can be provided by a range of institutions on a commercially sus-
tainable basis. DdG licenses (which include facilitator materials and technical assistance)
have been sold to 17 institutions, including MFIs, commercial banks, Chambers of
Commerce, and private firms, in 14 countries.

20 LINKING THE POOR TO OPPORTUNITY
tutions. In Kenya, for example, privatization ofthe dairy industry has opened this sector to65,000 microenterprises, or 5 percent of allKenya’s micro businesses. Dairy sales accountfor 3.5 percent of Kenya’s GDP.
USAID helps to create a more level playingfield for microenterprises by helping countriesstreamline business registration, so that moremicro and small enterprises will be able andwilling to move into the formal market econo-
my. In many countries, business registration isstill a long, expensive and complex process thatdiscourages informal microenterprises fromentering the formal sector. The result is a lose-lose situation: microenterprises must operate inthe vulnerable informal sector where they faceserious obstacles to growth and expansion, andstates are deprived of much-needed tax rev-enues as well as reliable data on the country’sworkforce and economy.
Laying the Foundation for Microfinance in theCentral Asian RepublicsUSAID's support to the microfinance industry in the Central Asian Republics (CAR) began
with investments designed to promote best practices in microfinance. Market leaders,
such as FINCA/Kyrgyzstan, the Kazakhstan Community Loan Fund (ACDI/VOCA), and the
Association of Business Women in Tajikistan (Mercy Corps and Save the Children), have
demonstrated the feasibility of operating sustainable institutions serving poorer
entrepreneurs.
USAID then supported a second generation of providers, including ACDI/VOCA in the
Ferghana Valley. Most recently, USAID helped to create the Central Asian Microfinance
Alliance (CAMFA), which will support expansion of the market leaders and provide train-
ing, capacity-building services, grants, loans, and policy support to MFIs throughout the
region.
The legal and regulatory environment for microfinance in these ex-Soviet Republics has
posed particular challenges. Laws throughout the region have restricted the normal
operations of microfinance institutions, impeding their ability to run efficient, sustain-
able operations. Highlights of USAID-supported work in the region include:
■ Kazakhstan: The National Bank developed a law on Microcredit Organizations, which
is now under consideration by Parliament.
■ Kyrgyzstan: A new law, creating the legal and organizational foundation for microfi-
nance organizations, was adopted in 2002 with donor and stakeholder input.
■ Tajikistan: USAID is supporting efforts by the National Bank of Tajikistan to develop
stable and consistent microfinance laws and policies.
■ Uzbekistan: A new government resolution allows development agencies, for the first
time, to legally implement microcredit activities.

LINKING THE POOR TO OPPORTUNITY 21
One important elementof USAID’s work toimprove policy environ-ments for microenter-prises is a focus onstrengthening the voicesof microentrepreneursthrough independentbusiness associations toadvocate for policyreforms. These efforts,which have been fundedthroughout the Europeand Eurasia region, alsosupport U.S. goals ofestablishing democracyand encouraging civilsociety development.Anti-corruption effortsare also important, sincemicroentrepreneurs andinformal sector business-es are particularly vulner-able to predation bygovernment officials andinspectors at all levels.
USAID-supported insti-tutions help governments develop and instituteappropriate microfinance laws and regulations.Regulations on reserve requirements, forexample, can discriminate against micro andsmall borrowers by requiring high provisioningfor loans without collateral. Notarizationrequirements can dramatically increase thetransaction costs for microlending.
USAID’s efforts to deregulate interest rates arecritical in assisting MFIs to become self-sus-
taining. Many developing and transition coun-tries have policies limiting the interest ratesthat financial institutions can charge. Suchpolicies effectively prevent MFIs from charg-ing rates that adequately cover transactioncosts with microentrepreneurs, resulting inrationed capital and limited access to financialservices. As a result, many MFIs cannot expandservices without donor assistance.
ACDI/VOCA’s Agricultural Cooperatives in Ethiopia (ACE) project empowers small-holder farmers by supporting the development of cooperatives and unions. Here a member of the Oromia Coffee Union displays her shade-grown, organic coffee cherries.
Ph
oto
co
urt
esy
of
AC
DI/
VO
CA
.

22 LINKING THE POOR TO OPPORTUNITY
Reaching Further Down Market: Examples from the Field
Bringing the benefits of microfinance and BDS to poorer clients is a frontier issue for the microen-
terprise development field. Remarkable progress has been made in ensuring that poor
entrepreneurs have access to microenterprise services vital to the growth and profitability of their
businesses. However, the benefits of this access have generally been enjoyed more by moderately
poor households than by the very poor. That is not to say that the very poor have not benefited
from microenterprise development programs; rather, it is to point out that the field needs to do
more to find innovative ways to reach larger numbers of poorer and hard-to-reach clients sustain-
ably and cost-effectively.
Many USAID partners in BDS and microfi-
nance have been searching for solutions,
resulting in remarkably diverse approaches
and methodologies.
Business Development Services
Poorer microentrepreneurs face huge chal-
lenges as they seek to build their business-
es. Ongoing efforts to expand BDS to
poorer clients often focus on one or more
of these challenges.
Achieving a “critical mass” for service pro-
vision: A major factor constraining the availability of services to poorer microentrepreneurs in
remote, rural areas is the lack of a sufficient concentration of clients. Even when the clients are will-
ing to pay for the services, the costs of setting up the BDS for too few people may be prohibitive.
One strategy is to use existing or newly-formed groups (producer groups, cooperatives, MFI client
groups, or groups formed for other purposes, such as women’s health groups) to deliver services.
With the support of USAID-Ethiopia, for example, ACDI/VOCA is facilitating access to private BDS by
existing small farmer cooperatives so they can tap more lucrative markets for their horticultural
produce. As the farmers have been able to extend their reach into commercial markets, positive
effects can be seen in very poor households and in the wider economy.
Adapt the service: Poorer entrepreneurs generally need services that are different from those in
demand by small and medium enterprises. Existing BDS providers often are not equipped with the
tools or services to attract microenterprises. Yet with assistance from a facilitator, they can adapt
existing products and services to suit the needs of a subsector in which poor microentrepreneurs
are concentrated. In India, for example, IDE has adapted technology, “affordable micro-irrigation
technologies” (AMIT), to directly address the needs of very small horticulture producers. In three
years’ time, more than 15,000 AMIT kits were installed, providing benefit to more than 75,000 rural
farmers.
Adapting methods of payment: To better fit the cash flow realities of many poor microen-
trepreneurs, some BDS is delivered “embedded” within a business transaction, so the microen-
trepreneur incurs no additional expense. For example, when the Malian artisans sell their products
IDE Nepal pioneered the development of low-cost drip irrigationsystems.
Ph
oto
co
urt
esy
of
IDE.
to the exporters assisted by Action for Enterprise (p. 18) the mark-up on the export sales covers the
exporters’ provision of many embedded services such as marketing, production advice, and quality
control. Other institutions have innovated in a variety of ways to make their services more afford-
able. PRIDE/Formation in Guinea adapted its pricing structure for training to ensure affordability to
poor rural clients.
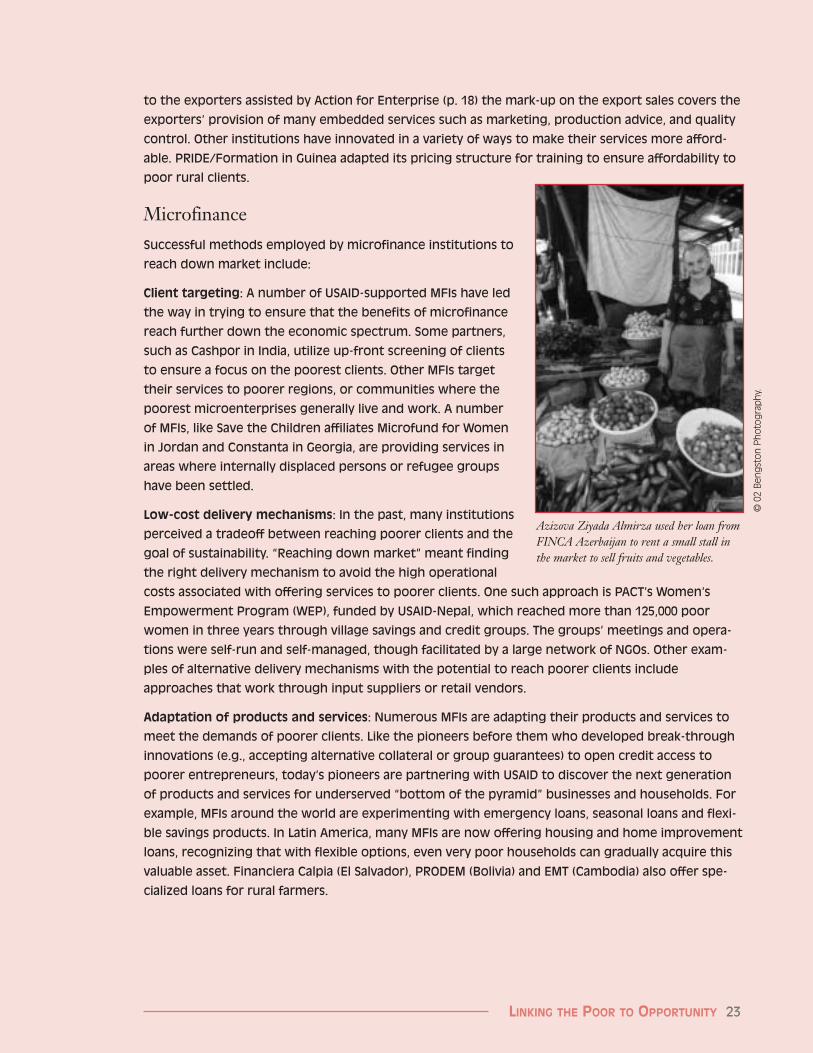
MicrofinanceSuccessful methods employed by microfinance institutions to
reach down market include:
Client targeting: A number of USAID-supported MFIs have led
the way in trying to ensure that the benefits of microfinance
reach further down the economic spectrum. Some partners,
such as Cashpor in India, utilize up-front screening of clients
to ensure a focus on the poorest clients. Other MFIs target
their services to poorer regions, or communities where the
poorest microenterprises generally live and work. A number
of MFIs, like Save the Children affiliates Microfund for Women
in Jordan and Constanta in Georgia, are providing services in
areas where internally displaced persons or refugee groups
have been settled.
Low-cost delivery mechanisms: In the past, many institutions
perceived a tradeoff between reaching poorer clients and the
goal of sustainability. “Reaching down market” meant finding
the right delivery mechanism to avoid the high operational
costs associated with offering services to poorer clients. One such approach is PACT’s Women’s
Empowerment Program (WEP), funded by USAID-Nepal, which reached more than 125,000 poor
women in three years through village savings and credit groups. The groups’ meetings and opera-
tions were self-run and self-managed, though facilitated by a large network of NGOs. Other exam-
ples of alternative delivery mechanisms with the potential to reach poorer clients include
approaches that work through input suppliers or retail vendors.
Adaptation of products and services: Numerous MFIs are adapting their products and services to
meet the demands of poorer clients. Like the pioneers before them who developed break-through
innovations (e.g., accepting alternative collateral or group guarantees) to open credit access to
poorer entrepreneurs, today’s pioneers are partnering with USAID to discover the next generation
of products and services for underserved “bottom of the pyramid” businesses and households. For
example, MFIs around the world are experimenting with emergency loans, seasonal loans and flexi-
ble savings products. In Latin America, many MFIs are now offering housing and home improvement
loans, recognizing that with flexible options, even very poor households can gradually acquire this
valuable asset. Financiera Calpia (El Salvador), PRODEM (Bolivia) and EMT (Cambodia) also offer spe-
cialized loans for rural farmers.
LINKING THE POOR TO OPPORTUNITY 23
Azizova Ziyada Almirza used her loan fromFINCA Azerbaijan to rent a small stall inthe market to sell fruits and vegetables.
© 0
2 B
eng
sto
n P
ho
tog
rap
hy.

24 LINKING THE POOR TO OPPORTUNITY
MICROENTERPRISE FUNDINGIN FY 2001
USAID has been the leading bilateraldonor of funds and technical assistance to
microenterprise development programs for thelast 20 years. Since 1988, when USAID beganformally tracking its microenterprise funding,USAID has committed nearly $2 billion tosupport microenterprise development. Duringthis time, huge strides have been made indeveloping systems and methods that delivermicroenterprise services, particularly financialservices, to the world’s poor.
In FY 2001, USAID contributed $158.7 mil-lion to microenterprise development pro-grams, a 3.4 percent decrease in funding
compared to the $164.3 million that USAIDprogrammed in 2000. As in recent years,Development Assistance (DA) funds constitut-ed more than half of the total for microenter-prise development.
The use of Economic Support Funds (ESF),authorized through the U.S. Department ofState, to support microenterprise developmentincreased by 43 percent in FY 2001 over FY2000. This resulted from a renewed commit-ment from USAID-Egypt, which typicallycontributes large sums annually to ongoingmicroenterprise activities.
Table 1. Sources of USAID Funds for Microenterprise byAppropriation Account, 1991-2001 (US$ millions)
Fund 1991 1992 1993 1994 1995 1996 1997 1998 1999 2000 2001
DA1 40.2 61.3 51.6 89.2 93.3 72.9 83.3 79.9 75.3 84.5 88.8AERA 2.0SADRF 1.5
Total DA 88.0 88.8
ESF 43.2 34.4 20.8 31.6 22.9 16.1 24.5 27.2 32.9 19.5 27.9
FSA 5.4 20.6 14.3 12.8 30.2 20.2
SEED/SAI2 4.7 24.8 4.6 12.0 9.0 7.6
CACEDRF 3.2 8.0
CSD/HIV .8 .5
Local 30.2 30.6 23.6 16.6 17.3 12.2 11.8 12.4 17.3 8.8 13.7Currency
Total 113.6 126.3 96.0 137.4 133.5 111.4 165.0 138.4 153.5 164.3 158.7
1 Development Assistance Funds include the Development Fund for Africa.
2 Funds appropriated under the Support for Eastern European Democracy (SEED) Act; also includes funds appro-priated under Special Assistance Initiatives (SAI).

LINKING THE POOR TO OPPORTUNITY 25
The FSA account, also authorized through theState Department, funds programs in Russia,Ukraine, the Caucasus, and the Central AsianRepublics. FY 2001 funding for microenter-prise from the Freedom Support Act (FSA)account decreased from the all-time recordfunding level from this account in FY 2000, but$20 million represents a continued major com-mitment to microenterprise development inthis region.
Local currency used for microenterprise (typi-cally from the monetization of Title II fundsunder P.L. 480) increased from FY 2000 levelsby more than 50 percent. The increase in FY2001 local currency corresponds to the $5 mil-lion in local currency derived from balance ofpayments by USAID-Egypt.
In FY 2000, 67 percent of total USAID funding went to financial services programs including loan capital, operational expenses,technical assistance, and microfinance policywork (see Table 2 above). The remaining 33 percent supported business development pro-
grams or policy advocacy on issues affectingmicroentrepreneurs.
Of the two-thirds of total funding applied tomicrofinance, $7.2 million or 7 percent wentfor financial policy reform for reforming orinstituting laws and regulations affectingmicrofinance institutions. Eleven percent ofnon-financial funding, or $5.9 million, sup-ported efforts to create an enabling environ-ment for microenterprises.
Total funding to Africa remained strong fol-lowing a record-breaking high of $43.8 millionin FY 2000. Funds for microfinance programsin Africa fell to $18.7 million in FY 2001, afterreaching $26 million in FY 2000, which result-ed in part from a commitment of $12 millionby USAID-Senegal to its nascent microenter-prise program. Funding for BDS continues tobe high in Africa where weak markets and rudi-mentary technologies pose major impedimentsto largely rural microentrepreneurs. In recentyears, USAID Missions in Ghana, Mozam-bique, Tanzania, and Zambia have provided
Table 2. FY 2000 Funding by Region of Use(US$ millions)
Financial Services and BDS and EnablingEnabling Environment Environment Total
Amount Percent Amount Percent Amount Percent
Africa $18.7 50 $19.0 50 $37.7 24
Asia/Near East $34.5 89 $4.3 11 $38.8 24
Europe/ Eurasia $18.7 66 $9.6 34 $28.3 18
Latin America/Caribbean $20.4 55 $16.5 45 $36.9 23
Worldwide1 $14.5 85 $2.5 11 $17.0 11
Total $106.8 67 $51.9 33 $158.7 100
1 Funds provided to North American headquater operations for institutions operating worldwide.

26 LINKING THE POOR TO OPPORTUNITY
large amounts of funding for ongoing BDSprograms.
In addition, funds for Latin America and theCaribbean dropped to $36.9 million from near-ly $43 million in FY 2000, a 14 percentdecrease. This drop does not reflect decreasedcommitment of USAID to microenterprisedevelopment in the region, but rather theabsence of a major crisis during FY 2001 neces-sitating special appropriations to the region. Inthe previous two years, special disaster-relatedappropriations to Guatemala ($9 million in1999) and Honduras ($8 million in 2000) havecontributed to large amounts of funding for theregion.
Table 3 presents the same data as in Table 2,only from the viewpoint of the funding sourcein the Agency rather than the destination offunds. The Bureaus for Africa, Europe andEurasia, and Latin America and the Caribbeanprovided roughly equal amounts to microen-terprise programs. The Bureau for Asia and theNear East was the only source showing a sig-nificant increase from the prior year (up $15.4
million or 51 percent), due to the renewedcommitment of funding by USAID-Egypt.
Funds for the Poor
Because of its priority to assist poor and verypoor households, USAID collects and reportsinformation on the poverty level of clients ofUSAID-sponsored microenterprise develop-ment institutions. Loan size, while not an actu-al measure of the client’s poverty status, haslong been the widely accepted proxy indicatorfor estimating the extent of service to poorerclients. In accordance with the Microenterprisefor Self-Reliance Act of 2000, poverty loans aredefined by region as:
■ $300 or less in Asia, the Near East, andAfrica;
■ $400 or less in Latin America and theCaribbean; and
■ $1,000 or less in Eastern Europe andEurasia.
USAID and its partners are beginning to testadditional proxies and measurement tools for
Table 3. Uses of FY 2001 Funding by USAID Bureau(US$ millions)
Financial Services and BDS and EnablingEnabling Environment Environment Total
Amount Percent Amount Percent Amount Percent
Africa Bureau $13.3 43 $17.8 57 $31.1 20
Asia/Near East Bureau $34.6 92 $3.1 8 $37.7 24
Europe/Eurasia Bureau $18.1 65 $9.6 35 $27.7 17
Latin America/ Caribbean Bureau $15.5 50 $15.7 50 $31.2 20
Global Bureaus $25.3 82 $5.7 20 $31.0 20
Total $106.8 67 $51.9 33 $158.7 101

LINKING THE POOR TO OPPORTUNITY 27
the poverty level of microenterprise clients.Until new tools are agreed upon, USAID willcontinue to use loan size to estimate the num-ber of very poor clients receiving services.Clearly, loan size is less applicable to BDS pro-grams, which are not always linked with finan-cial services.
As in prior years, microfinance institutionsreported on the percentage of their portfolioheld in loans equivalent to poverty loan sizes.Following the regional limits noted above,more than one-half (54%) of FY 2001 fundingto financial institutions was channeled to thevery poor through microfinance institutions. USAID funding to BDS programs is proratedbased on the percentage of BDS clients withpoverty loans. Fifty percent (50%) of BDSfunding went to very poor clients, based onBDS institutional reports.
Combining the amounts for both financial andnon-financial purposes, fifty-three percent oftotal funding supported very poor clients,meeting the poverty target included in theMicroenterprise for Self-Reliance Act.7
Funds for Private VoluntaryOrganizations
In addition to funding program activities,USAID has a long and successful history ofassisting U.S.-based PVOs and their local part-ners to expand service delivery in a sustainablemanner. More than a dozen U.S.-based privatevoluntary organizations (PVOs) have createdextensive multi-country networks of individ-ual microenterprise development institutionsoperating under similar models, through whichthey reach large numbers of clients. Such net-works were built with significant U.S. support.Table 5 shows the amounts of USAID supportto several large PVO networks that have spe-cialized in microfinance. Total funding to theinstitution and its network affiliates, combiningfunds from both USAID field and centraloffices, are included. The number of clientsshown represents all clients in the network.
For many years, the Office of Private andVoluntary Cooperation (PVC) MatchingGrants Program has fostered innovativeapproaches to development assistance, and
Table 4. Percentage of Funds Committed toPoverty Lending, FY 2001
Total Percent of Percent of Percent of Microenterprise Financial Non-Financial Total Funding
Funding Funding for Funding for for Poverty (US$ millions) Poverty Lending Poverty Loan Clients Lending
Africa $31.1 72% 73% 72%
Asia/Near East $37.7 42% 65% 44%
Europe/Eurasia $27.7 47% 28% 40%
Latin America $31.2 72% 34% 53%
Global Bureaus $31.0 50% 33% 47%
Total all Bureaus $158.7 54% 50% 53%
7 For a more complete description of USAID’s methodology to estimate funds to very poor clients, see Appendix 1:Methodology to Calculate Percentage of Funds for the Poor.
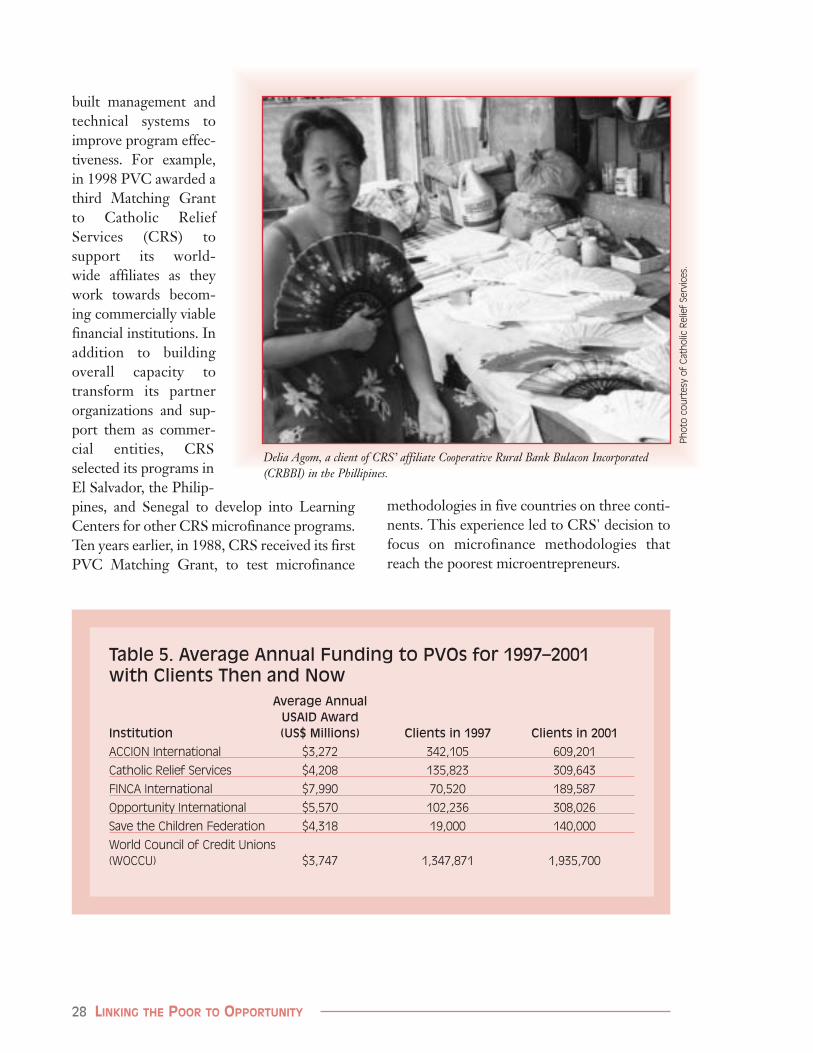
28 LINKING THE POOR TO OPPORTUNITY
built management andtechnical systems toimprove program effec-tiveness. For example,in 1998 PVC awarded athird Matching Grantto Catholic ReliefServices (CRS) to support its world-wide affiliates as theywork towards becom-ing commercially viablefinancial institutions. Inaddition to buildingoverall capacity totransform its partnerorganizations and sup-port them as commer-cial entities, CRSselected its programs inEl Salvador, the Philip-pines, and Senegal to develop into LearningCenters for other CRS microfinance programs.Ten years earlier, in 1988, CRS received its firstPVC Matching Grant, to test microfinance
methodologies in five countries on three conti-nents. This experience led to CRS' decision tofocus on microfinance methodologies thatreach the poorest microentrepreneurs.
Table 5. Average Annual Funding to PVOs for 1997–2001with Clients Then and Now
Average AnnualUSAID Award
Institution (US$ Millions) Clients in 1997 Clients in 2001
ACCION International $3,272 342,105 609,201
Catholic Relief Services $4,208 135,823 309,643
FINCA International $7,990 70,520 189,587
Opportunity International $5,570 102,236 308,026
Save the Children Federation $4,318 19,000 140,000
World Council of Credit Unions (WOCCU) $3,747 1,347,871 1,935,700
Delia Agom, a client of CRS’ affiliate Cooperative Rural Bank Bulacon Incorporated(CRBBI) in the Phillipines.
Ph
oto
co
urt
esy
of
Cat
ho
lic R
elie
f Se
rvic
es.
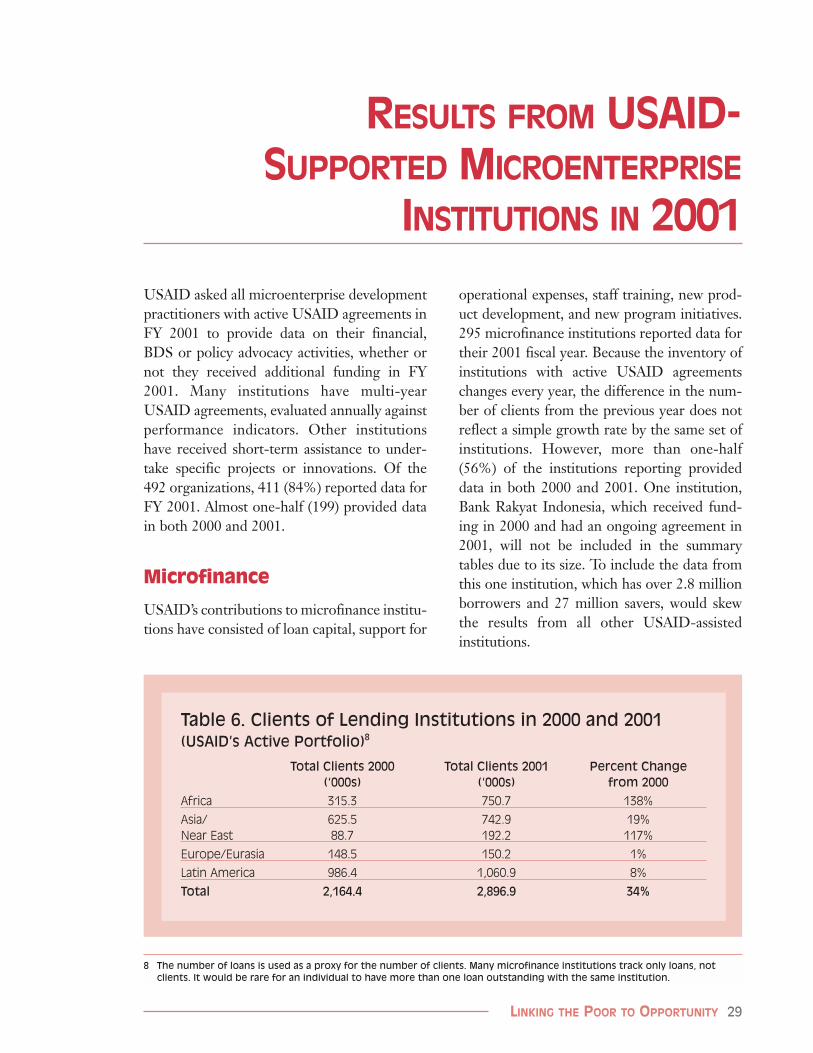
LINKING THE POOR TO OPPORTUNITY 29
RESULTS FROM USAID-SUPPORTED MICROENTERPRISE
INSTITUTIONS IN 2001
USAID asked all microenterprise developmentpractitioners with active USAID agreements inFY 2001 to provide data on their financial,BDS or policy advocacy activities, whether ornot they received additional funding in FY2001. Many institutions have multi-yearUSAID agreements, evaluated annually againstperformance indicators. Other institutionshave received short-term assistance to under-take specific projects or innovations. Of the492 organizations, 411 (84%) reported data forFY 2001. Almost one-half (199) provided datain both 2000 and 2001.
Microfinance
USAID’s contributions to microfinance institu-tions have consisted of loan capital, support for
operational expenses, staff training, new prod-uct development, and new program initiatives.295 microfinance institutions reported data fortheir 2001 fiscal year. Because the inventory ofinstitutions with active USAID agreementschanges every year, the difference in the num-ber of clients from the previous year does notreflect a simple growth rate by the same set ofinstitutions. However, more than one-half(56%) of the institutions reporting provideddata in both 2000 and 2001. One institution,Bank Rakyat Indonesia, which received fund-ing in 2000 and had an ongoing agreement in2001, will not be included in the summarytables due to its size. To include the data fromthis one institution, which has over 2.8 millionborrowers and 27 million savers, would skewthe results from all other USAID-assisted institutions.
Table 6. Clients of Lending Institutions in 2000 and 2001(USAID’s Active Portfolio)8
Total Clients 2000 Total Clients 2001 Percent Change (‘000s) (‘000s) from 2000
Africa 315.3 750.7 138%
Asia/ 625.5 742.9 19%Near East 88.7 192.2 117%
Europe/Eurasia 148.5 150.2 1%
Latin America 986.4 1,060.9 8%
Total 2,164.4 2,896.9 34%
8 The number of loans is used as a proxy for the number of clients. Many microfinance institutions track only loans, notclients. It would be rare for an individual to have more than one loan outstanding with the same institution.

30 LINKING THE POOR TO OPPORTUNITY
Since 2000, the number ofclients reached withUSAID assistance hasincreased by 34 percent(see Table 6). For thoseinstitutions reporting inboth 2000 and 2001, therewas an annual growth rateof 20 percent (318,000more clients for 164 insti-tutions). In Africa and theNear East, in particular,institutions reported con-siderable growth in thenumbers of clients reached.
As in prior years, loan portfolio value in theLAC region, where average loan size is $558,constitutes nearly two-thirds of the total port-folio of USAID-assisted institutions. Theamount of total outstanding portfolio grew bysix percent in 2001 to $917.7 million, despite adecrease in overall average loan size per client.Average loan size went down more than 20percent, from $401 in 2000 to $317 in 2001.
As shown in Table 7, the percentage of womenclients in USAID-supported microfinanceinstitutions is high for all regions. One remark-
able statistic is the jump in the percentage ofwomen clients in the Near East, climbing from27 percent in FY 2000 to 52 percent in FY2001.
Programs in Egypt provide an example of thischanging mix of clients by USAID-supportedinstitutions. In FY 2000, 6 Egyptian microfi-nance institutions reported a total of 72,634clients, with average loan size of $506. Onlyseventeen percent of these clients were women.In FY 2001, these same institutions reported95,063 clients (a 31% increase) with average
Table 7. Average Loan Balance9 and Percentage of WomenClients in 2001 (USAID’s Active Portfolio)
Average Balance (US$) Percentage of Women Clients
Africa 189 69
Asia/ 81 92Near East 332 52
Europe/Eurasia 398 60
Latin America/Caribbean 558 69
Total 317 73
Asia 7%
Europe/Eurasia
7%
Near East 7%
Africa 15%
Latin America/Caribbean
64%
Figure 1. Amount of Portfolio for Lending Institutions in 2001 (US$ Millions)
9 Institutions report on the total amount of loan balances outstanding at the end of their fiscal year and the related numberof loans. Average loan balance is a proxy for loan size.

LINKING THE POOR TO OPPORTUNITY 31
APIM/MaliThe Association of Professional Institutions of Microfinance (APIM) is a non-profit associa-
tion working to develop the microfinance sector in Mali. APIM supports and advocates on
behalf of its members, which include more than two dozen microfinance institutions
serving more than 300,000 microenterprise clients. USAID assistance has helped APIM
develop a strategic plan, an information and communications strategy, and a financial
management system to better serve its members.
Developments in the Near EastIn FY 2001, USAID provided US $26 million to expand and strengthen microenterprise ser-
vice markets throughout the Near East. Following are the highlights of activities in the
region:
■ Jordan: USAID has committed approximately $30 million to microfinance in Jordan.
Program components include: 1) operational support to four retail MFIs; 2) a credit
information bureau; 3) a comprehensive technical assistance program; 4) the cre-
ation of the Microfinance Association of Jordan; 5) a new product development pro-
gram; and 6) reform of legal and regulatory barriers to promote sustainable
microfinance.
■ Egypt: USAID has played a key role in the development of Egypt's small and micro
enterprise (SME) sector since 1990. USAID-assisted institutions (nine SME foundations,
two commercial banks, and a private corporation), have disbursed 793,000 loans to
more than 325,000 small and micro enterprises.
■ Lebanon: With USAID support, Save the Children Federation (SCF) and CHF have suc-
cessfully established local partners, Al Majmoua and AMEEN, respectively. Al Majmoua
now operates throughout the country and at six Palestinian refugee camps. AMEEN
partners with local banks to provide individual loans.
■ Morocco: With USAID funding, Volunteers in Technical Assistance (VITA) helped to cre-
ate Association Al Amana, which now has 80 credit branch offices with more than
50,000 clients. USAID has also supported Fondation Zakoura, another large MFI, in its
efforts to extend lending to rural areas. In addition, the Mission has provided funding
to a new national microfinance association (FNAM).
■ West Bank/Gaza: USAID launched a program to initiate microlending within 2 com-
mercial banks, the Bank of Jordan and the Arab Bank. The banks initially committed
$3 million of their own capital for this purpose. Results have been impressive, with
over 5,900 loans made in two years. The number of branches engaged in microlend-
ing has doubled during this same time period.

32 LINKING THE POOR TO OPPORTUNITY
loan size of $342. Forty-five percent of theseclients were women.
Table 8 shows the high percentage of totalloans that were poverty loans in all regions.Especially noteworthy is the dramatic increasein the percentage of poverty loans in the NearEast. Where microfinance institutions in theNear East reported that only thirty-one per-cent of loans held were in amounts equal to orless than $300 in 2000, more than half (56%) ofthe loans held at year end 2001 were povertyloans.
The Savings Safety Net
Microenterprise development practitionersdiscovered long ago that many very poorhouseholds are more likely to save to meet bothexpected and emergency demands for cashthan they are to seek loans. Without the secu-rity of an external safety net, poor householdsdraw on cash savings, or sell assets, such as ani-mals, in the event of a crisis or setback. USAIDhas long emphasized the need for safe and reli-able savings mechanisms suitable for the poor.
Table 9. Number of Savers and Savings Amounts in 2001Region Savings Members Savings Amounts Average Savings Account
(‘000s) (US$ millions) (US$)
Africa 757.2 $49.2 $65
Asia/ 1,087.3 $34.5 $32Near East 2.7 $0.07 $26
Europe/Eurasia 150.8 $9.4 $62
Latin America/Caribbean 1,516.2 $331.6 $218
Total 3,514.2 $424.8 $121
Table 8. Clients with Poverty Loans in 2001Number of
Region Number of Loans Poverty Loans Percent Poverty
(‘000s) (‘000s) Loans
Africa 750.7 492.4 66%
Asia/ 742.9 638.0 86%Near East 192.2 108.5 56%
Europe/Eurasia 150.2 132.1 88%
Latin America/Caribbean 1,060.9 628.2 59%
Total 2,896.9 1,999.2 69%

LINKING THE POOR TO OPPORTUNITY 33
Of the 295 USAID-supportedmicrofinance institutions providingdata in 2001, more than two-thirds(207 or 70%) have active savingsprograms for microenterpriseclients.10 Of these, the majority(84%) requires that their loanclients maintain a savings account asloan collateral. More than fifty per-cent (107) of the savings institutionsoffer voluntary savings to theirclients as well.
Table 10 shows the top eight sav-ings institutions, or ‘institution net-works’, supported by USAID in2001. These eight account for fifty-one percent of the clients and forty percent ofthe savings held by all the USAID supportedinstitutions shown in Table 9. Three of the topeight are in Latin America, three in Asia, one inAfrica, and one in Europe.
The data shown for each of the WOCCU net-works represents the activities of many smallcredit unions located throughout the country.For example, WOCCU/Ecuador has 22 affili-ated credit unions, Kenya has 16 credit unions,
Table 10. Leading Savings Institutions or NetworksSupported by USAIDInstitution Name Savings Amounts Average Savings
Savings Members (US$) Account (US$)
WOCCU/Ecuador 914,485 $ 75,988,230 $83
WOCCU/Honduras 194,034 $ 34,430,016 $177
WOCCU/Philippines 171,561 $ 15,758,701 $92
PACT/Nepal 122,406 $ 1,659,862 $14
WOCCU/Kenya 120,582 $ 4,379,049 $36
WOCCU/Romania 105,015 $ 5,181,554 $49
Rural Green Bank ofCaraga, Philippines 97,852 $ 1,540,409 $16
WOCCU/Bolivia 69,955 $ 32,682,018 $467
Total 1,795,890 $ 171,619,839 $96
10 Includes BRI in Indonesia.
A client of WOCCU/Kenya.P
ho
to c
ou
rtes
y o
f W
OC
CU
.

34 LINKING THE POOR TO OPPORTUNITY
Romania has 23 individual credit unions, andBolivia has 15 credit unions.
USAID continues to emphasize outreach tomicroentrepreneurs located in rural areas,
where the poorest households reside. Data inTable 11 suggest that many USAID-supportedinstitutions are making real progress in reach-ing rural microenterprises with microfinanceservices. In Africa, for example, the percentageof loan clients in rural areas has increased from37 percent in 2000 to 61 percent in 2001. Sincemany microfinance programs began in urbanand peri-urban settings, a shift towards morerural borrowers reflects the successful adapta-tions by microfinance institutions that havechosen to enter rural markets.
USAID offices and missions actively monitorthe microfinance institutions they support toensure quality of service. Data on repaymentand loan losses are shown in Table 12. Thesestandard indicators are used in microfinance tomonitor financial performance.11
USAID offices track sustainability indicators asan important measure of partner institutional
Constanta Foundation, Georgia: Reaching Sustainability and Poor ClientsConstanta is a Georgian microfinance institution created in 1998 after the civil war, with
assistance from Save the Children. It designed its products and outreach strategy to
ensure service to women who were internally displaced persons, typically supporting
families on their own. Constanta now has an active client base of over 14,000, and has
served over 21,000 very disadvantaged microentrepreneurs. Seventy percent of its clients
are women.
Constanta’s methodology, which includes both group and individual loans, has enabled it
to expand its outreach dramatically while simultaneously improving the quality of its
portfolio. Repayment rates are at 98%. In 2002 Constanta reached an operational self-suf-
ficiency of 202% and financial self-sufficiency of 174%. This achievement is the result of
establishing new branches and new products that helped to ensure client loyalty and
increased demand for Constanta’s services.
11 Loan repayment is calculated based on the amount of portfolio reported to be in arrears for 90 days or more. Loan lossrates show the percent of portfolio that must be written off because of delinquent loans.
Table 11. Location ofMicrofinance Clients,2001
Rural Urban
Percent Percent
Africa 61 39
Asia/ 85 15Near East 27 73
Europe/Eurasia 17 83
Latin America/Caribbean 35 65
Total 53 47

LINKING THE POOR TO OPPORTUNITY 35
development. Operational sustainability occurswhen the institution produces adequate incomefrom interest and fees to cover all its opera-tional expenses, including loan losses. Full sus-tainability occurs when the institution is able to cover all operational expenses, plus the costof raising its loan funds from commercialsources, adjusted for the effects of inflation andsubsidies.
As shown in Table 13, more than one-half ofUSAID-assisted institutions reporting forFY 2001 are either operationally or fully
sustainable. It is especially impressive thatthe newer institutions of the Europe andEurasia region are achieving operational orfull-sustainability so quickly. ConstantaFoundation in Georgia, which has onlybeen in operation for 5 years, is a goodexample of how this is being accomplishedin a relatively short period of time.
Business DevelopmentServices
Business services are often a key factor inhelping poor microentrepreneurs build ameaningful economic livelihood from ameager income-generating activity. Whileloans create opportunities that lead to the
potential for growth, many microen-trepreneurs are unable to take advantage ofsuch opportunities because they lack otherresources, including basic business skills andknowledge of better markets. Business devel-opment services include a range of servicesoffered to microenterprises that help them putall the ingredients together to make their busi-ness a success.
The inventory of BDS institutions that USAIDsupported in 2001 reflects a field in transition.
Table 13. Sustainability of USAID-Supported Institutions, 2001Not Yet Operational Fully
Region Sustainable Sustainability Sustainable
Africa (n=81) 60% 14% 26%
Asia/Near East (n=101) 46% 11% 43%
Europe/Eurasia (n=44) 46% 20% 34%
Latin America/Caribbean (n=68) 37% 18% 45%
Total (n=294) 47% 15% 38%
Table 12. AverageRepayment and Loan LossRates, 2001
Repayment Loan Loss
Percent Percent
Africa 98.5% 1.6%
Asia/ 94.2% 5.1%Near East 95.2% 2.5%
Europe/Eurasia 93.9% 1.9%
Latin America/Caribbean 91.6% 0.8%
Total 93.3% 1.4%

36 LINKING THE POOR TO OPPORTUNITY
Many institutions are engaged in directlyproviding more traditional BDS type activi-ties such as business training, while someinstitutions reflect the new, market-ledapproach to BDS described earlier in thisreport. USAID is leading the way in pro-moting the expansion of private BDS mar-kets, which aims to achieve massive outreachas well as full sustainability. As the means tothis end becomes more widely understood inthe field, more of the USAID-assisted insti-tutions reporting data will reflect thisapproach.
Of the institutions with active USAID agree-ments for BDS to microentrepreneurs in 2001,98 reported data on their clients. Seventy-twoof these provided services directly to microen-trepreneurs. Forty-nine facilitated BDS provi-sion, that is they worked at a market level toassist BDS provider organizations to expandmarkets, build capacity, or boost clientdemand. Twenty-three organizations wereboth providers and facilitators.
In 2001 the number of microenterprise clientsreached with BDS through USAID assistanceincreased more than threefold from 2000,(from 250,000 clients to more than 800,000clients, see Table 14). Nearly three-quarters ofthese clients are reached through the activitiesof institutions that facilitate BDS or workthrough other organizations, while the remain-ing one-quarter is reached through direct BDSproviders. In this way, USAID leverages theimpact of its development assistance by fund-ing activities that have the potential for greateroutreach, particularly to rural clients. As anexample, in Peru USAID has supported theefforts of Swiss Contact, which provided BDSto both microentrepreneurs and organizationsin 2001. Through its direct assistance tomicroentrepreneurs, it provided services to1,700 clients; through assistance to other BDSorganizations it had outreach to another 6,000clients.
BDS Providers
USAID promotes BDS programs that con-tribute to the microenterprise economythrough a variety of means. Following aresome of the ways that USAID-assisted BDSpractitioners supported clients’ business activi-ties in 2001:
■ More than 70 percent performed marketresearch or built market linkages;
■ More than 70 percent offered businessmanagement or technical training, or pro-vided individual business managementassistance to clients;
■ More than 60 percent undertook researchand development to introduce or adaptproduction technologies;
■ More than 50 percent provided financialservices directly or linked their clients tofinancial services;
■ More than 50 percent used subsector anal-ysis to provide strategic services tomicroentrepreneurs; and
■ More than 40 percent were also engaged inadvocacy for clients on microenterpriselegal and regulatory issues.
Many of the organizations reported data ontheir USAID-assisted work with underserved,poorer populations, such as refugees and inter-nally displaced persons, rural youth and
A client of Swiss Contact Peru.
Ph
oto
co
urt
esy
of
Swis
s C
on
tact
Per
u.

LINKING THE POOR TO OPPORTUNITY 37
women, and poor farmers. For example, CHFhas worked with internally displaced persons inAzerbaijan providing business training andconsultation and helping to build associationsof microentrepreneurs in particular industriesand commodities.
Most BDS clients (80%, see Table 14) reside inrural areas. Many organizations have the objec-tive to reach out to rural areas where microen-trepreneurs are constrained by poor infra-structure, limited markets, and inadequateinformation. In Mozambique, for example,TechnoServe assists businesses that source rawmaterials from the rural poor or employ therural poor. To track progress toward its objec-tive, TechnoServe monitors the number ofrural poor suppliers reached, the value of prod-ucts purchased from these suppliers, the num-ber of rural poor employed, and wages paid tothe rural poor.
BDS providers view tracking details about theirclients as critical to successful program imple-
mentation. Three quarters (75%) of the BDSproviders monitor client income data to mea-sure the effect of their services. Half also mon-itor household income.
BDS Facilitators
As noted above, USAID frequently funds insti-tutions that achieve wide outreach by enhanc-ing the effectiveness of BDS providers andstimulating demand for BDS. Whereas BDSproviders may focus on more local markets,working with relatively small numbers ofentrepreneurs, BDS facilitators may addressconstraints across a wider area, seeking to openregional or foreign markets to an entire sector.Support offered by BDS facilitators affects thequality and range of BDS services available aswell as the demand for these services.
Of the 49 reporting organizations that servedas BDS facilitators in 200112,
■ 43 (88%) were engaged in capacity build-ing of BDS providers;
Table 14. Clients of USAID-Funded BDS Programs, 2001 (Providers and Facilitators)
Numberof Micro Percent Percent Percent below PercentClients Women Rural Poverty Line1 Very Poor2
Africa 472,134 27% 88% 71% 35%
Asia/ 150,496 95% 91% 44% 15%Near East 16,480 30% 83% 68% 20%
Europe/Eurasia 66,618 62% 70% 55% 26%
Latin America 79,730 57% 44% 54% 24%
Worldwide 50,000 60% 50% 80% 50%
Total 835,458 47% 80% 64% 30%
1 Data are estimates of number of clients below poverty line reported by respondents.
2 Data are estimates of numbers of clients earning less than half the income designated as the country’s poverty line.
12 Twenty-three of these organizations are also BDS providers.

38 LINKING THE POOR TO OPPORTUNITY
■ 41 (84%) performed regular monitoringand evaluation of business services;
■ 39 (80%) trained trainers;
■ 37 (75%) provided market information services to microenterprise organizations;
■ 36 (73%) linked entrepreneurs to new business opportunities or networks; and
■ 34 (69%) identified new market oppor-tunities and innovative products formicroentrepreneurs.
BDS facilitators, like BDS providers, put effortinto tracking the impact of their services. Ofthe facilitators reporting, forty-three (88%)
tracked indicators that included customer satis-faction, gross business profit, increases inemployment and sales, business starts, changesin business practices, and awareness of businessservices available.
Both facilitators and providers are workingtowards cost-recovery, though the majority ofUSAID-supported institutions are not yet self-sustaining. Among the ways that institutionsrecover costs are by charging fees to theirclients, adding margins on goods sold, andthrough bundling BDS with other services.Nineteen (38%) of the facilitators and thirty-one (43%) of the providers recover coststhrough these means.
JOBS Bangladesh: Linking to Opportunity ThroughProducer AssociationsJob Opportunities and Business Support (JOBS),
a microenterprise support activity funded by
USAID in Bangladesh, facilitated market access
and working capital for the Modhupur
Pineapple Association. With assistance from
JOBS, this association established a relationship
with PRAN, a large agricultural processor in
Dhaka. As a result, members of the association
were able to sell their pineapples to PRAN at
twice the amount they would have received on
the local market.
Following this success, 12 more associations
were established and a network created. With
JOBS assistance each of the 13 associations has
increased the size of its operations, from 30 to
70 acres. The Modhupur Association has also obtained loans from the Social Investment
Bank Limited to enable members to expand operations, purchase additional land, and
grow more crops.
Women organized by JOBS for making handmade paper, a good example of clusterdevelopment.
Ph
oto
co
urt
esy
of
IRIS
.

LINKING THE POOR TO OPPORTUNITY 39
POLICY ADVOCACY AND REFORM
In FY 2001 USAID provided funds to twen-ty-two institutions for the purpose of under-
taking policy reform either in the areas ofmicrofinance regulation or policies affectingmicroenterprises generally. Eighteen institu-tions reported on their activities for the year; ofthese, seven had received funding in FY 2001. Twelve of the eighteen institutions wereengaged in dialogue on microfinance regula-tion, including credit union reform, and thesupervision of second-tier lending institutions.In Ecuador and Kazakhstan, USAID hasworked directly with the Central Bank toencourage appropriate microfinance regula-tion. In Jordan and Ecuador, USAID has pro-vided funds to set up credit bureaus that willassist microfinance institutions to better servetheir clients.
Funding for policies that affect the generalbusiness environment contribute to levelingthe playing field for microenterprises in many
ways. For example, in Senegal USAID has sup-ported the development of a fair judicial pro-cess and a system for arbitration of disputes,either labor or commercial, involving microen-terprises. In Mozambique, USAID funded theefforts of ACDI/VOCA to review the businessregulation framework for cooperatives, whichare the economic backbone of this largelyagrarian economy. Strengthening cooperativesmakes them more commercially competitive,particularly in the area of foreign trade whereformal enterprises dominate markets.
USAID places high priority on its work in thepolicy arena. While having an impact on manymore entrepreneurs in the short-term, suchchanges in the policy environment will alsoaffect the shape of things for many years tocome in these emerging economies. With amore level playing field, microenterprises havea better chance of thriving in the midst ofchange and destabilizing forces to become reli-able sources of income for poor households.
Credit Policy Improvement Program (CPIP) in the Philippines
The Credit Policy Improvement Program (CPIP), begun in 1996, has the goal of helping to
bring about increased financial services to the Filipino poor through policy reform.
Through a series of policy notes, workshops, seminars, and other strategic forms of
advocacy, including study tours to Indonesia and several Latin American countries, CPIP’s
technical assistance has resulted in critical credit policy reforms and strengthened the
National Credit Council (NCC). Specific accomplishments include: (i) adoption by the
Philippine Government of the National Strategy for Microfinance; (ii) enactment of the
Social Reform and Poverty Alleviation Act; (iii) enactment of the Agriculture and Fisheries
Modernization Act; (iv) issuance of Executive Order 138 directing Government Non-
Financial Agencies to cease implementing credit programs and Government Financial
Agencies to adopt the Credit Policy Guidelines of the NCC; (v) formulation of the
Agricultural Modernization Credit and Financing Program; and (vi) recognition of the NCC
as the chief governmental agency responsible for credit formulation.

40 LINKING THE POOR TO OPPORTUNITY
CONCLUSIONS
At the core of microenterprise developmentis a fundamental belief that people in
developing countries can and will improvetheir own lives, when they have access to theappropriate tools and opportunities.
For microenterprise practitioners, financialservices and BDS are those tools. Access tofinancial services empowers and protects poorpeople by giving them choices and economicsecurity. Access to BDS improves the bottomlines of both microentrepreneurs and the busi-nesses and organizations that serve them. Bothmicrofinance and BDS can help break downthe isolation that too often dooms the enter-prises owned by the poor to marginality.
The ultimate goal is a world in which poor andvery poor entrepreneurs benefit from perma-nent access to a wide range of financial andnon-financial services, delivered through avariety of convenient mechanisms by differenttypes of institutions, in a competitive marketthat promotes customer satisfaction. USAID,through its continued leadership and invest-ment in microenterprise development andresearch, is building the foundation to achievethat goal. Through its commitment tomicroenterprise development, USAID is help-ing to build stronger, more democratic soci-eties where the poor have more of a say in theirown future and more of a chance to benefitfrom the globalized world economy.
USAID Russia: Building the Microfinance Market,Not Just InstitutionsUSAID’s activities in Russia are now focusing on the needs of the microenterprise sector
as a whole, rather than on capacity building of a few select institutions. One of USAID’s
most important contributions to the microfinance industry was its support in creating
the Russian Microfinance Center (RMC). The RMC’s principle roles are to:
■ Provide training to microfinance institutions;
■ Disseminate best practices and standards;
■ Maintain a dialogue with leaders in Russia and in international microfinance; and
■ Implement a system of informational exchange, annual conferences and workshops.
In June 2002, USAID sponsored a weeklong visit of financial and business leaders of the
Russian State Duma, to learn about microenterprise development and its role in
strengthening the Russian economy. The visit, organized by FINCA, featured a forum on
Capitol Hill with 14 Members of Congress, including Speaker Dennis Hastert and Sen.
Hillary Rodham Clinton.
Key microfinance partners in Russia have included FINCA, Counterpart International,
Opportunity International, and ACDI/VOCA. Combined, these institutions now reach more
than 40,000 borrowers.
LINKING THE POOR TO OPPORTUNITY 41
APPENDIX I: METHODOLOGY
TO CALCULATE PERCENTAGE
OF FUNDS FOR THE POOR
USAID collects and reports information onthe amount of funds allocated to very
poor clients, as determined by the amount ofportfolio (for MFIs) or number of clients (forBDS programs) with poverty loans. Loan size,while not an actual measure of the client’spoverty status, is the currently accepted proxyindicator in the microenterprise developmentfield for estimating the extent of service topoorer clients.
In accordance with the Microenterprise for Self-Reliance and International Anti-Corruption Act of 2000, poverty loans aredefined by region as:
■ $300 or less in Asia, the Near East, andAfrica;
■ $400 or less in Latin America and theCaribbean; and
■ $1,000 or less in Eastern Europe andEurasia.
Calculation of funds for microfinance: ForMFIs, an institution’s poverty lending ratio isdetermined by dividing the amount of portfo-lio held in poverty loans by the total portfolioamount for that institution. The result is thenmultiplied by the amount of the obligation tothe institution, to give the amount of funds thatcan be attributed to poverty lending. Adding
these amounts together for the universe ofinstitutions reporting data in the current yearprovides the actual amount of total funds forpoverty lending. The proportion of total fundsfor poverty lending is then determined basedon the ratio of the sum of funds for povertylending by these institutions to the totalamount of funds for microfinance provided tothese institutions. Institutions with currentlending activities that reported data are includ-ed in this summary, which presents an accuratereflection of USAID support to the microfi-nance industry. Funds for microfinance forwhich there is no corresponding data includenewly initiated activities and the technical sup-port activities of the Microenterprise Develop-ment Division.
Calculation of funds for BDS: Funds for thevery poor are calculated based on the numberof BDS clients with poverty loans. USAIDdivides the number of BDS clients with pover-ty loans by the total number of BDS clients,and multiplies that ratio by the total funds obli-gated to the institution for the current year toobtain the amount of funds channeled to thevery poor. The sum of funds that can beattributed to very poor clients is then dividedby the total amount of funds obligated to theseinstitutions to give the percentage of total BDSfunds that can be attributed to funds for thevery poor.

42 LINKING THE POOR TO OPPORTUNITY
APPENDIX II: USAID’S ANNUAL
MICROENTERPRISE SURVEY
Tables 15 and 16 contain information onthe respondents to USAID’s annual
microenterprise survey undertaken by Micro-enterprise Results Reporting (MRR).13 In
2001, 295 microfinance, 98 BDS institutionsand 18 policy institutions responded to the survey.
Table 15. USAID’s Microenterprise Survey Respondents, 2001
Types Microfinance Business Policy Survey Development Survey Survey Total
Banks1, 2 59 1 - 60
Business Associations 5 2 1 8
Consulting Firms 1 8 8 17
Cooperatives/Credit Unions 36 10 2 48
For-Profits/Finance Companies 4 1 - 5
Government Agencies - 1 - 1
NGOs 135 30 1 166
Non-Bank Financial Institutions 19 1 - 20
PVOs 36 37 3 76
Research Institutions - 4 2 6
Other - 3 1 4
Total2 295 98 18 411
1 Includes rural banks that function more as village banks than as commercial banking facilities.
2 Total includes Bank Rakyat Indonesia (BRI).
13 Microenterprise Results Reporting (MRR), implemented by Weidemann Associates, Inc. through a contract with the BarentsGroup of KPMG Consulting, is responsible for collecting and reporting on USAID’s microenterprise funding and institutionalresults. This report was prepared by Catherine Neill of Weidemann Associates, Inc, under the direction of Katharine McKee,Director (USAID/EGAT/MD), with assistance from Mark Engmann and Geoffrey Chalmers.

LINKING THE POOR TO OPPORTUNITY 43
Tab
le 1
6. U
SAID
Fu
nd
ing
fo
r M
icro
en
terp
rise
Inst
itu
tio
ns,
200
11
Mic
rofi
na
nce
En
ab
ling
Mic
roe
nte
rpri
se E
na
blin
gTo
tal
Mic
rofi
na
nce
En
vir
on
me
nt
BD
SE
nv
iro
nm
en
tO
blig
ati
on
s2
Am
ou
nt
Am
ou
nt
Am
ou
nt
Am
ou
nt
Am
ou
nt
US$
(0
00’s
)N
um
be
rU
S$ (
000’
s) N
um
be
rU
S$ (
000’
s)N
um
be
rU
S$ (
000’
s) N
um
be
rU
S$ (
000’
s)
Nu
mb
er
Ban
ks4,
877
220
-40
31
0-
5,28
023
Bu
sin
ess
Ass
oci
atio
ns
0-
0-
1,71
02
0-
1,71
02
Co
nsu
ltin
g15
,206
82,
115
68,
139
113,
221
628
,681
25
Co
op
erat
ives
& C
red
it
Un
ion
s3,
994
80
-2,
066
20
-6,
060
9
For-
Pro
fits
/Fi
nan
ce
Co
mp
anie
s53
83
1,53
11
705
20
-2,
774
6
Go
vern
men
t A
gen
cies
289
10
-54
72
0-
836
3
NG
Os
23,9
8940
250
17,
415
1715
02
31,8
0458
No
n-B
ank
Fin
anci
al
Inst
itu
tio
n20
,738
120
-0
-0
-20
,738
12
PV
Os
22,3
0437
260
115
,977
332,
050
240
,591
64
Res
earc
hIn
stit
uti
on
s0
-31
22
3,31
04
0-
3,62
26
USA
ID3
4,18
97
2,70
02
5,73
211
532
213
,153
15
Oth
er3,
493
5 0
-0
-0
-3,
493
5
Tota
l499
,617
14
3 7,
168
13
46,0
04
85
5,95
3 12
15
8,74
2 22
82
1 Fu
nd
s w
ere
pro
vid
ed
to
in
stit
uti
on
s fo
r lo
an c
apit
al,
inst
itu
tio
nal
str
en
gth
en
ing
,te
chn
ical
ass
ista
nce
, p
rog
ram
exp
ansi
on
, m
on
ito
rin
g a
nd
eva
luat
ion
, o
r re
sear
chan
d d
eve
lop
me
nt.
2 Ta
ble
sh
ow
s o
blig
atio
ns
mad
e t
o u
mb
rella
s an
d a
pe
x o
rgan
izat
ion
s, n
ot
sub
-o
blig
atio
ns.
3 O
blig
atio
ns
to U
SAID
in
clu
de
th
ose
fu
nd
s th
at w
ere
use
d f
or
mic
roe
nte
rpri
se p
ro-
ject
man
age
me
nt
and
th
ose
fo
r w
hic
h s
pe
cifi
c im
ple
me
nti
ng
in
stit
uti
on
s h
ad n
ot
yet
be
en
id
en
tifi
ed
.
4 To
tal
for
all
ob
ligat
ion
s d
oe
s n
ot
corr
esp
on
d w
ith
co
lum
n t
ota
ls b
eca
use
22
inst
i-tu
tio
ns
had
fu
nd
ing
fo
r m
ore
th
an o
ne
pu
rpo
se.

44 LINKING THE POOR TO OPPORTUNITY
APPENDIX III: USAIDMICROENTERPRISE FUNDING
BY COUNTRY, 1992–2001
Table 17: USAID Microenterprise Funding by Country, 1992-2001 — US$ '000's
COUNTRY 1992 1993 1994 1995 1996 1997 1998 1999 2000 2001
Africa (AFR)
Benin 1,835 1,040 1,397 1,109 985
Botswana 627 158
Burkina Faso 150
Burundi 2,171 543
Chad 258 1,635 10
Eritrea 200 200 553
Ethiopia 330 34 1,049 1,683 600 756
Gambia 100 298 10 276
Ghana 1,050 505 2,584 4,515 4,448 6,322 6,000 6,513
Guinea 4,054 1,409 2,210 2,210 500 401 73 1,300 600 600
Guinea-Bissau 1,370 1,855 2,575 2,033
Kenya 1,084 270 1,650 2,000 2,904 1,717 2,629 943 2,357
Madagascar 801 550 229 260 225
Malawi 3,466 1,953 340 230 635
Mali 4,329 175 8,251 1,160 148 417 809 3,131 2,265 2,710
Mozambique 750 180 630 3,373 2,370 2,802 0 1,932 1,086
Namibia 280 320 410 712 241
Niger 2,795 3 715 0
Nigeria 3,090
RCSA 400 200
REDSO/EA 260
Senegal 7,040 7,850 3,520 450 932 364 2,500 2,778 12,916 3,852
South Africa 3,021 8,016 3,781 3,308 4,005 50 1,000 1,000
Swaziland 3,327
Tanzania 1,558 1,478 200 950 2,000 2,650
Togo 1,141
Uganda 2,330 3,358 2,582 2,416 3,044 5,481 5,162 4,752 2,540 1,300
Zambia 153 500 600 1,000 616 1,500 1,869 1,021
Zimbabwe 603 5,500 425 350 35 200 2,940 2,010
Regional Programs 491 100 800
AFR Subtotal 35,295 29,747 24,074 17,013 22,853 25,764 24,421 27,257 37,144 31,118

LINKING THE POOR TO OPPORTUNITY 45
Asia/Near East (ANE)
Bangladesh 1,500 250 650 1,165 5,670 8,639 7,663 3,388 2,000 4,105
Cambodia 112 462 2,398 1,281 750 1,000
Egypt 35,554 11,000 17,376 16,020 10,000 15,000 15,000 15,000 0 15,000
India 428 250 1,300
Indonesia 2,590 679 2,200 747 866 1,000 4,186 1,700
Jordan 1,031 100 500 2,792 3,539 5,739 7,655 6,000
Lebanon 2,045 1,000 1,000 2,100 866 2,500
Mongolia 105
Morocco 210 1,500 3,600 1,450 990 2,000 1,250 900
Nepal 1,980 2,260 1,950 1,200 50 1,170 1,855 500 1,500
Pakistan 3,134
Philippines 4,820 2,666 4,802 8,411 3,000 2,746 900 1,000 2,540
South Pacific 564
Sri Lanka 2,873 1,292 482 549 769 200
Yemen 658
West Bank/Gaza 1,888 2,499 3,311 501 3,133 2,515
ANE Subtotal 53,673 18,821 21,699 31,879 30,888 36,925 36,970 32,659 22,340 37,665
Europe and Eurasia (E&E)
Albania 2,240 2,200 225 1,000 1,000 1,500 950 550
Armenia 553 2,150
Azerbaijan 991 4,200 6,961 3,100
Bulgaria 1,564 1,400 771 132 524 1,450 1,266 1,118
Caucasus 6,940 2,000
Central/Eastern Europe 2,614 200
Croatia 500 500
Czech Republic 569 500
Estonia 224 150
Europe/Eurasia Region 1,000 200
Georgia 870 923 2,027 500 3,590 1,172
Hungary 1,197 730 310
Kazakstan 244 1,377 1,975 3,045 2,715
Kosovo 1,000 1,600
Kyrgystan 6,200 487 2,878 1,177 1,826 999 2,523
Latvia 224 430
Lithuania 560 600
Macedonia 2,500 950 900 500 2,000 1,056 1,000
Moldova 60 180 200
Montenegro 1,000 1,400
Poland 7,756 4,976 1,693 19,088
Romania 896 500 1,405 3,200 2,050 4,547 1,758 1,293
Russia 12,810 5,200 2,475 2,139 7,340 7,357 5,218 4,470
Serbia 2,000
Slovakia 896 500
Tajikistan 101 1,479 2,235
Turkmenistan 356 638
COUNTRY 1992 1993 1994 1995 1996 1997 1998 1999 2000 2001
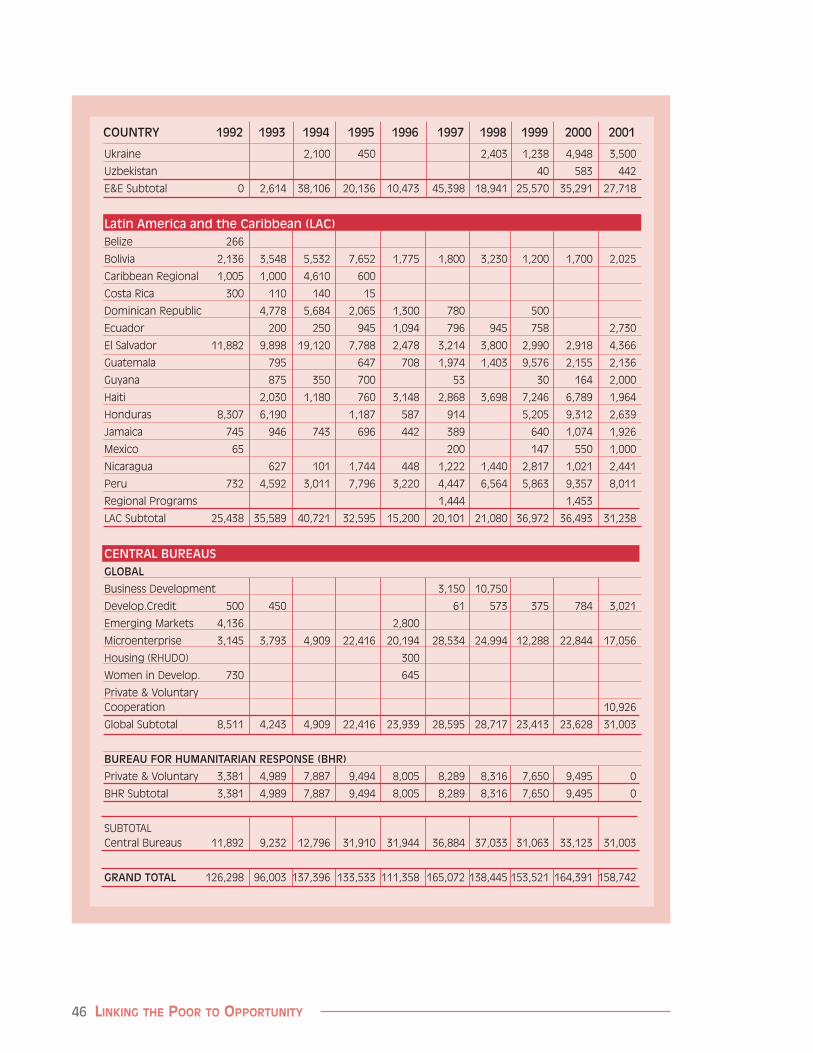
46 LINKING THE POOR TO OPPORTUNITY
COUNTRY 1992 1993 1994 1995 1996 1997 1998 1999 2000 2001
Ukraine 2,100 450 2,403 1,238 4,948 3,500
Uzbekistan 40 583 442
E&E Subtotal 0 2,614 38,106 20,136 10,473 45,398 18,941 25,570 35,291 27,718
Latin America and the Caribbean (LAC)
Belize 266
Bolivia 2,136 3,548 5,532 7,652 1,775 1,800 3,230 1,200 1,700 2,025
Caribbean Regional 1,005 1,000 4,610 600
Costa Rica 300 110 140 15
Dominican Republic 4,778 5,684 2,065 1,300 780 500
Ecuador 200 250 945 1,094 796 945 758 2,730
El Salvador 11,882 9,898 19,120 7,788 2,478 3,214 3,800 2,990 2,918 4,366
Guatemala 795 647 708 1,974 1,403 9,576 2,155 2,136
Guyana 875 350 700 53 30 164 2,000
Haiti 2,030 1,180 760 3,148 2,868 3,698 7,246 6,789 1,964
Honduras 8,307 6,190 1,187 587 914 5,205 9,312 2,639
Jamaica 745 946 743 696 442 389 640 1,074 1,926
Mexico 65 200 147 550 1,000
Nicaragua 627 101 1,744 448 1,222 1,440 2,817 1,021 2,441
Peru 732 4,592 3,011 7,796 3,220 4,447 6,564 5,863 9,357 8,011
Regional Programs 1,444 1,453
LAC Subtotal 25,438 35,589 40,721 32,595 15,200 20,101 21,080 36,972 36,493 31,238
CENTRAL BUREAUS
GLOBAL
Business Development 3,150 10,750
Develop.Credit 500 450 61 573 375 784 3,021
Emerging Markets 4,136 2,800
Microenterprise 3,145 3,793 4,909 22,416 20,194 28,534 24,994 12,288 22,844 17,056
Housing (RHUDO) 300
Women in Develop. 730 645
Private & Voluntary Cooperation 10,926
Global Subtotal 8,511 4,243 4,909 22,416 23,939 28,595 28,717 23,413 23,628 31,003
BUREAU FOR HUMANITARIAN RESPONSE (BHR)
Private & Voluntary 3,381 4,989 7,887 9,494 8,005 8,289 8,316 7,650 9,495 0
BHR Subtotal 3,381 4,989 7,887 9,494 8,005 8,289 8,316 7,650 9,495 0
SUBTOTAL Central Bureaus 11,892 9,232 12,796 31,910 31,944 36,884 37,033 31,063 33,123 31,003
GRAND TOTAL 126,298 96,003 137,396 133,533 111,358 165,072 138,445 153,521 164,391 158,742

Linking the Poor to Opportunity:
The Microenterprise Development Initiative
Microenterprise Results Reporting for 2001Report
The USAID microenterprise web site,
www.USAIDMicro.org, contains the latest
microenterprise research and reports, and
links to other informative web sites.
Produced by Weidemann Associates, Inc.
under the USAID-funded MicroServe
Indefinite Quantity Contract Numbers:
PCE-0406-I-00-6012-00, PCE-I-00-96-90012-00
and USAID Contract No. PCE-I-00-98-00012-00,
Task Order No. 06, with the Barents Group
of KPMG Consulting, LLC under Subcontract
No. AID-99-I-00012-000-0029, Technical
Assistance Order #3
By
Weidemann Associates, Inc.
933 North Kenmore Street, Suite 405
Arlington, Virginia 22201 USA
Tel: 703-522-3075 Fax: 703-525-6169
Email: [email protected]
Internet: www.weidemann.org.
December 2002
Cover photo courtesy of Geoffrey Chalmers
U. S. AG E N C Y F O R I N T E R N AT I O N A L D E V E L O P M E N TFor more information, contact
U.S. Agency for International Development
Washington, DC 20523-1000
Telephone: 202-712-4810
www.usaid.gov

Table of Contents
Annex A: Summary of USAID Microenterprise Funding by Country, 1992-2001 Annex B: Microenterprise Funding by Bureau, FY 2001 Annex C: Microenterprise Funding by Region, FY 2001 Annex D: Microenterprise Funding by Fund Account, FY 2001 Annex E: Institutions with Amounts of FY 2001 Funding by Bureau Annex F: Microfinance Institutions with Portfolio Data by Location of Institution,
FY 2001 Annex G: MFI Savings Data, Location, of Clients and Sustainability, FY 2001 Annex H: Poverty Lending Ratings by Location of Institution, FY 2001 Annex I: BDS Providers in USAID Survey, FY 2001 Annex J: BDS Facilitators in USAID Survey, FY 2001 Annex K: Policy Research by USAID-Supported Institutions, FY 2001 **** The FY 2001 Annex tables are available in PDF format on the MRR website at www.mrreporting.org

ANNEX A
SUMMARY OF USAID MICROENTEPRRISE FUNDINGBY COUNTRY, 1992-2001US $ '000's
REGION COUNTRY 1992 1993 1994 1995 1996 1997 1998 1999 2000 2001Africa (AFR)
Benin 1,835 1,040 1,397 1,109 985Botswana 627 158Burkina Faso 150Burundi 2,171 543Chad 258 1,635 10Eritrea 200 200 553Ethiopia 330 34 1,049 1,683 600 756Gambia 100 298 10 276Ghana 1,050 505 2,584 4,515 4,448 6,322 6,000 6,513Guinea 4,054 1,409 2,210 2,210 500 401 73 1,300 600 600Guinea-Bissau 1,370 1,855 2,575 2,033Kenya 1,084 270 1,650 2,000 2,904 1,717 2,629 943 2,357Madagascar 801 550 229 260 225Malawi 3,466 1,953 340 230 635Mali 4,329 175 8,251 1,160 148 417 809 3,131 2,265 2,710Mozambique 750 180 630 3,373 2,370 2,802 0 1,932 1,086Namibia 280 320 410 712 241Niger 2,795 3 715 0Nigeria 3,090RCSA 400 200REDSO/EA 260Senegal 7,040 7,850 3,520 450 932 364 2,500 2,778 12,916 3,852South Africa 3,021 8,016 3,781 3,308 4,005 50 1,000 1,000Swaziland 3,327Tanzania 1,558 1,478 200 950 2,000 2,650Togo 1,141Uganda 2,330 3,358 2,582 2,416 3,044 5,481 5,162 4,752 2,540 1,300Zambia 153 500 600 1,000 616 1,500 1,869 1,021Zimbabwe 603 5,500 425 350 35 200 2,940 2,010Regional Programs 491 100 800
AFR Subtotal 35,295 29,747 24,074 17,013 22,853 25,764 24,421 27,257 37,144 31,118
Asia/Near East (ANE)Bangladesh 1,500 250 650 1,165 5,670 8,639 7,663 3,388 2,000 4,105Cambodia 112 462 2,398 1,281 750 1,000Egypt 35,554 11,000 17,376 16,020 10,000 15,000 15,000 15,000 0 15,000India 428 250 1,300Indonesia 2,590 679 2,200 747 866 1,000 4,186 1,700Jordan 1,031 100 500 2,792 3,539 5,739 7,655 6,000Lebanon 2,045 1,000 1,000 2,100 866 2,500Mongolia 105Morocco 210 1,500 3,600 1,450 990 2,000 1,250 900Nepal 1,980 2,260 1,950 1,200 50 1,170 1,855 500 1,500Pakistan 3,134Philippines 4,820 2,666 4,802 8,411 3,000 2,746 900 1,000 2,540South Pacific 564Sri Lanka 2,873 1,292 482 549 769 200Yemen 658West Bank/Gaza 1,888 2,499 3,311 501 3,133 2,515
ANE Subtotal 53,673 18,821 21,699 31,879 30,888 36,925 36,970 32,659 22,340 37,665
Europe and Eurasia (E&E)Albania 2,240 2,200 225 1,000 1,000 1,500 950 550
A-1

REGION COUNTRY 1992 1993 1994 1995 1996 1997 1998 1999 2000 2001Armenia 553 2,150Azerbaijan 991 4,200 6,961 3,100Bulgaria 1,564 1,400 771 132 524 1,450 1,266 1,118Caucasus 6,940 2,000Central/Eastern Europe 2,614 200Croatia 500 500Czech Republic 569 500Estonia 224 150Europe/Eurasia Region 1,000 200Georgia 870 923 2,027 500 3,590 1,172Hungary 1,197 730 310Kazakstan 244 1,377 1,975 3,045 2,715Kosovo 1,000 1,600Kyrgystan 6,200 487 2,878 1,177 1,826 999 2,523Latvia 224 430Lithuania 560 600Macedonia 2,500 950 900 500 2,000 1,056 1,000Moldova 60 180 200Montenegro 1,000 1,400Poland 7,756 4,976 1,693 19,088Romania 896 500 1,405 3,200 2,050 4,547 1,758 1,293Russia 12,810 5,200 2,475 2,139 7,340 7,357 5,218 4,470Serbia 2,000Slovakia 896 500Tajikistan 101 1,479 2,235Turkmenistan 356 638Ukraine 2,100 450 2,403 1,238 4,948 3,500Uzbekistan 40 583 442
E&E Subtotal 0 2,614 38,106 20,136 10,473 45,398 18,941 25,570 35,291 25,717
Latin America and the Caribbean (LAC)Belize 266Bolivia 2,136 3,548 5,532 7,652 1,775 1,800 3,230 1,200 1,700 2,025Caribbean Regional 1,005 1,000 4,610 600Costa Rica 300 110 140 15Dominican Republic 4,778 5,684 2,065 1,300 780 500Ecuador 200 250 945 1,094 796 945 758 2,730El Salvador 11,882 9,898 19,120 7,788 2,478 3,214 3,800 2,990 2,918 4,366Guatemala 795 647 708 1,974 1,403 9,576 2,155 2,136Guyana 875 350 700 53 30 164 2,000Haiti 2,030 1,180 760 3,148 2,868 3,698 7,246 6,789 1,964Honduras 8,307 6,190 1,187 587 914 5,205 9,312 2,639Jamaica 745 946 743 696 442 389 640 1,074 1,926Mexico 65 200 147 550 1,000Nicaragua 627 101 1,744 448 1,222 1,440 2,817 1,021 2,441Peru 732 4,592 3,011 7,796 3,220 4,447 6,564 5,863 9,357 8,011Regional Programs 1,444 1,453
LAC Subtotal 25,438 35,589 40,721 32,595 15,200 20,101 21,080 36,972 36,493 31,238
CENTRAL BUREAUSGlobal
Business Development 3,150 10,750Develop.Credit 500 450 61 573 375 784 3,021Emerging Markets 4,136 2,800Microenterprise 3,145 3,793 4,909 22,416 20,194 28,534 24,994 12,288 22,844 17,056Housing (RHUDO) 300Women in Develop. 730 645Private & Voluntary Cooperation (PVC) 10,926
Global Subtotal 8,511 4,243 4,909 22,416 23,939 28,595 28,717 23,413 23,628 31,003
Bureau for Humanitarian Response (BHR)PVC 3,381 4,989 7,887 9,494 8,005 8,289 8,316 7,650 9,495 0
BHR Subtotal 3,381 4,989 7,887 9,494 8,005 8,289 8,316 7,650 9,495 0
SUBTOTAL Central Bureaus 11,892 9,232 12,796 31,910 31,944 36,884 37,033 31,063 33,123 31,003
GRAND TOTAL 126,298 96,003 137,396 133,533 111,358 165,072 138,445 153,521 164,391 156,741
A-2

ANNEX B
Microenterprise Funding by Bureau, 2001 (US$ '000's)
BUREAU MISSION FINANCE FINANCIAL POLICY BDS MICROENTERPRISE
POLICY TOTAL
AFRICA Benin $362 $623 $985 Eritrea $372 $181 $553 Ethiopia $398 $358 $756 Ghana $6,513 $6,513 Guinea $600 $600 Kenya $1,195 $1,162 $2,357 Liberia $0 $0 Madagascar $0 $0 Malawi $635 $635 Mali $1,179 $1,531 $2,710 Mozambique $1,086 $1,086 Nigeria $1,500 $500 $1,090 $3,090 Senegal $270 $2,500 $582 $500 $3,852 South Africa $1,000 $1,000 Tanzania $1,050 $1,600 $2,650 Uganda $1,300 $1,300 Zambia $1,021 $1,021 Zimbabwe $1,510 $500 $2,010
$8,721 $4,531 $15,766 $2,100 $31,118
ANE Bangladesh $1,845 $2,260 $4,105 Cambodia $1,000 $1,000 Egypt $15,000 $15,000 India $1,300 $1,300 Indonesia $410 $431 $859 $1,700 Jordan $6,000 $6,000 Lebanon $2,500 $2,500 Mongolia $105 $105 Morocco $900 $900 Nepal $0 $0 Philippines $2,190 $350 $2,540 West Bank /Gaza $2,515 $2,515
$33,765 $781 $3,119 $0 $37,665
BHR PVC $9,594 $1,332 $10,926 Total BHR $9,594 $0 $1,332 $0 $10,926
EE Albania $550 $550 Azerbaijan $2,600 $500 $3,100 Bulgaria $1,118 $1,118 Croatia $0 $0 Georgia $1,023 $99 $50 $1,172
Total AFRICA
Total ANE
B-1

BUREAU MISSION FINANCE FINANCIAL POLICY BDS MICROENTERPRISE
POLICY TOTAL
Kazakhstan $260 $842 $1,613 $2,715 Kosovo $1,600 $1,600 Kyrgyzstan $473 $55 $705 $1,290 $2,523 Macedonia $1,000 $1,000 Romania $400 $893 $1,293 Russia $2,620 $1,850 $4,470 Serbia $2,000 $2,000 Tajikistan $709 $1,326 $200 $2,235 Ukraine $3,400 $100 $3,500 Uzbekistan $331 $111 $442
$17,824 $315 $6,326 $3,253 $27,718
GLOBAL DC $3,021 $3,021 MD $12,558 $132 $4,366 $17,056
$15,579 $132 $4,366 $0 $20,077
LAC Bolivia $1,577 $448 $2,025 Ecuador $939 $1,791 $2,730 El Salvador $3,400 $966 $4,366 Guatemala $2,000 $136 $2,136 Guyana $2,000 $2,000 Haiti $470 $1,494 $1,964 Honduras $2,039 $600 $2,639 Jamaica $1,426 $500 $1,926 Mexico $1,000 $1,000 Nicaragua $250 $2,191 $2,441 Peru $5,481 $2,530 $8,011
$14,134 $1,409 $15,095 $600 $31,238
$99,617 $7,168 $46,004 $5,953 $158,742
Total LAC
GRAND TOTAL
Total EE
Total GLOBAL
B-2

Microenterprise Funding by Region, 2001 (US$ '000's)
REGION COUNTRY FINANCE FINANCIAL POLICY BDS MICROENTERPRISE
POLICY TOTAL
AFRICA Africa Region $1,253 $1,253 Benin $362 $623 $985 Eritrea $372 $181 $553 Ethiopia $1,698 $358 $2,056 Ghana $1,167 $6,513 $7,680 Guinea $600 $600 Kenya $1,195 $1,762 $2,957 Liberia $0 $0 Madagascar $0 $0 Malawi $635 $635 Mali $1,179 $1,531 $300 $3,010 Mozambique $1,077 $1,086 $2,163 Nigeria $1,500 $500 $1,090 $3,090 Rwanda $132 $132 Senegal $627 $2,500 $820 $500 $4,447 South Africa $1,000 $1,000 Tanzania $1,050 $1,600 $2,650 Uganda $1,300 $1,300 Zambia $132 $1,021 $1,153 Zimbabwe $1,510 $500 $2,010
$14,007 $4,663 $16,904 $2,100 $37,674
ASIA Bangladesh $1,845 $2,260 $4,105 Cambodia $1,000 $1,000 India $1,300 $750 $2,050 Indonesia $410 $431 $859 $1,700
ANNEX C
Total AFRICA
C-1
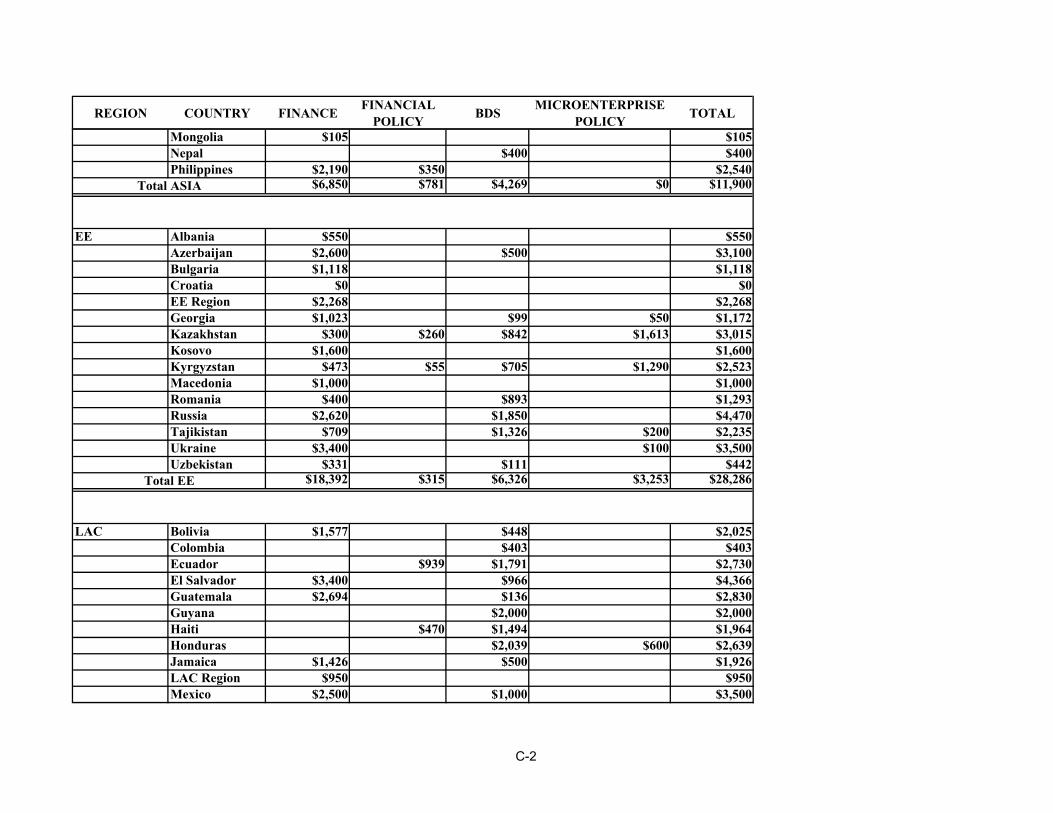
REGION COUNTRY FINANCE FINANCIAL POLICY BDS MICROENTERPRISE
POLICY TOTAL
Mongolia $105 $105 Nepal $400 $400 Philippines $2,190 $350 $2,540
$6,850 $781 $4,269 $0 $11,900
EE Albania $550 $550 Azerbaijan $2,600 $500 $3,100 Bulgaria $1,118 $1,118 Croatia $0 $0 EE Region $2,268 $2,268 Georgia $1,023 $99 $50 $1,172 Kazakhstan $300 $260 $842 $1,613 $3,015 Kosovo $1,600 $1,600 Kyrgyzstan $473 $55 $705 $1,290 $2,523 Macedonia $1,000 $1,000 Romania $400 $893 $1,293 Russia $2,620 $1,850 $4,470 Tajikistan $709 $1,326 $200 $2,235 Ukraine $3,400 $100 $3,500 Uzbekistan $331 $111 $442
$18,392 $315 $6,326 $3,253 $28,286
LAC Bolivia $1,577 $448 $2,025 Colombia $403 $403 Ecuador $939 $1,791 $2,730 El Salvador $3,400 $966 $4,366 Guatemala $2,694 $136 $2,830 Guyana $2,000 $2,000 Haiti $470 $1,494 $1,964 Honduras $2,039 $600 $2,639 Jamaica $1,426 $500 $1,926 LAC Region $950 $950 Mexico $2,500 $1,000 $3,500
Total ASIA
Total EE
C-2

REGION COUNTRY FINANCE FINANCIAL POLICY BDS MICROENTERPRISE
POLICY TOTAL
Nicaragua $950 $2,191 $3,141 Peru $5,481 $2,980 $8,461
$18,978 $1,409 $15,948 $600 $36,935
NEAR EAST Egypt $15,000 $15,000 Jordan $6,000 $6,000 Lebanon $2,500 $2,500 Morocco $900 $900 West Bank /Gaza $2,515 $2,515
$26,915 $0 $0 $0 $26,915
WORLDWIDE Worldwide $14,475 $2,557 $17,032 $14,475 $0 $2,557 $0 $17,032
GRAND TOTAL $99,617 $7,168 $46,004 $5,953 $158,742
Total LAC
Total NEAR EAST
Total WORLDWIDE
C-3
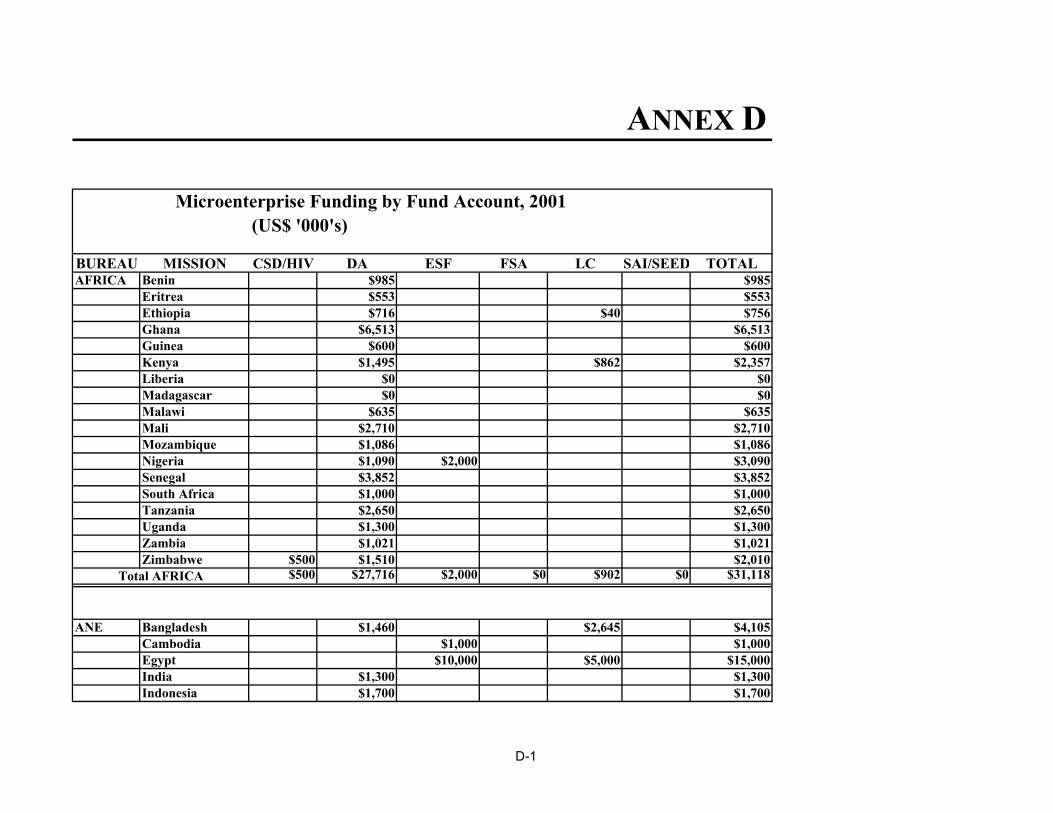
Microenterprise Funding by Fund Account, 2001 (US$ '000's)
BUREAU MISSION CSD/HIV DA ESF FSA LC SAI/SEED TOTALAFRICA Benin $985 $985
Eritrea $553 $553 Ethiopia $716 $40 $756 Ghana $6,513 $6,513 Guinea $600 $600 Kenya $1,495 $862 $2,357 Liberia $0 $0 Madagascar $0 $0 Malawi $635 $635 Mali $2,710 $2,710 Mozambique $1,086 $1,086 Nigeria $1,090 $2,000 $3,090 Senegal $3,852 $3,852 South Africa $1,000 $1,000 Tanzania $2,650 $2,650 Uganda $1,300 $1,300 Zambia $1,021 $1,021 Zimbabwe $500 $1,510 $2,010
$500 $27,716 $2,000 $0 $902 $0 $31,118
ANE Bangladesh $1,460 $2,645 $4,105 Cambodia $1,000 $1,000 Egypt $10,000 $5,000 $15,000 India $1,300 $1,300 Indonesia $1,700 $1,700
ANNEX D
Total AFRICA
D-1

BUREAU MISSION CSD/HIV DA ESF FSA LC SAI/SEED TOTALJordan $6,000 $6,000 Lebanon $2,500 $2,500 Mongolia $105 $105 Morocco $900 $900 Nepal $0 $0 Philippines $2,540 $2,540 West Bank /Gaza $2,515 $2,515
$0 $7,000 $22,120 $0 $8,545 $0 $37,665
BHR PVC $10,926 $10,926 $0 $10,926 $0 $0 $0 $0 $10,926
EE Albania $550 $550 Azerbaijan $3,100 $3,100 Bulgaria $1,118 $1,118 Croatia $0 $0 Georgia $1,172 $1,172 Kazakhstan $2,715 $2,715 Kosovo $1,600 $1,600 Kyrgyzstan $2,523 $2,523 Macedonia $1,000 $1,000 Romania $1,293 $1,293 Russia $4,470 $4,470 Serbia $2,000 $2,000 Tajikistan $2,235 $2,235 Ukraine $3,500 $3,500 Uzbekistan $442 $442
$0 $0 $0 $20,157 $0 $7,561 $27,718
GLOBAL DC $3,021 $3,021 MD $17,056 $17,056
$0 $20,077 $0 $0 $0 $0 $20,077
Total ANE
Total BHR
Total EE
Total GLOBAL
D-2

BUREAU MISSION CSD/HIV DA ESF FSA LC SAI/SEED TOTAL
LAC Bolivia $2,025 $2,025 Ecuador $1,357 $1,373 $2,730 El Salvador $4,000 $366 $4,366 Guatemala $2,000 $136 $2,136 Guyana $2,000 $2,000 Haiti $1,964 $1,964 Honduras $2,639 $2,639 Jamaica $1,926 $1,926 Mexico $1,000 $1,000 Nicaragua $2,441 $2,441 Peru $3,700 $4,311 $8,011
$0 $23,088 $3,839 $0 $4,311 $0 $31,238
GRAND TOTAL $500 $88,807 $27,959 $20,157 $13,758 $7,561 $158,742
Total LAC
D-3

Institutions with Amounts of 2001 Funding by Bureau (US$ '000's)
BUREAU MISSION OFFICE INSTITUTION FUNCTION OBLIGATION AMOUNT
AFRICA Benin Democracy Enterprise Works/Benin NONCRD $623 Democracy VFB VITAL-FINANCE BENIN/Benin CREDIT $362
Total Benin $985
EritreaEconomic Growth/Food Security CARE International/Eritrea CREDIT $372 Economic Growth/Food Security REU Rural Enterprise Unit/Eritrea NONCRD $181
Total Eritrea $553
EthiopiaAgriculture and Natural Resources ACDI/VOCA/Ethiopia NONCRD $193 Agriculture and Natural Resources CRS Catholic Relief Services/Ethiopia CREDIT $100 Agriculture and Natural Resources FHI Food for the Hungry Inter./Ethiopia CREDIT $68 Agriculture and Natural Resources Pact/Ethiopia Pact/Ethiopia/Ethiopia CREDIT $190 Agriculture and Natural Resources SOAG/Ethiopia NONCRD $165 FFP/USAID CRS Catholic Relief Services/Ethiopia CREDIT $40
Total Ethiopia $756
Ghana EWW/Ghana EWW Enterprise Works WorldWide/Ghana NONCRD $1,836 TechnoServe/Ghana NONCRD $3,856
Private Sector Nature Conservation Research/Ghana NONCRD $821 Total Ghana $6,513
Guinea Natural Resources Winrock International/USA NONCRD $600 Total Guinea $600
Kenya FFP/USAID TechnoServe/Kenya NONCRD $862
Microenterprise AMFI The Association of Microfinance Institutions/Kenya CREDIT $400 Microenterprise Faulu Kenya Limited/Kenya CREDIT $395 Microenterprise KWFT Kenya Women Finance Trust/Kenya CREDIT $400 Microenterprise TechnoServe/Kenya NONCRD $300
Total Kenya $2,357 Malawi BARENTS GROUP/Malawi CREDIT $295
ANNEX E
E-1

BUREAU MISSION OFFICE INSTITUTION FUNCTION OBLIGATION AMOUNT
AgricultureMUSCCO Malawi Union of Savings and Credit Cooperatives/Malawi CREDIT $340
Total Malawi $635 Mali SEG/USAID/Mali Barents Group of KPMG Consulting/Mali/Mali FINPOL $1,531
USAID/Mali SEG PIYELI (World Education PIEC) CREDIT $422 USAID/Mali SEG Save the Children/Mali - GGLS CREDIT $757
Total Mali $2,710 Mozambique ACDI/VOCA Mozambique/Mozambique NONCRD $262
ADRA/Mozambique NONCRD $50 Africare/Mozambique NONCRD $50 CARE/Mozambique NONCRD $50 CLUSA Cooperative League of the United States of America/Mozambique NONCRD $262 FHI/Mozambique NONCRD $50 Save the Children/Mozambique NONCRD $50 TechnoServe Mozambique/Mozambique NONCRD $262 World Vision/Mozambique NONCRD $50
Total Mozambique $1,086 Nigeria Nigeria SOAG/Nigeria SOAG/Nigeria/Nigeria CREDIT $1,500
Nigeria SOAG/Nigeria SOAG/Nigeria/Nigeria FINPOL $500 Nigeria SOAG/Nigeria SOAG/Nigeria/Nigeria NONCRD $1,090
Total Nigeria $3,090 Senegal Private Sector DynaEntreprises/ Chemonics/Senegal FINPOL $300
Private Sector Private Sector SO/Senegal FINPOL $2,200 Private Sector SOAG/Senegal NONCRD $562 Private Sector SOAG/Senegal NONPOL $500
Special Objective Casamance CRS Catholic Relief Services/Senegal CREDIT $270
Special Objective Casamance Handicap International NONCRD $20 Total Senegal $3,852
South Africa Enterprise, Management and Innovation NONCRD $500 WEI World Education NTINGA/South Africa NONCRD $500
$1,000 Tanzania African Wildlife Foundation/Tanzania NONCRD $150
Africare/Ugalla Community Conservation Project/Tanzania NONCRD $100 International Business Intiatives/Chemonics International/Tanzania NONPOL $1,600 Tuskeege University/Sokoine University/Tanzania NONCRD $800
Total Tanzania $2,650 Uganda Faulu Uganda Limited/Uganda CREDIT $50
Total South Africa
E-2

BUREAU MISSION OFFICE INSTITUTION FUNCTION OBLIGATION AMOUNT
FINCA Uganda Foundation for International Community Assistance/Uganda CREDIT $350 FOCCAS/Uganda CREDIT $40 FTCU Feed The Children Uganda/Uganda CREDIT $45 Katakwi Soroti Development Organisation (KASO) CREDIT $30
MED-Net Microenterprise Development Network/Uganda CREDIT $43 PRIDE UGANDA Promotion of Rural Initiatives and Development Enterprise (Uganda) Limited/Uganda CREDIT $45 UMU Uganda Microfinance Union/Uganda CREDIT $447 UWFT UGANDA WOMEN's FINANCE TRUST LIMITED/Uganda CREDIT $250
Total Uganda $1,300 Zambia ZACCI Zambia Assoc of Chambers of Commerce NONCRD $400
Microenterprise IESC/Zambia NONCRD $621 Total Zambia $1,021
Zimbabwe DAI/Zimbabwe NONCRD $500 DAI/Zimbabwe CREDIT $1,510
Total Zimbabwe $2,010 $31,118
ANE Bangladesh Enterprise Development ICLARM- The World Fish Center/Bangladesh NONCRD $700 Enterprise Development IRIS/JOBS University of Maryland/Bangladesh NONCRD $760 FFP/USAID CARE/Bangladesh CREDIT $1,045 FFP/USAID WV World Vision/Bangladesh CREDIT $800 FFP/USAID WV World Vision/Bangladesh NONCRD $800
$4,105
CambodiaOffice of General Development Catholic Relief Services/Cambodia CREDIT $500 Office of General Development World Relief/Cambodia CREDIT $500
Total Cambodia $1,000 Egypt Credit Guarantee Corporation/Egypt CREDIT $5,000
Microenterprise Credit Guarantee Corporation/Egypt CREDIT $10,000 Total Egypt $15,000
India USAID/India FWWB Friends of Women's World Banking, India/India CREDIT $1,300 Total India $1,300
Indonesia Trickle Up Program/Indonesia CREDIT $250
Economic GrowthASEMHAKI The Indonesian Association for Small and Medium Enterprises Consultant/Indonesia NONCRD $210
Total Bangladesh
Total AFRICA
E-3

BUREAU MISSION OFFICE INSTITUTION FUNCTION OBLIGATION AMOUNT
Economic Growth IDP Activities CREDIT $160
Economic Growth IRIS Institutional Reform and the Informal Sector/Indonesia FINPOL $180
Economic Growth PEG Partnership for Economic Growth Project/Indonesia FINPOL $251 Economic Growth The Asia Foundation/Indonesia NONCRD $649
Total Indonesia $1,700 Jordan Microenterprise Chemonics/AMIR/Jordan CREDIT $6,000
Total Jordan $6,000
Lebanon OtherAl Majmoua The Lebanese Association for Development: Al Majmoua/Lebanon CREDIT $1,100
OtherCHF/AMEEN Access to Microfinance and Enhance Enterprise Nich/Lebanon CREDIT $1,000
Other Makhzoumi Foundation/Lebanon CREDIT $400 Total Lebanon $2,500
Mongolia USAID/Mongolia Gobi Beginings Mercy Corps/Gobi Beginings (GB)/Mongolia CREDIT $105 Total Mongolia $105
Morocco Economic Growth Al Amana Association/Foundation Zakoura CREDIT $900 Total Morocco $900
PhilippinesOffice of Econ.Development & Governance Chemonics/Philippines CREDIT $2,190
Office of Economic Development & Governa
IMCC/CPIP International Management and Communication Corporation/Credit Policy Impr/Philippines FINPOL $350
Total Philippines $2,540
West Bank /Gaza Private Enterprise Activity Support/West Bank CREDIT $172 Private Enterprise DAI/West Bank Gaza CREDIT $93
Private EnterpriseISAMI Initiative for Sustainable and Accessible Microfin/West Bank /Gaza CREDIT $1,000
Private Enterprise Save the Children/US/West Bank /Gaza CREDIT $1,250 $2,515
Total ANE $37,665
BHR PVC AAC/MIS Americas Assoc of Coops/Mutual Insur. Soc CREDIT $100 ACCION International CREDIT $474 ADRA Adventist Development and Relief Agency CREDIT $594 Aid to Artisans NONCRD $574
Total West Bank /Gaza
E-4

BUREAU MISSION OFFICE INSTITUTION FUNCTION OBLIGATION AMOUNT
ARHC Andean Rural Health Care Inc. (Curamericas)/USA CREDIT $375 CCF Christian Childrens Fund CREDIT $414 CHF Cooperative Housing Foundation CREDIT $274 CONCERN Worldwide/Worldwide CREDIT $357 CRS Catholic Relief Services CREDIT $550 Enterprise Development CREDIT $20 FFH Freedom from Hunger CREDIT $122 FINCA International/USA CREDIT $2,017 Katalysis North/South Development Partnership CREDIT $425 MEDA Mennonite Economic Development Assoc. CREDIT $410
NCBA National Cooperative Business Association/USA NONCRD $522 OI Opportunity International CREDIT $400 PLAN International CREDIT $366 PRO Women CREDIT $500 Project HOPE CREDIT $549 SEEP Network CREDIT $300 Winrock International/USA NONCRD $236 WOCCU CREDIT $580 WR World Relief Corporation/USA CREDIT $240 WV World Vision Relief and Development CREDIT $527
Total PVC $10,926 Total BHR $10,926
EE Albania PSHM Partneri Shqiptar ne Mikrokredi/Albania CREDIT $550 Total Albania $550
Azerbaijan USAID/Baku ACDI/VOCA/Azerbaijan CREDIT $600 USAID/Baku Mercy Corps International/Azerbaijan/Azerbaijan CREDIT $2,000 USAID/Baku Mercy Corps International/Azerbaijan/Azerbaijan NONCRD $500
$3,100 Bulgaria Private Sector CRS Catholic Relief Services/Bulgaria CREDIT $518
Private Sector NACHALA Cooperative/Bulgaria CREDIT $100
Private SectorWOCCU/Bulgaria World Counsil of Credit Unions Inc./Bulgaria CREDIT $500
Total Bulgaria $1,118
Georgia USAID/Caucasus HRST IRC INTERNATIONAL RESCUE COMMITTEE/Georgia CREDIT $488 USAID/Caucasus HRST Office
CARE International in the Caucasus Cooperative for Assistance and Relief Everywhere/Georgia NONPOL $50
Total Azerbaijan
E-5

BUREAU MISSION OFFICE INSTITUTION FUNCTION OBLIGATION AMOUNT
USAID/Caucasus HRST Office Mercy Corps Int. CREDIT $70 USAID/Caucasus, ER SCF Save the Children Federation/Worldwide CREDIT $465 USAID/Caucasus, ER Development Associates Inc. NONCRD $99
Total Georgia $1,172
Kazakhstan Enterprise and FinanceNBRK National Bank of the Republic of Kazakhstan/Kazakhstan NONPOL $463
Enterprise and Finance Pragma Corporation - Kazakhstan FINPOL $260 Enterprise and Finance Pragma Corporation - Kazakhstan NONCRD $550 Enterprise and Finance Pragma Corporation - Kazakhstan NONPOL $1,150 PS Eurasia Foundation/Kazakhstan NONCRD $292
$2,715 Kosovo EE FINCA International/Kosovo CREDIT $1,600
Total Kosovo $1,600 Kyrgyzstan Enterprise and Finance ARD/CHECCHI Kyrgyzstan NONCRD $320
Enterprise and Finance ARD/CHECCHI Kyrgyzstan NONPOL $240 Enterprise and Finance Barents Group of KPMG Consulting/Kyrgyzstan FINPOL $55 Enterprise and Finance Barents Group of KPMG Consulting/Kyrgyzstan NONPOL $118 Enterprise and Finance BTFF Bai Tushum Financial Foundation/Kyrgyzstan CREDIT $473 Enterprise and Finance Pragma Corporation - Kyrgyzstan NONCRD $325 Enterprise and Finance Pragma Corporation - Kyrgyzstan NONPOL $900 Enterprise and Finance PSC Huston Kyrgyzstan NONPOL $32 PS Eurasia Foundation/Kyrgyzstan NONCRD $60
$2,523
Macedonia Moznosti Humanitarian Association Moznosti/Macedonia CREDIT $1,000 $1,000
Romania Private Sector CHF Cooperative Housing Foundation/Romania NONCRD $893 Private Sector RAEF Romanian-American Enterprise Fund/Romania CREDIT $400
Total Romania $1,293
RussiaBusiness Development & Investment Office ACDI/VOCA ACDI/VOCA/Russia CREDIT $1,270 Business Development & Investment Office CEF Counterpart Enterprise Fund /Russia CREDIT $500 Business Development & Investment Office DAI Development Alternatives, Inc./Russia NONCRD $800 Business Development & Investment Office
FINCA Foundation for International Community Assistance/Russia CREDIT $300
Business Development & Investment Office FINCA/Tomsk/Russia CREDIT $550 Business Development & Investment Office University of Alaska Anchorage/Russia NONCRD $1,050
Total Russia $4,470
Total Kyrgyzstan
Total Macedonia
Total Kazakhstan
E-6

BUREAU MISSION OFFICE INSTITUTION FUNCTION OBLIGATION AMOUNT
Serbia OI/Eastern European Office CREDIT $2,000 Total Serbia $2,000
Tajikistan Enterprise and Finance ARD/CHECCHI NONPOL $200
Enterprise and FinanceMDTM Micro-entrepreneur Development Support Center/Tajikistan CREDIT $709
PS Eurasia Foundation/Tajikistan NONCRD $29
TCOACTED Agence pour la Cooperation Technique et le Develop/Tajikistan NONCRD $500
TCO CARE Tajikistan/Tajikistan NONCRD $497 TCO SC/US Save the Children/Tajikistan NONCRD $300
Total Tajikistan $2,235 Ukraine Private Sector DCA/Ag Credit CREDIT $600
Private Sector Microfinance Bank - EBRD CREDIT $1,000 Private Sector West NIS Enterprise Fund CREDIT $1,800 Private Sector Winrock/Ukraine NONPOL $100
Total Ukraine $3,500
Uzbekistan Enterprise and FinanceO'z-MARD Uzbekistan Micro-entrepreneur Population Developme/Uzbekistan CREDIT $331
Enterprise and Finance Pragma/Uzbekistan NONCRD $84
PS Eurasia Foundation - Tashkent Regional Office/Uzbekistan NONCRD $27 $442
Total EE $27,718
GLOBAL DC Office of Development Credit Banco Cuscatlan/El Salvador CREDIT $33
Office of Development Credit Banco Solidario/Ecuador CREDIT $232
Office of Development Credit Bancomer/Honduras CREDIT $385
Office of Development Credit Bank NISP/Indonesia CREDIT $184
Office of Development Credit Bank Spoldielczy W. Lomiankach/Poland CREDIT $31
Office of Development Credit Banrural CREDIT $43
Office of Development Credit Barclays Bank of Kenya/Kenya CREDIT $232
Office of Development Credit BIN Bank/Russia CREDIT $155
Office of Development Credit BISE Bank S.A./Poland CREDIT $164
Total Uzbekistan
E-7
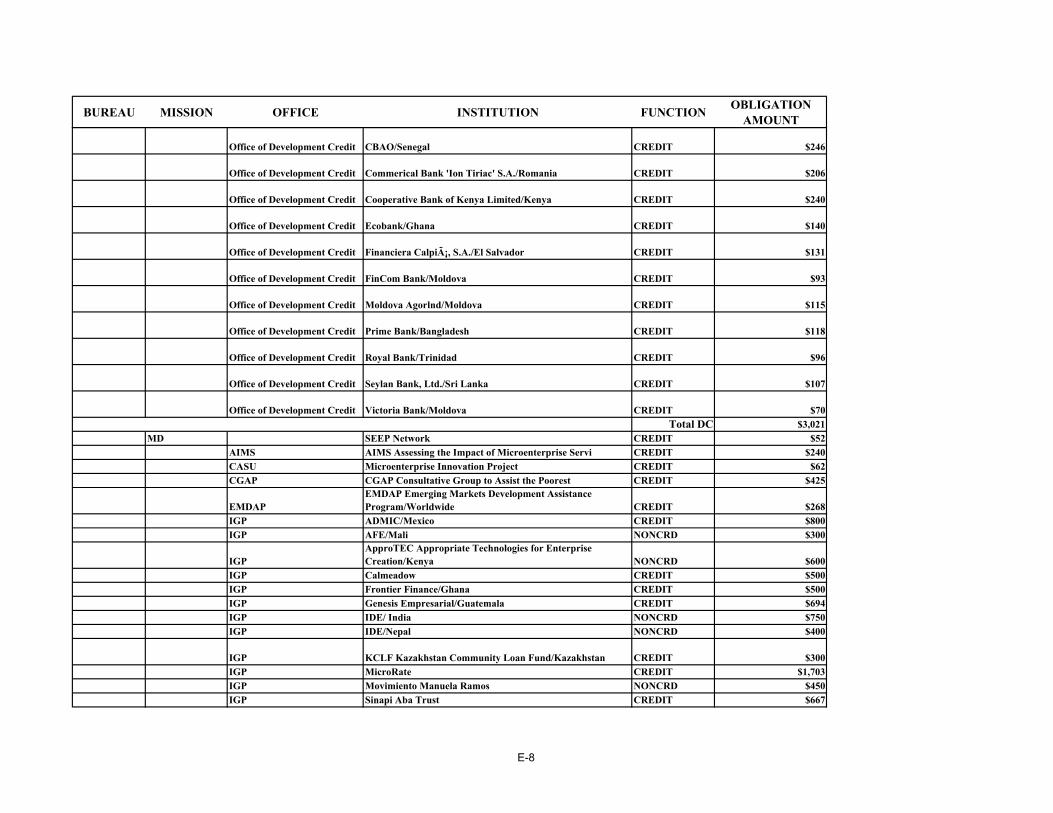
BUREAU MISSION OFFICE INSTITUTION FUNCTION OBLIGATION AMOUNT
Office of Development Credit CBAO/Senegal CREDIT $246
Office of Development Credit Commerical Bank 'Ion Tiriac' S.A./Romania CREDIT $206
Office of Development Credit Cooperative Bank of Kenya Limited/Kenya CREDIT $240
Office of Development Credit Ecobank/Ghana CREDIT $140
Office of Development Credit Financiera Calpiá, S.A./El Salvador CREDIT $131
Office of Development Credit FinCom Bank/Moldova CREDIT $93
Office of Development Credit Moldova Agorlnd/Moldova CREDIT $115
Office of Development Credit Prime Bank/Bangladesh CREDIT $118
Office of Development Credit Royal Bank/Trinidad CREDIT $96
Office of Development Credit Seylan Bank, Ltd./Sri Lanka CREDIT $107
Office of Development Credit Victoria Bank/Moldova CREDIT $70 Total DC $3,021
MD SEEP Network CREDIT $52 AIMS AIMS Assessing the Impact of Microenterprise Servi CREDIT $240 CASU Microenterprise Innovation Project CREDIT $62 CGAP CGAP Consultative Group to Assist the Poorest CREDIT $425
EMDAPEMDAP Emerging Markets Development Assistance Program/Worldwide CREDIT $268
IGP ADMIC/Mexico CREDIT $800 IGP AFE/Mali NONCRD $300
IGPApproTEC Appropriate Technologies for Enterprise Creation/Kenya NONCRD $600
IGP Calmeadow CREDIT $500 IGP Frontier Finance/Ghana CREDIT $500 IGP Genesis Empresarial/Guatemala CREDIT $694 IGP IDE/ India NONCRD $750 IGP IDE/Nepal NONCRD $400
IGP KCLF Kazakhstan Community Loan Fund/Kazakhstan CREDIT $300 IGP MicroRate CREDIT $1,703 IGP Movimiento Manuela Ramos NONCRD $450 IGP Sinapi Aba Trust CREDIT $667
E-8

BUREAU MISSION OFFICE INSTITUTION FUNCTION OBLIGATION AMOUNT
IGP Tchuma/Mozambique CREDIT $1,077 IGP WOCCU/Mexico CREDIT $1,400 IGP Womens World Banking/Colombia NONCRD $403 IGP WV/Ethiopia CREDIT $1,300 MBP Microenterprise Best Practices NONCRD $100 PASA Microenterprise Support/Senegal CREDIT $357 PRIME Chemonics/Mexico CREDIT $300 PRIME IRIS/Zambia FINPOL $132 PRIME Microenterprise Support/Senegal NONCRD $238 PRIME RMF Rwanda Microfinance Forum Secretariat/Rwanda CREDIT $132
PRIME WOCCU World Council of Credit Unions, Inc/Nicaragua CREDIT $700 SEEP SEEP Network CREDIT $1,000 SEEP SEEP Network NONCRD $300 SEGIR Buy-in Microenterprise Innovation Project NONCRD $825 Training Microenterprise Innovation Project CREDIT $81
Total MD $17,056 $20,077
LAC Bolivia Microenterprise SOAG Bolivia CREDIT $1,577 Microenterprise SOAG Bolivia NONCRD $448
Total Bolivia $2,025
Ecuador EGDSALTO/DAI Strengthen Access to Microfinance and Liberalization Task Order/Ecuador FINPOL $939
GDO Project Support/Ecuador NONCRD $418
GDOSALTO/DAI Strengthen Access to Microfinance and Liberalization Task Order/Ecuador NONCRD $1,373
Total Ecuador $2,730
El SalvadorEconomic Growth and Education CONAMYPE NONCRD $366 Economic Growth and Education FOMIR DAI/El Salvador CREDIT $3,111 Economic Growth and Education FOMIR DAI/El Salvador NONCRD $600 Economic Growth and Education SO AG/El Salvador CREDIT $289
$4,366 Guatemala AGIL Abt Associates, Inc./Guatemala CREDIT $800
Banrural CREDIT $1,033 FAFIDESS Fundación de Asesoria Financiera a Instituciones/Guatemala CREDIT $67
Total El Salvador
Total GLOBAL
E-9

BUREAU MISSION OFFICE INSTITUTION FUNCTION OBLIGATION AMOUNT
REDIMIF CREDIT $100
Income and Natural Resources AGEXPRONT/Guatemala NONCRD $79
Income and Natural Resources CECI NONCRD $29
Income and Natural Resources CHF Cooperative Housing Foundation/Guatemala NONCRD $28 $2,136
Guyana Mission IPED Institute of Private Enterprise Development/Guyana NONCRD $205 Mission MED Microenterprise/Guyana NONCRD $1,795
Total Guyana $2,000 Haiti Economic Growth Aid to Artisans/Haiti NONCRD $1,494
Economic Growth DAI-FINNET Haiti FINPOL $220 Economic Growth FINCA/Haiti FINPOL $250
Total Haiti $1,964
HondurasAgriculture & Natural Resources Office CARANA Corporation/Worldwide NONCRD $1,139 Agriculture & Natural Resources Office Chemonics/Honduras NONCRD $900 Agriculture & Natural Resources Office
Fintrac CDA Fintrac Inc / Centro de Desarrollo de Agronegocios/Honduras NONPOL $600
Total Honduras $2,639 Jamaica Economic Growth JNBS Jamaica National Building Society/Jamaica CREDIT $1,000
Economic Growth KRC Kingston Restoration Company Limited/Jamaica NONCRD $500 Economic Growth Workers Bank CREDIT $426
Total Jamaica $1,926 Mexico Chemonics/Mexico NONCRD $1,000
Total Mexico $1,000 Nicaragua ERD FINCA/Nicaragua CREDIT $119
ERD FINCA/Nicaragua NONCRD $352 ERD Project Coordination - Nicaragua NONCRD $69
ERDProMujer Nicaragua Pro Mujer Nicaragua Programas para la Mujer/Nicaragua CREDIT $131
ERDProMujer Nicaragua Pro Mujer Nicaragua Programas para la Mujer/Nicaragua NONCRD $226
ERD WOCCU World Council of Credit Unions, Inc/Nicaragua NONCRD $1,544
Total Nicaragua $2,441
Peru Agriculture A.B.PRISMA ASOCIACION BENEFICA PRISMA/Peru CREDIT $2,484
AgricultureCRS/Perú Catholic Relief Srevices USCC - Programa Perú/Peru CREDIT $1,227
Total Guatemala
E-10

BUREAU MISSION OFFICE INSTITUTION FUNCTION OBLIGATION AMOUNT
AgricultureEDPYME EDYFICAR Entidad de Desarrollo de la Micro y Pequena Empre/Peru CREDIT $600
Microenterprise ADEX/Peru NONCRD $1,310 Microenterprise Chemonics/Peru NONCRD $1,198
MicroenterpriseCOPEME Consorcio de organizaciones privadas de promocion a la pequenha y micro em/Peru CREDIT $570
Microenterprise Microenterprise Support/Peru CREDIT $200 Microenterprise Microenterprise Support/Peru NONCRD $22 Microenterprise SEGIR IQC/Peru CREDIT $400
Total Peru $8,011 Total LAC $31,238
$158,742 GRAND TOTAL
E-11

Microfinance Institutions with Portfolio Data by Location of Institution, 2001
REGION COUNTRY INSTITUTION BORROWERS PORTFOLIO US$ PERCENT WOMEN
PORTFOLIO AT RISK
LOAN LOSS
AFRICA Africa Region Haben Haben/Africa Region 0 $0 0.00% 0.00% 0.00%VE Vision Eritrea/Africa Region 4 $696 100.00% 0.00% 0.00%
Total Africa Region 4 $696
BeninPADME BENIN Association pour la Promotion et l'Appui au Dével/Benin 16,263 $6,200,000 81.00% 0.60% 0.57%VFB VITAL-FINANCE BENIN/Benin 9,017 $2,411,107 85.00% 1.30% 0.10%
Total Benin 25,280 $8,611,107 Eritrea CARE International/Eritrea 4 $696 100.00% 0.00% 0.00%
Total Eritrea 4 $696 Ethiopia Gasha Micro Financing, S.C./Ethiopia 7,000 $350,570 79.00% 5.80% 0.00%
Meklit Microfinance Institution, S.C./Ethiopia 2,187 $220,500 70.00% 4.00% 0.00%
Specialized Financial and Promotional Institution/Ethiopia 6,000 $422,783 73.00% 5.00% 0.00%WV/Ethiopia 9,759 $1,039,717 31.00% 4.00% 0.00%
Total Ethiopia 24,946 $2,033,570 Ghana Ecobank/Ghana 8 $47,075 25.00% 0.00% 0.00%
Sinapi Aba Trust 24,396 $1,665,071 92.10% 2.10% 2.00%Total Ghana 24,404 $1,712,146
Guinea Afr/Gn Africare/Guinea/Guinea 10 $18,000 90.00% 0.00% 0.00%OICI Opportunities Industrialization Centers International Guinea - Mamou/Guinea 631 $23,111 100.00% 0.00% 0.00%PRIDE/Finance/Guinea 10,160 $1,339,400 72.79% 11.30% 4.69%VITA Volunteers In Technical Assistance/Guinea 2,707 $81,162 54.00% 4.30% 0.00%
Total Guinea 13,508 $1,461,672
Kenya AMFI The Association of Microfinance Institutions/Kenya 0 $0 0.00% 0.00% 0.00%Barclays Bank of Kenya/Kenya 8 $54,093 38.00% 0.00% 0.00%Cooperative Bank of Kenya Limited/Kenya 1,413 $1,221,750 60.00% 0.70% 0.80%Faulu Kenya Limited/Kenya 11,584 $4,210,544 47.00% 0.94% 2.00%K-Rep Bank Limited/Kenya 15,911 $9,233,224 51.00% 1.20% 0.20%KWFT Kenya Women Finance Trust/Kenya 34,766 $6,047,957 100.00% 4.00% 5.00%SAGA Thrift and Enterprise Promotion, Ltd./Kenya 194 $14,936 65.00% 59.00% 0.00%SMEP Small and Micro Enterprise Programme/Kenya 10,833 $2,467,678 56.00% 3.00% 0.00%WOCCU/Kenya/Kenya 104,400 $59,043,934 40.00% 0.20% 0.53%
Total Kenya 179,109 $82,294,116
ANNEX F
F-1

REGION COUNTRY INSTITUTION BORROWERS PORTFOLIO US$ PERCENT WOMEN
PORTFOLIO AT RISK
LOAN LOSS
Malawi FINCA/Malawi 20,364 $1,151,000 98.00% 10.10% 3.37%MUSCCO Malawi Union of Savings and Credit Cooperatives/Malawi 15,000 $568,920 25.00% 15.00% 0.00%Project Hope/Malawi 1,554 $55,222 100.00% 0.05% 0.70%
Total Malawi 36,918 $1,775,142 Mali AFR/Mali Africare/Mali 2,215 $257,000 52.00% 2.14% 2.49%
CANEF 26,551 $555,619 98.00% 0.00% 0.00%CMEC SAN/Mali 2,137 $51,143 39.00% 0.00% 0.00%CRMD/Mali 12,110 $2,865,672 35.00% 0.00% 0.00%CVECA KITA/Mali 11,667 $510,633 30.00% 0.00% 0.00%CVECA ON/Mali 9,108 $2,037,747 36.00% 0.00% 0.00%CVECA PD/Mali 9,639 $332,425 27.00% 0.00% 0.00%JEMENI/Mali 12,467 $1,483,706 40.00% 0.00% 0.00%Jigiyaso 7,099 $263,708 86.00% 0.00% 0.00%Kafo Jiginew 15,327 $688,163 100.00% 4.00% 65.00%Kondo Jigima/Mali 21,938 $2,131,131 43.00% 0.00% 0.00%Nyesigiso 17,079 $952,680 100.00% 3.90% 23.00%PASACOOP/Mali 9,566 $357,097 41.00% 0.00% 0.00%Paseca/Mali 2,625 $172,765 33.00% 0.00% 0.00%PIYELI (World Education PIEC) 35,349 $806,048 67.00% 0.00% 0.00%Save the Children/Mali - GGLS 6,809 $199,779 100.00% 1.00% 5.00%
Total Mali 201,686 $13,665,316 Mozambique NovoBanco/Mozambique 2,167 $577,773 55.00% 0.23% 0.00%
Tchuma/Mozambique 3,393 $499,189 64.00% 1.91% 4.94%World Relief/Mozambique FCC Fundo de Credito Comun 4,458 $239,175 70.00% 2.00% 0.00%
Total Mozambique 10,018 $1,316,137 Nigeria LAPO 12,174 $2,006,826 97.00% 0.00% 0.00%
Total Nigeria 12,174 $2,006,826 Rwanda World Relief/Rwanda URWEGO 6,994 $267,829 88.00% 12.80% 4.00%
Total Rwanda 6,994 $267,829
SenegalACAPES-MECFAM Mutuelle d'Epargne et de Credit des Femmes du Mouvement social/Senegal 88 $15,271 98.00% 1.44% 1.02%ACEP/Senegal Alliance de Credit et d'Epargne pour la Production/Senegal 184 $171,016 64.00% 0.00% 0.00%ASACASE 137 $176,579 0.00% 0.00% 0.00%CAPEC - JOOBASS Caisse Populaire d'Epargne et de Credit JOOBASS/Senegal 20 $1,425 0.00% 12.68% 0.39%CBAO/Senegal 3 $19,942 0.00% 0.00% 0.00%CCF/Senegal Christian Children's Fund 2,394 $200,882 88.00% 10.00% 2.30%COFDEC Collectif des Femmes pour le Developpement de l'Epargne et du Credit/Senegal 278 $163,890 84.00% 0.00% 0.00%CRS Catholic Relief Services/Senegal 6,059 $331,559 100.00% 1.60% 15.40%FNGPF Federation Nationale des Groupements de Promotion Feminine/Senegal 4,158 $478,968 100.00% 3.67% 2.25%
F-2

REGION COUNTRY INSTITUTION BORROWERS PORTFOLIO US$ PERCENT WOMEN
PORTFOLIO AT RISK
LOAN LOSS
GEC FEMUNI Groupement d'Epargne et de Credit des Femmes de la cite des Nations Unies/Senegal 80 $6,044 81.00% 6.75% 0.00%INTER CREC Caisses Rurales d'Epargne et de Credit/Senegal 417 $108,354 41.00% 6.09% 4.68%MEC FADEC Mutuelle d'Epargne et de Credit de la Federation des Associations de Developpment Communautaire/Senegal 285 $70,270 49.00% 0.00% 0.00%MEC PROPEM Mutuelle d'Epargne et de Credit pour la Promotion de la Peche a Mbour/Senegal 332 $76,807 75.00% 1.72% 0.68%MECARTH Mutuelle d'Epargne et de Credit des Artisans de la Region de Thies/Senegal 95 $88,643 63.00% 2.35% 0.00%Plan/Senegal 71 $68,865 79.99% 0.00% 0.00%RECEC Reseau des Caisses d'Epargne et de Credit des Femmes de Dakar/Senegal 2,986 $308,118 79.00% 12.24% 6.54%UFC Union des Femmes commercantes/Senegal 50 $12,945 100.00% 29.81% 0.00%UMEC Union des Mutuelles d'Epargne et de Credit de Sedhiou/Senegal 2,753 $369,880 23.00% 6.33% 5.46%UNACOIS Union Nationale des Commerçants et Industriels du Sénégal/Senegal 2,636 $1,195,669 52.00% 2.76% 0.62%
Total Senegal 23,026 $3,865,127
South AfricaCalmeadow/SEF Calmeadow/Small Enterprise Foundation/South Africa 12,138 $7,567,199 98.00% 1.08% 4.07%FINCA/South Africa 1,678 $604,070 2.00% 3.01% 1.70%
Total South Africa 13,816 $8,171,269 Tanzania SEDA/Tanzania 11,328 $1,222,489 79.00% 3.60% 5.00%
Total Tanzania 11,328 $1,222,489 Uganda Faulu Uganda Limited/Uganda 7,594 $1,172,162 65.70% 0.00% 0.00%
FINCA Uganda Foundation for International Community Assistance/Uganda 76,906 $1,628,000 100.00% 1.50% 0.00%FTCU Feed The Children Uganda/Uganda 10,651 $460,952 86.00% 3.00% 2.00%
MED-Net Microenterprise Development Network/Uganda 8,126 $1,007,479 64.00% 2.95% 3.00%PRIDE UGANDA Promotion of Rural Initiatives and Development Enterprise (Uganda) Limited/Uganda 32,496 $4,854,448 48.00% 0.41% 2.00%UMU Uganda Microfinance Union/Uganda 10,417 $1,683,000 70.00% 0.70% 0.00%WOCCU/Uganda/Uganda 4,360 $2,167,185 30.80% 21.80% 0.00%
Total Uganda 150,550 $12,973,226 Zambia FINCA/Zambia 919 $33,994 96.00% 0.00% 0.00%
Total Zambia 919 $33,994 Zimbabwe DAI/Zimbabwe 0 $0 0.00% 0.00% 0.00%
SHDF Self Help Development Foundation/Zimbabwe 6,416 $481,679 91.00% 8.15% 2.00%Zambuko Trust 9,575 $130,515 81.26% 5.73% 1.58%
Total Zimbabwe 15,991 $612,194 Total AFRICA 750,675 $142,023,552
F-3

REGION COUNTRY INSTITUTION BORROWERS PORTFOLIO US$ PERCENT WOMEN
PORTFOLIO AT RISK
LOAN LOSS
ASIA Bangladesh BAWPA Bangladesh Agri. Working Peoples Assoc 2,343 $141,722 100.00% 2.28% 0.00%BAWSE Bang. Assoc. of Wom. for Self-Empower 1,789 $99,395 100.00% 0.80% 0.00%CARE/Bangladesh 7,514 $411,335 100.00% 1.00% 0.00%Desh Foundation/Bangladesh 2,611 $105,896 100.00% 0.00% 0.00%DSK Dushtha Shasthya Kendra 19,570 $630,694 100.00% 0.00% 0.00%Green Hill 315 $8,350 77.00% 0.00% 0.00%Hitaishi/Bangladesh 1,263 $53,262 100.00% 0.06% 0.00%HOPE Hatiya Optimist Peoples Energy 795 $18,486 82.00% 0.00% 0.00%IDF Integrated Development Foundation 34,000 $1,460,515 100.00% 0.40% 0.00%Mamata 6,988 $458,629 87.00% 0.00% 0.00%MSS 1,283 $59,272 100.00% 0.00% 0.00%OMI Organization for Mothers and Infants 1,298 $82,029 100.00% 6.80% 40.00%Prime Bank/Bangladesh 9 $46,306 11.00% 0.00% 0.00%WR/CSS Christian Service Society/Bangladesh 23,121 $1,076,371 83.00% 15.00% 0.00%
Total Bangladesh 102,899 $4,652,262 Cambodia Catholic Relief Services/Cambodia 25,325 $887,873 99.00% 2.00% 4.60%
EMT Ennatien Moulethan Tchorebat/Cambodia 74,196 $2,975,316 76.00% 1.00% 0.02%TPT Concern/Thanakea Ponleu Thmey/Cambodia 11,157 $653,869 75.00% 19.00% 14.00%World Relief/Cambodia 7,973 $712,494 100.00% 9.00% 1.00%
Total Cambodia 118,651 $5,229,552 India ASA Activists for Social Alternatives 20,077 $1,142,456 100.00% 0.00% 0.03%
BES Balaji Educational Society 914 $12,245 100.00% 0.00% 0.00%CARD/India 626 $13,743 100.00% 0.00% 0.00%ESAF 2,765 $96,941 100.00% 0.00% 0.00%FWWB Friends of Women's World Banking, India/India 32,119 $3,606,755 100.00% 1.20% 0.70%IMSE 4,460 $51,680 100.00% 0.95% 0.00%SARS South Asia Research Society 7,953 $724,144 100.00% 0.00% 0.00%TMT 784 $11,786 100.00% 0.00% 0.00%VSS 147 $5,190 100.00% 0.00% 0.00%
Total India 69,845 $5,664,940 Indonesia Bank NISP/Indonesia 1 $7,117 0.00% 0.00% 0.00%
BRI Bank Rakyat Indonesia, Micro Division 2,790,192 $963,790,000 16.00% 1.02% 1.65%DIMAN Dian Mandiri/Indonesia 3,057 $70,051 68.38% 0.00% 0.00%
Total Indonesia 2,793,250 $963,867,168 Mongolia
G g g y C p /G g g(GB)/Mongolia 155 $443,300 32.00% 0.00% 0.00%
Total Mongolia 155 $443,300 Nepal Nirdhan Utthan Bank, Ltd./Nepal 39,553 $2,342,205 100.00% 7.00% 1.11%
NSSC Neighborhood Society Service Ctr. 612 $48,406 100.00% 0.00% 0.00%Pact/Nepal/Nepal 68,613 $1,818,878 100.00% 0.50% 0.00%SBP/CSD 32,075 $2,370,340 100.00% 0.00% 0.00%TRWS 260 $15,358 100.00% 0.00% 0.00%
F-4

REGION COUNTRY INSTITUTION BORROWERS PORTFOLIO US$ PERCENT WOMEN
PORTFOLIO AT RISK
LOAN LOSS
Total Nepal 141,113 $6,595,187 Philippines Ad Jesum Foundation/Philippines 2,156 $144,681 100.00% 0.00% 0.00%
ASHI Ahon Sa Hirap Inc. 11,943 $559,649 100.00% 5.40% 0.03%Bangko Kabayan/Philippines 151 $41,424 75.96% 0.00% 0.00%Bank of Florida/Philippines 56 $6,287 76.47% 0.00% 0.00%Bank Victorias/Philippines 110 $12,821 78.17% 0.00% 0.00%CARD/Philippines 83,689 $7,732,924 100.00% 0.00% 0.00%Century Rural Bank/Philippines 292 $21,424 82.51% 2.04% 0.00%Cooperative Bank of Misamis Oriental, Inc./Philippines 609 $86,358 80.82% 1.72% 0.00%Cooperative Rural Bank of Bulacan/Philippines 712 $60,000 100.00% 0.00% 0.00%Dioces of Legaspi/Philippines 2,885 $0 100.00% 0.00% 0.00%Enterprise Bank/Philippines 4,408 $509,640 90.00% 0.12% 0.00%FICO First Isabela Cooperative Bank/Philippines 200 $37,105 80.97% 0.00% 0.00%First Macro Bank/Philippines 84 $15,927 83.24% 0.00% 0.00%MDF Muntinlupa Development Foundation 698 $58,698 91.00% 0.00% 0.00%Network Rural Bank, Inc. 390 $73,673 82.00% 0.00% 0.00%PD Project Dungganon 36,532 $3,103,532 100.00% 0.00% 0.00%Inc./Philippines 8,126 $249,459 100.00% 0.00% 1.25%Rang-Ay Bank/Philippines 26 $2,171 95.92% 0.00% 0.00%Rural Bank of Bogo/Philippines 52 $4,022 88.29% 0.00% 0.00%Rural Bank of Bukidnon, Inc. 1,748 $149,430 82.21% 0.00% 0.00%Rural Bank of Cantilan, Inc. 2,360 $213,742 89.48% 0.02% 0.00%Rural Bank of Digos, Inc. 557 $62,462 85.00% 6.00% 0.00%Rural Bank of Dipolog, Inc. 287 $44,660 79.10% 0.00% 2.32%Rural Bank of Dulag/Philippines 101 $12,992 75.73% 0.00% 0.00%Rural Bank of Kapatagan Valley, Inc. 686 $73,571 84.82% 0.91% 0.00%Rural Bank of Lebak, Inc. 217 $13,632 87.00% 8.59% 0.00%Rural Bank of Montevista, Inc. 2,704 $175,152 100.00% 3.31% 0.00%Rural Bank of Oroquieta, Inc. 307 $25,282 83.87% 2.00% 0.00%Rural Bank of Panabo 147 $21,035 63.96% 0.00% 0.00%Rural Bank of Santo Tomas, Inc. 505 $76,956 78.02% 2.91% 0.00%Rural Bank of Siam, Inc. 927 $124,155 82.00% 0.07% 0.00%Rural Bank of Tacurong 512 $50,030 81.99% 0.00% 0.00%Rural Bank of Talisayan, Inc. 878 $65,505 83.01% 4.19% 0.00%Rural Green Bank of Caraga, Inc. 3,023 $455,153 73.00% 2.44% 0.00%SAKLAW Foundation/Philippines 6,130 $128,812 100.00% 0.00% 0.00%Sarangani Rural Bank, Inc. 402 $24,196 93.97% 2.82% 0.00%Seviamus Foundation, Inc./Philippines 4,004 $162,461 99.00% 0.00% 2.00%Small Enterprise Development Project/Philippines 822 $37,948 100.00% 1.69% 0.63%Small Enterprise Kapital Assistance/Philippines 975 $40,849 100.00% 0.00% 0.00%Spes Pauperum Foundation, Inc./Philippines 2,656 $84,278 98.00% 0.00% 2.00%St. Elizabeth Community Development 3,337 $67,665 90.00% 0.00% 0.00%Tagum Rural Bank 527 $94,016 86.01% 0.29% 0.00%TSPI Development Corporation 32,691 $2,185,490 100.00% 0.00% 0.00%
F-5

REGION COUNTRY INSTITUTION BORROWERS PORTFOLIO US$ PERCENT WOMEN
PORTFOLIO AT RISK
LOAN LOSS
Tulong Kalinga, Inc./Philippines 830 $65,248 95.00% 18.00% 6.67%WOCCU/CUES/Philippines/Philippines 86,672 $20,294,053 68.00% 13.90% 13.90%
Total Philippines 307,124 $37,468,567 Sri Lanka Seylan Bank, Ltd./Sri Lanka 58 $85,869 7.00% 0.00% 0.00%
Total Sri Lanka 58 $85,869 Total ASIA 3,533,095 $1,024,006,845
EE Albania PSHM Partneri Shqiptar ne Mikrokredi/Albania 1,609 $2,357,058 21.00% 1.00% 6.68%Total Albania 1,609 $2,357,058
Armenia Save the Children/Armenia 5,895 $1,141,042 100.00% 0.55% 0.73%Total Armenia 5,895 $1,141,042
Azerbaijan ACDI/VOCA/Azerbaijan 380 $1,055,165 1.50% 0.00% 0.00%Foundation for International Community Assistance/Azerbaijan 3,438 $268,198 73.00% 7.80% 0.00%Mercy Corps International/Azerbaijan/Azerbaijan 2,973 $424,652 24.00% 4.00% 0.00%
Total Azerbaijan 6,791 $1,748,015 Bosnia Mercy Corps/Bosnia 6,603 $5,234,582 53.55% 0.31% 0.27%
WWB 2,104 $708,172 100.00% 0.00% 0.00%Total Bosnia 8,707 $5,942,754
Bulgaria CRS Catholic Relief Services/Bulgaria 1,350 $439,660 48.90% 0.00% 0.00%NACHALA Cooperative/Bulgaria 1,365 $1,764,504 39.51% 2.04% 0.00%WOCCU/Bulgaria World Counsil of Credit Unions Inc./Bulgaria 3,998 $1,501,928 46.70% 7.63% 3.83%
Total Bulgaria 6,713 $3,706,092
Georgia ADRA Adventist Development and Relief Agency/Georgia 717 $151,595 86.00% 88.00% 3.00%Constanta Foundation/Georgia 13,202 $1,494,731 77.00% 0.45% 0.51%
IOCC International Orthodox Christian Charities/Georgia 174 $209,300 12.00% 44.00% 0.00%UMCOR/Georgia United Methodist Committee on Relief/Georgia 86 $5,534 0.00% 0.00% 0.00%UOT Union of Trust/Georgia 2,279 $311,100 79.00% 4.60% 1.30%
Total Georgia 16,458 $2,172,260 Kazakhstan ACF Asian Credit Fund/Kazakhstan 405 $779,492 63.00% 0.00% 0.00%
KCLF Kazakhstan Community Loan Fund/Kazakhstan 3,133 $789,867 82.00% 0.01% 3.23%Total Kazakhstan 3,538 $1,569,359
Kosovo FINCA International/Kosovo 1,351 $1,558,856 13.00% 0.20% 2.00%Total Kosovo 1,351 $1,558,856
Kyrgyzstan BTFF Bai Tushum Financial Foundation/Kyrgyzstan 700 $1,177,878 28.00% 4.30% 2.60%FINCA International/Kyrgyzstan 20,315 $3,273,782 88.00% 0.30% 0.18%KRT-WID Kyrrghyz Rural Trust 3,545 $93,578 99.00% 0.95% 0.00%
Total Kyrgyzstan 24,560 $4,545,238
F-6

REGION COUNTRY INSTITUTION BORROWERS PORTFOLIO US$ PERCENT WOMEN
PORTFOLIO AT RISK
LOAN LOSS
Macedonia Moznosti Humanitarian Association Moznosti/Macedonia 2,740 $3,128,782 48.03% 2.41% 7.98%WOCCU/Macedonia 490 $257,395 22.00% 0.00% 0.00%
Total Macedonia 3,230 $3,386,177 Moldova FinCom Bank/Moldova 3 $26,791 33.00% 0.00% 0.00%
Moldova Agorlnd/Moldova 111 $403,653 28.00% 0.00% 0.00%Victoria Bank/Moldova 6 $33,479 0.00% 0.00% 0.00%
Total Moldova 120 $463,923 Montenegro MCM Micro Credit Montenegro/Montenegro 4,231 $3,509,710 38.00% 0.47% 0.99%
Total Montenegro 4,231 $3,509,710 Poland Bank Spoldielczy W. Lomiankach/Poland 4 $14,297 0.00% 0.00% 0.00%
BISE Bank S.A./Poland 4 $24,045 0.00% 0.00% 0.00%Total Poland 8 $38,342
Romania CHF Cooperative Housing Foundation/Romania 354 $1,291,537 28.33% 3.64% 7.28%Commerical Bank 'Ion Tiriac' S.A./Romania 3 $22,273 0.00% 0.00% 0.00%HIRO Help Integra Romania/Enterprise Development 143 $71,799 97.00% 9.00% 8.00%OMRO Opportunity Microcredit Romania/Romania 810 $898,725 55.35% 5.67% 1.95%RAEF Romanian-American Enterprise Fund/Romania 549 $1,970,319 30.00% 3.60% 2.10%WOCCU World Council of Credit Unions Inc./Romania 61,466 $10,670,682 46.00% 7.63% 0.00%
Total Romania 63,325 $14,925,335 Russia BIN Bank/Russia 18 $50,144 11.00% 0.00% 0.00%
CEF Counterpart Enterprise Fund /Russia 348 $683,000 66.54% 0.62% 0.00%FINCA Foundation for International Community Assistance/Russia 1,115 $1,176,475 89.00% 0.20% 0.78%FINCA/Tomsk/Russia 251 $78,825 91.00% 0.00% 0.00%SSEDF Sakhalin Small Enterprise Development Founda 33 $582,280 57.60% 0.50% 0.00%
Total Russia 1,765 $2,570,724
TajikistanACTED Agence pour la Cooperation Technique et le Develop/Tajikistan 278 $71,300 42.00% 0.00% 0.00%MDTM Micro-entrepreneur Development Support Center/Tajikistan 0 $0 0.00% 0.00% 0.00%
Total Tajikistan 278 $71,300 Ukraine Microfinance Bank - EBRD 1,618 $10,033,237 35.00% 19.87% 3.50%
Total Ukraine 1,618 $10,033,237
UzbekistanO'z-MARD Uzbekistan Micro-entrepreneur Population Developme/Uzbekistan 0 $0 0.00% 0.00% 0.00%
Total Uzbekistan 0 $0 Total EE 150,197 $59,739,422
LAC Bolivia BancoSol/Bolivia 53,812 $81,186,400 60.00% 12.67% 0.00%CRECER/Bolivia 30,989 $4,225,412 100.00% 0.00% 0.00%ProMujer/Bolivia 28,975 $5,115,174 94.00% 1.70% 1.73%WOCCU/Bolivia 14,043 $32,368,077 47.00% 3.20% 0.00%
F-7

REGION COUNTRY INSTITUTION BORROWERS PORTFOLIO US$ PERCENT WOMEN
PORTFOLIO AT RISK
LOAN LOSS
Total Bolivia 127,819 $122,895,063 Colombia AGAPE 8,312 $530,845 90.00% 10.32% 8.00%
Total Colombia 8,312 $530,845 Ecuador Banco Solidario/Ecuador 26,948 $27,007,252 45.20% 17.41% 0.00%
WOCCU/Ecuador/Ecuador 114,452 $112,357,153 42.00% 3.80% 0.00%Total Ecuador 141,400 $139,364,405
El SalvadorACACSEMERSA DE R.L. Asociacion Cooperativa de Ahorro y Creditos de las/El Salvador 170 $131,909 40.00% 5.88% 2.55%ACACU de R.L. Asociacion Cooperativa de Ahorro y Credito de La U/El Salvador 235 $215,937 56.00% 11.42% 9.40%ACCOVI DE R.L. Asociacion Cooperativa de Ahorro y Credito Comunal/El Salvador 0 $0 0.00% 0.00% 0.00%AMC de R.L. Sociedad Cooperativa de Ahorro y Credito, AMC de R/El Salvador 3,158 $1,943,665 52.68% 3.48% 2.20%ASEI Asociacion Salvadorena de Extensionistas Empresari/El Salvador 4,696 $468,251 81.36% 3.30% 13.00%BA Banco Agricola S.A./El Salvador 1,478 $951,460 73.08% 0.64% 0.00%Banco Cuscatlan/El Salvador 1 $5,714 0.00% 0.00% 0.00%BANSAL Banco Salvadoreno/El Salvador 1,329 $842,530 80.42% 4.05% 0.00%CAM Centro de Apoyo a la Microempresa/El Salvador 19,523 $3,966,200 83.00% 0.66% 2.90%ENLACE CRS/El Salvador 7,838 $997,155 90.00% 16.00% 0.00%Financiera Calpiá, S.A./El Salvador 38,019 $31,567,647 60.00% 2.41% 1.45%FJND Fundacion Jose Napoleon Duarte/El Salvador 2,299 $998,047 87.00% 10.26% 2.00%FUSAI Fundacion Salvadorena de Apoyo Integral /El Salvador 13,358 $6,336,566 69.00% 2.41% 2.80%
Total El Salvador 92,104 $48,425,082 Guatemala Banrural 16,158 $1,111,604 15.00% 30.00% 0.00%
CCF/Guatemala Christian Children's Fund 1,307 $155,279 92.00% 9.00% 0.00%FAFIDESS Fundación de Asesoria Financiera a Instituciones/Guatemala 5,275 $1,894,914 100.00% 3.00% 0.00%FINCA/Guatemala 2,115 $211,829 100.00% 14.30% 0.00%FUNDAP 5,658 $898,039 100.00% 2.00% 0.00%Genesis Empresarial/Guatemala 31,096 $13,744,015 59.53% 7.40% 0.00%MUDE/Villa Nueva 2,774 $304,600 97.20% 3.50% 0.00%Plan/Guatemala/Guatemala 2,414 $519,768 100.00% 1.27% 0.04%Project Hope/Guatemala 1,890 $118,119 100.00% 3.00% 0.40%
Total Guatemala 68,687 $18,958,167
Guyana IPED Institute of Private Enterprise Development/Guyana 3,963 $4,835,061 65.60% 32.70% 0.00%Total Guyana 3,963 $4,835,061
Haiti FINCA/Haiti 2,501 $131,645 90.00% 0.00% 0.00%Total Haiti 2,501 $131,645
Honduras ADEPES Asociacion para el Desarrollo Perspi 176 $76,000 60.00% 0.00% 0.00%ADICH Associacion para el Desarrollo Integr 2,130 $210,000 98.00% 1.00% 0.00%
F-8

REGION COUNTRY INSTITUTION BORROWERS PORTFOLIO US$ PERCENT WOMEN
PORTFOLIO AT RISK
LOAN LOSS
APRODESH Associacion Pro-Desarrollo Economi 45 $101,000 62.00% 3.00% 0.00%Bancomer/Honduras 443 $558,497 0.00% 0.00% 0.00%Camara de Comercio e Industrias de Choloma 176 $191,000 63.00% 3.00% 0.00%CDH Centro de Desarrollo Humano 324 $526,000 65.00% 3.00% 0.00%FAMA/Honduras Familia y Medio Ambiente/Honduras 5,639 $739,900 98.00% 1.40% 0.00%FHA Fundacion Horizontes de Amistad 558 $603,000 63.00% 4.00% 1.80%FINCA/Honduras 30,887 $7,670 95.00% 0.30% 0.00%FINSOL Financiera Solidaria. S.A. 11,688 $6,644,689 84.01% 17.41% 8.66%FJMC Fundacion Jose Maria Covelo/Honduras 26,774 $15,191,000 70.00% 2.50% 0.00%FUNDAHMICRO Fundacion Hondurena para el Apo 9,618 $1,588,000 97.00% 0.30% 0.00%Hermandad de Honduras 4,287 $2,663,000 73.00% 4.00% 0.00%IDH/Honduras Instituto para el Desarrollo Honduren 12,387 $2,192,000 71.00% 1.60% 0.00%INHDEI/Honduras Instituto Hondureno de Estudios y 1,063 $932,000 20.00% 1.50% 0.00%ODEF/Honduras 12,873 $7,575,000 76.00% 0.30% 0.00%OI Opportunity International/Honduras 6,480 $830,844 8.00% 3.70% 6.70%WOCCU Honduras/Honduras 66,062 $88,511,039 41.90% 18.10% 0.00%World Relief/Honduras/Honduras 24,049 $3,338,429 94.00% 15.70% 2.00%
Total Honduras 215,659 $132,479,068 Mexico ADMIC/Mexico 5,591 $1,575,811 83.00% 9.02% 4.86%
AMEXTRA Mexican Assoc. of Rural and Urban Transfor 803 $348,594 70.00% 10.00% 6.00%Financiera Compartamos/Mexico 109,188 $29,641,323 97.86% 2.26% 0.00%
Total Mexico 115,582 $31,565,728
NicaraguaASODENIC Asociacion para el Desarrollo Economico de Nicaragua/Nicaragua 24,000 $2,995,542 85.00% 10.39% 3.40%CONFIA S.A. Corporacion Nicaragüense Financiera S.A./Nicaragua 30,102 $7,090,147 68.00% 1.90% 0.30%FAMA/Nicaragua 16,402 $6,948,907 72.00% 1.63% 7.16%FINCA/Nicaragua 24,888 $2,680,631 100.00% 9.00% 0.00%FUNDENUSE/Nicaragua 5,940 $1,609,631 63.30% 5.20% 3.10%ProMujer Nicaragua Pro Mujer Nicaragua Programas para la Mujer/Nicaragua 10,561 $629,385 95.00% 0.35% 1.97%
WOCCU World Council of Credit Unions, Inc/Nicaragua 5,303 $3,217,760 55.70% 18.42% 5.50%Total Nicaragua 117,196 $25,172,003
Peru A.B.PRISMA ASOCIACION BENEFICA PRISMA/Peru 35,864 $6,447,740 44.00% 7.73% 5.16%COPEME Consorcio de organizaciones privadas de promocion a la pequenha y micro em/Peru 87,187 $37,643,369 58.00% 6.00% 4.50%Credivision/Peru 1,858 $759,516 58.00% 2.30% 0.00%CRS/Perú Catholic Relief Srevices USCC - Programa Perú/Peru 10,067 $1,427,217 82.00% 2.66% 0.00%EDPYME EDYFICAR Entidad de Desarrollo de la Micro y Pequena Empre/Peru 20,975 $20,400,000 60.00% 5.60% 1.70%Project Hope/Peru 1,800 $113,040 100.00% 8.00% 0.00%ProMujer/Peru 9,985 $685,161 99.80% 0.00% 0.00%
F-9

REGION COUNTRY INSTITUTION BORROWERS PORTFOLIO US$ PERCENT WOMEN
PORTFOLIO AT RISK
LOAN LOSS
Total Peru 167,736 $67,476,043 Trinidad Royal Bank/Trinidad 20 $93,732 30.00% 0.00% 0.00%
Total Trinidad 20 $93,732 Total LAC 1,060,979 $591,926,841
NEAR EAST Egypt ABA Alexandria Business Assoc. 25,432 $9,618,293 29.80% 3.40% 1.00%
ASBA Assiut Business Assoc. 15,525 $5,617,015 70.00% 0.70% 6.00%Aswan Business Association 489 $194,803 15.20% 22.43% 0.00%Banque du Caire 6,339 $2,998,796 23.50% 0.00% 0.00%DBAC Dakahleya Bus Assoc. for Investors Comm. Dev 9,693 $3,035,632 47.20% 1.00% 0.00%ESED Egyptian Sm Enter. Dev. Found.. 28,460 $8,631,396 48.70% 12.40% 0.00%FAYOUM Small Project Dev. Foundation 1,043 $310,998 22.20% 1.20% 4.20%SBACD Sharkia Bus Assoc. for Comm. Dev. 12,730 $3,252,305 49.60% 21.40% 0.00%SEDAP Small Enter. Dev Assoc. Port Said 3,223 $1,490,044 45.20% 5.90% 0.00%SOHAG / SEB 834 $364,416 24.60% 0.73% 0.20%
Total Egypt 103,768 $35,513,698 Jordan AMC Ahli Microfinancing Company/Jordan 1,035 $1,826,826 54.84% 9.52% 0.00%
CHF Cooperative Housing Foundation/Jordan 5,114 $3,362,270 61.00% 0.00% 3.00%JMCC Jordan Micro Credit Company/Jordan 1,297 $1,167,616 34.40% 0.08% 0.02%Microfund for Women (formerly JWDS)/Jordan 6,504 $1,579,892 100.00% 0.02% 0.03%
Total Jordan 13,950 $7,936,604
LebanonAl Majmoua The Lebanese Association for Development: Al Majmoua/Lebanon 5,769 $2,977,719 61.00% 11.11% 30.00%CHF/AMEEN Access to Microfinance and Enhance Enterprise Nich/Lebanon 2,802 $2,214,558 31.00% 0.98% 0.00%Makhzoumi Foundation/Lebanon 416 $163,415 86.00% 18.00% 0.00%
Total Lebanon 8,987 $5,355,692 Morocco Al Amana 64,393 $9,300,000 58.00% 0.01% 0.19%
Total Morocco 64,393 $9,300,000
West Bank /GazaCHF/PEOPLED Cooperative Housing Foundation - Palestinian Economic Opportunity Program/West Bank /Gaza 980 $4,232,965 10.00% 3.00% 1.00%Faten/West Bank /Gaza 161 $1,422,409 100.00% 7.19% 5.89%
Total West Bank /Gaza 1,141 $5,655,374 Total NEAR EAST 192,239 $63,761,368
GRAND TOTAL 5,687,185 $1,881,458,028
F-10

Microfinance Savings Data, Location of Clients and Sustainability, 2001
REGION COUNTRY INSTITUTION SAVINGS US$ SAVERS % RURAL
SUSTAINABILITY LEVEL
AFRICA Africa Region Haben Haben/Africa Region $859 100 100.00% Planned
Africa Region VE Vision Eritrea/Africa Region $740 162 100.00% Operational
BeninPADME BENIN Association pour la Promotion et l'Appui au Dével/Benin
$1,725,000 24,818 0.00% Operational
Benin VFB VITAL-FINANCE BENIN/Benin $328,538 10,480 1.00% Financial
Eritrea CARE International/Eritrea $1,560 228 100.00% Operational
Ethiopia Gasha Micro Financing, S.C./Ethiopia $150,913 7,374 6.80% Planned
Ethiopia Meklit Microfinance Institution, S.C./Ethiopia $134,435 2,187 19.00% Planned
Ethiopia Specialized Financial and Promotional Institution/Ethiopia $213,172 6,346 2.50% Planned
Ethiopia WV/Ethiopia $392,560 9,759 90.00% PlannedGhana Ecobank/Ghana $0 0 0.00% FinancialGhana Sinapi Aba Trust $0 0 62.00% Financial
Guinea Afr/Gn Africare/Guinea/Guinea $0 0 100.00% Planned
Guinea
OICI Opportunities Industrialization Centers International Guinea - Mamou/Guinea
$5,312 699 100.00% Planned
Guinea PRIDE/Finance/Guinea $0 0 59.47% Planned
Guinea VITA Volunteers In Technical Assistance/Guinea $22,459 2,960 100.00% Planned
Kenya AMFI The Association of Microfinance Institutions/Kenya $0 0 0.00% Planned
Kenya Barclays Bank of Kenya/Kenya $0 0 0.00% Financial
Kenya Cooperative Bank of Kenya Limited/Kenya $3,430,000 17,592 73.00% Operational
Kenya Faulu Kenya Limited/Kenya $2,346,719 18,696 63.00% OperationalKenya K-Rep Bank Limited/Kenya $5,874,830 26,245 65.00% Financial
Kenya KWFT Kenya Women Finance Trust/Kenya $3,986,582 47,586 80.00% Operational
Kenya SAGA Thrift and Enterprise Promotion, Ltd./Kenya $28,244 2,594 100.00% Planned
Kenya SMEP Small and Micro Enterprise Programme/Kenya $1,596,554 13,991 65.00% Planned
Kenya WOCCU/Kenya/Kenya $4,379,049 120,582 80.80% FinancialMalawi FINCA/Malawi $1,132,947 20,364 80.00% Planned
MalawiMUSCCO Malawi Union of Savings and Credit Cooperatives/Malawi
$605,953 15,025 100.00% Operational
Malawi Project Hope/Malawi $14,422 1,554 98.00% PlannedMali AFR/Mali Africare/Mali $25,000 3,400 75.00% PlannedMali CANEF $412,052 12,208 95.00% PlannedMali CMEC SAN/Mali $53,937 5,629 100.00% OperationalMali CRMD/Mali $846,312 9,313 100.00% PlannedMali CVECA KITA/Mali $218,291 5,605 100.00% PlannedMali CVECA ON/Mali $789,369 9,416 100.00% FinancialMali CVECA PD/Mali $432,415 2,110 99.00% PlannedMali JEMENI/Mali $1,727,370 12,467 3.75% Financial
ANNEX G
G-1

REGION COUNTRY INSTITUTION SAVINGS US$ SAVERS % RURAL
SUSTAINABILITY LEVEL
Mali Jigiyaso $182,578 7,099 35.00% PlannedMali Kafo Jiginew $39,100 17,180 0.00% PlannedMali Kondo Jigima/Mali $2,783,218 21,938 19.00% PlannedMali Nyesigiso $230,800 17,549 0.00% PlannedMali PASACOOP/Mali $210,692 3,500 100.00% FinancialMali Paseca/Mali $261,530 1,178 100.00% Financial
Mali PIYELI (World Education PIEC) $386,851 10,750 38.63% Planned
Mali Save the Children/Mali - GGLS $24,833 6,809 100.00% Planned
Mozambique NovoBanco/Mozambique $79,536 691 0.00% PlannedMozambique Tchuma/Mozambique $3,526 160 0.00% Planned
Mozambique World Relief/Mozambique FCC Fundo de Credito Comun $92,433 4,458 50.00% Planned
Nigeria LAPO $691,964 13,713 100.00% Planned
Rwanda World Relief/Rwanda URWEGO $61,797 6,994 67.00% Planned
Senegal
ACAPES-MECFAM Mutuelle d'Epargne et de Credit des Femmes du Mouvement social/Senegal
$16,862 351 0.00% Planned
SenegalACEP/Senegal Alliance de Credit et d'Epargne pour la Production/Senegal
$15,802 342 47.00% Planned
Senegal ASACASE $0 0 94.00% Planned
SenegalCAPEC - JOOBASS Caisse Populaire d'Epargne et de Credit JOOBASS/Senegal
$9,527 432 100.00% Planned
Senegal CBAO/Senegal $0 0 0.00% Financial
Senegal CCF/Senegal Christian Children's Fund $171,860 2,394 25.00% Planned
SenegalCOFDEC Collectif des Femmes pour le Developpement de l'Epargne et du Credit/Senegal
$42,107 789 0.00% Operational
Senegal CRS Catholic Relief Services/Senegal $212,312 6,936 80.00% Planned
SenegalFNGPF Federation Nationale des Groupements de Promotion Feminine/Senegal
$256,117 10,536 48.00% Financial
Senegal
GEC FEMUNI Groupement d'Epargne et de Credit des Femmes de la cite des Nations Unies/Senegal
$4,997 268 0.00% Financial
Senegal INTER CREC Caisses Rurales d'Epargne et de Credit/Senegal $191,284 2,542 100.00% Financial
Senegal
MEC FADEC Mutuelle d'Epargne et de Credit de la Federation des Associations de Developpment Communautaire/Senegal
$76,259 1,053 100.00% Financial
Senegal
MEC PROPEM Mutuelle d'Epargne et de Credit pour la Promotion de la Peche a Mbour/Senegal
$125,024 1,003 0.00% Financial
SenegalMECARTH Mutuelle d'Epargne et de Credit des Artisans de la Region de Thies/Senegal
$73,551 600 0.00% Financial
Senegal Plan/Senegal $142,780 1,792 100.00% Planned
SenegalRECEC Reseau des Caisses d'Epargne et de Credit des Femmes de Dakar/Senegal
$425,600 14,797 0.00% Planned
G-2

REGION COUNTRY INSTITUTION SAVINGS US$ SAVERS % RURAL
SUSTAINABILITY LEVEL
Senegal UFC Union des Femmes commercantes/Senegal $3,547 779 0.00% Planned
SenegalUMEC Union des Mutuelles d'Epargne et de Credit de Sedhiou/Senegal
$300,815 6,869 83.00% Financial
SenegalUNACOIS Union Nationale des Commerçants et Industriels du Sénégal/Senegal
$2,055,908 10,906 0.00% Financial
South AfricaCalmeadow/SEF Calmeadow/Small Enterprise Foundation/South Africa
$220,000 12,460 85.00% Planned
South Africa FINCA/South Africa $55,824 2,921 50.00% PlannedTanzania SEDA/Tanzania $244,498 11,328 10.00% OperationalUganda Faulu Uganda Limited/Uganda $628,087 11,267 20.00% Planned
UgandaFINCA Uganda Foundation for International Community Assistance/Uganda
$1,411,000 29,145 60.00% Financial
Uganda FTCU Feed The Children Uganda/Uganda $246,910 10,651 91.00% Planned
Uganda MED-Net Microenterprise Development Network/Uganda $416,679 8,337 68.00% Planned
Uganda
PRIDE UGANDA Promotion of Rural Initiatives and Development Enterprise (Uganda) Limited/Uganda
$2,866,570 40,469 30.00% Operational
Uganda UMU Uganda Microfinance Union/Uganda $561,000 18,546 66.00% Financial
Uganda WOCCU/Uganda/Uganda $2,274,270 9,346 70.60% PlannedZambia FINCA/Zambia $7,380 723 15.00% PlannedZimbabwe DAI/Zimbabwe $0 0 100.00% Planned
Zimbabwe SHDF Self Help Development Foundation/Zimbabwe $222,572 10,120 95.00% Planned
Zimbabwe Zambuko Trust $25,672 8,044 100.00% PlannedTotal AFRICA $49,229,267 757,255
ASIA Bangladesh BAWPA Bangladesh Agri. Working Peoples Assoc $94,982 3,371 100.00% Planned
Bangladesh BAWSE Bang. Assoc. of Wom. for Self-Empower $65,181 3,119 0.00% Planned
Bangladesh CARE/Bangladesh $0 12,794 0.00% PlannedBangladesh Desh Foundation/Bangladesh $44,185 2,640 0.00% Planned
Bangladesh DSK Dushtha Shasthya Kendra $354,808 12,422 49.00% Planned
Bangladesh Green Hill $4,173 492 100.00% PlannedBangladesh Hitaishi/Bangladesh $26,603 1,469 100.00% Planned
Bangladesh HOPE Hatiya Optimist Peoples Energy $5,350 1,080 100.00% Planned
Bangladesh IDF Integrated Development Foundation $523,537 26,411 71.00% Planned
Bangladesh Mamata $339,340 12,992 100.00% FinancialBangladesh MSS $9,503 1,340 32.00% Planned
Bangladesh OMI Organization for Mothers and Infants $23,170 1,797 0.00% Planned
Bangladesh Prime Bank/Bangladesh $0 0 0.00% Financial
Bangladesh WR/CSS Christian Service Society/Bangladesh $344,343 23,121 95.00% Planned
Cambodia Catholic Relief Services/Cambodia $319,156 27,419 100.00% Operational
Cambodia EMT Ennatien Moulethan Tchorebat/Cambodia $36,295 35 100.00% Financial
Cambodia TPT Concern/Thanakea Ponleu Thmey/Cambodia $90,185 14,900 100.00% Planned
Cambodia World Relief/Cambodia $104,764 7,973 80.00% Planned
G-3

REGION COUNTRY INSTITUTION SAVINGS US$ SAVERS % RURAL
SUSTAINABILITY LEVEL
India ASA Activists for Social Alternatives $263,732 27,699 100.00% Planned
India BES Balaji Educational Society $12,579 3,065 100.00% PlannedIndia CARD/India $14,695 1,390 100.00% PlannedIndia ESAF $16,521 3,740 100.00% Planned
India FWWB Friends of Women's World Banking, India/India $0 0 96.00% Financial
India IMSE $23,531 3,694 0.00% Planned
India SARS South Asia Research Society $276,607 7,578 100.00% Planned
India TMT $14,457 819 0.00% PlannedIndia VSS $752 295 100.00% PlannedIndonesia Bank NISP/Indonesia $0 0 0.00% Financial
Indonesia BRI Bank Rakyat Indonesia, Micro Division $2,146,680,000 27,045,184 80.00% Financial
Indonesia DIMAN Dian Mandiri/Indonesia $8,824 3,057 12.00% Planned
MongoliaGobi Beginings Mercy Corps/Gobi Beginings (GB)/Mongolia
$0 0 100.00% Planned
Nepal Nirdhan Utthan Bank, Ltd /Nepal $708,975 35,268 100.00% Operational
Nepal NSSC Neighborhood Society Service Ctr. $8,275 738 100.00% Planned
Nepal Pact/Nepal/Nepal $1,659,862 122,406 100.00% PlannedNepal SBP/CSD $740,503 37,614 100.00% OperationalNepal TRWS $2,984 355 100.00% Planned
Philippines Ad Jesum Foundation/Philippines $37,198 2,446 100.00% Financial
Philippines ASHI Ahon Sa Hirap Inc. $590,396 9,044 80.00% PlannedPhilippines Bangko Kabayan/Philippines $456,435 22,415 100.00% PlannedPhilippines Bank of Florida/Philippines $235,216 5,448 100.00% PlannedPhilippines Bank Victorias/Philippines $21,401 820 100.00% PlannedPhilippines CARD/Philippines $3,314,060 49,784 100.00% FinancialPhilippines Century Rural Bank/Philippines $126,098 7,316 100.00% Financial
Philippines Cooperative Bank of Misamis Oriental, Inc./Philippines $206,893 10,951 100.00% Financial
Philippines Cooperative Rural Bank of Bulacan/Philippines $712 500 100.00% Financial
Philippines Dioces of Legaspi/Philippines $0 0 100.00% PlannedPhilippines Enterprise Bank/Philippines $148,647 10,804 100.00% Financial
Philippines FICO First Isabela Cooperative Bank/Philippines $125,512 5,039 100.00% Planned
Philippines First Macro Bank/Philippines $205,811 10,245 100.00% Planned
Philippines MDF Muntinlupa Development Foundation $22,560 1,868 100.00% Planned
Philippines Network Rural Bank, Inc. $504,745 23,098 100.00% FinancialPhilippines PD Project Dungganon $544,301 47,037 100.00% Financial
Philippines People's Alternative Livelihood of Sorsogon, Inc./Philippines $57,389 3,956 100.00% Financial
Philippines Rang-Ay Bank/Philippines $210,338 4,334 100.00% Planned
Philippines Rural Bank of Bogo/Philippines $30,342 1,329 100.00% Planned
Philippines Rural Bank of Bukidnon, Inc. $193,467 10,773 100.00% FinancialPhilippines Rural Bank of Cantilan, Inc. $366,070 26,579 100.00% FinancialPhilippines Rural Bank of Digos, Inc. $98,164 4,860 100.00% FinancialPhilippines Rural Bank of Dipolog, Inc. $173,943 6,844 100.00% FinancialPhilippines Rural Bank of Dulag/Philippines $67,386 2,676 100.00% Planned
Philippines Rural Bank of Kapatagan Valley, Inc. $154,279 7,905 100.00% Financial
Philippines Rural Bank of Lebak, Inc. $77,120 4,126 100.00% FinancialPhilippines Rural Bank of Montevista, Inc. $305,072 22,156 100.00% FinancialPhilippines Rural Bank of Oroquieta, Inc. $75,203 3,007 100.00% Financial
G-4

REGION COUNTRY INSTITUTION SAVINGS US$ SAVERS % RURAL
SUSTAINABILITY LEVEL
Philippines Rural Bank of Panabo $247,249 11,737 100.00% FinancialPhilippines Rural Bank of Santo Tomas, Inc. $151,414 7,832 100.00% FinancialPhilippines Rural Bank of Siam, Inc. $256,061 16,246 100.00% FinancialPhilippines Rural Bank of Tacurong $49,414 4,153 100.00% FinancialPhilippines Rural Bank of Talisayan, Inc. $320,478 12,607 100.00% Financial
Philippines Rural Green Bank of Caraga, Inc. $1,540,409 97,852 100.00% Financial
Philippines SAKLAW Foundation/Philippines $33,511 2,551 100.00% Financial
Philippines Sarangani Rural Bank, Inc. $68,953 5,188 100.00% Financial
Philippines Seviamus Foundation, Inc./Philippines $94,519 4,306 100.00% Financial
Philippines Small Enterprise Development Project/Philippines $16,280 1,189 100.00% Financial
Philippines Small Enterprise Kapital Assistance/Philippines $16,700 1,201 100.00% Operational
Philippines Spes Pauperum Foundation, Inc./Philippines $21,337 2,656 100.00% Financial
PhilippinesSt. Elizabeth Community Development Program/Philippines
$27,055 1,390 100.00% Financial
Philippines Tagum Rural Bank $81,154 2,993 100.00% FinancialPhilippines TSPI Development Corporation $1,331,260 36,945 0.00% PlannedPhilippines Tulong Kalinga, Inc./Philippines $1,003 500 100.00% Operational
Philippines WOCCU/CUES/Philippines/Philippines $15,758,701 171,561 65.40% Financial
Sri Lanka Seylan Bank, Ltd./Sri Lanka $0 0 0.00% FinancialTotal ASIA $2,181,182,129 28,132,544
EE Albania PSHM Partneri Shqiptar ne Mikrokredi/Albania $0 0 25.00% Planned
Armenia Save the Children/Armenia $23,781 2,458 0.00% OperationalAzerbaijan ACDI/VOCA/Azerbaijan $0 0 95.00% Planned
AzerbaijanFoundation for International Community Assistance/Azerbaijan
$66,694 3,438 20.00% Planned
AzerbaijanMercy Corps International/Azerbaijan/Azerbaijan
$0 0 100.00% Planned
Bosnia Mercy Corps/Bosnia $0 0 0.00% FinancialBosnia WWB $0 1,533 0.00% Planned
Bulgaria CRS Catholic Relief Services/Bulgaria $83,249 1,396 5.00% Planned
Bulgaria NACHALA Cooperative/Bulgaria $0 0 68.00% Planned
BulgariaWOCCU/Bulgaria World Counsil of Credit Unions Inc./Bulgaria
$1,812,605 11,067 0.60% Financial
Georgia ADRA Adventist Development and Relief Agency/Georgia $0 0 99.00% Planned
Georgia Constanta Foundation/Georgia $0 0 2.50% Financial
Georgia IOCC International Orthodox Christian Charities/Georgia $0 0 100.00% Planned
GeorgiaUMCOR/Georgia United Methodist Committee on Relief/Georgia
$0 0 100.00% Planned
Georgia UOT Union of Trust/Georgia $0 0 9.00% Operational
Kazakhstan ACF Asian Credit Fund/Kazakhstan $0 0 13.00% Operational
Kazakhstan KCLF Kazakhstan Community Loan Fund/Kazakhstan $0 0 20.00% Operational
Kosovo FINCA International/Kosovo $135,946 1,021 45.00% Planned
G-5

REGION COUNTRY INSTITUTION SAVINGS US$ SAVERS % RURAL
SUSTAINABILITY LEVEL
Kyrgyzstan BTFF Bai Tushum Financial Foundation/Kyrgyzstan $0 0 80.00% Financial
Kyrgyzstan FINCA International/Kyrgyzstan $193,015 19,246 50.00% Financial
Kyrgyzstan KRT-WID Kyrrghyz Rural Trust $18,317 3,982 100.00% Planned
Macedonia Moznosti Humanitarian Association Moznosti/Macedonia $1,174 30 12.00% Financial
Macedonia WOCCU/Macedonia $155,545 1,273 65.00% FinancialMoldova FinCom Bank/Moldova $0 0 0.00% FinancialMoldova Moldova Agorlnd/Moldova $0 0 0.00% FinancialMoldova Victoria Bank/Moldova $0 0 0.00% Financial
Montenegro MCM Micro Credit Montenegro/Montenegro $0 0 14.70% Operational
Poland Bank Spoldielczy W. Lomiankach/Poland $0 0 0.00% Financial
Poland BISE Bank S.A./Poland $0 0 0.00% Financial
Romania CHF Cooperative Housing Foundation/Romania $0 0 21.18% Planned
Romania Commerical Bank 'Ion Tiriac' S.A./Romania $0 0 0.00% Financial
RomaniaHIRO Help Integra Romania/Enterprise Development
$0 0 18.00% Planned
Romania OMRO Opportunity Microcredit Romania/Romania $0 0 28.00% Financial
Romania RAEF Romanian-American Enterprise Fund/Romania $0 0 10.20% Operational
Romania WOCCU World Council of Credit Unions Inc./Romania $5,181,554 105,015 0.00% Operational
Russia BIN Bank/Russia $0 0 0.00% Financial
Russia CEF Counterpart Enterprise Fund /Russia $0 0 0.00% Operational
RussiaFINCA Foundation for International Community Assistance/Russia
$0 0 45.00% Planned
Russia FINCA/Tomsk/Russia $6,767 251 1.00% Planned
Russia SSEDF Sakhalin Small Enterprise Development Founda $0 0 0.50% Planned
TajikistanACTED Agence pour la Cooperation Technique et le Develop/Tajikistan
$0 0 100.00% Planned
TajikistanMDTM Micro-entrepreneur Development Support Center/Tajikistan
$0 0 0.00% Planned
Ukraine Microfinance Bank - EBRD $1,720,608 90 10.00% Operational
UzbekistanO'z-MARD Uzbekistan Micro-entrepreneur Population Developme/Uzbekistan
$0 0 0.00% Planned
Total EE $9,399,255 150,800
LAC Bolivia BancoSol/Bolivia $62,833,274 0 0.00% FinancialBolivia CRECER/Bolivia $1,279,531 31,010 70.00% FinancialBolivia ProMujer/Bolivia $2,366,096 35,808 5.00% OperationalBolivia WOCCU/Bolivia $32,682,018 69,955 40.00% FinancialColombia AGAPE $257,428 7,569 0.00% PlannedEcuador Banco Solidario/Ecuador $76,578,990 0 0.02% FinancialEcuador WOCCU/Ecuador/Ecuador $75,988,230 914,485 40.00% Financial
G-6
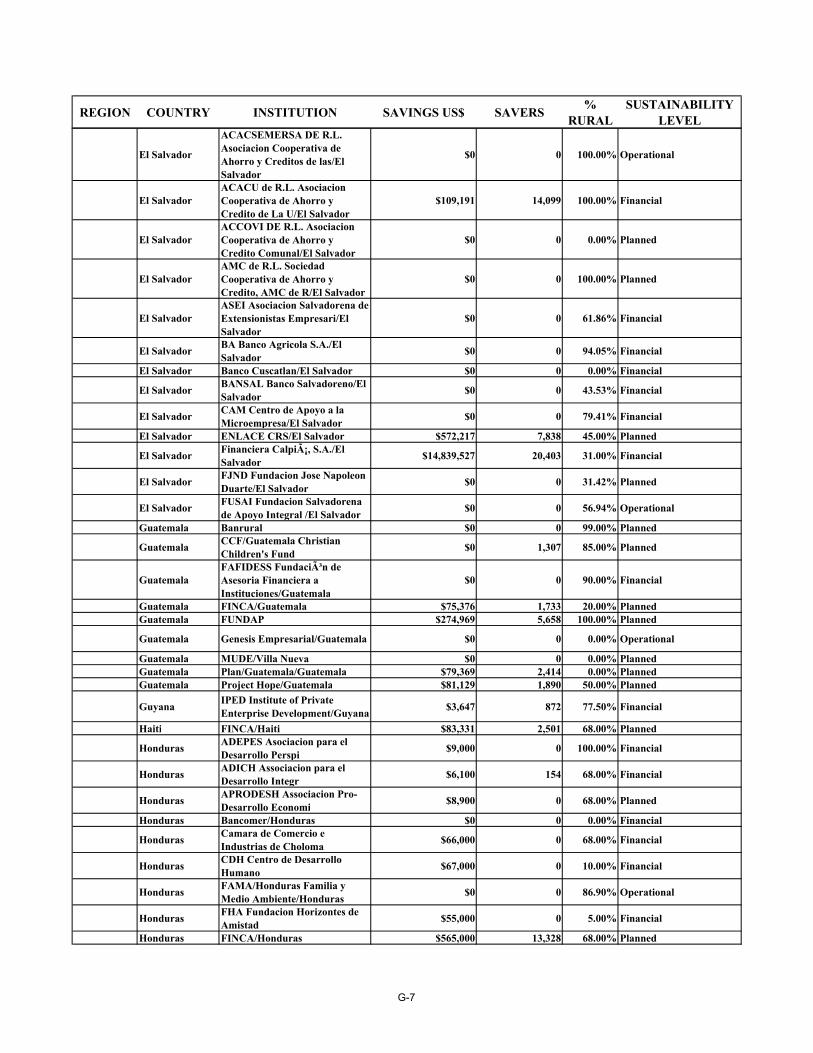
REGION COUNTRY INSTITUTION SAVINGS US$ SAVERS % RURAL
SUSTAINABILITY LEVEL
El Salvador
ACACSEMERSA DE R.L. Asociacion Cooperativa de Ahorro y Creditos de las/El Salvador
$0 0 100.00% Operational
El SalvadorACACU de R.L. Asociacion Cooperativa de Ahorro y Credito de La U/El Salvador
$109,191 14,099 100.00% Financial
El SalvadorACCOVI DE R.L. Asociacion Cooperativa de Ahorro y Credito Comunal/El Salvador
$0 0 0.00% Planned
El SalvadorAMC de R.L. Sociedad Cooperativa de Ahorro y Credito, AMC de R/El Salvador
$0 0 100.00% Planned
El SalvadorASEI Asociacion Salvadorena de Extensionistas Empresari/El Salvador
$0 0 61.86% Financial
El Salvador BA Banco Agricola S.A./El Salvador $0 0 94.05% Financial
El Salvador Banco Cuscatlan/El Salvador $0 0 0.00% Financial
El Salvador BANSAL Banco Salvadoreno/El Salvador $0 0 43.53% Financial
El Salvador CAM Centro de Apoyo a la Microempresa/El Salvador $0 0 79.41% Financial
El Salvador ENLACE CRS/El Salvador $572,217 7,838 45.00% Planned
El Salvador Financiera Calpiá, S.A./El Salvador $14,839,527 20,403 31.00% Financial
El Salvador FJND Fundacion Jose Napoleon Duarte/El Salvador $0 0 31.42% Planned
El Salvador FUSAI Fundacion Salvadorena de Apoyo Integral /El Salvador $0 0 56.94% Operational
Guatemala Banrural $0 0 99.00% Planned
Guatemala CCF/Guatemala Christian Children's Fund $0 1,307 85.00% Planned
GuatemalaFAFIDESS Fundación de Asesoria Financiera a Instituciones/Guatemala
$0 0 90.00% Financial
Guatemala FINCA/Guatemala $75,376 1,733 20.00% PlannedGuatemala FUNDAP $274,969 5,658 100.00% Planned
Guatemala Genesis Empresarial/Guatemala $0 0 0.00% Operational
Guatemala MUDE/Villa Nueva $0 0 0.00% PlannedGuatemala Plan/Guatemala/Guatemala $79,369 2,414 0.00% PlannedGuatemala Project Hope/Guatemala $81,129 1,890 50.00% Planned
Guyana IPED Institute of Private Enterprise Development/Guyana $3,647 872 77.50% Financial
Haiti FINCA/Haiti $83,331 2,501 68.00% Planned
Honduras ADEPES Asociacion para el Desarrollo Perspi $9,000 0 100.00% Financial
Honduras ADICH Associacion para el Desarrollo Integr $6,100 154 68.00% Financial
Honduras APRODESH Associacion Pro-Desarrollo Economi $8,900 0 68.00% Planned
Honduras Bancomer/Honduras $0 0 0.00% Financial
Honduras Camara de Comercio e Industrias de Choloma $66,000 0 68.00% Financial
Honduras CDH Centro de Desarrollo Humano $67,000 0 10.00% Financial
Honduras FAMA/Honduras Familia y Medio Ambiente/Honduras $0 0 86.90% Operational
Honduras FHA Fundacion Horizontes de Amistad $55,000 0 5.00% Financial
Honduras FINCA/Honduras $565,000 13,328 68.00% Planned
G-7

REGION COUNTRY INSTITUTION SAVINGS US$ SAVERS % RURAL
SUSTAINABILITY LEVEL
Honduras FINSOL Financiera Solidaria. S.A. $1,740,121 0 0.00% Financial
Honduras FJMC Fundacion Jose Maria Covelo/Honduras $564,000 9,063 0.00% Financial
Honduras FUNDAHMICRO Fundacion Hondurena para el Apo $35,700 3,351 60.00% Financial
Honduras Hermandad de Honduras $49,000 2,028 33.00% Operational
Honduras IDH/Honduras Instituto para el Desarrollo Honduren $1,300,000 5,700 38.00% Planned
Honduras INHDEI/Honduras Instituto Hondureno de Estudios y $6,000 0 85.00% Operational
Honduras ODEF/Honduras $117,000 6,139 68.00% Operational
Honduras OI Opportunity International/Honduras $0 88 86.00% Planned
Honduras WOCCU Honduras/Honduras $34,430,016 194,034 50.00% Financial
Honduras World Relief/Honduras/Honduras $1,450,700 19,096 72.00% Planned
Mexico ADMIC/Mexico $0 0 0.00% Financial
Mexico AMEXTRA Mexican Assoc. of Rural and Urban Transfor $108,262 1,530 0.00% Planned
Mexico Financiera Compartamos/Mexico $0 0 0.00% Financial
NicaraguaASODENIC Asociacion para el Desarrollo Economico de Nicaragua/Nicaragua
$388,831 16,198 0.00% Operational
NicaraguaCONFIA S.A. Corporacion Nicaragüense Financiera S.A./Nicaragua
$15,226,000 3,850 0.00% Operational
Nicaragua FAMA/Nicaragua $0 0 3.00% FinancialNicaragua FINCA/Nicaragua $706,083 24,888 100.00% FinancialNicaragua FUNDENUSE/Nicaragua $0 0 0.00% Planned
NicaraguaProMujer Nicaragua Pro Mujer Nicaragua Programas para la Mujer/Nicaragua
$333,000 15,197 60.00% Planned
Nicaragua WOCCU World Council of Credit Unions, Inc/Nicaragua $1,613,188 15,337 76.90% Operational
Peru A.B.PRISMA ASOCIACION BENEFICA PRISMA/Peru $0 35,864 80.00% Operational
Peru
COPEME Consorcio de organizaciones privadas de promocion a la pequenha y micro em/Peru
$4,200,000 20,000 40.00% Financial
Peru Credivision/Peru $0 0 10.00% Planned
PeruCRS/Perú Catholic Relief Srevices USCC - Programa Perú/Peru
$132,957 736 25.47% Planned
PeruEDPYME EDYFICAR Entidad de Desarrollo de la Micro y Pequena Empre/Peru
$0 0 18.00% Financial
Peru Project Hope/Peru $14,845 1,800 8.00% PlannedPeru ProMujer/Peru $349,121 10,321 5.00% PlannedTrinidad Royal Bank/Trinidad $0 0 0.00% Financial
Total LAC $331,646,146 1,516,244
NEAR EAST
Egypt ABA Alexandria Business Assoc. $0 0 43.00% Financial
Egypt ASBA Assiut Business Assoc. $0 0 86.00% OperationalEgypt Aswan Business Association $0 0 90.00% PlannedEgypt Banque du Caire $0 0 47.50% Planned
Egypt DBAC Dakahleya Bus Assoc. for Investors Comm. Dev $0 0 72.00% Financial
G-8

REGION COUNTRY INSTITUTION SAVINGS US$ SAVERS % RURAL
SUSTAINABILITY LEVEL
Egypt ESED Egyptian Sm Enter. Dev. Found.. $0 0 0.00% Financial
Egypt FAYOUM Small Project Dev. Foundation $0 0 50.00% Operational
Egypt SBACD Sharkia Bus Assoc. for Comm. Dev. $0 0 61.00% Operational
Egypt SEDAP Small Enter. Dev Assoc. Port Said $0 0 0.00% Financial
Egypt SOHAG / SEB $0 0 50.00% Financial
Jordan AMC Ahli Microfinancing Company/Jordan $0 0 0.00% Financial
Jordan CHF Cooperative Housing Foundation/Jordan $0 0 100.00% Planned
Jordan JMCC Jordan Micro Credit Company/Jordan $0 0 0.00% Financial
Jordan Microfund for Women (formerly JWDS)/Jordan $0 0 5.00% Operational
LebanonAl Majmoua The Lebanese Association for Development: Al Majmoua/Lebanon
$0 0 13.00% Planned
LebanonCHF/AMEEN Access to Microfinance and Enhance Enterprise Nich/Lebanon
$0 0 30.00% Planned
Lebanon Makhzoumi Foundation/Lebanon $0 0 0.00% Planned
Morocco Al Amana $0 0 0.60% Operational
West Bank /GazaCHF/PEOPLED Palestinian Economic Opportunity Program/West Bank /Gaza
$0 0 0.00% Operational
West Bank /Gaza Faten/West Bank /Gaza $70,227 2,701 100.00% Planned
Total NEAR EAST $70,227 2,701
GRAND TOTAL
$2,571,527,024 30,559,544
G-9

Poverty Lending Ratings by Location of Institution, 2001
REGION COUNTRY INSTITUTION PORTFOLIO US$ PL AMOUNT US$ PL RATINGAFRICA Africa Region Haben Haben/Africa Region $0 $0
Africa Region VE Vision Eritrea/Africa Region $696 $696 100.00%
BeninPADME BENIN Association pour la Promotion et l'Appui au Dével/Benin
$6,200,000 $0 0.00%
Benin VFB VITAL-FINANCE BENIN/Benin $2,411,107 $1,318,720 54.69%
Eritrea CARE International/Eritrea $696 $696 100.00%
Ethiopia Gasha Micro Financing, S.C./Ethiopia $350,570 $350,570 100.00%
Ethiopia Meklit Microfinance Institution, S.C./Ethiopia $220,500 $220,500 100.00%
EthiopiaSpecialized Financial and Promotional Institution/Ethiopia
$422,783 $422,783 100.00%
Ethiopia WV/Ethiopia $1,039,717 $935,000 89.93%Ghana Ecobank/Ghana $47,075 $0 0.00%Ghana Sinapi Aba Trust $1,665,071 $1,086,792 65.27%
Guinea Afr/Gn Africare/Guinea/Guinea $18,000 $0 0.00%
Guinea
OICI Opportunities Industrialization Centers International Guinea - Mamou/Guinea
$23,111 $23,111 100.00%
Guinea PRIDE/Finance/Guinea $1,339,400 $757,307 56.54%
Guinea VITA Volunteers In Technical Assistance/Guinea $81,162 $47,210 58.17%
KenyaAMFI The Association of Microfinance Institutions/Kenya
$0 $0
Kenya Barclays Bank of Kenya/Kenya $54,093 $0 0.00%
Kenya Cooperative Bank of Kenya Limited/Kenya $1,221,750 $183,262 15.00%
Kenya Faulu Kenya Limited/Kenya $4,210,544 $3,663,173 87.00%Kenya K-Rep Bank Limited/Kenya $9,233,224 $6,463,256 70.00%
Kenya KWFT Kenya Women Finance Trust/Kenya $6,047,957 $4,233,570 70.00%
Kenya SAGA Thrift and Enterprise Promotion, Ltd./Kenya $14,936 $14,936 100.00%
Kenya SMEP Small and Micro Enterprise Programme/Kenya $2,467,678 $29,225,502 1184.33%
Kenya WOCCU/Kenya/Kenya $59,043,934 $26,569,770 45.00%Malawi FINCA/Malawi $1,151,000 $1,000,000 86.88%
MalawiMUSCCO Malawi Union of Savings and Credit Cooperatives/Malawi
$568,920 $400,000 70.31%
Malawi Project Hope/Malawi $55,222 $55,222 100.00%
ANNEX H
H-1

REGION COUNTRY INSTITUTION PORTFOLIO US$ PL AMOUNT US$ PL RATINGMali AFR/Mali Africare/Mali $257,000 $250,000 97.28%Mali CANEF $555,619 $329,642 59.33%Mali CMEC SAN/Mali $51,143 $49,688 97.16%Mali CRMD/Mali $2,865,672 $2,579,105 90.00%Mali CVECA KITA/Mali $510,633 $458,096 89.71%Mali CVECA ON/Mali $2,037,747 $1,188,074 58.30%Mali CVECA PD/Mali $332,425 $249,319 75.00%Mali JEMENI/Mali $1,483,706 $222,556 15.00%Mali Jigiyaso $263,708 $47,314 17.94%Mali Kafo Jiginew $688,163 $688,163 100.00%Mali Kondo Jigima/Mali $2,131,131 $0 0.00%Mali Nyesigiso $952,680 $952,680 100.00%Mali PASACOOP/Mali $357,097 $337,787 94.59%Mali Paseca/Mali $172,765 $0 0.00%
Mali PIYELI (World Education PIEC) $806,048 $255,133 31.65%
Mali Save the Children/Mali - GGLS $199,779 $199,779 100.00%
Mozambique NovoBanco/Mozambique $577,773 $0 0.00%Mozambique Tchuma/Mozambique $499,189 $439,718 88.09%
MozambiqueWorld Relief/Mozambique FCC Fundo de Credito Comun
$239,175 $238,175 99.58%
Nigeria LAPO $2,006,826 $38,503 1.92%
Rwanda World Relief/Rwanda URWEGO $267,829 $262,472 98.00%
Senegal
ACAPES-MECFAM Mutuelle d'Epargne et de Credit des Femmes du Mouvement social/Senegal
$15,271 $9,854 64.53%
SenegalACEP/Senegal Alliance de Credit et d'Epargne pour la Production/Senegal
$171,016 $59,856 35.00%
Senegal ASACASE $176,579 $0 0.00%
SenegalCAPEC - JOOBASS Caisse Populaire d'Epargne et de Credit JOOBASS/Senegal
$1,425 $1,354 95.02%
Senegal CBAO/Senegal $19,942 $0 0.00%
Senegal CCF/Senegal Christian Children's Fund $200,882 $200,882 100.00%
Senegal
COFDEC Collectif des Femmes pour le Developpement de l'Epargne et du Credit/Senegal
$163,890 $90,140 55.00%
Senegal CRS Catholic Relief Services/Senegal $331,559 $331,559 100.00%
SenegalFNGPF Federation Nationale des Groupements de Promotion Feminine/Senegal
$478,968 $359,226 75.00%
Senegal
GEC FEMUNI Groupement d'Epargne et de Credit des Femmes de la cite des Nations Unies/Senegal
$6,044 $0 0.00%
SenegalINTER CREC Caisses Rurales d'Epargne et de Credit/Senegal
$108,354 $54,177 50.00%
H-2

REGION COUNTRY INSTITUTION PORTFOLIO US$ PL AMOUNT US$ PL RATING
Senegal
MEC FADEC Mutuelle d'Epargne et de Credit de la Federation des Associations de Developpment Communautaire/Senegal
$70,270 $28,108 40.00%
Senegal
MEC PROPEM Mutuelle d'Epargne et de Credit pour la Promotion de la Peche a Mbour/Senegal
$76,807 $0 0.00%
Senegal
MECARTH Mutuelle d'Epargne et de Credit des Artisans de la Region de Thies/Senegal
$88,643 $44,322 50.00%
Senegal Plan/Senegal $68,865 $20,914 30.37%
SenegalRECEC Reseau des Caisses d'Epargne et de Credit des Femmes de Dakar/Senegal
$308,118 $231,089 75.00%
Senegal UFC Union des Femmes commercantes/Senegal $12,945 $12,945 100.00%
SenegalUMEC Union des Mutuelles d'Epargne et de Credit de Sedhiou/Senegal
$369,880 $184,940 50.00%
Senegal
UNACOIS Union Nationale des Commerçants et Industriels du Sénégal/Senegal
$1,195,669 $248,858 20.81%
South AfricaCalmeadow/SEF Calmeadow/Small Enterprise Foundation/South Africa
$7,567,199 $3,277,200 43.31%
South Africa FINCA/South Africa $604,070 $154,206 25.53%Tanzania SEDA/Tanzania $1,222,489 $1,100,000 89.98%
Uganda Faulu Uganda Limited/Uganda $1,172,162 $1,022,711 87.25%
UgandaFINCA Uganda Foundation for International Community Assistance/Uganda
$1,628,000 $1,628,000 100.00%
Uganda FTCU Feed The Children Uganda/Uganda $460,952 $341,105 74.00%
UgandaMED-Net Microenterprise Development Network/Uganda
$1,007,479 $695,160 69.00%
Uganda
PRIDE UGANDA Promotion of Rural Initiatives and Development Enterprise (Uganda) Limited/Uganda
$4,854,448 $3,640,836 75.00%
Uganda UMU Uganda Microfinance Union/Uganda $1,683,000 $1,050 0.06%
Uganda WOCCU/Uganda/Uganda $2,167,185 $1,047,825 48.35%Zambia FINCA/Zambia $33,994 $30,000 88.25%Zimbabwe DAI/Zimbabwe $0 $0
Zimbabwe SHDF Self Help Development Foundation/Zimbabwe $481,679 $448,946 93.20%
Zimbabwe Zambuko Trust $130,515 $129,848 99.49%Total AFRICA $142,023,552 $101,153,389
ASIA Bangladesh BAWPA Bangladesh Agri. Working Peoples Assoc $141,722 $141,722 100.00%
H-3

REGION COUNTRY INSTITUTION PORTFOLIO US$ PL AMOUNT US$ PL RATINGBangladesh BAWSE Bang. Assoc. of
Wom. for Self-Empower $99,395 $99,395 100.00%
Bangladesh CARE/Bangladesh $411,335 $411,335 100.00%Bangladesh Desh Foundation/Bangladesh $105,896 $105,896 100.00%
Bangladesh DSK Dushtha Shasthya Kendra $630,694 $569,623 90.32%
Bangladesh Green Hill $8,350 $8,350 100.00%Bangladesh Hitaishi/Bangladesh $53,262 $53,262 100.00%
Bangladesh HOPE Hatiya Optimist Peoples Energy $18,486 $18,486 100.00%
Bangladesh IDF Integrated Development Foundation $1,460,515 $447,596 30.65%
Bangladesh Mamata $458,629 $27,402 5.97%Bangladesh MSS $59,272 $59,272 100.00%
Bangladesh OMI Organization for Mothers and Infants $82,029 $82,029 100.00%
Bangladesh Prime Bank/Bangladesh $46,306 $0 0.00%
Bangladesh WR/CSS Christian Service Society/Bangladesh $1,076,371 $1,076,371 100.00%
Cambodia Catholic Relief Services/Cambodia $887,873 $887,873 100.00%
Cambodia EMT Ennatien Moulethan Tchorebat/Cambodia $2,975,316 $2,968,137 99.76%
Cambodia TPT Concern/Thanakea Ponleu Thmey/Cambodia $653,869 $653,869 100.00%
Cambodia World Relief/Cambodia $712,494 $387,825 54.43%
India ASA Activists for Social Alternatives $1,142,456 $833,993 73.00%
India BES Balaji Educational Society $12,245 $0 0.00%
India CARD/India $13,743 $13,743 100.00%India ESAF $96,941 $96,941 100.00%
India FWWB Friends of Women's World Banking, India/India $3,606,755 $2,061,702 57.16%
India IMSE $51,680 $51,680 100.00%
India SARS South Asia Research Society $724,144 $724,144 100.00%
India TMT $11,786 $0 0.00%India VSS $5,190 $0 0.00%Indonesia Bank NISP/Indonesia $7,117 $0 0.00%
Indonesia BRI Bank Rakyat Indonesia, Micro Division $963,790,000 $260,223,300 27.00%
Indonesia DIMAN Dian Mandiri/Indonesia $70,051 $70,051 100.00%
MongoliaGobi Beginings Mercy Corps/Gobi Beginings (GB)/Mongolia
$443,300 $0 0.00%
Nepal Nirdhan Utthan Bank, Ltd./Nepal $2,342,205 $2,342,205 100.00%
Nepal NSSC Neighborhood Society Service Ctr. $48,406 $0 0.00%
Nepal Pact/Nepal/Nepal $1,818,878 $1,818,878 100.00%Nepal SBP/CSD $2,370,340 $2,370,340 100.00%Nepal TRWS $15,358 $15,358 100.00%
Philippines Ad Jesum Foundation/Philippines $144,681 $144,681 100.00%
Philippines ASHI Ahon Sa Hirap Inc. $559,649 $532,069 95.07%Philippines Bangko Kabayan/Philippines $41,424 $7,235 17.47%
H-4
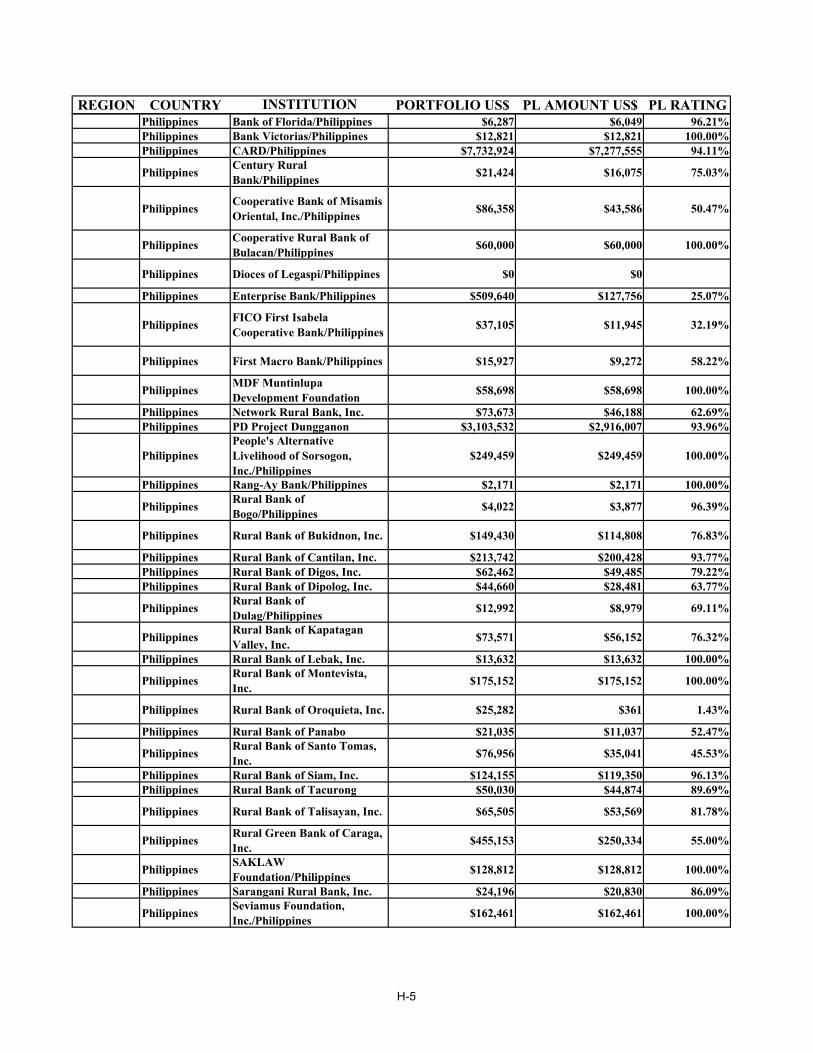
REGION COUNTRY INSTITUTION PORTFOLIO US$ PL AMOUNT US$ PL RATINGPhilippines Bank of Florida/Philippines $6,287 $6,049 96.21%Philippines Bank Victorias/Philippines $12,821 $12,821 100.00%Philippines CARD/Philippines $7,732,924 $7,277,555 94.11%
Philippines Century Rural Bank/Philippines $21,424 $16,075 75.03%
Philippines Cooperative Bank of Misamis Oriental, Inc./Philippines $86,358 $43,586 50.47%
Philippines Cooperative Rural Bank of Bulacan/Philippines $60,000 $60,000 100.00%
Philippines Dioces of Legaspi/Philippines $0 $0
Philippines Enterprise Bank/Philippines $509,640 $127,756 25.07%
Philippines FICO First Isabela Cooperative Bank/Philippines $37,105 $11,945 32.19%
Philippines First Macro Bank/Philippines $15,927 $9,272 58.22%
Philippines MDF Muntinlupa Development Foundation $58,698 $58,698 100.00%
Philippines Network Rural Bank, Inc. $73,673 $46,188 62.69%Philippines PD Project Dungganon $3,103,532 $2,916,007 93.96%
PhilippinesPeople's Alternative Livelihood of Sorsogon, Inc./Philippines
$249,459 $249,459 100.00%
Philippines Rang-Ay Bank/Philippines $2,171 $2,171 100.00%
Philippines Rural Bank of Bogo/Philippines $4,022 $3,877 96.39%
Philippines Rural Bank of Bukidnon, Inc. $149,430 $114,808 76.83%
Philippines Rural Bank of Cantilan, Inc. $213,742 $200,428 93.77%Philippines Rural Bank of Digos, Inc. $62,462 $49,485 79.22%Philippines Rural Bank of Dipolog, Inc. $44,660 $28,481 63.77%
Philippines Rural Bank of Dulag/Philippines $12,992 $8,979 69.11%
Philippines Rural Bank of Kapatagan Valley, Inc. $73,571 $56,152 76.32%
Philippines Rural Bank of Lebak, Inc. $13,632 $13,632 100.00%
Philippines Rural Bank of Montevista, Inc. $175,152 $175,152 100.00%
Philippines Rural Bank of Oroquieta, Inc. $25,282 $361 1.43%
Philippines Rural Bank of Panabo $21,035 $11,037 52.47%
Philippines Rural Bank of Santo Tomas, Inc. $76,956 $35,041 45.53%
Philippines Rural Bank of Siam, Inc. $124,155 $119,350 96.13%Philippines Rural Bank of Tacurong $50,030 $44,874 89.69%
Philippines Rural Bank of Talisayan, Inc. $65,505 $53,569 81.78%
Philippines Rural Green Bank of Caraga, Inc. $455,153 $250,334 55.00%
Philippines SAKLAW Foundation/Philippines $128,812 $128,812 100.00%
Philippines Sarangani Rural Bank, Inc. $24,196 $20,830 86.09%
Philippines Seviamus Foundation, Inc./Philippines $162,461 $162,461 100.00%
H-5

REGION COUNTRY INSTITUTION PORTFOLIO US$ PL AMOUNT US$ PL RATING
PhilippinesSmall Enterprise Development Project/Philippines
$37,948 $37,948 100.00%
Philippines Small Enterprise Kapital Assistance/Philippines $40,849 $40,849 100.00%
Philippines Spes Pauperum Foundation, Inc./Philippines $84,278 $84,278 100.00%
PhilippinesSt. Elizabeth Community Development Program/Philippines
$67,665 $67,665 100.00%
Philippines Tagum Rural Bank $94,016 $52,884 56.25%
Philippines TSPI Development Corporation $2,185,490 $2,185,490 100.00%
Philippines Tulong Kalinga, Inc./Philippines $65,248 $65,248 100.00%
Philippines WOCCU/CUES/Philippines/Philippines $20,294,053 $12,070,665 59.48%
Sri Lanka Seylan Bank, Ltd./Sri Lanka $85,869 $1,247 1.45%Total ASIA $1,024,006,845 $306,226,281
EE Albania PSHM Partneri Shqiptar ne Mikrokredi/Albania $2,357,058 $529,550 22.47%
Armenia Save the Children/Armenia $1,141,042 $1,141,042 100.00%Azerbaijan ACDI/VOCA/Azerbaijan $1,055,165 $61,513 5.83%
AzerbaijanFoundation for International Community Assistance/Azerbaijan
$268,198 $268,198 100.00%
AzerbaijanMercy Corps International/Azerbaijan/Azerbaijan
$424,652 $418,152 98.47%
Bosnia Mercy Corps/Bosnia $5,234,582 $2,385,409 45.57%Bosnia WWB $708,172 $0 0.00%
Bulgaria CRS Catholic Relief Services/Bulgaria $439,660 $343,290 78.08%
Bulgaria NACHALA Cooperative/Bulgaria $1,764,504 $603,000 34.17%
BulgariaWOCCU/Bulgaria World Counsil of Credit Unions Inc./Bulgaria
$1,501,928 $1,135,426 75.60%
Georgia ADRA Adventist Development and Relief Agency/Georgia $151,595 $151,595 100.00%
Georgia Constanta Foundation/Georgia $1,494,731 $1,374,329 91.94%
Georgia IOCC International Orthodox Christian Charities/Georgia $209,300 $87,150 41.64%
GeorgiaUMCOR/Georgia United Methodist Committee on Relief/Georgia
$5,534 $55 1.00%
Georgia UOT Union of Trust/Georgia $311,100 $311,100 100.00%
Kazakhstan ACF Asian Credit Fund/Kazakhstan $779,492 $4,933 0.63%
KazakhstanKCLF Kazakhstan Community Loan Fund/Kazakhstan
$789,867 $750,000 94.95%
Kosovo FINCA International/Kosovo $1,558,856 $205,633 13.19%
H-6
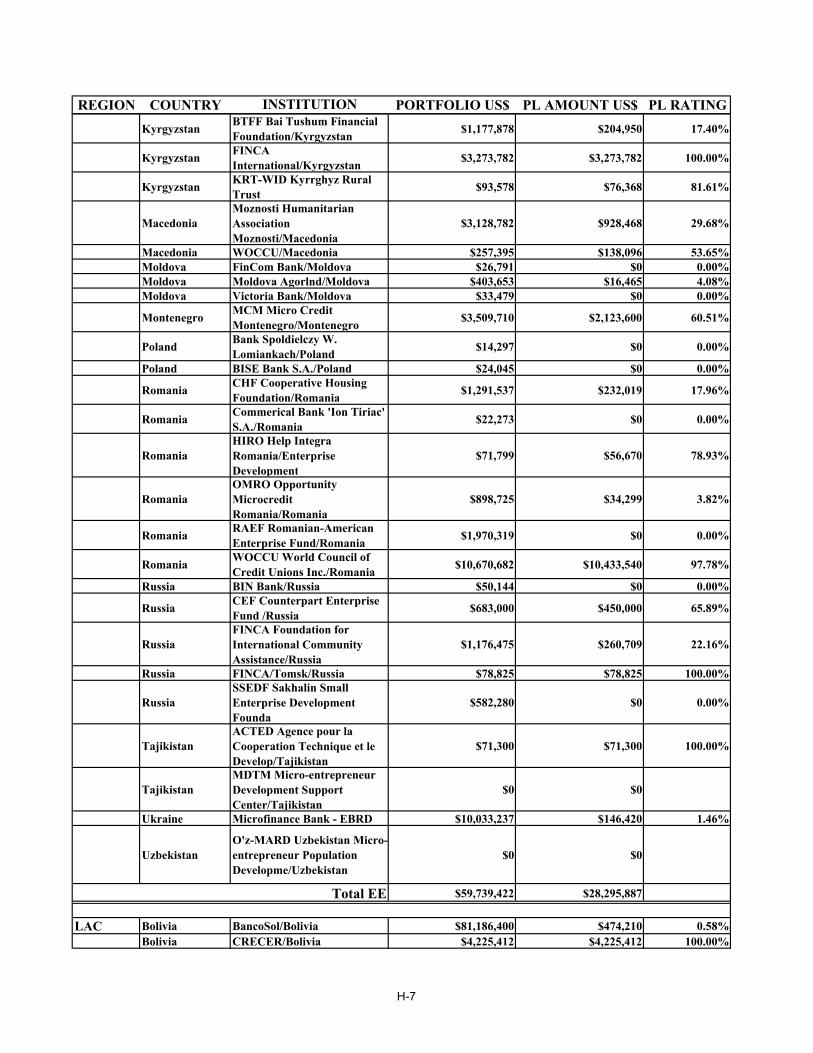
REGION COUNTRY INSTITUTION PORTFOLIO US$ PL AMOUNT US$ PL RATINGKyrgyzstan BTFF Bai Tushum Financial
Foundation/Kyrgyzstan $1,177,878 $204,950 17.40%
Kyrgyzstan FINCA International/Kyrgyzstan $3,273,782 $3,273,782 100.00%
Kyrgyzstan KRT-WID Kyrrghyz Rural Trust $93,578 $76,368 81.61%
MacedoniaMoznosti Humanitarian Association Moznosti/Macedonia
$3,128,782 $928,468 29.68%
Macedonia WOCCU/Macedonia $257,395 $138,096 53.65%Moldova FinCom Bank/Moldova $26,791 $0 0.00%Moldova Moldova Agorlnd/Moldova $403,653 $16,465 4.08%Moldova Victoria Bank/Moldova $33,479 $0 0.00%
Montenegro MCM Micro Credit Montenegro/Montenegro $3,509,710 $2,123,600 60.51%
Poland Bank Spoldielczy W. Lomiankach/Poland $14,297 $0 0.00%
Poland BISE Bank S.A./Poland $24,045 $0 0.00%
Romania CHF Cooperative Housing Foundation/Romania $1,291,537 $232,019 17.96%
Romania Commerical Bank 'Ion Tiriac' S.A./Romania $22,273 $0 0.00%
RomaniaHIRO Help Integra Romania/Enterprise Development
$71,799 $56,670 78.93%
RomaniaOMRO Opportunity Microcredit Romania/Romania
$898,725 $34,299 3.82%
Romania RAEF Romanian-American Enterprise Fund/Romania $1,970,319 $0 0.00%
Romania WOCCU World Council of Credit Unions Inc./Romania $10,670,682 $10,433,540 97.78%
Russia BIN Bank/Russia $50,144 $0 0.00%
Russia CEF Counterpart Enterprise Fund /Russia $683,000 $450,000 65.89%
RussiaFINCA Foundation for International Community Assistance/Russia
$1,176,475 $260,709 22.16%
Russia FINCA/Tomsk/Russia $78,825 $78,825 100.00%
RussiaSSEDF Sakhalin Small Enterprise Development Founda
$582,280 $0 0.00%
TajikistanACTED Agence pour la Cooperation Technique et le Develop/Tajikistan
$71,300 $71,300 100.00%
TajikistanMDTM Micro-entrepreneur Development Support Center/Tajikistan
$0 $0
Ukraine Microfinance Bank - EBRD $10,033,237 $146,420 1.46%
UzbekistanO'z-MARD Uzbekistan Micro-entrepreneur Population Developme/Uzbekistan
$0 $0
Total EE $59,739,422 $28,295,887
LAC Bolivia BancoSol/Bolivia $81,186,400 $474,210 0.58%Bolivia CRECER/Bolivia $4,225,412 $4,225,412 100.00%
H-7

REGION COUNTRY INSTITUTION PORTFOLIO US$ PL AMOUNT US$ PL RATINGBolivia ProMujer/Bolivia $5,115,174 $25,558 0.50%Bolivia WOCCU/Bolivia $32,368,077 $1,236,133 3.82%Colombia AGAPE $530,845 $483,393 91.06%Ecuador Banco Solidario/Ecuador $27,007,252 $10,394,314 38.49%Ecuador WOCCU/Ecuador/Ecuador $112,357,153 $8,341,500 7.42%
El Salvador
ACACSEMERSA DE R.L. Asociacion Cooperativa de Ahorro y Creditos de las/El Salvador
$131,909 $25,095 19.02%
El SalvadorACACU de R.L. Asociacion Cooperativa de Ahorro y Credito de La U/El Salvador
$215,937 $8,097 3.75%
El SalvadorACCOVI DE R.L. Asociacion Cooperativa de Ahorro y Credito Comunal/El Salvador
$0 $0
El Salvador
AMC de R.L. Sociedad Cooperativa de Ahorro y Credito, AMC de R/El Salvador
$1,943,665 $91,071 4.69%
El SalvadorASEI Asociacion Salvadorena de Extensionistas Empresari/El Salvador
$468,251 $178,011 38.02%
El Salvador BA Banco Agricola S.A./El Salvador $951,460 $81,740 8.59%
El Salvador Banco Cuscatlan/El Salvador $5,714 $0 0.00%
El Salvador BANSAL Banco Salvadoreno/El Salvador $842,530 $111,175 13.20%
El Salvador CAM Centro de Apoyo a la Microempresa/El Salvador $3,966,200 $2,657,400 67.00%
El Salvador ENLACE CRS/El Salvador $997,155 $997,155 100.00%
El Salvador Financiera Calpiá, S.A./El Salvador $31,567,647 $2,757,160 8.73%
El Salvador FJND Fundacion Jose Napoleon Duarte/El Salvador $998,047 $200,245 20.06%
El SalvadorFUSAI Fundacion Salvadorena de Apoyo Integral /El Salvador
$6,336,566 $836,469 13.20%
Guatemala Banrural $1,111,604 $1,111,604 100.00%
Guatemala CCF/Guatemala Christian Children's Fund $155,279 $155,279 100.00%
GuatemalaFAFIDESS Fundación de Asesoria Financiera a Instituciones/Guatemala
$1,894,914 $1,703,183 89.88%
Guatemala FINCA/Guatemala $211,829 $196,000 92.53%Guatemala FUNDAP $898,039 $898,039 100.00%
Guatemala Genesis Empresarial/Guatemala $13,744,015 $700,000 5.09%
Guatemala MUDE/Villa Nueva $304,600 $304,600 100.00%Guatemala Plan/Guatemala/Guatemala $519,768 $0 0.00%Guatemala Project Hope/Guatemala $118,119 $118,119 100.00%
GuyanaIPED Institute of Private Enterprise Development/Guyana
$4,835,061 $493,000 10.20%
Haiti FINCA/Haiti $131,645 $66,000 50.13%
Honduras ADEPES Asociacion para el Desarrollo Perspi $76,000 $76,000 100.00%
H-8
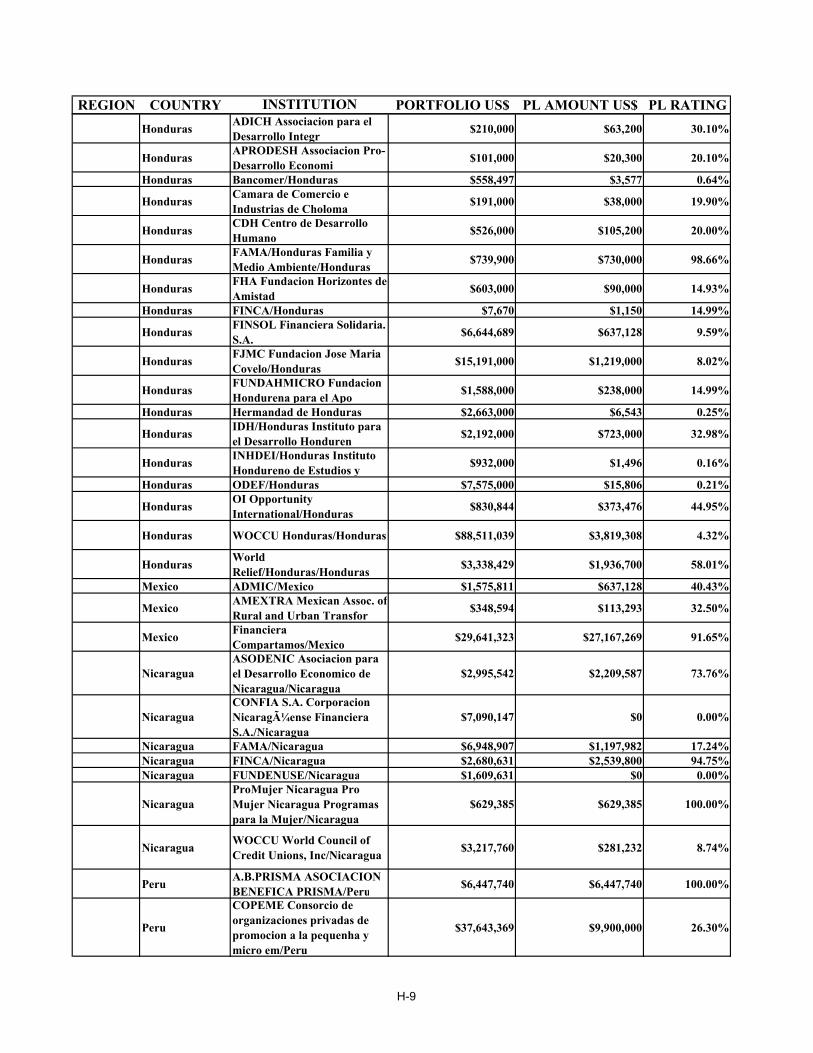
REGION COUNTRY INSTITUTION PORTFOLIO US$ PL AMOUNT US$ PL RATINGHonduras ADICH Associacion para el
Desarrollo Integr $210,000 $63,200 30.10%
Honduras APRODESH Associacion Pro-Desarrollo Economi $101,000 $20,300 20.10%
Honduras Bancomer/Honduras $558,497 $3,577 0.64%
Honduras Camara de Comercio e Industrias de Choloma $191,000 $38,000 19.90%
Honduras CDH Centro de Desarrollo Humano $526,000 $105,200 20.00%
Honduras FAMA/Honduras Familia y Medio Ambiente/Honduras $739,900 $730,000 98.66%
Honduras FHA Fundacion Horizontes de Amistad $603,000 $90,000 14.93%
Honduras FINCA/Honduras $7,670 $1,150 14.99%
Honduras FINSOL Financiera Solidaria. S.A. $6,644,689 $637,128 9.59%
Honduras FJMC Fundacion Jose Maria Covelo/Honduras $15,191,000 $1,219,000 8.02%
Honduras FUNDAHMICRO Fundacion Hondurena para el Apo $1,588,000 $238,000 14.99%
Honduras Hermandad de Honduras $2,663,000 $6,543 0.25%
Honduras IDH/Honduras Instituto para el Desarrollo Honduren $2,192,000 $723,000 32.98%
Honduras INHDEI/Honduras Instituto Hondureno de Estudios y $932,000 $1,496 0.16%
Honduras ODEF/Honduras $7,575,000 $15,806 0.21%
Honduras OI Opportunity International/Honduras $830,844 $373,476 44.95%
Honduras WOCCU Honduras/Honduras $88,511,039 $3,819,308 4.32%
Honduras World Relief/Honduras/Honduras $3,338,429 $1,936,700 58.01%
Mexico ADMIC/Mexico $1,575,811 $637,128 40.43%
Mexico AMEXTRA Mexican Assoc. of Rural and Urban Transfor $348,594 $113,293 32.50%
Mexico Financiera Compartamos/Mexico $29,641,323 $27,167,269 91.65%
NicaraguaASODENIC Asociacion para el Desarrollo Economico de Nicaragua/Nicaragua
$2,995,542 $2,209,587 73.76%
NicaraguaCONFIA S.A. Corporacion Nicaragüense Financiera S.A./Nicaragua
$7,090,147 $0 0.00%
Nicaragua FAMA/Nicaragua $6,948,907 $1,197,982 17.24%Nicaragua FINCA/Nicaragua $2,680,631 $2,539,800 94.75%Nicaragua FUNDENUSE/Nicaragua $1,609,631 $0 0.00%
NicaraguaProMujer Nicaragua Pro Mujer Nicaragua Programas para la Mujer/Nicaragua
$629,385 $629,385 100.00%
Nicaragua WOCCU World Council of Credit Unions, Inc/Nicaragua $3,217,760 $281,232 8.74%
Peru A.B.PRISMA ASOCIACION BENEFICA PRISMA/Peru $6,447,740 $6,447,740 100.00%
Peru
COPEME Consorcio de organizaciones privadas de promocion a la pequenha y micro em/Peru
$37,643,369 $9,900,000 26.30%
H-9
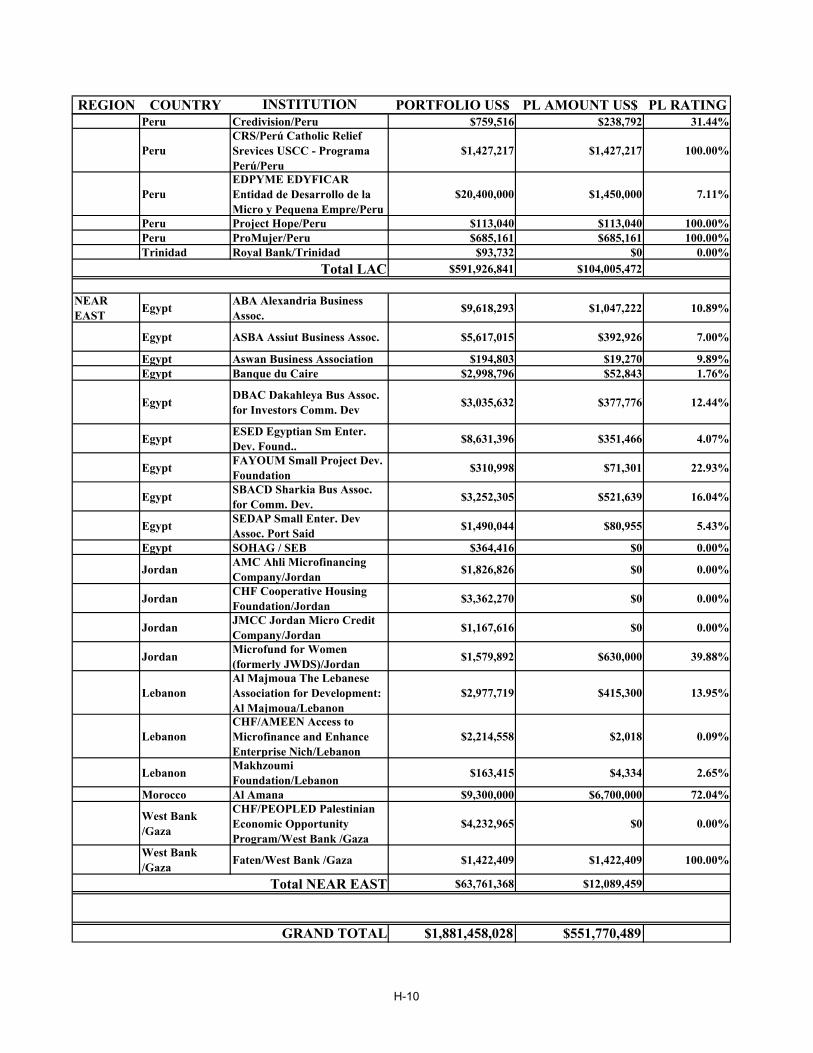
REGION COUNTRY INSTITUTION PORTFOLIO US$ PL AMOUNT US$ PL RATINGPeru Credivision/Peru $759,516 $238,792 31.44%
PeruCRS/Perú Catholic Relief Srevices USCC - Programa Perú/Peru
$1,427,217 $1,427,217 100.00%
PeruEDPYME EDYFICAR Entidad de Desarrollo de la Micro y Pequena Empre/Peru
$20,400,000 $1,450,000 7.11%
Peru Project Hope/Peru $113,040 $113,040 100.00%Peru ProMujer/Peru $685,161 $685,161 100.00%Trinidad Royal Bank/Trinidad $93,732 $0 0.00%
Total LAC $591,926,841 $104,005,472
NEAR EAST Egypt ABA Alexandria Business
Assoc. $9,618,293 $1,047,222 10.89%
Egypt ASBA Assiut Business Assoc. $5,617,015 $392,926 7.00%
Egypt Aswan Business Association $194,803 $19,270 9.89%Egypt Banque du Caire $2,998,796 $52,843 1.76%
Egypt DBAC Dakahleya Bus Assoc. for Investors Comm. Dev $3,035,632 $377,776 12.44%
Egypt ESED Egyptian Sm Enter. Dev. Found.. $8,631,396 $351,466 4.07%
Egypt FAYOUM Small Project Dev. Foundation $310,998 $71,301 22.93%
Egypt SBACD Sharkia Bus Assoc. for Comm. Dev. $3,252,305 $521,639 16.04%
Egypt SEDAP Small Enter. Dev Assoc. Port Said $1,490,044 $80,955 5.43%
Egypt SOHAG / SEB $364,416 $0 0.00%
Jordan AMC Ahli Microfinancing Company/Jordan $1,826,826 $0 0.00%
Jordan CHF Cooperative Housing Foundation/Jordan $3,362,270 $0 0.00%
Jordan JMCC Jordan Micro Credit Company/Jordan $1,167,616 $0 0.00%
Jordan Microfund for Women (formerly JWDS)/Jordan $1,579,892 $630,000 39.88%
LebanonAl Majmoua The Lebanese Association for Development: Al Majmoua/Lebanon
$2,977,719 $415,300 13.95%
LebanonCHF/AMEEN Access to Microfinance and Enhance Enterprise Nich/Lebanon
$2,214,558 $2,018 0.09%
Lebanon Makhzoumi Foundation/Lebanon $163,415 $4,334 2.65%
Morocco Al Amana $9,300,000 $6,700,000 72.04%
West Bank /Gaza
CHF/PEOPLED Palestinian Economic Opportunity Program/West Bank /Gaza
$4,232,965 $0 0.00%
West Bank /Gaza Faten/West Bank /Gaza $1,422,409 $1,422,409 100.00%
Total NEAR EAST $63,761,368 $12,089,459
GRAND TOTAL $1,881,458,028 $551,770,489
H-10

BDS Providers in USAID Survey, 2001
REGION COUNTRY INSTITUTION CLIENTS % WOMEN
% RURAL % POOR % VERY
POORAFRICA Benin Enterprise Works/Benin 13,539 46.00% 38.00% 32.00% 0.00%
Eritrea National Council of Negro Women, Inc./Eritrea 100 50.00% 90.00% 80.00% 0.00%
Eritrea REU Rural Enterprise Unit/Eritrea 235 20.00% 50.00% 0.00% 0.00%Ethiopia FHI Food for the Hungry Inter./Ethiopia 29,204 0.00% 0.00% 60.00% 30.00%
Ghana EWW/Ghana EWW Enterprise Works WorldWide/Ghana 0 0.00% 0.00% 0.00% 0.00%
Ghana TechnoServe/Ghana 4,851 65.00% 70.00% 40.00% 10.00%
Guinea ADRA/GUINEA Adventist Development And Relief Organization/Guinea 1,234 84.00% 81.00% 40.00% 0.00%
Guinea Afr/Gn Africare/Guinea/Guinea 3,000 70.00% 100.00% 62.00% 25.00%
Guinea VITA Volunteers In Technical Assistance/Guinea 1,119 26.00% 76.00% 76.00% 63.00%
Kenya Land O'Lakes, Inc./Kenya/Kenya 899 20.00% 90.00% 57.00% 20.00%Malawi Land O'Lakes, Inc./Malawi 5,000 30.00% 90.00% 20.00% 1.00%Mozambique ACDI/VOCA Mozambique/Mozambique 360 38.00% 100.00% 100.00% 50.00%Mozambique Aid to Artisans/Mozambique 449 37.00% 100.00% 0.00% 0.00%
Mozambique CLUSA Cooperative League of the United States of America/Mozambique 25,999 22.30% 100.00% 95.00% 10.00%
Mozambique TechnoServe Mozambique/Mozambique 20 5.00% 100.00% 0.00% 0.00%Senegal Africare/Senegal 203 86.00% 99.00% 48.00% 39.00%
Senegal EWW EnterpriseWorks Worldwide/Senegal 196 55.00% 0.00% 75.00% 35.00%
South Africa Enterprise, Management and Innovation 709 41.00% 7.00% 0.00% 0.00%
Tanzania Africare/Ugalla Community Conservation Project/Tanzania 1,622 39.00% 100.00% 18.70% 5.00%
Tanzania Aid to Artisans/AMKA/Tanzania 565 55.00% 70.00% 0.00% 0.00%Uganda Land OLakes/Uganda 1,822 40.00% 92.00% 15.00% 15.00%Zambia Land O'Lakes, Inc./Zambia 20 30.00% 80.00% 30.00% 15.00%
ANNEX I
I-1

REGION COUNTRY INSTITUTION CLIENTS % WOMEN
% RURAL % POOR % VERY
POORZambia Zambia Chamber of Small and Medium
Business Associ 1,208 38.00% 97.00% 75.00% 0.00%
Zambia ZAMTIE Zambia Trade and Investment Enhancement 400 35.00% 90.00% 85.00% 0.00%
Zambia ZATAC Zambia Agribusiness Technical Assistance Cen 1,500 31.00% 90.00% 90.00% 10.00%
Total AFRICA 94,254
ASIA Bangladesh BT BURO Tangail/Bangladesh 3,000 100.00% 99.00% 37.00% 30.00%
Bangladesh CDS Centre for Development Services/Bangladesh 500 82.00% 75.00% 30.00% 30.00%
Bangladesh ICLARM- The World Fish Center/Bangladesh 6,608 45.00% 100.00% 60.00% 30.00%
Bangladesh IRIS/JOBS University of Maryland/Bangladesh 10,687 94.00% 97.00% 30.00% 30.00%
Bangladesh SF Shakti Foundation/Bangladesh 300 100.00% 0.00% 40.00% 20.00%
Bangladesh SSS Society for Social Service/Bangladesh 1,500 100.00% 100.00% 40.00% 30.00%
Bangladesh WV World Vision/Bangladesh 92 65.00% 100.00% 100.00% 15.00%
Bangladesh YPSA Young Power in Social Action/Bangladesh 300 78.00% 100.00% 40.00% 30.00%
IndonesiaASEMHAKI The Indonesian Association for Small and Medium Enterprises Consultant/Indonesia
560 50.00% 70.00% 10.00% 5.00%
IndonesiaCARE-UNBAR SAMBA Silk And Microenterprises Development in Bandung RayA/Indonesia
200 60.00% 45.00% 60.00% 20.00%
Nepal Pact/Nepal/Nepal 0 0.00% 0.00% 0.00% 0.00%Total ASIA 23,747
EE Albania Land O'Lakes, Inc./Albania 8,000 95.00% 100.00% 50.00% 5.00%
Azerbaijan CHF Cooperative Housing Foundation/Azerbaijan 686 42.00% 100.00% 45.00% 25.00%
Azerbaijan Land O'Lakes, Inc./Azerbaijan 604 55.00% 40.00% 25.00% 0.00%
I-2

REGION COUNTRY INSTITUTION CLIENTS % WOMEN
% RURAL % POOR % VERY
POORAzerbaijan Mercy Corps
International/Azerbaijan/Azerbaijan 21,107 52.00% 100.00% 80.00% 40.00%
Macedonia Land O'Lakes, Inc./Macedonia 182 0.00% 85.00% 5.00% 0.00%
Montenegro Land O' Lakes, Inc./ Montenegro/Montenegro 5,000 50.00% 95.00% 80.00% 50.00%
Romania ATA Romania Arta Traditie Artizanat Romania/Romania 285 80.00% 83.00% 15.00% 5.00%
Romania CARA Arad Casa de Ajutor Reciproc a Asociatiilor Arad/Romania 26 46.00% 0.00% 0.00% 0.00%
RomaniaCARA Caras-Severin Casa de Ajutor Reciproc a Asociatiilor Caras-Sever/Romania
43 41.86% 0.00% 0.00% 0.00%
Romania CARA Mehedinti Casa de Ajutor Reciproc a Asociatiilor Mehedinti/Romania 41 82.92% 0.00% 0.00% 0.00%
Romania CARA/CHF/Romania Casa de Ajutor Reciproc a Asociat 417 56.35% 0.00% 0.00% 0.00%
Romania CARMA Deva Casa de Ajutor Reciproc a Membrilor Asociati Deva/Romania 24 58.33% 0.00% 0.00% 0.00%
Romania HIRO Help Integra Romania/Enterprise Development 0 0.00% 0.00% 0.00% 0.00%
Russia AMM Academy of Management and the Market/Russia 13,963 59.00% 12.00% 0.00% 0.00%
Russia University of Alaska Anchorage/Russia 100 20.00% 100.00% 100.00% 30.00%Tajikistan CARE Tajikistan/Tajikistan 3,185 55.00% 100.00% 100.00% 100.00%
Total EE 53,663
LAC Bolivia MEDA/Bolivia 0 0.00% 0.00% 0.00% 0.00%Colombia Womens World Banking/Colombia 999 99.00% 0.00% 55.00% 23.00%Guatemala AGEXPRONT/Guatemala 5,000 30.00% 100.00% 85.00% 30.00%Guatemala AGIL Abt Associates, Inc./Guatemala 9,569 53.00% 75.00% 95.00% 40.00%Guatemala CECI 289 49.00% 87.00% 0.00% 0.00%
Guatemala CHF Cooperative Housing Foundation/Guatemala 100 0.00% 100.00% 80.00% 0.00%
Haiti Aid to Artisans/Haiti 1,200 44.58% 80.00% 90.00% 20.00%Honduras Chemonics/Honduras 572 48.70% 51.00% 98.00% 30.00%
I-3
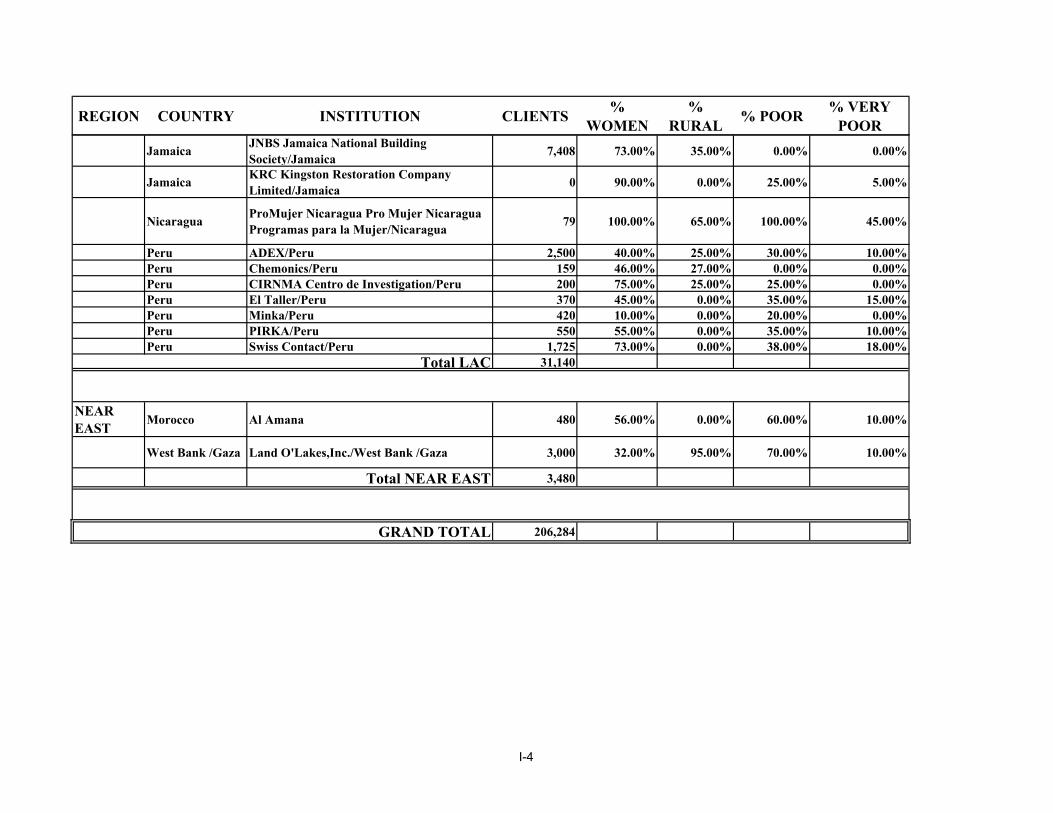
REGION COUNTRY INSTITUTION CLIENTS % WOMEN
% RURAL % POOR % VERY
POORJamaica JNBS Jamaica National Building
Society/Jamaica 7,408 73.00% 35.00% 0.00% 0.00%
Jamaica KRC Kingston Restoration Company Limited/Jamaica 0 90.00% 0.00% 25.00% 5.00%
Nicaragua ProMujer Nicaragua Pro Mujer Nicaragua Programas para la Mujer/Nicaragua 79 100.00% 65.00% 100.00% 45.00%
Peru ADEX/Peru 2,500 40.00% 25.00% 30.00% 10.00%Peru Chemonics/Peru 159 46.00% 27.00% 0.00% 0.00%Peru CIRNMA Centro de Investigation/Peru 200 75.00% 25.00% 25.00% 0.00%Peru El Taller/Peru 370 45.00% 0.00% 35.00% 15.00%Peru Minka/Peru 420 10.00% 0.00% 20.00% 0.00%Peru PIRKA/Peru 550 55.00% 0.00% 35.00% 10.00%Peru Swiss Contact/Peru 1,725 73.00% 0.00% 38.00% 18.00%
Total LAC 31,140
NEAR EAST Morocco Al Amana 480 56.00% 0.00% 60.00% 10.00%
West Bank /Gaza Land O'Lakes,Inc./West Bank /Gaza 3,000 32.00% 95.00% 70.00% 10.00%
Total NEAR EAST 3,480
GRAND TOTAL 206,284
I-4

BDS Facilitators in USAID Survey, 2001
REGION COUNTRY INSTITUTION CLIENTS % WOMEN % RURAL % POOR % VERY POOR
AFRICA Eritrea REU Rural Enterprise Unit/Eritrea 235 20.00% 50.00% 0.00% 0.00%
Ethiopia ACDI/VOCA/Ethiopia 169,000 13.00% 100.00% 100.00% 50.00%
KenyaApproTEC Appropriate Technologies for Enterprise Creation/Kenya
2,597 49.00% 95.00% 10.00% 6.00%
Kenya TechnoServe/Kenya 3,165 90.00% 80.00% 100.00% 0.00%Malawi ACDI/VOCA/Malawi 96,181 37.00% 100.00% 20.00% 0.00%Mali AFE/Mali 2,630 50.00% 30.00% 60.00% 20.00%
Mozambique ACDI/VOCA Mozambique/Mozambique 0 0.00% 0.00% 100.00% 50.00%
Mozambique Africare/Mozambique 187 9.00% 15.00% 63.10% 34.20%Mozambique CARE/Mozambique 29,183 29.00% 100.00% 95.00% 90.00%
MozambiqueCLUSA Cooperative League of the United States of America/Mozambique
5,534 20.00% 100.00% 95.00% 40.00%
Mozambique FHI/Mozambique 35,450 54.00% 100.00% 100.00% 70.00%Mozambique Save the Children/Mozambique 18 19.00% 100.00% 100.00% 90.00%Mozambique World Vision/Mozambique 12,442 35.00% 100.00% 95.00% 80.00%
Senegal DynaEntreprises/ Chemonics/Senegal 1,606 41.00% 75.00% 0.00% 0.00%
South Africa WEI World Education NTINGA/South Africa 6,000 51.00% 51.00% 76.00% 50.00%
South Africa WOCCU/South Africa 13,000 25.00% 25.00% 0.00% 0.00%
Tanzania Africare/Ugalla Community Conservation Project/Tanzania 0 0.00% 0.00% 18.70% 5.00%
Zambia Land O'Lakes, Inc./Zambia 200 50.00% 70.00% 60.00% 30.00%
Zambia Zambia Chamber of Small and Medium Business Associ 52 38.00% 88.00% 75.00% 0.00%
Zambia ZAMTIE Zambia Trade and Investment Enhancement 400 35.00% 90.00% 0.00% 0.00%
ANNEX J
J-1

REGION COUNTRY INSTITUTION CLIENTS % WOMEN % RURAL % POOR % VERY POORZimbabwe DAI/Zimbabwe 0 0.00% 0.00% 80.00% 0.00%
Total AFRICA 377,880
ASIA Bangladesh ICLARM- The World Fish Center/Bangladesh 0 0.00% 0.00% 0.00% 0.00%
Bangladesh IRIS/JOBS University of Maryland/Bangladesh 0 0.00% 0.00% 30.00% 30.00%
Bangladesh WV World Vision/BangladeshIndia IDE/ India 2,113 11.00% 100.00% 26.10% 13.00%
Indonesia
ASEMHAKI The Indonesian Association for Small and Medium Enterprises Consultant/Indonesia
0 0.00% 0.00% 10.00% 0.00%
Indonesia
CARE-UNBAR SAMBA Silk And Microenterprises Development in Bandung RayA/Indonesia
30 55.00% 50.00% 60.00% 50.00%
IndonesiaSAMBA Silk and Microenterprises Development in Bandung Raya/Indonesia
2,000 60.00% 75.00% 30.00% 5.00%
Indonesia The Asia Foundation/Indonesia 200 28.00% 35.00% 0.00% 0.00%Nepal Pact/Nepal/Nepal 122,406 100.00% 90.00% 45.00% 12.00%
Total ASIA 126,749
EE Montenegro Land O' Lakes, Inc./ Montenegro/Montenegro 5,000 50.00% 95.00% 80.00% 50.00%
RomaniaHIRO Help Integra Romania/Enterprise Development
0 70.00% 0.00% 0.00% 0.00%
Russia JAR Junior Achievement Russia/Russia 5,920 88.00% 25.00% 70.00% 0.00%
Tajikistan Eurasia Foundation/Tajikistan 100 50.00% 25.00% 100.00% 80.00%
Turkmenistan Pragma Corporation/Turkmenistan 1,535 61.00% 22.00% 0.00% 0.00%
Uzbekistan Eurasia Foundation - Tashkent Regional Office/Uzbekistan 400 50.00% 30.00% 0.00% 0.00%
J-2

REGION COUNTRY INSTITUTION CLIENTS % WOMEN % RURAL % POOR % VERY POORTotal EE 12,955
LAC Bolivia CRS/Bolivia 417 22.00% 100.00% 100.00% 20.00%Bolivia MEDA/Bolivia 3,000 40.00% 99.99% 85.00% 15.00%
Colombia Fundacion Mario Santo Domingo 21,430 70.00% 5.00% 50.00% 25.00%
Colombia Womens World Banking/Colombia 0 0.00% 0.00% 55.00% 23.00%
Guatemala AGEXPRONT/Guatemala 0 0.00% 0.00% 85.00% 30.00%Haiti Aid to Artisans/Haiti 200 45.00% 30.00% 90.00% 20.00%Honduras Chemonics/Honduras 2,000 40.00% 50.00% 70.00% 20.00%
Nicaragua WOCCU World Council of Credit Unions, Inc/Nicaragua 15,713 49.00% 80.00% 50.00% 25.00%
Peru ADEX/Peru 0 0.00% 0.00% 30.00% 10.00%Peru Swiss Contact/Peru 5,830 57.00% 0.00% 42.00% 36.00%
Total LAC 48,590
NEAR EAST West Bank /GazaISAMI Initiative for Sustainable and Accessible Microfin/West Bank /Gaza
10,000 33.00% 80.00% 67.00% 20.00%
West Bank /Gaza Land O'Lakes,Inc./West Bank /Gaza 3,000 11.00% 95.00% 70.00% 30.00%
Total NEAR EAST 13,000
WORLDWIDE Worldwide CARANA Corporation/Worldwide 50,000 60.00% 50.00% 80.00% 50.00%
Total WORLDWIDE 50,000
GRAND TOTAL 629,174
J-3

ANNEX KPolicy Research by USAID-Supported Institutions, 2001
REGION COUNTRY INSTITUTION INSTITUTION TYPE POLICY ISSUE
AFRICA Kenya KIPPRA Kenya Institute for Public Policy Research and Analysis/Kenya Research/Educational Capacity building
DeregulationTrade Policy
Mozambique ACDI/VOCA Mozambique/Mozambique PVO Cooperative business regulation and transparency
Senegal Arbitration Center Chamber of Commerce Judicial process more adapted to business needs
Senegal Private Sector SO/Senegal USAID Adaptation of the judicial process to business needsZimbabwe DAI/Zimbabwe Consulting Firm
ASIA Indonesia IRIS Institutional Reform and the Informal Sector/Indonesia Research/Educational Identify barriers to SME activity in the regions.
Microenterprise LawWorking with regional university partners and SME Strengthen the capacity of local groupsWorking cooperatively with Mercy Corp and other local NGOs
Indonesia PEG Partnership for Economic Growth Project/Indonesia Consulting Firm Regulation and Promotion of Small, Medium and
MicroenterprisesIndonesia The Asia Foundation/Indonesia PVO Halal Certification and Halal Labeling
Microfinance LawAmendment to Article No. 51
Indonesia Trickle Up Program/Indonesia NGO Poverty AlleviationNepal Pact/Nepal/Nepal PVO MFI Intermediary Act
Uniform strategy to link village banks to MFI
PhilippinesIMCC/CPIP International Management and Communication Corporation/Credit Policy Impr/Philippines
Consulting Firm Appropriate Regulatory Framework for Microfinance
Providing the appropriate regulatory environment
K-1

REGION COUNTRY INSTITUTION INSTITUTION TYPE POLICY ISSUE
EE Kazakhstan NBRK National Bank of the Republic of Kazakhstan/Kazakhstan Consulting Firm Microlending Organizations Law
Kyrgyzstan Barents Group of KPMG Consulting/Kyrgyzstan Consulting Firm Bank Supervision/Bank Regulation
Romania WOCCU World Council of Credit Unions Inc./Romania Credit Union Institutional Capitalization
Delinquency ControlUzbekistan WOCCU/Uzbekistan Credit Union Create supervisory framework for credit unions
LAC EcuadorSALTO/DAI Strengthen Access to Microfinance and Liberalization Task Order/Ecuador
Consulting Firm Second-Tier Institutions
Financial RegulationCredit Information Bureaus
Haiti DAI-FINNET Haiti Consulting Firm Legal and Regulatory Framework for MFIsNEAR EAST Jordan Chemonics/AMIR/Jordan Consulting Firm Entity Change of the Microfinance institution (MFI
Product Line LeasingMovable Assets LawSubsidized LendingSales Tax ExemptionCredit Bureau
K-2