linking poor rural households to microfinance and markets
TRANSCRIPT

Linking Poor Rural Households to Microfinance and Markets in Ethiopia
Baseline and Mid-term Assessment of the PSNP Plus Project in Raya Azebo
November 2010
John Burns & Solomon Bogale

Longitudinal Impact Study of the PSNP Plus Program Baseline Assessment in Raya Azebo
1
Table of Contents
SUMMARY 6
1. INTRODUCTION 8 1.1 PSNP PLUS PROJECT BACKGROUND 8 1.2 LINKING POOR RURAL HOUSEHOLDS TO MICROFINANCE AND MARKETS IN ETHIOPIA. 9
2 THE PSNP PLUS PROJECT 10 2.1 PSNP PLUS OVERVIEW 10 2.2 STUDY OVERVIEW 11 2.3 OVERVIEW OF PSNP PLUS PROJECT APPROACH IN RAYA AZEBO 12 2.3.1 STUDY AREA GENERAL CHARACTERISTICS 12 2.3.2 MICROFINANCE LINKAGE COMPONENT 12 2.3.3 VILLAGE SAVINGS AND LOAN ASSOCIATIONS 13 2.3.4 MARKET LINKAGE COMPONENT 14 2.3.5 IMPLEMENTATION CHALLENGES 17 2.4 RESEARCH QUESTIONS 18
3. ASSESSMENT METHODOLOGY 19 3.1 STUDY APPROACH 19 3.2 OVERVIEW OF METHODS AND INDICATORS 19 3.3 INDICATOR SELECTION 20 3.4 SAMPLING 20 3.4.1 METHOD AND SIZE 20 3.4.2 STUDY LOCATIONS 21 3.5 DATA COLLECTION METHODS 22 3.5.1 HOUSEHOLD INTERVIEWS 22 3.5.2 FOCUS GROUP METHODS 22 3.6 PRE-TESTING 23 3.7 TRIANGULATION AND VALIDATION 23 3.8 DATA ANALYSIS 23
4 RESULTS 25 4.1 CONTEXTUALIZING PSNP PLUS 25 4.2 PROJECT BACKGROUND AND STATUS AT THE TIME OF THE ASSESSMENT 26 4.3 IMPACT OF THE DROUGHT IN 2009 28 4.4 COMMUNITY CHARACTERISTICS 29 4.5 INCOME AND EXPENDITURE 30 4.5.1 PROJECT DERIVED INCOME AND UTILIZATION 31 4.6 SAVINGS AND LOANS 33 4.6.1 PSNP PLUS VILLAGE SAVINGS GROUPS 34 4.7 ASSETS AND ASSET CHANGES 35 4.8. LIVESTOCK VALUE CHAIN STRENGTHS AND CHALLENGES 43

Longitudinal Impact Study of the PSNP Plus Program Baseline Assessment in Raya Azebo
2
5. DISCUSSION 44 5.1 METHODOLOGICAL LIMITATIONS 44 5.2 RECENT LIVELIHOODS SHOCKS 44 5.3 COMMUNITY WEALTH INDICATORS 45 5.4 SOURCES OF INCOME 45 5.4.1 LIVESTOCK PRODUCTION AND MARKETING 45 5.4.2 CONSTRAINTS TO LIVESTOCK PRODUCTION AND MARKETING 46 5.4.3 CROP PRODUCTION 48 5.4.4 CONSTRAINTS TO CROP PRODUCTION 49 5.4.5 OTHER ECONOMIC ACTIVITIES 49 5.6 CREDIT AND SAVINGS 50 5.6.1 VILLAGE SAVING AND LOAN ASSOCIATIONS 51 6 EXPENDITURE 51 7 LIVESTOCK FATTENING ISSUES 52 8 ASSET CHANGES 53 9 OTHER PROJECT IMPACTS 54
CONCLUSIONS 55 Annex I Household component checklist 60 Annex II Livestock Prices in Raya Azebo 67

Longitudinal Impact Study of the PSNP Plus Program Baseline Assessment in Raya Azebo
3
List of Tables Table 1: Value chain outputs under PSNP Plus ............................................................................... 17 Table 2: Sampling frame and actual sample .................................................................................... 20 Table 3: Summary of assessment coverage .................................................................................... 21 Table 4: Summary of household questionnaire themes and methods .............................................22 Table 5: Project intervention timeline ............................................................................................... 25 Table 6: Recent events timeline .......................................................................................................26 Table 7: Shocks experienced by assessment participants in 2009 .................................................. 26 Table 8: PSNP Plus asset transfers and dynamics ..........................................................................27 Table 9: Characteristics and Background Data on Assessment Participants...................................27 Table 10: Community wealth indicators (n=27 groups) ....................................................................29 Table 11: Utilization of income from fattening sales (disaggregated)............................................... 32 Table 12: Village Saving Groups SWOT analysis (n=6)...................................................................34 Table 13: Changes in tree ownership 2009-2010.............................................................................35 Table 14: Factors contributing to negative changes in livestock assets...........................................37 Table 15: Factors contributing to positive changes in livestock assets ............................................37 Table 16: Factors contributing to negative changes in productive assets (tools) ............................. 39 Table 17: Factors contributing to positive changes in productive assets (tools) .............................. 39 Table 18: Factors contributing to negative changes in household assets ........................................41 Table 19: Factors contributing to positive changes in household assets .........................................41 Table 20: Probability of project participant’s assets increasing ........................................................ 42 Table 21: Livestock value chain SWOT analysis n=27.....................................................................43 Table 22: Profile of VSLA groups assessed ..................................................................................... 51 List of Figures Figure 1: Reported impacts of the drought in 2009 ..........................................................................28 Figure 2: Responses to the drought in 2009 .................................................................................... 28 Figure 3: Relative contributions from different income sources........................................................ 30 Figure 4: Relative expenditure..........................................................................................................30 Figure 5: Changes in the contribution of income from livestock fattening Sheep n= 136................. 31 Figure 6: Changes in the contribution of income from livestock fattening Cattle n=82..................... 31 Figure 7: Utilization of Income from Fattening Sales........................................................................32 Figure 8: Value of current savings and loans by source...................................................................33 Figure 9: Saving and loan utilization.................................................................................................33 Figure 10: Changes in land holding 2009-2010................................................................................ 35 Figure 11: Changes in livestock Sheep (n=136)............................................................................... 36 Figure 12: Changes in livestock Cattle (n=82).................................................................................. 36 Figure 13: Summary of project versus non-project factors contributing to an increase in assets ....37 Figure 14: Changes in productive assets Sheep (n=136) ................................................................ 38 Figure 15: Changes in productive assets Cattle (n=82) ...................................................................38 Figure 16: Changes in household items Sheep (n=136) ..................................................................40 Figure 17: Changes in household items Cattle (n=82) .....................................................................40 Figure 18: Scoring of project versus non-project factors contributing to impact............................... 42

Longitudinal Impact Study of the PSNP Plus Program Baseline Assessment in Raya Azebo
4
Acronyms and Abbreviations AARC Alamata Agricultural Research Center Agric Inputs Agriculture/farming Inputs CARE Cooperative for Assistance and Relief Everywhere CBPP Contagious Bovine Plueropneumonia CRS Catholic Relief Services DECSI Dedebit Credit and Saving Institution DPPA Disaster Preparedness and Prevention Agency ETB Ethiopian Birr FGD Focus Group Discussion GFDRE Government of the Federal Democratic Republic of Ethiopia HH Household HI Home Improvement IGA Income Generating Activities LIS Longitudinal Impact Study LIU Livelihoods Information Unit (DPPA) M&E Monitoring and Evaluation MDTCS Micro Development Training and Consultancy Services MFI Micro Finance Institute MoARD Ministry of Agriculture and Rural Development OFSP Other Food Security Programs PSNP Productive Safety Net Program PSNP-PIM PSNP Program Implementation Manual PSNP Plus Linking Poor Rural Households to Microfinance & Markets (Project) P.Trade Petty Trade Qty Quantity Radio/CP Radio/Cassette Player REST Relief Society of Tigray RFA Request for Applications RIC Rural Investment Climate RVRDP Raya Valley Rural Development Project SCUK Save the Children Fund (UK) SNV Netherlands Development Organization Social Oblig. Social Obligations SWOT (analysis) Strengths Weaknesses’ Opportunities Threats TARI Tigray Agricultural Research Institute Trad Traditional (beehives) USAID United States Agency for International Development VC Value Chain VSLA Village Savings and Loan Association

Longitudinal Impact Study of the PSNP Plus Program Baseline Assessment in Raya Azebo
5
Acknowledgements The PSNP Plus Project is being funded by the United States Agency for International Development (USAID). The authors would like to acknowledge the contributions of the other members of the research team, Girmay Mirutse, Tikabo Gebremariam, Hailay Mehari, Tesfaye Hagos and Abraham Haftu. We are also grateful to the Relief Society of Tigray (REST) offices in Mekele and Mohoni for supporting the assessment. In particular, we would like to thank Dr. Mulugeta Berhanu, Mr Zeratsion Fesseha, and Dawit Libanos in Mekele. Special thanks also goes to the REST team in Raya Azebo, we are especially grateful to Yishak Desta, Abeba Berhanu, Teklehaymanot Etsana and Kalayu Tesfakiros. We would like to thank staff members working for CARE Ethiopia, including Jay Banjade, Yetnayet Girma and Berhanu Alemu for supporting this study. We would also like to thank the woreda officials in Raya Azebo for their support, participation and hospitality. From the Feinstein Center at Tufts, many thanks to Anita Robbins, Elizabeth O’Leary, Rosa Pendenza, Ann O’Brien, Fasil Yemane, Haillu Legesse,and Hirut Demissie for providing administrative support. For the provision of technical support, we would like to thank Yoseph Shifferaw, Andy Catley, Berhanu Admassu and Yacob Aklilu. We acknowledge and would like to thank USAID for funding this research initiative. Disclaimer This report and the associated study were made possible by the generous support of the American people through the United States Agency for International Development (USAID). The contents are the responsibility of CARE and its BUY IN (PSNP PLUS) partners and do not necessarily reflect the views of USAID or the United States Government. The content of this report is derived from research carried out by the Feinstein International Center, Tufts University under the USAID funded PSNP Plus project. The contents of this report have not been endorsed by the other PSNP Plus partners, and do not necessarily reflect the views of these organizations.
Longitudinal Impact Study of the PSNP Plus Program Baseline Assessment in Raya Azebo
6
SUMMARY This report presents the findings of the first two stages of an assessment of the PSNP Plus project in Raya Azebo woreda in Tigray. These assessments are part of a broader longitudinal impact study of the PSNP Plus project, which aims to link poor rural households to microfinance and markets, as a strategy to assist people in accumulating assets, and graduating from the Government of Ethiopia’s Productive Safety Net Program (PSNP). The PSNP provides poor food insecure households with either food or cash in exchange for work, or direct support to people who are physically unable to work. PSNP participants are expected to graduate from the program within five years, and certain types of financial and productive assets are used as benchmarks for graduation. The PSNP Plus project started in the last quarter of 2008 and aims to link PSNP participants to both formal microfinance, and in the interim, or in the absence of this, to informal microfinance by establishing Village Savings and Loan Associations (VSLAs). The project also aims to link PSNP households to markets, through the development of different types of commodity value chains. In Raya Azebo the PSNP Plus project activities started in early 2009, and the project is supporting a cereal (teff) value chain, and two livestock value chains viz. cattle fattening, and sheep fattening. This study specifically focused on the two livestock value chains. At the time of the assessment in Raya Azebo, the projects informal microfinance component was limited to seven pilot VSLA groups. Although the assessment did collect some information from VSLA participants, this was limited to focus group discussions with members from six of these groups. The assessment was carried out roughly one year after the projects value chain activities had started in Raya Azebo. A household component was also included in the assessment, which comprised of a representative sample from both livestock value chains, and a control group sample. The assessment described in this report had two key objectives: 1. To collect a retrospective baseline on specific types of household assets 2. To carry out a midterm assessment of the project, this included:
• Measuring changes against the assessed baseline • Assessing changes in income • Investigating the utilization of project derived income • Attributing any assessed changes to project and non-project factors
The findings from the assessment suggest that the PSNP plus value chains in Raya Azebo have been well designed and well implemented, and could in principle address some of the key constraints to livestock production and marketing in the study area. Nonetheless, a drought in 2008-2009 has undoubtedly had a negative impact on the income, assets and food security status of project participants. The assessment findings show that the drought resulted in a loss of food and income, and a reduction in livestock assets for both project and non-project participants alike. However, the results suggest that the project may have helped participants better maintain their livestock assets in comparison to non-project participants. The results also indicate that the project is starting to have some positive impact on assets, and hopefully this trend will continue given more favorable conditions in 2009-2010. For example, participants in the projects small ruminant (sheep) value chain experienced a significant increase in

Longitudinal Impact Study of the PSNP Plus Program Baseline Assessment in Raya Azebo
7
sheep holdings since the project started, in comparison to non-project participants who experienced no significant change in sheep holdings. Although this may be partly attributed to direct project sheep transfers, participants from both value chains largely attributed an increase in specific livestock assets to livestock purchases derived from the sale of project animals, as opposed to actual project transfers. This is supported by the fact that the results also show that most of the income earned from the sale of project livestock was reinvested in livestock assets. Although the findings indicate that most project participants have not experienced an overall increase in assets since the project started, where there was an increase in a specific productive asset, participants also partly attributed this to project derived income. The results also show that there was a significantly greater probability of project participants experiencing an overall increase in assets in comparison to non-project participants. For example, from the entire sample of households that experienced an overall increase in assets, eighty four percent of these were involved in the projects value chains. The project has also had a positive impact on income and livelihoods. For example, the livestock value chains have been instrumental in providing some participants with a new source of income, and in increasing the mean contribution of household income from fattening for the majority of households, by between eight to ten percent. Arguably, this has increased people’s resiliency by reducing their dependency on other sources of income such as rain-fed crop production. Some project participants have also experienced an actual increase in income from the sale of fattened animals. The results show that the mean income from the sale of project animals was 884 birr for sheep value chain participants, and 1,786 birr for cattle value chain participants. As mentioned, most of this income was reinvested in livestock assets, however a fairly sizeable portion was also spent on food, and this is likely to have had some impact on household food security. To a lesser extent, project derived income was also spent on other livelihoods investments such as health and education. The results indicate that there was fairly low livestock mortality for project animals, even though the variety and prevalence of livestock disease in the area is high. Although inconclusive, this may suggest that the projects training activities, which included topics such as animal health and improved feed management, may have translated into improved animal health, and helped project participants maintain their livestock holdings comparatively better than they might have done prior to the project. Seeing as the assessment took place roughly half way through the project cycle, these findings should be considered as preliminary. However, they do indicate that well designed and well-implemented value chain activities, in concert with specific types of credit, can translate into a fairly immediate impact on household income for the poor. Where this income is being reinvested in assets such as livestock, as is being done in Raya Azebo, over time, if no major shocks occur, it could be expected that this would lead to the kind of asset accumulation required to graduate households from the safety net program.

Longitudinal Impact Study of the PSNP Plus Program Baseline Assessment in Raya Azebo
8
1. INTRODUCTION
1.1 PSNP Plus Project Background
Although responses to food insecurity in Ethiopia have typically been dominated by emergency food assistance, over the past two decades, ‘and in spite of a steady increase in humanitarian food aid, recurrent shocks and structural food insecurity have resulted in an ever increasing number of chronically food-insecure Ethiopians’ (Devereux et al, 2006). This has largely been attributed to the fact that humanitarian food aid has had little impact on poverty, asset depletion, and the resulting vulnerability to food related shocks (Devereux, et al, 2006). In recognition of this, and with the objective of addressing the underlying causes of vulnerability to food insecurity, in 2005 the Government of Ethiopia launched its PSNP, as one component of a broader food security strategy including a Voluntary Resettlement Program and Other Food Security Programs (OFSP).
The PSNP was designed to assist chronically or ‘predictably’ food insecure households as opposed to households affected by transitory food deficits as a result of a specific event. The program provides either cash or food in exchange for labor on rural infrastructure projects, or direct cash and food transfers for households unable to participate in physical labor. The primary objective of the PSNP is to prevent chronically food insecure households from selling their assets during times of drought, and by building community assets through involving these households in public works programs (Pankhurst, 2009). Ultimately participating households are expected to ‘graduate’ from the PSNP and out of chronic food insecurity. However, the concept of graduation is fairly nuanced and graduation remains one of the key technical and policy issues associated with the PSNP.
For example, the PSNP Program Implementation Manual (PSNP-PIM) recognizes that in order for households to graduate from the program (or out of food insecurity), there is a need for them to be linked to OFSP that go beyond the PSNP food and cash safety net transfers (MoARD, 2006). The OFSP include interventions that provide credit and loans for agriculture as well as non-farm income generating activities, and the provision of ‘agricultural technologies’ such as extension services, and inputs (Gilligan et al, 2008). While the overall goal of the PSNP is to address food insecurity through household asset protection and community asset creation, the OFSP are designed to increase participant’s income from agricultural production, and build up household assets (Gilligan et al, 2008).
Participating households are expected to graduate from the PSNP within five years and thresholds for graduation are based on household asset levels. Although a number of different definitions for graduation have been proposed, most of these involve the concept of households moving out of chronic food insecurity (for example see, PSNP-PIM, 2006, Slater et al, 2006, and Devereux et al, 2006). Essentially graduation involves a two-stage process: the first stage is graduation from the PSNP program, and the second stage involves graduation from the OFSP. A recent PSNP graduation guidance note defines graduation as follows (MoARD, 2007: 2): “A household has graduated when, in the absence of receiving PSNP transfers, it can meet its food
needs for all 12 months and is able to withstand modest shocks. This state is described as being food sufficient”.
As such, households that have graduated from the PSNP are no longer considered to be food insecure, and they are therefore no longer entitled to PSNP food or cash transfers (MoARD, 2007).
Annual assessments to determine PSNP graduation are carried out by a Community Food Security Task Force using broadly defined regional benchmarks based on household assets, such as education levels, land, livestock and tool holdings. However, flexibility in assessing graduation based

Longitudinal Impact Study of the PSNP Plus Program Baseline Assessment in Raya Azebo
9
on these asset portfolios may be applied to different livelihood zones within a region (MoARD, 2007). Essentially, households with asset levels higher than the established benchmarks are expected to graduate from the PSNP, although some households may chose to self-graduate on a voluntary basis (MoARD, 2007).
The use of assets as a benchmark for graduation is then partly based on the consideration that these are a more reliable indicator of long-term food insecurity, and partly in recognition of the fact that these are easier to observe and therefore measure than income based indicators (MoARD, 2007).
Nonetheless this rationale is supported by a growing body of evidence that suggests the poor prioritize assets over income (Narayan et al, 1999) and recent research that focuses on identifying the existence of an asset-based equivalent of a poverty line, or an asset (or Micawber) threshold (Carter and Barrett, 2007). People falling below such a threshold are essentially caught in a poverty trap (chronic poverty), whereas those above the threshold can “productively invest and accumulate” and even recover in the event of a livelihoods shock (Carter and Barrett, 2007 cited by Carter et al, 2008: 126).
Although it was originally anticipated that PSNP households would graduate from the program within five years, a recent evaluation of the PSNP and OFSP, while suggesting that the PSNP has had a significant impact on food security, proposes that the combination of PSNP plus OFSP does not guarantee household graduation (Slater et al, 2006). The same report argues that for certain PSNP households to accumulate assets: “they require access to a wider range of package options to support diversification into new agricultural activities – especially high value crop production and irrigated agriculture” (Slater et al, 2006: VII). Similarly the report identifies access to investment capital and savings as an important enabling factor in facilitating graduation (Slater et al, 2006).
Consistent with this, one of the two pillars of the World Bank’s poverty reduction strategy focuses on the Rural Investment Climate (RIC), and recent pilot studies identify markets and financing as significant constraints to promoting a healthy RIC (World Bank, 2006).
In view of these considerations, and in support of a continuation of the Government of Ethiopia’s Food Security Program, and building on the achievements and lessons learned from the PSNP, and other initiatives including the Market-Led Livelihoods for Vulnerable Populations project, in March 2008, USAID launched a Request for Applications (RFA) entitled linking poor rural households to microfinance and markets in Ethiopia.
1.2 Linking Poor Rural Households to Microfinance and Markets in Ethiopia.
The RFA recognized that without the additional OFSP packages such as microfinance and complementary market development interventions, PSNP households were unlikely to move out of poverty (USAID, 2008). Although the PSNP was established with the view that OFSP interventions would complement the program, evaluations of the PSNP highlighted the limited uptake of microfinance or credit amongst PSNP households (USAID, 2008). The RFA was therefore launched with the objective of demonstrating that the “adoption of market –led livelihood options for the persistently poor through sustainable links to markets and microfinance services” results “in increased assets at the household level and therefore more resilient households (USAID, 2008: 18). The RFA also suggests that the value chain approach be considered as an appropriate methodology for linking poor households to markets.

Longitudinal Impact Study of the PSNP Plus Program Baseline Assessment in Raya Azebo
10
More specifically, the RFA called for projects that would contribute to the following higher goals (USAID, 2008: 18-19): • Reduced food insecurity and improved resiliency in vulnerable households • Increased rural economic growth opportunities for the poor to diversify livelihoods • Demonstrate a new market-driven approach to poverty reduction in Ethiopia • Expanded adoption and scaling up of market-driven approaches by new actors such as the
Government of the Federal Democratic Republic of Ethiopia (GFDRE) • Improved access to microfinance services through a graduated assistance program
The RFA also required that proposals demonstrate how project results, outcomes, and the ‘replicability’ and sustainability of interventions would be measured and documented. Consistent with this, the RFA called for a preliminary causal model presenting the logic of how the project would achieve the desired outputs, outcomes and impacts, and how these would be measured (USAID, 2008).
The PSNP Plus project proposal was designed by a consortium of partners led by CARE in response to this RFA. The PSNP Plus consortium was awarded the RFA grant of $ US 12,000,000 during the last quarter of 2008.
2 THE PSNP PLUS PROJECT
2.1 PSNP Plus Overview
Consistent with the objectives of the RFA, the PSNP Plus project was designed to facilitate the graduation of poor rural households from the PSNP through the provision of microfinance services and market-driven interventions aimed at building assets and diversifying livelihoods.
The project, which is being led by CARE, was launched towards the end of 2008, and is being implemented by CARE and Catholic Relief Services (CRS) and partners in Oromia, the Relief Society of Tigray (REST) in Tigray, and Save the Children UK (SCUK) in Amhara. The project will be implemented in ten woredas across the three regions1.
The project specifically intends to target households that are currently enrolled in the PSNP, with the objective of graduating these households from the program. The project aims to provide a variety of microfinance products to participants, through interventions such as Village Savings and Loan Associations (VSLA), and through direct linkages with formal microfinance institutions. The project also aims to link households to markets through livestock, cereal, honey and white pea bean value chain interventions. Technical support for the value chain development activities is being provided by SNV2, while the Feinstein International Center, Tufts University is conducting a Longitudinal Impact Study (LIS) of the project in selected areas. The project will run until the middle of 2011, and is expected to assist a total of 42,414 participating households.
1 Originally it was nine woredas, however Sire/Dodota woreda has since been split into two separate woredas 2 Netherlands Development Organization

Longitudinal Impact Study of the PSNP Plus Program Baseline Assessment in Raya Azebo
11
Under the original proposal, the goals and the objectives of the project were stated as follows1:
The goal of the PSNP Plus program is: “Targeted PSNP households’ resiliency improved and livelihood assetsi enhanced as a means towards achieving graduation.” This goal is met through three interlinked objectives:
• Objective 1: Targeted PSNP households have increased their financial assets as a result of access to financial products and services.
• Objective 2: Targeted PSNP households are engaged in functioning markets. • Objective 3: Government and private sector strategies show greater support for engaging
PSNP participants in market-based activities.
The objectives have been structured to bring immediate, positive impact to participants while building upon lessons learned (PSNP Plus, 2008).
As discussed, the RFA called for a preliminary causal model. The causal model proposed under the PSNP Plus assumes that as part of the OFSP, improved linkages between poor households and commodity markets, plus enhanced use of microfinance services leads to asset accumulation at household level with associated improvements in PSNP graduation. Essentially, this causal model seeks to validate the assumption that the activities and strategies implemented under Objectives 1 and 2 do indeed result in asset accumulation and more resilient households.
2.2 Study Overview
In order to test this causal model the LIS was included under the original objective number three. The LIS, which is being implemented by Tufts University, was originally to be carried out in four of the ten project woredas; Doba, Sire, Dodota and Raya Azebo woredas in Oromia and Tigray respectively. It was originally proposed that the LIS would focus on one value chain in each of the study areas. The study areas were selected to capture different socio economic and livelihood zones. However practical and budgetary considerations were also taken into account. Since the assessment took place in Raya Azebo, an additional study area, Sekota in Amhara region has been included in the LIS. The overall objective of the LIS is to generate evidence on how combinations of microfinance and market oriented interventions leads to asset accumulation at the household level, with associated improvements in PSNP graduation. This evidence will be used to influence and inform the Government of Ethiopia and other stakeholders on their strategies pertaining to the design of food security and safety net programs around microfinance and market based interventions. With this objective in mind, the study will specifically involve measuring the impact of the projects micro-finance and value chain activities on the livelihood assets of the project participants, these being proxy indicators for both resiliency and PSNP graduation.
1 Following the start up of the project, a supplemental water, sanitation and health (WASH) component was included and the geographical scope of the project was expanded. The objective of the WASH component is to improve the health and productivity of the targeted participants through improved access to water. However, the research activities outlined in this report focus on the three objectives stated above.

Longitudinal Impact Study of the PSNP Plus Program Baseline Assessment in Raya Azebo
12
In summary, the original design of the LIS was as follows:
• Baseline assessment focusing on household assets
• After six months, to document project implementation, re-measure household assets, and conduct a preliminary assessment of project attribution
• Final assessment, using panel data collection to complete documentation of project implementation,
re-measure household assets, and finalize assessment of project attribution
However, due to delays in implementation and the seasonality of production from the projects value chains, it was decided to substitute the second round of assessments for an additional impact assessment in Sekota.
This report covers the first component of the LIS in Raya Azebo and includes a baseline and mid term assessment of the project.
2.3 Overview of PSNP Plus Project Approach in Raya Azebo
2.3.1 Study Area General Characteristics
Raya Azebo is one of 36 woreda’s in Tigray, with an estimated population of 105, 298 people (DPPA, 2007). Raya Azebo shares a border with Afar region to the east, and Amhara region to the south. The woreda is situated in the ‘Raya Valley Sorghum and Teff’ Livelihood zone, characterized by undulating mountains, plains and rugged terrain (DPPA, 2007). An estimated 88% of the woreda’s population lives in rural areas (SNV, 2010). As such, agricultural production is the main livelihoods activity, and involves a mixture of food and cash crop production (DPPA, 2007). Although annual rainfall is moderate, ranging from 450-600 mm, the availability of sufficient farmland and fertile clay/loam soils makes the area well suited to crop production (DPPA, 2007:4). The main crops grown are maize, sorghum and teff, and draft animals are extensively utilized for land preparation (DPPA, 2007). Agricultural production is dependent on the Belg and Kiremti rains, and although a crop surplus can be expected when there is good rain, production is often affected by unreliable or erratic rainfall, as well as a variety of crop pests (DPPA, 2007). Livestock production and trading are also important livelihoods and economic activities in the area. This includes rearing of both cattle and small ruminants. There is also a healthy livestock trade in the area, and markets in the woreda such as Kukufto, receive a considerable amount of livestock traffic, including camels in transit from Afar to Sudan. Other economic activities include petty trading and agriculture labor (DPPA, 2007).
2.3.2 Microfinance Linkage Component
Under the microfinance component, the project aims to improve participant’s access to financial products and services, by linking participants to formal microfinance institutions (MFI), and in the interim or absence of these, to provide informal microfinance services through the Village Saving and Loan Association (VSLA) approach. For example in Raya, the project will provide credit through MFI’s for value chain commodities such as sheep and cattle and other inputs. Over the course of the project it is anticipated that participants will also be linked to other financial services such as credit and loan facilities. The main MFI in Raya Azebo is Dedebit Credit and Saving Institution (DECSI), with two offices in the woreda. DECSI was established in response to the work done by REST in providing credit services to the poor, and since it was officially

Longitudinal Impact Study of the PSNP Plus Program Baseline Assessment in Raya Azebo
13
registered in 1997, much of DECSI’s work has continued to focus on the provision of credit services for the poor in the rural areas of Tigray. Although the PSNP Plus project recognizes the challenges of providing financial services to the poor, DECSI’s experience and success provides a promising example of what can be achieved in the Ethiopian context (see Borchgrevink et al, 2003 and Borchgrevink et al, 2005). In Raya Azebo, the project aims to provide informal credit and saving facilities for 300 participants based on the VSLA approach. However, given the capacity and outreach of DECSI in comparison to other MFI’s in the country, particularly in reaching the poor, this component of the project was included as a pilot exercise in Raya; with the objective of testing the relative advantages, if any, of the VSLA approach in a context where formal microfinance is available and evidently well tailored to the poor.
2.3.3 Village Savings and Loan Associations
The challenges involved in providing microfinance for the poor are well documented. These partly relate to low demand, particularly in areas where potential clients are unfamiliar and suspicious of the microfinance products being introduced (Mosely, 2003). There are also challenges relating to the cost of providing financial services to the poor, given that transaction costs are high in comparison to the returns that can be expected from poor clients. Essentially MFI’s have to be financially viable, and there is little incentive for them to invest in the poor. As one commentator points out, financial sustainability remains one of the biggest challenges facing micro-insurance and microfinance providers in general, particularly when they try to balance this with their social mission of helping the poor (Greeley, 2003). As such, most MFI’s are reluctant to take on the risk of providing or scaling up financial services for the poor at scale. Largely in response to these challenges, CARE and other NGO’s have been promoting the VSLA model as a community managed approach to microfinance provision for the poor in rural African settings. The approach, which is loosely based on traditional saving and lending mechanisms, requires little external investment, and seeing as VSLA groups can meet anywhere, they can provide accessible financial services for rural communities.
The VSLA approach typically involves a group of between 10-25 members. The PSNP Plus project aims to provide training and resources to these groups to enable them to manage, maintain and increase their own financial assets such as savings and loans. Under the VSLA approach, members should use their own cash resources to lend funds to one another, charge an acceptable interest rate, and re-lend funds on a rotating basis. Although the approach is flexible and can be applied in different ways, under the PSNP Plus project, other features of the VSLA approach are as follows:
• These groups typically meet twice a month, and each member will contribute a specified amount of money to a savings pool, and a smaller amount to a social fund. After a certain amount of capital has accumulated in the savings fund, members can take out loans, which they are obliged to repay with interest within a certain time period. Group members will collectively agree upon the contribution amounts, interest rates and repayment periods. However, the approach is meant to be flexible and in principle, individuals can contribute whatever amount they can afford. In such cases, the amount they can borrow is proportional to their accumulated savings.
• Group members will also collectively decide which members can borrow during a given loan
disbursement cycle. In order to borrow, a member will present a proposal to the group, outlining what
Longitudinal Impact Study of the PSNP Plus Program Baseline Assessment in Raya Azebo
14
they intend to use the loan for, and how they will be able to repay it. For example, members might use the loan to invest in petty trading or other income generating activities. In principle, members will select the person with the most convincing proposal. However it is also not uncommon for loans to be given to the person who appears to need it most, for example to cover medical expenses, as long as the members are confident that the person can repay the loan. Penalties are imposed on members who fail to repay their loans within the specified time period, which is usually between 1-3 months.
• In some cases, a group may also decide not to disburse loans on an individual basis, but to collectively
invest their savings in a group business venture and then share the profits.
• After a certain period, usually between 9-12 months, the group will share the savings and any interest accrued with all the members. As such VSLA members can earn dividends on their savings whether they borrow from their group fund or not.
• The social fund is typically meant to provide group members with insurance against idiosyncratic shocks
such as illness, although it can be utilized in other ways. No interest is applied to social fund disbursements, and again group members will collectively decide on who gets this support. However, seeing as the social fund is smaller than the savings fund, as discussed, in certain cases members may be allowed to borrow from the savings fund to pay for medical expenses or other contingencies. For some groups, they may decide to use the social fund for other activities that the group as a whole might benefit from.
• Each group selects a chairperson and a treasurer. A secretary is also selected to keep records on savings
and loan transactions. The savings are kept in a wooden or metal box, with two (or sometimes three) padlocks. The keys for these locks are given to different members, selected by the group based on their honesty and standing within the community. As, such the box cannot be opened by any individual group member, and would only be opened in the presence of the entire group during the bi-monthly meetings.
• In terms of inputs, the project pays community facilitators to provide support to the groups. The project also
provides training in the VSLA methodology to community agents or ‘animators’. Training in business development skills and adult literacy is also provided to selected VSLA members. Physical inputs include the savings boxes, padlocks, and a registration/savings book. In the absence of financial services for the poorest households, one of the key objectives of the VSLA activities is to provide saving and loan services for participating households. However, the project also aims to use these groups as a vehicle to link VSLA members to formal microfinance. By demonstrating that group members’ financial literacy and knowledge on savings increases over time, the project aims to convince MFI’s to accept groups and individuals as clients. As such, the VSLA groups are intended as a catalyst to provide the linkage between informal and formal microfinance (MDTCS, 2010).
2.3.4 Market Linkage Component Under the market linkage component, REST is supporting three commodity value chains in Raya Azebo. This includes two livestock fattening value chains, cattle fattening and small ruminant fattening, and a cereal (teff) value chain. According to the original proposal, the project aims to support 2,014 households under the two livestock fattening chains, and 3,000 households under the cereal value chain (PSNP Plus, 2008). The project aims to assist PSNP Plus participants in the production and marketing of these commodities. On the supply side the objective of these interventions is not only to increase production, but also to improve the quality of these products with a view to adding to their market value. On the production side the project will

Longitudinal Impact Study of the PSNP Plus Program Baseline Assessment in Raya Azebo
15
provide technical support including training, as well as specific inputs such as improved seeds and animal feed. The training components and transfer of inputs will be facilitated through producer or marketing associations to be established by the project. The production side will also be complemented by the microfinance component, with production inputs such as sheep and cattle for the fattening value chains supplied to project participants on a credit basis. As mentioned, this report focuses on the livestock fattening value chains being implemented in Raya Azebo. Ethiopia is the largest livestock producer in Africa (Aklilu, 2008), and smallholder farmers in rural areas such as Raya Azebo own the majority of these livestock holdings (SNV, 2010). In the Ethiopian highlands, people will invest in livestock as a buffer, or insurance against food and income shocks (SNV, 2010). As such, when people sell their livestock, it is typically during drought periods, when livestock prices are low, due to oversupply and the poor condition of animals. Nonetheless, the sale of livestock and livestock products provides an important source of income for rural households. For example, data generated by the LIU indicates that the sale of livestock and livestock products in a “good year” contributes an estimated 25-30% of household income for the poorest wealth categories and between 50-60 % for better-off households in Raya Azebo (DPPA, 2007). In Raya Azebo, the potential for expanding livestock marketing has been assessed, and favorable policies and agro-ecology, good livestock breeds (Raya, Harmo and Adel) and a high local demand for meat exist (SNV, 2010). However, the shortage of feed, water and quality pasture, along with poor animal livestock management practices, the lack of experience in fattening, and livestock disease have been identified as the major constraints to livestock marketing in the area (REST, 1997; TARI/AARC 2010; SNV, 2010). The shortage of quality feed has been ranked as the number one constraint to livestock production and marketing in the area (TARI/AARC, 2010). Consistent with this, another study suggests that the livestock population in the Raya Valley, exceeds its carrying capacity, in that pasture is poor due to overgrazing, and that the valley experiences an estimated net livestock feed shortage of four and a half months each year (REST, 1997). This results in poor livestock condition translating into low demand or low prices for livestock (REST, 1997). In all likelihood, the availability of pasture and the quality of pasture will decrease over time as a result of an expansion of agriculture and continued overgrazing. If so, an increase in the off-take of livestock through increased sales is indeed desirable.
A number of assessments have suggested that poor markets and market facilities represent an additional constraint to livestock production and marketing (REST, 1997; TARI/AARC, 2010). However, this may no longer be as much of a constraint as originally assessed. Firstly, an extensive network of livestock markets exists in the area, and these appear to be functioning rather well. Furthermore, a small ruminant value chain study indicates that nearby towns such as Alamata could potentially serve as valuable markets for fattened animals (SNV, 2010). Indeed, recent road construction, and the expansion and upgrading of the existing road networks in the Raya Valley, including a new road from Alamata to Mehoni, has undoubtedly created new livestock marketing opportunities in the area. According to key informants, there appears to be little or no preference for markets with better infrastructure. For example, Mehoni market is fenced and is considered by key informants to be better managed than Kukufto market. Kukufto on the other hand is more of an informal open-air market but it is apparently no less popular than Mehoni. According to sources, in recent years camel traders actually shifted their business to Kukufto as the taxes in Mehoni were considered high. However, at the time of the assessment, informants reported that there was little difference in taxes between Mehoni and Kukufto. If accurate this is unlikely to explain any preference for Kukufto market. Similarly the existence of weighing scales may not be a priority in determining market preference, as livestock are generally traded by visual judgments. Prices are usually fixed by individual bargaining, which takes into account the body condition, body conformation, age, sex and color of the animal. As
Longitudinal Impact Study of the PSNP Plus Program Baseline Assessment in Raya Azebo
16
such, little consideration is given to weight when purchasing livestock. Prices depend mainly on supply and demand, which is heavily influenced by the season of the year and the occurrence of religious and cultural festivals1. Although, the lack of physical market infrastructure is often cited as a constraint to livestock marketing, there appears to be a lack of assessments on the impact of new livestock markets in the highland areas of Ethiopia. Although relating to pastoral areas, some commentators caution that there has been a ‘fixation’ with developing market infrastructure amongst donors and policy makers (Aklilu and Catley, 2009). However, there is a growing body of research that shows there is little, if any evidence of positive impact on poverty from the large-scale investments in livestock markets since the 1970’s (Aklilu and Catley, 2009). A recent livestock markets impact assessment from Ethiopia revealed that where new market facilities had been developed, less than a third of these were being utilized; the report went on to note that from forty years of experience in different countries, ‘simple bush markets’ work well’ and can best be supported by improvements in roads and communications, specifically mobile phone networks (Bekele and Aklilu, 2008). Similarly, in Raya Azebo the existing markets appear to be functioning quite well, and recent road developments and some expansion in mobile phone coverage have and will continue to link farmers in the woreda to markets and market information. Arguably, the existing market network (with or without modern facilities) represents more of an opportunity than a constraint to livestock marketing.
The PSNP Plus value chains are designed to take advantage of the production and marketing opportunities, and to address the constraints to livestock production and marketing discussed. This will be done by focusing on quality production and sales, as opposed to “quantity oriented livestock management” the latter being described as a key constraint in one of the studies mentioned (REST, 1997: vi). In doing so the project aims to increase the income derived from livestock sales for project participants, and to diversify people’s income and reduce their dependency on crop production and sales (SNV, 2010). In terms of implementation, participants will be provided with loans to purchase an ox (cattle value chain) or three to six small ruminants, thus linking the projects microfinance and value chain components (SNV, 2010). These loans will be provided by either the implementing partner, or an MFI, with the expectation that the loans will be repaid with interest once the livestock have been fattened and sold (SNV, 2010). The project will use a revolving fund mechanism, whereby once the loans have been repaid; the funds are then lent to other households (SNV, 2010). The project will also provide training in “fattening, provision of feed, veterinary services, business skills training, and linking farmers to markets” (SNV, 2010: 6). Participants from the cattle fattening value chain were also loaned 400 birr to be used for supplementary feed.
The selection of project areas in the woreda was selected based on having prior experience in fattening, availability of irrigation and forage, and above average market access (SNV, 2010). Amongst other factors, project participants were selected based on vulnerability criteria, willingness to participate, prior experience with fattening, and the amount of land they have to produce forage (SNV, 2010).
Table 1 gives a summary of the objectives and expected outputs of the value chain activities.
1 Annex II shows the maximum and minimum price of various livestock species and age classes recorded at the time of the assessment.

Longitudinal Impact Study of the PSNP Plus Program Baseline Assessment in Raya Azebo
17
Table 1: Value chain outputs under PSNP Plus
Objectives Expected Outputs Critical bottlenecks for each value chain inhibiting PSNP household’s entry to value chain identified.
• Existing value chain assessments updated and new value chains validated.
Targeted PSNP households start production or improve productivity and quality of selected products.
• Targeted PSNP households have formed producer or marketing associations.
• Newly formed producer or marketing associations have access to production inputs.
• Targeted PSNP households received training or technical assistance on productivity and quality of production.
• Government, private sector, research institutions and others are providing targeted PSNP households with market extension services, post-harvest storage, assistance with handling and marketing.
• Women have the skills necessary to be successful entrepreneurs. • Private sector engaged in value chain activities and linkages based
on market demand created. • Private sector and producer/marketing associations engaged in
contracts, trader credit, warehouse receipt schemes and other contract farming.
Stakeholder forums and coordination groups help value chain actors and stakeholders resolve problems and meet shared goals.
• Coordination group and stakeholder forums established for value chain development.
Market information platforms provide targeted producers with the information necessary to negotiate fair prices, access to technical assistance and productive inputs.
• Market information platforms created.
Source: PSNP Plus Project Proposal (2008)
2.3.5 Implementation challenges The project has faced a number of challenges. The drought in 2008-2009 had a negative impact on income and asset accumulation for project participants. For the livestock value chain participants, the issue of feed shortage and poor animal health associated with drought limited the impact of the project during the first year of implementation. In response, a study was carried out to identify new drought resistant feed and fodder technologies (CARE, 2010). Secondly, the introduction of credit in Raya Azebo has been particularly challenging. Roughly 40% of the population in the woreda is Muslim, and local interpretation of Islamic law prohibits Muslims
Longitudinal Impact Study of the PSNP Plus Program Baseline Assessment in Raya Azebo
18
from engaging in money lending or interest earning activities (Getahun, 2010). Clearly this has had a number of implications on both the microfinance and value chain components that define the project. Seeing as one of the key obstacles appeared to be the use of the word ‘interest’, REST provided value chain assets in kind, with a view to charging recipients with a service charge once these animals were sold (Getahun, 2010). However, religious leaders did not accept the difference between ‘service charge’ and ‘interest’, and compelled project participants to either return the assets they received, or be subjected to various types of social exclusion (Getahun, 2010). In response to this challenge, REST has worked with the community, Muslim leaders and Islamic scholars to address this issue (Getahun, 2010). Drawing upon examples of Islamic banking systems elsewhere, a new approach (Murabaha) was agreed upon, whereby the interest or fee are considered as a service charge or commission, and lumped together with the loan amount from the outset (Getahun, 2010). At the time of the assessment, this new approach appeared to be working quite well although there were still some reluctance on the part of some community members. These challenges aside, project implementation from planning to the delivery of inputs, has been exceptionally fast in comparison to other PSNP Plus areas. For example, in the first year of the project, the project achieved 100% of its annual performance targets for the cattle value chain, 69% for the small ruminant value chain, and 93% for the cereal value chain (REST, 2009).
2.4 Research Questions
The overall objective of the study is to test the projects causal model, which proposes that: “Improved linkages between poor households and commodity markets, plus enhanced use of microfinance leads to asset accumulation at household level with associated improvements in PSNP graduation”. Based on this, the key research question for the study is:
Do combinations of Microfinance and Value Chain Activities enhance asset accumulation at the household level?
Under this key question, the following sub set of questions were investigated during the assessment in Raya Azebo:
• What land, livestock and productive assets did participants own before the project started? • What changes in these assets have occurred since the project started? • What factors contributed to any assessed change in these assets? • What was the relative contribution of project factors to any assessed change?
Other research questions included but were not limited to:
• How do communities and PSNP participants define relative wealth status, and what indicators do they associate with poverty and food insecurity, and conversely what indicators do they associate with food security and relative wealth?
The assessment also investigated sources of income and credit, relative expenditure, and the utilization (expenditure) of income derived from project activities and loans.

Longitudinal Impact Study of the PSNP Plus Program Baseline Assessment in Raya Azebo
19
3. ASSESSMENT METHODOLOGY
3.1 Study Approach Most definitions of impact in the humanitarian and development literature involve the concepts of change and attribution, and a project level impact assessment essentially tries to answer the following three questions (Watson, 2008):
1. What changes have occurred in the project area since the start of the project? 2. Which of these changes can be attributed to the project? 3. What difference have these changes made to the lives of the project participants?
With these three questions in mind, the overall goal of the Longitudinal Impact Assessment (LIS) is to measure changes in the physical and financial assets that are currently being used by the Government of Ethiopia as proxy benchmarks for PSNP graduation, such as land, livestock and tool holdings. The study also aims to assess changes in income and expenditure. For example, changes in income sources will capture livelihoods diversification, or an increase in the relative contribution of income from specific sources such as those being promoted by the project, namely honey, cereals, livestock and white pea beans. Changes in certain key expenditures will be used as a proxy for real income. These will also capture investments in livelihoods assets, such as land, livestock, education, etc, facilitated through project derived loans or indirect project income transfers. Positive changes in productive and financial assets will also capture household resiliency, these being proxy indicators for resiliency particularly in the event that no major shocks occur during the project timeframe. The study originally aimed to use a before and after panel survey approach across three points in time (baseline, midterm and final assessment). This approach was to be used to assess changes in the asset indicators against a baseline. Therefore, the same respondents, or representatives from the same households were to be interviewed during each assessment. However, due to a number of practical and technical delays outside of the control of the assessment team, the baseline assessments had to be rescheduled until after the start of the project. As such a retrospective baseline approach was adopted to assess pre-project asset levels in households participating in the projects micro-finance and value chain activities. Given the timing of the baseline assessment, it was therefore proposed that a baseline and first impact assessment be conducted concurrently. In Raya Azebo, this was done by measuring changes in assets against a retrospective baseline using methods described by Catley et al (2008). The actual assessment in Raya Azebo was carried out from April to May 2010. The final impact assessment will be carried out during the same period in 2011. The revised approach will still use the same respondents during the final assessment. The study in Raya Azebo focused on two of the projects livestock value chains viz. cattle and small ruminants. The assessment also collected some data on the VSLA component, but this was limited to focus group discussions.
3.2 Overview of Methods and Indicators The assessment had two main components, household interviews and focus group discussions. As implied, the household component used an individual household as the unit of analysis. This component was designed to collect mostly quantitative data using a conventional questionnaire

Longitudinal Impact Study of the PSNP Plus Program Baseline Assessment in Raya Azebo
20
format, and including a number of standardized participatory assessment methods. The focus group component was designed to collect mostly qualitative contextual data on the project activities, communities, and areas. However, the focus group discussions were structured around a set of standardized participatory assessment tools providing some numerical data. A number of key informant interviews were also carried out. These were used to collect secondary data on the project and study area.
3.3 Indicator Selection The choice of indicators was largely based on PSNP graduation benchmarks (land/tools/livestock). Although it should be noted that household items are not used as PSNP graduation benchmarks, these were included as they may represent important wealth indicators, and over time these may be useful in capturing project impact. The selected asset indicators were validated and refined during scoping visits to the project area. Indicators on sources of income and common household expenditures were also collected and refined during these earlier visits.
3.4 Sampling
3.4.1 Method and Size For the household component of the study, simple random sampling was used for the small ruminant value chain sample. Every registered participant was considered, and the latest project registration list was used as the sampling frame. Out of this sampling frame, a total of 150 households were randomly selected for the assessment. The same approach was used for the cattle value chain. However, seeing as only seven female participants were involved in the cattle value chain, these seven women were purposively selected, and 80 male participants were randomly selected for the assessment. The PSNP participant lists provided the sampling frame for the comparison (control) group sample, but excluding households involved in PSNP plus project activities. However, respondents were purposively selected based on their willingness and availability to participate in the study. Table 2 provides a summary of the planned and final sample for the assessment. Table 2: Sampling frame and actual sample
SheepValueChain CattleValueChainMale Female Total Male Female* Total
SamplingFrame 180 159 339 117 7 124PlannedSample NA 150 80 7 87ActualSample 79 57 136 77 5 82PercentageofSamplingFrame 40% 66%* Female participants from the Cattle value chain were purposively selected A total of 27 focus group discussions were carried out across the study area. These exercises included participants from both the projects livestock value chains and non-project PSNP participants. Participants from six of the existing VSLA groups also participated in some of these focus groups. Participation in these discussions was voluntary, however attendance by project participants had been requested in advance. There was also no overlap between participants selected for household interviews, and those involved in the focus groups. A number of key informant interviews were also carried out with project staff, woreda officials, and development

Longitudinal Impact Study of the PSNP Plus Program Baseline Assessment in Raya Azebo
21
agents. These interviews were used to collect background information, triangulate findings from household and focus groups exercises, and to fill in gaps.
3.4.2 Study Locations The assessment team visited all 8 tabia’s in Raya Azebo where the livestock value chains had been implemented at the time of the assessment. The team also visited an additional tabia (Mechare) where a VSLA group had been established under the project. Table 3 provides a summary of the geographical coverage of the assessment. Table 3: Summary of assessment coverage
Category(#ofHouseholds) AssessmentMethodNo
NameofTabia CattleVC SheepVC Total Household
InterviewFocusGroups
1 Genete 14 31 45 2 KaraAdishaho 15 33 48 3 WereAbaye 21 31 52 4 Kukufto 20 0 20 5 Bagai‐Delwo 12 0 12 6 Maru 0 7 7 7 BalaUlaga 0 27 27 8 Ebo 0 7 7 9 Mechare 0 0 0 ‐ TotalRespondents 82 136 218

Longitudinal Impact Study of the PSNP Plus Program Baseline Assessment in Raya Azebo
22
3.5 Data Collection Methods
3.5.1 Household Interviews The interviews for the household component were carried out by a team of five data collectors under the supervision of an assessment coordinator. The interviews were carried out on an individual basis using a standardized questionnaire that included a number of participatory exercises, and some qualitative data. For the comparison group sample, a similar questionnaire was used although this did not include specific project related questions. Each interview took between 30-40 minutes to complete, and each data collector would typically complete 4-5 interviews in a day. The household questionnaire was structured around the following themes/sections: Table 4: Summary of household questionnaire themes and methods Section/Theme TypesofInformationCollected(method) Sample1 Householdand
ProjectBackgroundInformation
• PSNPandPSNPPlusactivities&participation*• Householdage,laborcapacityandeducationlevels• Occurrence,typeandimpactofrecentshocks/events,andhousehold
responsetothese
N=348
2 SavingsandLoanInformation
• RecentHHsavingshistory• RecentHHborrowinghistoryandsourceofloans• UtilizationofHHsavingsandloans
N=348
3 AssetInventory • Pre‐project(2008)andcurrentlandholdings• Pre‐project(2008)andcurrentlivestockholdings• Reasons(positiveornegative)forchangesinassetholdings• Projectlivestocksales;type,number,derivedincome&utilization*• Pre‐project(2008)andcurrentproductiveassets(tools)andHHitems• ReasonsforchangesinproductiveassetsandHHitems
N=348
4 ReasonsforanoverallincreaseinAssets
• Identificationofreasons/factorscontributingtoanoverallincreaseinassets
• Scoringofcontributingfactors(proportionalpilingusing100counters)
N=55**
5 IncomeSources • Relativecontributionofdifferentincomesourcesfor2008‐2009(proportionalpilingusing100counters)
• Relativecontributionofincomefrom‘fattening’(‘beforeandafterscoringusing100counters)
• ReasonsforanyincreaseinHHincomesince2008(simpleranking)
N=348
6 Expenditure • Relativeexpenditure2008‐2009(proportionalpilingusing100counters)
N=348
* Some of the project specific questions were limited to PSNP Plus participants only (n=218) ** Only 55 households experienced a perceived increase in assets
The household questionnaire is appended as Annex I to this report
3.5.2 Focus Group Methods A mixture of qualitative, quantitative, and participatory data collection methods were used for the focus group component of the study. These discussions were primarily used to collect descriptive contextual information on the PSNP, the PSNP plus and more general information on the project area. The focus groups were structured around a checklist, which included a set of standardized participatory exercises.
Longitudinal Impact Study of the PSNP Plus Program Baseline Assessment in Raya Azebo
23
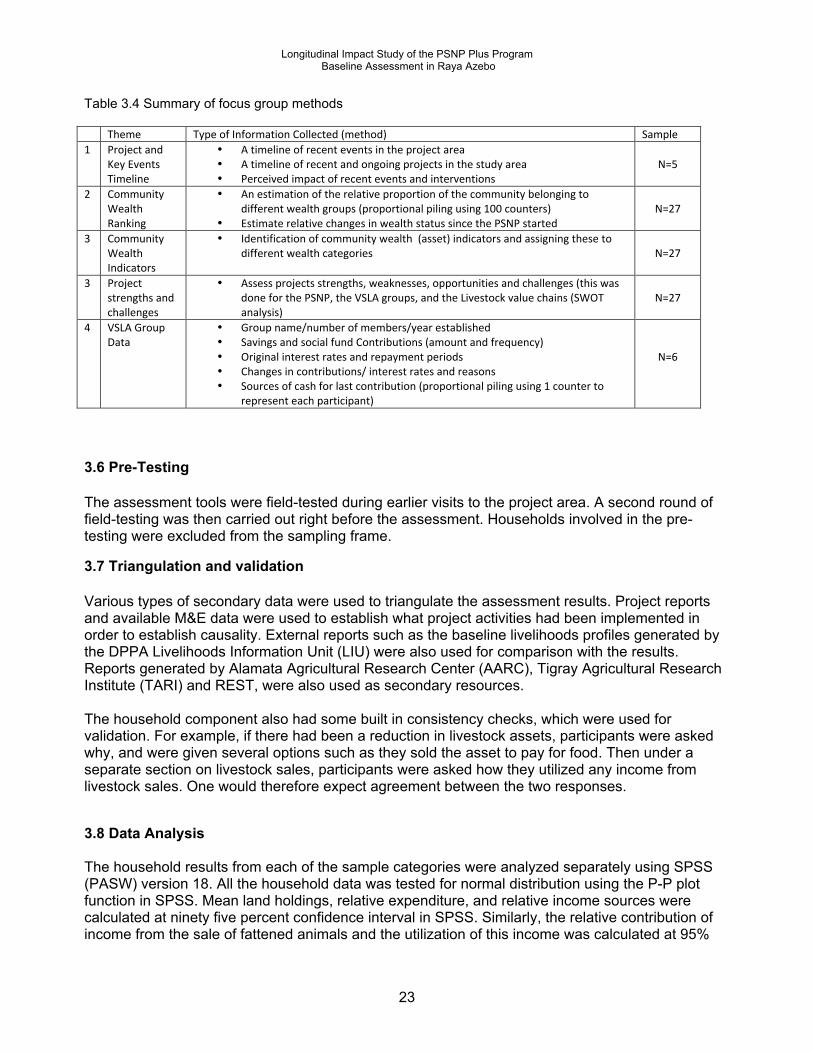
Table 3.4 Summary of focus group methods Theme TypeofInformationCollected(method) Sample1 Projectand
KeyEventsTimeline
• Atimelineofrecenteventsintheprojectarea• Atimelineofrecentandongoingprojectsinthestudyarea• Perceivedimpactofrecenteventsandinterventions
N=5
2 CommunityWealthRanking
• Anestimationoftherelativeproportionofthecommunitybelongingtodifferentwealthgroups(proportionalpilingusing100counters)
• EstimaterelativechangesinwealthstatussincethePSNPstarted
N=27
3 CommunityWealthIndicators
• Identificationofcommunitywealth(asset)indicatorsandassigningthesetodifferentwealthcategories
N=27
3 Projectstrengthsandchallenges
• Assessprojectsstrengths,weaknesses,opportunitiesandchallenges(thiswasdoneforthePSNP,theVSLAgroups,andtheLivestockvaluechains(SWOTanalysis)
N=27
4 VSLAGroupData
• Groupname/numberofmembers/yearestablished• SavingsandsocialfundContributions(amountandfrequency)• Originalinterestratesandrepaymentperiods• Changesincontributions/interestratesandreasons• Sourcesofcashforlastcontribution(proportionalpilingusing1counterto
representeachparticipant)
N=6
3.6 Pre-Testing The assessment tools were field-tested during earlier visits to the project area. A second round of field-testing was then carried out right before the assessment. Households involved in the pre-testing were excluded from the sampling frame.
3.7 Triangulation and validation Various types of secondary data were used to triangulate the assessment results. Project reports and available M&E data were used to establish what project activities had been implemented in order to establish causality. External reports such as the baseline livelihoods profiles generated by the DPPA Livelihoods Information Unit (LIU) were also used for comparison with the results. Reports generated by Alamata Agricultural Research Center (AARC), Tigray Agricultural Research Institute (TARI) and REST, were also used as secondary resources. The household component also had some built in consistency checks, which were used for validation. For example, if there had been a reduction in livestock assets, participants were asked why, and were given several options such as they sold the asset to pay for food. Then under a separate section on livestock sales, participants were asked how they utilized any income from livestock sales. One would therefore expect agreement between the two responses.
3.8 Data Analysis
The household results from each of the sample categories were analyzed separately using SPSS (PASW) version 18. All the household data was tested for normal distribution using the P-P plot function in SPSS. Mean land holdings, relative expenditure, and relative income sources were calculated at ninety five percent confidence interval in SPSS. Similarly, the relative contribution of income from the sale of fattened animals and the utilization of this income was calculated at 95%

Longitudinal Impact Study of the PSNP Plus Program Baseline Assessment in Raya Azebo
24
confidence interval in SPSS, as were the value of savings and loans by source and the utilization of these loans. For changes in assets, and comparisons between the intervention and treatment groups, a comparison of mean scores was calculated at ninety five percent confidence interval using SPSS. The impact of the drought and responses to the drought, as well as the reasons for changes in various types of assets were summarized in Microsoft excel. The probability scoring for an increase in overall assets for the treatment and intervention groups was calculated using the chi-square test in CIA software.

Longitudinal Impact Study of the PSNP Plus Program Baseline Assessment in Raya Azebo
25
4 RESULTS
4.1 Contextualizing PSNP Plus
Table 5: Project intervention timeline
Year Intervention Actor(s) Activities/Outcome PerceivedImpact2003‐10 Animaldiseasecontrol(+treatment) GFDRE Animalswerevaccinated Livestockmortalityreduced
2003‐10 FloodirrigationschemedevelopmentGFDRECommunity
Supplementaryirrigation/waterprovided Cropyieldincreasedinsomewatershedareas
2005‐10 PSNPFoodforWork&directsupportGFDREREST
Foodforwork Poorfamiliesaccessedfood
2005‐09 Erosioncontrol/treeplantation REST&GFDRELandterracing&rehabilitation;vegetationcoverageincreased
Soilerosioncontrolled,andhillsidesrehabilitated;marginallandbecamemoreproductive
2005‐10 Feederroadsconstruction GFDREREST FeederroadsbuiltAccesstobasicservices(likehealth,market)improved;facilitatesmarketlinkages
2005‐10 Enclosuredevelopment GFDRE&public Rehabilitationofcertainhills&grazingareasVegetationrecovered&landdegradation/soilerosionreduced
2005‐10Provisionofagriculturalinputsandtechnologies
GFDRE&AARC
Inputs&packagesdispatched Yieldincreasedingoodyears
2006‐10 Provisionofcashcredit DECSI Cashcreditavailabletoruralfarmers Livelihoodactivitiesdiversified
2006‐10 ProvisionofcropseedsGFDREREST&AARC1
Improvedteff,sorghumandmaizeseedsprovided
Cropyieldincreasedontemporarybasisinanormalyear2
2007‐10 Emergencyfoodsupply GFDRE&REST FoodaidprovidedFoodinsecurity,displacementandmigrationreduced
2008‐09 Provisionoffeedconcentrates&blocksGFDREREST,FAO
FeedsupplementsprovidedLivestockdeathsandmigrationminimized;assetsmaintainedorbuilt
2009‐10Provisionofcreditfundforsmallruminantfattening
GFDRE&REST
SheepandgoatsreceivedoncreditIncomefromsaleofsmallruminant‐forloanrecipients;interestgeneratedforloanproviders
2009‐10 Provisionofcashcreditfundforcattle GFDRE&RESTEachrecipienthouseholdreceivedananimal+400ETB
Incomeobtainedfromthesaleofanimalsandfarmersbuiltlivestockasset3;landcultivated
2009‐10CommunitybasedCreditandsavinginitiatives(VSLA)
RESTSavingcultureimproved;numberofparticipantsincreased,creditavailability
Insurance4;influenceotherstoengageinVSLA;livelihoodoptionscreated
2009 Dairycattledevelopmentinitiatives REST&GFDRE Bagaitbreedsdistributed ‐Theinitiativeisrecent
2009Waterponds(haroye)development–potablewater
GFDRE&REST
Potablewateravailable;wateravailabilityextendedtothedryseasons
Reductionofwaterbornedisease;timesavedonfetchingwater;improvedavailabilityofwaterforlivestock(somevillages)
2009‐10 VethealthpostsconstructedGFDRERVRRP5&public
Maintenanceofcrushetc
Thecompoundmaintainedtoprovideservice
2010 Microfinanceinsuranceduringrisk6 OxfamAmerica Toprovideinsurance ‐Recent
2010 Smallruminantcredit OxfamAmericaSmallruminantsprovidedtothewomeninHawilititabia
‐Recent
2010 Humanhealthpostsconstruction GFDRE&public Foundationofhealthpost Servicesnotyetavailable‐Noimpactsofar
2010 Schoolconstruction GFDRE&publicRenovationofelementaryschool;childrenaccessedschoolintheruralareas
‐Teachingandlearningprocessimproved‐Studentenrolmentincreased
1 Alamata Agricultural Research Center 2 Improved varieties performed better than local varieties during partial rain failures but little was harvested in 2009. 3 Recipients that used the credit for oxen were able to increase farm production 4 Informants appreciated easy access to credit for idiosyncratic shocks and for schooling costs 5 Raya Valley Rural Development Project 6 This activity only started during the study period
Longitudinal Impact Study of the PSNP Plus Program Baseline Assessment in Raya Azebo
26
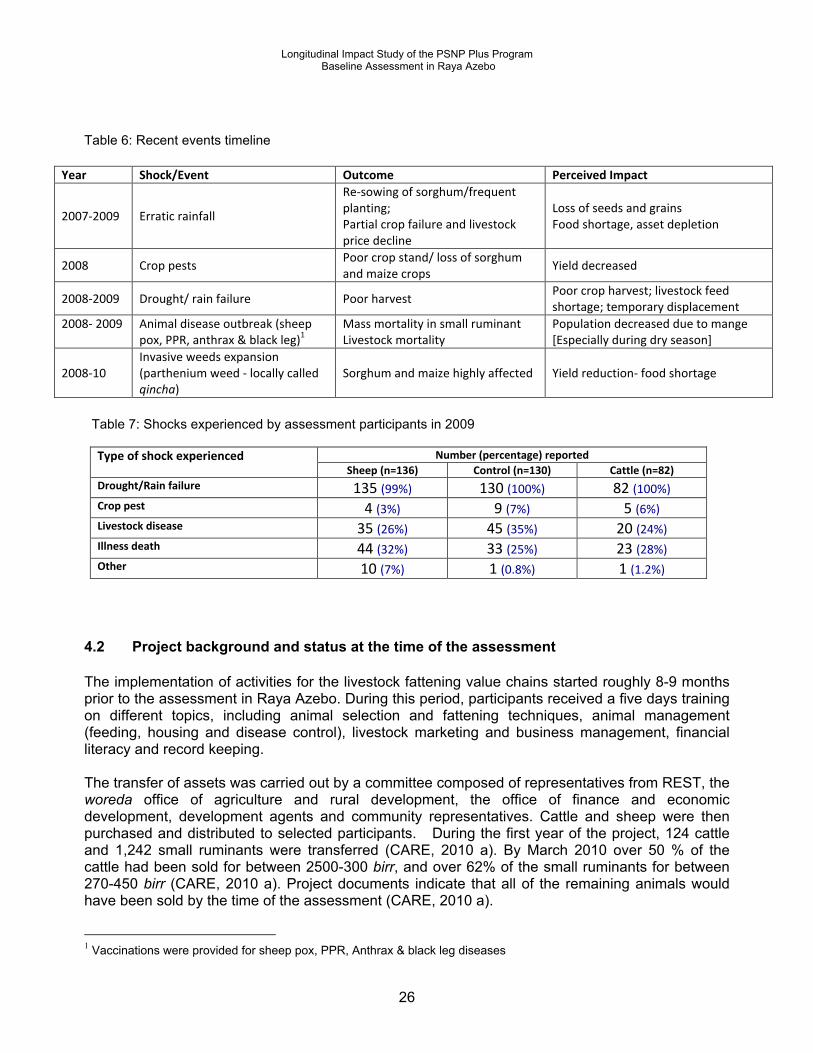
Table 6: Recent events timeline
Year Shock/Event Outcome PerceivedImpact
2007‐2009 Erraticrainfall
Re‐sowingofsorghum/frequentplanting;Partialcropfailureandlivestockpricedecline
LossofseedsandgrainsFoodshortage,assetdepletion
2008 CroppestsPoorcropstand/lossofsorghumandmaizecrops
Yielddecreased
2008‐2009 Drought/rainfailure PoorharvestPoorcropharvest;livestockfeedshortage;temporarydisplacement
2008‐2009
Animaldiseaseoutbreak(sheeppox,PPR,anthrax&blackleg)1
MassmortalityinsmallruminantLivestockmortality
Populationdecreasedduetomange[Especiallyduringdryseason]
2008‐10Invasiveweedsexpansion(partheniumweed‐locallycalled qincha)
Sorghumandmaizehighlyaffected Yieldreduction‐foodshortage
Table 7: Shocks experienced by assessment participants in 2009
Number(percentage)reportedTypeofshockexperiencedSheep(n=136) Control(n=130) Cattle(n=82)
Drought/Rainfailure 135(99%) 130(100%) 82(100%)Croppest 4(3%) 9(7%) 5(6%)Livestockdisease 35(26%) 45(35%) 20(24%)Illnessdeath 44(32%) 33(25%) 23(28%)Other 10(7%) 1(0.8%) 1(1.2%)
4.2 Project background and status at the time of the assessment The implementation of activities for the livestock fattening value chains started roughly 8-9 months prior to the assessment in Raya Azebo. During this period, participants received a five days training on different topics, including animal selection and fattening techniques, animal management (feeding, housing and disease control), livestock marketing and business management, financial literacy and record keeping. The transfer of assets was carried out by a committee composed of representatives from REST, the woreda office of agriculture and rural development, the office of finance and economic development, development agents and community representatives. Cattle and sheep were then purchased and distributed to selected participants. During the first year of the project, 124 cattle and 1,242 small ruminants were transferred (CARE, 2010 a). By March 2010 over 50 % of the cattle had been sold for between 2500-300 birr, and over 62% of the small ruminants for between 270-450 birr (CARE, 2010 a). Project documents indicate that all of the remaining animals would have been sold by the time of the assessment (CARE, 2010 a).
1 Vaccinations were provided for sheep pox, PPR, Anthrax & black leg diseases

Longitudinal Impact Study of the PSNP Plus Program Baseline Assessment in Raya Azebo
27
During the first year of the project, seven VSLA groups were established in Raya Azebo, six of these were located in Mechare tabia, and one in Hujera village of Were Baye tabia. At the time of the assessment, group membership ranged between 13-27 participants in the six groups assessed. Group members received training on the VSLA approach, financial literacy, record keeping, and income generating activities. Table 8: PSNP Plus asset transfers and dynamics
Mean Qty/Value (95% CI) Sheep (n=136) Cattle (n=82) ReceivedfromPSNP+ 4.2(4.1, 4.3) 1NumberDied 0.5(0.3, 0.6) 0.0NumberSold 3.0(2.8, 3.3) 0.8(0.7, 0.9)Incomefromfattening(ETB) 883.9(768.6, 999.2) 1786.1(1587.0, 1985.2)NumberofSheep/Cattleboughtwithprofitsfromfattening 1.1(0.8, 1.3) 0.9(0.8, 1.1) Table 9: Characteristics and Background Data on Assessment Participants Household (HH) Background and Project Participation Stats Sheep
(n=136) Control (n=130)
Cattle (n=82)
Total number currently involved in cattle value chain 0 NA 82 (100%) Total number currently involved in sheep value chain 136 (100%) NA 0 Total number currently involved in teff value chain 0 0 0 Total number currently involved in VSLA 0 0 0 Number of HHs, with iron sheet roofing 22 (16%) 12 (9%) 6 (7%) Highest level of education HH head (average grade) 1 1 1 Highest level of education other HH member (average grade) 4 4 4 Number of HH members (average) 5 5 6 Number of working adults (average) 2 2 2 Number of HH members working on PSNP (average) 2 2 2 Number of years participating in the PSNP (average) 4 4 4 Total number of households graduated from the PSNP 8 (6%) 0 1 (1.2%)

Longitudinal Impact Study of the PSNP Plus Program Baseline Assessment in Raya Azebo
28
4.3 Impact of the Drought in 2009 Figure 1: Reported impacts of the drought in 2009
Figure 2: Responses to the drought in 2009
0 50 100 150 200 250 300 350 400
Crop loss
Food shortage (human)
Income loss
Feed shortage (livestock)
Livestock mortality
Herd reduction
Labor shortage
School dropout
Other
Number of Responses
Sheep n=136 Control n=130 Cattle n=82
0 50 100 150 200 250 300 350 400
Engaged in PSNP
Sold livestock
Engaged in labor activities
Cactus feeding
Borrowed money
Trading/Petty trade
Sold/traded chat
Migrated in search of work
Sold Firewood
Purchased animal feed
Made/sold handicrafts
Other
Number of Responses
Sheep n=136
Control n=130
Cattle n=82

Longitudinal Impact Study of the PSNP Plus Program Baseline Assessment in Raya Azebo
29
4.4 Community Characteristics Table 10: Community wealth indicators (n=27 groups) WealthIndicator Better-Off Medium Poor PercentageofthePopulation 15% 25% 60% Oxen 4 2 0-1 Cows 5 3 0-1 Calves 2 1 0-1 Steers 2 1 0-1 Heifers 2 1 0-1 Small Ruminants 11 6 3 Donkeys 2 1 0-1 Camels 9 3 0 Chickens 3 2 4 Traditional beehive 2 1 0-1 Overall landholding (tsimad) 7 7 7 Cultivated land 7 7 6 Beds 1 1 0 Mattresses 1 1 0 Mats 1 1 0 Lanterns 1 1 1 Barrel 1 0 0 Radio/Cassette Player 1 1 0 Corrugated iron sheet house roofing (No of sheets) 34 16 1 Number of rooms in the house 1 1 0 Food Security from own production (months) 12 11 6 Food Security from other sources (months) 0 1 6 Critical food deficit (months) 0 0 5 Engaged in labor activities for income NO NO YES Engaged in labor for farming oxen NO NO YES Other specify (tends others animals) NO NO YES

Longitudinal Impact Study of the PSNP Plus Program Baseline Assessment in Raya Azebo
30
4.5 Income and Expenditure Figure 3: Relative contributions from different income sources
Figure 4: Relative expenditure

Longitudinal Impact Study of the PSNP Plus Program Baseline Assessment in Raya Azebo
31
4.5.1 Project Derived Income and Utilization Figure 5: Changes in the contribution of income from livestock fattening Sheep n= 136
Income from fattening Mean Score (95% CI) = 2.1 (1.1, 3.1)
Income from fattening Mean Score (95% CI) = 12.2 (9.3, 15.1)
Data derived from proportional piling using 100 counters Figure 6: Changes in the contribution of income from livestock fattening Cattle n=82
Income from fattening Mean Score (95% CI) = 3.6 (1.6, 5.6)
Income from fattening Mean Score (95% CI) = 12.2 (9.3, 15.1)
Data derived from proportional piling using 100 counters
2%
98%
Before
Fattening Other
12%
88%
After
Fattening Other
4%
96%
Before
Fattening Other
12%
88%
After
Fatttening Other

Longitudinal Impact Study of the PSNP Plus Program Baseline Assessment in Raya Azebo
32
Figure 7: Utilization of Income from Fattening Sales
Percentage of Total Expenditure Reinvested in Livestock Assets
Table 11: Utilization of income from fattening sales (disaggregated)
Disaggregated Expenditure Mean value ETB Expenditure Sheep n=136 Cattle n=82
Food 211.6 173.5 Medical 22.8 7.7 School 10.3 1.2 Land /Home Improvement 0 4.9 Livestock 306.9 1376.8 Trade 45.8 2.4 Farming Inputs 4.3 5.7 Social Obligations 1.8 0.2 Clothes 25.7 5.7 Other 37.6 17.1 Total Expenditure ETB Mean Value (95% CI) 667.1(583.1, 751.6) 1595.2 (1379.9, 1810.5)
32%
46%
22%
Sheep (n=136)
Food Livestock Other
11%
86%
3%
Cattle (n=82)
Food Livestock Other
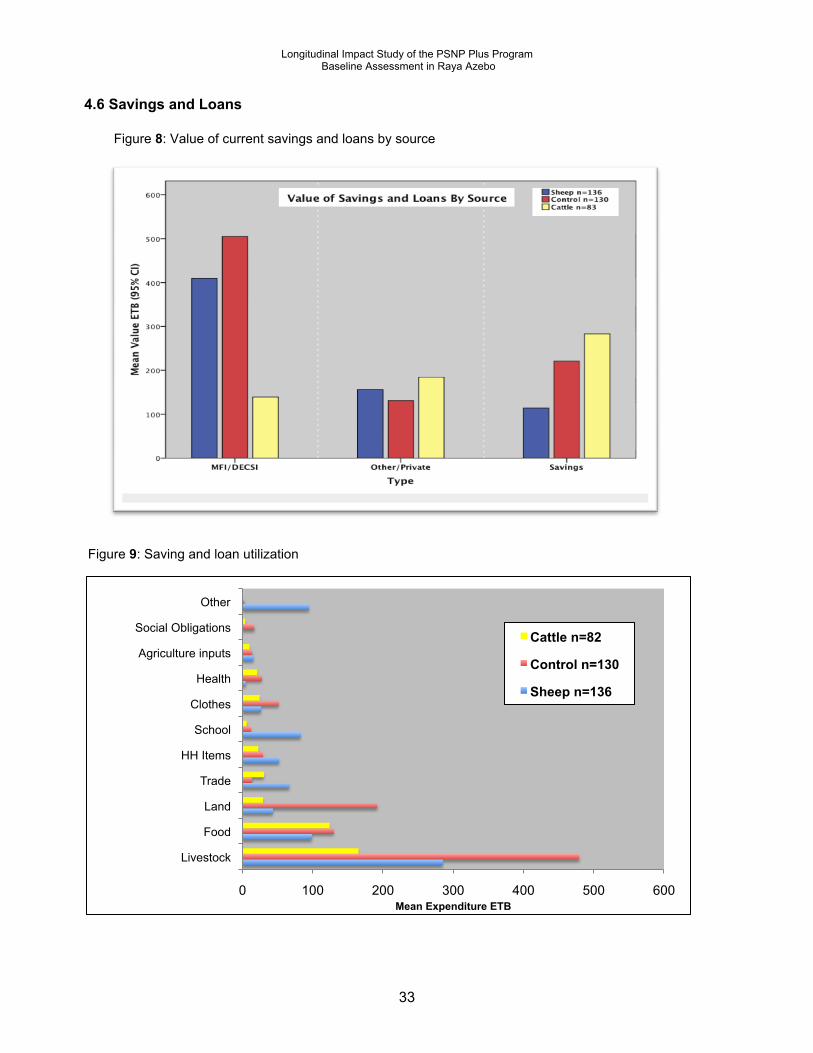
Longitudinal Impact Study of the PSNP Plus Program Baseline Assessment in Raya Azebo
33
4.6 Savings and Loans Figure 8: Value of current savings and loans by source
Figure 9: Saving and loan utilization
0 100 200 300 400 500 600
Livestock
Food
Land
Trade
HH Items
School
Clothes
Health
Agriculture inputs
Social Obligations
Other
Mean Expenditure ETB
Cattle n=82
Control n=130
Sheep n=136

Longitudinal Impact Study of the PSNP Plus Program Baseline Assessment in Raya Azebo
34
4.6.1 PSNP Plus Village Savings Groups Table 12: Village Saving Groups SWOT analysis (n=6)
Strengths• Providecreditatbetterinterestratesthanprivate
lenders(5‐10%asopposedto40%)• Poorhouseholdshaveaccesstogreatercapital(through
savingsandcredit)thantheywouldnormallyhave• Memberscanaccessloanswhenneeded(timely)topay
forhealthcare,medicineorfarminginputs• Creditcanbeusedtohelpmembersinvestinnew
livelihoodactivitiesanddiversifytheirincomesources• Improvedsavingculture
Weaknesses• Lowworkingcapital,andsmallloandisbursements
preventmembersfrominvestinginindividualbusinessactivities
• Lackofbusinessopportunitiesinthearea• Lackofbusinessskillstotakeadvantageofcredit• Religiousandsocioeconomicdifferencesbetween
memberscreatesconflictovermodalitiessuchascontributionsandinterestrates
Opportunities• Collective(group)investmentsmayprovidemembers
withnewincomeandlivelihoodoptions• Newroadsbeingbuiltintheworedawillbringnew
businessopportunitiestothearea(VSLAcreditwillallowmemberstotakeadvantageofthese)
• PSNPPlushascreatedawarenessofcreditandsavings,andanincreasedwillingnessonthepartofMuslimcommunitymemberstotakeoutloans
Threats• Frequentdroughtandfailedharvestsresultsinlossof
incomeandunderminesmembersabilitytocontributeandsave
• Disagreementsoninterestratesandothermodalitiescouldresultingroupsdisbanding(particularlywherereligiousorsocio‐economicdifferencesexist)
• Disagreementonhowgroupsavingshouldbeutilized,somemembersprefertheideaofcollectiveinvestments,otherspreferthatthemoneyindividuallysharedout

Longitudinal Impact Study of the PSNP Plus Program Baseline Assessment in Raya Azebo
35
4.7 Assets and Asset Changes Figure 10: Changes in land holding 2009-2010
Table 13: Changes in tree ownership 2009-2010
Sheep n=136 Control n=130 Cattle n=82 Asset Type 2009 2010 2009 2010 2009 2010
Number of Households (HHs,) with coffee trees 8 9 19 22 8 9 Average number coffee trees/HH (23) (21) (66) (58) (142) (184) Number HHs, owning chat (roots) 33 39 27 37 5 5 Average number chat roots/HH (295) (310) (231) (231) (370) (438) Number HHs, owning fruit trees 6 7 10 10 5 5 Average number fruit trees/HH (125) (134) (81) (22)1 (8) (8) Number of HHs, owning Gesho 4 4 0 0 0 0 Average number /HH (118) (116) - - - - Number of HHs owning ‘other’ trees (Eucalyptus/Olives) 5 5 1 4 0 0 Average number ‘other’ trees/HH (187) (187) (300) (77)2 - -
1 Reduction due to one farmer going from 600 fruit trees in 2009 to zero in 2010 (reason not recorded) 2 Reduction due to the fact that the majority of trees (300) were owned by the same farmer in 2009 and 2010, the additional three farmers in 2010 only owned 7 trees
Land Holdings (tsimad) Mean Qty (95% CI) Sample
2009 2010 Sheep n=136 3.9 (3.5,4.3) 3.9 (3.6, 4.3) Control n=130 3.8 (3.3, 4.3) 3.9 (3.3, 4.4) Cattle n=82 4.4 (3.9, 4.8) 4.7 (4.2, 5.2)

Longitudinal Impact Study of the PSNP Plus Program Baseline Assessment in Raya Azebo
36
Figure 11: Changes in livestock Sheep (n=136)
Figure 12: Changes in livestock Cattle (n=82)

Longitudinal Impact Study of the PSNP Plus Program Baseline Assessment in Raya Azebo
37
Table 14: Factors contributing to negative changes in livestock assets
Number and Percentage of Responses
Reasons (Decrease)
Sheep VC n=136 Control n=130 Cattle VC n=82 Sold/Exchanged/Slaughteredforfood 104 41% 136 49% 99 52%Livestockdied 94 37% 94 34% 59 31%Otherreason 26 10% 8 3% 13 7%Livestockmatured(e.g. heifer became a bull) 12 5% 9 3% 7 4%Soldtopayforeducation/schooling 6 2% 13 5% 5 3%Sold/Slaughteredforsocialobligations 7 3% 9 3% 5 3%Soldtorepayloansordebts 4 2% 5 2% 1 1%Soldtopayforhealthcare 3 1% 4 1% 0 0TotalResponses 256 278 189Notes: Number of responses may exceed the number of respondents as more than one asset was assessed per household Table 15: Factors contributing to positive changes in livestock assets
Number and Percentage of Responses
Reasons (Increase)
Sheep VC n=136 Control n=130 Cattle VC n=82 Livestockreproduced/matured 69 39% 35 58% 40 35%Purchasedwithincomefromfattening 41 23% 2 3% 43 37%Otherreason 23 13% 16 27% 18 16%WeweregiventhisassetbyPSNPPlusvaluechain 28 16% 0 0 8 7%Purchasedwithincomefromotherlivestocksales 6 3% 3 5% 1 1%PurchasedwithPSNP/OFSPincomeorloan 4 2% 2 3% 4 3%PurchasedwithprofitfromPettyTrade/IGA 5 3% 1 2% 1 1%PurchasedwithMFIloan 0 0 1 2% 0 0TotalResponses 176 60 115
Figure 13: Summary of project versus non-project factors contributing to an increase in assets
Notes: (1) Frequency of responses as a percentage of total number of responses (2) Fattening profit considered as a project factor although this does not apply to the control
23%
16% 61%
Sheep VC n=136
Fattening Profit
Project Transfer
Other
3%
97%
Control n=130
Fattening Profit
Project Transfer
Other
37%
7%
56%
Cattle VC n=82
Fattening Profit
Project Transfer
Other

Longitudinal Impact Study of the PSNP Plus Program Baseline Assessment in Raya Azebo
38
Figure 14: Changes in productive assets Sheep (n=136)
Figure 15: Changes in productive assets Cattle (n=82)

Longitudinal Impact Study of the PSNP Plus Program Baseline Assessment in Raya Azebo
39
Table 16: Factors contributing to negative changes in productive assets (tools)
Number and Percentage of Responses
Reasons (Decrease)
Sheep VC n=136 Control n=130 Cattle VC n=82 Assetstolen/broken 26 67% 21 72% 19 90%Otherreason 11 28% 7 24% 2 10%Sold/Exchangedforfood 2 5% 1 3% 0 0TotalResponses 39 29 21
Table 17: Factors contributing to positive changes in productive assets (tools)
Number and Percentage of Responses
Reasons (Increase)
Sheep VC n=136 Control n=130 Cattle VC n=82 Otherreason 24 49% 12 41% 24 75%PurchasedwithPSNP/OFSPincomeorloan 13 27% 5 17% 4 13%Purchasedwithincomefromfattening 8 16% 3 10% 2 6%Purchasedwithincomefromotherlivestocksales 1 2% 6 21% 0 0Weweregiventhisasset 3 6% 1 3% 2 6%PurchasedwithprofitfromPettyTrade/IGA 0 0 2 7% 0 0TotalResponses 49 29 32

Longitudinal Impact Study of the PSNP Plus Program Baseline Assessment in Raya Azebo
40
Figure 16: Changes in household items Sheep (n=136)
Figure 17: Changes in household items Cattle (n=82)

Longitudinal Impact Study of the PSNP Plus Program Baseline Assessment in Raya Azebo
41
Table 18: Factors contributing to negative changes in household assets
Number and Percentage of Responses
Reasons (Decrease)
Sheep VC n=136 Control n=130 Cattle VC n=82 Assetstolen/broken 61 82% 38 88% 31 84%Otherreason 7 9% 2 5% 3 8%Sold/Exchangedforfood 1 1% 3 7% 0 0Sold/Givenforsocialobligations 1 1% 0 0 2 5%Soldtopayforeducation/schooling 1 1% 0 0 1 3%Soldtopayloansordebts 2 3% 0 0 0 0Soldtopayforhealthcare 1 1% 0 0 0 0TotalResponses 74 43 37
Table 19: Factors contributing to positive changes in household assets
Number and Percentage of Responses
Reasons (Increase)
Sheep VC n=136 Control n=130 Cattle VC n=82 Otherreason 33 35% 43 59% 44 80%PurchasedwithPSNP/OFSPincomeorloan 24 26% 14 19% 3 5%PurchasedwithprofitfromPettyTrade/IGA 14 15% 3 4% 4 7%Purchasedwithincomefromotherlivestocksales 10 11% 6 8% 2 4%Purchasedwithincomefromfattening 8 9% 4 5% 1 2%Purchasedwithcredit 4 4% 1 1% 0 0Weweregiventhisasset 1 1% 2 3% 1 2%TotalResponses 94 73 55

Longitudinal Impact Study of the PSNP Plus Program Baseline Assessment in Raya Azebo
42
Figure 18: Scoring of project versus non-project factors contributing to impact
Average Score for Interventions Reasons Sheep n=27 Control n=9 Cattle n=19
PSNP
26
12
25
Crop sales
17
46
11
Livestock fattening
24
10
23 Other livestock production
9
17
21 Labor
13
7
3 Land rent & Compensation
0
6
6 Petty trade
8
0
3
MFI loan
0
3
2
Handicrafts 0
0
3 Remittances
2
0
0
Local drinks 1
0
0
Other reason 0
0
5
Table 20: Probability of project participant’s assets increasing
Sheep Control CattlePercentageofsamplethatexperiencedanassetincrease 20% 7% 23%P‐valueinterventionsampleversuscontrol P=0.002 P=0.001
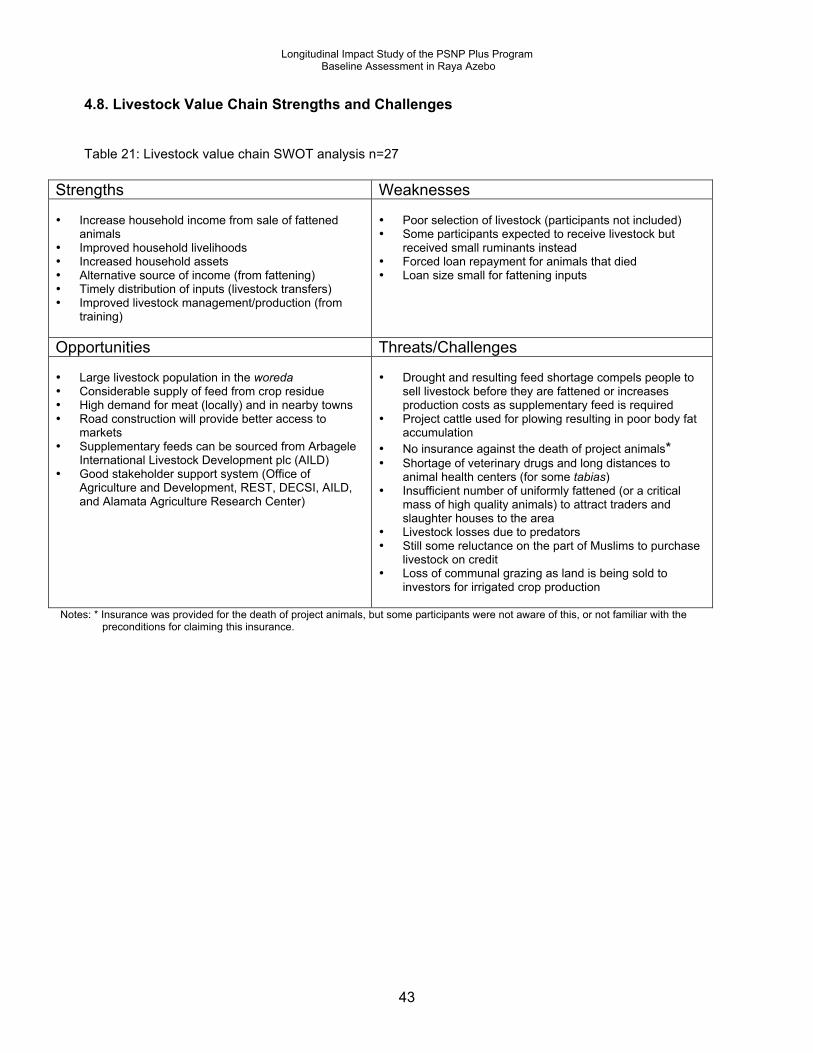
Longitudinal Impact Study of the PSNP Plus Program Baseline Assessment in Raya Azebo
43
4.8. Livestock Value Chain Strengths and Challenges Table 21: Livestock value chain SWOT analysis n=27
Strengths Weaknesses
• Increase household income from sale of fattened animals
• Improved household livelihoods • Increased household assets • Alternative source of income (from fattening) • Timely distribution of inputs (livestock transfers) • Improved livestock management/production (from
training)
• Poor selection of livestock (participants not included) • Some participants expected to receive livestock but
received small ruminants instead • Forced loan repayment for animals that died • Loan size small for fattening inputs
Opportunities Threats/Challenges
• Large livestock population in the woreda • Considerable supply of feed from crop residue • High demand for meat (locally) and in nearby towns • Road construction will provide better access to
markets • Supplementary feeds can be sourced from Arbagele
International Livestock Development plc (AILD) • Good stakeholder support system (Office of
Agriculture and Development, REST, DECSI, AILD, and Alamata Agriculture Research Center)
• Drought and resulting feed shortage compels people to
sell livestock before they are fattened or increases production costs as supplementary feed is required
• Project cattle used for plowing resulting in poor body fat accumulation
• No insurance against the death of project animals* • Shortage of veterinary drugs and long distances to
animal health centers (for some tabias) • Insufficient number of uniformly fattened (or a critical
mass of high quality animals) to attract traders and slaughter houses to the area
• Livestock losses due to predators • Still some reluctance on the part of Muslims to purchase
livestock on credit • Loss of communal grazing as land is being sold to
investors for irrigated crop production
Notes: * Insurance was provided for the death of project animals, but some participants were not aware of this, or not familiar with the preconditions for claiming this insurance.

Longitudinal Impact Study of the PSNP Plus Program Baseline Assessment in Raya Azebo
44
5. DISCUSSION
5.1 Methodological Limitations
There were a number of methodological constraints and limitations to the assessment. As the assessment took place a year after the project started, a retrospective baseline approach was used, and this could potentially result in a certain degree of recall bias. Consistent with the project objectives, the study also focused on measuring impact in terms of assets. Although physical and financial assets may be useful poverty measurement indicators, the LIS study findings to date, indicate that livestock represent the most meaningful asset in poor rural Ethiopian households. However, livestock die and reproduce, and they are continuously being sold and purchased, these dynamics make it difficult to measure impact in terms of livestock holdings, unless this were to be done over a protracted period. Seeing as assets are used as benchmarks for PSNP graduation, it is also possible that households may under report on these, as there may clearly be incentives for households to remain in the program. In terms of attribution, the classic scientific approach involves the use of a control population of non-project participants. This approach involves comparing a control group with a “treatment” or “intervention” population to determine statistical difference between the two groups, the assumption being that the control group has similar characteristics as the intervention group (Catley et al, 2008). In identifying a control group for the study in Raya Azebo, the assumption was made that PSNP participants would share similar characteristics as PSNP Plus households and so the same comparison group was used for both livestock value chains. However, it has been argued that the complexity, diversity and variance that defines and distinguishes people and communities is such that the conventional rigor associated with using a control makes no sense when applied to community development research (Chambers, 2008). This argument is acknowledged, as is the limitation that the approach used in no way captures the multiplicity of independent variables or characteristics that make two population groups similar or indeed truly comparable. As such, the characteristics used to define comparability were limited to the specific asset indicators being measured. Having said this, the results show no significant difference in baseline asset levels or relative income sources between the intervention and control groups suggesting that for these indicators, this is a fairly reliable control. On the asset inventory exercises, if there had been any changes in assets, participants were asked to give the reasons for this. Each reason mentioned was then assigned a score of one and the total number of responses was added to give a corresponding frequency score to each factor. The limitation with this approach is that if two reasons are given, they each receive the same score even though one of the reasons may have been far more important than the other. Although an additional exercise was included in which participants were asked to score the different reasons contributing to an overall increase in assets, very few participants actually experienced an overall increase in assets, and the results from these exercises could not be analyzed with an degree of confidence.
5.2 Recent Livelihoods Shocks
The results indicate that over 99% of assessment participants reported drought or rain-failure in 2009 (table 7). Key informants maintained that this resulted in poor crop production, shortage of livestock feed, and temporary displacement (table 6). This also coincided with high livestock mortality, which was attributed to a variety of livestock disease outbreaks (table 6). Although 24-35% of assessment participants reported livestock disease in 2008-2009 (table 7), reports of livestock mortality were

Longitudinal Impact Study of the PSNP Plus Program Baseline Assessment in Raya Azebo
45
relatively low in comparison to other impacts of the drought (figure 1). A slightly higher percentage of control participants reported livestock disease outbreaks (9-11%) in comparison to the intervention households. It is possible that this difference may be partly attributed to the livestock management training activities associated with the project value chains. This training included topics such as feed management, animal care and disease prevention. Other major impacts of the drought included, crop and income loss, and food and animal feed shortage (figure 1). Assessment participants employed a variety of economic strategies in order to cope with the effects of the drought and other recent idiosyncratic shocks (figure 2). The results indicate that the PSNP was the most important factor enabling participants to cope with the drought (figure 2). Many households also sold livestock, and engaged in other income generating activities such as casual labor, petty trading and chat trading.
5.3 Community Wealth Indicators
Livestock are the main determinant of wealth in the Raya Valley with oxen being the single most important wealth indicator. Focus group participants suggested that most households that own between 2-4 oxen would be considered better off, although many households from the poorest wealth category might own one draft animal (table 10). Medium to better off households would also be expected to own more cattle in general, and small ruminants than the poorest, and the poorest would be less likely to own camels and equines. Participants also indicated that the better off categories would typically have larger homes, and were more likely to have acquired certain household items such as beds, mats, lanterns and radios (table 10). Participants also indicated that wealth was typically defined in terms of household food security, with the better off meeting all of their food needs from their own on farm production. Conversely, the poorest wealth category would only be expected to meet half of their annual food needs through on farm production, and could potentially face a five months food deficit (table 10). As such, the poorest category are also characterized by being engaged in other income earning activities such as temporary wage employment and tending animals for wealthier community members. The quantity of land holdings is not as such a key determinant of wealth, but rather people’s ability to utilize their land effectively is seen as more important. This factor is largely determined by household labor capacity and the ownership of draft animals. However, some households are landless, as such they can neither cultivate nor own more than a few livestock for lack of space and livestock feed.
5.4 Sources of Income
Formal employment opportunities are limited in Raya Azebo, and the rural economy of the woreda is almost exclusively characterized by agricultural production. Two surveys carried out in the Raya Valley in 1996 and 1997 indicated that 98-99 percent of households derived most of their income from crop and livestock production (REST, 1997).
5.4.1 Livestock Production and Marketing Data generated by the LIU indicates that the sale of livestock and livestock products in a “good year” contributes an estimated 25-30% of household income for the poorest wealth categories and between 50-60 % for better-off households in Raya Azebo (DPPA, 2007). Similarly, the assessment results indicate that income from livestock production (including fattening) for the assessed PSNP Plus

Longitudinal Impact Study of the PSNP Plus Program Baseline Assessment in Raya Azebo
46
households and the control sample contributed between 20-30% of household income in 2008-2009 (figure 3), keeping in mind that assessment participants would fall into the poorest wealth categories. In Raya Azebo, livestock production mostly involves rearing cattle and small ruminants, although camels and donkeys are also used, and hired out for transportation (DPPA, 2007). Typically wealthier households own camels, for example only 12 camels were reported in the entire assessment sample, and 8 of these belonged to a single household. Although cattle, specifically oxen are primarily used as draft animals, the LIU baseline reports indicate that some dairy production exists in the woreda, with products such as butter and milk being consumed and sold (DPPA, 2007). However, cattle are rarely sold except during times of food and income shortage, and as such they represent a form of insurance against economic and food security shocks (DPPA, 2007). Small ruminant rearing is practiced by households across all wealth groups, with sheep and goats being sold between the ages of 12-24 months, providing an important and steady source of household income (DPPA, 2007). Although all households have access to communal grazing land, based on livestock population estimates from the late nineties, these would only provide enough feed for seven and a half months of the year (REST, 1997). Participants indicated that crop residue also provides an important supplementary source of feed for livestock. During periods of feed shortage, people will feed their livestock cactus, which is fairly abundant in the area (figure 2, & also see REST, 1997. 11). Although, scientific livestock fattening is not commonly practiced in the woreda, key informants suggested that in the past, traditional livestock fattening was practiced. The results indicate that income from livestock fattening contributed 4% of total household income for both the treatment and control samples in 2008-2009 (figure 3). It should be noted however, that the term fattening is fairly loosely defined, and more often involves a process of short term natural fattening as opposed to a more systematic process of stall or tether feeding. A number of important livestock marketing centers exist in the woreda, such as Mehoni, Kukufto, Chercher, Mechare and Bala. Other markets in the neighboring areas include Shukomajo (Meswaeti), Maichew, Gugubdo and Alamata. Although some of these are feeder markets for Afar livestock being exported to other areas, including Sudan, they provide residents of the woreda with an easy option to purchase and sell livestock. This extensive livestock market network also provides other income earning opportunities from livestock trading, and trekking. Poultry production is also common, and even the majority of poor households own some poultry. Although productivity from poultry in the area has been assessed as “very low” (REST, 1997. 12), LIU reports indicate that the sale of eggs does contribute to household income in the area (DPPA, 2007).
5.4.2 Constraints to Livestock Production and Marketing
There are a number of constraints to livestock production and marketing in the area, some of which apply to the project fattening activities, and some might be partly addressed by the projects livestock value chain interventions. Drought and Feed Shortage A comprehensive feasibility study of the agricultural potential of the Raya Valley identifies the shortage of grazing land and livestock feed as a major constraint to livestock production or the expansion of this activity (REST, 1997). The same assessment largely attributes this to poor livestock management and utilization and suggests that the economic potential exists if livestock production were to be improved

Longitudinal Impact Study of the PSNP Plus Program Baseline Assessment in Raya Azebo
47
(REST, 1997). The report recommends that a greater emphasis be placed on quality production over quantity production, by improving feed management, animal health, and marketing (REST, 1997). Feed and grazing shortage certainly remain a challenge to livestock production (and the project), and a more recent assessment in the area ranks feed shortage as the first and second most important priorities to be addressed for cattle and small ruminant production in the Raya Valley (TARI/AARC, 2010). Again, this study also links this constraint to land and livestock management practices (TARI/AARC, 2010), or the lack thereof. Arguably this has resulted in what has been described as heavily “overgrazed” areas and low productivity (REST, 1997). As such, the pasture in the communal grazing areas is considered to be of poor quality, in part due to poor management practices, but also due to the encroachment of weeds and other invasive plant species (REST, 1997). Although grazing and livestock feed might be improved through better land management practices, certain challenges remain. For example, the quantity (availability) and quality of livestock feed is directly dependent on rainfall, and the challenge of livestock feed is exacerbated by frequent drought. This factor was repeatedly mentioned as the main constraint to ‘livestock fattening’ by assessment participants. Focus group participants identified drought related feed shortage as a key challenge to the project fattening activities, as the lack of feed compelled people to sell their livestock before they were properly fattened (table 21). Furthermore, in recent years, communal grazing land has been leased to private investors for commercial crop production, it appears as though this trend will continue, and key informants expressed their concern that this would further reduce the availability of grazing, compounding the problem of feed shortage (table 21). On an individual level, people with small plots of land, or no land at all obviously have less access to feed from crop by-products. Some landless female participants in Kukufto and Bala tabia’s maintained that they had to prematurely sell their project animals for lack of feed and or space. The quality and availability of feed certainly represents a major challenge to livestock production and marketing. Although it may seem counterintuitive, in principle, the PSNP Plus value chain activities are designed to at least partly overcome and address this constraint. As discussed, the issue of feed shortage has been attributed to the fact that the woreda’s livestock population exceeds the existing feed supply, mostly derived from overgrazed communal pasture (REST, 1997). The project value chain aims to address this in the following ways: Firstly, the value chain aims to increase the off-take of livestock from the area, by improving the quality of livestock, and tapping into an existing well-established livestock market network. Secondly, by focusing on alternative feeds, the value chains aim to improve the health and overall condition of the livestock, and improve their market value. If successful, these activities could potentially reduce the livestock population, improve the quality of pasture by reducing the pressure on communal grazing land and, at the same time increase the income from livestock sales. The projects emphasis on quality over quantity seems logical in this context. It should be noted however, that the results show that participants are re-investing in livestock assets (table 11). If people’s livestock assets do increase over time, which is the overall objective of the project, it could potentially put even greater pressure on natural pasture unless more sustainable land and livestock management practices are implemented.
Water Shortage
Lack of water for livestock can also be problematic during the dry season, when many of the livestock water points “haroyes” dry up (REST, 1997). This means that some livestock owners spend between 2-4 hours taking their livestock to water points, and as such they will only do this every other day (REST, 1997), with obvious implications on animal health and productivity.

Longitudinal Impact Study of the PSNP Plus Program Baseline Assessment in Raya Azebo
48
Livestock Disease
Livestock disease also represents a major challenge to livestock production and more specifically to livestock fattening. Key informants reported that outbreaks of anthrax (Megerem), blackleg, contagious bovine pleuropneumonia (CBPP), bovine pasturellosis and ovine pasturellosis (Mieta), sheep and goat pox (Enfirir), and brucellosis were not uncommon. Reports also indicate the presence of fascioliasis, mastitis, foot and mouth disease, tick and other parasites in the area (REST, 1997, TARI/AARC, 2010). Although there are five animal health posts in the area (Mehoni, Kukofto, Mechare and Bala), and animal health services are provided for a nominal charge, shortage of vaccines, and distances to veterinary clinics remain an obstacle (table 21). The prevalence and variety of animal disease is partly attributed to the large volume of trade livestock passing through the area, however this would only really apply to foot and mouth disease, CBPP (Sambue), and to some extent goat pox. Key informants also suggested that many of the disease outbreaks, or poor animal health in general, is associated with drought and feed shortage. Despite the reported prevalence of livestock disease in the area, the results show fairly low livestock mortality (although still a12% preventable loss/year) for project animals (table 8). As mentioned, this might be attributed to the improved feeding and management practices introduced by the project, although this would only apply to parasitic disease. However, it may also be that there were no epidemics during the period assessed resulting in sudden livestock deaths and asset loss. If as reported, veterinary services are weak, future epidemics are inevitable, and this would undoubtedly result in considerable asset loss for project participants. Diseases that result in sudden livestock death would be anthrax, blackleg (which is more common in fattened animals), pasteurellosis, and to some extent CBPP and goat pox. In the future, preventative measures would need to be implemented to avoid these epidemics. Diseases that would relate to reduced fattening would be fasciolosis, foot and mouth disease, ticks and other parasites. Informants also claimed that some livestock such as poultry and small ruminants are periodically lost to predators such as hyena and jackals (table 21).
5.4.3 Crop Production
Farming activities are dependent on the Belg (February/March to April/May) and Kiremti (July to September/October) rains (REST, 1997; DPPA, 2007). Good soil fertility, and the availability of land make the area well suited to crop production, and in recent years there has been some investment in commercial farming in the area, characterized by mechanized and irrigated crop production (DPPA, 2007). Farmers living close to the edge of the valley also practice ‘flood irrigation’ by diverting temporary streams created by rainfall in the adjacent mountains. The main crops grown in the area are sorghum, teff and maize, with teff being produced as a cash crop as well as for own consumption (DPPA, 2007). A variety of pulses, such as lentils, chickpeas, horse beans, fruit including lemons, oranges and bananas, and vegetables such as onions, potatoes, tomatoes and cabbage are also grown in the woreda. However, the type and distribution of these crops varies according to elevation (REST, 1997). For example, fruit is typically found in lowland areas, and coffee and chat are also grown as cash crops in the lowland areas. Crops such as barley and oil seeds are grown at higher elevations, and prickly pear can be found in the midland and lowland areas (REST, 1997). According to LIU data, in a “good year”, roughly 20-30% of household income for the two poorest categories is derived from crop sales (DPPA, 2007). The assessment results indicate that between 17-23% of household income for 2008-2009 came from crop sales (figure 3). Although there is some discrepancy between these results and the LIU data, this can be explained by the fact that 2008 was a

Longitudinal Impact Study of the PSNP Plus Program Baseline Assessment in Raya Azebo
49
“bad year” in terms of crop production, and LIS participants would most likely fall into the poorest wealth category where the income contribution from crop sales is closer to 20%.
5.4.4 Constraints to Crop Production
Although good soil fertility and the availability of land indicate that the area has high agricultural potential, there are still a number of constraints to crop production in the woreda. Erratic or unreliable rainfall (in terms of distribution and duration) probably represents the major constraint to crop production in the area (DPPA, 2007; TARI/AARC, 2010). For example, key informants suggested that the area experienced poor rainfall in 2007, 2008 and 2009, with 2009 being a particularly bad year. Although a variety of pests such as parthenium weed, shoot fly and striga weed are also commonly reported, pesticides can be accessed through the Bureau of Agriculture and Rural Development. However, a recent assessment suggested that crop production potential is limited due to the lack of improved (disease and pest resistant) crop varieties in Raya Azebo (TARI/AARC, 2010). The same assessment pointed to ‘poor agronomic practice’ as a constraint to sorghum and maize production (TARI/AARC, 2010, 26 & 27). During focus group discussions, assessment participants consistently mentioned drought or unreliable rainfall as the key constraint to crop production, followed by the shortage of agricultural inputs, or the delayed provision of inputs such as seeds. In some ways these two constraints are linked. For example, participants indicated that they have developed a risk management system to cope with crop failure associated with erratic rainfall. This involves the continuous planting and replanting of sorghum every time it rains, in the hope that one crop will survive. Although experience has shown this to be an effective risk coping strategy, it can also rapidly result in a depletion of seed stocks. Participants also consistently mentioned the lack of draft animals as a constraint to crop production, however this typically ranked after drought and the availability of inputs. Interestingly enough, in other LIS study areas, the lack of draft animals has often featured as a major constraint to crop production and food security in general. Seeing as oxen are considered a key indicator of wealth, this constraint is particularly relevant to poorer households, and is also associated with a households labor capacity, or ability to fully utilize their land holdings for crop production. The logic being that draft animal ownership, automatically translates into greater household productive capacity and greater crop production benefits. Similarly, in Raya Azebo the general perception appears to be that households with draft animals are able to prepare their land and plant earlier than households without oxen, they therefore benefit from the first rains, and ultimately harvest more. As such, the lack of draft animals represents a constraint to crop production even where variables such as land holdings (size) and soil quality are not considered a limitation.
5.4.5 Other Economic Activities
Aside from income derived from crops and livestock, there are limited economic or formal employment opportunities in the area. As such, in 2008-2009 the PSNP represented the single most important source of income for the poorest households, with the results indicating that for the assessed households, almost one third of their income comes from this source (figure 3). Similarly, LIU data estimates that roughly 30-40% of income for the two poorest categories comes from the safety net program (DPPA, 2007). The importance of this source of income explains why assessment participants overwhelmingly cited the PSNP as enabling them to cope with the drought in 2008-2009 (figure 2).
Longitudinal Impact Study of the PSNP Plus Program Baseline Assessment in Raya Azebo
50
Some informal seasonal agricultural work is available for poor households, who will work on the farms of better-off households during the harvesting and weeding periods (DPPA, 2007). The results show that between 11-19% of household income comes from non-PSNP labor (figure 3), which in all likelihood would be more or less limited to this type of informal agricultural work. Other economic activities include, petty trading (including chat and grain trading), firewood, fodder and stone selling, clay making and weaving. Although the results indicate that these are not that important for PSNP households (figure 3), this could potentially change over time. Recent road construction has brought an increase in human traffic through the area and opened up opportunities for small retail businesses, such as shops, restaurants, tea houses and so on. Although these provide service industry jobs, these are few and are limited to urban centers such as Mehoni. Nonetheless, this has and likely will continue to create opportunities for petty trading and other income generating activities.
5.6 Credit and Savings
A number of formal and informal microfinance options are available to rural communities in Raya Azebo. Dedebit Credit and Saving Institute is the main provider of formal financial products, offering interest-based loans to rural households. Formal agricultural credit is also provided through the Other Food Security Programs (OFSP). These include improved seeds and livestock loans provided by the woreda Agriculture and Rural Development offices, REST, and farmer’s cooperatives. Informal financial products are also available from private sources and traditional saving and lending groups such as Iqqub and Iddir. Focus group participants indicated that Iddir is primarily an insurance mechanism, whereby friends and neighbors will raise funds to cover unexpected shocks or medical emergencies, and to pay for burial services. On the other hand Iqqub provides saving and loan facilities using a similar albeit less structured approach to the VSLA model. The main distinction between Iqqub and the VSLA approach is that no interest is applied to Iqqub loans in Raya Azebo. Although this approach accommodates the religious concerns discussed, where inflation is high, this could create a disincentive for Iqqub members to lend money, as there is no cushion against devaluation. Participants suggested that Iquub is more active closer to urban areas where trading and retail options are available. However, they also indicated that most people use Iqqub loans to purchase assets such as livestock. People also borrow money directly from individual neighbors or better-off community members. Typically, interest on these loans is high ranging from 10-100%. These can either be paid back in cash or crops after the harvest. However, due to the high risk of rain and crop failure, people generally prefer to save rather than borrow, and convert their savings into livestock assets as a form of insurance against idiosyncratic and covariant livelihoods shocks. The results from the household component of the assessment indicate that for the sheep value chain and control samples, the main source of credit comes from formal MFI’s such as DECSI (figure 8). The mean value of loans for the year prior to the assessment was roughly between 400-500 birr for these two groups (figure 8). For the cattle value chain, the mean value of loans from MFI’s for the past year was less than 150 birr (figure 8). However, this group had slightly more in terms of savings (just under 300 birr), than the other two groups (figure 8). Credit from other/private sources ranged between 100-200 birr for all three groups (figure 8). No data on credit and savings from VSLA groups was captured as none of the household participants belonged to these groups (table 9). Loan utilization varied between the three samples, however for all three categories, the vast majority of these loans were invested in livestock, followed by food purchases (figure 9). However, the control sample spent more of their loans on renting land (almost 200 birr) than they did on food purchases
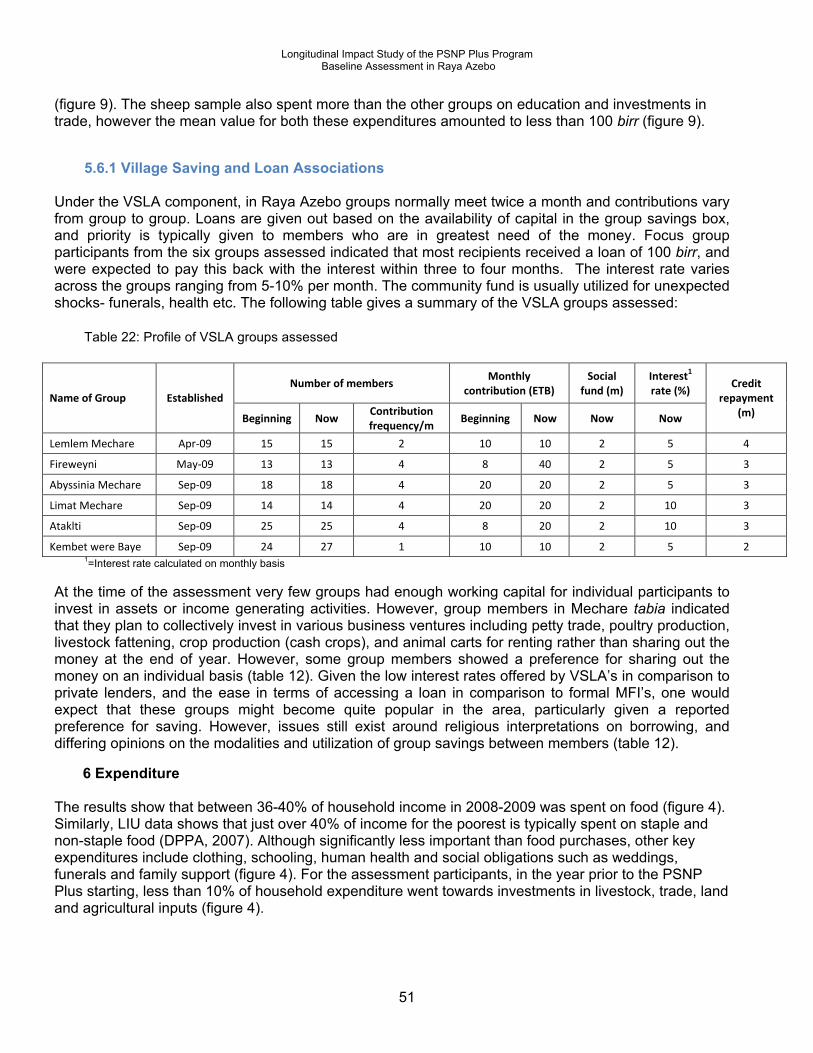
Longitudinal Impact Study of the PSNP Plus Program Baseline Assessment in Raya Azebo
51
(figure 9). The sheep sample also spent more than the other groups on education and investments in trade, however the mean value for both these expenditures amounted to less than 100 birr (figure 9).
5.6.1 Village Saving and Loan Associations Under the VSLA component, in Raya Azebo groups normally meet twice a month and contributions vary from group to group. Loans are given out based on the availability of capital in the group savings box, and priority is typically given to members who are in greatest need of the money. Focus group participants from the six groups assessed indicated that most recipients received a loan of 100 birr, and were expected to pay this back with the interest within three to four months. The interest rate varies across the groups ranging from 5-10% per month. The community fund is usually utilized for unexpected shocks- funerals, health etc. The following table gives a summary of the VSLA groups assessed:
Table 22: Profile of VSLA groups assessed
NumberofmembersMonthly
contribution(ETB)Social
fund(m)Interest1rate(%)
NameofGroup Established
Beginning NowContributionfrequency/m
Beginning Now Now Now
Creditrepayment
(m)
LemlemMechare Apr‐09 15 15 2 10 10 2 5 4
Fireweyni May‐09 13 13 4 8 40 2 5 3
AbyssiniaMechare Sep‐09 18 18 4 20 20 2 5 3
LimatMechare Sep‐09 14 14 4 20 20 2 10 3
Ataklti Sep‐09 25 25 4 8 20 2 10 3
KembetwereBaye Sep‐09 24 27 1 10 10 2 5 21=Interest rate calculated on monthly basis
At the time of the assessment very few groups had enough working capital for individual participants to invest in assets or income generating activities. However, group members in Mechare tabia indicated that they plan to collectively invest in various business ventures including petty trade, poultry production, livestock fattening, crop production (cash crops), and animal carts for renting rather than sharing out the money at the end of year. However, some group members showed a preference for sharing out the money on an individual basis (table 12). Given the low interest rates offered by VSLA’s in comparison to private lenders, and the ease in terms of accessing a loan in comparison to formal MFI’s, one would expect that these groups might become quite popular in the area, particularly given a reported preference for saving. However, issues still exist around religious interpretations on borrowing, and differing opinions on the modalities and utilization of group savings between members (table 12).
6 Expenditure The results show that between 36-40% of household income in 2008-2009 was spent on food (figure 4). Similarly, LIU data shows that just over 40% of income for the poorest is typically spent on staple and non-staple food (DPPA, 2007). Although significantly less important than food purchases, other key expenditures include clothing, schooling, human health and social obligations such as weddings, funerals and family support (figure 4). For the assessment participants, in the year prior to the PSNP Plus starting, less than 10% of household expenditure went towards investments in livestock, trade, land and agricultural inputs (figure 4).

Longitudinal Impact Study of the PSNP Plus Program Baseline Assessment in Raya Azebo
52
7 Livestock Fattening Issues
Although factors such as drought, feed shortage, lack of water and livestock disease have been identified as the key constraints to livestock production, a number of specific challenges for the fattening activities were also identified. Focus group participants suggested that a number of cattle value chain recipients could not resist the temptation to use their project oxen for plowing. As a result the body condition of the animals did not greatly improve. Consistent with this, participants expressed their concern that at present, there are still not enough ‘uniformly’ fattened animals to attract traders and slaughterhouses to the area (table 21). Some project participants also felt that their exclusion from the animal selection process resulted in ‘poor quality’ livestock being selected. As such, when these livestock died, they felt that they should not have been obliged to repay the loan. However, household participants reported fairly low mortality rates for project livestock (table 8), so these concerns were probably not that widespread. Nonetheless, in the future, the selection of livestock should be done in a more transparent way, and include recipients in the process. Best practice guidelines for restocking interventions allow recipients to select their own livestock (see MoARD, 2008 and LEGS, 2009), and the same approach should be applied for future fattening interventions. This being said, the timely distribution of livestock for fattening was noted as one of the strengths of the project. Focus group participants also recommended that some sort of insurance should have been provided by the project (table 21). However, project staff indicated that insurance against livestock mortality is actually provided under the PSNP Plus fattening value chains, although some participants were not aware of this. Under this insurance mechanism, if for example an animal died of a treatable disease, the owner would have to provide evidence that the animal in question had been treated for that particular disease. It appeared as though a number of participants were either not aware of this insurance provision, or of the preconditions for claiming the insurance. As such greater awareness and clarification needs to be provided to future project participants on their entitlements. Certainly livestock insurance minimizes the risks associated with project participation, and one analyst has recommended that both human and livestock insurance be incorporated into the design of the PSNP and OFSP (Pankhurst, 2009). Furthermore, given the low mortality rates reported for project animals (table 8), one would expect a greater willingness on the part of insurance providers to consider this option. Focus group participants also mentioned a number of future opportunities for the value chain activities. These included the existence of feed suppliers, local research and project implementation capacity, good livestock breeds and a sizeable livestock population in the woreda. Also as discussed the construction of new roads is expected to increase market opportunities in the area. In terms of benefits, although at the time of the assessment the project had only been implemented for about one year, focus group participants suggested that their income had increased, or that they now had a new source of income from the sale of fattened animals (table 21). Some participants also suggested that their assets had increased as a result of the project, and that there had been some knowledge benefits transferred translating into improved livestock management and production (table 21).
Longitudinal Impact Study of the PSNP Plus Program Baseline Assessment in Raya Azebo
53
8 Asset Changes
The results show that there have been some important changes in specific livestock assets since the project started. For the participants in the sheep value chain, there has been a significant increase in the number of sheep owned since 2009 (figure 11). In comparison, the control sample experienced no significant change in the amount of sheep owned (figure 11). This can partly be attributed to actual project (sheep) transfers. For example, within the sheep sample, of all the reasons given for an increase in a specific livestock asset, 16% of the responses involved the project asset transfer (table 15). However, 23% of the responses attributed the increase in livestock assets to purchases using income from the sale of fattened animals. In contrast, only 3% of the control group responses were for this reason (table 15). These findings are also supported by the results on actual utilization of income derived from fattening profits. These show that 46% of the income derived from sheep fattening was directly reinvested in livestock assets, representing a mean expenditure of 307 birr per household (table 11).
For the cattle sample, the results show no significant changes in livestock assets, however there was a significant decrease in oxen and heifers for the control group (figure 12). This suggests that the project value chain helped participants maintain their livestock assets. Again this can be partly attributed to the project asset transfers. However, where households had experienced an increase in assets, 37% of the total responses attributed this to purchases from income derived from fattening, as opposed to only 7% of the responses attributing it to project transfers (table 15). Again this is supported by the results on the actual utilization of fattening derived income. These show that an even greater proportion of this income (86%) was reinvested in livestock, translating into 1,377 birr (mean expenditure) per household.
The results show no significant changes in land holdings, productive assets or households items either for the intervention or control sample (figures 10 & 14-18). The results do however show that the sheep sample had significantly more mattresses than the control sample both before and after the project started (figure 16). However, even for the sheep sample, mean ownership of mattresses was well below one per household, so this disparity probably has little significance. What is significant is the extremely low level of household assets for the entire sample, with mean values of most assets assessed being less than one (figures16 &17). Furthermore, certain assets such as kerosene stoves and mobile phones were also used as asset indicators (see Annex 1), however these are not reflected in the results, as most households simply do not own these items. These findings underscore the extreme level of poverty of PSNP household’s; keeping in mind that very similar results were obtained in the other LIS study areas (see Burns et al, 2009 and Bogale et al, 2010). Where households experienced an increase in a specific productive asset or household item, respondents gave a wide range of reasons (tables 17 & 19). These did include the PSNP, which was frequently mentioned, and some mentioned that these items were purchased with income from fattening (tables 17 & 19). Where households experienced a decrease in household items and productive assets, the only (single) reason that was frequently mentioned, was that the asset broke (tables 16 & 18).
Where households experienced a decrease in a specific livestock type, the most frequently mentioned reason for this was that the livestock was sold, exchanged or slaughtered for food (table 14). This was the same for the treatment and control samples and can be directly attributed to the drought in 2008-2009, as the sale of livestock was given as the second most important coping strategy people employed in response to the drought (figure 2). Although livestock mortality was only the fifth most frequently mentioned impact of the drought (figure 1) it was the second most frequently mentioned reason for a decrease in a specific livestock type (table 14). Fortunately, the mortality rates for project livestock were fairly low (table 8). A reduction in herd size was also frequently mentioned as an impact of the drought (figure 1). Although this is clearly the combined result of both livestock sales and mortality, either way,
Longitudinal Impact Study of the PSNP Plus Program Baseline Assessment in Raya Azebo
54
the results strongly indicate that the drought had a negative impact on livestock assets, food security and income (figure 1). The impact of the drought arguably explains why only 16% of the entire sample (n=348) experienced a ‘perceived’ increase in overall (as opposed to specific) assets. However, 20% and 23% of the intervention samples respectively experienced this increase, as opposed to only 7% of the control sample. Therefore, the probability of project participants having experienced an increase in assets is significantly greater than that of the control (see table 20). Project households that experienced an overall increase in assets, scored the PSNP and livestock fattening as the two most important contributing factors (figure 18). Although it is too early for the project to have had a significant impact on assets for all participants, the results show that it has contributed to an overall increase in assets for some. The evidence also shows there has been a fairly substantial investment in livestock assets through project derived income, and overall it has certainly helped to maintain or increase specific livestock assets for the majority of participants, at least in the short to medium term.
9 Other Project Impacts
Consistent with the project objectives, the LIS aims to measure impact in terms of assets, specifically those measurable assets used as the criteria for PSNP graduation. However, impact can be measured in different ways, such as the impact on actual income. For example, at the time of the assessment, mean income from the sale of ‘fattened’ project animals was 884 birr for sheep value chain participants, and 1,786 birr for cattle value chain participants (table 8). The results show that for project participants, the relative contribution of income earned from fattening went from 2-4% to 12% since the start of the project (figures 5 & 6). The utilization of income derived from the project can also be a useful indicator of project benefits (Catley et al, 2008). As discussed, most of this income was reinvested in livestock, thus contributing towards the protection or utilization of these assets. To a lesser extent, some of this income was also used on other livelihoods investments, such as food, health and education (table 11).

Longitudinal Impact Study of the PSNP Plus Program Baseline Assessment in Raya Azebo
55
CONCLUSIONS
The project activities appear to be well designed to address some of the key constraints to livestock production and marketing in Raya Azebo, and the livestock value chains are well positioned to take advantage of an increasing local demand for meat, and an existing network of well functioning livestock markets in the area. Ultimately, if the project can promote the off-take of quality livestock, this could help mitigate some of the key constraints to livestock production, namely the poor quality and availability of pasture, and the shortage of livestock feed in general. Therefore, the project emphasis on quality over quantity production appears to be a logical response to overgrazing and feed shortage that results in poor quality livestock with a low market value. This being said, caution should be applied, if people’s livestock assets do increase over time, and this does not coincide with improved land and livestock feed management practices, it could ultimately result in even greater levels of pasture degradation and feed shortage. The assessment results indicate that the rapid implementation of the project, and the timely distribution of livestock assets, is already starting to have some impact on the livelihoods of project participants. Although the area experienced a drought during the first year of the project, resulting in food and income losses, livestock feed shortage, and livestock mortality and sales, project participants appear to be slightly better off than non-project participants that shared similar wealth characteristics before the project started. In terms of livestock holdings, participants in the cattle value chain maintained more or less the same level of oxen, whereas control group participants experienced a significant decline in oxen. Participants in the sheep value chain actually experienced a significant increase in sheep, whereas there was no significant change in sheep holdings for the control sample. Although these results can partly be attributed to the actual project asset transfers, participants mostly attributed positive changes in assets to project derived income as opposed to project transfers. The results also show fairly low livestock mortality for project animals, in contrast to reports of high livestock disease prevalence. This might suggest that the projects training activities have translated into improved animal health for animals owned by project participants. In other words it is possible that the project’s knowledge transfer benefits have helped project households better maintain their livestock holdings in comparison to non-project participants. Although only fifty-five households across the entire sample (intervention and control) experienced an overall ‘perceived’ increase in assets, the results show that there was a significantly greater probability of project participants experiencing an asset increase. Again, where there had been an increase in a specific type of non-livestock productive asset, project participants partly attributed this to project related factors. Some project participants also suggested that they had experienced an increase in household income from the sale of fattened animals. For some households this actually represented a new source of income. In such cases it could be argued that the project has improved people’s resiliency, by diversifying their livelihood options, and reducing their dependency on rain-fed crop production. Overall, the contribution of income from the sale of fattened animals in comparison to all other income sources has increased by between 8-10% for project participants. This represents a mean income from fattening of 884 birr and 1,786 birr for sheep and cattle value chain participants respectively. Although most of this income was reinvested in livestock, a sizeable portion was also spent on food, arguably helping to improve household food security. To a lesser extent, some of this project income was invested in other livelihoods assets such as health and education.

Longitudinal Impact Study of the PSNP Plus Program Baseline Assessment in Raya Azebo
56
Seeing that a final impact assessment will be carried out in 2011, these findings can be considered as somewhat preliminary. One of the key issues to look at during the final assessment will be whether participants have been able to repay their loans and still continue to realize an elevated level of income from fattening sales. Nonetheless, these mid term findings do indicate that when well designed and well implemented, value chain interventions in concert with microfinance in the form of credit, can quickly translate into income and livelihoods benefits for PSNP participants. That this income is being reinvested in livestock assets suggests that over time this approach could well contribute to an increase in physical household assets, and help participants graduate from the PSNP.

Longitudinal Impact Study of the PSNP Plus Program Baseline Assessment in Raya Azebo
57
References: Aklilu, Y. and Catley, A. (2009) Livestock Exports from the Horn of Africa: An Analysis of Benefits by Pastoralist Wealth Group and Policy Implications. Feinstein International Center, Medford, MA. Aklilu. Y (2008) Livestock Marketing in Kenya and Ethiopia: A Review of Policies and Practice. Pastoral Areas Coordination, Analysis and Policy Support Project, Feinstein international Center, Addis Ababa. Bekele, G. and Aklilu, A. (2008) Impact Assessment of the New Livestock Markets in Somali, Afar and Oromia Regions, Feinstein International Center, Tufts University, Addis Ababa. Burns, J., Bogale, S., and Bekele, G (2010) Linking Poor Rural Households to Microfinance and Markets in Ethiopia; Baseline and Mid-Term Assessment of the PSNP Plus project in Doba, Feinstein International Center, Medford, MA
Bogale, S., Bekele, G., and Burns, J. (2010) Linking Poor Rural Households to Microfinance and Markets in Ethiopia; Baseline Assessment of the PSNP Plus project in Sire and Dodota, Feinstein International Center, Medford, MA
Borchgrevink, A., Helle-Valle, J., and Wodehanna, T. (2003) Credible Credit Impact Study of the Dedebit Credit and Saving Institution (DECSI), Tigray, Ethiopia. Norwegian Institution of International Affairs and Norsk Borchgrevink, A., Wodehanna, T., Ageba, G., and Teshome, W. (2005) Marginalized groups, credit and empowerment: The case of Dedebit Credit and Saving Institution (DECSI) of Tigray, Ethiopia. Occasional Paper No 14. AEMFI. Addis Ababa
CARE (2010) PSNP Plus Project, Linking Poor Rural Households to Microfinance and Markets: Seventh Quarterly Report April- June 2010, Addis Ababa. CARE (2010) PSNP Plus Project, Linking Poor Rural Households to Microfinance and Markets: Sixth Quarterly Report January-March 2010, Addis Ababa.
CARE (2009) PSNP Plus Project, Linking Poor Rural Households to Microfinance and Markets: Year One Annual Report and 4th Quarter Programmatic Report; July 2009 to September 2009. Addis Ababa.
Carter, M., Little, P., Mogues, T. and Negatu, W. (2008), Poverty Traps and Natural Disasters in Ethiopia and Honduras Ch. 5 in A. Barrientos and D. Hulme (eds), Social Protection for the Poor and Poorest; Concepts, Policies and Politics, London: Palgrave Macmillan Carter, M. and Barret, C. (2007), Asset Thresholds and Social Protection; A ‘Think Piece’: IDS Bulletin, Vol. 38, No. 3, pp. 34-38 Catley, A. Burns, J, Abebe, D, and Omeno, W. 2008: Participatory Impact Assessment: A Guide for Practitioners, Feinstein International Center, Medford, MA 2008 Chambers, R. (2008) Revolutions in Development Inquiry: Institute of Development Studies, 2008, London, Earthscan.
Devereux, S., Sabates-Wheeler, R., Tefera, M and Taye, H. (2006) Ethiopia’s Productive Safety Net Programme (PSNP), Trends in PSNP Transfers Within Targeted Households, Final Report. IDS: Brighton UK, Indak, International, Addis Ababa 2006. DPPA (2007) Tigray Livelihood Zone Reports: Raya Azebo Woreda, Southern Administrative Zone. Raya Valley Sorghum and Teff Livelihood Zone: Report from the Livelihoods Information Unit, Disaster Preparedness and Prevention Agency (DPPA) Addis Ababa, February 2007. Getahun, M (2010) “The Plus” In Getahun, M (ed) PSNP Plus newsletter: Volume 1. Issue 2, Addis Ababa, October 2010.

Longitudinal Impact Study of the PSNP Plus Program Baseline Assessment in Raya Azebo
58
Gilligan, D., Hodinott, J., Kumar, N., Taffasse, A, S., Dejene, S., Gezahegn, F., and Yohannes, Y. (2008) Ethiopia Food Security Program: Report on 2008 Survey. International Food Policy Research Institute (IFPRI). Washington, D.C.
Greeley, M. (2003) Poverty Reduction and Microfinance – Assessing Performance Ch. 1 in (Brody, Copestake, Greeley, Kabeer, and Simanowitz (eds) Microfinance, Poverty and Social Performance: IDS Bulletin, Vol. 34, No. 4, pp. 10-20 LEGS (Livestock Emergency Guidelines and Standards) (2009) Livestock Emergency Guidelines and Standards. Practical Action Publishing, Rugby.
Micro Development Training and Consultancy Services (2010) Final Report – Financial Product Development and Linkage Mechanism – PSNP Plus, Addis Ababa. Ministry of Agriculture and Rural Development (2008) National Guidelines for Livestock Relief Interventions in Pastoralist Areas of Ethiopia, Ministry of Agriculture and Rural Development, Addis Ababa, Ethiopia. 105 pp.
Ministry of Agriculture and Rural Development (2007), Productive Safety net Programme: Graduation Guidance Note, Food Security Co-ordination Bureau, Ministry of Agriculture and Rural Development, Addis Ababa, December, 2007 Ministry of Agriculture and Rural Development (2006) Productive Safety Net Programme: Programme Implementation Manual. Addis Ababa, Ministry of Agriculture and Rural Development, Government of the Federal Democratic Republic of Ethiopia. Mosely, P (2003) Micro-insurance; Scope, Design and Assessment of Wider Impacts Ch. 14 in (Brody, Copestake, Greeley, Kabeer, and Simanowitz (eds) Microfinance, Poverty and Social Performance: IDS Bulletin, Vol. 34, No. 4, pp. 143-155
Narayan, D., Patel, R., Schafft, K., Rademacher, A., Koch-Schulte, S. (1999), Can Anyone Hear US? Voices from 47 Countries, (Voices of the Poor, Vol. 1.) World Bank, Poverty Group, Consultations with the Poor Project, Washington, D.C. Available at http://go.worldbank.org/3T5PAAJ060 accessed on July/15th/2009 Pankhurst (1999) Rethinking Safetynets and Household Vulnerability in Ethiopia: Implications of Household Cycles, Types and Shocks. Paper presented at the World Conference of Humanitarian Studies, Groningen, Netherlands. 4-7 February 2009 PSNP Plus Project Proposal (2008) Bringing Ultimate Yields through Integrated Networks (BUY IN): Linking Poor Rural Households to Microfinance and Markets REST (2009) PSNP Plus: Linking Poor Rural Households to Microfinance and Markets in Ethiopia: Annual Intermediate Results and Outcome Report. December 2009. Relief Society of Tigray (REST). Makelle, Ethiopia. REST (1997) Feasibility Report of the Raya Valley Development Study Project: Volume 1. The Federal Democratic Republic of Ethiopia, Tigray National Regional Government, The Relief Society of Tigray (REST). Alamata, August 1997.
Slater, R., Adhley, S., Tefera, M., Butta, M, and Esubalew. (2006). PSNP Policy, Programmes and Institutional Linkages, Final Report. SNV (2010) PSNP Plus Livestock Sheep and Goats Fattening Value Chain Analysis Report: SNV, Ethiopia. Addis Ababa, Ethiopia, March 2010. TARI/AARC (2010) Problem Appraisal and Prioritization of Southern Zone Tigray (Alamata, Raya Azebo, Endam-Mokoni and Emba Alaje) Woreda’s. Tigray Agricultural Research Institute (TARI), Alamata Agricultural Research Institute (AARC), Alamata, January 2010.
Longitudinal Impact Study of the PSNP Plus Program Baseline Assessment in Raya Azebo
59
USAID (2008) Linking Poor Rural Households to Microfinance and Markets; RFA No: 663-A-08-015. USAID, Ethiopia, Addis Ababa, March 2008. Watson, C. (2008), Literature Review of Impact Measurement in the Humanitarian Sector. Feinstein International Center, Medford.
World Bank. (2006). The Rural Investment Climate: It differs and it matters, Washington. D.C. World Bank

Longitudinal Impact Study of the PSNP Plus Program Baseline Assessment in Raya Azebo
60
ANNEX I: Household Questionnaire (reformatted and translated for report)
Ques No._________ Household Component Checklist
BASELINE ASSESSMENT PSNP PLUS LONGITUDINAL STUDY- Raya Azebo
Name of Interviewer__________________________________ Day:_________ Month: ______________Year 2010
Woreda Raya Azebo Peasant Association (Tabia) Village/Cluster (Kushet) 1. Household and Project Background Information
Household Code # Circle the appropriate boxes Registered name of Household (PSNP +)
Name of respondent
Household roofing material Grass Corrugated Sheeting
Project Activities that household members are involved in Cattle S. Ruminant Teff VSLA
Religion Christian Muslim Other
Education/grade of Household Head
Maximum education/grade of any household member
Number of household members
Number of working adults in the household
Is your household participating in the PSNP? (safety net - food or cash for work) YES NO
Number of household members working on the PSNP (safety net)
How many years has your household been participating in the PSNP?
Has your household graduated from the PSNP in the past year? YES NO
Have you experienced any of the following shocks in the past year?
Weather related (specify - drought etc) Crop loss (specify - pest, disease, etc) Livestock related (specify – disease, deaths etc) Other unexpected shocks (specify –human illness, death) What impact did these shocks have on your livelihood? What actions did you take to cope with these shocks?

Longitudinal Impact Study of the PSNP Plus Program Baseline Assessment in Raya Azebo
61
2. Savings and Loan Information
Circle the appropriate boxes A How much money has your household managed to save in the past year? ETB B Has your household taken out a loan in the past year? YES NO C (If Yes) - How much money did you borrow? (total) ETB D Who did you borrow the money from? (breakdown) VSLA MFI/DECSI Other E Have you managed to pay back the loan and commission? YES NO b. How did your household spend your savings/sharing and loans? (in the past year only) Check each of the items that apply and ask the respondent to specify the amount Savings & Loan Utilization Amount ETB 1 Food & household consumables 2 Medical costs 3 Education/schooling (fees/uniforms/rent/transport) 4 Land renting/ purchase property or home improvements (corrugated roofing etc) 5 Purchase livestock or poultry 6 Invested in petty trade/ other trade retail, business or IGA 7 Farming & livestock inputs (animal health treatment/seeds/fertilizers/pesticides/tools, animal feeds etc) 8 Social obligations/ceremonies (weddings/funerals/iddir other contributions) 9 Clothes, shoes, blankets 10 Other-specify taxes, loan, transport, social obligations, entertainment, HH items: 3. Livestock Value Chain Information a. How many livestock have you received under the PSNP Plus Livestock fattening Value Chain?
Livestock Type Received (number) Died (number) Cattle Small Ruminants
b. During the past year, have you sold any fattened (project) livestock? Livestock type (oxen/shoats etc) Number sold Total income in ETB
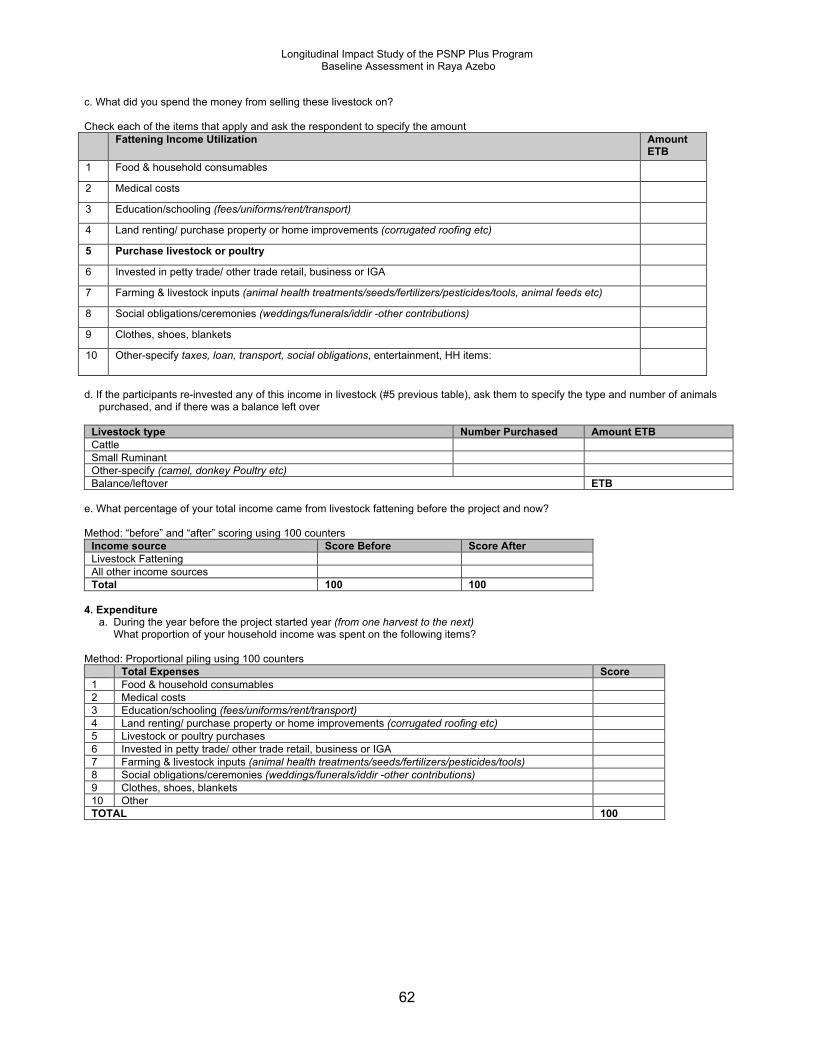
Longitudinal Impact Study of the PSNP Plus Program Baseline Assessment in Raya Azebo
62
c. What did you spend the money from selling these livestock on? Check each of the items that apply and ask the respondent to specify the amount Fattening Income Utilization Amount
ETB 1 Food & household consumables
2 Medical costs
3 Education/schooling (fees/uniforms/rent/transport)
4 Land renting/ purchase property or home improvements (corrugated roofing etc)
5 Purchase livestock or poultry
6 Invested in petty trade/ other trade retail, business or IGA
7 Farming & livestock inputs (animal health treatments/seeds/fertilizers/pesticides/tools, animal feeds etc)
8 Social obligations/ceremonies (weddings/funerals/iddir -other contributions)
9 Clothes, shoes, blankets
10 Other-specify taxes, loan, transport, social obligations, entertainment, HH items:
d. If the participants re-invested any of this income in livestock (#5 previous table), ask them to specify the type and number of animals
purchased, and if there was a balance left over
Livestock type Number Purchased Amount ETB Cattle Small Ruminant Other-specify (camel, donkey Poultry etc) Balance/leftover ETB
e. What percentage of your total income came from livestock fattening before the project and now? Method: “before” and “after” scoring using 100 counters
Income source Score Before Score After Livestock Fattening All other income sources Total 100 100
4. Expenditure
a. During the year before the project started year (from one harvest to the next) What proportion of your household income was spent on the following items?
Method: Proportional piling using 100 counters
Total Expenses Score 1 Food & household consumables 2 Medical costs 3 Education/schooling (fees/uniforms/rent/transport) 4 Land renting/ purchase property or home improvements (corrugated roofing etc) 5 Livestock or poultry purchases 6 Invested in petty trade/ other trade retail, business or IGA 7 Farming & livestock inputs (animal health treatments/seeds/fertilizers/pesticides/tools) 8 Social obligations/ceremonies (weddings/funerals/iddir -other contributions) 9 Clothes, shoes, blankets 10 Other TOTAL 100
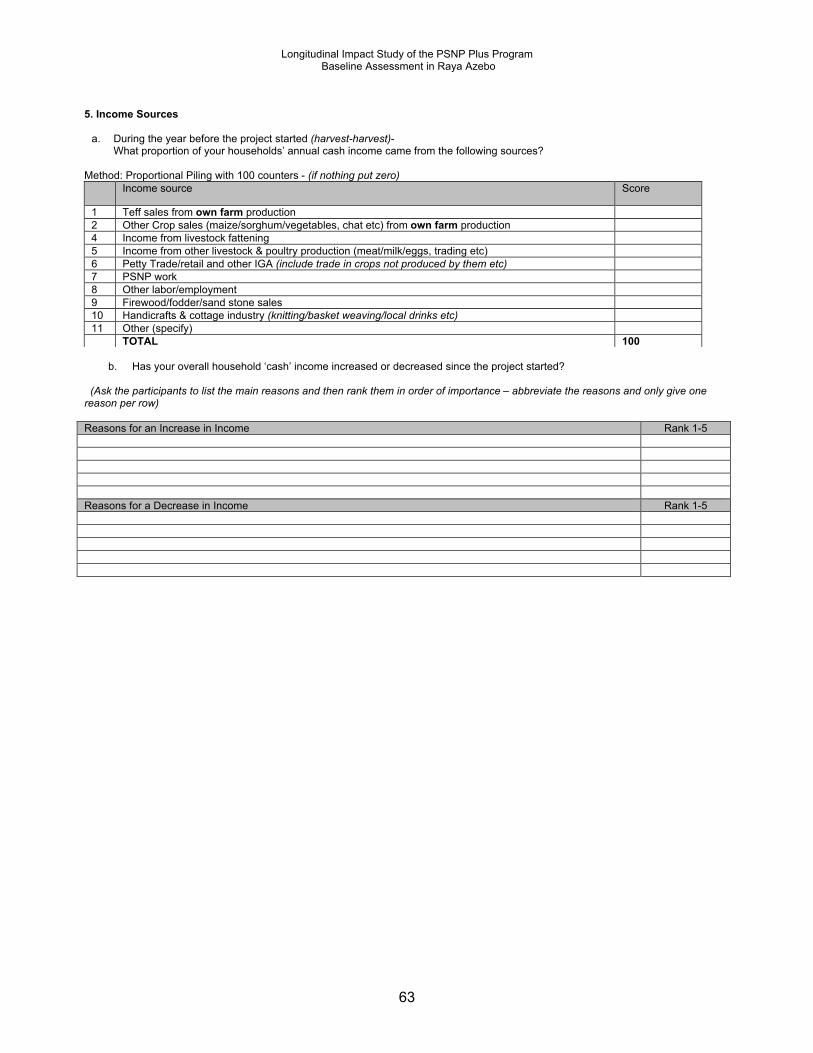
Longitudinal Impact Study of the PSNP Plus Program Baseline Assessment in Raya Azebo
63
5. Income Sources
a. During the year before the project started (harvest-harvest)- What proportion of your households’ annual cash income came from the following sources?
Method: Proportional Piling with 100 counters - (if nothing put zero)
b. Has your overall household ‘cash’ income increased or decreased since the project started?
(Ask the participants to list the main reasons and then rank them in order of importance – abbreviate the reasons and only give one reason per row) Reasons for an Increase in Income Rank 1-5 Reasons for a Decrease in Income Rank 1-5
Income source Score
1 Teff sales from own farm production 2 Other Crop sales (maize/sorghum/vegetables, chat etc) from own farm production 4 Income from livestock fattening 5 Income from other livestock & poultry production (meat/milk/eggs, trading etc) 6 Petty Trade/retail and other IGA (include trade in crops not produced by them etc) 7 PSNP work 8 Other labor/employment 9 Firewood/fodder/sand stone sales 10 Handicrafts & cottage industry (knitting/basket weaving/local drinks etc) 11 Other (specify) TOTAL 100

Longitudinal Impact Study of the PSNP Plus Program Baseline Assessment in Raya Azebo
64
6. Asset Inventory For the all the asset inventory tables (6.1 to 6.4) you will ask the three following questions
a. How many of the following assets belonged to your household one year ago? (if none write ‘0’) b. How many do you own now? (if none write ‘0’) c. What are the reasons for any changes in assets since last year?
6.1 Land (Do not include land that you do not own but are renting from someone else, but include any land you own and are renting out to someone else)
Asset What quantity of the following assets did you own or rent one year ago
What quantity do you own/rent today
Land Tsimad Tsimad Trees Coffee Roots Roots Trees Chat Roots Roots
d. If there has been any change in the amount of land they own/rent (either positive or negative), what are the reasons for these
changes? ________________________________________________________________________________________________________________________________________________________________________________________________________________
6.2 Productive assets
Productive Assets 1 Year Ago Now DECREASE INCREASE Plough and its accessories 1 2 3 4 5 6 7 1 2 3 4 5 6 7 8 Sickle 1 2 3 4 5 6 7 1 2 3 4 5 6 7 8 Pick Axe 1 2 3 4 5 6 7 1 2 3 4 5 6 7 8 Axe 1 2 3 4 5 6 7 1 2 3 4 5 6 7 8 Hoe 1 2 3 4 5 6 7 1 2 3 4 5 6 7 8 Spade 1 2 3 4 5 6 7 1 2 3 4 5 6 7 8 Wheel barrow 1 2 3 4 5 6 7 1 2 3 4 5 6 7 8 Animal Cart 1 2 3 4 5 6 7 1 2 3 4 5 6 7 8 Water pump 1 2 3 4 5 6 7 1 2 3 4 5 6 7 8 Grain mill (hand) 1 2 3 4 5 6 7 1 2 3 4 5 6 7 8 Grain Mill (diesel) 1 2 3 4 5 6 7 1 2 3 4 5 6 7 8 Traditional beehive 1 2 3 4 5 6 7 1 2 3 4 5 6 7 8 Modern beehive 1 2 3 4 5 6 7 1 2 3 4 5 6 7 8 TOTAL
Codes: for negative changes in assets 1 = We sold/exchanged for food 2 = We sold this asset to pay for healthcare 3 = We sold this asset to pay for education schooling 4 = We sold this asset for social obligations (wedding gift/funeral) 5 = asset lost/stolen or broken 6 = We sold this asset to pay of loans or debts 7 = We sold the asset for another reason (specify)
Codes for positive changes in assets We bought this asset with: 1 = Savings & credit from VSLA 2 = Credit from MFI 3 = PSNP income 4 = Profit from livestock fattening 5 = Income from “other” livestock sales 6 = Profits from petty trade/retail 7 = We were given this asset (specify) 8 = Other reason (specify)
Other reasons decrease Other reasons increase (put 7 or 8) __________________________________________ 1. _______________________________________ __________________________________________ 2. _______________________________________ __________________________________________ 3. _______________________________________ __________________________________________ 4. _______________________________________

Longitudinal Impact Study of the PSNP Plus Program Baseline Assessment in Raya Azebo
65
6.3 Household Items/Durables
If the amount owned today is different from one year ago explain why (circle all the reasons mentioned)
Asset How many did you own one year ago
How many do you own today DECREASE INCREASE
Bed 1 2 3 4 5 6 7 1 2 3 4 5 6 7 8 Mattresses 1 2 3 4 5 6 7 1 2 3 4 5 6 7 8 Mats 1 2 3 4 5 6 7 1 2 3 4 5 6 7 8 Chairs 1 2 3 4 5 6 7 1 2 3 4 5 6 7 8 Cupboards 1 2 3 4 5 6 7 1 2 3 4 5 6 7 8 Jericans 1 2 3 4 5 6 7 1 2 3 4 5 6 7 8 Pots/Pans 1 2 3 4 5 6 7 1 2 3 4 5 6 7 8 Cups 1 2 3 4 5 6 7 1 2 3 4 5 6 7 8 Lanterns 1 2 3 4 5 6 7 1 2 3 4 5 6 7 8 Tables 1 2 3 4 5 6 7 1 2 3 4 5 6 7 8 Radio or cassette player 1 2 3 4 5 6 7 1 2 3 4 5 6 7 8 Bicycles 1 2 3 4 5 6 7 1 2 3 4 5 6 7 8 Mobile phones 1 2 3 4 5 6 7 1 2 3 4 5 6 7 8 Charcoal stove 1 2 3 4 5 6 7 1 2 3 4 5 6 7 8 Kerosene stove 1 2 3 4 5 6 7 1 2 3 4 5 6 7 8 Barrel 1 2 3 4 5 6 7 1 2 3 4 5 6 7 8 TOTAL Codes: for negative changes in assets 1 = We were forced to sell/exchange/ for food 2 = We were forced to sell to pay for health 3 = We were forced to sell to pay for education/training 4 = We had to sell for social obligations (wedding gift/funeral) 5 = asset lost/stolen or broken 6 = We were forced to sell to pay of loans or debts 7 = We sold the asset for another reason (specify)
Codes for positive changes in assets
We bought this asset with: 1 = Savings & credit from VSLA 2 = Credit from MFI 3 = PSNP income 4 = Profit from livestock fattening 5 = Income from “other” livestock sales 6 = Profits from petty trade/retail 7 = We were given this asset (specify) 8 = Other reason (specify)
Other reasons decrease Other reasons increase (put 7 or 8) __________________________________________ 1. _______________________________________ __________________________________________ 2. _______________________________________ __________________________________________ 3. _______________________________________ __________________________________________ 4. _______________________________________

Longitudinal Impact Study of the PSNP Plus Program Baseline Assessment in Raya Azebo
66
6.4 Livestock assets - Do not include any animals that you are looking after but belong to someone else. Livestock 1 Year Ago Now DECREASE INCREASE Oxen/bulls 1 2 3 4 5 6 7 8 1 2 3 4 5 6 7 8 9 Cows 1 2 3 4 5 6 7 8 1 2 3 4 5 6 7 8 9 Steers 1 2 3 4 5 6 7 8 1 2 3 4 5 6 7 8 9 Heifers 1 2 3 4 5 6 7 8 1 2 3 4 5 6 7 8 9 Calves 1 2 3 4 5 6 7 8 1 2 3 4 5 6 7 8 9 Sheep 1 2 3 4 5 6 7 8 1 2 3 4 5 6 7 8 9 Goats 1 2 3 4 5 6 7 8 1 2 3 4 5 6 7 8 9 Donkeys 1 2 3 4 5 6 7 8 1 2 3 4 5 6 7 8 9 Poultry 1 2 3 4 5 6 7 8 1 2 3 4 5 6 7 8 9 Mules 1 2 3 4 5 6 7 8 1 2 3 4 5 6 7 8 9 Horses 1 2 3 4 5 6 7 8 1 2 3 4 5 6 7 8 9 Camels 1 2 3 4 5 6 7 8 1 2 3 4 5 6 7 8 9 Bees colony 1 2 3 4 5 6 7 8 1 2 3 4 5 6 7 8 9 TOTAL Codes: for negative changes in assets 1 = We sold/exchanged/slaughtered for food 2 = We sold this asset to pay for health care 3 = We sold this asset to pay for education/schooling 4 = We sold/slaughtered for social obligations (wedding gift/funeral) 5 = asset stolen or (livestock) died, predator eaten, absconding 6 = We sold this asset to repay loans or debts 7 = Livestock matured (e.g. heifer became a cow) 8 = We sold the asset for another reason (specify)
Codes for positive changes in assets We bought this asset with: 1 = Saving or credit from VSLA 2 = Credit from MFI 3 = PSNP/OFSP income or credit 4 = Profits from fattening 5 = Income form “other” livestock sales 6 = Profits from petty trade/retail 7 = We were given this asset by PSNP Plus value chain 8 = Livestock reproduced/matured 9 = Other reason (specify)
Other reasons decrease Other reasons increase __________________________________________ 1. _______________________________________ __________________________________________ 2. _______________________________________ __________________________________________ 3. _______________________________________ 7. Reasons for changes in assets Step 1: Now take a couple of minutes to add up the ‘before’ and ‘after’ asset scores. If there has been an overall increase in assets or the
participants feel there has been an increase in the overall value of household assets (livestock/tools etc) ask the participant to list the 5 most important reasons for this. [If there are less than 5 reasons just list the ones mentioned. List project factors mentioned]
Step 2: Ask the participants to score the reasons mentioned in order of importance. If one of the reasons listed has not been mentioned
put zero (0). [Method: Scoring with 100 counters – (list all the reasons mentioned)] Reasons for positive changes in assets Score 1 2 3 4 5 TOTAL 100 Do you have any questions that you would like to ask us, or is there anything else you would like to tell us about the project, and how it might be improved? (Once you have finished remember to thank the respondent for their time and participation).

Longitudinal Impact Study of the PSNP Plus Program Baseline Assessment in Raya Azebo
67
ANNEX II: Livestock Prices
Average Livestock Prices in Raya Azebo (April May 2010)
Normal Season Favorable Season Livestock type Category
Min. Price Max. Price Min. Price Max. Price Origin/source
Ox 1500 2000 2500 3500
Bull 1500 2000 2500 3500
Steer 1800 2000 2500 3000
Cow 1300 2000 2000 2500
Heifer 1000 1500 1200 1600
Cattle
Calf 400 700 700 1000
Surrounding areas and Afar region
Matured male 340 400 420 500
Castrated 500 700 800 1000
Matured female 300 380 400 500 Sheep
Lamb 100 150 160 200
Matured male 330 400 500 600
Matured female 300 400 400 470
Buck 600 800 800 1200 Goat
Kid 100 160 140 170
Surrounding areas, Afar and Amhara regions
Matured male 6000 8000 7000 14000
Matured female 3000 3800 3500 5000 Camel
Young 2400 2700 2800 3000
Mainly Afar region: Gugubdo, Yallew, Awash & Meiso
Mule 2300 2700 2400 3000
Horse 2200 2500 2400 3000
Matured male donkey 450 600 600 1000
Matured female donkey 300 400 500 600
Equine
Young donkey 250 300 400 500
Afar and the surrounding rural areas
Hen 15 20 20 25
Cock 20 30 30 50
Pullet 8 10 10 12 Chicken
Cockerel 9 13 11 15
Surrounding areas
Source: Livestock Market Information Center of Raya Azebo woreda; rural households in the woreda