linking pond water quality with algal bloom dynamics...
TRANSCRIPT

Linking Pond Water Quality with Algal
Bloom Dynamics: Implications for
Ecosystem and Human Health
Dianne I. Greenfield, Ph.D.
SC Algal Ecology Laboratory
Belle W. Baruch Institute for Marine and Coastal Sciences, USC
Marine Resources Research Institute, SCDNR

Overview
• What are algal blooms?
• What is a harmful algal bloom (HAB), and what are the consequences?
• HAB events specific to SC pond systems
• What factors influence algal bloom formation?
• Examples of projects examining algal pond dynamics (environment, molecular tools, population assessment)

What are algae?
Phytoplankton: Microscopic. All water types (marine, fresh, ponds,
rivers, lakes). Mostly benign, but includes harmful species.
Macroalgae: Visible without microscopy. Typically filamentous in
ponds, can have thin ‘leaves’. Conspicuous, but generally non-toxic.

• Like plants, algae use light to
convert nutrients into energy
(photosynthesis)
• Uptake carbon dioxide (CO2),
produce oxygen (O2)
• Form the base of the aquatic
food web – provide necessary
energy for higher organisms
• Critical for nutrient cycling
Ecological Importance
A significant, often rapid population increase resulting
in one or more species becoming numerically and/or
physiologically dominant.
What is an algal bloom?
A harmful algal bloom (HAB) causes negative
ecological or health impacts, sometimes leading to
economic consequences.
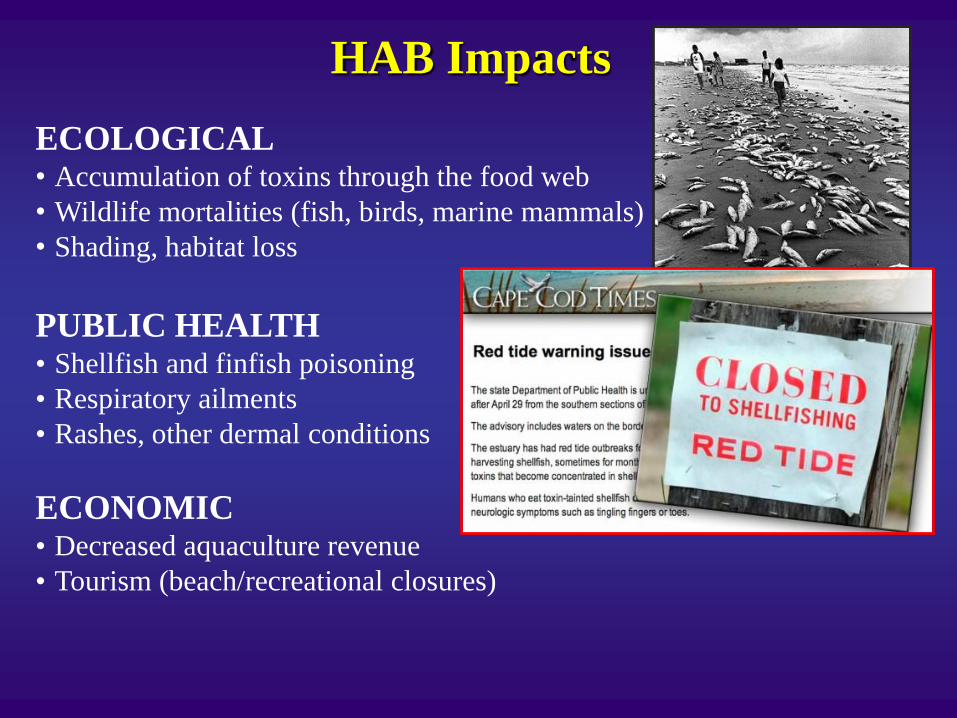
HAB Impacts
PUBLIC HEALTH • Shellfish and finfish poisoning
• Respiratory ailments
• Rashes, other dermal conditions
ECONOMIC • Decreased aquaculture revenue
• Tourism (beach/recreational closures)
ECOLOGICAL • Accumulation of toxins through the food web
• Wildlife mortalities (fish, birds, marine mammals)
• Shading, habitat loss

Food Web Linkages
Modified from Smayda (1992)

HABs in the US
www.whoi.edu/redtide/page.do?pid=14898

• Fish kills/lesions from mid-
Atlantic-Carolinas (late
1990s - early 2000s),
drawing national attention
• Estuaries and ponds
• Sewage (hog farming) &
eutrophication
• Dermal & respiratory
ailments in humans
• No recent blooms
HABs in SC: Pfiesteria piscicida
How do I recognize a HAB in
SC ponds, and what are the
potential health hazards?
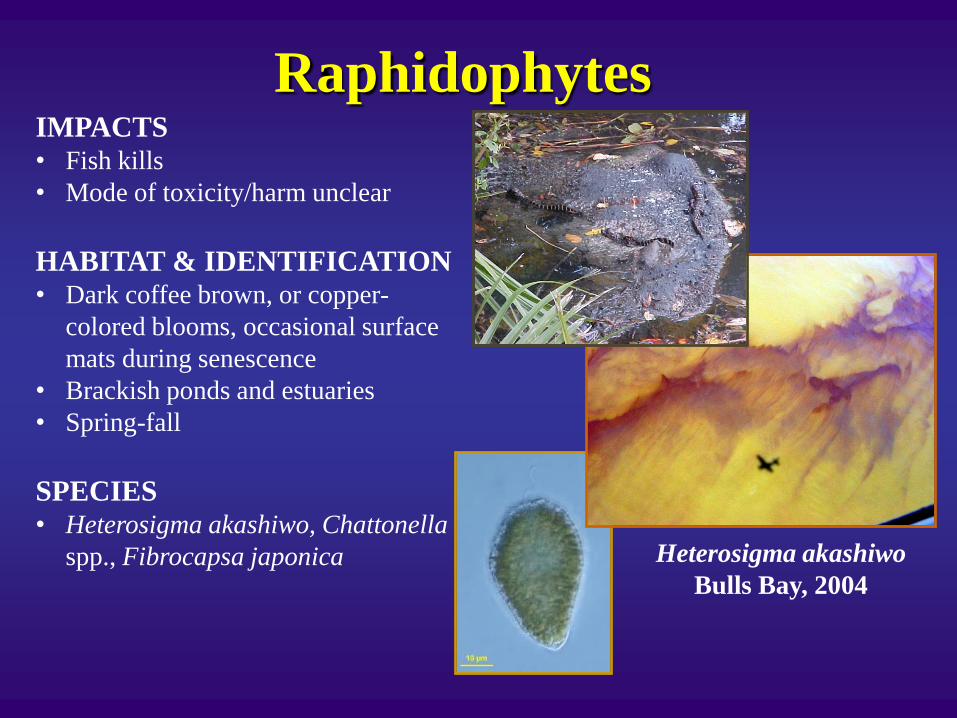
Heterosigma akashiwo
Bulls Bay, 2004
Raphidophytes IMPACTS • Fish kills
• Mode of toxicity/harm unclear
HABITAT & IDENTIFICATION • Dark coffee brown, or copper-
colored blooms, occasional surface
mats during senescence
• Brackish ponds and estuaries
• Spring-fall
SPECIES • Heterosigma akashiwo, Chattonella
spp., Fibrocapsa japonica

Cyanobacteria IMPACTS • Fish kills
• Humans, pets, and wildlife: rashes, respiratory
illness, liver failure, gastroenteritis
• Toxigenic: microcystin, cylindrospermopsin,
anatoxin, others
HABITAT & IDENTIFICATION • Dense, green blooms, often a filmy surface
• Decaying odor
• Fresh and brackish ponds
• Summer/autumn
SPECIES • Microcystis, Anabaenopsis, Oscillatoria,
Aphanizomenon, Anabaena,
Cylindrospermopsis spp.

Dinoflagellates IMPACTS • Fish kills
• Shellfish and finfish poisoning (as
gastroenteritis or neurological disorders:
seizures, amnesia, disorientation), respiratory
ailments
• Toxigenic: saxitoxin, brevetoxin, okadaic
acid, karlotoxin, others
HABITAT & IDENTIFICATION • Red, mahogany, or brown blooms
• Brackish and saline ponds
• Spring-fall
SPECIES • Prorocentrum minimum, Kryptoperidinium
foliaceum, Karlodinium veneficum,
Alexandrium spp.
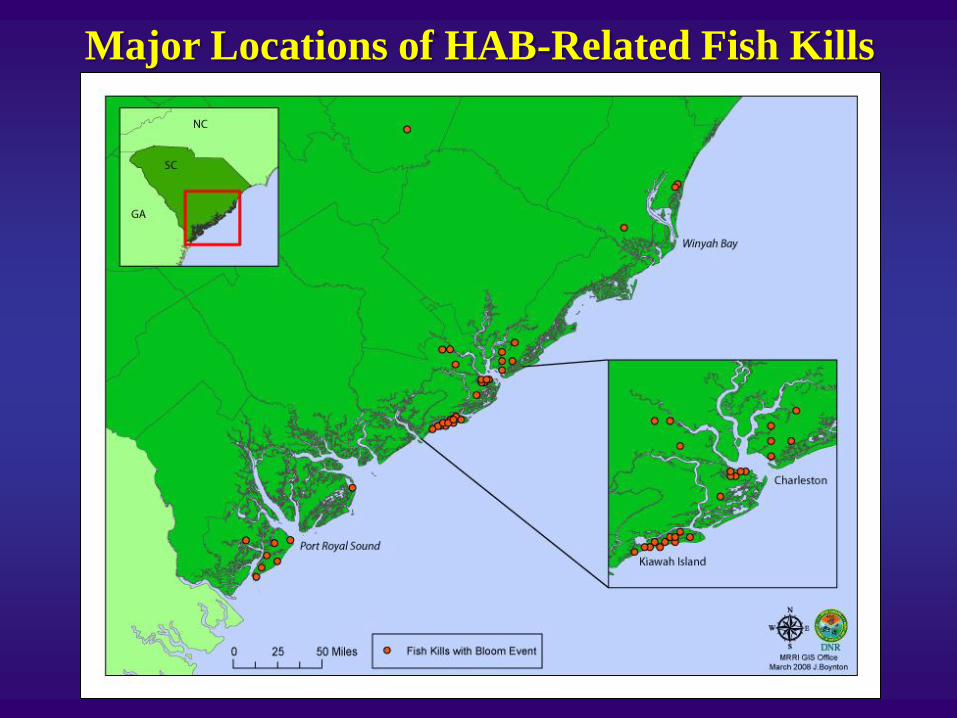
Major Locations of HAB-Related Fish Kills


Fish Kill Responses • Marine and brackish systems
• Detention ponds, lagoons, lakes, rivers
• >300 separate events since 2001, ~23% HAB-related.
Additional causes include hypoxia, chemical applications,
others
• Communication from residents, SCDNR, SCDHEC and
others to assess appropriate response
• Sample for water quality, phytoplankton, nutrients, toxin
(if necessary)
• Follow-up if warranted

Station Date
Chl a
(ug/L)
Chl a (<20 um)
(ug/L) DO (mg/L) T (OC) Sal (ppt) pH Bloom Species Count Toxin
Concentration
(ppb)
Pemberton (JI) 8-Jul-09 21.0 2.21 29.2 22.6 7.2 Heterocapsa rotundata 7,700 cells/ml
K 2 (KI) 13-Jul-10 254.9 249.5 1.79 29.2 12.6 8.6 Aphanizomenon sp.
9,503,900
cells/ml Microcystin 0.15
Teal Marsh Wading
Heron (JI) 20-Jul-10 14.70 32.5 8.8 9.1 Aphanizomenon sp. 77,300 cells/ml Microcystin ND
Chlamydomonas sp.
1,077,100
cells/ml
Oscillatoria sp. 520,600 cells/ml
K 36 (KI) 23-Jul-10 222.1 1.60 31.8 20.7 8.1 Aphanizomenon sp. 157,600 cells/ml Microcystin 0.16
Chlorophyte
1,645,500
cells/ml
K 41 (KI) 28-Jul-10 2313.5 2,006.7 0.09 30.2 15.9 8.2 Chattonella subsalsa 55,100 cells/ml
K 74 (KI) 17-Aug-10 261.6 170.8 2.90 30.6 22.6 8.5 Anabaenopsis sp. 142,300 cells/ml Microcystin 0.93
Oscillatoria sp. 34,200 cells/ml
K 7 (KI)
23-Aug-10
1230.1
524.7
8.86
31.6
19.1
8.1
Chattonella subsalsa
Microcystis (< bloom)
37,600 cells/ml
Microcystin 0.21
K 118 (KI) 30-Jun-11 357.3 28.7 9.19 31.4 25.3 9.5 Anabaena circinalis 471,900 cells/ml Microcystin 0.30
K 115 (KI) 30-Jun-11 553.8 113.8 11.79 34.3 24.5 9.9 Anabaenopsis sp. 275,500 cells/ml Microcystin 0.38
K 5 - ORP (KI) 29-Aug-11 400.7 310.2 5.72 29.3 3.3 9.2 Aphanizomenon sp. 19,100 cells/ml Microcystin ND
K 50 (KI) 8-Sep-11 14.02 29.0 13.2 8.8 Chattonella subsalsa 7,200 cells/ml
K 50 (KI) 21-Sep-11 15.70 30.1 12.8 9.3 Chattonella subsalsa 13,200 cells/ml
K 100 (KI) 28-Sep-11 768.2 12.73 30.9 17.3 8.8 Chattonella subsalsa 17,900 cells/ml
Charleston Area Bloom-Related Fish Kills:
Sept 2008 – Feb 2012
JI = James Island; KI = Kiawah Island; ND = Not Detected
DO = Dissolved Oxygen: red = anoxia (<2 mg/L), orange = hypoxia (2.01-4 mg/L), blue = high DO
Phytoplankton in red are potentially harmful species.
Slide: C. Keppler, modified by D. Greenfield

What influences pond algal blooms?
• Reduced exchange/flushing and aeration
• Warm, stagnant conditions, most common during summer
• Excessive ‘bottom-up’ inputs (excess nutrients, mostly
nitrogen)
• Reduced ‘top-down’ predator controls (grazing by shellfish,
zooplankton, larvae)
• Lack of competition by other species

Residential/golf course activities
stormwater detention ponds (BMP) HABs
& fish kills.

Detention Pond Functions “Prevent flooding and nutrients, sediments and bacteria from
urbanized areas from directly impacting the critical area”
Receive piped stormwater from roadways and surrounding developments
Settle contaminants (sediments, nutrients from fertilizers, and associated
development pollutants), flood prevention
Pond Piped outflow Tidal creek
Low flow, low flushing, can produce high algal biomass
Slide: L. Brock, modified by D. Greenfield

• Connected to 3 adjacent ponds
• 15 entering stormwater pipes
• 4 exiting pipes
• Tidal exchange: creek to pond
tides >5.3’
Slide: L. Brock, modified by D. Greenfield
Kiawah Pond K075
• Dimensions: area (9 ha); volume
(154,850 m3); depth (1.7 m)
• History of raphidophyte blooms
Surface run-off?
Groundwater?
Complex Hydrography

• 117 ponds
• ~340 acres water surface
• 47 mi pond shoreline
• 31 mi drainage pipe
• >430 reported fish kills, last 11 yrs
Kiawah Island Pond System & SCAEL Projects
Golf Course Residential
Statistics provided by KICA Lakes Management Department
• Routine monitoring, event response, and
ecosystem linkages
• Co-occurring pathogens
• Bloom ecology, genomics, and mitigation
strategies
• Development/refinement of novel molecular
detection methods

Routine Monitoring
• 2X month during warm months,
monthly during winter
• Sample mid-ebb
• Measure basic water quality
parameters (T, S, DO, pH) and
nutrients (N, P)
• Evaluate phytoplankton
community composition and
chlorophyll a
• Additional analyses (e.g., toxin) or
follow-up as needed
• 2X yr bacterial indicator
monitoring

• 2 terminal pond/creek systems
• Nutrients, phytoplankton, standard
water quality measured twice/month
during ebb tide
Slide: L. Brock & C. Keppler, modified by D. Greenfield
Ecosystem linkages: Are ponds sources of
nutrients and HABs to tidal creeks?
0
50
100
150
200
250
300
22-Feb-08 12-Apr-08 1-Jun-08 21-Jul-08 9-Sep-08 29-Oct-08 18-Dec-08 6-Feb-09 28-Mar-09 17-May-09
Tota
l N
itro
gen
(u
M/L
)
Date
K75 Pond
K75 Creek Upper
K75 Creek Middle
K75 Creek Lower
Tight similarities between ponds and
receiving creeks strongly suggest linkages

What nutrient types/levels cause
blooms? Implications for management?
• Comparative field and experimental
approach
• Determine biological responses
(algal growth) to N and P in different
coastal habitats
• Seasonal sampling for
phytoplankton, nutrients, other water
quality parameters
• Lab experiments evaluating
phytoplankton responses to N levels
Problem: Elevated N and P are known to cause eutrophication.
Surprisingly little is known about nutrient loading & phytoplankton growth
across SC estuaries and ponds. Implications for nutrient management?
Winyah
Bay
Charleston
Harbor
Kiawah
Island ACE
Basin

Nutrient Addition Bioassays
• 48 hr incubation
• N added at 20 M, P added at 1.25 M (Redfield 16:1)
• Net phytoplankton growth & community composition measured
(chlorophyll a, microscopy, HPLC pigments)
• Nutrients measured for N, P, and C utilization
Whole
Water
NH4+ Urea NO3-
NH4,
PO43
-
NO3-
PO43-
Urea,
PO43-
PO43- All
additions
No
addition

• Automated sampling over 2 tidal cycles
• Near-continuous (15 min) water quality (T, S, turbidity,
fluorometry, DO, pH) measured using deployable YSIs
• Evaluate phytoplankton assemblages & nutrients
• Coordinate sampling with other regional activities
Other field measurements

CTRL
N
A
U
N-A
N-U
A-U
P
4 6 8
b
a
a
a
a
a
a
Pond K61
TR
EA
TM
EN
T
a
2 3
c
bc
ab
ab
ab
ab
ab
a
Pond K67
ABUNDANCE
( g Chla l-1)
10 20 30
cd
d
cd
bc
bc
abc
a
ab
Pond K61
20 30 40 50
b
b
b
b
b
b
a
a
Pond K67
Total PhytoplanktonCyanobacteria
Siegel et al. MEPS 2011
Cyanobacteria responses to N-enrichment
• 2 ponds with bloom histories
• Ammonium (A) and urea (U)
favored algal growth, including
HAB species
• Management implications:
urea is a common golf course
fertilizer compound
• N-fixing species (ability to
convert N2 to NH3) did not increase
with additions

Can we understand nutrient and algal
population dynamics at a gene/molecular level? Kiawah Pond K109, Aug-Sept 2011
• Massive (>6 x 10⁵ cells/ml) bloom of
mixed cyanobacteria genera
(Microcystis, Oscillatoria,
Cylindrospermopsis, Aphanizomenon,
Anabaenopsis)
• Microcystin: ELISA (4 – 16 ppb)
• mcyD gene: qPCR, 454-
pyrosequencing
• Environmental parameters: nutrients,
chlorophyll a, T, S, DO, pH
• Short-term goal: evaluate
phytoplankton assemblage variability
and key genes regulating toxicity
• Long-term goal: Improve capabilities
to predict toxic events

Developing novel molecular tools to study
algal population dynamics
• Light microscopy is time-consuming
• Many species look alike and are difficult to distinguish
• Molecular approaches are often faster and enable species or gene-
specific identification and quantification, enabling ‘early warnings’
of HAB events
• Examples: polymerase chain reaction (PCR), sandwich
hybridization assay (SHA) for HABs. Protein-based for toxins
(ELISAs and others)
Why develop molecular approaches to study algae?

NOAA-MERHAB Project: Compare different
molecular methods for HAB research
• Many methods exist for phytoplankton monitoring, but few cross-
comparisons have been done
• ‘Bake-off’ between PCR and SHA
• Comparisons using a wide range of population, physiological and
environmental/field conditions
• Which one should I use? Provide recommendations to researchers
and managers
• Ichthyotoxic
• Global distribution
• Molecular assays established Heterosigma akashiwo www.ifremer.fr

Do different populations affect responses?
• Different study, year, population, and operator – yet, same response!
• Similar results using many, but not all populations tested
• Promising results using qPCR
From Greenfield et al., 2008 C. Doll, this study
y = 0.0001x + 0.0418R² = 0.9996
y = 0.0002x + 0.0494R² = 0.9997
0.0
0.5
1.0
1.5
2.0
2.5
3.0
0.0E+00 2.0E+03 4.0E+03 6.0E+03 8.0E+03 1.0E+04 1.2E+04
Op
tica
l D
ensi
ty
cells well−1 (250 µl)
Delaware Inland Bays
650 nm
450 nm y = 0.0002x + 0.1007R² = 0.9933
y = 0.0001x + 0.0539R² = 0.9950
0.0
0.5
1.0
1.5
2.0
2.5
3.0
0.0E+00 2.0E+03 4.0E+03 6.0E+03 8.0E+03 1.0E+04 1.2E+04
Op
tica
l D
en
sity
cells well-1 (250 L)
NZ Clone CAWR04

What if I preserve a sample and analyze
it later - will I get reliable results?
• Maybe, it depends upon the storage conditions
• Other questions: How do range/limits of detections compare? How does
culture age or nutritional status affect results? What about field sampling?
Figure: C. Doll

Take-Home Messages
• Algal blooms may be unsightly, but most are benign
• Some algal blooms are harmful (HABs) and pose mild to
severe health and environmental threats
• Recognizing the signs of a HAB and prompt reporting can
help safeguard public health
• Causative factors include poor flushing and stagnation,
nutrient loading, and reduced predation
• Technology improvements are underway to expedite
sample processing and analyses

Acknowledgments
SCAEL Crew: Chuck Keppler, Lara Brock, Sarah Hogan, Suzie Kacenas,
Cameron Doll, Michelle Reed (& all former lab members)
Norm Shea, Priscilla Wendt (& all fishkill reponders), Jim Morris, Margaret Bergin,
Bob Van Dolah, Mary Ellen Williams, Kathy Coyne, & all who have assisted us over
the years.
SC Sea Grant, EPA, OHH, Kiawah Island Community Association, CDC, USC
Research Foundation, NOAA-MERHAB

Questions?
CONTACT INFORMATION:
Dianne Greenfield
843-725-4823
http://links.baruch.sc.edu/SCAEL/index.html