linking farmers to markets: realizing opportunities for ... sub-regional office for the pacific...
TRANSCRIPT

0
Sub-regional Office for the Pacific Islands
Linking farmers to markets: Realizing opportunities for locally produced food on domestic and tourist markets in Cook Islands
1
The designations employed and the presentation of material in this report do not imply the expression of any opinion whatsoever on the part of the Food and Agriculture Organization of the United Nations concerning the legal or development status of any country, territory, city or area or of its authorities, or concerning the delimitation of its frontiers or boundaries. The mention of
specific companies or products of manufacturers, whether or not these have been patented, does not imply that these have been endorsed or recommended by FAO in preference to others
of a similar nature that are not mentioned.
The findings, interpretations and conclusions expressed in this report are those of the authors and do not necessarily represent the views of FAO.
Linking farmers to markets: Realizing opportunities for locally produced food on
domestic and tourist markets in Cook Islands
May 2014

2
Changing the Mindset
“At the heart of our National Vision and NSDP 2011- 2015 is the transformation of our society to turn our National Vision into action. This transformation will only take place if there is a change in the mindset of the nation which addresses those traits that are likely to inhibit progress towards development. This change is vital if we are to capitalize opportunity in our size, our geographical makeup, our distance from markets and overcome our economies of scale.”
Guiding Principles – The Cook Islands Te Kaveinga Nui– page 15
3
Acknowledgements
The study team undertaking the research and compiling this report included Tim Martyn (FAO Policy Officer), Tuifa’asisina Steve Rogers (Consultant) and Fine Tu’itupou-Arnold (Consultant).
Many other people have contributed information and ideas that have been fed into the findings in this report. Thanks are extended to all stakeholders that generously provided time and information and shared their ideas with the study team. Particular thanks are extended to Mat Purea, Metua Vaiimene, Hugh Baker, John Scott, Gaye Whitta, Daniel Forsyth, Bob Taylor, Jon Beymer, Steve Anderson, Peter Tierney, James Webb, Tangata Tou and Steven Barrett who have willingly provided valuable information and advice on request during the course of this study. Enua Pakitoa from the Cook Islands Statistics Office kindly provided a range of food trade statistics. Finally, thanks are extended to Patrick Arioka who efficiently assisted with mission logistics and meetings in Cook Islands.

4
Table of Contents Acknowledgements ....................................................................................................................................... 3
Acronyms and Abbreviations ........................................................................................................................ 5
Executive Summary ........................................................................................ Error! Bookmark not defined.
1. Introduction to the Cook Islands Agriculture Sector……………………………………………………………………….12
2. Food import trends and opportunities for import substitution. ........................................................ 15
3. Facilitating increased investment in the adoption of more efficient farming systems ................ Error! Bookmark not defined.
4. Improved marketing and market information capacity......................... Error! Bookmark not defined.
5. Improved co-ordination of policy and regulatory reform...................... Error! Bookmark not defined.
6. Conclusions ......................................................................................................................................... 41
Annex 1: Key actions to realise opportunities for food import substitution .............................................. 44
Annex 2: Domestic fruit and vegetable market value chain .......................... Error! Bookmark not defined.
Annex 3: Model of a health tax based on fat and salt content................................................................... 45
Annex 4: List of parties consulted…………………………………………………………… …………………………………………….58
Annex 5: References …………………………………………………………………………..…………………………………………………60

5
Acronyms and Abbreviations
ADB Asian Development Bank AUT Auckland University of Technology BCI Bank of Cook Islands BTIB Business Trade Investment Board CC Chamber of Commerce CIF Cost Insurance Freight CISO Cook Islands Statistics Office CITC Cook Islands Trade Company CITC Cook Islands Tourism Corporation CITIC Cook Islands Tourism Industry Council FAO Food and Agriculture Organization GDP Gross Domestic Product GFDRR Global Facility for Disaster Reduction and Recovery HIES Household Income and Expenditure Survey Hydro Hydroponics IOs International Organization MFEM Ministry of Finance and Economic Management MOA Ministry of Agriculture MOE Ministry of Education MOH Ministry of Health NCD Non-Communicable Disease NZ New Zealand NZTRI New Zealand Tourism Research Institute NSDP National Sustainable Development Plan NZD New Zealand Dollar PCRAFI Pacific Catastrophe Risk Assessment and Financing Initiative PICs Pacific Island Countries SMEs Small and Medium Enterprises SPC Secretariat of the Pacific Community TGA Titikaveka Growers Association WB World Bank WHO World Health Organization

6
Executive Summary
Over the past 20 years, the agriculture sector in the Cook Islands has undergone a significant transformation. The value of imported food consumption per capita has more than doubled, and foreign exchange generated from food and beverage exports has plummeted to just over NZ$3 million. As Cook Islanders of working age have increasingly moved from the Outer Islands to Rarotonga and from Rarotonga to New Zealand, participation in the agricultural activities has fallen dramatically. Growth in the tourist and the service sectors of the economy has effectively raised wages higher than the agriculture sector can profitably pay, resulting in the migration of labour to other sectors. In addition, increased investment in these industries has resulted in rising land values and the conversion of agricultural land into land for the tourism and residential property developments. Whilst a small but vibrant agribusiness sector remains, competition from more efficient producers in Asia and the Pacific Rim have priced primary sector products from the Cook Islands out of export markets, and many domestic markets.
Unlocking the potential of the agriculture sector in the Cook Islands will require significant reorientation towards production of fruit and horticultural products for domestic markets, including tourism. Critical to servicing this market, however, is the adoption of farming systems capable of producing a consistent, high quality supply. The high cost of finance in the Cook Islands, and the threat of uninsured losses due to natural disasters, is a major impediment to the level of investment required to effect this reorientation. Improved market information and information on market demand is also required to assist the agriculture sector to better co-ordinate production to meet domestic demand specifications. Tariff, tax and regulatory policies governing the importation and sale of agricultural products and inputs which promote the consumption of nutritious locally produced food throughout the year, as well as provide access to lower cost farm inputs, will offer additional security to agriculture sector investments. Finally improved public-private sector dialogue and collaboration between the agriculture sector, tourism and key partner Ministries, will help to improve co-ordination of food policy interventions.
At the request of the Government of Cook Islands the Food and Agriculture Organization (FAO) was asked to help identify the specific policy, regulatory and programmatic interventions that would help the agriculture sector realize opportunities for locally produced food on domestic and tourist markets, in order to reduce food import dependence. This report presents those recommendations, and the evidence which supports them.
Objective 1: Facilitating increased investment in the adoption of more efficient farming systems
The competitiveness of the agriculture sector is undermined by the relative scarcity of agricultural land and high cost of agricultural labour located in proximity to the major domestic markets. Consequently, a major focus of the Government of Cook islands import substitution policy should be facilitating the

7
adoption of new technologies which reduce dependence on these two inputs. In addition the lack of off-season production is a significant barrier to local proudcers capturing a greater proportion of local demand.
To realize import substitution opportunities through increased agricultural productivity and extended growing seasons will require a transformation to knowledge intensive, land and labour-saving approaches to farming. This will require capital investments in the adoption of new farm technologies. The Government of Cook Islands need to implement programs and policy reforms to create a more enabling environment for investment in commercial agricultural production and processing. To encourage investment in the adoption of new technologies which increase off-season supply, as well as processing technologies which would help to provide a market for second grade fruit and vegetable products during periods of oversupply, there is an urgent need for the introduction of: (i) a low interest loan facility for agribusiness development; (ii) tax breaks for primary producers and the ability to quickly write off the value of capital investment for agricultural equipment (100% depreciation); (iii) disaster risk insurance for agribusiness infrastructure and equpipment.
Recommendation 1: The Business Trade and Investment Board (BTIB), the Ministry of Agriculture (MOA) and the Ministry of Finance and Economic Management (MFEM), together with the Bank of Cook Islands (BCI) and partner International Organizations (IOs), should develop a proposal for dedicated low interest loan product for agribusiness development.
Recommendation 2: The BTIB, together with the MOA and MFEM and partner IOs, should develop a proposal for the reform of the Cook Islands Tax code to render all investment in capital equipment for agriculture 100 per cent depreciable over three years for tax purposes.
Recommendation 3: MFEM in cooperation with MOA and BCI should develop a proposal for establishing a private sector ‘disaster risk’ agriculture insurance facility to reduce the risk of capital investment in agriculture.
Financing agriculture is more effective, and hence less risky, when it is part of a broader package that combines both financial and non-financial services to the farmers with the objective of building business management skills, improving yields and quality (through access to better inputs and extension) and ensuring access to markets for selling farm produce. Assisting banks to look at farmers within their value chains and combining the resulting information into financial packages should also help in reducing risks and costs. Consequently it is critical that the Cook Islands develop: (i) information tools to assist financial institutions and agriculture sector stakeholders to identify the gross margins that can be expected from these new approaches to fruit and vegetable production; (ii) a public-private sector program for the identification of ‘best bet’ agribusinesses for the receipt of low-interest loans; and (iii)a technical assistance package aimed at the adoption of off-season production technologies and use of hydropic and semi-hydroponic technologies, covered agriculture and mechanized farming systems, as well as mentoring assistance on business planning and management.

8
Recommendation 4: In order to facilitate economic and financial feasibility assessments for business planning and to strengthen the business case for loan applications the MOA should, in partnership with IOs, prepare a farm manual containing gross margin analysis for all key crops and farm budget information.
Recommendation 5: The BTIB and MOA working in partnership with the Tourism Industry Council, Chamber of Commerce and the Titikaveka Growers Association (TGA), with support by partner technical agencies, should put together a portfolio of bankable agribusiness projects.
Recommendation 6: The MOA, together with assistance from partner IOs, should develop a proposal for the development of a technical assistance package designed to assist with: the selection and dissemination of off-season varieties of vegetable and fruit products in demand on the domestic market; the transfer of knowledge on off-season production technologies, including hydroponics, semi-hydroponics and covered agriculture.
Objective 2: Improved marketing and market information capacity
The paucity of market information and market intelligence on future domestic demand undermines the monitoring and evaluation of farm production trends, farm production planning and effective coordination of supply of farm produce to the domestic market. Domestic market price and volume data can be used to monitor food production trends and the implementation of sector plans; as well as provide vital information on the contribution of the agriculture sector to the national economy. The Cook Islands Statistics Office (CISO) is currently reviewing its long term strategy for statistics collection for each sector, which provides a unique opportunity for the MOA to work with CISO to ensure the inclusion of a provision for a weekly or monthly Market Survey in the National Stragey for the Development of Statistics (NSDS).
Recommendation 7: The MOA should work with the CISO to institutionalize the production of a weekly or monthly domestic market survey (volume, prices and demand) and publishing of this information in a regular report, as part of the NSDS.
Inability to consistently produce and deliver the required quantity and quality of fresh fruits and vegetables required by retail, hospitality and tourist markets is a critical challenge for the agriculture sector in the Cook Islands. However tourist and retail outlets have cited a willingness to share information on their present and future demand for these products (quality and quantity) in a systematic way, as long as they can interact with one or a small number of institutional intermediaries. There is a need for facilitated support to establish strategic alliances that better ensure good coordination between supply and demand.
Recommendation 8: The BTIB and the CITC should work together with the CITIC and the MOA and the TGA to develop a pilot scheme for collecting forecasts of future demand (quality and quantity) for

9
select fruit and vegetables products from participating hotels and retail outlets, and co-ordination of supply.
Providing promotional benefits to tourism and retail outlets for their use of local food products, is essential for driving increased demand for local produce and encouraging their participation in schemes designed to promote greater co-operation between growers and local buyers. Fresh and locally sourced food is a central component of the tourist experience, and therefore customer feedback; however there are currently few hospitality businesses in Cook Islands focusing on improving the “cuisine experiences” of their guests by incorporating locally produced food into their menus. Cook Islands tourism outlets should be offered additional marketing benefits for menus and ‘cuisine experiences’ involving local food.
Recommendation 9: The CITC, CITIC, the BTIB and MOA should build a promotional campaign around the use of local fresh produce in the food and beverage experience in Cook Islands by inviting tourism operators and chefs who are particularly innovative in their use of local food to identify some initiatives to help differentiate the Cook Islands tourism brand as a destination offering a superior ‘cuisine experience’ to other Pacific Islands
3. Improved co-ordination of policy and regulatory reform
In order to help achieve the implementation of policy and regulatory reforms required to achieve improved food security, the Cook Islands needs to establish a high level, multi-sector statutory body to offer the full range of public and private sector stakeholders in food production and consumption, a formal policy role. This should result in better policy and development outcomes. This body, identified here as the Food Policy Council, should be established in order to address the emerging NCD crisis in the Cook Islands by introducing practical measures to encourage increased consumption of locally produced, nutritious food in order to reduce obesity rates. This statutory body should be given the responsibility for designing and implementing the policy, regulatory and programmatic reforms presented here, among other identified priorities.
Recommendation 10: The MOA should join with the Ministry of Health, MFEM, BTIB and Office of the Prime Minister to facilitate the establishment of Food Policy Council to design and implement whole of government policy measures to address the strategic issues common to food production and consumption trends in the Cook Islands; and to enhance co-operation between the public and private sectors.
Increasing the consumption of fresh local fruits and vegetables among Cook Islanders, and reducing their consumption of imported processed foods high in salt, fat and sugar has been recognized by government as an important strategy in the prevention and control of Non-Communicable Diseases (NCDs). The Cook Islanders has already shown its willingness to use price disincentives to deal with obesity and NCDs by implementing a tax on the sugar content of soft drinks; in addition to alcohol and

10
tobacco. However in order to arrest the dramatic increase in obesity, consumers should also face disincentives for the consumption of food and beverage products which have a negative impact on obesity. These are identified as food and beverage products for which one serve contain rates of salt (sodium) and trans fat which are significantly higher than the daily recommended intake. Revenue raised from this ‘health excise’ should be directed to improving the affordability of fruits and vegetables. The introduction of a trial free school lunch program which provides each school student with a daily serve of fruit (fruit plate), in order to establish healthy consumption habits among the nation’s youth, is one example of a practical and affordable program which should be the flagship policy of the Food Policy Council. In order to facilitate the introduction of this excise, the Food Policy Council should work with partner International organizations to develop an implementation plan for this policy which would include: i) identifying food products of which a single serve exceed the daily minimum requirements for sodium, trans fat and sugar; ii) analyzing the impact of a 20% excise on these products on their consumption, and an accurate estimation of the revenue such as excise would raise for investment in encouraging the consumption of health alternatives; iii) developing cost effective proposals for improving access of at risk groups to affordable fruit and vegetable products.
Recommendation 11: The Food Policy Council should lead the consultation for and implementation of a ‘health excise’ on food products with a negative impact on NCDs, and the identification of priority programmes for facilitating improved access to healthier substitute propducts (such as through the proposed free school fruit-lunch program).
Despite having a very liberal trade regime the government has maintained tariff protection for selected fruit and vegetables produced locally. An import tariff is levied on imports of fruits (of up to 75%) and vegetables (of up to 25%) during the period September 1st through to 30th November in order to help improve the competitiveness of local production versus imports during this off-season ‘shoulder’ period. However, several of the products included in the protected group can be grown with appropriate farming methods over a more extended period of the year (e.g. December to February). The provision of temporary price protection would provide an additional incentive for investment in the adoption of off-season production technologies. Therefore it would be advisable for the Food Policy Council to review the impact of an extension of tariff protection for select fruit and vegetable products to the off-season months (Dec-Feb) on the competitiveness of local production vs imports; and in light of this analysis, consider whether this reform should be part of the package of incentives to be offered to encourage investment in off-season production.
Recommendation 12: The Food Policy Council should review the import tariff regime currently in place for fruit and vegetable produce with a view to better aligning it to support improved competitiveness of local off-season production.
The agriculture sector is identified as the single largest consumer of water, with estimated daily use of 4,600 m3. Ensuring a regular supply of low cost water is essential to improving the reliability and quality of agricultural produce in the Cook Islands. The introduction of water efficient irrigation systems will be

11
essential if the agriculture sector is to supply the domestic and tourist markets during the season of highest demand: the drier ‘winter’ months during the middle of the year. However the government is poised to implement a major upgrade of the Rarotonga water supply infrastructure coupled with a user-pay system which may significantly increase the cost of water consumption to the agriculture sector. Any significant increase in the price of water paid by farmers would negatively impact their competitiveness, and reduce incentives for capital investment in water-intensive technologies (such as irrigation and hydroponic systems) central to the future of agribusiness in the Cook Islands. As a result it is critical that the sector develop a clear strategy for agriculture water use and supply which would ensure that farmers continue to access competitively priced water inputs within the proposed system.
Recommendation 13: the Food Policy Council should develop a strategy for the supply of competitively priced water to the agriculture sector through the proposed Te Mato Vai project. Given the proposed timeframe for the beginning of this project, this recommendation should be implemented as a priority.
In order to reduce the cost of farm inputs, and the impact of emissions on public health and branding of the Cook Islands as a clean and green destination, the Government of Cook Islands should introduce legislation to regulate, and eventually eliminate, burning off of green waste on Rarotonga. The municipal council should be the initial target of regulation. The Titikaveka Growers Association (TGA) currently produces compost fertilizer at a significantly cheaper price than imports. However the effectiveness of this farm inputs suffers from a deficit of green waste. Given the council is responsible for maintaining public sites and removing green waste, and the TGA have provided a designated dump site for green waste, the council should be required to deliver green waste to this site (rather than landfill).
Recommendation 14: the Food Policy Council should recommend the introduction of a ban on burning of green waste and requiring the delivery to the TGA compost site.
In order to provide a strategic and legislative framework for the new policy and programmatic framework of MOA, the Ministry needs to work with other stakeholders on the Food Policy Council to develop and adopt a long-term policy, and plan for the sector. This plan should inform a review of the Ministry of Agriculture Act (1978) in order to ensure compliance of this legislative framework with this new Agriculture sector plan.
Recommendation 15: the Food Policy Council, with the assistance from partner IOs, should develop a new long-term strategic plan and policy for the Cook Islands MoA.
Recommendation 16: The Food Policy Council, with the assistance from partner IOs, should undertake a review and reform of the Ministry of Agriculture Act (1978), subsequent to the development of the Agriculture Sector Policy and Strategic Plan.
12
1. Introduction to Cook Islands Agriculture Sector
The Cook Islands consists of 15 islands with a land area of 237 square kilometres scattered over 2 million square kilometres of the South Pacific Ocean. The islands are split geographically into the Northern Group and the Southern Group. The main island, and seat of Government, is Rarotonga in the Southern Group. It is also the single largest island with a land area of 67 square kilometres and a resident population of 10,572 (CoPD 2011). Other islands in the Southern Group have semi-regular transport and communications links with the capital, given they lie within 150 nautical miles of Rarotonga; and traditionally these islands regularly supplied agricultural products to the capital. Transport and communications links for the 1,112 person located in the Northern group are much less developed, given their small size and considerable distance from Rarotonga.
The combination of significant disadvantages of small land and population size, and distance from its principal trading partner (New Zealand), meant that the gradual market liberalization of the agricultural sector (beginning the 1980’s) has led to steady decline of the competitiveness of Cook Islands products – citrus, papaya and pineapple, as well as fruit juice - in export markets. 1 The loss of these export markets removed many of the income generating opportunities in the outer islands, and encouraged the wholesale migration of their residents to Rarotonga, and abroad. 2 As a result, the population of the Southern Group roughly halved between 1986 and 2011, and most of the remaining population are employed by the public sector.
The period 1986-2011 has also witnessed a significant increase in the number of visitor arrivals from 30,000 in 1986 to 113,000 in 2011 resulting in considerable new employment opportunities in the tourism industry. Rarotonga and Aitutaki island in the Northern group, have principally benefitted from significant growth in tourism, with rising wages encouraging Cook Islanders to move into education and employment opportunities outside of the agriculture sector. Tourism is now the single most important economic sector in the Cook Islands, contributing more than 44 per cent of GDP. In contrast, agriculture contributes less than 3 per cent of GDP.
As a result of this change, local food production in the Cook Islands has fallen sharply, contributing to a steady increase in dependence upon imported foodstuffs. Food imports have risen from NZ$10.3 million in 1986 to NZ$30 million in 2012 (Figure 1). In 2012, the per capita consumption of imported food of each of the 15,000 residents of the Cook Islands was valued at over NZD 2,000 (Figure 2)3.
1 In 2012 the value of CI total exports was NZD 6.52 million with fish (fresh & frozen) valued at NZD 5.31million; the only agriculture export was maire valued at NZD 54,000 , CISO Overseas Trade December Quarter 2012. 2 2011 Agriculture Census draft Report 3 Cook Islands Statistics Office

13
The dietary shift that has followed this transition has contributed to a rising rate of incidence of obesity, and diet related NCDs4. Furthermore, heavy reliance on food imports has increased Cook Island’s vulnerability to external food supply shocks and price volatility in global food markets5. As a result of this increased food insecurity, the Cook Islands has identified that the agriculture sector must refocus on improving its competitiveness and capacity to supply the domestic market for food products.
The sustained growth in tourism sector provides an important potential domestic opportunity for local agricultural producers. However Cook Islanders have been relatively unsuccessful at meeting the 4 The Cook Islands STEPS survey 2003/04 report showed that in the adult population aged 25-64 the prevalence of obesity was 61 per cent, prevalence of hypertension was 33 per cent, prevalence of diabetes was 23 per cent, and prevalence of elevated blood cholesterol was 75 per cent. 5 At the time of the 2008 global food price spike Cook Islands food inflation rate reached 10.8% (ADB, 2011)
-
5,000
10,000
15,000
20,000
25,000
30,000
35,000
40,000
1991
19
92
1993
19
94
1995
19
96
1997
19
98
1999
20
00
2001
20
02
2003
20
04
2005
20
06
2007
20
08
2009
20
10
2011
20
12
Figure 1: Imported Food (NZ$M) and Resident Population (000's)
Imported Food ($M)
Resident Population
0
500
1000
1500
2000
2500
Figure 2: Imported food per capita (NZ$)

14
minimum product quality and supply requirements demanded by the tourism industry. As a result, growth in the tourism industry has only compounded the food import dependence of the Cook Islands.
Consequently, the Food and Agriculture Organization (FAO) was requested to assist the government of the Cook Islands to identify the policy, regulatory and programmatic changes that would help improve the competitiveness of locally produced food on domestic and tourist markets, in order to reduce the nation’s food import dependence. This report provides 16 recommended actions, organized into 5 sections that will help the Cook Islands achieve this objective.
Section 2 provides background evidence of the food import trends in the Cook Islands, for selected commodities. Section 3 identifies the key constraints, and opportunities, for adopting technologies critical to improving the competitiveness of the production of these commodities. Section 4 provides evidence of domestic marketing opportunities, and methods to improve co-ordination of market intelligence, and marketing to the tourism sector. Section 5 provides a methodology for improving the co-ordination of the policy, regulatory and program interventions required to enhance synergies between public and private actors with a stake in improving the access of Cook Islands to nutritious, competitively priced food. Finally, Section 6 draws conclusions and a summary policy/program action matrix is presented in Annex 1.

15
2. Food imports trends and opportunities for import substitution
Meat and eggs
The Cook Islands meat imports were valued at approximately NZD 5.6 million in 2012 (Figure 3). After wheat and wheat products, import of meat products represent the largest share of Cook Island food imports. This evidence indicates that the greatest gains for food import substitution would come from investing in improving competitiveness in the livestock sector.
Source: Customs data provided by CISO
Despite a slight fall in meat imports in recent years, livestock production has fallen significantly in the Cook Islands over the last decade, with the number of households raising livestock declining by 38 per cent between 2000 and 2011; and the overwhelming majority (75 per cent) of livestock production in 2011 being for own consumption, or gifts. The impact of increased competition from livestock producers in Pacific Rim countries which enjoy scale efficiencies and cheaper feed costs, has made it extremely difficult for commercial livestock producers to maintain market share, without significant market intervention. A government decision to remove tariff protection on imported pork products in April 2014, however, seems to indicate an unwillingness to continue to intervene in this (and perhaps other) livestock markets. In addition as the scale of pork production has fallen and shifted from commercial to own consumption, the standard of commercial meat processing and storage facilities has fallen and is now no longer operational, making it extremely difficult for local producers to meet necessary quality and food safety standards required to supply retailers and hospitality markets.
Although there is no commercial broiler enterprise in Cook Islands there are commercial layer operations which have a proven capacity to produce and market eggs. This sector has also benefited
0
1,000,000
2,000,000
3,000,000
4,000,000
5,000,000
6,000,000
7,000,000
8,000,000
1991
19
92
1993
19
94
1995
19
96
1997
19
98
1999
20
00
2001
20
02
2003
20
04
2005
20
06
2007
20
08
2009
20
10
2011
20
12
Valu
e N
ZD
Figure 3: Cook Islands meat imports 1991-2012 (NZD)
All meat
pig
chicken
16
from border tariff protection6 until its very recent removal. With the tariff protection local eggs are price competitive with imported eggs and have a quality advantage over sea-freighted imports in terms of ‘freshness’ and shelf life. However, the levels of production achieved by the local egg industry have declined significantly from their peak (from 5000 eggs per day to 1000 per day) as result of difficulties accessing local retail markets (despite a price advantage)7.
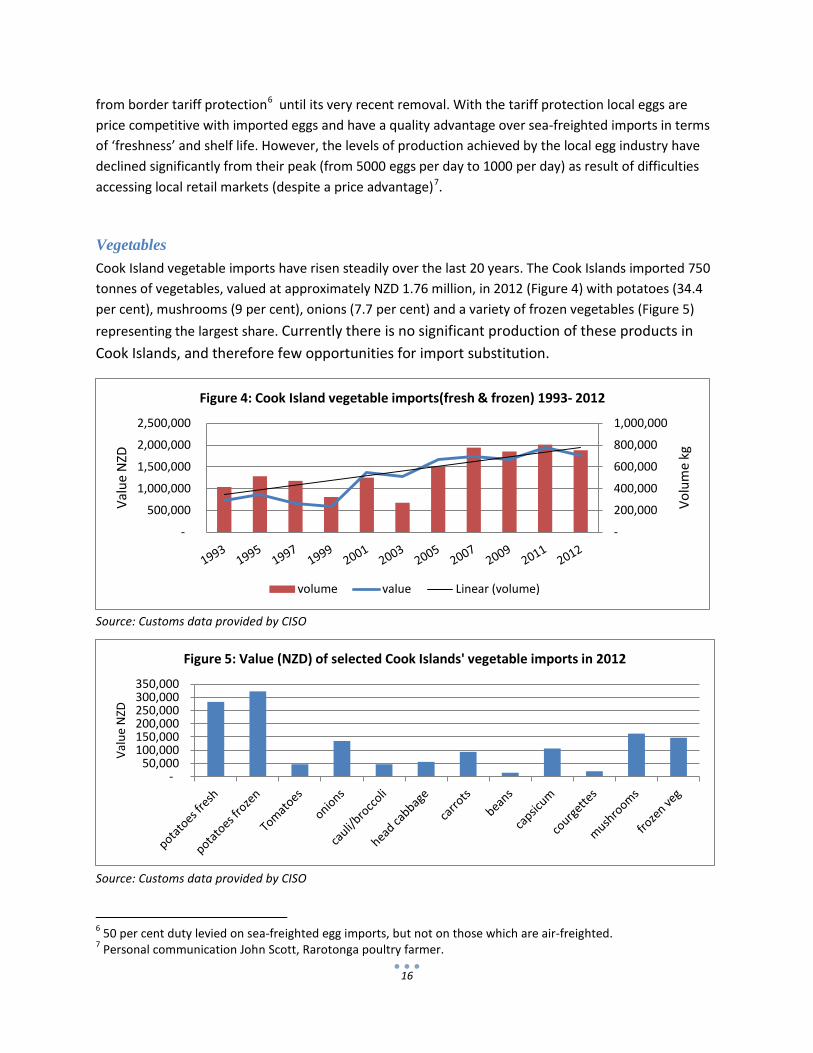
Vegetables Cook Island vegetable imports have risen steadily over the last 20 years. The Cook Islands imported 750 tonnes of vegetables, valued at approximately NZD 1.76 million, in 2012 (Figure 4) with potatoes (34.4 per cent), mushrooms (9 per cent), onions (7.7 per cent) and a variety of frozen vegetables (Figure 5) representing the largest share. Currently there is no significant production of these products in Cook Islands, and therefore few opportunities for import substitution.
Source: Customs data provided by CISO
Source: Customs data provided by CISO
6 50 per cent duty levied on sea-freighted egg imports, but not on those which are air-freighted. 7 Personal communication John Scott, Rarotonga poultry farmer.
-
200,000
400,000
600,000
800,000
1,000,000
-
500,000
1,000,000
1,500,000
2,000,000
2,500,000
Volu
me
kg
Valu
e N
ZD
Figure 4: Cook Island vegetable imports(fresh & frozen) 1993- 2012
volume value Linear (volume)
- 50,000
100,000 150,000 200,000 250,000 300,000 350,000
Valu
e N
ZD
Figure 5: Value (NZD) of selected Cook Islands' vegetable imports in 2012

17
Locally produced fruits and vegetables are competitive with other imported vegetables, however (Table 1). Indeed the data in Table 1 indicates that when in season, locally produced vegetables such as capsicums, cucumbers, courgettes/zucchini, tomatoes, lettuces – and locally produced oranges and lemons – are cheaper than imports.
Table 1: CIF, import trade and local trade prices for selected vegetables and fruit
Product 2012 Customs Import Data March 2014 Rarotonga Supermarket Trade Prices
Volume kg Value $ CIF $/kg Import trade price $/kg
Local product trade price $/kg
Potato 256,940 282,712 1.11 1.70 Onion 74,197 135,272 1.82 1.95 Carrot 86,003 94,016 1.09 1.80 Mushroom 13,141 162,962 12.40 19.70 Bean (vigna Spp) 3,060 14,987 4.90 13.20 Broccoli 4,010 27,001 6.73 13.60 Cabbage 29,161 55,989 1.92 3.70 3.40 Capsicum 7,419 106,912 14.40 16.00 10.00 Cucumber 478 3,479 7.28 12.50 3.20 Courgette 2,830 20,274 7.20 12.45 6.80 Tomato 6,985 47,361 6.70 8.50 5.00 Lettuce 828 8,561 10.34 (var.?) 8.50 (ice berg) Lettuce 6.35 (NZ bag) 3.50 (Hydro bag) Orange 13,783 47,778 3.47 5.20 3.30 Lemon 249 1,066 4.28 13.15 4.00 Pineapple 3,885 15,440 3.97 9.40 7.50 each
Sources of data: 2012 Customs data provided by CISO; CITC and/or Prime Foods trade prices March 2014
Figure 6 indicates that the Cook Islands has already been successful in substituting imports of a select number of vegetable commodities (e.g. ,lettuce and tomato) and that there is significant fluctuation in import values for other products, indicating a latent, but inconsistent, local capacity for import substitution of vegetables.
Source: Customs data provided by the CISO
-
50,000
100,000
150,000
200,000
Valu
e N
ZD
Figure 6: Cook Islands selected vegetable imports 1991-2012
Tomatoes
Cabbage, cauliflower, broccoli
Lettuce
Carrots

18
In order to secure local supply contracts, retail chains and tourism outlets also consider the quality
characteristics, as well as consistency of supply. The adoption of modern production technologies associated with lettuce and tomato production (e.g. hydroponics and semi-hydroponics) has been critical to the substitution of imports with a higher quality, local alternative. The success of the hydroponic producers Aroa Vegieland has encouraged other local operators to enter into the hydroponics market. However the cost of capital equipment, chemical inputs and technical knowledge required to operate these systems, are significant barriers to adoption of this technology. In addition, despite an increase in investment into the tourism industry and a rise in tourist numbers, it is uncertain how much unmet demand for existing hydroponic products (i.e. lettuce) is in the local market. The best opportunities for investment therefore lie in utilization of these systems for new vegetable products.
Fruits In 2012 Cook Islands imported 15.2 tonnes of fruit (and nuts) valued at NZD 730,728 (Figure 7). Similar to other food produce fruit imports have trended upwards over recent years, but there has also been some yearly variability possibly reflecting weather conditions for local fruit production; the peak in fruit imports in 2005 occurred in a year when Cook Islands experienced several cyclonic events.
Source: Customs data provided by CISO
- 50,000 100,000 150,000 200,000 250,000 300,000
-
200,000
400,000
600,000
800,000
1,000,000
1993 1995 1997 1999 2001 2003 2005 2007 2009 2011 2012
Volu
me
kg
Valu
e N
ZD
Figure 7: Cook Islands fruit imports 1993-2012
volume value Linear (volume)
Tomato cultivation in greenhouses
Aroa Vegieland hydroponic farm

19
The main imported fruit products are apples, grapes, oranges/mandarins and pears (Figure 8) More limited amounts of melons, pineapples, avocados and other tropical fruits are also imported (Figure 8). This implies that substituting fruit imports will require both improving supply and marketing of local tropical fruits, and also efforts to increase the consumer demand for Cook Islands’ tropical fruit varieties as opposed to the more common temperate fruit varieties currently being imported.
Tropical fruits constitute a clear area where local production should be competitive to imported substitutes and are a product range that is much in demand by the tourism sector. Local citrus fruits offer good opportunities for competitive import replacement as significant quantities of citrus (oranges, mandarins and lemons) are currently being imported.
Source: Customs data provided by CISO
The major barrier to local proudcers capturing a greater proportion of local demand (both fruits and vegetables) is seasonality in production. The tourist food hospitality market demands a consistent year-round supply of popular fruit and vegetable choices. The peak tourist season coincides fairly well with the main growing season for vegetables, but not for the main local fruits (Figure 9). However, tourist arrivals exceed 8,000/month for over 10 months of the year, thus the adoption of plant varieties and technologies to promote off-season production presents the best opportunity for food import substitution in the Cook Islands.
-
50,000
100,000
150,000
200,000
2007 2008 2009 2010 2011 2012
Valu
e N
ZD
Figure 8: Cook Islands selected fruit imports 2007-2012
apples pears grapes oranges/mandarin pineapple melon Avocado

20
Currently one local fruit orchard (Manea Nui Plantation) managed by an experienced fruit horticulturalist has by using appropriate technology and selection of varieties been able to provide a range of high quality tropical fruits throughout the year. This operation clearly demonstrates what can be achieved with a combination of knowledge and appropriate inputs. The MOA has already undertaken some work on extending floral induction technology for pineapples to farmers and this work should be expanded and also include other fruit varieties.
Increasing production, diversity and extending the season for fruit production also increases opportunities for processing into juice, nectar and pulp products. Fresh fruit juice production has already created opportunities for a small, but vibrant trade on the Punanga Nui Saturday market and sustained a longer-term enterprise processing papaya nectar which is marketed (in 1litre, 2litre and 5litre packs) locally and to the hotel/resort sector. This processing operation has been in business for over a decade and has also exported product. At peak production up
to 1,000 kg of papaya/week is processed, but constraints on throughput have been caused at times by insufficient supply of papaya fruits for processing8.
8 Personal communication Hugh Baker, Raro-Pacific
Figure 9: Cook Island Visitor Arrivals 2012-2014
Cool season vegetables …..Wet/Season fruits Hot…..
Fruit juice vendor at Saturday market
21
3. Facilitating increased investment in the adoption of more efficient farming systems
Increased competitiveness in the production of agricultural commodities in the Cook Islands, and the achievement of food import substitution, is currently constrained by the shortage of agricultural land and labour in close proximity to domestic markets for fresh produce (on Rarotonga). Subsequently it is critical to encourage investment in increasing the productivity of land and labour inputs through the adoption of capital intensives farming; and to adopt off-season production technologies in to extend the growing season, in order to provide increased returns to capital.
Land
Increased competition for land on Rarotonga from the tourism sector has significantly reduced the amount of vacant agricultural land, and therefore poses a challenge to increasing local agricultural production through extensive farming systems. At present, approximately 75 per cent of all agricultural land on Rarotonga is being cultivated by commercial farmers.9 However only 7 per cent of the land area used for farming is under freehold lease or license.10 An estimated 65 per cent of the land being used by commercial farmers is borrowed or customary, with the largest portion being borrowed.11 The proliferation of use rights to customary land among both resident and non-resident Cook Islanders has made it extremely difficult for commercial farmers to obtain leases for tracts of agricultural land of a size sufficient to obtain scale efficiencies from investment in broad acre, mechanized farming systems. In addition, the incentive for commercial farmers to invest their own resources to improve and develop borrowed land is significantly diminished, given the high rate of risk that the owner could reclaim the land without paying them compensation.
Whilst government recognizes the need for the introduction of legislation to address the impact of rapid demographic and socioeconomic change on land - such as the implementation of recommended procedures to address land fragmentation, absentee ownership and land development12; and negotiating long-term lease arrangements with off-shore landowners in order to establish a land-bank to open up to investors13 - these policy reforms will be politically difficult to achieve. Consequently, the facilitation of investment in land saving agricultural systems, such as hydroponics and covered agriculture, is critical to improving the competitiveness of the industry.
9 Cook Islands Statistics Office (2011) Agricultural Census 10 Ibid 11 Ibid 12 AusAid (2008) Making Land Work Vol.1: Reconciling customary land and development, Canberra, AusAID 13 Economic Task Force Report, Task Force Outcomes, Observations, Recommendations and Specific Actions, June 2011

22
Labour
Competition for labour from the public sector and overseas employment has significantly reduced the availability of efficiently priced surplus labour for the intensification of agricultural production in the Cook Islands. The cost of agricultural labour in the Cook Islands is among the highest in the Pacific Islands. Indeed, with the minimum wage in Cook Islands having been recently increased from NZD 5 to NZD6 per hour, wages in the Cook Islands are comparable with developed, rather than developing countries (e.g. US federal minimum wage of US$7.25 per hour). Despite the high minimum wage rate, Cook Islands employers are forced to sponsor labour from overseas (mainly from Philippines, China and Fiji) in order to take up vacant positions in industries such as tourism and agriculture, in return for significantly higher hourly wages than the minimum and the payment of large bonds, return airfares and other expenses. This has significantly raised the cost of agricultural labour, and labour-intensive agricultural production, in the Cook Islands. Furthermore, socio-cultural factors have restricted the use of foreign workers for agricultural ventures on some outer islands14.
Source: Cook Islands Statistics Office (2011) Agriculture Census
The demographic characteristics of Cook Islanders participating in the agriculture sector illustrated in Figure 10, indicates a high proportion of aged farmers in the sector. The mature age of many of the farmers in the Cook Islanders agriculture sector reduces both the efficiency of labour inputs and reduces the capacity of the agriculture sector to engage with more sophisticated markets such as tourism and supermarkets. As a result, the adoption of labour-saving technologies it is critical to the Cook Islands import substitution strategy.
14 Personal communication Marama Wigmore, Rarotonga commercial farmer.
15-19 20-39 40-59 60 and over Total 8 127 530 335 Male 8 122 495 304 Female 0 5 35 31
0 100 200 300 400 500 600
Num
ber
Figure 10: Cook Islands agricultural operators
-age structure of household members aged 15 and over

23
Capital
The high rate of interest charged on loans to the agriculture sector – 16.5 per cent for unsecured loans – is a significant barrier to the adoption of land and labour saving technology (hydroponic and drip irigation systems, coverings, tractors and trailer attachments), particularly for small and medium-sized farmers. Extending affordable finance to agricultural Small and Medium Enterprises (SMEs) will be essential to facilitating import substitution by enabling farmers to borrow to invest in purchasing the technological inputs required to increase returns to labour and land, while extending the fruit and vegetable growing seasons. The Bank of Cook Islands (BCI), in partnership with the BusinessTrade Investment Board (BTIB) have already gained experience of providing low interest loan products for the agriculture sector albeit at a mico-finance level (Box 1).
These agencies are now keen to see affordable loan products made more available to the agriculture sector to encourage viable business development. Availability of a suitable loan product (finance in the range of NZD 5 to 50,000 for the purchase of capital equipment, with maximum interest rate of 5 per cent) targeted at proven agriculture sector borrowers who have a viable business plan, and who are supported by business mentoring services and technical assistance on new technologies, would be an important catalyst for agribusiness development.
Recommendation 1: The Business Trade and Investment Board (BTIB), the Ministry of Agriculture (MOA) and the Ministry of Finance and Economic Management (MFEM), together with the Bank of Cook Islands (BCI) and partner International Organizations (IOs), should develop a proposal for dedicated low interest loan product for agribusiness development, utilizing a capital injection from an external party (e.g. EIB, IFAD, ADB).
Reducing the tax burden on the primary sector will also encourage a higher level of investment. In the recent past the government have promoted investment in tourism in the outer islands by making capital asset investments 100% depreciable over 2-3 years, allowing operators to reduce their tax payments in the first years after their initial investment, when repayments on a loan are highest. This same model could also be used to reduce the tax burden for the primary sector, which in many countries in the Pacific region is exempt from taxes. Tax holidays may also be considered for agribusinesses that make significant capital investments over a prescribed threshold level. This would encourage investment in the adoption of production technologies which increase off-season supply, as well as processing
Box 1: Agricultural Development Loan
The Business Trade and Investment Board has worked previously with the Bank of Cook Islands and the Ministry of Agriculture to provide a small stimulus loan (NZD 3,000 at 5% interest, payable within 12-months) to 31 farmers in the Cook Islands. Despite the limited period within which loans were to be repaid, BTIB/BCI received full repayment on 80% of the loans. The performance of these loans was therefore only slightly less than the average 85% rate of repayment experienced with mortages in the Cook Islands. Implementation of this scheme has also provided BCI with good background credit information on members of the agriculture sector which will help them select clients for future loans.

24
technologies which will help to provide a market for second grade fruit and vegetable products during periods of oversupply.
Recommendation 2: The BTIB, together with the MOA and MFEM and partner IOs, should develop a proposal for the reform of the Cook Islands Tax code to render all investment in capital equipment for agriculture 100 per cent depreciable over three years for tax purposes
One major barrier to investment in agriculture sector development in the Cook Islands, is the high rate of risk of damage to capital equipment as a result of the frequency of natural disasters (principally cyclones). In order to provide greater security to investment in capital equipment, the government of Cook Islands should investigate the feasbility of establishing a public-private agricultural insurance facility. The recent admission of the Cook Islands to the Pacific Disaster Risk Financing and Insurance Program (Box 2) and its access to the multi-million dollar Sovereign Disaster Risk Facility has effectively established an insurance fund to help Cook Islanders meet the capital costs associated with recovering from natural disasters.
Given that the sector which commonly experiences the highest rate of economic losses as a result of cyclones is the agricultural sector, utilizing these funds to establish a dedicated agricultural insurance fund would provide help facilitate greater investment in the sector. Insurance and government risk-sharing arrangements should increase a banks’ level of comfort and enable them to increase their lending rates to the agricultural sector.
Recommendation 3: MFEM in cooperation with MOA and BCI should develop a proposal for establishing a private sector ‘disaster risk’ agriculture insurance facility to reduce the risk of capital investment in agriculture.
In order to assist financial institutions identify loan applicants in the agriculture sector suitable for financing, it is important to provide them with information tools to improve their capacity to calculate
Box 2: The Pacific Disaster Risk Financing and Insurance Program
The Pacific Disaster Risk Financing and Insurance Program builds on the Pacific Catastrophe Risk Assessment and Financing Initiative (PCRAFI). PCRAFI is a joint initiative between the Secretariat of the Pacific Community SPC/SOPAC, the World Bank, and the Asian Development Bank, with financial support from the Government of Japan and the Global Facility for Disaster Reduction and Recovery (GFDRR). Development of Private Disaster Risk Insurance Markets The domestic property catastrophe risk insurance markets are currently under-developed in the South Pacific. This activity assists in the design of disaster risk insurance products, both sovereign disaster risk insurance for governments and disaster micro-insurance for households and SMEs. It provides insurance companies and other financial institutions with technical assistance to design and to implement parametric (based on size of the event) disaster risk insurance mechanisms in the PICs.
Source: World Bank program overview , September 2011

25
the profitability of agribusiness applications, and estimate likely rates of repayment. Similarly, in order to encourage stakeholders in the agriculture sector to invest in increasing production and productivity, it is essential to help them identify commodities offering the best rates of return on investment. Consequently, a priority for the Ministry of Agriculture should be the production of a Farm Manual containing calculations of Gross Margins for the production of the full range of commercial fruit and vegetable crops. These margins should include some sensitivity analysis in order to enable calculation of profitability for the full range of different input and output prices commonly experienced in the Cook Islands, in order to enable calculation for both peak and off-season, and allow for fluctuations in input prices due to changes in global commodity prices.
Recommendation 4: In order to facilitate economic and financial feasibility assessments for business planning and to strengthen the business case for loan applications the MOA should, in partnership with IOs, prepare a farm manual containing gross margin analysis for all key crops and farm budget information15 .
Global experiences in extending loan finance to agricultural SMEs have indicated that it is important to help financial institutions to identify bankable opportunities in agriculture in order to develop a pipeline of projects to provide financial service to16. Given the experience of the BTIB in identifying profitable enterprises in the Cook Islands and helping them to prepare farm business plans, it is critical that they work alongside agriculture sector stakeholders to identify a series of ‘best bet’ agribusiness enterprises and loan applicants to make first use of the low interest loan, in order to ensure the sustainability of the fund. The support of the Tourism Industry Council should be sought to help identify dedicated buyers in the tourism industry, and therefore increase the security of agribusiness loans.
Recommendation 5: The BTIB and MOA working in partnership with the Cook Islands Tourism Industry Council (CITIC) and the Titikaveka Growers Association (TGA), with support by partner technical agencies, should put together a portfolio of bankable agribusiness projects.
In order to ensure the sustainability of investments in off-season and capital intensive fruit and vegetable production, and the sustainability of the low-interest loan facility, it is critical to ensure that successful loan applicants have ongoing access to technical support on business planning and modern farming methods. In order to augment the MOA’s agricultural extension capacity, it is essential to work with partner International Organizations to acquire technical support for the full range of these new production technologies. In addition, successful applicants should also have access to technical support from agribusinesses overseas that have experience of incorporating these technologies into a profitable agribusiness. The Chamber of Commerce (CC) is currently implementing a business mentoring
15 Calculation of a gross margin is the essential first step in farm budgeting and planning. It enables you to directly compare the relative profitability of similar enterprises and consequently provides a starting point to deciding or altering the farms overall enterprise mix. It also provides a basis for determining a profitable farm gate price. 16 International Finance Corporation (2012) Innovative Agricultural SME Finance Models
26
programme (with support from New Zealand) and would be keen to see this extended to the agriculture sector17.
Recommendation 6: The MOA, together with assistance from partner IOs and the CC, should develop a proposal for the development of a technical assistance package designed to assist with: the selection and dissemination of off-season varieties of vegetable and fruit products in demand on the domestic market; the transfer of knowledge on off-season production technologies, including hydroponics, semi-hydroponics and covered agriculture; and agribusiness mentoring from private sector partners.
17 Personal communication Steve Anderson, President Cook Islands Chamber of Commerce
27
4. Improved marketing and market information capacity
Improved co-ordination of market information
The Cook Islands does not currently benefit from a market information survey capable of providing accurate agricultural product price and volume data. In the absence of the regular collection of this data, it is difficult to estimate the size of the Cook Islands domestic market beyond information derived from import data and indication of annual yield from the agricultural census held every 10 years. This makes it extremely difficult for agriculture sector stakeholders to develop farm business plans incorporating seasonal fluctuations in product prices. It also makes it difficult for stakeholders in Government to estimate the volume of production and size of agricultural GDP, and therefore measure the impact of policy and program interventions on the agriculture sector. Therefore in order to facilitate the provision of improved market information to farmers, as well as to facilitate improved monitoring and evaluation of the agriculture sector in order to enable the development of evidence-based policies, the Government of Cook Islands should introduce a regular market survey.
The MOA has indicated that the collection of market information in the future is a priority. The MOA has sought to carry out its own monitoring of price and product volumes at the Te Punanga Nui fresh produce market; however it does not have the capacity to institutionalize the collection of accurate data sufficient to inform both farmers and policy-makers with price and production trends. The Cook Islands Statistics Office (CISO) is the national authority with the legal mandate for the collection of statistics in the country. The CISO is currently preparing a National Statistics Development Plan (NSDP) in order to identify the statistical data needs of stakeholders in the country, and develop a long-term plan for their collection and dissemination. The MOA has been invited to outline its key information needs. The inclusion of a regular (weekly) market survey designed to collect both market prices and estimate national production volumes, should be a priority for inclusion in the NSDP.
Recommendation 7: The MOA should work with the CISO to institutionalize the production of a weekly or monthly domestic market survey (volume, prices and demand) and publishing of this information in a regular report, as part of the NSDS
Improved co-ordination of food marketing
In the absence of official data, demand for fruit and vegetable products by the tourism sector was estimated using weekly food purchase orders supplied by tourist resorts contacted by the study team. This information was used to estimate per capita consumption (Table 3)18.
18 Consumption data was calculated using information supplied by the Edgewater hotel. The Edgewater is the largest hotel/resort in Rarotonga with total capacity to sleep 732 guests (representing around 20 per cent of Cook

28
Table 2: Estimated Cook Islands tourist market consumption of selected vegetable and fruit products19
Item Price NZD/kg
7 day Consumption by 220 guests kg
Estimated 7 day consumption by all tourists Kg (column 2 x 13.13)
Estimated yearly consumption by all tourists Kg (column 3 x 52)
Value of yearly consumption by tourists NZD (column 1 x column 4)
Local vegetables
Cucumber 3.67 30 393.9 20482.8 75171.88
Snake bean 7 2.5 32.83 1706.9 11948.3
Broad bean 7 2.5 32.83 1706.9 11948.3
Capsicum 4 10 131.3 6827.6 27310.4
Tomato 3 40 525.2 27310.4 81931.2
Courgette 5 10 131.3 6827.6 34138
Pumpkin 2.5 50 656.5 34138 85345
Head cabbage 1 40 525.2 27310.4 27310.4
Bok Choy 4.55 11 144.43 7510.36 34172.14
Eggplant 1 10 131.3 6827.6 6827.6
Silver beet 4 25 328.25 17069 68276
Lettuce 8.8 50 656.5 34138 300414.4 subtotal veg
281 3,690 191,856 764,794
Fruits
Water melon 2.5 150 1969.5 102414 256035
Mango 2.5 50 656.5 34138 85345
Lemon 4 30 393.9 20482.8 81931.2 Lime 4 10 131.3 6827.6 27310.4 Rock melon 4 60 787.8 40965.6 163862.4
Pineapple 4 30 393.9 20482.8 81931.2
Banana 2.5 100 1313 68276 170690 subtotal fruit
430 5646 293,587 867,105
Grand Total
1,631,899
This approach finds that the tourist sector has an annual consumption of selected vegetable products of approximately 192 tonnes, at a value of over NZD 765 thousand; and demand for 294 tonnes of fruit valued at around NZD 867 thousand, every year (Table 3). The total value of the tourist market for this fresh food produce is therefore estimated to be over NZD 1.6 million; and that each tourist consumes on
Islands total bed capacity). The data presented in Table 3 below has been calculated based on information provided by the Edgewater Resort with 50% occupancy (i.e. 366 guests) and assuming that the resort has 60% of these guests regularly eating meals in their restaurants (i.e. 220 guests) 19 The calculation on total tourist consumption is based on a total tourist visitor arrival number of 121,20719 who stay on average 8.7 days19 in the Cook Islands. This equates to around 2,889 tourist visitors to feed each day of the year. The amount consumed by 220 tourist guests in one week is shown in Table 3 column 2. The estimated amount consumed by 2889 tourist visitors (all tourists consumption = column 2 x 13.13) in one week is shown in column 3, and the amount consumed by all tourists in one year (column 3 x 52 weeks) is shown in column 4. The value of consumption of each product is calculated by multiplying the kg consumption by price/kg of the food item (column 4 x column 1).

29
average about NZD 7.15 worth of fruit during an 8.7 day stay or 82 cents worth of fruit per day. Lettuces, cucumbers, tomato, pumpkin and silver beet are the most valuable vegetable markets; while water melon, banana and rock melon are the most valuable fruit markets (Table 3).
Whilst recognizing the limitations of the data in the above calculations of market demand, it is clear that food hospitality (i.e. hotels, restaurants, cafes) are a significant consumer of local fresh produce using at least 50% of the domestic commercial supply. Targeting this sector with a coordinated and consistent year round supply of a diverse range of quality fresh vegetables and fruits should therefore, be given a high priority in government strategy to grow commercial agriculture and reduce import dependence.
Data in the Cook Islands Visitor Survey20 indicate that 99 per cent of tourists visit a restaurant/ café during their stay and this is where they spend the most money; about 31 per cent (NZD 39) of their average daily spend of NZD 126 per day in 2013. The Visitor Survey also identifies that 84 per cent of tourists visit the local market and 69 per cent attend island night and feast events. Interestingly, almost an equal number of tourists cite their food and beverage experience as the least appealing aspect of their say (12 per cent) as those that cite it has the most appealing (11 percent).
The food hospitality sector accesses food supplies directly from importers and farmers and also to a lesser extent from all of the other intermediary retail/wholesale outlets. Whilst some of the hotel/resorts have established preferred supplier arrangements and do provide limited forward indication of their produce demand, formal contracts are not the norm. Furthermore, most farmers attempt to market their own produce with few ‘middlemen’ traders operating to coordinate (grade and sort) and link supplies to meet specific hotel/resort/restaurant demand. A consequence of these uncoordinated supply chains for local farmers’ produce has been summed up by the food hospitality sector as a situation of ‘feast or famine’.
Figure 11 presents a schematic representation of the main domestic outlets and supply chains for fresh produce in Rarotonga.
20 Cook Islands Visitor Survey Annual Summary Report April 2012-March 2013, and Cook Islands Visitor Survey Results July- September 2013; New Zealand Tourism Research Institute, Auckland University of Technology, 2013

30
Source: Adapted from Lafaele Enoka (2008) Report on Domestic Market Appraisal of Fresh Agricultural Produce
Whilst there have been some limited successes in coordinating fresh produce supply from farmers for specific events such as the South Pacific Mini-Games, no sustainable structure or coordination arrangement has evolved. It is considered that a private sector driven solution through direct strategic alliances (including forward orders and firmer contracts) between the tourist sector consumers and farmer/traders will be the most sustainable route to improved coordination between supply and demand (see Box 3).
Institutions (Hospital)
Village shop
Roadside stalls
Punanga Nui Market
Retail Supermarkets
Wholesale
Farmers
Imports
Food
hospitality Hotels
Restaurants Cafes
Domestic Consumers
Figure 11: Domestic fresh produce market supply chains

31
Of the 115 accredited accommodation options in Rarotonga only 16 have in-house restaurants. However these accommodation options account for 753 (or 66 per cent) of the total rooms on the island (Table 3)
Table 3: Structure of the Accredited Hospitality Sector in Rarotonga, Cook Islands Type of Suppliers Number Number
of Rooms Number of Beds
With Restaurant
Hotels/Resorts 15 500 1,924 12 Self-Catering 37 326 773 4 Holiday Rentals 55 202 450 Budget 8 119 297 Totals 115 1,147 3,444 16 Restaurants 26 26 Total Restaurants 40 Source: Cook Islands Tourism Corporation
Box 3: Sandals Resorts - success in sourcing local food from farmers The Sandals Group is a large all-inclusive resort chain with properties in Jamaica, Bahamas, St. Lucia and Antigua. Their approach to developing agricultural supply linkages has been quite distinctive, going beyond just increasing their own demand for local products.
Sandals’ Farmer Program in Jamaica began in 1996, with the aim of developing good working relationships between farmers and hotels by improving the quality of produce, developing proper pricing arrangements, and improving communications between farmers and hotels. Thus the initiative works across supply, demand and marketing. Key elements of the approach include:
A farmer extension officer, funded by Sandals, who works directly with farmers on improving production. Collaboration with various other organizations, particularly on agricultural support, including the Rural
Agricultural Development Authority (RADA) and Continuing Education Program in Agricultural Technology (CEPAT).
Hotel management staff visit farmers, holding and attending workshop days with them to discuss quality and marketing procedures. Farmers visit the hotels to see how their products are being utilized and why Sandals’ specifications are important.
A focus on improving pricing and contractual arrangements concerning volumes to be traded.
Problems have also been encountered. The initial problems for farmers were a) problems relating to production (e.g. lack of water supply; lack of packing material); and b) problems relating to sale of the produce (e.g. inconsistent supply orders; lack of communication). RADA played an active part in ensuring that the communication lines were active and the hotels were being informed two weeks before the delivery date as to what crops and volumes are available, thus guaranteeing supplies to the hotels while informing the farmers of demand in due time. In addition, a list of types, volumes and delivery prices of produce was agreed to by individual hotels and the respective farmer groups. This corresponded to a monthly supply order. Despite initial problems, progress has been made. The project began with ten farmers supplying two hotels, but increased to involve 80 farmers across the island; and sales rose from US$60,000 to $3.3 million within three years. Farmers’ income increased and became more reliable, while hotels have gained from a wider variety of good quality local produce and cost savings. The program subsequently expanded to St Lucia and Antigua.
Source: Pro-Poor Tourism, Brief No 3, ODI, UK
32
In order to improve the co-ordination of supply to the tourist sector, it is critical to combine improved market intelligence, with better farm production planning. The collection of market intelligence from participants in the tourism industry with an interest in increasing their use of locally produced food should be encouraged to supply ‘demand forecasts’ for fruit and vegetable products, to agriculture sector stakeholders. These demand forecasts should be developed using weekly food order sheets, combined with information on forward bookings, in order to identify the future volume of demand for select fruit and vegetable products for each resort, at least 6-months in advance. The BTIB could work with the Cook Islands Tourism Corporation (CITC) and Cook Islands Tourism Industry Council (CITIC) to collect this information and provide it to TGA (and others) to provide to reliable growers, so that they could better plan their production around this unmet demand.
Recommendation 8: The BTIB and the CITC should work together with the CITIC and the MOA and the TGA to develop a pilot scheme for collecting forecasts of future demand (quality and quantity) for select fruit and vegetable products from participating hotels and retail outlets, and co-ordination of supply.
Improved marketing of Cook Islands as destination for local ‘cuisine experiences’
Around the world cuisine is becoming one of the most important aspects of a defining holiday experience for tourists. Intensifying competition from other lower cost Pacific Island destinations means that the Cook Islands must differentiate itself in order to continue to attract a growing number of tourists. One method for achieving this would be to emphasize, through promotional materials, that visitors will enjoy local ‘cuisine experiences.’
Currently there are a few hospitality businesses in Cook Islands focusing on improved ‘cuisine experiences’ featuring locally produced food such as Island Living, Plantation House and the Progressive Dining Tour. The tourism industry has also supported training local chefs towards the development of menus offering unique dishes utilizing local ingredients.
The CITIC oversee the voluntary ‘Cook Island Quality Assured’ system, which gives accredited businesses access to CITC promotional activities and assistance for marketing. Developing a promotional campaign to offer additional marketing benefits for tourism operators committed to offering cuisine experiences to guests through the using local ingredients, would be one strategy for encouraging greater demand for local produce among tourist operators.
The CITC could successfully implement its Cuisine Strategy by offering operators in the tourism industry identified as displaying a particularly innovative approach to the use of local food, additional marketing benefits by featuring in their ‘cuisine experience’ campaign.21.
21 Personal communication Metua Vaiimene, Cook Islands Tourism Corporation.

33
Recommendation 9: The CITC together with CITIC, the BTIB and MOA should build a promotional campaign around the use of local fresh produce in the food and beverage experience in Cook Islands by inviting tourism operators and chefs who are particularly innovative in their use of local food to identify some initiatives to help differentiate the Cook Islands tourism brand as a destination offering a superior ‘cuisine experience’ to other Pacific Islands

34
5. Improved co-ordination of policy and regulatory reform
There is a need for improved coordination and coherence in the policy/regulatory framework governing the production and consumption of food in the Cook Islands. Improving national food security through better access to affordable nutritious food is a central development objective of the Government of Cook Islands, as well as of the Health and Agriculture sectors. Bringing actors from these sectors together within one statutory body capable of identifying and lobbying for the implementation of policy and reforms will be critical to achieving food import substitution in the Cook Islands. Stakeholders in Finance, Energy and Environment Ministries, as well as in the tourism and agribusiness industries, will also be critical to informing effective and coherent food policy. In order to more effectively communicate the shared interests of these stakeholders to high level Government decision-makers, it is critical to involve the Office of the Prime Minister in the implementation of policy and regulatory reforms. In order to spearhead the implementation of a coherent set of reforms designed to improve food security in the Cook Islands, the MOA should work to establish a Food Policy Council involving stakeholders from health, Finance, Energy, Environment; and from agribusinesses, farmer organisations and representative of the tourism industry.
Currently the Minister of Agriculture chairs a small informal forum that meets regularly to discuss sector development issues. This coordination group is an important initiative, and could be gradually expanded to include representatives from the Ministries, and industries, outlined above.
Recommendation 10: The MOA should join with the Ministry of Health, MFEM, BTIB and Office of the Prime Minister to facilitate the establishment of Food Policy Council to design and implement whole of government policy measures to address the strategic issues common to food production and consumption trends in the Cook Islands; and to enhance co-operation between the public and private sectors.
Enhancing synergies between health and agriculture policy
The leading causes of death in the Cook Islands are NCDs: diseases of the circulatory system; cancer and diabetes contributing to 80.4% of all causes of death in 201022. The Minister of Health’s Foreword Message in the Cook Islands National Health Strategy 2012-2016 stated:
“In view of the NCD crisis in the Pacific, the burden of NCD on our health services and the increasing number of premature deaths from NCD (75%) I am delighted that targeted interventions proven to reduce NCDs such as controlling tobacco; improving diets (reduction in salt, fat and sugar intake and increasing the consumption of fruits and vegetables); promoting physical activity; reducing alcohol intake; and
22 Cook Islands National Health Strategy 2012-2016
35
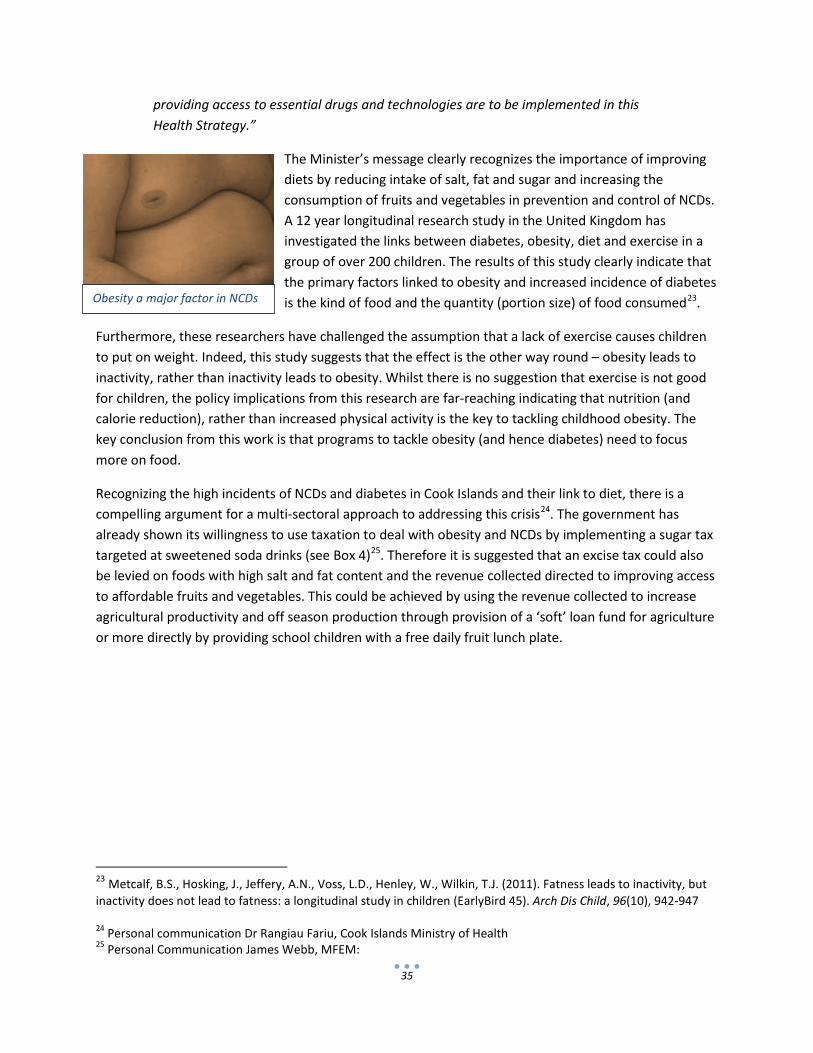
providing access to essential drugs and technologies are to be implemented in this Health Strategy.”
The Minister’s message clearly recognizes the importance of improving diets by reducing intake of salt, fat and sugar and increasing the consumption of fruits and vegetables in prevention and control of NCDs. A 12 year longitudinal research study in the United Kingdom has investigated the links between diabetes, obesity, diet and exercise in a group of over 200 children. The results of this study clearly indicate that the primary factors linked to obesity and increased incidence of diabetes is the kind of food and the quantity (portion size) of food consumed23.
Furthermore, these researchers have challenged the assumption that a lack of exercise causes children to put on weight. Indeed, this study suggests that the effect is the other way round – obesity leads to inactivity, rather than inactivity leads to obesity. Whilst there is no suggestion that exercise is not good for children, the policy implications from this research are far-reaching indicating that nutrition (and calorie reduction), rather than increased physical activity is the key to tackling childhood obesity. The key conclusion from this work is that programs to tackle obesity (and hence diabetes) need to focus more on food.
Recognizing the high incidents of NCDs and diabetes in Cook Islands and their link to diet, there is a compelling argument for a multi-sectoral approach to addressing this crisis24. The government has already shown its willingness to use taxation to deal with obesity and NCDs by implementing a sugar tax targeted at sweetened soda drinks (see Box 4)25. Therefore it is suggested that an excise tax could also be levied on foods with high salt and fat content and the revenue collected directed to improving access to affordable fruits and vegetables. This could be achieved by using the revenue collected to increase agricultural productivity and off season production through provision of a ‘soft’ loan fund for agriculture or more directly by providing school children with a free daily fruit lunch plate.
23 Metcalf, B.S., Hosking, J., Jeffery, A.N., Voss, L.D., Henley, W., Wilkin, T.J. (2011). Fatness leads to inactivity, but inactivity does not lead to fatness: a longitudinal study in children (EarlyBird 45). Arch Dis Child, 96(10), 942-947 24 Personal communication Dr Rangiau Fariu, Cook Islands Ministry of Health 25 Personal Communication James Webb, MFEM:
Obesity a major factor in NCDs

36
.
Research into the links between poor diet, obesity and increased risk of developing Non-Communicable Diseases over the last three decades, has led a number of constituencies to introduce levies on foods and beverages with high sugar, salt and fat content26. The result of these levies indicates that the best way to encourage healthy eating is to use revenue collected from public health taxes to make healthy substitute products cheaper, or more available27. Furthermore, research has found that the price of a product would need to be increase by at least 20% in order to make an impact on consumption volumes28. In this study, therefore, we present evidence of the potential revenue raised by a 20 per cent ad valorem import excise on a sample of 6 food products deemed to be very high in salt, saturated fat or sugar by nutritionists (see Annex 3 for full details). The study found that a tariff of 20 per cent was applied to just these 6 food products – canned mutton; spam; potato chips; instant noodles; butter; and cheddar cheese (representing less than 13% of total value of all imported food products) would be sufficient to collect over NZD 800,000 for programs to fight obesity, and improve the health of the nation (Table 5). A levy of 20 per cent on canned mutton alone – a product once kept artificially cheap through price controls, in order to encourage consumption – would raise in excess of NZD 300,000. This
26 Thow et al., 2010 27 Horgen, K.B., Brownell, K.D., 2002 28 Myton et al., 2012
Box 4: Estimation of potential revenue collected from a tax on sugar content in soft drinks
The Cook Islands government introduced a levy on soft drinks with high sugar content on April 1st 2014. This tax effectively switching the sweetened drinks levy from an ad valorem tariff (one based on the price of the good) applied to soft drinks at border, to a specific tax (one based on the quantity of sugar in the actual good) applied to all products consumed in the Cook Islands (Cook Islands Tax Review 2013). MFEM considered that specific taxes make the aims of the taxation policy clear by targeting the specific content in a product – in this case, sugar. This has resulted in the removal of an import levy on carbonated soft drinks (HS Code 22.02) of 77%, and the introduction of a tax of NZD9.80 per kg of sugar content in soft drinks. Coke 1.5 litre has 160grams of sugar, for example; this would add about NZD1.56 to the imported price of a 1.5 litre bottle of Coke, or a product with the same sugar content.
In 2012, there were 1,178,469 litres of carbonated soft drinks with sugar (not sweetener) added, valued (CIF) at NZD 1,596,882.95. The sugar content of these soft drinks ranges from 148g per litre for Fanta orange, down to 105g per litre for Sprite. Coke and Dr. Pepper were on the lower end of the scale at 114g per litre. Given the likelihood that more Coke was imported than Fanta, it has been assumed for the purpose of this estimation, that Coke (and a sugar content of 114g) is the average for all of the 1,178,469 litres of soft drink imported.
Applying the new sugar tax on 2012 soft drink imports implies that 1,178,469litres x 114g = 134,345.47 kg of sugar content in imported soft drinks would be taxed at NZD9.80/kg of sugar, providing NZD1,316,585.56 of revenue. Thus the revenue raising impact of the new tariff relative to the old 77% tariff previously applied (which collected NZD1, 229,599 on NZD 1,596,882.95 of imported sugar added soft drinks in 2012) would be an additional NZD86,985. Whist the new tax is unlikely to provide an additional disincentive for soft drink consumption, as it will not make soft drinks significantly more expensive, it is proposed to commit NZD200,000 of revenue raised from this public health tax, towards nutrition and NCD education in order to reduce the future burden of treating people suffering from NCDs on the health system.
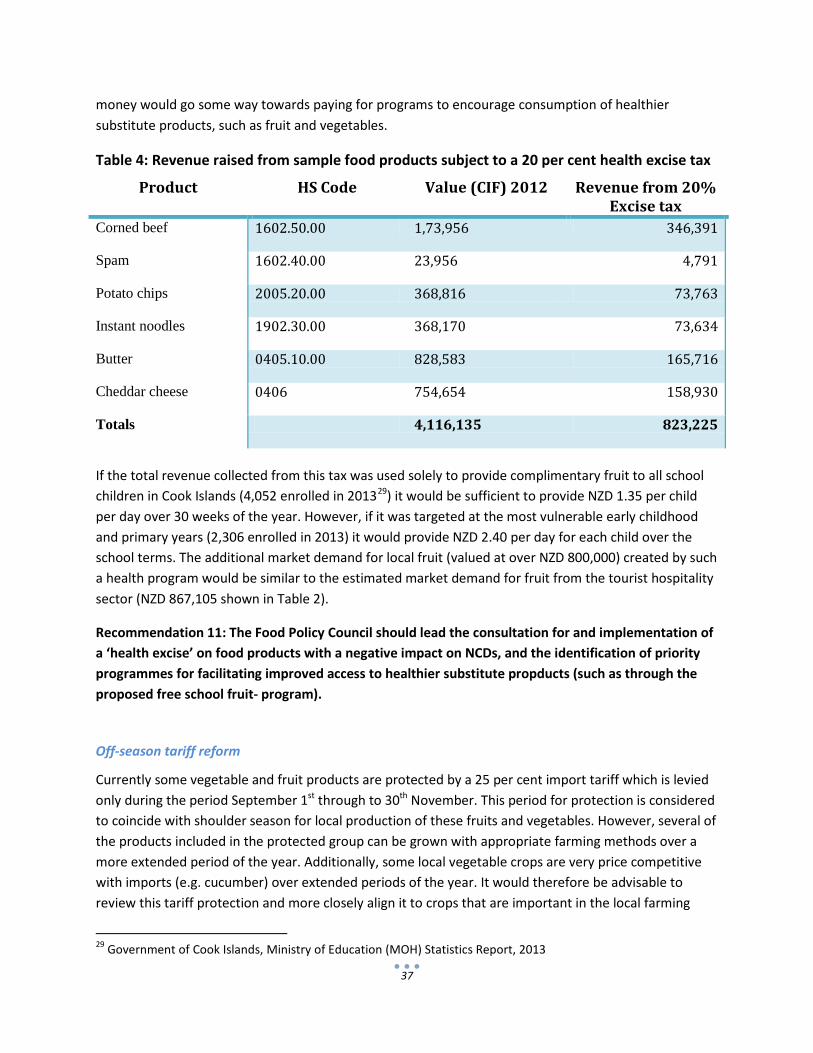
37
money would go some way towards paying for programs to encourage consumption of healthier substitute products, such as fruit and vegetables.
Table 4: Revenue raised from sample food products subject to a 20 per cent health excise tax
Product HS Code Value (CIF) 2012 Revenue from 20% Excise tax
Corned beef 1602.50.00 1,73,956 346,391
Spam 1602.40.00 23,956 4,791
Potato chips 2005.20.00 368,816 73,763
Instant noodles 1902.30.00 368,170 73,634
Butter 0405.10.00 828,583 165,716
Cheddar cheese 0406 754,654 158,930
Totals 4,116,135 823,225
If the total revenue collected from this tax was used solely to provide complimentary fruit to all school children in Cook Islands (4,052 enrolled in 201329) it would be sufficient to provide NZD 1.35 per child per day over 30 weeks of the year. However, if it was targeted at the most vulnerable early childhood and primary years (2,306 enrolled in 2013) it would provide NZD 2.40 per day for each child over the school terms. The additional market demand for local fruit (valued at over NZD 800,000) created by such a health program would be similar to the estimated market demand for fruit from the tourist hospitality sector (NZD 867,105 shown in Table 2).
Recommendation 11: The Food Policy Council should lead the consultation for and implementation of a ‘health excise’ on food products with a negative impact on NCDs, and the identification of priority programmes for facilitating improved access to healthier substitute propducts (such as through the proposed free school fruit- program).
Off-season tariff reform
Currently some vegetable and fruit products are protected by a 25 per cent import tariff which is levied only during the period September 1st through to 30th November. This period for protection is considered to coincide with shoulder season for local production of these fruits and vegetables. However, several of the products included in the protected group can be grown with appropriate farming methods over a more extended period of the year. Additionally, some local vegetable crops are very price competitive with imports (e.g. cucumber) over extended periods of the year. It would therefore be advisable to review this tariff protection and more closely align it to crops that are important in the local farming
29 Government of Cook Islands, Ministry of Education (MOH) Statistics Report, 2013
38
system and which can be grown over extended periods of the year, but struggle to be competitive with imports in off-season production periods because of higher input costs.
Recommendation 12: The Food Policy Council should review the import tariff regime currently in place for fruit and vegetable produce with a view to better aligning it to support improved competitiveness of local off-season production.
Water
Along with access to land an adequate water supply is essential for optimum agricultural production. During the drier cooler months of the year irrigation is essential to capitalize on the opportunity for extended season growth of crops. Hydroponic systems and farming in plastic tunnels and houses (which can protect crops from inclement weather conditions) also needs appropriate quality water supply and management. Currently water for agriculture is drawn from the general water reticulation system and no water use charges are being levied on domestic water supply.
However, the government is poised to implement a major upgrade of the Rarotonga water supply infrastructure and a reform of the institutions for water governance including a cost recovery policy implying a user-pay system. The ‘Te Mato Vai’ program, estimated to cost in excess of NZD 70 million, is supported by development partner grant (NZ) and loan finance (China). The agriculture sector is identified as the single largest consumer of domestic water with estimated use of 4,600 m3/day, representing 41 per cent of the total daily water usage30. Seasonal dry periods and droughts are fairly common and irrigation is required for successful crop production. Going forward a clear strategy for agriculture water supply and use will be required. Adoption of technology and practices to increase water use efficiency will be an essential part of a water strategy as any additional production costs related to water charges would further challenge the competitiveness of Cook Islands agriculture.
Recommendation 13: the Food Policy Council should develop a strategy for the supply of competitively priced water to the agriculture sector through the proposed Te Mato Vai project. Given the proposed timeframe for the beginning of this project, this recommendation should be implemented as a priority.
Farm Inputs
Increased investment in modern agricultural production systems in the Cook Islands will lead to an increase in the demand for farm inputs, such as fertilizers and agricultural chemicals, which are largely imported. The current retail price of recommended fertilizer mixes on Rarotonga, is some 40 to 50% higher than the retail price of the same fertilizers in New Zealand. The large difference between fertilizer prices in the two countries is major contributing factor in reducing the relative competitiveness of farmers in Cooks Islands. Despite attempts by both the MOA and large farmers to directly import whole shipping containers of fertilizer in order to eliminate the retail margin from their final consumption 30 Te Mato Vai – Water Supply Master Plan for Rarotonga, Table 5 (MFEM, 2013)

39
price, a price gap remains between the price of imported fertilizers and the cost of this input to farmers in competitor markets. In order to reduce the cost of fertilizers, therefore, it is necessary to facilitate local production.
The TGA currently produces bulk composted fertilizer at NZD 30 per cubic metre (or NZD200 for a 5 cubic metre truck delivery). However the effectiveness of the compost as a fertilizing agent is currently affected by an insufficient supply of green waste such as grass clippings and tree cuttings. At present, green waste is being burnt by the Municipal Council rather than delivered to a waste treatment facility. The TGA have offered to provide a green waste dump site, in return for free delivery. Considering the positive economic and environmental benefits of composting green waste, in addition to its contribution to local fertilizer, there is a clear role for Government regulation of burning of green waste. Encouraging green waste collection and delivery to
the TGA site by the council for composting would provide a win-win opportunity to improve Cook Islands environment and also provide a source of compost to enhance agricultural production.
In order to reduce the cost of farm inputs, and reduce the impact of emissions on public health and branding of the Cook Islands as a clean and green destination, the Government of Cook Islands should introduce legislation to regulate, and eventually eliminate, burning off of green waste on Rarotonga. The municipal council should be the initial target of regulation. The TGA currently produces compost fertilizer at a significantly cheaper price than imports. However the effectiveness of this farm input suffers from a deficit of green waste. Given the council is responsible for maintaining public sites and removing green waste, and the TGA have provided a designated dump site for green waste, the council should be required to deliver green waste to this site (rather than landfill).
Recommendation 14: the Food Policy Council should recommend the introduction of a ban on burning of green waste and requiring the delivery to the TGA compost site
Improved strategic planning and legislative framework for the agriculture sector
The MOA have already identified the need to prepare a new policy and legislative framework for the agriculture sector, therefore the Food Policy Council could provide a steering group for the formulation of a long-term strategy which aims to facilitate improved food security through improved access to affordable, nutritious food by increasing food important substitution by facilitating opportunities for investment in adoption of productivity enhancing technologies; improving the co-ordination of domestic market information and marketing; and through the adoption of evidence-based policy and regulatory reforms. The Ministry of Agriculture Business Plan would subsequently need to be revised so that the work program and budget allocation reflects the new sector strategic priorities.

40
Recommendation 15: the Food Policy Council, with the assistance from partner IOs, should develop a new long-term strategic plan and policy for the Cook Islands MoA.
In order to provide a strategic and legislative framework for the new policy and programmatic framework of MOA, the Ministry needs to work with other stakeholders on the Food Policy Council to review the Ministry of Agriculture Act (1978) in order to ensure compliance of the legislative framework with the new Agriculture sector plan.
Recommendation 16: The Food Policy Council, with the assistance from IOs, should undertake a review and reform of the Ministry of Agriculture Act (1978), subsequent to the development of the Agriculture Policy and Strategic Plan.
41
6. Conclusions
Over the last two decades the Cook Islands agricultural sector has experienced a rapid decline, matched by the rising level of food import dependency. Despite successive governments proclaiming that food import substitution is a priority, the MOA has not been able to implement a coherent set of policy, regulatory and programmatic reforms in order to achieve this goal. The growing domestic and tourist markets for fresh food produce in Rarotonga offer tangible opportunities for local producers. These markets should therefore be the primary focus of the agriculture sector, in order to increase rural income generation, reduce food imports and strengthen food security. Effectively limiting the escalation in obesity and NCD rates will require the introduction of targeted policies aimed at redressing the food price incentives faced by consumers, which at present encourage the consumption of food products which result in poor nutrition outcomes. Reducing the cost of local fruit and vegetables, through the facilitation of increased investment in the adoption of productivity enhancing technologies, and improved co-ordination of production and food marketing, is critical to winning the battle against NCDs in the Cook Islands.
The production of a consistent supply of quality, year-round fresh produce is the key to local farmers securing improved access to domestic markets, including tourism. This goal needs to be supported by sound technical, as well as business mentoring support. It also needs the support of a low-interest loan facility, and assistance with the identification of priority loan recipients. Improved access to local markets will be the result of the formation of strategic alliances between hotel chefs/purchasing officers, local suppliers, farmers and service suppliers from government, NGOs and the private sector, and through the identification of the marketing benefits of increased utilization of local food by the tourist industry.
In order to support the development, monitoring and evaluation of evidence-based policy, as well as facilitate the identification and articulation of priority investment opportunities, the Cook Islands must institutionalize the collection and analysis of market information and market intelligence. In order to facilitate the implementation of effective, multi-sector policies for improving food security, the Cook Islands needs to establish a multi-sector, high-level statutory body: the Food Policy Council.

42
Annex 1: Key Actions to realize opportunities for locally produced food on domestic and tourist markets
Action Area Specific Action Responsibility Possible Partners
Improved productivity
1) Develop a dedicated low interest loan product for agribusiness development.
2) Introduce tax policy provision to make all capital investment in agriculture depreciable for tax purposes
3) Introduce a private sector agriculture insurance model linked to the ‘Sovereign Disaster Risk Facility’
4) Prepare gross margin for all key crops and farm budget information in order to facilitate economic and financial feasibility assessments to strengthen business planning
5) Develop a portfolio of bankable agribusiness projects
6) Transfer knowledge and facilitate access to technology for “off-season” fruit and vegetable production and provide business skills training and mentoring support to agriculture entrepreneurs
BCI; BTIB; MFEM; MOA MFEM; BCI; MOA MOA; MFEM; MOA BTIB; MOA; BCI; CC MOA; BTIB;CC MOA
FAO; ADB WB; SPC WB; FAO SPC; FAO NZ; FAO SPC; FAO; NZ
Improved market co-ordination
1) Institutionalize a regular domestic market survey and quarterly report
2) Collect tourist sector demand information on fresh produce needs and use this to build strategic supply chain alliances
3) Build a promotional campaign around the use of local fresh produce in the Cook Islands cuisine (food & beverage) experience
4) Establish a school ‘fruit lunch’ program
CISO; MOA BTIB; CITC;CITIC;TGA CITC; CITIC; BTIB MOH; MOE; MOA; MFEM
FAO; SPC NZ WHO
Improved policy coherence
1) Establish a statutory Food Policy Council in order to co-ordinate the implementation of policy and regulatory reforms required to achieve improved food import substitution
2) Develop a proposal for the implementation of a border health tax based on salt and fat content of foods with a view to reducing consumption and raising revenue which can be directed to ecourage production and consumption of cheaper healthier substitute products
3) Review the import tariff regime for vegetables and fruits to better align it to support competitive import replacement
4) Formulate an agriculture water strategy
MOA; MOH; MFEM; PMO MOA; MOH; MFEM; PMO MOA; PMP MOA; MFEM
NZ; FAO WHO; FAO FAO FAO

43
5) Facilitate improved production of low cost fertilizer through regulation of green waste disposal
6) Commission the development of an agriculture sector plan
7) Commission the review of the Ministry of Agriculture Act (1978)
MOA MOA
NZ; FAO NZ; FAO
ACRONYMS: ADB – Asian Development Bank; BCI – Bank of Cook Islands; BTIB – Business, Trade & Investment Board; CC –Chamber of Commerce; CISO –Statistics Office; CITC – Tourism Corporation; CITIC – Tourism Industry Council; FAO – Food and Agriculture Organization; MFEM; Ministry of Finance and Economic Management; MOA – Ministry of Agriculture; MOE – Ministry of Education; MOH – Ministry of Health; NZ – New Zealand; PMO – Prime Minister’s Office; TGA – Titikaveka Growers Association; WB – World Bank

44
MONEY
VALUE ADDED GOODS
PRIVATE SECTOR ROLES
BASIC FUNCTIONS
CONTENT
INSTITUTIONS
SERVICE
PROVIDERS
POLICY/
REGULATORY/
PROGRAM
ISSUES
Importers Wholesalers
Retailers
Inputs Production Trade Primary
Processing
Secondary Processing Promotion
Farmers Traders Juice/ Food Processors
Food Hospitality Hotels/
Restaurants TOU
RIST CON
SUM
ERS
Fertilizers Ag Chemicals
Compost Equipment
Seeds planting mat.
Vegetables Fruits Eggs Meat
Vegetables
Fruits Eggs
Juices Purees
Chutneys Sauces etc.
Smoothies Fresh juices/cocktails
Snacks Meals
MOA Titikaveca Growers
Association (TGA)
MOA; BCI; BTIB; CC;
MFEM; CISO; TGA; PUA:
Power/ Water
MFEM; CISO; Customs;
Infrastructure; Transport BTIB; TGA
PUA: Power/Water
BCI/Banks
PUA: Power/Water
BCI; CITC; CITIC;
BTIB/Banks
Market competition, supply/price Govt. subsidy Proportion of imported vs local supply
Land access, Labour supply/cost;
Water access; Affordable finance;
Technical & business skills; Market information.
Market power, Trade/tariffs, Market information, Supply-demand coordination
Cost of utilities; Consistency in
supply of inputs; Food safety/
HACCP; Technical information;
Affordable finance
Local content vs imports; Promotion of local food
experience/ accreditation for local content; Chef
training to use local produce in menu choices
Annex 2: Domestic fruit and vegetable market value chain
45
Annex 3: Model of a health tax based on fat and salt content
What foods should a ‘health tax’ target?
According to the Australian and New Zealand Food Standard Code (FSC), a balanced diet (8700 kilijoules) for an average adult should include no more than the following levels of daily intake of saturated fat, sugar and sodium (http://www.foodstandards.gov.au/code/Pages/default.aspx):
• Sodium – 2300 miligrams • Saturated Fat – 24 grams • Sugar – 90 grams
Health authorities (USDA) considers that a serving of any food item which contains more than 20% of the recommended maximum daily intake of that ingredient, is considered to contain a high-level of that ingredient, and should be consumed only in moderation. However there are a large number of foods containing far more than this rate, and their consumption could therefore beneficially be reduced through the use of a tax.
Research into the impact of fat taxes shows that the price of a product would need to increase by at least 20% in order to make an impact on consumption volumes (Myton et al 2012). In this example we look at the revenue raising impact of the introduction of a tax that results in a 20% increase in the price of a sample of food products deemed to very high in salt, saturated fat or sugar by nutritionists. For the purposes of this study we have compared 10 prepared and fresh food products: tinned corned beef (Palm); tinned ham product (Spam); instant noodles (Maggi); salted potato chips (Bluebird); cheddar cheese (Mainland); salted butter; banana; avocado; tomato; and lettuce. A full description of the nutritional content of each of these products is included at the end of this Annex.
In order to compare the contents of each product, we select 100g as a sample serving size. While many products display a serving size that is lower than100g, this often obscures the serving sizes being consumed in the Pacific Islands and their real impact on health. Thus we used 100g as the standard size in order to provide a comparison between products. We highlight in the table below any product for which a 100g serve contains more than a third (33%) of recommended daily intake (RDI) of any of sugar, salt of saturated fat. There are six products - canned corned beef; canned spam; instant noodles; salted potato chips; cheddar cheese; and salted butter - selected that should be subject to a health tax.

46
Table: Contents of 100g serve of select food items
Food item Saturated Fat content Sodium Content Sugar Content
Grams % DRI Milligrams % DRI Grams % DRI
tinned corned beef 8.4 35 630 27 0 0
tinned ham product 10.5 53 1383 60 0 0
instant noodles 7.5 31 1188 52 3 3.3
salted potato chips 15.3 64 813 35 4.14 4.6
cheddar cheese 21 87.5 621 26 1 0
salted butter 51.36 257 643 28 0 0
banana 0 0 1 0 0 0
avocado 2 8 7 0 1 0
tomato 0 0 5 0 3 0
lettuce 0 0 8 0 1 0
Using 2012 official national import data, providing the total volume and value of each of these products that was imported into the country that year, we can investigate what revenue would be raised by applying a 20% ad valorem excise tax to imports of these products. The results are presented in Table 5 in the main body of the report and copied in the table below.

47
Table: Revenue raised from sample food products subject to a 20 per cent health excise tax
Product HS Code Value (CIF) 2012 Revenue from 20% Excise tax
Canned beef 1602.50.00 1,73,956 346,391
Spam 1602.40.00 23,956 4,791
Potato chips 2005.20.00 368,816 73,763
Instant noodles 1902.30.00 368,170 73,634
Butter 0405.10.00 828,583 165,716
Cheddar cheese 0406 754,654 158,930
Totals 4,116,135 823,225

48
Corned Beef Nutrition Facts Per serving size 100 grams
Amount Per Serving
Calories from Fat 142 Calories 248
% Daily Values*
Total Fat 16g 22%
Saturated Fat 8.4g 35%
Cholesterol 63mg 21%
Sodium 630mg 27%
Total Carbohydrate 0g 0%
Dietary Fiber 0g 0%
Sugars 0g
Protein 14g
Vitamin A -
Vitamin C -
Calcium -
Iron 6%
* Percent Daily Values are based on a 2000 calorie diet. Your daily values may be higher or lower depending on your calorie needs.

49
Spam Nutrition Facts Per serving size100g
Amount Per Serving
Calories from Fat 245 Calories 315
% Daily Values*
Total Fat 28g 38%
Saturated Fat 10.5g 53%
Trans Fat 0g
Cholesterol 123mg 41%
Sodium 1383mg 60%
Total Carbohydrate 3.5g 0%
Dietary Fiber 0g 0%
Sugars 0g
Protein 12.25g
Vitamin A 0%
Vitamin C 0%
Calcium 0%
Iron 2%
* Percent Daily Values are based on a 2000 calorie diet. Your daily values may be higher or lower depending on your calorie needs.

50
Potato Chips Nutrition Facts Serving Size 100 g
Amount Per Serving
Calories from Fat 337 Calories 547
% Daily Values*
Total Fat 37.31g 58%
Saturated Fat 15.3g 64%
Polyunsaturated Fat 12.17g
Monounsaturated Fat 9.84g
Cholesterol 0mg 0%
Sodium 813mg 35%
Potassium 1642mg
Total Carbohydrate 49.74g 17%
Dietary Fiber 4.4g 18%
Sugars 4.12g
Protein 6.56g
Vitamin A 0%
Vitamin C 31%
Calcium 2%
Iron 9%
* Percent Daily Values are based on a 2000 calorie diet. Your daily values may be higher or lower depending on your calorie needs. Nutrition Values are based on USDA Nutrient Database SR18

51
Instant Noodles Nutrition Facts Serving Size 100g
Amount Per Serving
Calories from Fat 163 Calories 450
% Daily Values*
Total Fat 17g 23%
Saturated Fat 7.5g 31%
Trans Fat 0g
Cholesterol 0mg 0%
Sodium 1188mg 52%
Total Carbohydrate 59g 20%
Dietary Fiber 2.5g 10%
Sugars 3g
Protein 7g
Vitamin A 0%
Vitamin C 0%
Calcium 10%
Iron 2%
* Percent Daily Values are based on a 2000 calorie diet. Your daily values may be higher or lower depending on your calorie needs.
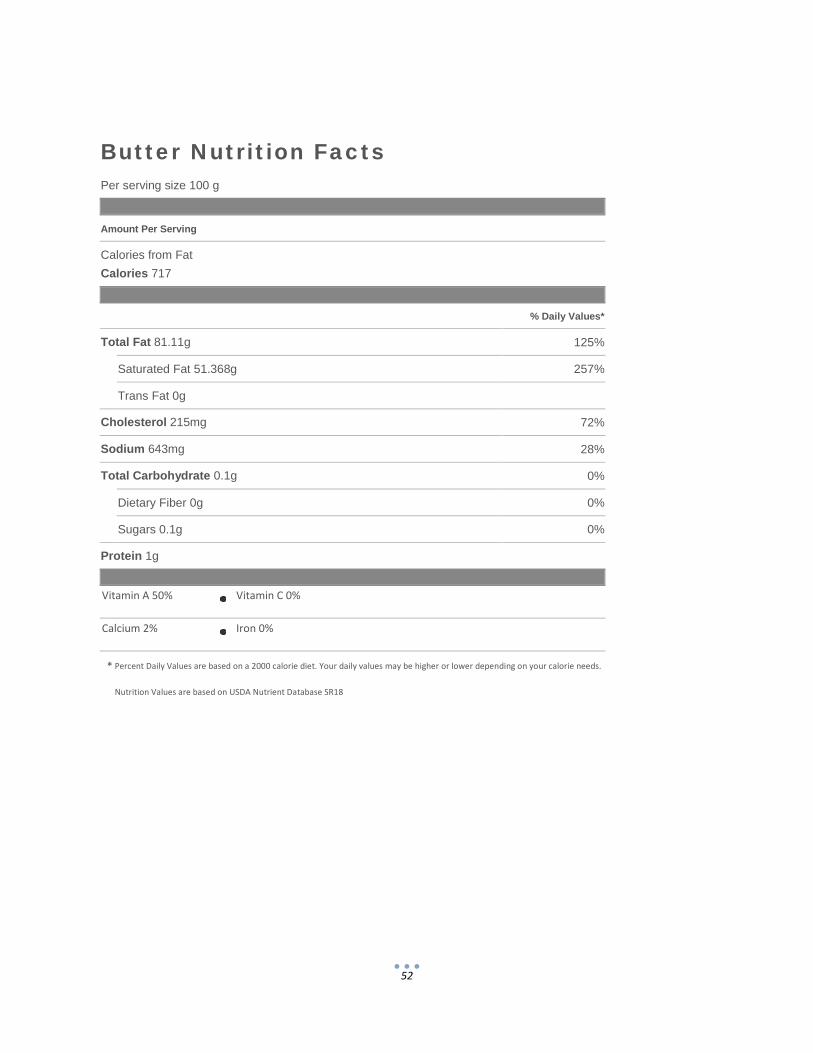
52
Butter Nutrition Facts Per serving size 100 g
Amount Per Serving
Calories from Fat Calories 717
% Daily Values*
Total Fat 81.11g 125%
Saturated Fat 51.368g 257%
Trans Fat 0g
Cholesterol 215mg 72%
Sodium 643mg 28%
Total Carbohydrate 0.1g 0%
Dietary Fiber 0g 0%
Sugars 0.1g 0%
Protein 1g
Vitamin A 50%
Vitamin C 0%
Calcium 2%
Iron 0%
* Percent Daily Values are based on a 2000 calorie diet. Your daily values may be higher or lower depending on your calorie needs. Nutrition Values are based on USDA Nutrient Database SR18

53
Cheddar Cheese Nutrition Facts Per serving size 100 g
Amount Per Serving
Calories from Fat 291 Calories 403
% Daily Values*
Total Fat 33g 51%
Saturated Fat 21g 87.5%
Trans Fat 0g
Cholesterol 105mg 35%
Sodium 621mg 26%
Total Carbohydrate 0g 0%
Dietary Fiber 0g 0%
Sugars 1g 0%
Protein 25g
Vitamin A 20%
Vitamin C 0%
Calcium 72%
Iron 4%
* Percent Daily Values are based on a 2000 calorie diet. Your daily values may be higher or lower depending on your calorie needs. Nutrition Values are based on USDA Nutrient Database SR18

54
Banana Nutrition Facts Per serving size 100 g
Amount Per Serving
Calories from Fat 3 Calories 89
% Daily Values*
Total Fat 0g 0%
Saturated Fat 0g 0%
Trans Fat 0g
Cholesterol 0mg 0%
Sodium 1mg 0%
Total Carbohydrate 23g 8%
Dietary Fiber 3g 10%
Sugars 0g 0%
Protein 1g
Vitamin A 1%
Vitamin C 15%
Calcium 1%
Iron 1%
* Percent Daily Values are based on a 2000 calorie diet. Your daily values may be higher or lower depending on your calorie needs. Nutrition Values are based on USDA Nutrient Database SR18

55
Avocado Nutrition Facts Per serving size 100 g
Amount Per Serving
Calories from Fat 123 Calories 160
% Daily Values*
Total Fat 15g 21%
Saturated Fat 2g 8%
Trans Fat 0g
Cholesterol 0mg 0%
Sodium 7mg 0%
Total Carbohydrate 9g 3%
Dietary Fiber 7g 27%
Sugars 1g 0%
Protein 2g
Vitamin A 3%
Vitamin C 17%
Calcium 1%
Iron 3%
* Percent Daily Values are based on a 2000 calorie diet. Your daily values may be higher or lower depending on your calorie needs. Nutrition Values are based on USDA Nutrient Database SR18

56
Tomato Nutrition Facts Per serving size 100 g
Amount Per Serving
Calories from Fat 2 Calories 18
% Daily Values*
Total Fat 0g 0%
Saturated Fat 0g 0%
Trans Fat 0g
Cholesterol 0mg 0%
Sodium 5mg 0%
Total Carbohydrate 4g 1%
Dietary Fiber 1g 5%
Sugars 3g 0%
Protein 1g
Vitamin A 17%
Vitamin C 21%
Calcium 1%
Iron 1%
* Percent Daily Values are based on a 2000 calorie diet. Your daily values may be higher or lower depending on your calorie needs. Nutrition Values are based on USDA Nutrient Database SR18

57
Lettuce Nutrition Facts Per serving size 100 g
Amount Per Serving
Calories from Fat 3 Calories 17
% Daily Values*
Total Fat 0g 0%
Saturated Fat 0g 0%
Trans Fat 0g
Cholesterol 0mg 0%
Sodium 8mg 0%
Total Carbohydrate 3g 1%
Dietary Fiber 2g 8%
Sugars 1g 0%
Protein 1g
Vitamin A 174%
Vitamin C 40%
Calcium 3%
Iron 5%
* Percent Daily Values are based on a 2000 calorie diet. Your daily values may be higher or lower depending on your calorie needs. Nutrition Values are based on USDA Nutrient Database SR18
58
Annex 4: List of people consulted Participants in consultation meetings held during 24-28 March, 2014
Name Designation Aaron Tierney Restaurant Association Arama Wigmore Wigmore Farms Bob Taylor General Manager, Edgewater Resort and Spa Marcel Tua Pacific Spring (bottling plant) Daniel Forsyth Managing Director, Prime Foods Enua Pakitoa Senior Statistician, National Statistics Office, MFEM Erina Korohina Development Program Manager, MFEM Ewan Smith Managing Director, Air Raratonga Gaye Whitta General Manager, Cook Islands Trading Corporation Ltd Gerard Kaczmarek Restaurants Association; Café Salsa Hugh Baker Raro-Pacific Fruit Processor Jack Cooper Tide Table Restaurant/ Trader Jacks/ Bamboo Jacks James Webb Economic Advisor, Budget and Economic Division, MFEM John Scott Farmer Jon Beymer Manea Nui Plantation Hon. Kiriau Turepu Minister of Agriculture, National Environment Service, BTIB Madeleine Sword Pacific Spring (bottling plant) Mat Purea Secretary, Ministry for Agriculture Maria Tuoro Central Planning and Policy Unit, OPM Metua Vaiimene Director of Destinations Development, CITC Ngapoko Ngatamaine Chief Customs Officer, MFEM Otheniel Tangianau Outer Islands, OPM Patrick Arioka Director, Department of Policy, Planning & Projects, MOA Peter Tierney Manager of Development Coordination Division, MFEM Petero Okotai Director, Central Planning and Policy Unit, OPM Rangiau Fariu Director of Community Health Services, Ministry of Health Robert Matapo Climate Change Cook Islands (OPM) Sean Mackesy-Buckley Senior Development Program Coordinator, NZ High Commission Stephen Barrett Senior Development Program Coordinator, NZ High Commission Stephen Whitta Aroa Vegieland Hydroponics Steve Anderson President, Cook Islands Chamber of Commerce Sue Caruthers Restaurant Association; Tamarind House restaurant Tai Manuela CEO, Minister of Agriculture Tapi Taio Taio Shipping Teava Iro Titikaveka Growers Association Terry Rangi CEO, Business Trade and Investment Board Teruautu Ringi Relationship Manager –Corporate & Business finance BCI Tony Armstrong International shipping Tua Manea Head Chef Rarotonga Beach Resort and Spa Vaine Nooana- Arioka Managing Director, Bank of Cook Islands
59
Local farmers round table meeting at MOA
Name Village Tupou Faireka Tupapa
Sean Isamaela Tutakimoa
Eliasa Benichi Tupapa
Nga Jessie Matavera
Nga Kino Titikaveka
Phillip Strickland Tupapa
Tai Manuela Matavera
Ngari Tini Nikao
Rau Nga Tupapa
Hugh Baker Nikao
Teava Iro Titikaveka
James Heather Puaikura
Mata Poescako Nikao
Tearoa John Tini Nikao
Georgina Keenan-Williams Titikaveka
George Taripo Arorangi
Takiua Simpson Takuvaine
Tim Nubono Nikao
Participants at the focus group meeting held on 31 March, 2014
Name Designation Fine T Arnold National Consultant Hugh Baker Raro-Pacific Fruit Processor Mat Purea Secretary, Ministry of Agriculture Noo Tokari Senior Policy Office, Ministry of Agriculture Patrick Arioka Director, Department of Policy, Planning & Projects, MOA Peter Tierney Manager of Development Coordination Division, MFEM Petero Okotai Director, Central Planning and Policy Unit, OPM Steven Barret Senior Development Programme Coordinator, NZ High Commission Tai Manuela CEO, Minister for Agriculture Tangata Tou Business Development Manager, Business Trade Investment Board Teava Iro Titikaveka Growers Association Teruautu Ringi Relationship Manager – Cooperate & Business Finance BCI

60
Annex 5: References
Asian Development Bank (2011) Key Indicators for Asia and the Pacific 2011
Asian Development Bank (2012) Key Indicators for Asia and the Pacific 2012
AusAid (2008) Making Land Work Vol.1: Reconciling customary land and development, Canberra, AusAID Enoke, L. (2008) Domestic Market Appraisal of Fresh Agricultural Produce Cook Islands, Food and Agriculture Organization and Ministry of Agriculture, July 2008
World Health Organisation (2004) Cook Islands STEPS Survey, Manilla, WHO
Government of the Cook Islands (2011) Economic Task Force Report, Task Force Outcomes, Objectives, Recommendations and Specific Actions, June 2011
Government of the Cook Islands (2012) Cook Islands National Health Strategy 2012-2016, Ministry of Health
Government of the Cook Islands (2012) Overseas Trade December Quarter, Cook Islands Statistics Office
Government of the Cook Islands (2013) Te Mato Vai, Water Supply Master Plan for Rarotonga, Ministry of Finance and Economic Management
Government of the Cook Islands (2014) Ministry of Education Statistics Report 2013
Government of the Cook Islands (2014) 2011 Agriculture Census, Cook Islands Statistics office
Horgen, K.B.; Brownell, K.D. (2002). "Comparison of price change and health message interventions in promoting healthy food choices". Health Psychology 21 (5): 505–512
Metcalf, B.S., Hosking, J., Jeffery, A.N., Voss, L.D., Henley, W., Wilkin, T.J. (2011). Fatness leads to inactivity, but inactivity does not lead to fatness: a longitudinal study in children (EarlyBird 45). Arch Dis Child, 96(10), 942-947
Myton, O., Gray, A. Rayner, M. Rutter, H. (2007) “Could targeted foods improved health?” Journal of Epidimological Community Health Vol. 61 No. 1 pp.689-694
New Zealand Tourism Research Institute (2013) Cook Islands Visitor Survey Results July-September 2013, Auckland University of Technology
New Zealand Tourism Research Institute (2013) Cook Islands Visitor Survey Annual Summary Report April 2012 – March 2013, Auckland University of Technology
New Zealand Tourism Research Institute (2013) Cook Islands Visitor Survey Executive Summary April 2012 – March 2013, Auckland University of Technology
Thow, A. Heywood, P. Scultz, J. Quested, C. Jan, S. Colagiuri, S. (2011) Trade and the Nutrition Transition: Strengthening Policy for Health in the Pacific: Strengthening Policy for Health in the Pacific, Ecology of Food and Nutrition, 50:1, 18-42