linkages and referrals within aids care and treatment ... filetreatment national service delivery...
TRANSCRIPT
This report was made possible by support from the U.S. Agency for International Development (USAID) under the terms of Cooperative Agreement GPO-A-00-03-00003-00. The opinions expressed are those of the authors and do not necessarily reflect the views of USAID or the United States government.
September 2008 SR-08-45
Linkages and Referrals within AIDS Care and
Treatment National Service Delivery Systems, Swaziland
Final Report
September 2008
The Swaziland Referral Technical Working Group Team

Acknowledgements This report was compiled by technical advisors Kate Macintyre and Megan Littrell, and further commented on or edited by Murmly Mathunjwa, Thembayena Dhlamini, Sikhomba Gumbi, Rejoice Nkambule, Sibongile Mndzebele, Lisanne Brown, David Hotchkiss and Verne Kemerer. Tulane University School of Public Health and Tropical Medicine, Department of International Health, was the lead MEASURE Evaluation partner in this project. This study was advised by Dr. C. Mabuza (Director of Health Services, MOHSW); Beatrice Dlamini and Velephi Okello (SNAP); Sibongile Mndzebele (NERCHA M&E); and the Swaziland Referral Technical Working Group including: Mohammed Ali (EGPAF), Eollyne Balde (SWANNEPHA), Raymond Bharnhanga (ICAP), Faith Dlamini (NERCHA), Sibusiso Dlamini (NERCHA), Prudence Gwebu (MOHSW), Samson Haumba (URC), Elliot Jele (Red Cross), Makhosonke Mavimbela (PSI), Lindiwe Mkhatohwe (URC), Khosi Mthethwa (WHO), Thembi Mugore (Southern Africa Human Capacity Development Coalition), Nomsa Mulima (SNAP M&E Unit), Augustin Ntilivamunda (WHO), Edwin Simelane (PSI), Fikile Sithole (Southern Africa Human Capacity Development Coalition), Alice Tembe (SWANNEPHA), Mulunesh Tennagashwa (UNAIDS), Thembi Tnkambule (SWANNEPHA), Agatha Tsabedze (TBC), Velephi Okello (SNAP M&E Unit), Allen Waligo (EGPAF); Stephanie Posner (former USAID, now PACT-Namibia); Gwen Wilkins (USAID, SA); George Bicego (CDC); Christine Stevens (USG HIV/AIDS Coordinators Office); Peter Vranken (CDC); Agai Jones (PSI); Victoria Masuku (PSI); and Elizabeth Jahnke (formerly of Tulane University, now National University of Singapore).
We also thank the REDI interview team for their essential role in this project: Maqhawe Sibandze, Thembi Khumalo, Zodwa Dlamini, Thembinkosi Mabuza, Bonginkosi Khumalo, Batsile Malima, Gcinangaye Tsabedze, Nandi Mhlanga, Mdudzi Dlamini, Sebe Masilela, Mfanimpela Hlatshwayo, Simangele Mamba, and Nosipho Hlophe. Finally, we thank the community health workers, traditional healers, NGO staff and facility providers who gave time to share their experiences and recommendations. The opinions expressed in this document reflect the opinions of the respondents which have been sorted, analyzed and filtered to be represented in this document as coherently and simply as possible. All errors or misrepresentations are those of the authors, and opinions expressed here do not reflect those of the funding agency or their agents. Mbabane September 2008

Table of Contents
Acknowledgements....................................................................................................................................... 2
List of Figures ............................................................................................................................................... 5
List of Tables ................................................................................................................................................ 5
Abbreviations & Acronyms .......................................................................................................................... 6
Executive Summary ...................................................................................................................................... 7
1. Introduction......................................................................................................................................... 10
2. Background and Rationale .................................................................................................................. 10
2.1 Definitions......................................................................................................................................... 11
2.2 The Referral Pyramid........................................................................................................................ 11
2.3 Referrals in AIDS Care & Treatment .................................................................................. 12
3. The Swaziland Context ....................................................................................................................... 13
3.1 HIV and AIDS in Swaziland............................................................................................................. 14
3.2 The Health Care System in Swaziland.............................................................................................. 14
4. Methods............................................................................................................................................... 15
4.1 Participants........................................................................................................................................ 15
4.1.1 Facility-Based Participants................................................................................................... 15
4.1.2 Community-Based Participants............................................................................................. 17
4.1.3 NGO Participants.................................................................................................................. 18
4.1.4 Sample Summary ................................................................................................................... 19
4.2 Instruments........................................................................................................................................ 19
4.3 Procedures......................................................................................................................................... 19
4.3.1 Facility-Based Data Collection............................................................................................. 20
4.3.2 Community-Based Data Collection....................................................................................... 20
4.3.3 NGO Data Collection............................................................................................................ 21
4.4 Analysis............................................................................................................................................. 21
5. Results................................................................................................................................................. 21
5.1 Facility-Based Quantitative Data ...................................................................................................... 21
5.1.1 Facility Services .................................................................................................................... 21
5.1.2 Referral Practices ................................................................................................................. 22
5.1.3 Referral Procedures .............................................................................................................. 25
5.1.4 Barriers to Referral ............................................................................................................... 26
5.1.5 Problems Faced by Clients Living with HIV and AIDS ........................................................ 28
Final report_ Linkages and Referral Report SD 2008 3

5.1.6 Provider Training.................................................................................................................. 30
5.1.7 Clients Seeking Care at Facilities that Provide ART ............................................................ 31
5.2 Community-Based Quantitative Data ............................................................................................... 33
5.2.1 Community Health Worker and Traditional Healer Training and Clientele ........................ 33
5.2.2 Referral Practices and Procedures ....................................................................................... 34
5.2.3 Barriers to Referral ............................................................................................................... 36
5.3 Qualitative Data ................................................................................................................................ 38
5.3.1 Senior Medical Officer, Senior Nurse and Other Provider Views on Improving the
Referral System ...................................................................................................................... 38
5.3.2 Community Health Worker Views on Improving the Referral System .................................. 41
5.3.3 Traditional Healer Views on Improving the Referral System ............................................... 42
5.3.4 NGO Experiences with Referral and Suggestions for Improvement ..................................... 43
6. Discussion ........................................................................................................................................... 47
6.1 Understanding Referral ..................................................................................................................... 47
6.2 Accepting Referral: Client Behavior................................................................................................. 48
6.3 Barriers to Referral ........................................................................................................................... 49
6.4 Improving the Referral System......................................................................................................... 49
6.5 Study Limitations.............................................................................................................................. 50
7. Conclusions and Recommendations ................................................................................................... 51
References................................................................................................................................................... 53
Appendix A: Facility Services & Referral Practices................................................................................... 55
Appendix B: Referral Sites for Specific Services ....................................................................................... 58
...................................................................................................... 62 Appendix C: Common Referral Forms
Final report_ Linkages and Referral Report SD 2008 4

List of Figures Figure 1 The ideal referral pyramid ........................................................................................................ 11 Figure 2 Framework of referral in a health care system ......................................................................... 12 Figure 3 HIV and AIDS continuum of care and support ........................................................................ 13
List of Tables
Table 1 Swaziland health care delivery system ...................................................................................... 14 Table 2 Facility sample characteristics ................................................................................................... 15 Table 3 Provider sample characteristics.................................................................................................. 16 Table 4 Client sample characteristics...................................................................................................... 17 Table 5 CHW sample characteristics ...................................................................................................... 17 Table 6 Traditional healer sample characteristics................................................................................... 18 Table 7 Sample summary........................................................................................................................ 19 Table 8 Proportion of facilities offering additional non-facility-based services..................................... 22 Table 9 Proportion of facilities reportedly referring clients that test HIV positive for additional HIV and AIDS services.............................................................................................................. 23 Table 10 Providers reporting single most common referral site for clients referred from the facility.... 24 Table 11 Proportion of providers reporting use of a referral form, providing a sample referral form, and reporting a referral record keeping system....................................................................... 25 Table 12 Providers reporting specific reasons that referred clients are able or willing to follow a referral..................................................................................................................................... 26 Table 13 Providers reporting specific reasons that referred clients are unable/unwilling to follow referral..................................................................................................................................... 27 Table 14 Proportion of providers reporting specific barriers to referral ................................................. 28 Table 15 Proportion of providers reporting specific problems faced by PLHA within the facility........ 29 Table 16 Proportion of providers reporting specific problems that PLHA face when referred to either facility- or community-based care ........................................................................................... 30 Table 17 Proportion of providers reporting training received within the past year ................................ 31 Table 18 Clients reporting specific reasons for visit to the health facility on the day of the interview..31 Table 19 Proportion of clients reporting means of transportation to the health facility on the day of the interview and mean travel time and roundtrip cost ............................................................ 32 Table 20 Proportion of clients reporting referral to and from the health facility.................................... 33 Table 21 CHWs and traditional healers that report seeing specific health problems in their clientele... 34 Table 22 Proportion of CHWs and traditional healers reporting specific reasons for referring clients affected by HIV or AIDS to a health facility .......................................................................... 35 Table 23 Proportion of CHWs and traditional healers reporting referral feedback and follow-up on clients referred for HIV or AIDS care..................................................................................... 36 Table 24 Proportion of CHWs and traditional healers reporting specific reasons that referred clients are able or willing to follow a referral ..................................................................................... 37 Table 25 Proportion of CHWs and traditional healers reporting specific reasons that referred clients are unable or unwilling to follow a referral ............................................................................. 37 Table 26 Proportion of CHWs and traditional healers reporting specific barriers to referral................. 38 Table 27 Proportion of providers reporting specific facility services and referral practices .................. 55 Table 28 Referral sites for specific services among providers that report referring for these services across facility types.................................................................................................................. 58
Final report_ Linkages and Referral Report SD 2008 5
Abbreviations & Acronyms ART Antiretroviral therapy
ARV Antiretroviral
CDC U.S. Centers for Disease Control and Prevention
CHW Community health worker
CSO Central Statistics Office
HBC Home based care
HTC HIV testing and Counseling
MOHSW Ministry of Health and Social Welfare
NERCHA National Emergency Response Council on HIV and AIDS
NGO Nongovernmental organization
PLHA Persons living with HIV or AIDS
PMTCT Prevention of mother to child transmission
REDI Regional Excellence and Development Initiative
SNAP Swaziland National AIDS Programme
STI Sexually transmitted infection
TB Tuberculosis
USG United States government
VCT Voluntary counseling and testing
USAID U.S. Agency for International Development
Final report_ Linkages and Referral Report SD 2008 6

Executive Summary Appropriate and timely referral is essential for a functioning health system. Unfortunately, it is often among the weakest components of a system. In Swaziland, as antiretroviral treatment and other treatment services are rolled out, identifying and addressing barriers to a strong referral system is critical to ensure access to services and continuity of care for people living with HIV and AIDS. This study, which is one facet of a phased plan to improve the national referral system, has gathered evidence as to how referral is understood by key stakeholders. The information is intended for use by decision makers at the Ministry of Health and Social Welfare and other stakeholders to create and implement policies and procedures that improve care and support for people living with HIV and AIDS. Objectives of this study were to:
1. Document linkages between different services within the continuum of HIV and AIDS care 2. Assess the quality of the referral system 3. Identify gaps in the referral system 4. Identify barriers to care from communities to facilities and back to the community 5. Document how referral is understood by facility providers, clients, community providers and
NGOs To answer study questions and achieve study objectives, a multi-level cross-sectional study design was developed to gather perspectives and experiences of referral from facility-based providers, traditional healers, community health workers, clients seeking care at health facilities and staff at NGOs providing HIV and AIDS services. Assessment tools were developed to understand referral from each of these stakeholder perspectives. The study design called for a nationally representative sample of facilities, clinical providers, clients, traditional healers and CHWs drawn from the four regions of the country. One week was spent collecting data in each region. A total of 52 health facilities were visited and at each facility, an interview was conducted with the senior medical officer or senior nurse. Within those facilities, 161 providers (nurses, doctors and counselors) were interviewed. At facilities providing ART (n=18), a total of 307 clients seeking care in the OPD, TB, PMTCT, ART and VCT departments were interviewed. In 82 randomly sampled communities (census enumeration areas), a total of 81 traditional healers and 247 CHWs participated in the study. Finally, staff at 7 NGO stakeholders providing HIV and AIDS care were interviewed. Key findings include: Understanding Referral Referral is quite common among both facility-based and community-based providers, and is most
commonly understood as sending clients to seek care at higher level health care facilities, most notably hospitals, as opposed to sending clients back down the referral pyramid for treatment, care or support at lower levels of the formal health care system or from community-based providers.
While typically an uncommon practice in general, referral by facility providers to community-based
care was found to be notably high for home-based care, and somewhat practiced for psychosocial support and palliative care.
While NGO staff reported both receiving and making referrals to health facilities, NGOs were not
frequently cited by either community-based or facility-based providers as referral sites. However, NGOs were cited by a limited number of facility-based providers for specific services including palliative care, home-based care, psychosocial support, family planning, nutrition support services and counseling about HIV and AIDS.
Final report_ Linkages and Referral Report SD 2008 7

Referral is an individualized process that depends on various factors. When examining referral practices across a large menu of facility-based services, referral was found to be quite a common practice even for services provided by the referring provider/facility. Referral is most commonly made for services provided by a facility in certain cases where the provider or facility cannot serve the particular patient with that service. In addition, for many services, around a quarter of facility-based providers reported using more than one referral site indicating that different circumstances call for sending clients in need of the same service to different referral sites.
Referrals and linkages for certain services are particularly weak. These services are those that are
primarily taken up by community providers and include nutrition support services, psychosocial support, palliative care and home-based care. The qualitative data supported these findings, with facility providers and NGO staff noting both weak systems of care in the community as well as poor linkages between community-based care and facility-based care.
Accepting Referral: Client Behavior Among all providers (community- and facility-based), taking up a referral was thought to occur
among clients because they think they will improve; because they trust the provider’s advice; and because they are feeling sick. However, providers agree that failing to follow a referral occurs among clients unable to pay the cost of transport and/or care.
Facility-based providers emphasized lack of transport and perceptions of poor care at the referral site
as factors that influence client behavior. Traditional healers and CHWs placed more emphasis on issues of stigma and fear as barriers to following referral, and less commonly cited quality of care issues. In addition, it was community-based providers that noted preference for traditional medicine and/or fear of mixing traditional and Western medicines as factors that influence client behavior.
Barriers to Referral A common barrier to referral noted by all providers was the cost of care. While facility-based
providers also placed importance on transport as well as poor care at the referral site and lack of good communication within the system as important barriers to referral, CHWs and traditional healers frequently cited client fear.
Communication was a constant theme emphasized for its importance in ensuring that clients receive
necessary care in a timely manner and that feedback is given to ensure necessary follow-up by the referring site. Yet providers at all levels noted insufficient communication in current referral practices.
Improving the Referral System CHWs, traditional healers and facility providers all recommended that referral protocols be put in
place with communication tools, most notably a common referral form that includes sections for detailed history as well as feedback to be returned to the referring provider. While facility-based providers most often emphasized need for better communication between facilities, community-based providers consistently emphasized the need for better linkages between themselves and facilities in order to improve access to timely and appropriate care. All stakeholder groups feel that increased communication between community and facility and between facilities will improve client care by providing necessary information to the referral site and feedback to the referring site to support the continuum of care.
CHWs and facility-based providers alike described a need for priority to be given to clients that they
refer upon arrival at the referral site. They also both expressed a desire for strengthening care at their respective levels. NGO staff and providers at all levels also expressed the need for referral facilities
Final report_ Linkages and Referral Report SD 2008 8

to have adequate staff and equipment (particularly CD4 count machines) to serve referred clients with the services that they need and in a timely manner.
Based on study results, recommendations for improving the referral system are as follows:
Short-Term Recommendations Re-train on existing referral forms
Emphasize the feedback portion of referral forms
Revisit supply of forms (may be more of an issue at particular facilities)
Wide dissemination of the national HTC/VCT Referral Directory and Guide.
Develop a simple reporting system for facilities to track patients referred internally
Ensure community-based providers are involved in regional meetings
Develop mentoring and communication programs between providers and CHWs, particularly for
HBC and other health issues
Extend current hours of operation in clinics and health centres (i.e. beyond closing between 12-2pm)
Improve access to CD4 count by increasing hours and/or days of operation numbers of staff and
machines nationally
Long Term Recommendations / Significant Changes Revise or develop a standard referral form with more space for observations and client history and a
substantial feedback section to be sent to the referring site
Train on the referral form and protocol at all levels and disseminate widely through government,
mission, private and NGO stakeholders
Develop a protocol for referral between facilities as well as between communities and facilities (i.e.
procedures for communication (specific channels, parties to be involved) and completion of forms) as
well as a protocol for referral record keeping and reporting
Appoint referral officers at each referral receiving site to track each referred patient
Continue to improve service provision for all HIV services at the lower levels to reduce burden on
upper levels and reduce need for some of the referrals
Computerize referrals made for clients on ART in order to properly track them through the system
(perhaps build on the existing computerized monitoring system under SNAP)
Use SMS to communicate regarding referred patients
Revisit the triage system at referral sites so that they become more focused on referral rather than
operating as a general health facility
Final report_ Linkages and Referral Report SD 2008 9

1. Introduction Appropriate and timely referral is an essential part of a functioning health system. Unfortunately, it is often among the weakest component of a health system. In Swaziland, as AIDS treatment services including anti-retroviral therapy (ART) and home based care are rolled out, it is essential to understand the linkages between HIV testing and counseling (HTC), treatment, and care services both between community and provider levels and within the health system itself. It is vital to document the barriers to a strong referral system. This study seeks to gather evidence as to how referral is understood by various key groups, namely: facility-based providers, traditional healers, community health workers (CHWs), clients seeking care at health facilities, and staff working in non-governmental organizations (NGOs) providing HIV and AIDS services. These groups will provide a range of perspectives to answer the questions at the center of this study:
• How is referral understood? • How are decisions to advise and accept referral made? • What are the major barriers to smooth referral in the context of Swaziland? • How could referrals most effectively be tracked in Swaziland?
A series of structured and semi-structured questionnaires specifically designed for each key group collected information that the Ministry of Health and Social Welfare (MOHSW) through the Swaziland National AIDS Programme (SNAP) and other stakeholders can use to make decisions to improve Swaziland’s national referral system.
2. Background and Rationale The demand for AIDS care and treatment services in Swaziland is expected to increase due to a number of initiatives, including the continuing roll-out of ART. The effective roll-out of various initiatives requires an efficient health care delivery system that will offer appropriate services at multiple levels. The development of an effective and structured referral system operating through efficient institutional and community linkages is vital. This study has been designed to fill various information gaps and answer various questions relating to referral within the formal health care system as well as linkages between the health system and communities1. The main objectives of the study were to:
1. Document linkages between different services within the continuum of HIV and AIDS care 2. Assess the quality of the referral system 3. Identify gaps in the referral system 4. Identify barriers to care from communities to facilities and back to the community 5. Document how referral is understood by facility providers, clients, community providers and
NGOs
1 The origin of this study came from the Strategic Information Assessment (2005). This laid the ground work and identified the need for the basic information on referral. This was explored with USG-Pretoria and later USG Swaziland for regional and national application. Tulane and the partners developed a research design to capture the main questions. The team that later formed the Referral Working Group in Swaziland then adapted the basic framework and agreed that this study would form one step in five of the referral initiative of the MOHSW.
Final report_ Linkages and Referral Report SD 2008 10

2.1 Definitions Referral is defined as the process through which a client is moved or moves through the continuum of treatment, care and support. Linkages are viewed as the formal structures or conduits between institutions or organizations through which the process of referral occurs. Care is defined as support provided to an individual during illness to preserve mental and physical well-being through the services offered by the medical and allied health professions. Treatment refers to the clinical management and care of physical symptoms and pathologies.
2.2 The Referral Pyramid A referral system is dynamic and links an individual seeking care and support to a variety of services. The ideal and most efficient arrangement occurs when clients receive the most appropriate care at the lowest level possible in the system. Lower level care consumes fewer human and financial resources. In theory, health system referral networks are designed to move clients ‘up’ through a pyramid-shaped structure (see Figure 1), with the entry points at the base of the pyramid through primary care clinics, or a community-based worker. Clients then move up the health system to higher levels of care at a regional (district) hospital, mission hospital, or private facility, as dictated by the severity or type of illness and availability of the correct care. At higher level service-delivery sites, such as regional and national hospitals, clients are referred between different departments, according to need. Similarly, as critical and acute conditions are resolved, the client then may be referred back down to lower levels of care for observation or management.
Figure 1 The ideal referral pyramid
Referral can also be understood at three levels of interfaces between clients and the health care system: the community, the client/provider and the institution (see Figure 2). Several studies have examined the issue of by-passing lower levels of the system (especially in urban areas) and can be said to have an institutional focus (Bapna et al., 1991; Akin and Hutchison, 1999; Leonard et al., 2002). Multiple factors
Final report_ Linkages and Referral Report SD 2008 11

at household and community levels and characteristics (provider, client, and AIDS care and treatment sites) influence the dynamic system of referral at each of its interfaces – community, client-provider, and institutional (Macintyre and Hotchkiss, 1999).
Figure 2 Framework of referral in a health care system
2.3 Referrals in AIDS Care & Treatment Figure 3 illustrates the continuum of care and support for HIV and AIDS. In the context of HIV and AIDS, community-based services are essential for ensuring client ability to access care and treatment and maintain social, physical, and mental health (quality of life). Equally important in maintaining the continuum are clinical treatment and referrals, which are necessary to manage acute illnesses including opportunistic infections; initiate ART treatment; provide AIDS care and treatment services including ART; manage complications or side effects; address treatment failure; and make or confirm diagnoses (WHO 2004; WHO 2005a). Although referral is often mentioned in country-level plans, HIV programs typically lack well-defined guidelines that specify how referrals are supposed to be made among health facilities and between the health system and community-based organizations or individuals that serve PLHA. The HIV and AIDS continuum of care is circular, but the structure underpinning health system referral is largely hierarchical. In theory, health system referral networks are designed such that clients move through a classic pyramid-shaped structure (see Figure 1), however in HIV the interface with services provided in the community is particularly important, for example in relation to home-based care as well as many other facets of care and support. There are many gaps in our understanding of how these interfaces work best; what relationship if any is formed between the trained CHW and the providers to which they refer clients; and what providers know about structures in communities from which their patients come from and return to.
Final report_ Linkages and Referral Report SD 2008 12
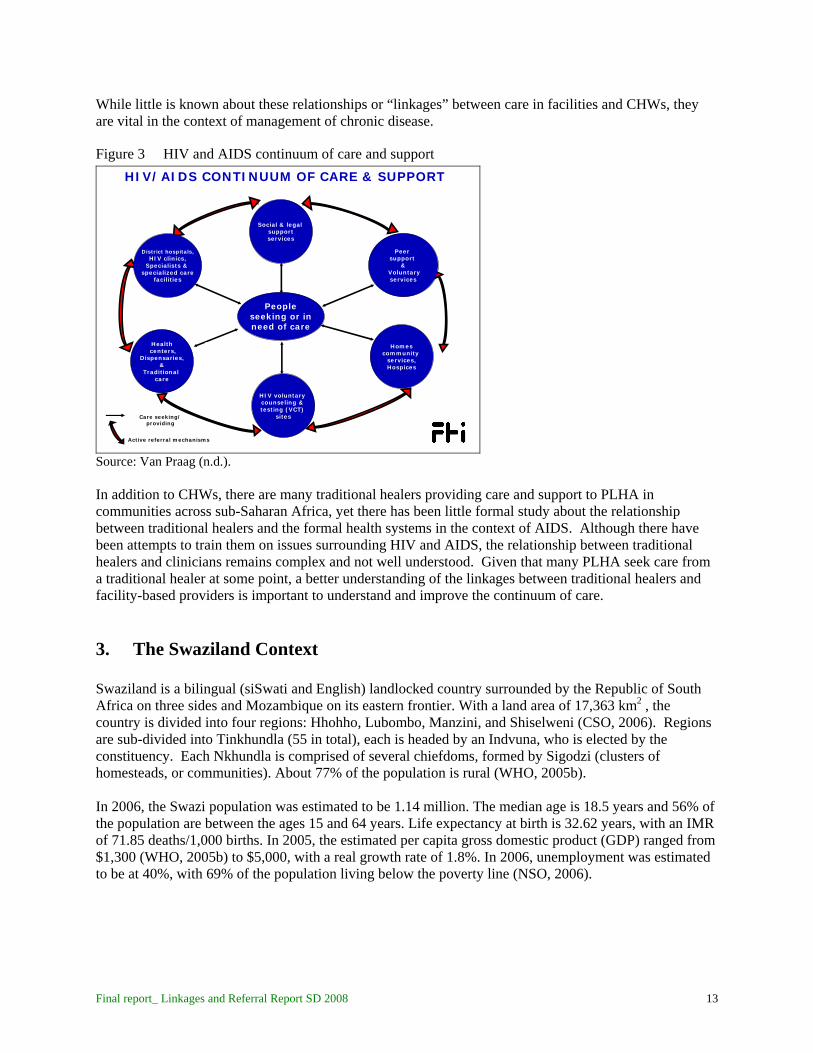
While little is known about these relationships or “linkages” between care in facilities and CHWs, they are vital in the context of management of chronic disease.
Figure 3 HIV and AIDS continuum of care and support
Peopleseeking or inneed of care
Active referral mechanisms
Care seeking/ providing
Homescommunity
services,Hospices
HIV voluntary counseling & testing (VCT)
sites
Peer support
&Voluntaryservices
Social & legal supportservices
Healthcenters,
Dispensaries,&
Traditional care
District hospitals,HIV clinics,
Specialists & specialized care
facilities
HIV/AIDS CONTINUUM OF CARE & SUPPORT
Source: Van Praag (n.d.). In addition to CHWs, there are many traditional healers providing care and support to PLHA in communities across sub-Saharan Africa, yet there has been little formal study about the relationship between traditional healers and the formal health systems in the context of AIDS. Although there have been attempts to train them on issues surrounding HIV and AIDS, the relationship between traditional healers and clinicians remains complex and not well understood. Given that many PLHA seek care from a traditional healer at some point, a better understanding of the linkages between traditional healers and facility-based providers is important to understand and improve the continuum of care.
3. The Swaziland Context Swaziland is a bilingual (siSwati and English) landlocked country surrounded by the Republic of South Africa on three sides and Mozambique on its eastern frontier. With a land area of 17,363 km2 , the country is divided into four regions: Hhohho, Lubombo, Manzini, and Shiselweni (CSO, 2006). Regions are sub-divided into Tinkhundla (55 in total), each is headed by an Indvuna, who is elected by the constituency. Each Nkhundla is comprised of several chiefdoms, formed by Sigodzi (clusters of homesteads, or communities). About 77% of the population is rural (WHO, 2005b). In 2006, the Swazi population was estimated to be 1.14 million. The median age is 18.5 years and 56% of the population are between the ages 15 and 64 years. Life expectancy at birth is 32.62 years, with an IMR of 71.85 deaths/1,000 births. In 2005, the estimated per capita gross domestic product (GDP) ranged from $1,300 (WHO, 2005b) to $5,000, with a real growth rate of 1.8%. In 2006, unemployment was estimated to be at 40%, with 69% of the population living below the poverty line (NSO, 2006).
Final report_ Linkages and Referral Report SD 2008 13

3.1 HIV and AIDS in Swaziland The first diagnosis of HIV in the Kingdom of Swaziland was reported in 1986 (MOHSW, et al., 2005). The first case of AIDS was reported in 1987 (MOHSW, 2001), and HIV/AIDS was declared a national disaster in Swaziland in 1999 (Kelly & Magongo, 2004). A sentinel surveillance system to monitor the proportion of pregnant women attending ANC clinics infected with HIV has been in place since 1992. More than 90% of pregnant women are reported to make contact with ANC services at least once during pregnancy (MOHSW, et al., 2005; SHRU & UNFPA, n.d.). ANC-based HIV sero-prevalence has risen from between 3.0% (MOHSW and WHO, 2003) and 3.9% (MOHSW, 2001; MOHSW, et al., 2005) in 1992 to 42.6% in 2004. With results of 39.2% in 2006, Swaziland has the highest prevalence rate among pregnant women seeking services at an ANC clinic in the world (HDA, Draft; USAID & CDC, 2004). While there may now be signs of the epidemic beginning to slow, according to the 2006-07 Swaziland Demographic and Health Survey, the overall HIV prevalence in the country remains high at 26% among adults age 15 to 49 (CSO & Macro International, 2008).
3.2 The Health Care System in Swaziland The formal health system is divided into primary care (clinic), secondary care (public health unit and health centre) and tertiary (hospital) and includes public, mission, and private facilities (see Table 1).
Table 1 Swaziland health care delivery system
Health Care Unit
Facility Type Staff Capacity Number Clinic Primary Nurses Outpatient services
162 Public Health Units
Secondary Nurses Health promotion 8 Prevention In client services (24-42 beds) Health Centres Secondary Regional medical Minor surgery officers 12 Prevention Nurses Curative outpatient services Midwives
Hospitals Tertiary Specialist Health Promotion Professionals Prevention 7 Curative Rehabilitation Outpatient Services
Source: MOHSW et al. (2005); HAD Draft; USAID and CDC (2004); MEASURE Evaluation, USAID, CDC, NERCHA, SNAP, & GoS (2006) The system is assumed to be highly accessible with 80% of the population residing within 8 km of a health care unit and over 60% able to access a health care unit within an hour. Additionally, the private health care sector is a major stakeholder. Physicians in private practice or industry account for almost 50% of all physicians; there are two privately run hospitals; and just over 100 care services points are run by private, NGO, or industry clinics.
Final report_ Linkages and Referral Report SD 2008 14

To date, Swaziland lacks a national protocol for referral. In 2006, the design of a formal discharge and planning system was initiated. Referral forms have been developed in the past, but their current use is unknown. It is hoped that this study can now fill some of these knowledge gaps.
4. Methods This study investigates linkages between facility- and community-based AIDS care and treatment services with focus on referral processes in the context of ART roll-out. The method chosen was a mixed method diagnostic approach that used six different instruments to gather information from the following types of participants: (1) senior medical officers and senior nurses; (2) health facility providers including nurses and doctors; (3) clients seeking care at health facilities; (4) traditional healers; (5) community health workers; and (6) program staff at NGOs working in HIV and AIDS services.
4.1 Participants This study includes facility-based samples of senior medical officers, providers and clients seeking care at ART and non-ART facilities as well as community-based samples of community health workers and traditional healers. In addition to these participants, staff members at a select number of NGOs providing HIV and AIDS services were interviewed.
4.1.1 Facility-Based Participants Providers and clients from 52 facilities participated in the study. Table 2 summarizes characteristics of facilities included in the study. The majority of facilities included in this study were government (54%) or mission (27%) facilities. The sample included the national referral hospital; regional referral hospitals (n=3); sub-regional referral hospitals (n=2); one private hospital; private clinics (n=6); public clinics (n=31); private health centres (n=2); public health centres (n=5); and one public health unit. The sample includes 18 facilities that were providing ART (35% of the sample). At each facility, the senior medical officer or senior nurse completed an interview focused on facility characteristics and referral policies. A total of 161 providers were interviewed; provider characteristics are provided in Table 3. Facility providers were those responsible for referral; 22% of the providers interviewed were doctors; 1% were matrons; 66% were nurses; 12% were nursing assistants; and 7% were counselors. Clients were interviewed within the sub-sample of study facilities that were providing ART (n=18 facilities). Three-hundred and seven clients seeking either general outpatient services, TB treatment, PMTCT, VCT or other AIDS care participated in the study. More than half of clients interviewed were seeking care at hospitals; 12% were seeking care at the national referral hospital, 31% at regional referral hospitals, 15% at sub-regional referral hospitals and 4% at private hospitals. Clients were mentally and physically fit enough to complete a brief interview, and were at least 18 years of age. Clients ranged in age from 18 to 78 (mean age 35) and 66% of the clients were female (see Table 4). Clients were interviewed at facilities in each of the four regions, although nearly a third of the sample came from Hhoho region due to a greater number of facilities in that region including the national referral hospital.
Final report_ Linkages and Referral Report SD 2008 15

Table 2 Facility sample characteristics % All Facilities (n=52) n Facility type
Table 3 Provider sample characteristics
* Nurse includes nurse practitioner, nursing sister, senior nurse, registered nurse/staff nurse and enrolled nurse
National referral hospital 2% 1 Regional referral hospital 6% 3 Sub-regional referral hospital 4% 2 Private hospital 2% 1 Private clinic 12% 6 Public clinic 60% 31 Private health centre 4% 2 Public health centre 10% 5 Public health unit 2% 1
Facility ownership Government 54% 28 Mission 27% 14 Industry 8% 4 Private for profit 8% 4 Non-profit 4% 2
ART provision Providing ART 35% 18
% All Providers (n=161) n Facility type
National referral hospital 4% 6 Regional referral hospital 11% 18 Sub-regional referral hospital 8% 13 Private hospital 4% 6 Private clinic 6% 10 Public clinic 41% 66 Private health centre 4% 7 Public health centre 19% 30 Public health unit 3% 5
Facility ownership Government 59% 95 Mission 22% 35 Industry 10% 16 Private for profit 4% 6 Non-profit 6% 9
Respondent designation Medical doctor 14% 22 Matron 1% 1 Nurse* 66% 106 Nursing assistant 12% 20 Counselor 7% 12
Final report_ Linkages and Referral Report SD 2008 16

Table 4 Client sample characteristics
% Clients (n=307) n
Female
66% 203 Mean age (SD) 35 (12) 307
Age range 18-78 307 Facility type
4.1.2 Community-Based Participants A total of 247 CHWs from 22 communities equally representing the country’s four regions participated in the study (see Table 5). The majority of the CHWs (86%) had received training from the government. CHWs additionally reported training from UNICEF (9%); NGOs (11%); FBOs (2%); and their company (1%). Most of the CHWs were women (98%). To participate in the study, CHWs must have been working in the community for at least 1 year. The mean number of years as a CHW among the sample was 11 years. CHWs were serving on average 34 households and seeing 7 clients per week. A total of 81 traditional healers from 75 communities drawn approximately equally from the country’s four regions participated in the study. The majority of traditional healers were male; 47% were herbalist medicine men/women; 30% were Zionist herbalists; 12% were Zionist sangoma herbalists; 10% were traditional birth specialists; and one was a bogobela trainer. To participate in the study, traditional healers must have been seeing clients for at least one year. The mean number of years traditional healers had been practicing was 24 years. Traditional healers were seeing on average 12 clients per week (See Table 6).
National referral hospital 12% 37 Regional referral hospital 31% 96 Sub-regional referral hospital 15% 46 Private hospital 4% 12 Private clinic 3% 7 Public clinic 8% 26 Private health centre 4% 12 Public health centre 19% 59 Public health unit 4% 12
Facility location Hhohho 30% 92 Manzini 29% 90 Lubombo 22% 68 Shiselweni 18% 56
Final report_ Linkages and Referral Report SD 2008 17

Table 5 CHW sample characteristics
% CHWs (n=247) n
Female
98% 241 Trained by
Table 6 Traditional healer sample characteristics
4.1.3 NGO Participants NGO interviews were conducted with key informants on referral practice and policy issues at 7 NGOs working in HIV and AIDS care. The organizations are all USG partners (i.e. they have received or are currently receiving funding from the USG as partners in the national HIV program). The individuals
Government 86% 213 UNICEF 9% 21 NGO 11% 27 FBO 2% 4 Company 1% 3 Region Hhohho 25% 62 Manzini 26% 64 Lubombo 24% 60 Shiselweni 25% 61 Mean number of years as a CHW (SD)
11 years (9) 247
Mean number of clients seen per week (SD)
7 clients (6) 247
Mean number of homesteads served (SD)
34 homes (19) 247
% Traditional Healers
(n=81) n Male 72% 58 Type of healer
Zionist – sangoma – herbalist 12% 10 Zionist – herbalist 30% 24 Herbalist – medicine man/woman 47% 38 Traditional birth specialist 10% 8 Bogobela – trainer 1% 1 Mean number of years as a traditional healer (SD)
24 years (13) 81
Mean number of clients seen per week (SD)
12 clients (22) 81
Final report_ Linkages and Referral Report SD 2008 18

invited for interview were program staff working either in direct service or management of medical or case management services for HIV and AIDS care.
4.1.4 Sample Summary Table 7 summarizes the samples at facility, community and respondent levels.
Table 7 Sample summary FACILITIES & COMMUNITIES
Per region Total ART facilities 18 total 18 Non-ART facilities At least 5 per region 34
+ 1 TB centre Communities Approximately 20 per region 82
RESPONDENTS Per facility/community Total Senior Medical Officers / Senior Nurses
1 per facility 52
Health Providers 3 at non-ART facilities 161 6 at ART facilities
307 Clients at ART facilities At least 30 at national, regional & sub-regional hospital At least 10 at all other ART facilities
CHWs At least 3 per 22 communities 247 Traditional Healers At least 1 per 75 communities 81
4.2 Instruments Six instruments were created by the research team in conjunction with The Referral Working Group, NERCHA and Ministry of Health stakeholders. Questionnaire content focused on experiences with referral and with accessing and providing health services from client, facility-based provider, NGO and community-based provider perspectives. Basic facility and respondent demographic information was additionally collected. The instruments were translated into Siswati and back translated. Final instruments can be obtained from the authors upon request.
4.3 Procedures Ethical approval was obtained from Tulane University’s Institutional Review Board and the Scientific and Ethics Committee of the MOHSW of the Government of Swaziland. According to protocol, informed consent was obtained from all individuals interviewed for this survey. A trained team of 12 interviewers piloted the five instruments among community- and facility-based providers and clients in Manzini. During four weeks of data collection, the team moved throughout the country together, with some members dedicated to community-based and others to facility-based data collection. Following the nationwide four-week data collection, NGO respondents were interviewed over a period of three additional days.
Final report_ Linkages and Referral Report SD 2008 19

4.3.1 Facility-Based Data Collection A sample of the largest 16 facilities providing ART as part of their menu of services was selected from the 22 ART facilities nationwide based on recent service statistics to ensure a representative picture of ART services nationwide. Non-ART providing facilities were selected randomly from all health facilities mapped during the 2006 Service Availability Mapping exercise (MOHSW & WHO, 2006). Five non-ART facilities per region were selected with respect to distance from the regional referral hospital. Within each of five levels of distance from the regional referral hospital (ranging from nearest to farthest), facilities were listed, numbered and one randomly selected for inclusion in the survey. At each facility, the senior medical officer (SMO) or the senior nurse was approached and asked to identify providers responsible for referral for the study. At facilities providing ART, the SMO was asked to identify three providers in VCT/ART/PMTCT (doctors, nurses, counselors) and three in OPD (OPD doctors and nurses, TB nurses). At non-ART facilities, the senior nurse was asked to identify three providers. Providers were invited to participate, and staggered their clients accordingly to take part in an interview. Staggering with doctors or with specialized providers such as the TB nurse was not usually possible, and in smaller clinics where at times there was only one provider, staggering was not possible. Where necessary, providers had the interviewers wait until patient lines went down to conduct interviews. Most small clinics did not have three nurses either on staff or at work on the day of data collection. To maintain sample size, clinics were added. Where a clinic did not contain three providers, the nearest clinic(s) from those sampled were visited until at least three providers were obtained for each sampled non-ART facility. A few of the ART facilities did not have six providers. To maintain sample size, two additional ART facilities were added. Clients were sampled in facilities that provided ART. In these facilities, there were generally separate waiting areas for ART and VCT; one waiting room for OPD; PMTCT in a separate area of antenatal care in the public health unit; and TB either in its own waiting area or in OPD. Half of the research assistants interviewed clients in the ART/VCT waiting area and sometimes PMTCT, and half in OPD and sometimes the separate TB clinic. Clients were invited to participate until client quota was met (at least 30 clients in national, regional and sub-regional referral hospitals; at least 10 clients in other facilities). The SMO or senior nurse, health providers and clients gave informed consent to participate in the study and completed oral interviews. All interviews at a particular facility were completed during one visit on one day.
4.3.2 Community-Based Data Collection Twenty communities were sampled per region using systematic sampling to select census enumeration areas from the sampling frame of the recent census. Within selected enumeration areas, a listing of CHWs was obtained from a CHW informant; these included CHWs trained by both government and non-government organizations. From this list, three CHWs were selected and invited to participate. Utilizing CHWs as informants, a list of traditional healers was generated and one selected at random and invited to participate. Five of the 80 sampled communities did not contain a traditional healer. As such, more than one traditional healer was sampled and invited to participate in five of the communities. CHWs and traditional healers, selected from a given community, were interviewed on one day; three to four communities were visited per day.
Final report_ Linkages and Referral Report SD 2008 20

4.3.3 NGO Data Collection Seven NGOs working in HIV and AIDS care were visited during a three-day period and a brief semi-structured interview was conducted with program staff working either in direct services or management of HIV and AIDS services. The interview focused on their experience with referral and views on weaknesses within and potential reforms of the national referral system.
4.4 Analysis Data were double entered and cleaned using Microsoft Access. Analyses were done using STATA 9.0 (STATA Corporation, College Station, TX).
5. Results This section presents basic results from the facility-based and community-based data.
5.1 Facility-Based Quantitative Data Facility-based data include facility services, provider referral practices, provider referral procedures, provider perspectives on barriers to referral, problems faced by clients living with HIV and AIDS, provider training, and information on clients seeking care at facilities that provide ART.
5.1.1 Facility Services Appendix A includes Table 27 summarizing provider reports on all services provided at each type of facility. Many of the facilities visited report providing several services; between 90% to 100% of all facilities report providing counseling about HIV and AIDS; HTC/VCT; diagnosis and treatment of concurrent infections; counseling and treatment for PMTCT; and STI counseling, testing and treatment. Fewer facilities report providing TB treatment (68%); nutrition support services (78%); palliative care (68%); home-based care (65%); ART (67%); psychosocial support (84%); and family planning (87%). Significant differences in services provided across facility type include provision of services such as PMTCT, ART, palliative care, and nutrition support services in which a higher frequency of hospital and health centre providers report providing these services in comparison with clinic providers. Table 8 below presents data from interviews with senior medical officers and senior nurses (one per facility). Non-facility-based services do not different significantly across facility with the exception of outreach (i.e. provider outreach to smaller facilities and/or the community) which is higher among hospitals and health centres in comparison with clinics.
Final report_ Linkages and Referral Report SD 2008 21
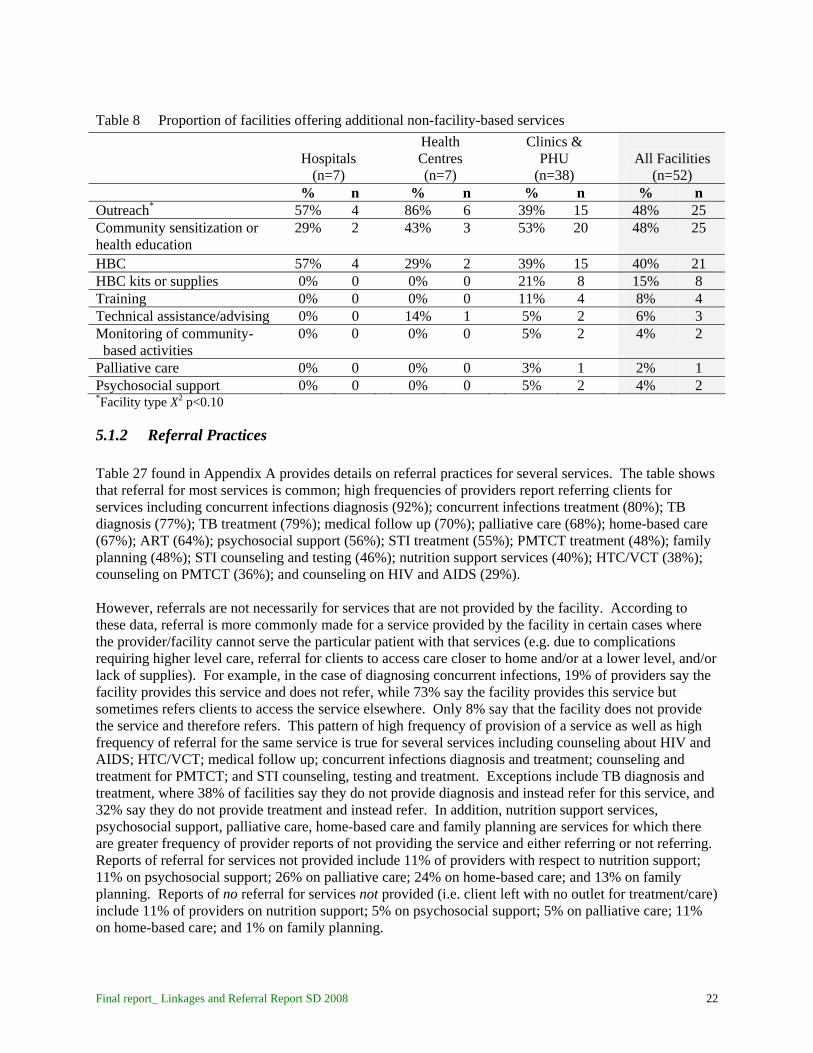
Table 8 Proportion of facilities offering additional non-facility-based services Health
Centres Clinics &
PHU
Hospitals All Facilities (n=7) (n=7) (n=38) (n=52)
% n % n % n % n *Outreach 57% 4 86% 6 39% 15 48% 25
Community sensitization or health education
29% 2 43% 3 53% 20 48% 25
HBC 57% 4 29% 2 39% 15 40% 21 HBC kits or supplies 0% 0 0% 0 21% 8 15% 8 Training 0% 0 0% 0 11% 4 8% 4 Technical assistance/advising 0% 0 14% 1 5% 2 6% 3 Monitoring of community- 0% 0 0% 0 5% 2 based activities
4% 2
Palliative care 0% 0 0% 0 3% 1 2% 1 Psychosocial support 0% 0 0% 0 5% 2 4% 2 *Facility type X2 p<0.10
5.1.2 Referral Practices Table 27 found in Appendix A provides details on referral practices for several services. The table shows that referral for most services is common; high frequencies of providers report referring clients for services including concurrent infections diagnosis (92%); concurrent infections treatment (80%); TB diagnosis (77%); TB treatment (79%); medical follow up (70%); palliative care (68%); home-based care (67%); ART (64%); psychosocial support (56%); STI treatment (55%); PMTCT treatment (48%); family planning (48%); STI counseling and testing (46%); nutrition support services (40%); HTC/VCT (38%); counseling on PMTCT (36%); and counseling on HIV and AIDS (29%). However, referrals are not necessarily for services that are not provided by the facility. According to these data, referral is more commonly made for a service provided by the facility in certain cases where the provider/facility cannot serve the particular patient with that services (e.g. due to complications requiring higher level care, referral for clients to access care closer to home and/or at a lower level, and/or lack of supplies). For example, in the case of diagnosing concurrent infections, 19% of providers say the facility provides this service and does not refer, while 73% say the facility provides this service but sometimes refers clients to access the service elsewhere. Only 8% say that the facility does not provide the service and therefore refers. This pattern of high frequency of provision of a service as well as high frequency of referral for the same service is true for several services including counseling about HIV and AIDS; HTC/VCT; medical follow up; concurrent infections diagnosis and treatment; counseling and treatment for PMTCT; and STI counseling, testing and treatment. Exceptions include TB diagnosis and treatment, where 38% of facilities say they do not provide diagnosis and instead refer for this service, and 32% say they do not provide treatment and instead refer. In addition, nutrition support services, psychosocial support, palliative care, home-based care and family planning are services for which there are greater frequency of provider reports of not providing the service and either referring or not referring. Reports of referral for services not provided include 11% of providers with respect to nutrition support; 11% on psychosocial support; 26% on palliative care; 24% on home-based care; and 13% on family planning. Reports of no referral for services not provided (i.e. client left with no outlet for treatment/care) include 11% of providers on nutrition support; 5% on psychosocial support; 5% on palliative care; 11% on home-based care; and 1% on family planning.
Final report_ Linkages and Referral Report SD 2008 22

Table 9 below provides data from SMOs and senior nurses on referral of clients testing HIV positive for specific HIV and AIDS services. The referrals most frequently cited for people that test HIV positive are ART (50%), lab work/CD4 count (44%); TB diagnosis and treatment (35%); and concurrent infections diagnosis and treatment (25%). Significantly higher rates of referral are found among clinics in comparison with hospitals and health centres for ART (58%) as compared with health centres (43%) and hospitals (14%); as well as for lab work/CD4 count (55%) as compared with health centres (14%) and hospitals (14%). While 29% of hospitals said they never refer clients that test positive for HIV, 0% of health centres and 3% of clinics reported never referring these clients.
Table 9 Proportion of facilities reportedly referring clients that test HIV positive for additional HIV and AIDS services Health
Centres Clinics &
PHU
Hospitals All Facilities (n=7) (n=7) (n=38) (n=52)
% n % n % n % n *ART 14% 1 43% 3 58% 22 50% 26
Lab work/CD4 count** 14% 1 14% 1 55% 21 44% 23
TB diagnosis/treatment 29% 2 29% 2 37% 14 35% 18 Concurrent infections diagnosis/treatment
29% 2 29% 2 24% 9 25% 13
Medical follow-up 29% 2 0% 0 16% 6 15% 8 Home-based care 29% 2 0% 0 11% 4 12% 6 In-patient care 14% 1 14% 1 8% 3 10% 5 Counseling about HIV & AIDS
0% 0 0% 0 11% 4 8% 4
Nutrition support services 0% 0 0% 0 11% 4 8% 4 Psychosocial support 0% 0 0% 0 8% 3 6% 3 PMTCT 14% 1 0% 0 5% 2 6% 3 STI testing/counseling/ treatment
0% 0 0% 0 5% 2 4% 2
Social services 0% 0 14% 1 3% 1 4% 2 Palliative care** 14% 1 0% 0 0% 0 2% 1 Never refer** 29% 2 0% 0 3% 1 6% 3 * Facility type X2 p<0.10 **Facility type X2 p<0.05 In terms of most common referral sites, 74% of all providers report referral to hospitals, 9% to health centres and 11% to specialized clinics. Only 2% of providers reported referral for community-based care as the most common referral site. Although the general pattern of referral remains the same across facility type, frequencies vary significantly showing some evidence of a referral pyramid. While 73% of clinic providers most commonly refer to hospitals, there is also referral to health centres (16% of clinic providers) and specialized clinics (6% of clinic providers). Health centre providers overwhelmingly refer to hospitals (92%) and in some cases to specialized clinics (5%). Hospital providers most often report referral to other hospitals (60%), however they also commonly refer to specialized clinics (23%) and within the facility itself (9%).
Final report_ Linkages and Referral Report SD 2008 23

Table 10 Providers reporting single most common referral site for clients referred from the facility Health
Centres Clinics &
PHU
Hospitals All Facilities (n=43) (n=37) (n=81) (n=161)
% n % n % N % n Hospitals 60% 26 92% 34 73% 59 74% 119 Health centres 2% 1 0% 0 16% 13 9% 14 Clinics 2% 1 3% 1 1% 1 2% 3 Specialized clinics 23% 10 5% 2 6% 5 11% 17 Community-based care 2% 1 0% 0 2% 2 2% 3 Within the facility/not referred 9% 4 0% 0 1% 1 3% 5 Facility type X2 p=0.001 Table 28 in Appendix B provides details on referral sites for several services among providers that report referring for each of these services. The table shows evidence for a great deal of referral to hospitals by clinic providers and health centre providers, particularly for medical follow-up (100% of health centre providers and 80% of clinic providers); concurrent infections diagnosis (96% of health centre providers and 78% of clinic providers); concurrent infections treatment (92% of health centre providers and 76% of clinic providers); PMTCT treatment (100% of health centre providers and 58% of clinic providers); palliative care (70% of health centre providers and 50% of clinic providers); family planning (100% of health centre providers and 70% of clinic providers) The most frequently cited referral site for clinics across all services was hospitals. This suggests that rather than referral to health centres (middle link in the referral chain), instead clinics are more often referring directly to hospitals. Health centres and specialized clinics are the second most frequent site for referral from clinics. Hospital providers report most frequently referring to other hospitals or to specialized clinics. Specialized clinics are the most frequently cited referral site for hospital providers for counseling about HIV and AIDS (91%); HTC/VCT (83%); TB diagnosis (83%); TB treatment (69%); STI counseling and testing (83%); STI treatment (79%); counseling on PMTCT (77%); PMTCT treatment (75%); and ART (60%). Other hospitals are the most frequently cited referral site for hospital providers for medical follow-up (88%); concurrent infections diagnosis (74%); concurrent infections treatment (78%); and family planning (55%). A few providers report referral from the hospital to health centre or clinic. Referral by hospital providers to lower level facilities was reported for counseling about HIV and AIDS (9% to health centre, 18% to clinic); medical follow up (4% to health centres, 13% to clinics); and family planning (40% to health centres and 15% to clinics). Although never the most frequently cited referral site for any one particular service, referral to NGOs was cited by providers for palliative care (35%); home-based care (22%); psychosocial support (15%);counseling about HIV and AIDS (9%); HTC/VCT (10%); nutrition support services (14%); family planning (18%). Referral to the community was cited by providers for home-based care (72%); psychosocial support (25%); palliative care (21%); nutrition support (17%); and counseling about HIV and AIDS (6%). The community was the most frequently cited referral source for home-based care.
Final report_ Linkages and Referral Report SD 2008 24

Table 28 suggests evidence that referral sites depends (e.g. on client needs, client location) in that for several services providers reported using more than one type of referral site. Services for which providers reported using more than one referral site include: counseling about HIV and AIDS (21%); HTC/VCT (27%); medical follow-up (23%); TB diagnosis (23%); TB treatment (24%); counseling on PMTCT (22%); PMTCT treatment (22%); ART (20%); and family planning (29%). However, for other services, there were fewer providers naming more than one referral site; these include concurrent infections diagnosis (17%); concurrent infections treatment (17%); nutrition support services (13%); palliative care (15%); home-based care (14%); STI counseling and testing (17%); STI treatment (18%); and psychosocial support (12%).
5.1.3 Referral Procedures The findings regarding the use of and observation of referral forms are given in Table 11. The majority of providers across facility types reportedly use some type of referral form (94%). However, only 73% of providers could produce a sample referral form. Commonly used forms are provided in Appendix C. While 78% of facilities reported using some type of record keeping system to track referrals, only 61% could show the record keeping system to the research team. Significantly fewer health centre providers could provide the record keeping system (49%) in comparison with 58% of hospital providers and 69% of clinic providers). Common referral tracking systems included use of the OPD register called the Outpatient Morbidity Register which includes check-box columns for “referred in” and “referred out.” Some providers use the column entitled “treatment outcome” to note referrals. Other less prevalent record keeping systems included referral tally sheets and exercise books devoted to referrals. One facility used a referral book that creates duplicate copies as a record while others report creating duplicates and storing them in a referrals binder. A few facilities use a special exercise book devoted to referrals to record each one.
Table 11 Proportion of providers reporting use of a referral form, providing a sample referral form, and reporting a referral record keeping system Health
Centres Clinics &
PHU
Hospitals All Facilities (n=43) (n=37) (n=81) (n=161)
% n % n % n % N Facility reportedly uses a referral form 95% 41 97% 36 93% 75
94% 152
Health provider provided a sample referral form 77% 33 70% 26 73% 59
73% 118
Facility reportedly uses a referral record keeping system 77% 33 78% 29 78% 63
78% 125
Referral record keeping system observed* 58% 25 49% 18 69% 56
61% 99
*Facility type X2 p<0.10 About half (51%) of all providers that recently referred a client for AIDS treatment or care (n=154) report knowledge of client behavior following the referral. There was a significant difference in provider knowledge across facility types (p<0.10); 54% of hospital providers, 66% of health centre providers and 43% of clinic providers reported knowledge of client behavior (data not shown).
Final report_ Linkages and Referral Report SD 2008 25
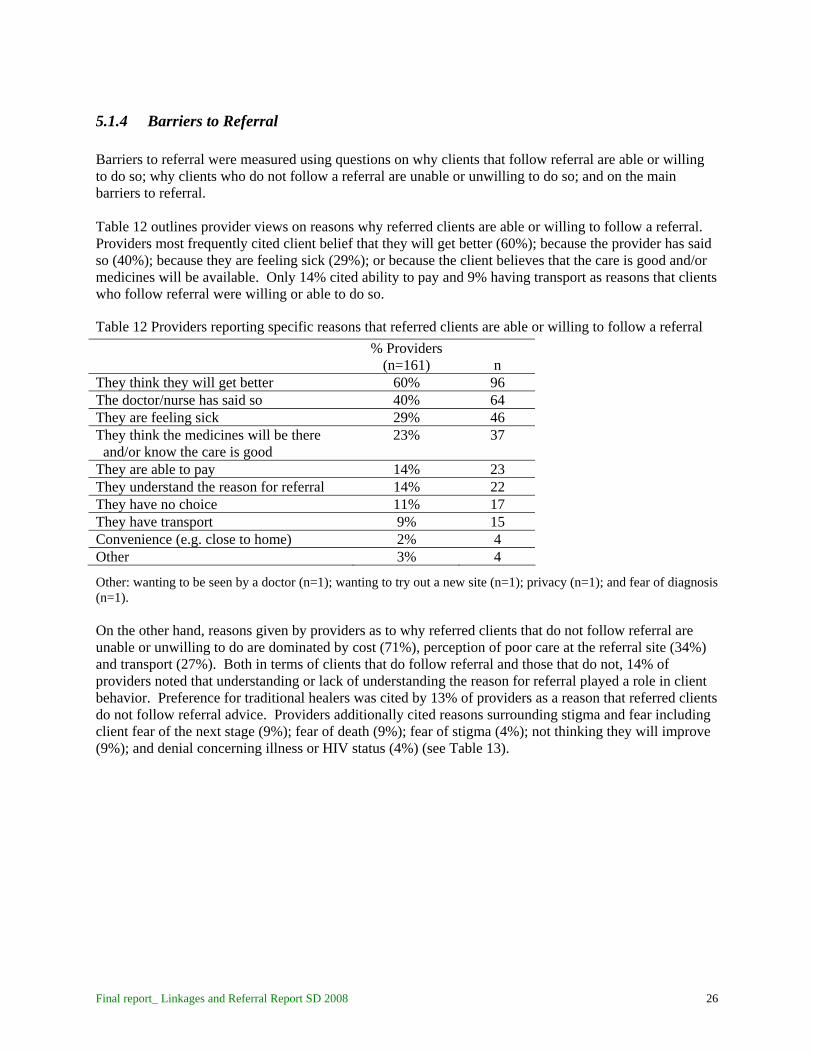
5.1.4 Barriers to Referral Barriers to referral were measured using questions on why clients that follow referral are able or willing to do so; why clients who do not follow a referral are unable or unwilling to do so; and on the main barriers to referral. Table 12 outlines provider views on reasons why referred clients are able or willing to follow a referral. Providers most frequently cited client belief that they will get better (60%); because the provider has said so (40%); because they are feeling sick (29%); or because the client believes that the care is good and/or medicines will be available. Only 14% cited ability to pay and 9% having transport as reasons that clients who follow referral were willing or able to do so.
Table 12 Providers reporting specific reasons that referred clients are able or willing to follow a referral
% Providers (n=161) n
They think they will get better 60% 96 The doctor/nurse has said so 40% 64 They are feeling sick 29% 46 They think the medicines will be there 23%
37 and/or know the care is good
They are able to pay 14% 23 They understand the reason for referral 14% 22 They have no choice 11% 17 They have transport 9% 15 Convenience (e.g. close to home) 2% 4 Other 3% 4
Other: wanting to be seen by a doctor (n=1); wanting to try out a new site (n=1); privacy (n=1); and fear of diagnosis (n=1). On the other hand, reasons given by providers as to why referred clients that do not follow referral are unable or unwilling to do are dominated by cost (71%), perception of poor care at the referral site (34%) and transport (27%). Both in terms of clients that do follow referral and those that do not, 14% of providers noted that understanding or lack of understanding the reason for referral played a role in client behavior. Preference for traditional healers was cited by 13% of providers as a reason that referred clients do not follow referral advice. Providers additionally cited reasons surrounding stigma and fear including client fear of the next stage (9%); fear of death (9%); fear of stigma (4%); not thinking they will improve (9%); and denial concerning illness or HIV status (4%) (see Table 13).
Final report_ Linkages and Referral Report SD 2008 26

Table 13 Providers reporting specific reasons that referred clients are unable/unwilling to follow referral
% Providers (n=161) n
Clients do not have money 71% 114 Clients think the care is not good there, do not 34%
54 like the staff, do not like the place
Clients do not have transport 27% 43 Distance – referral site is too far 16% 26 Clients do not understand the reason for referral 14% 22 Clients would rather go to a traditional healer or 13%
21 faith healer
Clients fear the next stage 9% 15 Clients fear they will die 9% 14 Clients do not think they will get better 9% 14 Long queues at the referral site 7% 12 Clients think medicines are not available at the 5% 8
referral site Clients think they will be discriminated against or 4% 6 Stigmatized Denial concerning illness/HIV status 4% 6 Clients do not want to a new provider 3% 5 Lack of family support 2% 4 Clients do not want to be admitted 2% 4 Clients always follow referral advice 2% 3 Other 6% 9 Other: fear of being recognized (n=2); defaulting on ARVs (n=1); think care is same as referring site (n=1); fear will not be treated at hospital (n=1); too busy to go to referral site (n=1); want home-based care (n=1); don’t care (n=3); don’t want to (n=2) When asked to report specific barriers to referral, providers again cited cost (67%) and transport (47%) as main barriers. They also cited quality of care issues including long queues (27%); client perception of poor care (25%); lack of good communication within the system (18%); and lack of enough providers at the referral site (11%). Lack of client understanding for the reason for referral was reported by 15% of providers. Also noted were barriers related to stigma and fear including client fear (14%); and lack of confidentiality and/or fear of stigma (4%) (see Table 14).
Final report_ Linkages and Referral Report SD 2008 27

Table 14 Proportion of providers reporting specific barriers to referral
% Providers (n=161) n
Clients do not have money 67% 108 Clients do not have transport 47% 76
Referral site has long queues 27% 43 Clients think care is better here / do not want 25% 41 to be sent to another place System lacks good communication 18% 29
Clients do not understand / do not understand 15%
24 reason for referral
Clients have fear 14% 22 System lacks enough providers 11% 17 Clients are affected by outside influence 6% 9 Clients lack confidentiality at the referral site / fear 4%
7
stigmatization by other clients at the referral site Providers lack coordination / do not follow-up 3% 4 Clients do not have family support 2% 4 Providers think there is no need to refer 1% 1 No barriers 2% 3
Other 16% 26 Other: clients do not care (n=2); cultural beliefs (n=1); client denial of HIV status (n=1); client loss of hope (n=2); clients are too sick (n=1); clients don’t want to be admitted (n=2); client preference for traditional healers (n=1); clients refuse HBC (n=1); conflicting advice from medical workers (n=1); difficult to know where to send someone (n=1); doctors at referral site tell us to treat here (n=1); health staff attitude (n=1); lack of drugs (n=1); lack of infrastructure at referral hospital (n=1); lack of proper care at referral site (n=1); lack of referral forms (n=2); shortage of medical equipment (n=1); referral site does not treat referring providers well (n=1); treatment at referral site same as referring site (n=1); lack of national guidelines/policy on referral (n=2)
5.1.5 Problems Faced by Clients Living with HIV and AIDS Table 15 summarizes problems providers report that PLHA face within their own facility. Nearly a third of providers noted that clients seeking care at their facility faced problems with inability to pay for transport, services and/or medicines. Lack of ARVs (29%) and lack of comprehensive care (29%) were also commonly cited problems. Other problems related to quality of care included clients not served in a timely manner (16%); lack of food for PLHA (not enough World Food Program support – 12%); not enough staff (11%); lack of confidentiality (9%); inconsistent supply of testing kits and supplies (4%); and lost blood samples (4%). Stigmatization by providers in the facility was noted by 8% of providers. Fifteen percent of providers noted that PLHA face problems in the facility because they seek care when they are very sick. PLHA were reported to face no problems at the facility by 12% of providers.
Final report_ Linkages and Referral Report SD 2008 28

Table 15 Proportion of providers reporting specific problems faced by PLHA within the facility
% Providers (n=161) n
Clients are too poor to pay for transport and/or health 30%
49 services and/or medicine
Lack of ARVs 29% 46 Lack of comprehensive care and support / not having all 29%
46 services that the patient needs
Cannot be served in timely manner 16% 26 PLHA come when they are very sick 15% 24 Hunger / not enough WFP support for clients 12% 19 Not enough staff resulting in poor services 11% 17 Cultural beliefs 11% 17 Lack of confidentiality 9% 14 Stigmatization by health workers 8% 13 Inconsistent supply of testing kits and equipment 4% 7
Stigmatization by clients in the waiting area 4% 6 Lost blood sample or CD4 results 3% 4 Other
9% 14
PLHA do not face any problems 12% 19
Other: retirement on medical grounds (i.e. industry facility) (n=1); fear of disclosure (n=1); lab tech is drunk (n=1); language barrier for Mozambicans (n=1); lack of caretaker in the facility (n=1); lack of treatment supporters which is a requirement for ART (n=1); lack of beds (n=1); inadequate waiting area (n=2); lack of agreement for partner testing (n=1); scheduling so that clients must come on multiple days (n=1); separation from other clients (n=2); Table 16 summarizes specific problems that PLHA face when referred either to the community or to another facility. Providers commonly cited quality of care issues including inability to be served in a timely manner (37%); lack of comprehensive care at the referral site (25%); and not enough providers (9%). Client inability to pay for transport, services and/or medicine was cited by 34% of providers. Providers cited stigmatization by community members (32%) and other providers (20%) as problems PLHA face when referred. Other problems related to stigma and fear included clients not wanting to change providers (14%); and lack of confidentiality (3%). Lack of ARVs (8%) and inconsistent supply of testing kits and equipment (5%) were also noted. Only 2% said the PLHA do not face problems at referral sites.
Final report_ Linkages and Referral Report SD 2008 29

Table 16 Proportion of providers reporting specific problems that PLHA face when referred to either facility- or community-based care
% Providers (n=161) n
Clients cannot be served in a timely manner 37% 59 Clients are too poor to pay for transport and/or health 34%
55 services and/or medicine
Stigmatization by community members so that PLHA 32% 52 cannot follow medical advice Lack of comprehensive care and support / not having all 25% 40 services that the patient needs Stigmatization by health workers 20% 32
PLHA come when they are very sick 14% 23 Cultural beliefs 14% 22 Clients do not want to change providers 14% 22 Distance – referral sites are too far 11% 18
Not enough staff resulting in poor services 9% 14 Lack of ARVs 8% 13 Inconsistent supply of testing kits and equipment 5% 8
Clients lack family support 3% 5 Lack of confidentiality 3% 5 Lack of food (at home or at facility) 3% 5 Other 11% 17
PLHA do not face problems at referral sites 2% 4 Other: No doctors available, only nurses (n=1); sent back for additional counseling (n=1); not given proper attention (n=1); clients don’t want to take medication (n=1); having to return to referral site for results (n=1); lack of information on HBC (n=3); no referral forms sent with clients (n=2); client lack of understanding for reason of referral (n=1); turned back without being served (n=3); clients don’t like being re-tested (n=1); providers lack knowledge on schedules at other facilities (n=3); denial (n=1); shame (n=1); lack of information on medication (n=1); adherence (n=1)
5.1.6 Provider Training Over 90% of all the providers reported receiving training in the last year (see table 17). Common topics of training included HTC/VCT (65%); PMTCT (60%); ART (49%); TB diagnosis or treatment (48%); and care and prophylaxis for opportunistic infections (47%). Training received is similar across different types of facilities with the exception of PMTCT and psychosocial support more frequently cited by clinic providers than hospital or health centre providers, and training on TB more frequently mentioned by hospital and clinic providers than health centre providers. While only 36% of all facility providers felt their training on management of HIV and AIDS and opportunistic infections was adequate, significantly more hospital (51%) and health centre (41%) providers reported adequate training in comparison with only 26% of clinic providers (p<.05, data not shown).
Final report_ Linkages and Referral Report SD 2008 30

Final report_ Linkages and Referral Report SD 2008 31
Table 17 Proportion of providers reporting training received within the past year
Hospitals
(n=43)
Health Centres (n=37)
Clinics & PHU
(n=81)
All Facilities
(n=161) % n % n % n % n Any training 91% 39 86% 32 96% 78 93% 149 HTC/VCT 67% 29 65% 24 64% 52 65% 105 Care & prophylaxis for opportunistic infections
44% 19 41% 15 52% 42 47% 76
ART 51% 22 49% 18 48% 39 49% 79 PMTCT* 56% 24 43% 16 70% 57 60% 97 Psychosocial support*** 7% 3 16% 6 30% 24 21% 33 Palliative care** 12% 5 5% 2 25% 20 17% 27 Home-based care 19% 8 11% 4 23% 19 19% 31 TB diagnosis or treatment* 56% 24 32% 12 52% 42 48% 78 STI counseling, testing or Treatment
35% 15 30% 11 42% 34 37% 60
Maternal & child health or family Planning
26% 11
19% 7 37% 30 30% 48
*Facility type X2 p<0.10 **Facility type X2 p<0.05 ***Facility type X2 p<0.01
5.1.7 Clients Seeking Care at Facilities that Provide ART Tables 18 through 20 summarize data from the client interviews (n=307). Clients were most often at the facility on the day of the interview because they were feeing sick (48%) and/or to pick up medication (41%). Interestingly, there is no significant difference in reason for visit to the facility across facility types. It should be remembered that clients were only interviewed at facilities offering ART, although clients in both general OPD as well as in HIV and AIDS services were interviewed.
Table 18 Clients reporting specific reasons for visit to the health facility on the day of the interview
Hospital Clients (n=191)
Health Centre Clients (n=71)
Clinic & PHU Clients (n=45)
All Clients
(n=307) % n % N % n % n Routine check-up 19% 36 10% 7 13% 6 16% 49 Referred to the facility 2% 4 0% 0 0% 0 1% 4 To pick up medication 42% 80 47% 33 31% 14 41% 127 Told to come by family 0% 0 0% 0 4% 2 1% 2 Feeling sick 48% 92 47% 33 51% 23 48% 148 Lab test 7% 14 4% 3 7% 3 7% 20 Follow-up visit 3% 5 6% 4 7% 3 4% 12 Note: some clients indicated more than 1 reason for the visit Most clients reached the health facility by bus (73%). On average, clients traveled about one hour to reach the health facility although length of time varied greatly as demonstrated by the standard deviations

and range of 2 minutes to 6 hours (see Table 19). The roundtrip travel cost was nearly E/R 20 and was significantly different across facility type, with clinic clients paying on average E/R 9.36, health centre clients paying E/R 13.22 and hospital clients paying E/R. 21.50. The cost of transport ranged from nothing to E/R 300, which was paid for a hospital visit and was 200 E/R higher than the highest price paid to travel to a health centre.
Table 19 Proportion of clients reporting means of transportation to the health facility on the day of the interview and mean travel time and roundtrip cost Hospital
Clients Health Centre
Clients Clinic & PHU
Clients
All Clients (n=191) (n=71) (n=45) (n=307)
% n % n % n % n Transport to the facility
*
Walk 9% 18 18% 13 11% 5 12% 36 Private car 9% 18 20% 14 22% 10 14% 42 Bus 79% 150 61% 43 67% 30 73% 223 Other^ 3% 5 1% 1 0% 0 2% 6
Mean travel time in minutes to the
64 62 52 62 (56) (49) (40) (49)
facility (SD) Range: 2-360 Range: 5-225 Range: 10-180 2-360 Mean roundtrip travel cost (SD)
21.50 13.22 9.36 17.81 * * (35.15) (17.11) (12.05) (29.65)
Range: 0-300 Range: 0-100 Range: 0-60 0-300 * Facility type X2 p<0.05 * * Facility type F-test p<0.05 ^Other: bike (n=1), hired car (n=1), tractor (n=1), police van (n=1), company car (n=2) Only 16% of all the clients or patients interviewed had received a referral from another facility and very few clients reported referred from a traditional healer or CHW (see table 20). Clients were asked about previous treatment sought for their current ailment; 22% said they had sought care from a traditional healer. Nine percent had received services as well as a referral to the facility from the traditional healer and 13% had received services but had not been referred by the traditional healer to the facility. The most commonly provided services clients had received from the traditional healer was herbal treatment; less common services included medicines, scarification, prayer, counseling, divination, spiritual intervention, enema or inhalation of smoke (data not shown). Only 6% of clients interviewed had previously sought treatment for their current ailment from an organization based in the community. Three percent had received services as well as a referral to the facility and three percent had received services but were not referred to the facility. Clients seeking care from organizations in the community were most frequently given medicines (data not shown).
Final report_ Linkages and Referral Report SD 2008 32
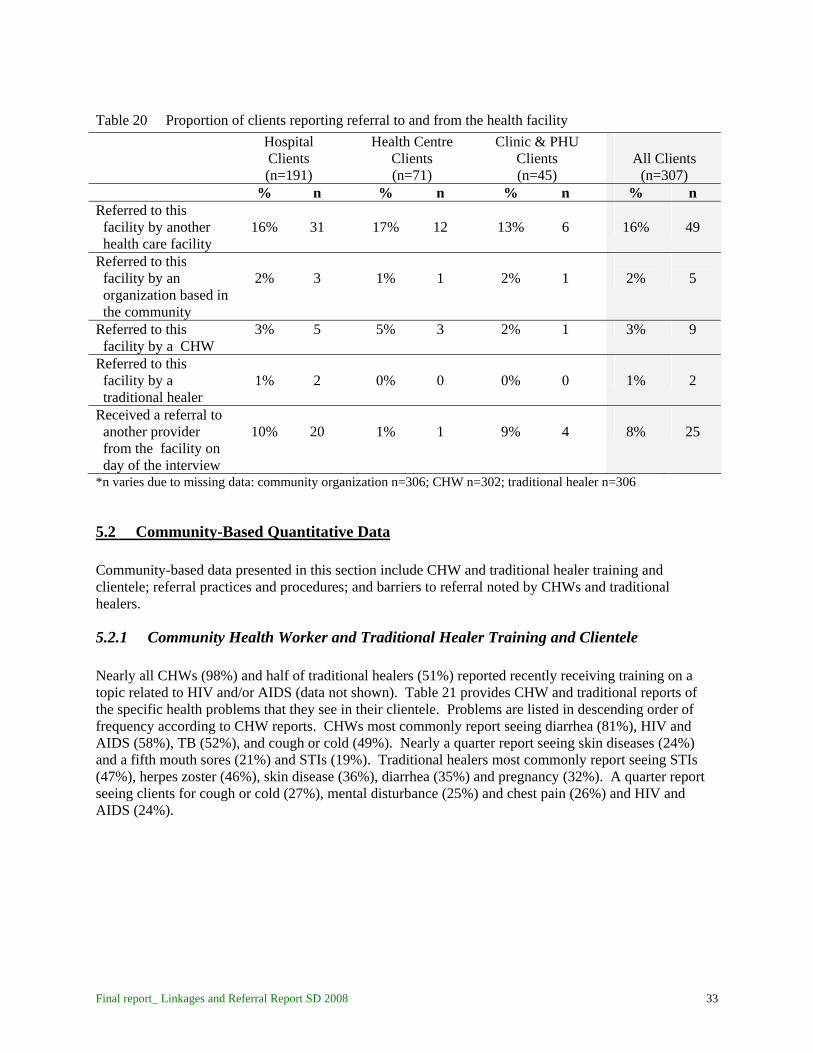
Table 20 Proportion of clients reporting referral to and from the health facility Hospital
Clients Health Centre
Clients Clinic & PHU
Clients
All Clients (n=191) (n=71) (n=45) (n=307)
% n % n % n % n Referred to this facility by another health care facility
16% 31 17% 12 13% 6
16% 49
Referred to this facility by an organization based in the community
2% 3
1% 1 2% 1
2% 5
Referred to this 3% 5 5% 3 2% 1 facility by a CHW
3% 9
Referred to this facility by a traditional healer
1% 2 0% 0 0% 0
1% 2
Received a referral to another provider from the facility on day of the interview
10% 20 1% 1 9% 4
8% 25
*n varies due to missing data: community organization n=306; CHW n=302; traditional healer n=306
5.2 Community-Based Quantitative Data Community-based data presented in this section include CHW and traditional healer training and clientele; referral practices and procedures; and barriers to referral noted by CHWs and traditional healers.
5.2.1 Community Health Worker and Traditional Healer Training and Clientele Nearly all CHWs (98%) and half of traditional healers (51%) reported recently receiving training on a topic related to HIV and/or AIDS (data not shown). Table 21 provides CHW and traditional reports of the specific health problems that they see in their clientele. Problems are listed in descending order of frequency according to CHW reports. CHWs most commonly report seeing diarrhea (81%), HIV and AIDS (58%), TB (52%), and cough or cold (49%). Nearly a quarter report seeing skin diseases (24%) and a fifth mouth sores (21%) and STIs (19%). Traditional healers most commonly report seeing STIs (47%), herpes zoster (46%), skin disease (36%), diarrhea (35%) and pregnancy (32%). A quarter report seeing clients for cough or cold (27%), mental disturbance (25%) and chest pain (26%) and HIV and AIDS (24%).
Final report_ Linkages and Referral Report SD 2008 33

Table 21 CHWs and traditional healers that report seeing specific health problems in their clientele
CHWs Traditional Healer (n=247) (n=81)
Main health problems seen in
CHW other: asthma (n=2); bilharzia (n=1); cancer (n=2); cholera (n=3); change in skin color (n=3); epilepsy (n=1); fainting (n=1); giving birth (n=1); hunger (n=2); lack of food for taking ARVs (n=1); pneumonia (n=2); polio (n=1); injury (n=1); loss of energy (n=1); ulcers (n=1); witch potions (n=1); poverty (n=1) Traditional healer other: asthma (n=1); bewitching (n=1); burns (n=1); cancer (n=2); preventing death of small children (n=2); loss of energy (n=1); regulation of menstrual cycle (n=1); oral thrush (n=2); piles (n=1); ulcers (n=2); leprosy (n=1); ghosts (n=1); red mark (n=1); uterus problem (n=1).
5.2.2 Referral Practices and Procedures Only 2% of CHWs and 7% of traditional healers said that they ever feel reluctant to give a client a referral to a health facility. CHWs commonly report referring clients to a clinic (72%), hospital (69%) or health centre (19%). Traditional healers commonly report referring clients to hospitals (69%), clinics (45%), other traditional healers (34%) and health centres (19%) (data not shown). CHWs and traditional healers were asked to give specific reasons as to why they refer clients affected by HIV or AIDS to a health facility (see Table 22). Most commonly cited by both CHWs and traditional healers were HIV testing (67% of CHWS, 80% of traditional healers), HIV and AIDS counseling (45% of CHWs, 37% of traditional healers) and ART (37% of CHWs, 21% of traditional healers). Quite infrequently mentioned were referrals for TB diagnosis (5% of CHWs, 13% of traditional healers) or
clients
%
n
% n Diarrhea 81% 200 35% 28 HIV & AIDS 58% 143 24% 19 TB 52% 129 10% 8 Cough or cold 49% 120 27% 22 Skin disease 24% 60 36% 29 Mouth sores 21% 53 12% 10 STIs 19% 46 47% 38 Headache 18% 44 11% 9 Diabetes 17% 42 16% 13 Herpes Zoster (shingles) 15% 37 46% 37 Chest pain 15% 37 26% 21 Stomachache and/or vomiting 11% 28 10% 8 High blood pressure 11% 27 5% 4 Pregnancy 11% 28 32% 26 Swollen feet 6% 14 1% 1 Mental disturbance 5% 13 25% 20 Malaria 4% 10 0% 0 Pain 2% 5 1% 1 Stress 2% 4 7% 6 Fits 0% 0 6% 5 Bleeding <1% 1 5% 4 Spirits 0% 0 9% 7 Stroke 2% 5 5% 4 Other 6% 16 11% 9
Final report_ Linkages and Referral Report SD 2008 34
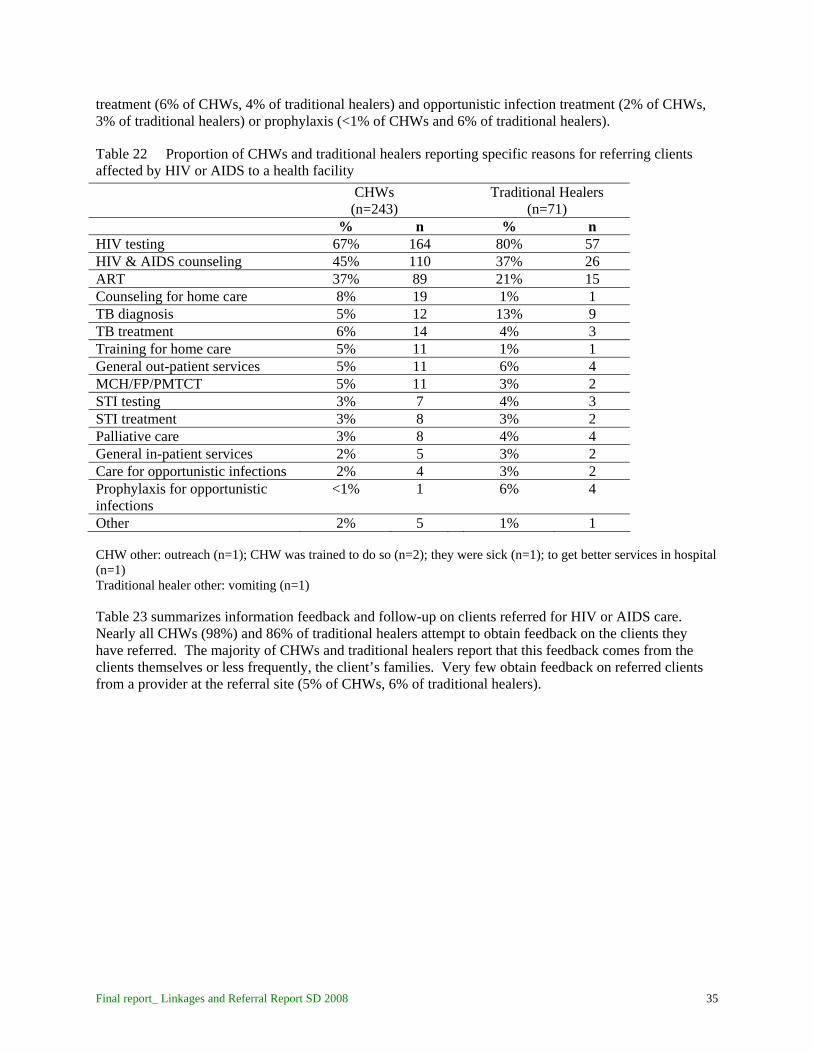
treatment (6% of CHWs, 4% of traditional healers) and opportunistic infection treatment (2% of CHWs, 3% of traditional healers) or prophylaxis (<1% of CHWs and 6% of traditional healers).
Table 22 Proportion of CHWs and traditional healers reporting specific reasons for referring clients affected by HIV or AIDS to a health facility
CHWs Traditional Healers (n=243) (n=71)
% n %
n HIV testing 67% 164 80% 57
HIV & AIDS counseling 45% 110 37% 26 ART 37% 89
21% 15 Counseling for home care 8% 19 1% 1
TB diagnosis 5% 12 13% 9 TB treatment 6% 14 4% 3 Training for home care 5% 11 1% 1
General out-patient services 5% 11 6% 4 MCH/FP/PMTCT 5% 11
3% 2
STI testing 3% 7 4% 3 STI treatment 3% 8 3% 2 Palliative care 3% 8 4% 4 General in-patient services 2% 5 3% 2 Care for opportunistic infections 2% 4 3% 2
Prophylaxis for opportunistic infections
<1% 1 6% 4
Other 2% 5
1% 1
CHW other: outreach (n=1); CHW was trained to do so (n=2); they were sick (n=1); to get better services in hospital (n=1) Traditional healer other: vomiting (n=1) Table 23 summarizes information feedback and follow-up on clients referred for HIV or AIDS care. Nearly all CHWs (98%) and 86% of traditional healers attempt to obtain feedback on the clients they have referred. The majority of CHWs and traditional healers report that this feedback comes from the clients themselves or less frequently, the client’s families. Very few obtain feedback on referred clients from a provider at the referral site (5% of CHWs, 6% of traditional healers).
Final report_ Linkages and Referral Report SD 2008 35

Table 23 Proportion of CHWs and traditional healers reporting referral feedback and follow-up on clients referred for HIV or AIDS care CHWs Traditional Healers
(n=243) (n=71) % n % n
Reportedly attempts to obtain feedback on referrals made 98% 237 86% 61 Sources of knowledge on client receipt of care at referral site
Client self-report 81% 197 59% 42 Family report 15% 36 31% 22 Follow up with the client 3% 7 0% 0 Accompany client to the facility 2% 5 1% 1 Provider at referral site report 5% 11 6% 4 Rarely hear – don’t know 1% 2 1% 1 Never hear – don’t know 1% 3 8% 6
5.2.3 Barriers to Referral CHWs and traditional healers were asked about reasons that referred clients that follow referral are willing or able to follow a referral; reasons that referred clients that do not follow a referral are unwilling or unable to do so, and about specific barriers to referral. Both CHWs and traditional healers agree that clients that follow referral are willing to do so because they are feeling sick (61% of CHWs, 38% of traditional healers); because the client thinks that they will improve (42% of CHWs, 39% of traditional healers); and because the CHW or traditional healer has said so (26% of CHWs, 24% of traditional healers). While nearly a third of traditional healers say that clients follow referral because they know that the traditional healer cannot treat them (30%), only 16% of CHWs cite this reason. Few community-based providers cite quality of care issues (e.g. client thinks the care will be good there – 9% of CHWs, 7% of traditional healers) or issues of cost (5% of CHWs, 5% of traditional healers) or transport (2% of CHWS, 0% of traditional healers) as reasons that clients that follow referral are willing or able to do so (see Table 24). Table 25 provides CHW and traditional healer views on why referred clients are unable or unwilling to follow a referral. Most frequently cited by both provider types is the issue of cost (48% of CHWs, 22% of traditional healers). Also commonly cited by both provider types are issues of stigma and fear including fear of the next stage (24% of CHWs, 26% of traditional healers); fear of death (24% of CHWs, 15% of traditional healers); and fear of stigma (16% of CHWs, 12% of traditional healers). Both CHWs and traditional healers noted quality of care issues including client perception of poor care at the referral site (16% of CHWs, 18% of traditional healers) and client perception that they will not improve (15% of CHWs, 23% of traditional healers). Preference for traditional healers was mentioned by 22% of CHWs and 12% of traditional healers as a reason that referred clients fail to follow referral advice. While CHWs did not mention client fear of mixing traditional medicine with Western medicine, 20% of traditional healers cited this as a reason that referred clients fail to follow referral advice. Less frequently mentioned were transport (9% of CHWs, 1% of traditional healers) and distance (2% of CHWs, 4% of traditional healers) as reasons that referred clients fail to follow referral advice.
Final report_ Linkages and Referral Report SD 2008 36

Table 24 Proportion of CHWs and traditional healers reporting specific reasons that referred clients are able or willing to follow a referral
CHWs Traditional Healers (n=246) (n=74)
% n %
n Client is feeling sick 61% 150 38% 28 Client thinks they will get better 42% 104 39% 29 CHW/traditional healer said so 26% 63 24% 18 Because the CHW/traditional healer can’t treat 16% 39 30% 22
Client thinks the care will be good 9% 22 7% 5 Client thinks the medicines will be there 8% 20 5% 4 Client has no choice 7% 18 4% 3 Client is able to pay 5% 12 5% 4
Client has transport 2% 5 0% 0 Client is educated on the use of health facilities 2% 4 0% 0 Other
2% 5 4% 3
CHW other: CHW will follow up with client (n=1); client is afraid to die (n=1); ready to accept HIV status (n=1); have witnessed clients with same disease (n=1); know dangers of HIV/AIDS (n=1). Traditional healer other: they want to check their HIV status (n=1); for TB diagnosis (n=1); they accept their HIV status (n=1); they understand the reason for referral (n=1)
Table 25 Proportion of CHWs and traditional healers reporting specific reasons that referred clients are unable or unwilling to follow a referral CHWs Traditional Healers
(n=244) (n=74)
CHW other: belief that they will be healed at home (n=1); outside influence (n=2); ignorance (n=1); loss of will to live (n=1); laziness (n=1); they don’t care (n=1); do not want to be admitted (n=1); stubbornness (n=1); addiction (n=1); don’t believe in HIV/AIDS (n=1); those who are very sick (n=1);
% n % n Clients do not have money 48% 118 22% 16 Clients fear the next stage 24% 59 26% 19 Clients fear they will die 24% 59 15% 11 Clients prefer traditional healers 22% 54 12% 9 Clients think they will be discriminated against or 16% 40 12% 9 Stigmatized Clients think the care is not good there 16% 39 18% 13 Clients do not think they will get better 15% 37 23% 17 Clients do not have transport 9% 23 1% 1 Clients do not want to be recognized as HIV+ 3% 8 0% It is too far 2% 6 4% 3 Clients think the medicines are not at the referral site 2% 5 5% 4 Clients do not want to test for HIV 2% 6 1% 1 Clients do not want to start on ART 2% 5 1% 1 Shortage of staff and/or long wait at the referral site 1% 3 0% 0 Fear of mixing traditional & Western medicines 0% 0 20% 15 Clients always follow referral advice 1% 2 0% 0 Other 4% 9 3% 2
Final report_ Linkages and Referral Report SD 2008 37
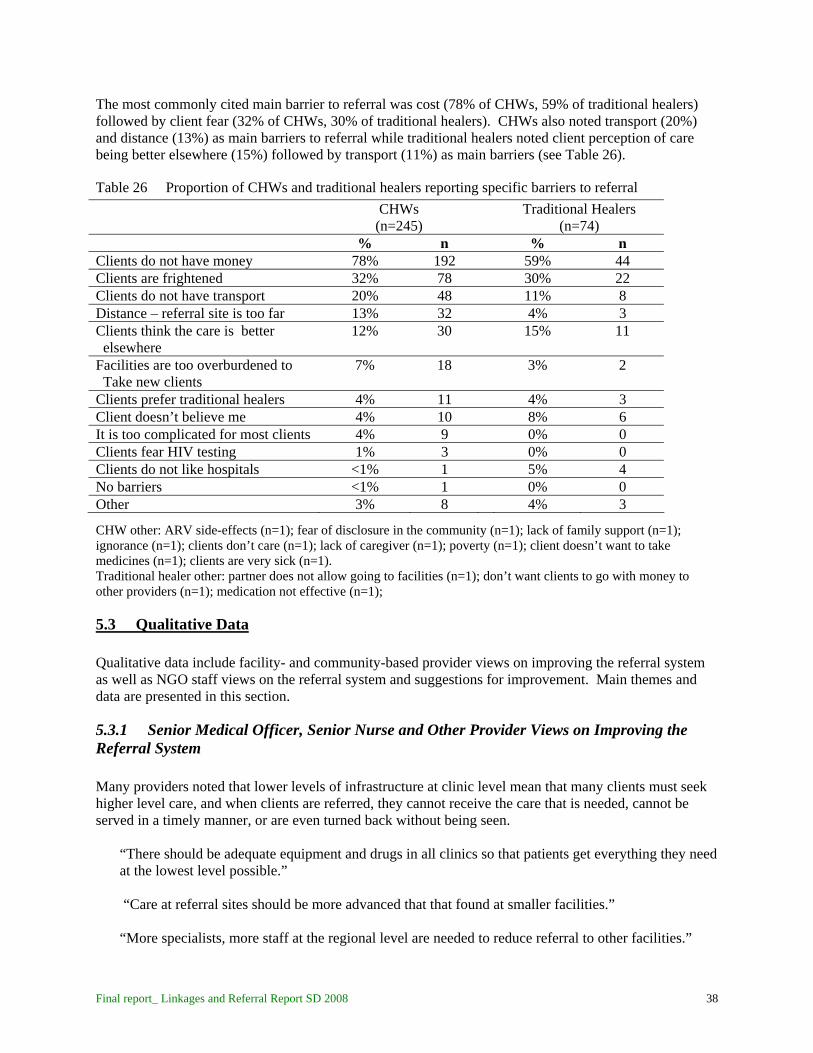
The most commonly cited main barrier to referral was cost (78% of CHWs, 59% of traditional healers) followed by client fear (32% of CHWs, 30% of traditional healers). CHWs also noted transport (20%) and distance (13%) as main barriers to referral while traditional healers noted client perception of care being better elsewhere (15%) followed by transport (11%) as main barriers (see Table 26).
Table 26 Proportion of CHWs and traditional healers reporting specific barriers to referral
CHWs Traditional Healers (n=245) (n=74)
% n %
n Clients do not have money 78% 192 59% 44
Clients are frightened 32% 78 30% 22 Clients do not have transport 20% 48 11% 8 Distance – referral site is too far 13% 32 4% 3 Clients think the care is better 12% 30 15%
11
elsewhere Facilities are too overburdened to 7% 18 3%
2 Take new clients
Clients prefer traditional healers 4% 11 4% 3 Client doesn’t believe me 4% 10 8% 6 It is too complicated for most clients 4% 9 0% 0 Clients fear HIV testing 1% 3 0% 0 Clients do not like hospitals <1% 1 5% 4
No barriers <1% 1 0% 0 Other 3% 8
4% 3
CHW other: ARV side-effects (n=1); fear of disclosure in the community (n=1); lack of family support (n=1); ignorance (n=1); clients don’t care (n=1); lack of caregiver (n=1); poverty (n=1); client doesn’t want to take medicines (n=1); clients are very sick (n=1). Traditional healer other: partner does not allow going to facilities (n=1); don’t want clients to go with money to other providers (n=1); medication not effective (n=1);
5.3 Qualitative Data Qualitative data include facility- and community-based provider views on improving the referral system as well as NGO staff views on the referral system and suggestions for improvement. Main themes and data are presented in this section.
5.3.1 Senior Medical Officer, Senior Nurse and Other Provider Views on Improving the Referral System Many providers noted that lower levels of infrastructure at clinic level mean that many clients must seek higher level care, and when clients are referred, they cannot receive the care that is needed, cannot be served in a timely manner, or are even turned back without being seen.
“There should be adequate equipment and drugs in all clinics so that patients get everything they need at the lowest level possible.” “Care at referral sites should be more advanced that that found at smaller facilities.” “More specialists, more staff at the regional level are needed to reduce referral to other facilities.”
Final report_ Linkages and Referral Report SD 2008 38

Providers described a need for a referral system with clear protocol. This is important so that higher level facilities are not overburdened with clients that can be served at lower levels. In addition, providers lack a schedule of services offered at other facilities. A referral directory is reportedly needed.
“There is no national referral system. There needs to be one in place. There must be a system for referral within facilities and between facilities. There should be a system in place so that not just anyone can walk into the regional referral hospitals.” “Bigger hospitals should be kept for referrals only. But instead people go there for minor illnesses. So, then when patients go there, there are very long lines or they aren’t even helped. When we refer to the hospital, the patients come back saying they weren’t served.” “There is a claim that we are the national referral hospital but we are not. We are a walk-in facility, so we should truly be a referral facility where patients who come here have been referred from lower level facilities.”
“[The system would be improved by] a national directory for referrals.”
Many providers indicated a need for communication and feedback between providers. In some cases, this is hindered by a lack of reliable communication channels. It is also hindered by a lack of institutionalization of communication and feedback as part of the referral process.
“We need proper communication tools like telephones so that we can call ambulances and make follow-ups with referral sites.” “We need communication means to contact facilities where clients have been referred.” “The discharge feedback portion of the referral card is never completed and returned to us. We don’t know why this is happening, but when patients come back to me they don’t have the cards with feedback.”
Several providers noted that referred patients should be fast-tracked at the referral site rather than have to wait in the same lines and go through the same registration process and steps of reevaluation that those who arrived without a referral go through.
“When a person moves from one facility to another with a referral form, he or she must not be made to stand in long lines; they must be made first priority.” “Referred patients should not be made to restart the registration process at the new sites.”
Transportation was a very common theme among provider reports on barriers to referral that need to be addressed.
“Transport can help the referral system improve because it will be easy [for the client] to get to the next facility where they were referred. Transport is a barrier to referral.”
Many providers talked about a need for a standard referral form, for referral forms that are always in stock/available, and forms to be used consistently and properly.
“Referral cards need to be updated so that they give comprehensive information.”
Final report_ Linkages and Referral Report SD 2008 39

“[To improve the system,] come up with a comprehensive form with all information to facilitate easy treatment for referred patients.” “We need a steady supply of referral cards.”
Providers and senior medical officers/senior nurses were asked to describe steps necessary to improve the referral system for HIV and AIDS services. As noted in responses on the steps needed to improve the general national referral system, the theme of poor infrastructure was often cited, particularly provision of ART and CD4-count at more levels and on more days, and more staff in HIV and AIDS services.
“Increase the staff to avoid long queues. The HIV/AIDS services must be provided daily not on specific days only.” “The biggest problem is CD4 count. It must be done every day. There shouldn’t be just specific days. They should increase capacity through more staff and equipment to deal with the volume.” “Decentralize ART refills so that they are accessible to all.” “We want to improve the services here so that we don’t [have to] refer.”
Related to the issue of infrastructure, providers commented on a need for comprehensive care available to clients.
“[There is need for] one stop shop for HIV and AIDS services in every facility.” “We need to supply patients with food, transport and medication.”
Communication was also mentioned as important to improve referral for HIV and AIDS services.
“[The system would be improved] if we could have clear communication between doctors when HIV/AIDS patients are referred.”
Monitoring patients or following up on the care they receive and their adherence to treatment was mentioned by some providers as necessary to improve referral.
“HIV positive patients that are referred to other centres for refills should also be monitored so that patients do not get lost in the system. Patients who are HIV positive who are defaulting and not honoring their return dates should be followed up.”
As was noted quite frequently in responses related to improving the national referral system, addressing transportation was noted as an important step in improving the referral system for HIV and AIDS care.
“Transport is crucial for the HIV positive patients to check CD4 count and viral load. Otherwise they don’t go.”
The need for a referral system with clear protocol was identified by providers.
“There should be set out rules on steps to follow when referring HIV positive patients.” “Every ART centre should have standard referral forms that are filled when referred.”
Final report_ Linkages and Referral Report SD 2008 40
Finally, some providers spoke about the need to improve community-based care and linkages between facility and community care.
“HBC is very little but very needed. There is not adequate community-based care.” “So far, even when there may be a protocol for discharging or referring to the community or local clinic, these procedures are not followed by the providers. And so the patients don’t know what to do and can feel like providers just want them to die.” “Strengthen HBC. When we refer for HBC, we basically refer them to ‘the community.’ But we don’t actually know if there are any structures in place to care for the patients.”
5.3.2 Community Health Worker Views on Improving the Referral System CHWs were asked to provide suggestions to improve the referral system. Many of them noted that to improve the referral process, facilities should be more responsive to them when they bring in clients.
“When we arrive with a client at the hospital or clinic, they have to consider us as their wing. The health facilities must act quickly when we arrive with clients. The health facilities must also listen to our issues and consider them.”
CHWs suggested that facility staff use them as sources of information on clients referred.
“[The system can be improved] by giving the health provider more information about the condition of the client because I am able to observe all of the symptoms, so I can provide this information.”
CHWs also felt that to improve referral, health providers should trust and respect CHWs
“They should give us attention as CHWs since we are also health workers. The nurses shouldn’t look down upon use when we arrive at hospitals.” “The majority of the providers in the health facilities have pride. They look down upon us as CHWs and that makes us feel inferior and scared to go the health facilities.”
One made by some was for CHWs to come together on a regular basis with health facility staff to share ideas.
“We as CHWs want to meet with the health facilities to share ideas on how we can make our work easier in treating our clients.”
CHWs expressed a desire to have providers visit patients in the community so that those unable to access facility-based care can be treated. CHWs also expressed a desire to work together with facility providers in home-based care activities.
“When the CHW tells the provider in the health facility about very sick clients in the community, the provider must respond quickly without delaying and go and check the client.” “Team up with CHWs in doing home-based care. Health workers in facilities must work together with CHWs in taking care of patients in communities.”
Final report_ Linkages and Referral Report SD 2008 41
CHWs would like adequate supplies and medication and training to carry out their work. They would like to be able to do more for clients in the community so that facility visits can be minimized and so that where facility care is necessary, clients will not arrive in as critical condition having received initial basic first aid.
“The health facilities should provide us with adequate medication so that clients can reach the hospital having taken the first aid treatment that we provide.” “[The system can be improved] by training the CHWs more about health and referral so that we can advise our clients to attend health facilities.”
There is also agreement that CHWs must refer patients to health facilities in good time and when they are very sick.
“[The system will be improved] if we as CHWs can refer clients at earlier stages to health facilities.” Finally, CHWs report that the referral system could be improved with more access to means of transporting patients.
“They [the health facility] should allow us to have or use their transport in cases where the patient is very sick.”
5.3.3 Traditional Healer Views on Improving the Referral System To improve the referral system, many traditional healers emphasized the importance of mutual referral.
“If providers must refer clients to traditional healers if they cannot manage the symptoms. The traditional healers must also refer clients to health facilities for services like HIV testing.”
Some traditional healers reported the need for traditional healers to refer to health facilities.
“Traditional healers should refer HIV patients to the hospital rather than keeping them in their homesteads.”
Many noted that health facilities should refer to traditional healers when appropriate.
“We as traditional healers want the health facilities to recognize our healing. They should refer clients that they are unable to treat to us so that we can treat them if we are able.”
Traditional healers suggested coming together with providers to share ideas.
“[The system could be improved] if we as traditional healers can occasionally meet with the health facilities to share ideas because there are things that we don’t know that they know and they also don’t know what we know.”
Many traditional healers expressed desire for facility providers to respect traditional healers and traditional medicines.
Final report_ Linkages and Referral Report SD 2008 42

“Health facility workers should allow patients to use traditional medicines since some diseases cannot be cured in hospitals but by traditional medicine.”
5.3.4 NGO Experiences with Referral and Suggestions for Improvement Staff working in direct service and management of HIV and AIDS programs gave perspectives on the NGO experience with referral. NGOs both refer and receive referrals. Staff noted receiving referrals from health facilities for services including hospice care, palliative care and home-based care. Staff reported referring clients from their clinics, support programs (e.g. HBC, support groups) and/or mobile VCT programs to government and mission facilities for general outpatient services, ART, CD4 count, TB diagnosis and treatment and pediatric services. They also refer to other NGOs and community-based care for support services such as support groups or HBC. In terms of general perspectives on the referral system, providers noted that referral is happening to a certain extent, but that referral formalized by a written form and characterized by feedback is not common.
“I don’t think we are helping people that much in terms of referral. Most PLHA are not receiving formal referrals as such. I think people are looking for a one-stop shop at the community level but these are not available. People would really appreciate at the community level if they could access the care they need.” “Referral is not something most people are experiencing. When there is referral, usually it’s verbal and when you get there you start afresh. Those are the complaints we have had. You find that people degenerate in the process and they get more ill in the mean time.” “Referral is happening to a certain degree. Right now the referral that is happening is mostly verbal only. When it is only verbal, you don’t know if the referral is working or not. For example, when we refer people from the community to a facility by verbal only, we don’t know the result. If referral was written and more formal, we could follow the clients. We could track where patients are.” “We do referrals but I must say, as it is in the country, our referral system is very weak if non-existent….Some of them get lost to us, some of them come back. Because we don’t have a referral system where we track referrals or even liaise with the hospital to find out if the mother has been to the hospital as per the referral.”
NGO staff were asked to describe the barriers to referral. One of the barriers commonly noted was lack of communication and feedback.
“Community health workers/rural health motivators do not know the services that their clients are receiving at facilities and the need for follow up that they could be a part of. Referral and communication isn’t taking place between communities and facilities.” “For example, if people test for HIV, we do not have the CD4 machines on the mobile clinic, so we refer for these services to the national hospitals. This is a challenge – we don’t know if the people will access the services.”
“There is no formal system for communication and referral. You may find cases of relationships between certain providers but these are informal relationships. We have some of our own relationships with certain providers. But there is no formal system.”
Final report_ Linkages and Referral Report SD 2008 43
“It is tiresome to move between facilities. I’ve had people say, ‘no I have to move to another facility, and then they will tell me to go to another facility.’ It is tiring and people just decide to go home. Part of why it is tiresome is because there is no communication to ensure a continuum of care for clients that have been referred. They are moving on their own without support from the provider(s) who referred them.”
The lack of communication was noted specifically to be a problem in that referral sites do not know the history of the referred client.
“In receiving clients who have been referred, the issue is that continuum of care is not clear in many instances, it’s not clear where to start with the client. You don’t know their history. With a referral form, you could know the client’s history and take it from there.” “There is no information that is sent with the patient when they are referred to us and so we have no idea of the history or what has been done.” “Providers not communicating – we don’t have the tool for communication. We need the tool that we can fill that says ‘I have seen this client,’ and that gives details on the history so that the provider knows what to do with the client.” “Even for our community careers – we have no standardized form. They just send the patients to us saying ‘she is sick.’ We don’t know what the carer knows about the history.”
NGO staff described stigma and client fear as barriers to referral.
“HIV related stigma [is a barrier]; when you go to the VCT/ART centre – you will be identified as someone with HIV. Even coming to Hospice, even though we deal with all terminal conditions, now are known as an ‘AIDS hospital.’” “The issue in moving to another provider is often fear of lack of confidentiality. So clients don’t feel safe to go from one provider to another. So they may not go to the provider because they don’t trust that there will be confidentiality. Confidentiality is better in the community. It’s the hospital that clients fear is where they will have confidentiality broken.”
“Lack of knowledge about ART [is a barrier]. People still have myths about ART. If they are referred for initiation, I will counsel them but they might not believe me and have other thoughts about the toxicity and side effects of ART, or that ART causes death so they won’t go.” “Maybe it’s the attitude of the client- fearing stigma if they go to the ART/VCT centre.”
Quality of care issues were also frequently cited as barriers to referral.
“Provider behavior – patients perceive that providers don’t treat them well so they don’t follow the referral. They may instead go to another site of their own choosing because they don’t like the facility they were referred to.” “Attitude of health workers [is a barrier]; someone might have been ill treated by a provider and so the patient won’t want to go back there.”
Final report_ Linkages and Referral Report SD 2008 44
“Sometimes it is we nurses, we don’t explain clearly to the client – we just say ‘go to the government hospital’ – not telling the client that you will find the line, you will use the referral letter. We don’t give clear explanation on exactly where to go and what to do.”
Quality of care issues also included the problems of lack of infrastructure including adequate staff and equipment.
“CD4 count issues we also hear – there needs to be more machines and capacity to test CD4. What we’ve proposed before is that lab techs don’t need to have a medical background – they can be trained in 6 months and can do this work, instead of having the same doctors or nurses who are processing the lines, taking the blood and following up the samples, add lab techs to do the lab work.”
“Long lines at the referral sites [are a barrier]. [Clients] may be turned away and not seen because facilities only take a certain number in each day. So the client may have spent all of his or her money to come from far away only to be turned back.”
“Equipment is not there. You may refer to a clinic or facility for investigations and the patient will be told there is no equipment for that. The equipment needs to be improved so that clients don’t travel a long distance only to not be served. For example… some centres have some equipment but it’s not in working order and it isn’t fixed after it breaks down.”
“Also the staff needs to be improved. The numbers are not enough. And so the way they treat the clients – it is not good because they are stressed.” “Overload [is a barrier]. I find myself saying ‘go to RFM’ without writing the referral. At times this is due to lack of stationary. At other times it is because of overload. Not following proper referral procedures – like not giving the referral forms. There should be some enforcement that you don’t do verbal, only written referral on a standard form. The patients should know that they need a referral form and demand it from the provider.”
Some staff noted inadequate infrastructure at community level as a barrier to referral; adequate services such as HBC and palliative care are lacking.
“For palliative care, we are very limited in Swaziland. We don’t put much into HBC and palliative care. There are many communities doing HBC but they don’t even have basic kits like gloves… So when you refer a patient from hospital to home for HBC, the system for HBC and palliative care is not concrete. You find it is the family who is taking care of the patient with no information on how to protect themselves or care for the patients. Not enough people are trained, or they don’t have the materials.”
Finally, some NGO staff noted issues of cost and distance as barriers to referral.
“Poverty [is a barrier]; when we say your CD4 is very low, you must start ART – then as hospice I must refer to RFM, but the patient will not have bus fare to go there.” “Traveling long distances to refill ARVs so you find people defaulting [is a barrier].” “Distance is a problem, because people haven’t got money to go long distances.”
Final report_ Linkages and Referral Report SD 2008 45

NGO staff provided several suggestions to improve the referral system. Many of these suggestions surrounded a more formalized referral protocol with communication procedures and tools including a standardized form in place.
“As service providers, we should come together and define our referral system and procedures so that we know very well – everyone is using the same system, we come up with a unified system for the country for referral.” “We need a uniform referral form that comes from each institution – if you’re NGO, private, government. We get many different referral forms, or some are just verbal referral and then you have no idea what was going on – just the patient report.” “Sometimes you refer a client to a facility and you don’t know if the client accessed the service or not. So if there could be standard tool for feedback – to say that this client was able to access the service that you referred him or her to.” “The follow-up. I’ve referred to you, is there a way of giving me feedback that the client was received and the findings in writing including feedback for how we should continue with care or advice to us on how to proceed with medical follow up.” “Doctors who refer to us never request a feedback, so we too are not communicating with the referring doctor. The form should have a place for feedback so we can give that to the referring doctor or nurse.” “Systematic referrals and acknowledgement of referral. Like if a patient has been diagnosed at one facility, that should be acknowledged at the next site so they don’t need to go through diagnostics again at the second site – especially with TB. Introduce formal procedures – forms with information about the patient that say this patient has been referred instead of just word of mouth.”
Staff noted in the need for referral protocol the specific need for defined levels of care and a protocol for clients seeking care first at primary level and when necessary, referred to tertiary levels.
“Development of primary health care. So the bottom level is available to deal with many of the patients who seek care at the top levels, and to effectively manage PLHA.”
“Our Ministry should have the levels of care – from clinic you refer to health centre, then to hospital. No jumping levels. This would help prevent overcrowding in hospitals. If something could be done at a health centre, then the patient should not go to the hospital.”
“Ideally I think at the regional level there should be primary health care and then referral up to the bigger centres. But you find people go straight from home to the referral hospital. And I would think it would be better to start at primary health care… From that point, if it can’t be handled, refer to larger institutions.”
In part, the ability for clients to be served at lower levels of the health care system is reportedly hindered by lacking infrastructure at clinic level, particularly in management of ART.
“Capacity at clinic level needs to be built up. We have challenges managing at tertiary intuitions, because there are too many patients and at the same time, at clinics there is no one there accessing care. So if we can build this capacity at clinic level – like ART management, management of PLHA,
Final report_ Linkages and Referral Report SD 2008 46

management of symptoms like diarrhea, collecting sputum, refills of ART – these things if done at clinic level would relieve the larger facilities.”
“There are such long lines for refills at larger facilities – if only this were done at clinic level, this would reduce the crowding. So we have here underutilization of the primary health care system.”
NGO staff also noted that service at community level is hindered by weak HBC and palliative care systems and a lack of communication between providers at facility and community levels.
“[There is] need for more strengthening of HBC and palliative care – basic supplies for these providers and scaling up so that patients can be dealt with at the community level.”
“There needs to be more linkages with CHW/rural health motivators so that those community-based workers are able to refer people to a local facility that offers a comprehensive package of services, and facilities can refer back to them for follow up.”
“NGOs, and also government facilities, they should know who exists at community level in terms of who is there and what they are providing. After that has been identified, there should been meetings between community and facility workers to communicate.” “There should be a referral card that the rural health motivators can use, and monitor the progress that is being made. For example, issues of adherence, a facility cannot really address this but if there is a referral system with communication between facility and community worker, the community rural health motivators can use the information on the card to follow up and provide this type of support. Then we could say that we are really assisting PLHA.”
6. Discussion Exploring linkages and referrals for HIV and AIDS services in the context of large-scale ART roll-out and care and treatment for people living with HIV and AIDS is complex and by definition, this brief report only begins to present the results of a rich and detailed data collection effort. It is worth reviewing the study’s primary questions: How is referral understood? How are decisions to advise and accept referral made? What are the major barriers to smooth referral? How could referrals most effectively be tracked in Swaziland? The remainder of this section explores these questions as well as study limitations.
6.1 Understanding Referral This study provides evidence that referral is quite common among both facility-based and community-based providers, and is most commonly understood as sending clients to seek care at higher level health care facilities, most notably hospitals, as opposed to sending clients back down the referral pyramid for treatment, care or support at lower levels of the formal health care system or from community-based providers. This understanding was true among providers at clinics, health centres and hospitals as well as among traditional healers and CHWs; each of these provider groups most frequently cited hospitals as the most common referral site given to their clients with the exception of CHWs who frequently cited referring clients to hospitals and also frequently cited referring to clinics. Frequency of referral from hospitals down to health centres or clinics was found to be very low. While typically an uncommon practice in general, referral by facility providers to community-based care was found to be notably high for home-based care, and somewhat practiced for psychosocial support and palliative care.
Final report_ Linkages and Referral Report SD 2008 47

While NGO staff reported both receiving and making referrals to health facilities, NGOs were not frequently cited by either community-based or facility-based providers as referral sites. However, NGOs were cited by a limited number of facility-based providers for specific services including palliative care, home-based care, psychosocial support, family planning, nutrition support services and counseling about HIV and AIDS. The data also suggest that referral is an individualized process that depends on various factors. When examining referral practices across a large menu of facility-based services, referral was found to be a quite common practice even for services provided by the referring provider/facility (i.e. both provision of and referral for specific services such as concurrent infections diagnosis or treatment). Referral is most commonly made for services provided by a facility in certain cases where the provider or facility cannot serve the particular patient with that service. Factors such as complications requiring higher level care, referral for clients to access care closer to home or at a lower level, and lack of supplies are reasons for these types of referral. In addition, for many services, around a quarter of facility-based providers reported using more than one referral site indicating that different circumstances call for sending clients in need of the same service to different referral sites. The study suggests that referrals and linkages for certain services are particularly weak. These services are those that are primarily taken up by community providers and include nutrition support services, psychosocial support, palliative care and home-based care. For these types of services, common referral sites included hospitals but also NGOs and community-base care. However, some providers explained that when referring to “the community,” formal structures or linkages do not exist; instead clients are left to search for community-based care on their own. CHWs echoed this concern in expressing a lack of communication with facility-based providers. In addition, some providers reported having no referral outlet for these services that were additionally not offered by the facility meaning that clients are left with no outlet for treatment or care. The qualitative data supported these findings, with facility providers and NGO staff noting both weak systems of care in the community as well as poor linkages between community-based care and facility-based care. Respondents noted that stronger community systems and better communication would improve client care and reduce the burden on facilities.
6.2 Accepting Referral: Client Behavior In trying to understand client behavior from the perspective of facility- and community-based providers, different factors emerged to explain either following or failing to follow referral advice. Among all providers, taking up a referral was thought to occur among clients who think they will improve, because they trust the provider’s advice and because they are feeling sick. However, providers agree that failing to follow a referral occurs among clients unable to pay the cost of transport and/or care. Facility-based providers emphasized lack of transport and perceptions of poor care at the referral site as factors that influence client behavior. To some extent, they also cited fear of stigma, the next stage, not improving and death as factors at work when clients fail to follow referral, although when asked about specific problems that PLHA face when seeking care and in following referral, facility-based providers as well and NGO staff cited poor quality of care including not being served in a timely manner as well as stigma and discrimination. They also spoke of lack of comprehensive care including ARVs. Returning to the question of why clients do not follow referral advice, traditional healers and CHWs placed more emphasis on issues of stigma and fear as barriers to following referral, and less commonly cited quality of care issues. In addition, it was community-based providers that noted preference for traditional medicine and/or fear of mixing traditional and Western medicines as factors that influence client behavior.
Final report_ Linkages and Referral Report SD 2008 48

6.3 Barriers to Referral A common barrier to referral noted by all provider groups was the cost of care. While facility-based providers also placed importance on transport as well as poor care at the referral site and lack of good communication within the system as important barriers to referral, CHWs and traditional healers frequently cited client fear. Transport and distance were also noted by some CHWs as barriers although less frequently reported by traditional healers. Although this study does not gather information on barriers to referral from referred clients who did not follow referral advice, from the clients that were interviewed at health facilities, on average they traveled one hour and typically paid E/R 20 roundtrip. While this amount of time and cost may be manageable, providers have also noted that other costs of services such as facility fees, medication, food and accommodation may be prohibitive. The issue of transport and cost of seeking care deserves more analysis to understand all factors involved; merely adding more ambulances as was suggested by many facility-based providers and CHWs, may be an expensive and insufficient way of dealing with the issue of clients failing to follow referral advice. In understanding provider behavior, communication is a constant theme emphasized for its importance in ensuring that clients receive necessary care in a timely manner and that feedback is given to ensure necessary follow-up from the referring site. About half of facility-based providers said they had knowledge of what happened with the last client they referred for HIV and AIDS, while nearly all CHWs and most of traditional healers reported trying to get feedback on referrals made. Feedback, particularly for community-based providers, is not provided through formalized communication channels with facilities but instead most often comes from clients themselves and sometimes from family reports.
6.4 Improving the Referral System CHWs, traditional healers and facility providers all recommended referral protocols to be put in place with communication tools, most notably a common referral form that includes sections for detailed history as well as feedback to be returned to the referring provider. While facility-based providers most often emphasized need for better communication between facilities, community-based providers consistently emphasized the need for better linkages between themselves and facilities in order to improve access to timely and appropriate care. All stakeholders feel that increased communication between community and facility and between facilities will improve client care by providing necessary information to the referral site and feedback to the referring site to support the continuum of care. CHWs and facility-based providers alike described a need for priority to be given to clients that they refer upon arrival at the referral site. They also both expressed a desire for strengthening care at their respective levels. CHWs expressed desire for the necessary equipment, training and support from health facilities to minimize the need for referrals when care can be provided in the community. NGO staff also frequently spoke of the need to improve community-based services including palliative care and HBC. Similarly, NGO staff and facility-based providers spoke of the need to offer comprehensive care to PLHA at the lowest levels possible, and also often expressed the desire to have more staff and service (e.g. CD4 count capability) available at their sites to better service clients and obviate the need for referral. NGO staff and providers at all levels also expressed the need for referral facilities to have adequate staff and equipment (particularly CD4 count machines) to serve referred clients with the services that they need and in a timely manner.
Final report_ Linkages and Referral Report SD 2008 49

6.5 Study Limitations Due to resources available, it was not feasible to interview members of the general population who were not already clients within the system. In other words, participants were those who had successfully navigated the health system. This study can only understand the perspectives of those clients who are unsuccessful through the reports of providers and staff based in the community, at health facilities and NGOs. Reporting bias, or socially acceptable response patterns, is always a possible problem in any survey but perhaps especially in this context where providers may have felt there was an element of monitoring. In addition, clients, CHWs or traditional healers may have perceived potential to receive something if they gave “acceptable” or needy responses. Interviewer bias may also have been an issue in this study as it emerged during the training and field work that there were still levels of denial and misunderstanding around HIV even in this group of well educated Swazis. One challenge reported from the field was interviewing ART/ VCT clients in comparison with general OPD clients. With VCT clients, many were eager to leave the facility immediately after testing, even if before going for their results, they told the interviewer they would participate. In the case of ART clients, in some facilities the clients were receiving medicine inside the provider’s office and thus did not need to line up at the dispensary and thus after waiting all morning to see a provider, were eager to leave immediately afterwards. Because of these constraints, interviewers conducting client interviews generally preferred the outpatient department. A source of selection bias in this study is that clients that participated in the study were reasonably well and were attending the facility for their own treatment needs. Thus, the very sick or their caretakers were not interviewed. Inpatients nor indeed children (under 18) or their caretakers were eligible for interview. It must be kept in mind when interpreting the results of this study that referral is understood in different ways by different providers. Some understand referral to be the process of transferring clients to another facility, sometimes actually physically transporting them in health facility ambulances. Others, particularly in larger facilities, include in their understanding of referral sending clients to other departments within the same facilities. Furthermore, when interpreting the perspectives and experiences with referral of providers at specific facilities and facility types, it is noted that there are discrepancies in provider reports of referral practices that occur within the same facility (e.g. referral practices for ART). Multiple providers were interviewed at each facility, and they at times provided different responses on referral practices due to their location in different departments (i.e. of large facilities) that have different referral practices and/or are not familiar with other practices within the facility. For example, referral record keeping systems and forms are different in ART versus OPD, and providers working in, for example, OPD are not always familiar with protocols in VCT, PMTCT or TB. Finally, reports from the field indicate that some providers were clearly frustrated with the questionnaire, noting that it doesn’t capture the true picture of procedures and provider behavior. Everything depends, and behavior and procedures are not as straightforward as the line of questioning appeared to be making them. This is a valid comment and it is what makes referral such a challenging area. Providers will often report that referral depends on many factors, and yet health systems require a certain amount of protocol be followed for efficiency and quality of care. The tension between protocol and flexibility in practice will persist to some extent, however addressing discrepancy between these dimensions will be an important challenge for many countries to address in order to improve patient care at reasonable cost.
Final report_ Linkages and Referral Report SD 2008 50

7. Conclusions and Recommendations This study sought to understand referral from various perspectives so as to inform decision makers on ways to move forward to reform the national referral system in Swaziland. Although there was an initial focus on the referral needs are the ART system and generally around HIV treatment and care, the study is applicable to referral for many different diagnoses and issues (acute or chronic). As results discussed in the report suggest, improvement of the referral system can come through efforts aimed at standardizing and/or improving referral protocols, procedures and practices. However, improving the referral system also inevitably includes reforms of the health care system itself. These reforms include addressing client access to appropriate and timely services related to issues including distribution of services and human resources throughout the health care system. Study results point towards specific areas where the system is overburdened or lacks capacity, but the problems of capacity and resources are not uniform. As such, discrete short term reforms may alleviate some of the burden on the system. Other reforms will be more costly in terms of time and resources necessary for change. Below are two sets of recommendations based upon these results. First, are a set of relatively inexpensive, short-term items that might ease some of the burdens on the health system. Second, is a set of recommendations that are more long term, likely more expensive and that will require more planning.
Short-Term Recommendations Re-train on existing referral forms
Emphasize the feedback portion of referral forms
Revisit supply of forms (may be more of an issue at particular facilities)
Wide dissemination of the national HTC/VCT Referral Directory and Guide.
Develop a simple reporting system for facilities to track patients referred internally
Ensure community-based providers are involved in regional meetings
Develop mentoring and communication programs between providers and CHWs, particularly for
HBC and other health issues
Extend current hours of operation in clinics and health centres (i.e. beyond closing between 12-2pm)
Improve access to CD4 count by increasing hours and/or days of operation numbers of staff and
machines nationally
Final report_ Linkages and Referral Report SD 2008 51

Long Term Recommendations / Significant Changes Revise or develop a standard referral form with more space for observations and client history and a
substantial feedback section to be sent to the referring site
Train on the referral form and protocol at all levels and disseminate widely through government,
mission, private and NGO stakeholders
Develop a protocol for referral between facilities as well as between communities and facilities (i.e.
procedures for communication (specific channels, parties to be involved) and completion of forms) as
well as a protocol for referral record keeping and reporting
Appoint referral officers at each referral receiving site to track each referred patient
Continue to improve service provision for all HIV services at the lower levels to reduce burden on
upper levels and reduce need for some of the referrals
Computerize referrals made for clients on ART in order to properly track them through the system
(perhaps build on the existing computerized monitoring system under SNAP)
Use SMS to communicate regarding referred patients
Revisit the triage system at referral sites so that they become more focused on referral rather than
operating as a general health facility
While transport was mentioned frequently as an area to be addressed, perhaps transport – most frequently recommended were more ambulances – will not necessarily improve the situation if other factors are not addressed at the same time. For example, if the referred emergency patient arrives by ambulance but does not get treated quickly, or he/she has to begin the registering process again, then it may not have done much good to bring them in by ambulance. While it is an essential component of the health system, referral it is not well understood. It is a complex phenomenon, interpreted by different actors in various ways. It is difficult to measure and challenging to train providers. This study has begun to address information gaps and points towards some reforms that if implemented, could improve collaboration and communication which are essential components of referral. The reforms could also relieve burden on particular points within the health care system. However, implementation of a revised or new referral system will require considerable resources and political and organizational commitment. Solitary reforms will not mend all problems. What is possible, however, is that with effective reform which produces a relatively efficient referral system the confidence in the whole system from both provider and patient perspectives will rise.
Final report_ Linkages and Referral Report SD 2008 52

References Akin, J.S. and Hutchinson, P. (1999). Health-care facility choice and the phenomenon of bypassing.
Health Policy Plan, 14, 135–151. Bapna, J. S., Tekur, D., Pradham, S. C., and Shashindran, C. H. (1991). Why clients prefer referral
hospitals. World Health Forum, 12(3), 344–345. Central Statistical Office (CSO) [Swaziland] and Macro International, Inc. (2008). Swaziland
Demographic and Health Survey 2006-07. Mbabane, Swaziland: Central Statistical Office and Macro International Inc.
Central Intelligence Agency [CIA] (2006). The World Factbook: Swaziland. Retrieved 18 December
2006 from https://www.cia.gov/cia/publications/factbook/geos/wz.html Health and Development Africa (HDA) Ltd (Draft). Draft Report: Study of the Health Service Burden of
HIV/AIDS and Impact of HIV/AIDS on the Health Sector in Swaziland Health and Development Africa (HDA) Ltd. and JTK Associates (2005). Study of the Health Service
Burden and Impact of HIV/AIDS on the Health Sector in Swaziland. Mbabane. Kelly, K. & Magongo, B. (2004). Report on Assessment of the Monitoring and Evaluation Capacity of
HIV/AIDS of Organizations in Swaziland. NERCHA: Swaziland. Leonard, K.L., Mliga, G.R., and Mariam, D.H. (2002). Bypassing Health Centers in Tanzania: Revealed
Preferences for Observable and Unobservable Quality. Journal of Africa Economies, 11(4). Macintyre, K. and Hotchkiss, D. (1999). Referral Revisited: Community Financing Schemes and
Emergency Transport in Rural Africa. Social Science and Medicine. 49: 1473-1487. MEASURE Evaluation, [USAID], United States Centers for Disease Control and Prevention (CDC),
National Emergency Response Council on HIV and AIDS [NERCHA], Swaziland National AIDS Programme (SNAP), Ministry of Health and Social Welfare [MOHSW], and the Government of Swaziland [GOS] (2006). Report of the strategic information assessment in Swaziland. http://www.cpc.unc.edu/measure/publications/pdf/tr-06-34.pdf
Ministry of Health and Social Welfare [MOHSW] (2001). Policy Document on HIV/AIDS and STD
Prevention and Control. Ministry of Health and Social Welfare [MOHSW], United Nations Development Program [UNDP],
National Emergency Response Council on HIV/AIDS [NERCHA], The HIV/AIDS Prevention and Care Program [HAPAC], World Bank, United Nations Population Fund [UNFPA], Swaziland National AIDS Program [SNAP], Joint United Nations Program on HIV/AIDS [UNAIDS], Coooperazione Italiana, and The World Health Organization [WHO] (2005). Ninth Round of National HIV Sero-surveillance among Women Attending Antenatal Care Services at Health Facilities in Swaziland, 2004.
Ministry of Health and Social Welfare [MOHSW] and the World Health Organization [WHO] (2003).
The Health Sector Response to HIV/AIDS Plan in Swaziland, 2003-2005.
Final report_ Linkages and Referral Report SD 2008 53
Ministry of Health and Social Welfare-Sexual and Reproductive Health Unit [SHRU], United Nations
Population Fund [UNFPA]. (n.d.). Report for Swaziland Community Health Survey. Ministry of Health and Social Welfare (MOHSW) and the World Health Organization (WHO). (2006).
Service availability mapping. Geneva: WHO. MEASURE Evaluation. (2001). Quick Investigation of Quality (QIQ): A User's Guide for Monitoring
Quality of Care in Family Planning. MEASURE Evaluation Manual Series, No. 2. Chapel Hill, NC: Carolina Population Center, University of North Carolina.
United States Agency for International Development [USAID] and The Centers for Disease Control and
Prevention [CDC] (2004). United States Government Rapid Appraisal for HIV/AIDS Program Expansion, Swaziland
Van Praag, E. (n.d.). “HIV Care and Support” Presentation from HIV/AIDS Prevention and Care
Department, Family Health International, Arlington, Virginia. World Health Organization (WHO). (2005a). Acute Care: Interim Guidelines for First-Level Health
Workers at Health Center and District Outclient Clinic. World Health Organization (WHO). (2005b). Health action in crises: Swaziland. Retrieved 18 December
2006 from http://www.who.int/hac/crises/swz/Swaziland_Aug05.pdf World Health Organization (WHO). (2004). Chronic HIV Care with ARV Therapy: Interim Guidelines
for First-Level Facility Health Workers.
Final report_ Linkages and Referral Report SD 2008 54

Final report_ Linkages and Referral Report SD 2008 55
Appendix A: Facility Services & Referral Practices
Table 27 Proportion of providers reporting specific facility services and referral practices Hospital
Providers (n=43)
Health Centre Providers
(n=37)
Clinic Providers
(n=81)
All Facility Providers (n=161)
% n % n % N % n Counseling about HIV & AIDS
Provide, don’t refer 74% 32 69% 25 69% 56 70% 113 Provide, refer 26% 11 31% 11 28% 23 28% 45 Don’t provide, refer 0% 0 0% 0 3% 2 1% 2 Don’t provide, don’t refer 0% 0 0% 0 0% 0 0% 0
HTC/VCT Provide, do not refer 72% 31 72% 26 52% 42 62% 99 Provide, refer 28% 12 28% 10 42% 34 35% 35 Don’t provide, refer 0% 0 0% 0 5% 4 3% 4 Don’t provide, do not refer 0% 0 0% 0 1% 1 1% 1
Medical follow up* Provide, do not refer 43% 18 32% 12 17% 14 28% 44 Provide, refer 57% 24 62% 23 73% 59 66% 106 Don’t provide, refer 0% 0 0% 0 7% 6 4% 6 Don’t provide, do not refer 0% 0 5% 2 2% 2 3% 4
Concurrent infections diagnosis***
Provide, do not refer 36% 15 29% 10 6% 5 19% 30 Provide, refer 62% 26 69% 24 80% 65 73% 115 Don’t provide, refer 2% 1 3% 1 12% 10 8% 12 Don’t provide, do not refer 0% 0 0% 0 1% 1 1% 1
Concurrent infections treatment***
Provide, do not refer 36% 15 26% 9 9% 7 20% 31 Provide, refer 62% 26 74% 26 77% 62 72% 114 Don’t provide, refer 2% 1 0% 0 15% 12 8% 13 Don’t provide, do not refer 0% 0 0% 0 0% 0 0% 0
TB diagnosis*** Provide,do not refer 47% 20 38% 14 4% 3 23% 37 Provide, refer 51% 22 59% 22 23% 19 39% 39 Don’t provide, refer 2% 1 3% 1 73% 59 38% 61 Don’t provide, do not refer 0% 0 0% 0 0% 0 0% 0
TB treatment*** Provide, do not refer 40% 17 32% 12 6% 5 21% 34 Provide, refer 49% 21 65% 24 38% 31 47% 76 Don’t provide, refer 12% 5 3% 1 56% 45 32% 51 Don’t provide, do not refer 0% 0 0% 0 0% 0 0% 0

Final report_ Linkages and Referral Report SD 2008 56
Counseling on PMTCT Provide, do not refer 70% 70 68% 25 59% 48 64% 103 Provide, refer 26% 11 30% 11 36% 29 32% 51 Don’t provide, refer 5% 2 3% 1 5% 4 4% 7 Don’t provide, do not refer 0% 0 0% 0 0% 0 0% 0
Hospital Providers
(n=43)
Health Centre Providers
(n=37)
Clinic Providers
(n=81)
All Facility Providers (n=161)
% n % n % N % N
PMTCT Treatment*** Provide, do not refer 63% 27 78% 29 35% 29 53% 85 Provide, refer 33% 14 19% 7 51% 41 39% 62 Don’t provide, refer 5% 2 3% 1 14% 11 9% 14 Don’t provide, do not refer 0% 0 0% 0 0% 0 0% 0
Nutrition support services* Provide, do not refer 60% 26 66% 23 36% 29 49% 78 Provide, refer 28% 12 26% 9 31% 25 29% 46 Don’t provide, refer 5% 2 3% 1 17% 14 11% 17 Don’t provide, do not refer 7% 3 6% 2 16% 13 11% 18
Palliative care** Provide, do not refer 44% 19 34% 12 14% 11 26% 42 Provide, refer 42% 18 37% 13 44% 36 42% 67 Don’t provide, refer 14% 6 20% 7 36% 29 26% 42 Don’t provide, do not refer 0% 0 9% 3 6% 5 5% 8
Home-based care* Provide, do not refer 36% 15 11% 4 20% 16 22% 35 Provide, refer 38% 16 39% 14 48% 39 43% 69 Don’t provide, refer 19% 8 28% 10 25% 20 24% 38 Don’t provide, do not refer 7% 3 22% 8 7% 6 11% 17
ART*** Provide, do not refer 53% 23 53% 19 19% 15 36% 57 Provide, refer 44% 19 44% 16 19% 15 31% 50 Don’t provide, refer 2% 1 3% 1 63% 51 3% 53 Don’t provide, do not refer 0% 0 0% 0 0% 0 0% 0
STI counseling & testing*** Provide, do not refer 71% 30 75% 27 37% 30 55% 87 Provide, refer 19% 8 25% 9 57% 46 40% 63 Don’t provide, refer 10% 4 0% 0 6% 5 6% 9 Don’t provide, do not refer 0% 0 0% 0 0% 0 0% 0
STI treatment*** Provide, do not refer 67% 29 56% 20 28% 23 45% 72 Provide, refer 26% 11 44% 16 68% 55 51% 82 Don’t provide, refer 7% 3 0% 0 4% 3 4% 6 Don’t provide, do not refer 0% 0 0% 0 0% 0 0% 0
Psychosocial support Provide, do not refer 47% 20 46% 17 33% 26 39% 63 Provide, refer 42% 18 35% 13 51% 41 45% 72 Don’t provide, refer 9% 4 11% 4 11% 9 11% 17 Don’t provide, do not refer 2% 1 8% 3 5% 4 5% 8

Hospital
Providers Health Centre
Providers
Note: n varies slight due to a few cases of “don’t know” which are excluded *Facility type X2 p<0.05 **Facility type X2 p<0.01 ***Facility type X2 p<0.001
(n=43) (n=37)
Clinic Providers
(n=81)
All Facility Providers (n=161)
% n % n % N % N Family planning***
Provide, do not refer 52% 22 89% 32 35% 28 52% 82 Provide, refer 19% 8 11% 4 53% 43 35% 55 Don’t provide, refer 29% 12 0% 0 11% 9 13% 21 Don’t provide, do not refer 0% 0 0% 0 1% 1 1% 1
Final report_ Linkages and Referral Report SD 2008 57

Final report_ Linkages and Referral Report SD 2008 58
Appendix B: Referral Sites for Specific Services
Table 28 Referral sites for specific services among providers that report referring for these services across facility types Hospital
Providers Health Centre
Providers Clinic Providers All Facility
Providers % n % n % n % n Counseling about HIV & AIDS
n=11 n=25 n=11 n=47
Hospital 18% 2 64% 16 27% 3 45% 21 Health centre 9% 1 0% 0 25% 6 15% 7 Clinic 18% 2 18% 2 0% 0 9% 4 Specialized Clinic 91% 10 45% 5 28% 7 47% 22 NGO 9% 1 18% 2 4% 1 9% 4 Community 0% 0 9% 1 8% 2 6% 3 Refers to >1 of the sites listed above
18% 2 18% 2 24% 6 21% 10
HTC/VCT n=12 n=10 n=38 n=60 Hospital 25% 3 30% 3 58% 22 47% 28 Health centre 0% 0 0% 0 21% 8 13% 8 Clinic 0% 0 20% 2 8% 3 8% 5 Specialized Clinic 83% 10 60% 6 42% 16 53% 32 NGO 8% 1 10% 1 11% 4 10% 6 Refers to >1 of the sites listed above
8% 1 20% 2 34% 13 27% 16
Medical follow up n=24 n=65 n=23 n=112 Hospital 88% 21 100% 23 80% 52 86% 96 Health centre 4% 1 13% 3 29% 19 21% 23 Clinic 13% 3 22% 5 3% 2 9% 10 Specialized Clinic 13% 3 9% 2 6% 4 9% 9 NGO 4% 1 0% 0 2% 1 2% 2 Community 0% 0 4% 1 3% 2 3% 3 Refers to >1 of the sites listed above
17% 4 30% 7 23% 15 23% 26
Concurrent infections diagnosis
n=27 n=25 n=76 n=128
Hospital 74% 20 96% 24 78% 59 80% 103 Health centre 0% 0 4% 1 26% 20 16% 21 Clinic 1% 4 4% 1 3% 2 3% 4 Specialized Clinic 22% 6 16% 4 14% 11 16% 21 Refers to >1 of the sites listed above
7% 2 12% 3 22% 17 17% 22
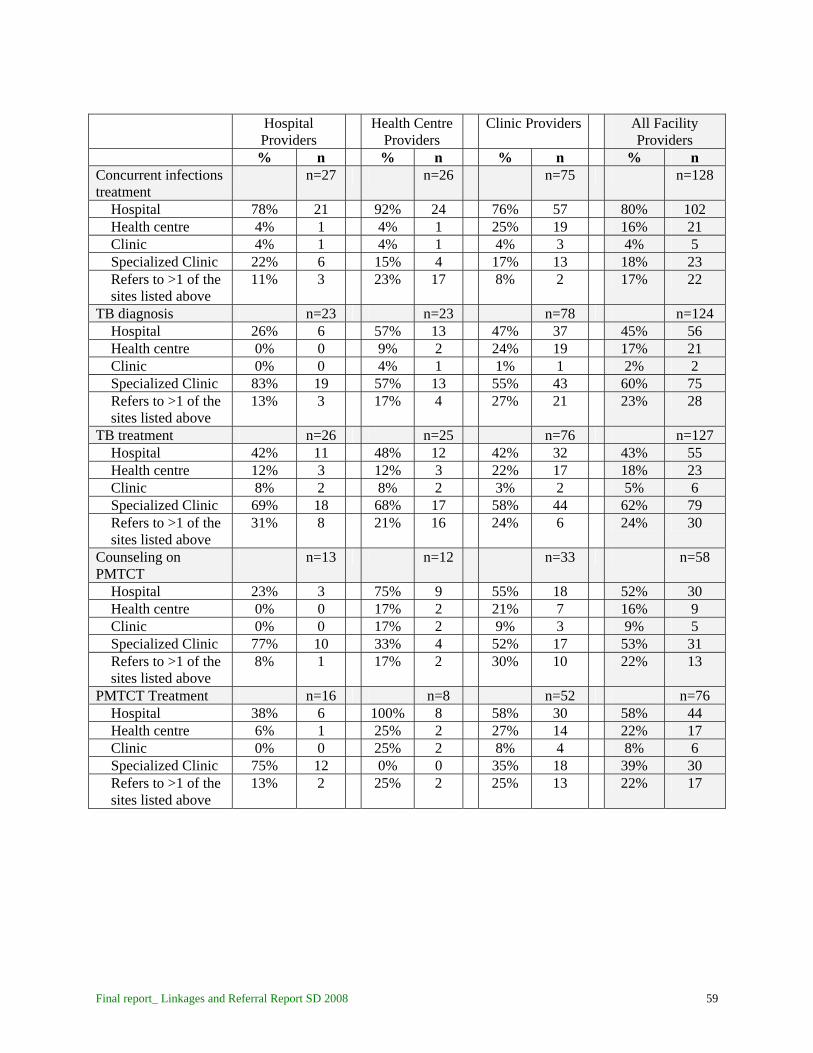
Final report_ Linkages and Referral Report SD 2008 59
Hospital
Providers Health Centre
Providers Clinic Providers All Facility
Providers % n % n % n % n Concurrent infections treatment
n=27 n=26 n=75 n=128
Hospital 78% 21 92% 24 76% 57 80% 102 Health centre 4% 1 4% 1 25% 19 16% 21 Clinic 4% 1 4% 1 4% 3 4% 5 Specialized Clinic 22% 6 15% 4 17% 13 18% 23 Refers to >1 of the sites listed above
11% 3 23% 17 8% 2 17% 22
TB diagnosis n=23 n=23 n=78 n=124 Hospital 26% 6 57% 13 47% 37 45% 56 Health centre 0% 0 9% 2 24% 19 17% 21 Clinic 0% 0 4% 1 1% 1 2% 2 Specialized Clinic 83% 19 57% 13 55% 43 60% 75 Refers to >1 of the sites listed above
13% 3 17% 4 27% 21 23% 28
TB treatment n=26 n=25 n=76 n=127 Hospital 42% 11 48% 12 42% 32 43% 55 Health centre 12% 3 12% 3 22% 17 18% 23 Clinic 8% 2 8% 2 3% 2 5% 6 Specialized Clinic 69% 18 68% 17 58% 44 62% 79 Refers to >1 of the sites listed above
31% 8 21% 16 24% 6 24% 30
Counseling on PMTCT
n=13 n=12 n=33 n=58
Hospital 23% 3 75% 9 55% 18 52% 30 Health centre 0% 0 17% 2 21% 7 16% 9 Clinic 0% 0 17% 2 9% 3 9% 5 Specialized Clinic 77% 10 33% 4 52% 17 53% 31 Refers to >1 of the sites listed above
8% 1 17% 2 30% 10 22% 13
PMTCT Treatment n=16 n=8 n=52 n=76 Hospital 38% 6 100% 8 58% 30 58% 44 Health centre 6% 1 25% 2 27% 14 22% 17 Clinic 0% 0 25% 2 8% 4 8% 6 Specialized Clinic 75% 12 0% 0 35% 18 39% 30 Refers to >1 of the sites listed above
13% 2 25% 2 25% 13 22% 17

Final report_ Linkages and Referral Report SD 2008 60
Hospital
Providers Health Centre
Providers Clinic Providers All Facility
Providers % n % n % n % n Nutrition support services
n=14 n=10 n=39 n=63
Hospital 36% 5 30% 3 49% 19 43% 27 Health centre 0% 0 10% 1 23% 9 16% 10 Clinic 7% 1 20% 2 10% 4 11% 7 Specialized Clinic 14% 2 0% 0 8% 3 8% 5 NGO 36% 5 0% 0 10% 4 14% 9 Community 14% 2 50% 5 10% 4 17% 11 Refers to >1 of the sites listed above
14% 2 10% 1 13% 5 13% 8
Palliative care n=24 n=20 n=66 n=110 Hospital 29% 7 70% 14 50% 33 49% 54 Health centre 0% 0 0% 0 14% 9 8% 9 Clinic 4% 1 0% 0 2% 1 2% 2 Specialized Clinic 4% 1 0% 0 0% 0 1% 1 NGO 38% 9 20% 4 38% 25 35% 38 Community 33% 8 25% 5 15% 10 21% 23 Refers to >1 of the
sites listed above 8% 2 20% 4 17% 11 15% 17
Home-based care n=24 n=25 n=59 n=108 Hospital 8% 2 8% 2 20% 12 15% 16 Health centre 0% 0 4% 1 3% 2 3% 3 Clinic 0% 0 8% 2 2% 1 3% 3 NGO 25% 6 4% 1 29% 17 22% 24 Community 71% 17 80% 20 69% 41 72% 78 Refers to >1 of the sites listed above
4% 1 8% 2 20% 12 14% 15
ART n=20 n=17 n=67 n=104 Hospital 40% 8 65% 11 52% 35 52% 54 Health centre 5% 1 12% 2 28% 19 21% 22 Clinic 0% 0 12% 2 1% 1 3% 3 Specialized Clinic 60% 12 47% 8 45% 30 48% 50 Refers to >1 of the sites listed above
5% 1 24% 4 24% 16 20% 21
STI counseling & testing
n=12
n=9
n=51
n=72
Hospital 33% 4 44% 4 57% 29 51% 37 Health centre 0% 0 0% 0 29% 15 21% 15 Clinic 0% 0 0% 0 4% 2 3% 2 Specialized Clinic 83% 10 56% 5 33% 17 44% 32 Refers to >1 of the sites listed above
17% 2 0% 0 20% 10 17% 12

Final report_ Linkages and Referral Report SD 2008 61
Hospital
Providers Health Centre
Providers Clinic Providers All Facility
Providers % n % n % n % n STI treatment n=14 n=16 n=58 n=88
Hospital 36% 5 75% 12 55% 32 56% 49 Health centre 7% 1 0% 0 24% 14 17% 15 Clinic 14% 2 0% 0 9% 5 8% 7 Specialized Clinic 79% 11 25% 4 36% 21 41% 36 Refers to >1 of the sites listed above
29% 4 0% 0 21% 12 18% 16
Psychosocial support n=22 n=17 n=50 n=89 Hospital 45% 10 47% 8 50% 25 48% 43 Health centre 0% 0 6% 1 14% 7 9% 8 Clinic 5% 1 0% 0 0% 0 1% 1 Specialized Clinic 18% 4 6% 1 8% 4 10% 9 NGO 5% 1 12% 2 20% 10 15% 13 Community 27% 6 52% 9 14% 7 25% 22 Refers to >1 of the sites listed above
14% 3 12% 2 12% 6 12% 11
Family planning n=20 n=4 n=53 n=77 Hospital 55% 11 100% 4 70% 37 68% 52 Health centre 40% 8 0% 0 23% 12 26% 20 Clinic 15% 3 25% 1 11% 6 13% 12 Specialized Clinic 10% 2 0% 0 8% 4 8% 6 NGO 10% 2 25% 1 21% 11 18% 14 Refers to >1 of the sites listed above
25% 5 50% 2 28% 15 29% 22

Appendix C: Common/Typical Referral Forms Government forms: ART Referral form and General Referral
Form
Final report_ Linkages and Referral Report SD 2008 62

Non governmental form example:
Final report_ Linkages and Referral Report SD 2008 63