linkage of patent and design right data: analysis of
TRANSCRIPT

DPRIETI Discussion Paper Series 20-E-005
Linkage of Patent and Design Right Data: Analysis of Industrial Design Activities in Companies at the Creator Level
IKEUCHI, KentaRIETI
The Research Institute of Economy, Trade and Industryhttps://www.rieti.go.jp/en/
MOTOHASHI, KazuyukiRIETI
RIETI Discussion Paper Series 20-E-005
January 2020
Linkage of Patent and Design Right Data: Analysis of Industrial Design Activities in
Companies at the Creator Level1
Kenta Ikeuchi (RIETI and NISTEP)
Kazuyuki Motohashi (University of Tokyo, RIETI and NISTEP)
Abstract
In addition to technological superiority (functional value), attention to design superiority
(semantic value) is increasing as a source of competitiveness in product markets. In this research,
we have created a linked data set of utility patent and design patent information from the Japan
Patent Office to evaluate design patent data as a source of understanding design innovation. First,
machine learning was performed on a classification model to disambiguate the same inventor /
creator on patent right/design right applications using data from applications from the Japanese
Patent Office. By interconnecting the inventor's and creator's identifiers estimated by the learned
classification model, we identified design creators who also created the patented invention. Next,
an empirical analysis is conducted to characterize the design created by a utility patent inventor.
It was found that about half of design patents are found to be created by the same individuals who
are involved in the relevant utility patents. However, the division of labor between designers
(creators of design patents) and engineers (inventors of utility patents) is advancing, particularly
in large firms.
Keywords: Utility Patent, Design Patent, Disambiguation, Design Innovation
JEL classification: O31, O34
The RIETI Discussion Papers Series aims at widely disseminating research results in the form of
professional papers, with the goal of stimulating lively discussion. The views expressed in the papers are
solely those of the author(s), and neither represent those of the organization(s) to which the author(s)
belong(s) nor the Research Institute of Economy, Trade and Industry.
1This study is conducted as a part of the Project “Empirical Analysis of Innovation Ecosystems in
Advancement of the Internet of Things (IoT)” undertaken at the Research Institute of Economy, Trade and
Industry (RIETI). Financial support by JSPS KAKENHI (18H03631) is also acknowledged. Authors also
thank Prof. Yoshioka (Hitotsubashi University), as well as participants at RIETI DP seminar for their
valuable comments.

1
1. Introduction
The design rights is the intellectual property right that protects industrial design. Novelty in a
design can only be found in its appearance (design) and shape, and design rights are different to
the patent rights that protect industrial technology. In industries where differentiation in design
between products is important, such as furniture, food products and home appliances, design
rights are important to make product differentiation from competitors (Brown, 2009).
Furthermore, design rights have a short approval period compared to patent rights, and filing and
maintenance fees are also low, so they have a complementary role to patent rights in protecting
product inventions.
As such, design data can provide useful information when analyzing industrial design innovation
but, in comparison to patent data, there is little progress in utilizing it as an indicator of technical
innovation. One of the reasons behind this is that design patent system is not internationally
harmonized such as utility patent for technological inventions. A substantial examination process
is required for design patent right in some countries such as Japan and United States, while only
formality check is conducted for its registration in other countries/regions such as China and
Europe (Yoshioka-Kobayashi, 2018). Therefore, interpretation of design patent information
should be made by taking into account the definition of national/regional IP regulation. In addition,
the design patent system does not cover all dimensions of design innovation. A recent review
paper by Homburg et al. (2015) identifies three aspects of design innovation; aesthetics,
functionality and symbolism, and design patents protects mainly functionality of inventions, but
no judgements are given for the other two dimensions (Galindo-Rueda and Millot, 2015).
However, design patent data is still a useful tool for systematic understanding of design innovation
due to its objectivity and comprehensiveness (Yoshioka-Kobayashi, 2018). In addition,
bibliometric information such as right holder, creator, product category and citation data can be
used for various empirical analysis, as is the case for the dataset created from utility patent
information. This paper is based on the comprehensive database of design patent information
registered at JPO (Japan Patent Office), developed by NISTEP (National Institute of Science and
Technology Policy) (Motohashi, Ikeuchi, Dang, 2016), with a similar structure of utility patent
database such as NBER patent database for USPTO patent (Hall et. al, 2005) and IIP Patent
database for JPO patent (Goto and Motohashi, 2017).
This paper provides a first look at systematic understanding of design patent information, by
linking with utility patent information, where the data quality and characteristics have been
extensively investigates (Nagaoka et. al, 2010). Specifically, connections were made between the
NISTEP design database and the IIP Patent Database at individual level (designer creator and

2
patent inventor) to see the relationship between these two patent rights. It is found that about half
of all design rights were created by engineers who have also made patented inventions. In other
words, in product development, improvement of appearance (design) and development of
technology (engineering) are often performed by the same person. However, this trend has been
lessening recently and, especially in large companies, so that the division of labor between
designers and engineers are progressed over time. It should be noted that the design patent in
Japan is registered after its substance examination, its quality of such information is supposed to
be better than the same information in other countries where only formality check of design patent
application is conducted.
The structure of this paper is as follows. The methodology for linked dataset is described in the
next section. First, disambiguation of inventors and creators in the IIP Patent Database and the
NISTEP design database are conducted, then two information are merged at inventor/creator level.
Then, empirical analysis to characterize design patent database is provided. Finally, the
conclusions and managerial implications obtained from this study were detailed.
2. Creating a database of inventors and creators
2-1. Inventor disambiguation in the IIP Patent Database
In order to understand micro nature of design and patent activities, inventor (creator)
identification should be made since patent records give only the information of inventor (creator)
name and her address. Or, both synonym problem (in which the same person’s name appears in
several distinct forms due to name changing etc.) and homonym problem (in which many distinct
people share the same name) should be treated. In case of Japanese name, which appeared mainly
in our database, addressing homonym problem is more important (Ikeuchi et. al, 2017).
The methodology if inventor disambiguation (identification) has been developed extensively. A
machine learning becomes a main stream recently, and several studies are conducted for various
patent databases (Li et. al, 2014 for USPTO data, Ikeuchi et. al, 2017 for JPO data and Yin et. al,
2019 for China patent data). In this paper, we use the methodology of supervised machine learning,
following our previous work on JPO inventor information (Ikeuchi et. al, 2017). Namely, model
parameter tuning and model selection (learning) are performed based on training data, and the
patterns of the entire dataset are predicted using the best performed model. It is therefore critical
that the training data is reliable for the machine learning model to be successfully applied.1
1 There are three types of methodology in inventor disambiguation, rule based, supervised machine
leaning (this study) and unsupervised machine learning. Yin et al. (2019) provides extensive survey on

3
We use a telephone directory in Japan to create training data. The names of inventors who have
only been listed in the telephone directory once or not at all over multiple years are defined as
rare names. The training data is constructed in which a group of inventors with the same rare
name are defined as the same person. It is natural to assume that the names and characteristics of
the inventors are independent of each other and it is thought that this approach is representative
of the population as a whole.
Two million pairs of records with the same and different rare names were extracted randomly
from the records and a classifier was applied based on a total of 4 million record pairs. As
representative classifiers, three types of naive Bayes models (Bernoulli, Gaussian, and
Multinomial), two types of discriminant analysis models (linear discriminant and quadratic
discriminant analysis), random forest and XGBoost were each applied to the training data.
Additionally, the hyper parameters of random forest and XGBoost were determined by the F1
score of the training data using 5-fold cross validation.
The classifier learning is performed on the data formed from the paired records of the patent-
inventor units as described above, and the variable used as the predictor is a numerical vector
(similarity profile) representing the similarity of each record pair. The vector has the following
five elements:
(1) Co-inventors: The number of matching co-inventors (excluding the main person),
capped at a maximum of six.
(2) Patent technical classification (primary IPC):
Match at 4-digit level: 4
Match at 3-digit level: 3
Match at 1-digit level: 2
Missing IPC in any record: 1
Otherwise: 0
(3) Applicant’s name: Number of matching characters (capped at six)
(4) Inventor affiliation:
If matching: 2
If the affiliation cannot be determined in either record: 1
Otherwise: 0
(5) Inventor’s address:
Match at building number level: 5
patent datasets in various countries.
4
Match at street name level: 4
Match at city block level: 3
Match at municipality level: 2
Match at prefectural level: 1
Otherwise: 0
The predicted probability of being the same individual is calculated for each record pair by the
learning classifier, but it is necessary to establish a probability threshold at which a pair is
determined to be the same person and a set (cluster) needs to be configured with record pairs that
refer to the same individuals. With this in mind, clustering is performed using a learning classifier.
If the name is different then there is a high probability that the records refer to different individuals,
so the data is divided into groups with the same name using the same methodology as Ikeuchi et
al. (2017), and all records within each name group are given a prediction probability that is
calculated from the learning classifiers, and a prediction probability matrix is constructed.
Clustering is then performed based on this matrix. It is necessary to select a clustering method
and adjust the parameters at this time, and teaching data is required for this purpose.
As the clustering is performed within groups of people who have the same name, it is necessary
to prepare training data that includes two individuals with the same name. However, it is
challenging to construct training data that relates to patent inventors and includes individuals who
possess the same given name and family name. Accordingly, this study uses rare names and the
distribution information of the appearance frequency of the full name in telephone directory
listings to virtually construct the training data for clustering that includes individuals with the
same name, and to select clustering methods and parameters.
The construction method of the training data for the clustering process is as follows. Firstly, the
appearance frequency of each name that is listed in the telephone directory is calculated in order
to obtain the distribution of the appearance frequency for each name. Next, names are extracted
at random from the list of patent inventors with unique names and an experience distribution of
the appearance frequency of each patent inventor's name is constructed. After this, names are
randomly extracted from the list of rare names, and groups are randomly formed according to the
experience distribution of the appearance frequency of each patent inventor’s name. This means
that there is a group composed of a single rare name and a group composed of many rare names,
and this rare name information can be used as training data for clustering. In this study, 20,000
groups are extracted and used as teaching data.
The candidate clustering methods are hierarchical clustering, DBSCAN, and graph partitioning.
The parameters of each method were adjusted via grid search using the teaching data created
5
above, and a model was selected. The F1 score is used as a criterion for parameter and model
selection, in the same way as is the case with classifier learning.
The patent-inventor data to be analyzed consists of 23,299,337 records, which include 1,675,133
unique names. The classifier that is ultimately selected on the basis of the F1 score is "Random
Forest" (the F1 score is 96.3%), while the clustering method is the “graph partition method” and
verification is performed using random extracts of the teaching data used for clustering. The
accuracy rate of the data is 98%, the recall rate is 96.3% and the F1 score is 97.1%. After applying
the learning classifier and clustering methodology to all the available data, 2,577,432 unique
inventors were identified out of 10,695,520 patents (the average number of patents per inventor
is 9.04).
2-2. Creator identification in the NISTEP design database
Identifying individual design creators was performed in the same manner as described above for
patent inventors. However, co-creators were used instead of co-inventors and design product
classifications were used instead of technical classifications as attributes for the learning of the
classifier. Additionally, the empirical distribution of the frequency of name appearance that was
used to construct teacher data for clustering was estimated separately for the names of design
creators, as the number of unique names differed greatly between patent inventors and design
creators.
The analysis included 672,815 design creators, of which 110,270 were unique names. The
classifier that was selected based on the F1 score criteria was "random forest" (the F1 score is
98%) and the clustering method is "graph partitioning." The precision of the verification data is
99.9%, the recall is 99.4% and the F1 score is 99.7%, which indicates a very high degree of
accuracy. After applying the trained classifier and clustering method to all data, 118,027 unique
creators were identified, which means that the average number of creative designs per creator is
about 5.7.
2-3. Linkage between inventors and creators
The process of identifying the same person from the inventors in the IIP Patent Database and the
creators in the NISTEP database is described below. This was mainly done using first and last
name information and information about organizational affiliation (i.e. affiliation with companies
that hold design rights and patents). Here it should be noted that there are cases where individuals
with the same family and given names are affiliated with the same organization. There are
2,769,242 different first and last name + affiliated institution pairs. Of these, 2,685,389 cases were

6
identified as unique individuals as a result of the identification work. In other words, the
identification process revealed about 80,000 cases where individuals with the same name were
affiliated with the same organization (such as companies like Panasonic with large numbers of
inventors). Furthermore, this means that a match between the name and institutional affiliation
records between databases is not necessarily enough to say that the records refer to the same
person, as there may be more than one engineer or designer with the same name.
Accordingly, we decided to connect the two by referring to corresponding contents of the patents
and designs, in addition to the name and institution. Specifically, the following rules are adopted:
・ Pairs in which the patent and design application timings are different refer to different
individuals.
・ Cases with high relevance between the patent application and the design application refer to
the same individual.
The former policy suggests that the pairs in two dataset correspond to different people if there is
a gap between the time of the patent application and the time of the design application (in other
words, if the year of the last patent application is not the same as the year of the first design
application or vice versa). After analyzing the different pairs using the first rule, then we look at
the contents of patents and design for the pair.
In order to implement the second rule, a concordance table for IPC classification of patent and
product category classification of design, by using patent and design pairs by same name and
affiliated organization. This concordance table is used to convert the patent application vector (the
number of applications per IPC class) into a design classification vector (the number of
applications for each major category of Japanese Design Classification). Then, the cosign
similarity between this vector and the design classification vector of comparing creator is
calculated.
We need to determine the threshold point of this cosign similarity. If the threshold value is set too
low, the probability of false positives (matching different people into the same one) increases,
while the probability of false negatives (not matching the same person into one) increases, if the
value is too high. We use the value of cosign similarity for rare name people to set the appropriate
threshold value.
From the distribution of these cosign similarities, True Positives (TP: the ratio of correctly
identified pairs) and True Negatives (TN: the ratio of correctly identified pairs) for each threshold
value is shown in Figure 1. For example, if the threshold for cosign similarity is set to 0.1, the

7
ratio of TP is 80% (conversely, the False Negative rate is 100-80: 20%), the TN ratio is 50% (False
Positives are 100-50: 50%). When the threshold is raised, the TP decreases (because the
probability of being falsely judged to be the same individual increases) and the TN increases
(because the probability of different people being correctly determined as such increases). As can
be seen in Figure 1, the accuracy rate (taken as an average of TP and TN) was determined to be a
maximum of the value of 0.2 for cosign similarity, where the ratio of TP to TN is almost balanced.
(Figure 1)
Furthermore, although the telephone directory data is used to indicate rare name data in this model,
there is a possibility that there are inaccuracies in the correct answer data as there are a
considerable number of people who are not listed in the telephone directory.2 Accordingly, a
robustness check is performed by breaking down the rare names in the telephone directory into
family and given names to see the rarity of both types of names. Then, the relative rarity of full
names in rare name database is determined. Specifically, rare names are filtered in two stages of
the top 5% and top 25% by rarity (filtering of names that have an even higher possibility of being
rare) and are compared with the results for the aforementioned Same Person (True Positive).
Figure 2 shows there has been almost no change in the relationship between Cosign similarity and
TP.
(Figure 2)
The threshold value for the cosign similarity (0.2) looks quite low. But, it is not caused by a
problem with the rare name information but rather that the concordance table between patent
technology classification and design product classification does not give accurate information. It
should be noted that that there are a considerable number of errors (both FP and FN) in the results
of this work.
3. Empirical Analysis
In this section, empirical analysis to characterize NISTEP design database (roughly 380,000
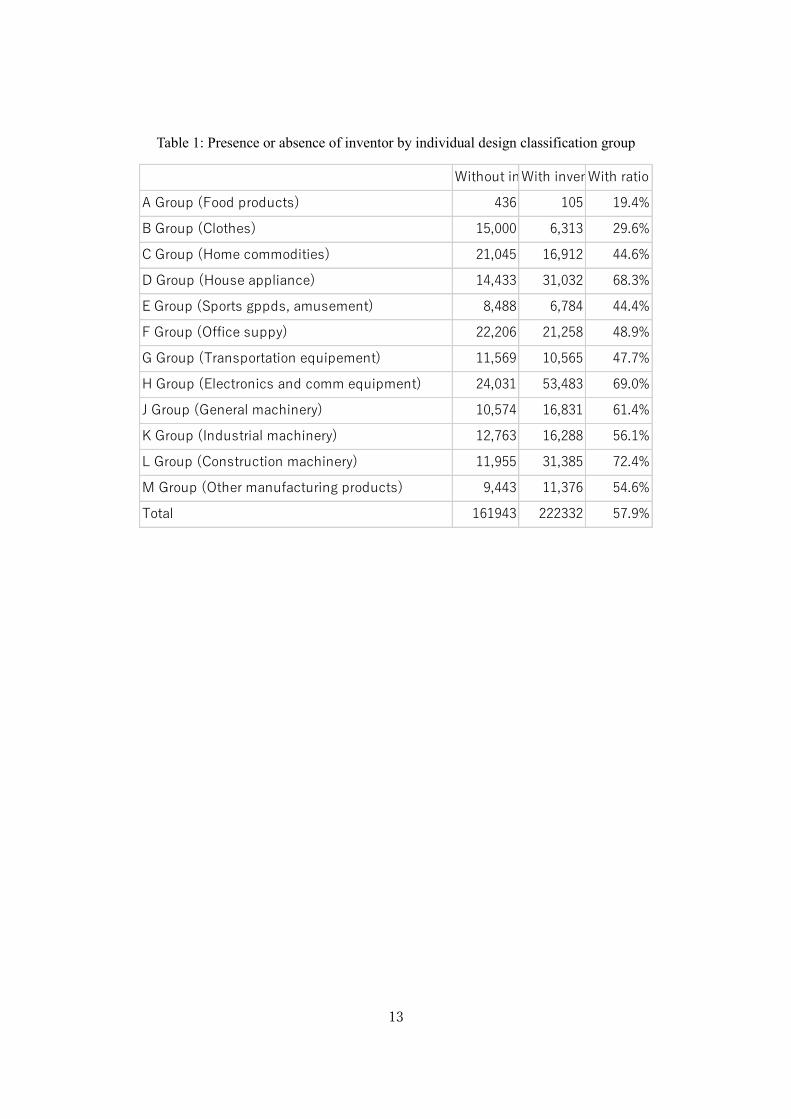
designs that were filed between 1998 and 2013) is provided. Table 1 shows the ratio of design
patent with any of creator who is also an inventor of utility patents. It can be seen that, of about
380,000 designs, around 220,000 (roughly 60%) feature the patent inventor as the designer. L
group (civil engineering and construction supplies) has a rate of 72.4% and H group (electrical,
electronic and communication equipment) has a rate of 69.0%. In groups such as group A
2 Listing telephone number to the directory is based on voluntary disclosure of the owner of the
telephone number.

8
(manufactured foodstuffs and luxury grocery items) and group B (clothing and personal
belongings), the ratio of with-inventor designs is low.
(Table 1)
Figure 3 shows the time trend of design applications, both with- and without-inventor. The
number of design applications has been declining since the early 2000s, but the decrease mainly
comes from the falling number of with-inventor designs. In other words, it can be seen that the
ratio of with-inventor designs is trending downwards. It should be all design rights applications
that are filed are subject to examination, and only registered designs appear as public record. On
the other hand, all utility patent application information is disclosed after 18 month of application
date. Here, all patent application information up to September 2015 is included, sot that this
downward trend is not caused by truncation bias of patent statistics.
(Figure 3)
Figure 4 shows the with-inventor ratio by applicant. Here, in addition to looking at those classified
as belonging to companies with more than 1,000 patent applications (relatively large firms) and
those with 1,000 or less patent applications (smaller firms). The number of with-inventor designs
is higher for large patent applicants but the decreasing trend is also more pronounced in these
cases. Since around 2007, the overall trend has been almost the same for companies with more
than 1,000 applications and those with 10,000 or more applications, in that the ratio of with-
inventor patented designs has been decreasing. This shows that the division of labor between
engineers (inventors) and designers (creators) in new product development process is progressed
mainly in large firms.
(Figure 4)
Figure 5 shows the characteristics of with-inventor design rights. Here we can see the share of
“partial design”, “related design” and “design with forward citation”. In all cases, the number of
with-inventor designs exceeds the number of without-inventor designs. “Partial design” is the
right granted to a part of product design. The right holder can protect its design for a particular
part of the product, which is likely to increase the functional utility of the product, in addition to
a design of a whole product. “Related design” refers to the rights protection for multiple variations
based on a single design concept as having the same value. In both cases, the overall costs such
as application fees are increased due to multiple filings so that such design (of product features
and series) has a greater economic value than regular design rights.
The citation information in NISTEP design patent database is created by an examiner as a

9
reference of existing design rights similar to the examining design application. Therefore, the
design right cited by other designs (forward citation) is also more valuable one. One difference
from utility patent system is that the examination of design rights only looks at the novelty of a
design’s appearance and shape, and does not represent a basis for technical progress. That said,
designs with a high number of citations are likely to be pioneers in new styles (Chan et al, 2018).
When interpreted in conjunction with the partial and related design results, it is likely that design
rights involving a patent applicant will have superior functionality in addition to aesthetic
advantages (as a result of good design), when compared to a design right where this is not the
case.
(Figure 5)
Finally, in order to comprehensively examine the characteristics of design rights based whether
they are with- or without-inventor designs, a descriptive regression analysis was performed using
the presence or absence of an inventor as the dependent variable. The explanatory variables are
as follows:
・ Log (Number of citations +1)
・ Log (Number of related designs +1)
・ With related design dummy
・ Partial design dummy
・ Log (number of patents filed by the design applicant +1) : pcount
・ Log (number of design applications filed by the design applicant +1) : dcount
・ Post-2006 dummy: after
・ Interaction terms of “pcount” and “dcount” with “after”
In addition, design product category dummies and application year dummies are included in some
modes (not using “after” ones), and a logistic model is used to estimate the probability of design
with patent inventors. The results are presented in Table 2.
(Table 2)
The results of this analysis confirm that firstly, the relationship between partial design, related
design and cited design seen in Figure 4 are statistically significant, even after controlling for
application year and design product category. Furthermore, the related design dummy (whether
or not a related design is related to the original design) is also positive and statistically significant,
which confirms that the proportion of with-inventor design rights is high across the entire design
family, including the related designs (the original design and related designs are likely to have the

10
same creator, so in a sense, perhaps this result is obvious).
With regards to time trends, “after” being negative and statistically significant is a result of the
overall division of labor between the designer and the inventor. Furthermore, an intersection
between pcount and “after” being negative and statistically significant (model 4), supports the
view that the division of labor between the creator and inventor is more likely to be found in large
patent applicant organizations.
4. Conclusion
In this study, creator/inventor disambiguation works are conducted for both NISTEP design patent
data and IIP patent database, and linked each other at individual creator and inventor level, to
evaluate the characteristics of design patent information. First, it is found that more than half of
the design rights creators were also patent inventors. Second, the ratio of design rights with
inventor decreases over time, which suggests that the division of innovative labor between
invention and design activities is progressed. Furthermore, such trend is more likely to be found
in large firms. Third, the design patents with patent inventor are more valuable as is suggested by
higher propensity to having partial and related design rights and forward citations.
Design activities have been shown to be an important factor in corporate competitiveness in many
empirical studies (D'lippolito, 2014). As developing countries increasingly catch up
technologically, non-technological features become more and more important for a firm in
developed countries including Japan in global competitive market. A product design, stressing
new “meaning” of product or customer value proposition, is one of promising factors to pursue
such avenue (Verganti, 2009). In this environment, expectations for design rights data as a means
of analyzing design innovation and strategy are increasing.
However, a care must be taken when using design rights as a proxy variable for innovation in
design. Firstly, it should be recognized that more than half of current design rights were created
by the patent inventor and that they include the technical characteristics of products to a great
extent. Design rights are intellectual property rights that only protect industrial designs, and do
not focus on design characteristics such as external aesthetics. A design right requires newness in
outer shape, which does not always lead to “better” design. Therefore, it is risky to evaluate design
capability and performance by only looking at design rights.
With such reservation, design patent information is still a useful tool to analyze a general trend of
product development organization. For example, it is found that movement towards splitting the
roles of designers and engineers, particularly in large companies. In product development, this
11
seems to reflect a move away from engineering-type industrial design, in which engineers at a
company also create designs, to a system of independent designers who focus not only on function
but also the design itself (semantic value). In this regard, it is important to conduct a more detailed
analysis that focuses on the characteristics of each applicant (company). For example, multiple
studies deal with design award information to take into account overall value of design innovation
aspects (In terms of aesthetics, it is effective to use objective indicators for design such as the
Good Design Award (Gemser and Wijnberg, 2002; Hertenstein et al., 2005).
Furthermore, this study focused on design results involving inventors but conversely, it should be
possible to analyze patented inventions that involve the design creator. Designers are renowned
for playing an important role in breakthroughs in technological innovation (Yoshioka-Kobayashi,
2018). Clarifying the characteristics of design creators in detail enables the quantitative analysis
of a patent for an invention of superior product design that involves a creator. Analysis using
design rights data has not made progress in Europe and the United States, and it is expected that
world-leading research results could be derived from the data that is available in Japan.
References
Brown, T. (2009), Change by Design: How Design Thinking Transforms Organizations and
Inspires Innovation, Harper Collins, New York
Chan, T. H., Mihm, J. and M. E. Sosa (2018), On styles in product design: An analysis of US
design patents, Management Science, 64(3) 1230-1249
D’lippolito, B (2014), The importance of design for firm's competitiveness: a review of the
literature, Technovation, 34(2014) 716-730
Galindo-Rueda, F. and V. Millot (2015), Measuring Design and its Role in Innovation, OECD
Science, Technology and Industry Working Papers 2015/01
Gemser, G. and N.W. Wijnberg (2002), The economic significance of industrial design awards: A
conceptual framework, Academic Rev. 2 (1), 61–71.
Hertenstein, J. H, M.B. Platt and R.W. Veryzer (2005), The impact of industrial design
effectiveness on corporate financial performance, J. Prod. Innovat. Manag. 22 (1) (2005)3–
21

12
Goto, A., & Motohashi, K. (2007), Construction of a Japanese patent database and a first look at
Japanese patenting activities. Research Policy, 36(9), 1431–1442
Hall, B., Jaffe, A., & Trajtenberg, M. (2005), Market value and patent citations. RAND Journal of
Economics, 1–50
Homburg, C., M. Schwemmle and C. Kuehnl (2015), New product design: concept, measurement,
and consequences, Journal of Marketing. 79 (3), 41–56
Ikeuchi, K., Motohashi, K., Tamura, R., & Tsukada, N. (2017), Measuring science intensity of
industry using linked dataset of science, technology and industry. RIETI Discussion Paper
Series, 17-E-056
Li, G.-C., Lai, R., D’Amour, A., Doolin, D. M., Sun, Y., Torvik, V. I., et al. (2014),
Disambiguation and co-authorship networks of the U.S. patent inventor database (1975–
2010). Research Policy, 43, 941–955.
Motohashi, K, K. Ikeuchi and J. Dang (2016), Constructing a Database of Design and Trademark
Rights, NISTEP RESEARCH MATERIAL No.249, NISTEP, MEXT Japan, April 2016 (in
Japanese)
Nagaoka, S., K Motohashi and A Goto (2010), Patent statistics as an innovation indicator, in
Handbook of the Economics of Innovation Volume 2 (B. Hall and N. Rosenberg ed.), North
Holland
Verganti, R. (2009), Design Driven Innovation: Changing the Rules of Competition by Radically
Innovating what Things Mean, Harvard Business Press, Boston, Massachusetts
Yin, D., K. Motohashi and J. Dang (2019), Large-scale name disambiguation of Chinese patent
inventors (1985-2016), Scientometrics, published on-line, 1-26
Yoshioka-Kobayashi, T., Fujimoto, T., Akiike, A. (2018), The validity of industrial design
registrations and design patents as a measurement of "good" product design: A comparative
empirical analysis, World Patent Information, 53, 14-23
13
Table 1: Presence or absence of inventor by individual design classification group
Without inventorsWith inventorsWith ratio
A Group (Food products) 436 105 19.4%
B Group (Clothes) 15,000 6,313 29.6%
C Group (Home commodities) 21,045 16,912 44.6%
D Group (House appliance) 14,433 31,032 68.3%
E Group (Sports gppds, amusement) 8,488 6,784 44.4%
F Group (Office suppy) 22,206 21,258 48.9%
G Group (Transportation equipement) 11,569 10,565 47.7%
H Group (Electronics and comm equipment) 24,031 53,483 69.0%
J Group (General machinery) 10,574 16,831 61.4%
K Group (Industrial machinery) 12,763 16,288 56.1%
L Group (Construction machinery) 11,955 31,385 72.4%
M Group (Other manufacturing products) 9,443 11,376 54.6%
Total 161943 222332 57.9%

14
Table 2: Descriptive regression analysis results
(1) (2) (3) (4)
Log(forward citation+1) 0.193 0.144 0.025 0.149
[0.010]** [0.010]** [0.003]** [0.010]**
Log(# of related designs+1) 0.23 0.181 0.18 0.182
[0.014]** [0.014]** [0.004]** [0.014]**
Dummy with related designs 0.264 0.208 0.205
[0.010]** [0.011]** [0.011]**
Partial design dummy 0.213 0.162 0.161
[0.009]** [0.010]** [0.009]**
0.014 0.024
[0.002]** [0.003]**
0.189 0.173
[0.003]** [0.004]**
Dummy after 2006 : after -0.146 -0.165
[0.024]** [0.024]**
pcount*after -0.021 -0.023
[0.004]** [0.004]**
dcount*after 0.036 0.041
[0.006]** [0.006]**
Constant -1.866 -3.316 -2.814 -2.95
[0.433]** [0.434]** [0.433]** [0.433]**
Design class dummy Yes Yes Yes Yes
Application year dymmy Yes Yes No No
# of samples 345,822 345,822 345,826 345,826
* p<0.05; ** p<0.01
Log(# of patents by applicant+1):pcount
Log(# of designs by applicant+1):dcount

15
Figure 1: Cosign similarity threshold tuning using rare names
Figure 2: Robustness check results for rare names in the telephone directory

16
Figure 3: Trends in the number of design right applications by inventor status
Figure 4: With-inventor patent ratio (by applicant with # of patents)

17
Figure 5: Differences in with- and without-inventor design rights