linkage merlin kate - institute for behavioral geneticsibg fast multipoint calculations to generate...
TRANSCRIPT

Linkage Analysis in Merlin
Meike BartelsKate Morley
Danielle Posthuma
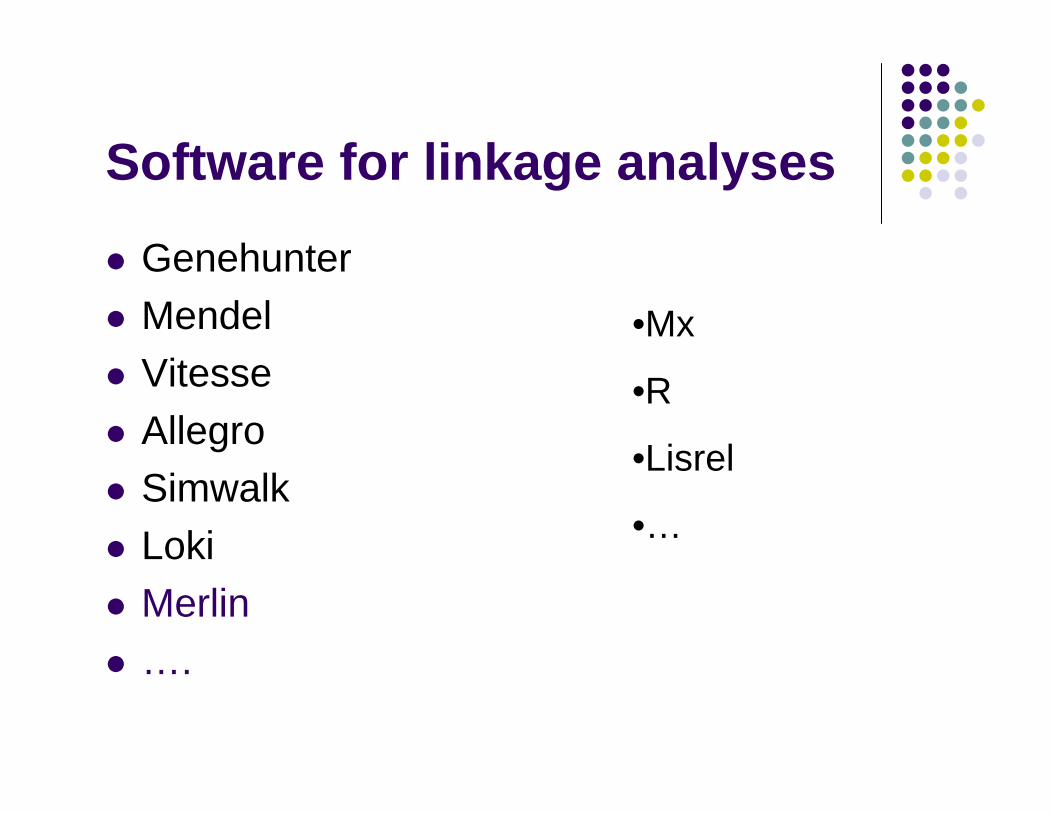
Software for linkage analyses
GenehunterMendelVitesseAllegroSimwalkLokiMerlin….
•Mx
•R
•Lisrel
•…

MERLIN softwarePrograms:
MERLINMinXMERLIN-regressPedstatsPedwipePedmerge
http://www.sph.umich.edu/csg/abecasis/Merlin/
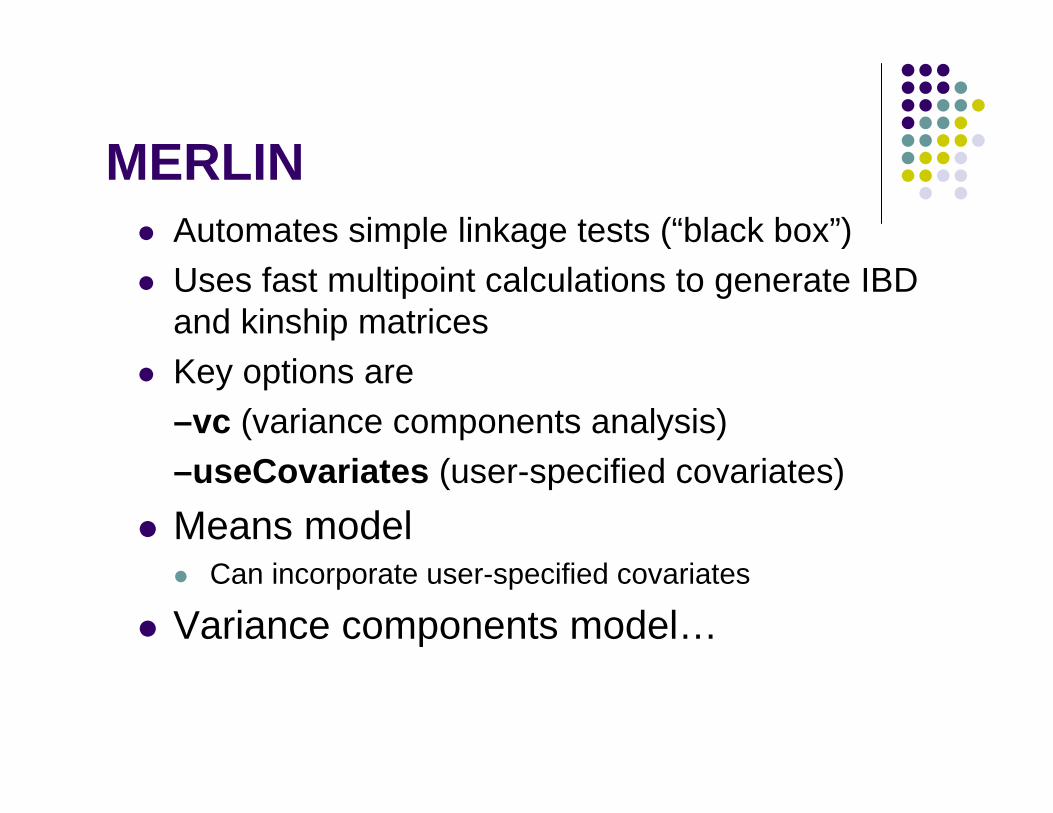
MERLINAutomates simple linkage tests (“black box”)Uses fast multipoint calculations to generate IBD and kinship matricesKey options are –vc (variance components analysis) –useCovariates (user-specified covariates)Means model
Can incorporate user-specified covariates
Variance components model…

Merlin's Standard Variance Components Model
Environmental component Non shared, uses identity matrix
Polygenic component Shared among relatives, according to kinship matrix
Major gene componentShared when individuals are IBD, kinship matrix at marker
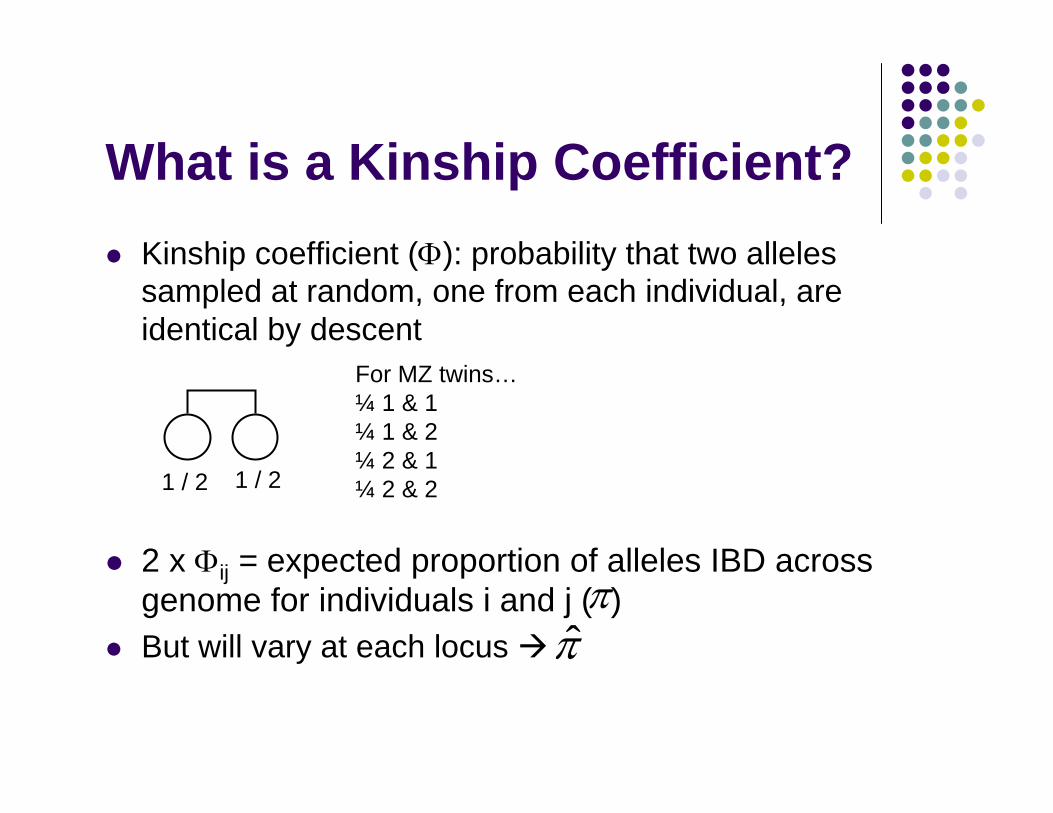
What is a Kinship Coefficient?Kinship coefficient (Φ): probability that two alleles sampled at random, one from each individual, are identical by descent
2 x Φij = expected proportion of alleles IBD across genome for individuals i and j ( )But will vary at each locus π
1 / 2 1 / 2
π
For MZ twins…¼ 1 & 1¼ 1 & 2¼ 2 & 1¼ 2 & 2
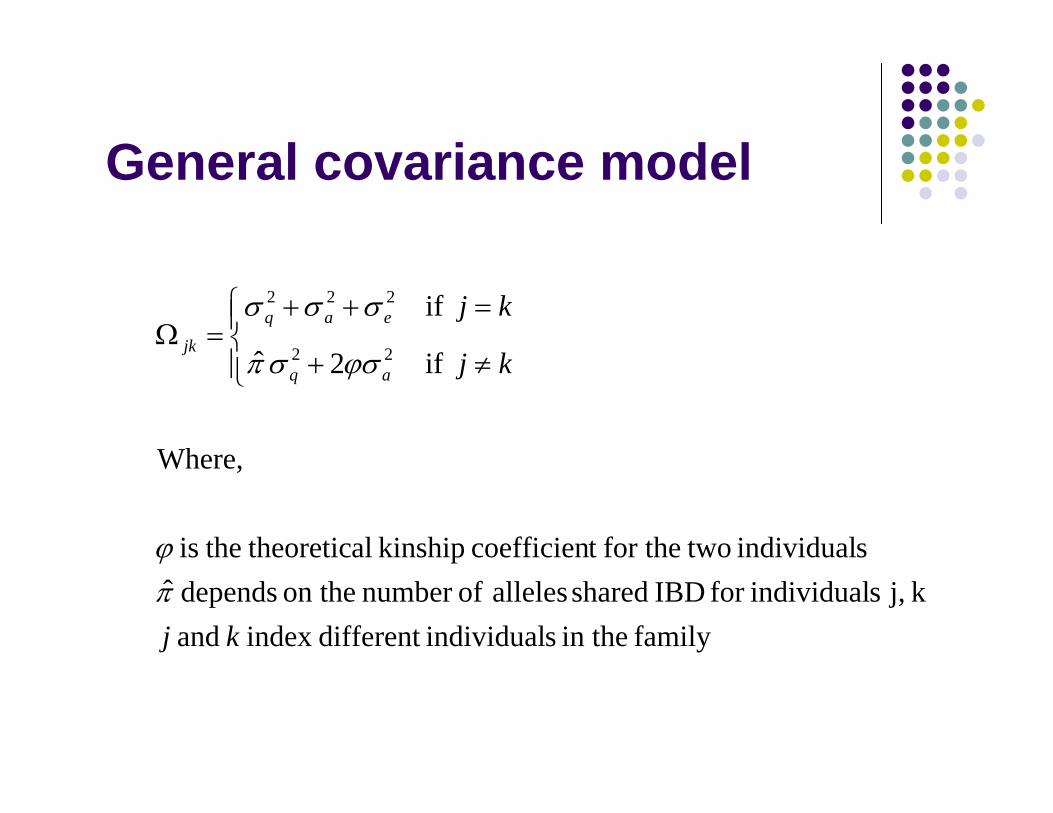
General covariance model
family in the sindividualdifferent index and k j, sindividualfor IBD shared alleles ofnumber on the depends ˆ
sindividual twofor thet coefficien kinship al theoretic theis
Where,
if2ˆ
if22
222
kj
kj
kj
aq
eaq
jk
πϕ
ϕσσπ
σσσ
⎪⎩
⎪⎨⎧
≠+
=++=Ω

Input Files (again)Pedigree File
Family relationshipsPhenotype dataGenotype data
Data FileDescribes contents of pedigree file
Map FileRecords location of genetic markers
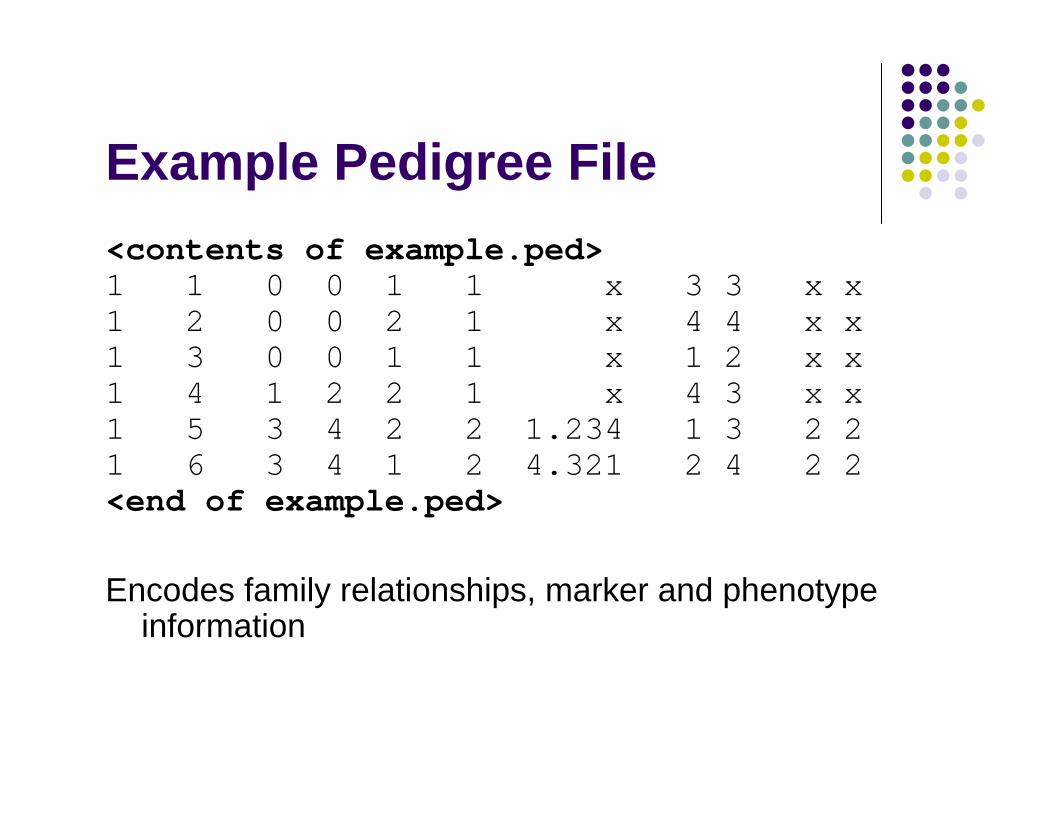
Example Pedigree File<contents of example.ped>1 1 0 0 1 1 x 3 3 x x1 2 0 0 2 1 x 4 4 x x1 3 0 0 1 1 x 1 2 x x1 4 1 2 2 1 x 4 3 x x1 5 3 4 2 2 1.234 1 3 2 21 6 3 4 1 2 4.321 2 4 2 2<end of example.ped>
Encodes family relationships, marker and phenotype information
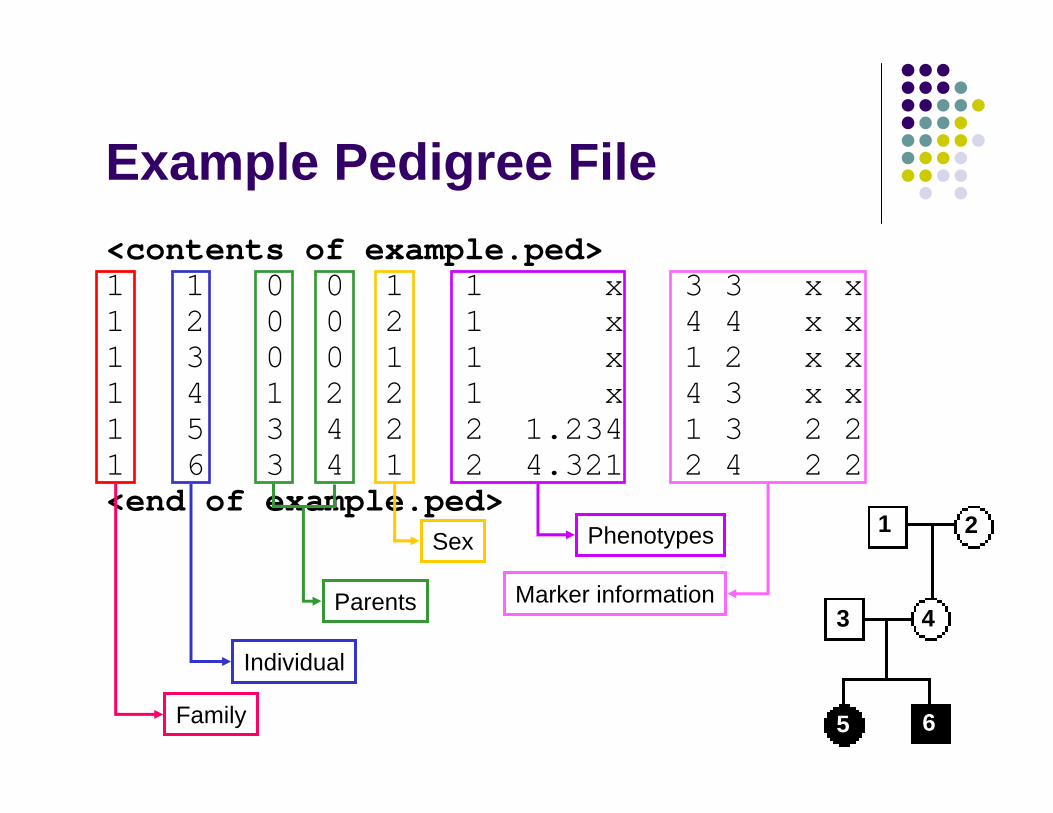
Example Pedigree File<contents of example.ped>1 1 0 0 1 1 x 3 3 x x1 2 0 0 2 1 x 4 4 x x1 3 0 0 1 1 x 1 2 x x1 4 1 2 2 1 x 4 3 x x1 5 3 4 2 2 1.234 1 3 2 21 6 3 4 1 2 4.321 2 4 2 2<end of example.ped>
Encodes family relationships, marker and phenotype information
Family
Individual
Parents
Sex Phenotypes
Marker information
1 2
3 4
5 6
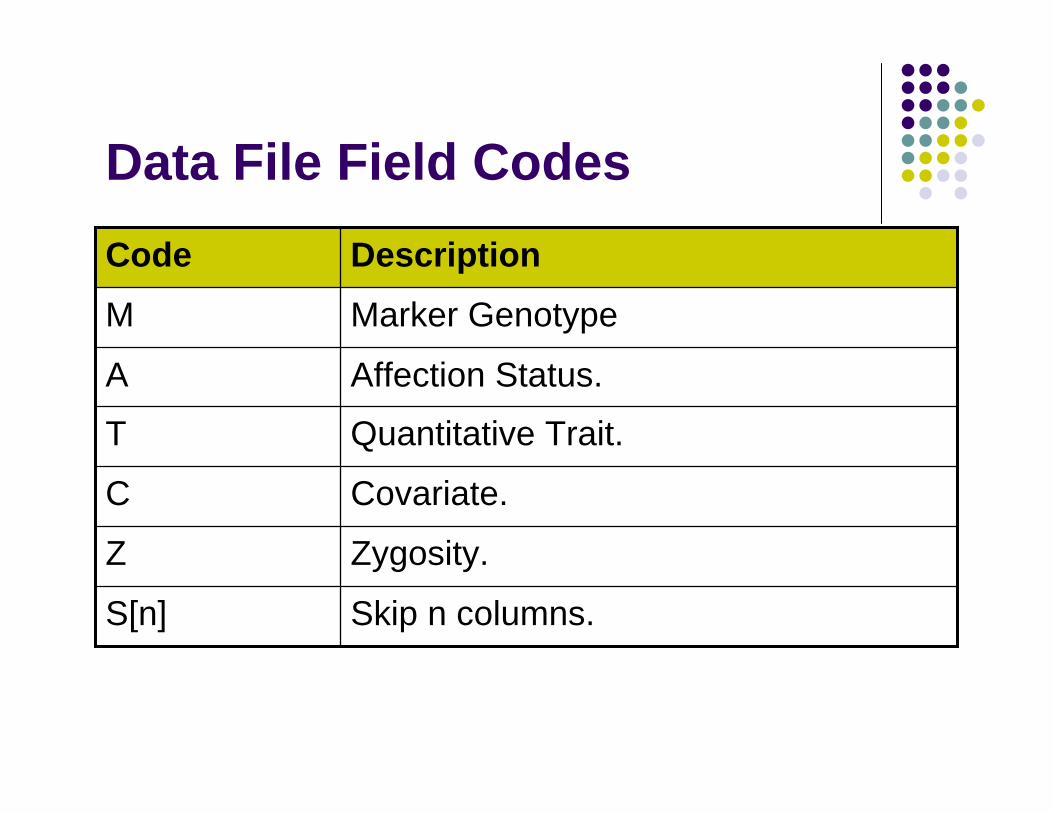
Data File Field Codes
Skip n columns.S[n]
Zygosity.Z
Covariate.C
Quantitative Trait.T
Affection Status.A
Marker GenotypeM
DescriptionCode

Example Data File<contents of example.dat>T some_trait_of_interestM some_markerM another_marker<end of example.dat>
Provides information necessary to decode pedigree file.
First five columns assumed to follow standard format: family, individual, father, mother, sex
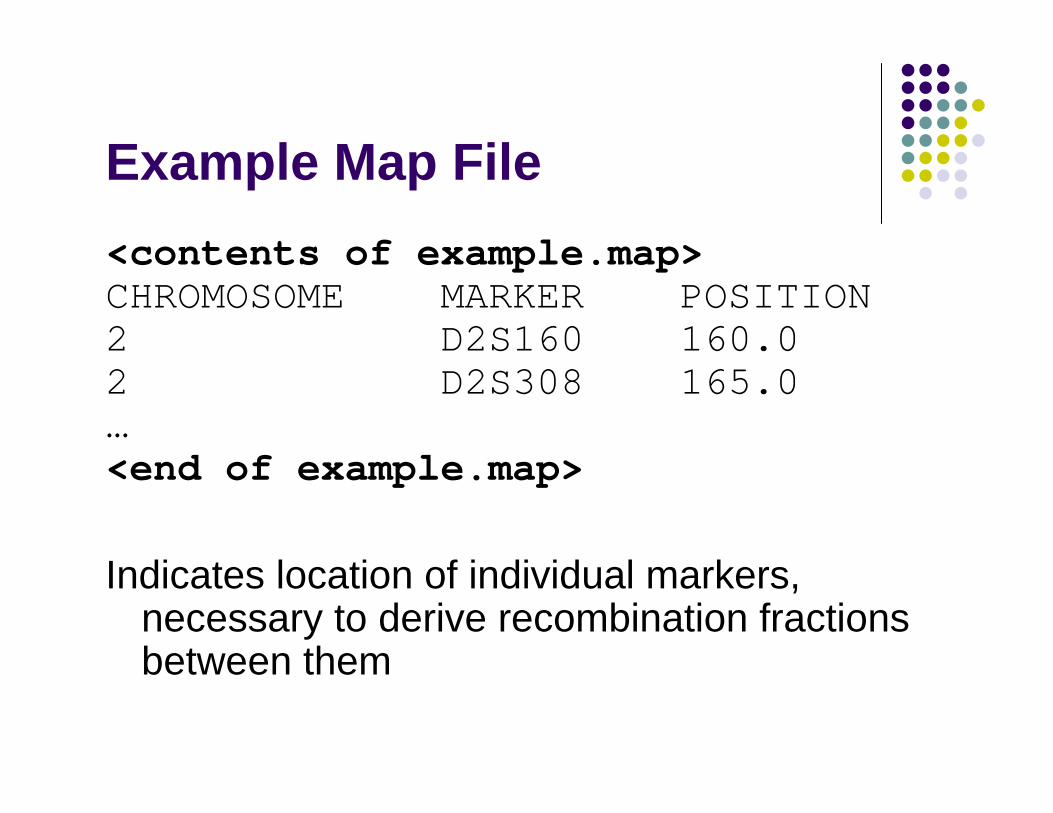
Example Map File<contents of example.map>CHROMOSOME MARKER POSITION2 D2S160 160.02 D2S308 165.0…<end of example.map>
Indicates location of individual markers, necessary to derive recombination fractions between them


Example DatasetPerformance IQ Data
710 sib-pairs59 micro-satellite markers on chromosome 2
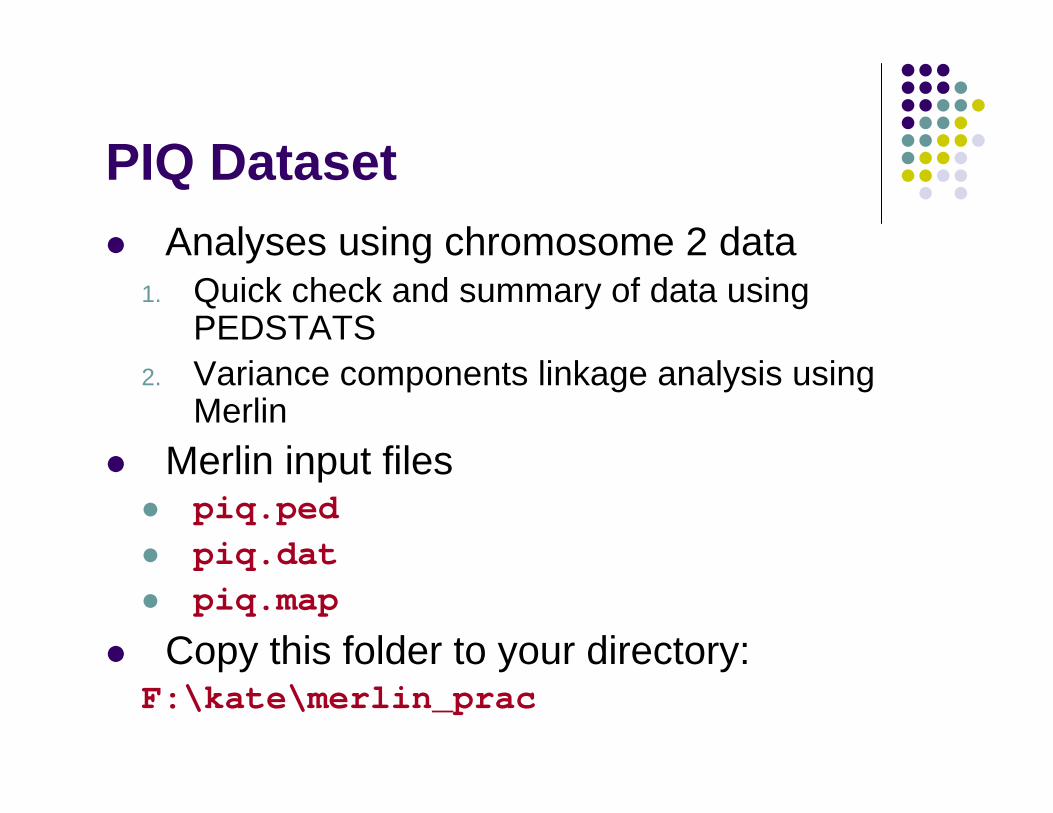
PIQ DatasetAnalyses using chromosome 2 data
1. Quick check and summary of data using PEDSTATS
2. Variance components linkage analysis using Merlin
Merlin input filespiq.pedpiq.datpiq.map
Copy this folder to your directory:F:\kate\merlin_prac
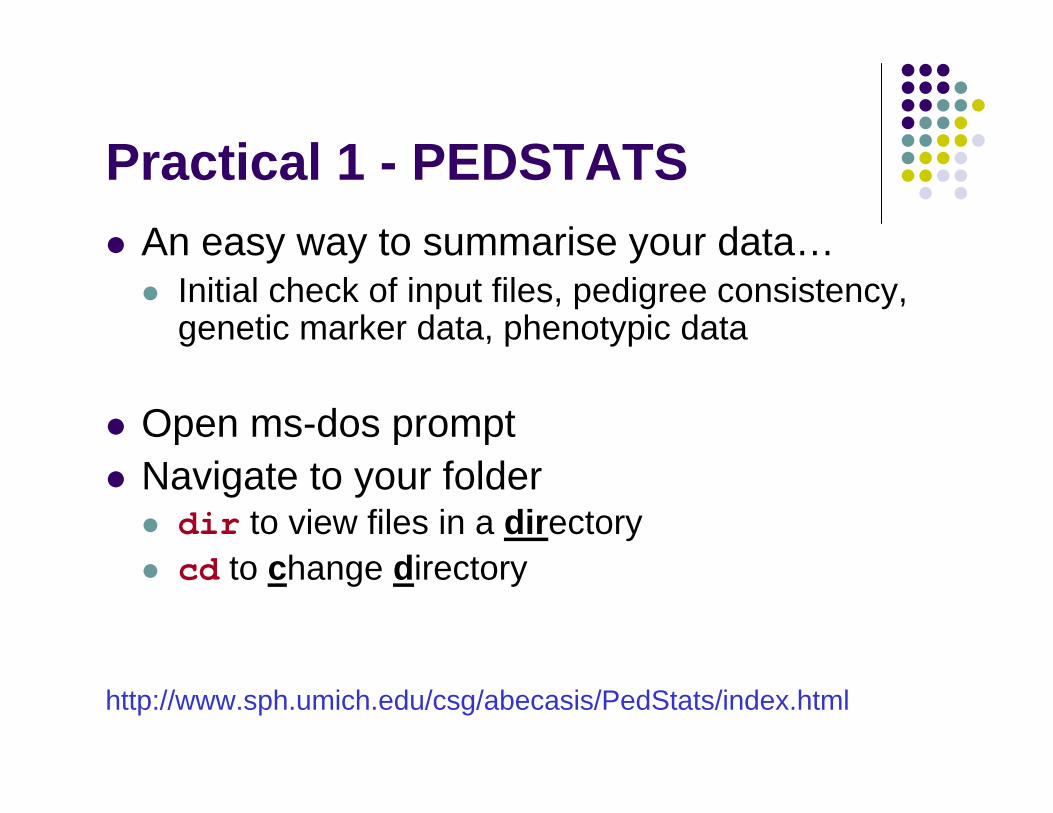
Practical 1 - PEDSTATSAn easy way to summarise your data…
Initial check of input files, pedigree consistency, genetic marker data, phenotypic data
Open ms-dos promptNavigate to your folderdir to view files in a directorycd to change directory
http://www.sph.umich.edu/csg/abecasis/PedStats/index.html
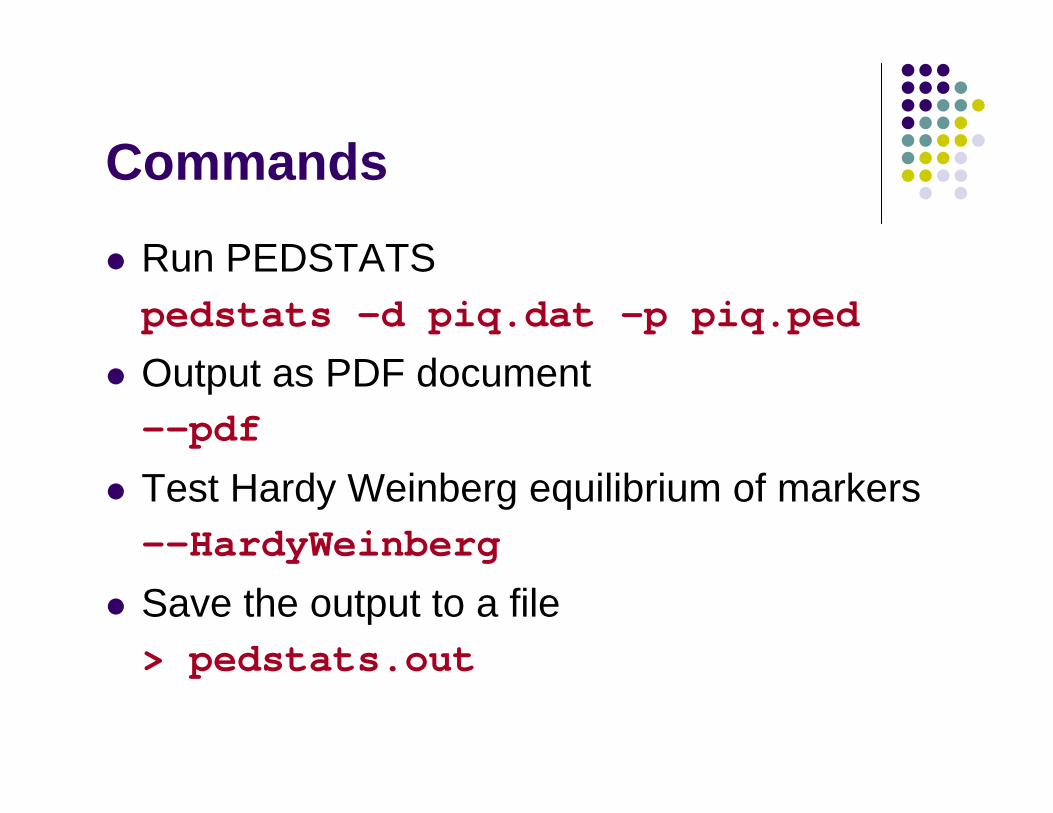
Commands
Run PEDSTATSpedstats –d piq.dat –p piq.ped
Output as PDF document--pdf
Test Hardy Weinberg equilibrium of markers--HardyWeinberg
Save the output to a file > pedstats.out
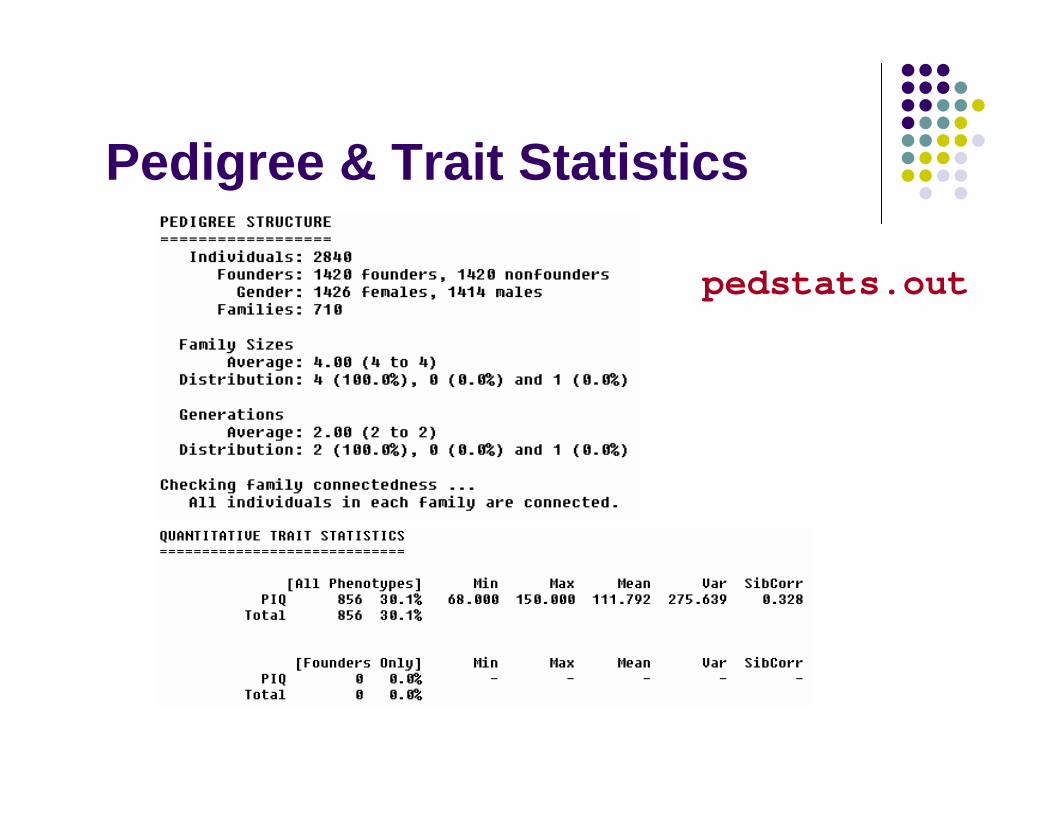
Pedigree & Trait Statistics
pedstats.out

Genotypic Data Quality
pedstats.out

Graphical OutputGraphical output for
Pedigree and trait statisticsHWE tests
pedstats.pdf
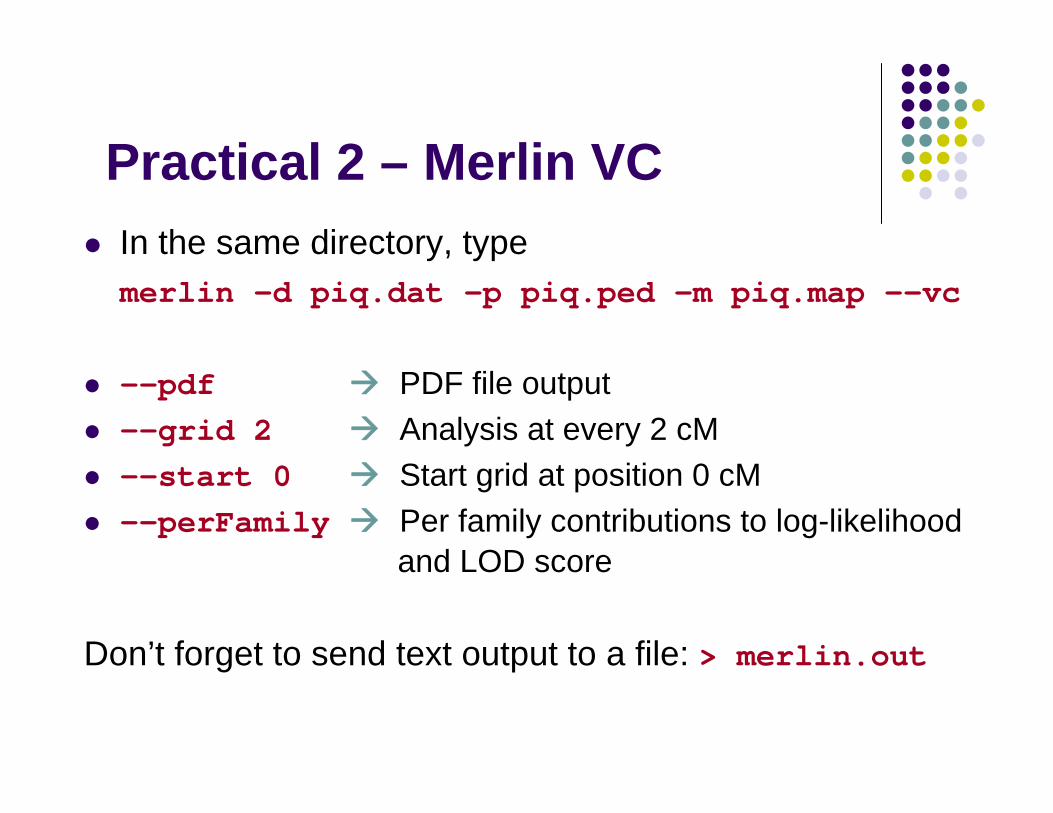
Practical 2 – Merlin VCIn the same directory, typemerlin –d piq.dat –p piq.ped –m piq.map --vc
--pdf PDF file output--grid 2 Analysis at every 2 cM--start 0 Start grid at position 0 cM--perFamily Per family contributions to log-likelihood
and LOD score
Don’t forget to send text output to a file: > merlin.out

Output
merlin.out

Output
sample heritability
evidence for linkage?merlin.out
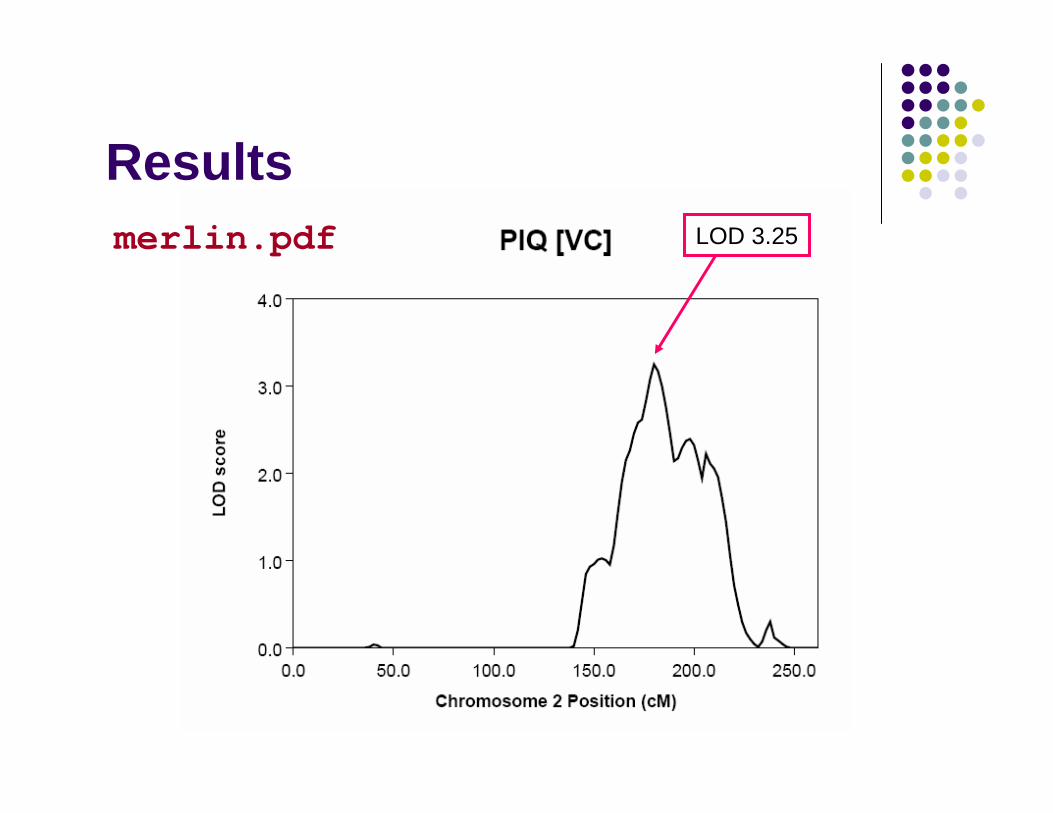
ResultsLOD 3.25merlin.pdf
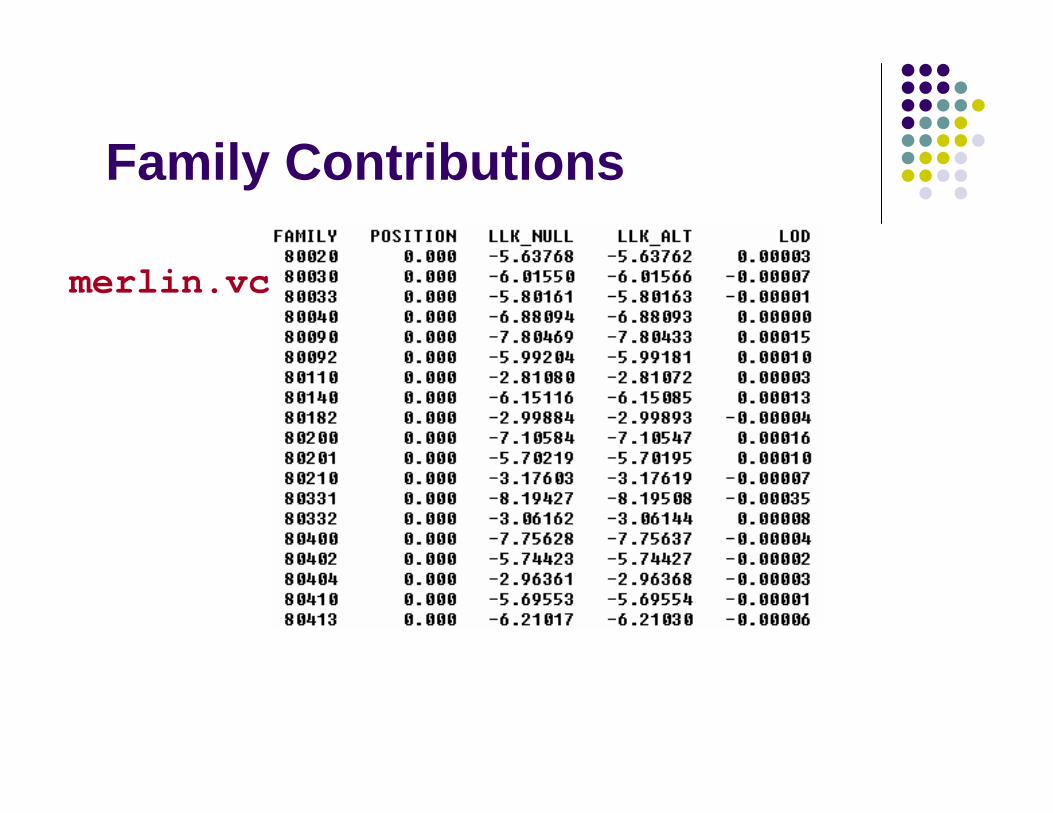
Family Contributions
merlin.vc

Family Contributions
Null hypothesis log-likelihood
Alternative hypothesisLOD score
merlin.vc

Creating Input FilesCreate your own Merlin input filesSmall example data set: 10 families, 2 offspring each (no parents!), one trait, one markerInitial data in Input.Exercise.xlsCreate ex.ped ex.dat ex.map
Use a text editor e.g. PFE (included in prac folder)Use 3 and 4 to denote father and mother extensions (remember – need parental information to link siblings, even if parents not genotyped)Use x for missing data Save files to your directory
Analysing Your Data…Check your files using PEDSTATSpedstats -d ex.dat -p ex.ped
Run VC linkage analysis in Merlin: merlin -d ex.dat -p ex.ped -m ex.map --vc
Your LOD score should be 0.41