link failure detection, network recovery, and network...
TRANSCRIPT
Link failure detection, network recovery, and network reliability in multi-hop wireless networks
by
Tareq HAYAJNA
THESIS PRESENTED TO ÉCOLE DE TECHNOLOGIE SUPÉRIEURE IN PARTIAL FULFILLMENT FOR THE DEGREE OF DOCTOR OF
PHILOSOPHY Ph.D.
MONTREAL, JUNE 20, 2017
ÉCOLE DE TECHNOLOGIE SUPÉRIEURE UNIVERSITÉ DU QUÉBEC
Copyright © 2017, (Tareq HAYAJNA, 2017) All right reserved

© Copyright reserved
It is forbidden to reproduce, save or share the content of this document either in whole or in parts. The reader
who wishes to print or save this document on any media must first get the permission of the author.
BOARD OF EXAMINERS (THESIS PH.D.)
THIS THESIS HAS BEEN EVALUATED
BY THE FOLLOWING BOARD OF EXAMINERS Mr. Michel Kadoch, Thesis Supervisor Department of electrical engineering, École de technologie supérieure Mr. Eric Paquette, President of the Board of Examiners Department of software engineering and information technology, École de technologie supérieure Mr. Mohamed Cheriet, Member of the jury Department of automated production engineering, École de technologie supérieure Mrs. Anjali Agarwal, External Member of the jury Department of electrical and computer engineering, Concordia university
THIS THESIS WAS PRENSENTED AND DEFENDED
IN THE PRESENCE OF A BOARD OF EXAMINERS AND PUBLIC
ON MAY 29, 2017
AT ÉCOLE DE TECHNOLOGIE SUPÉRIEURE


ACKNOWLEDGMENT
I would like to thank Dr. Michel Kadoch, my research director, for supervising my Ph.D
program, research and my Ph.D thesis. His support, suggestions, comments and ideas all the
way helped me a lot to reach my ultimate goal.
I would like also to thank Dr. Eric Paquette and Dr. Mohamed Cheriet, the Board of
Examiners, for their valuable comments and suggestions at my Ph.D proposal that helped me
later finish my thesis.
I am grateful to Dr. Anjali Agarwal, the external member of the jury, for her acceptance to be
a member of the jury.


DÉTECTION DE BRIS DE LIENS, RÉCUPÉRATION DE NETWORK, ET FIABILITÉ DE RÉSEAU DANS LES RÉSEAUX SANS FIL MULTI SAUTS
Tareq HAYAJNAN
RÉSUMÉ
Dans cette thèse, nous étudions les réseaux maillés sans fil (WMN) ainsi que les réseaux mobiles ad hoc (MANET), deux types de réseaux de communication multi-sauts sans fil. Les WMN et les MANET sont des technologies prometteuses qui ont la capacité de fournir des solutions efficaces à de nombreuses applications dans les domaines technologique, social, militaire, d’aide aux sinistres et économique. Certaines de ces applications sont des extensions de la couverture des réseaux cellulaires, de l'accès Internet à large bande et des réseaux communautaires et de voisinage. Le grand défi dans ces types de réseaux est le taux fréquent de bris de liens, rendant ainsi moins fiables la communication par rapport à d'autres types de réseaux. Cependant, la mise en œuvre d'un mécanisme rapide pour détecter les défaillances de liaison, l’application de métriques et d’un protocole de routage efficace et fiable ainsi qu’un puissant mécanisme de reconfiguration pour récupérer les échecs de liaison, vont améliorer grandement les performances des WMN et MANET et augmenteront leur fiabilité et leur disponibilité. Notre recherche comporte trois orientations. Dans la première direction, nous étudions les approches de détection de défaillance de lien et les techniques de récupération de défaillance de liaison. Dans cette direction, nous analysons mathématiquement la détection de défaillances de lien basée sur l’approche Hello mise en œuvre dans les protocoles de routage qui utilisent deux routes, l'une comme route principale et l'autre comme route de sauvegarde immédiatement utilisée lors des défaillances de lien. Les objectifs de l'analyse ci-dessus sont de calculer mathématiquement le rapport de livraison des paquets et de déterminer le gain que nous pourrions réaliser en utilisant deux itinéraires au lieu d'un. Nos résultats montrent que la livraison des paquets est augmentée de 1,5 fois en utilisant deux routes au lieu d'une. Il montre également que l'application de deux voies est essentielle pour couvrir les valeurs de taux d'échec de liaison élevé, et le besoin d'utiliser deux routes au lieu d'une, est plus urgent dans WMNs et MANETs avec des valeurs de taux de panne de liaison plus élevées, De plus, nous proposons un nouveau cadre qui attribue dynamiquement les valeurs des paramètres du schéma de détection de défaillance de lien basé sur l’approche Hello en rapport avec les types de communication et les exigences de QoS. En outre, nous proposons un protocole novateur pour améliorer la performance du système de détection de défaillance de liaison basée sur l’approche Hello.

VIII
Dans la deuxième direction, nous étudions les protocoles et métriques de routage fiables. Cette thèse propose un nouveau protocole de routage adaptatif pour augmenter la connectivité et la fiabilité du réseau tout en minimisant le nombre de sauts, en réduisant la distribution spatiale et la mémoire des nœuds de réseau et en simplifiant le processus de routage. La fiabilité et la connectivité du réseau sont étudiées dans le dernier volet. Basé sur notre étude, les seules façons de fournir des communications fiables et stables, réduire pratiquement la perte de paquets à zéro, et soutenir les communications multimédias dans MANETs et WMNs sont, l’utilisation de multi-route au lieu d'une, et en permettant aux protocoles de routage de sélectionner les routes les plus stables parmi les itinéraires disponibles. La densité de nœuds de réseau spécifie la probabilité de l’existence d'un itinéraire parmi n'importe quelle paire de source et de destination choisie au hasard. Ainsi, pour assurer l'existence de deux routes entre n'importe quelle paire source et destination, la densité nodale doit être supérieure à un certain seuil. Dans cette thèse, nous proposons un modèle mathématique pour trouver ce seuil. Nos résultats montrent que la probabilité d'avoir deux routes augmente de façon exponentielle avec le nombre de nœuds jusqu'à atteindre la région de saturation où l'augmentation du nombre de nœuds a un impact négligeable la croissance de cette probabilité. En plus de cela, nous étudions les effets de la mobilité des nœuds sur la connectivité réseau. Notre travail est évalué avec MATLAB. Mots clés: réseaux mobile ad hoc (MANET), réseaux maillés sans fil (WMN), fiabilité et disponibilité de réseaux, protocoles de routage, stratégie d’acheminement gourmand
LINK FAILURE DETECTION, NETWORK RECOVERY, AND NETWORK RELIABILITY IN MULTI-HOP WIRELESS NETWORKS
Tareq HAYAJNA
ABSTRACT In this thesis, we study Wireless Mesh Network (WMN) and Mobile Ad hoc NETwork (MANET), which are two kinds of wireless multi-hop communication networks. WMNs and MANETs are promising technologies that have the ability to provide effective solutions to many applications in the technological, social, military, disaster recovery, and economic fields. Some of these applications are the extension of the cellular network's coverage, broadband internet access, and community and neighborhood networks. The big challenge in these kinds of networks is the frequent link failures, which make them less reliable compared to other kinds of networks. Implementing a fast mechanism to detect link failures, effective and reliable routing protocols and metrics, and a powerful reconfiguration scheme to recover from the link failures greatly enhance the WMNs and MANETs performance, and increase their reliability and availability. Our research has three directions. In the first direction, we study link failure detection approaches and link failure recovery techniques. In this direction, we mathematically analyze Hello based link failure detection approach implemented in routing protocols that use two routes, one as a primary route, and the other one as a backup route that is immediately used upon link failures. The objectives behind the above analysis are to mathematically calculate the packet delivery ratio, and to find how much gain we could achieve by using two routes instead of one. Our results show that the packet delivery is increased by 1.5 times by using two routes instead of one. It also shows that applying two routes is essential to cover high link failure rate values, and the need using two routes instead of one is more urgent in WMNs and MANETs with higher link failure rate values, i.e. less reliable networks. In addition to that, we propose a novel framework that dynamically assigns the values of Hello based link failure detection scheme parameters based on the communication types and the QoS requirements. Besides that, we propose a novel protocol to enhance the Hello based link failure detection scheme performance. In the second direction, we study the reliable routing protocols and metrics. This thesis proposes a novel adaptive routing protocol to increase the network connectivity and reliability, while minimizing the hop count, reducing the network nodes' spatial distribution and memory, and simplifying the routing process.
X
The network reliability and connectivity are investigated in the last direction. Based in our study, the only ways to provide reliable and stable communications, virtually decrease the packet loss to zero, and to support multimedia communications in MANETs and WMNs are by using multi-route instead of one, and letting the routing protocols select the most stable routes among the available routes. The network node density specifies the probability that a route exists between any randomly chosen source and destination pair. Thus, to ensure the existence of two routes between any source and destination pairs, the node density must be above a certain threshold. In this thesis, we propose a mathematical model to find the above threshold. Our results show that the probability to have two routes exponentially increases with the number of nodes until it reaches the saturation region where the increase of the number of nodes has negligible improvements in terms of network availability. In addition to that, we study the effects of nodes mobility on the network connectivity. Our work is evaluated by MATLAB. Keywords: mobile ad hoc networks (MANET), wireless mesh network (WMN), network reliability and availability, routing protocols, greedy forwarding strategy

TABLE OF CONTENTS
Page
INTRODUCTION .....................................................................................................................1
CHAPTER 1 LINK FAILURE DETECTION APPROACHES ........................................9 1.1 Related work ..................................................................................................................9
1.1.1 Link layer feedback failure detection approach ........................................ 10 1.1.2 Hello based link failure detection approach .............................................. 12
1.2 Mathematical analysis of Hello based link failure detection approach .......................17 1.2.1 Network model and assumptions .............................................................. 18 1.2.2 Mathematical analysis ............................................................................... 18 1.2.3 Analytical framework ............................................................................... 20 1.2.4 Multi-path packet delivery ratio ................................................................ 21
1.3 Evaluation ....................................................................................................................24 1.3.1 The effect of TB and K on the packet delivery ratio ................................. 24 1.3.2 The effect of the sending rate on the pdr and the achieved gain ............... 26 1.3.3 The effect of the link failure rate on the pdr and the achieved gain ......... 29
1.4 Assigning the values of K and TB based on the communications types..................... 32 1.4.1 Introduction ............................................................................................... 33 1.4.2 The one route case .................................................................................... 34 1.4.3 The two routes case....................................................................................35
1.5 A novel enhanced Hello based link failure detection approach...................................41 1.5.1 The proposed algorithm ............................................................................ 41 1.5.2 Evaluation ................................................................................................. 44
1.6 Proposed solutions to network recovery......................................................................47 1.6.1 Initial resource allocation method ............................................................. 47 1.6.2 Greedy channel assignments method......................................................... 47 1.6.3 Interference aware channel assignments....................................................48 1.6.4 Autonomous reconfiguration system ........................................................ 48 1.6.5 Enhanced reconfiguration system. ............................................................ 52 1.6.6 Fault tolerant routing protocols ................................................................. 55
CHAPTER 2 RELIABLE ROUTING .............................................................................57 2.1 Introduction ..................................................................................................................57 2.2 Related work ................................................................................................................58 2.3 Adaptive greedy forwarding strategy in MANETs based on node density .................67
2.3.1 Mathematical model analysis .................................................................... 68 2.3.2 One-way connectivity ............................................................................... 72 2.3.3 Two-ways connectivity ............................................................................. 78
CHAPTER 3 NETWORK RELIABILITY AND CONNECTIVITY .............................83 3.1 Introduction ..................................................................................................................83 3.2 Literature review ..........................................................................................................83
XII
3.3 Ensuring reliable communications in MANETs with uniform random distribution ...87 3.3.1 Mathematical model analysis .................................................................... 78 3.3.2 Evaluation ................................................................................................. 92
3.4 The random waypoint mobility model .........................................................................96 3.5 Ensuring two routes connectivity with random waypoint mobility model ..................98
3.5.1 The hop count .......................................................................................... .99 3.5.2 Mathematical analysis .............................................................................. .99 3.5.3 Evaluation ............................................................................................... 102
CONCLUSION ......................................................................................................................107
RECOMMENDATIONS .......................................................................................................111
LIST OF PUBLISHED PAPERS ..........................................................................................115
LIST OF BIBLIOGRAPHICAL REFERENCES ..................................................................117

LIST OF TABLES
Page Table 1.1 The values of pdr1 for different values of K and TB ..................................24
Table 1.2 The effect of rLF on pdr1, pdr2 and gain ....................................................31
Table 1.3 Acceptable pdr for different multimedia communications types............. ..34 Table 1.4a Pdr1 for different combinations of K and TB at rLF = 0.01 ........................36
Table 1.4b The required K and TB values at rLF = 0.01 ...............................................37
Table 1.5a Pdr1 for different combinations of K and TB at rLF = 0.03 ........................37
Table 1.5b The required K and TB values at rLF = 0.03 .............................................37
Table 1.6a Pdr1 for different combinations of K and TB at rLF = 0.09 ........................38
Table 1.6b The required K and TB values at rLF = 0.09 .............................................38
Table 1.7a Pdr1 for different combinations of K and TB at rLF = 0.14 ........................39
Table 1.7b The required K and TB values at rLF = 0.14 .............................................40
Table 1.8a Pdr1 for different combinations of K and TB at rLF = 0.27 ........................40
Table 1.8b The required K and TB values at rLF = 0.27 .............................................40

LIST OF FIGURES
Page
Figure 0.1 The IEEE 802.11s mesh network architecture .............................................2
Figure 1.1 An analytical framework for a single multi-hop flow ...............................21
Figure 1.2 Packet delivery ratio versus TB for K=1, 2, 3 and 4 ..................................25
Figure 1.3 The relationship between the Gain and pB ................................................27
Figure 1.4 The relationship between pdr2 and hello loss probability (pB) ..................28
Figure 1.5 The relationship between pdr's and the link failure rate(rLF)....................30 Figure 1.6 The relationship between the Gain and rLF ................................................32
Figure 1.7 The relationship between the achieved increase in pdr1 and rLF ...............45
Figure 1.8 The relationship between the achieved increase in pdr2 and rLF ...............46
Figure 1.9 ARS steps ...................................................................................................50
Figure 1.10 Feasible plan generation in ERS ................................................................53
Figure 1.11 ERS QoS test..............................................................................................54
Figure 2.1 MFR greedy forwarding strategy.............................................................. 61 Figure 2.2 How Greedy-based Backup Routing (GBR) works............................... ..66 Figure 2.3 The angle ϕ in our adaptive greedy forwarding strategy..........................69 Figure 2.4 f (z) for the default case at N = 4 and R = 100m.....................................73 Figure 2.5 The relationship between Z and N at R = 100m ....................................74
Figure 2.6 The probability that the network is one-way connected vs. N..................75 Figure 2.7 The probability that the network is one-way connected vs. ϕ..................76 Figure 2.8 ϕ vs. R when the network is almost surely one-way connected...............77 Figure 2.9 The probability of one-way and two-ways connectivity vs. ϕ................ ..79
XVI
Figure 2.10 ϕ vs. R when the network is almost surely two-ways connected............ ..80 Figure 2.11 ϕ vs. R when the network is one-way or two-ways connected.................81 Figure 3.1 Probability density function of per one hop progress............................. ..93 Figure 3.2 The average per one hop progress (ε) vs. N at R = 100m....................... ..94 Figure 3.3 The probability that two k-hop routes exist between S and D vs. N........95 Figure 3.4 The average per hop progress vs. N for both MHD and LRD................103 Figure 3.5 The hop count vs. the node density (N) for both MHD and LRD..........104 Figure 3.6 The probability that the two k-hop routes exist vs. N.............................105

LIST OF ABBREVIATIONS AND ACRONYMS
ACK ACKnowledgement AHR Adaptive Hello Rate AODV Ad hoc On Demand Distance Vector AP Access Point ARS Autonomous Reconfiguration System BEST-MAC Bitmap-Assisted Efficient and Scalable TDMA-Based WSN MAC
BSR Backup Source Routing BW BandWidth CB Competing Backup CHAMP Caching and Multiple Paths D Destination node DA Destination Address DSR Dynamic Source Routing FDM Frequency Division Multiplexing GBR Greedy-based Backup Routing GBR-CNR GBR with Conservative Neighborhood Range GPS Global Position System GPSR Greedy Perimeter Stateless Routing IACA Interference Aware Channel Assignment LLLA Link Layer and Learning Automata LRD Least Remaining Distance MAC Media Access Control

XVIII
MANET Mobile Ad hoc NETwork MDA Mobility Detection Algorithm MFR Most Forward within R MHD Maximum Hop Distance NFP Nearest with Forward Progress NIC Network Interface Card OLSR Optimized Link State Routing PDORP PEGASIS-DSR Optimized Routing Protocol pdr packet delivery ratio PET Path Expiration Time PREQ Path REQuest QoS Quality of Service RA Receiver Address RBD Reliability Block Diagram RM-AODV Radio-Metric AODV RREP Route REPply RV Random Variables RWP Random WayPoint S Source node SA Source Address SMORT Scalable Multi-path On demand Routing TA Transmitter Address

XIX
TDM Time Division Multiplexing TDMA Time Division Multiple Access TGs Task Group “s” TLF Time to Link Failure TWC Time Without Change WMN Wireless Mesh Network WSN Wireless Sensor Network

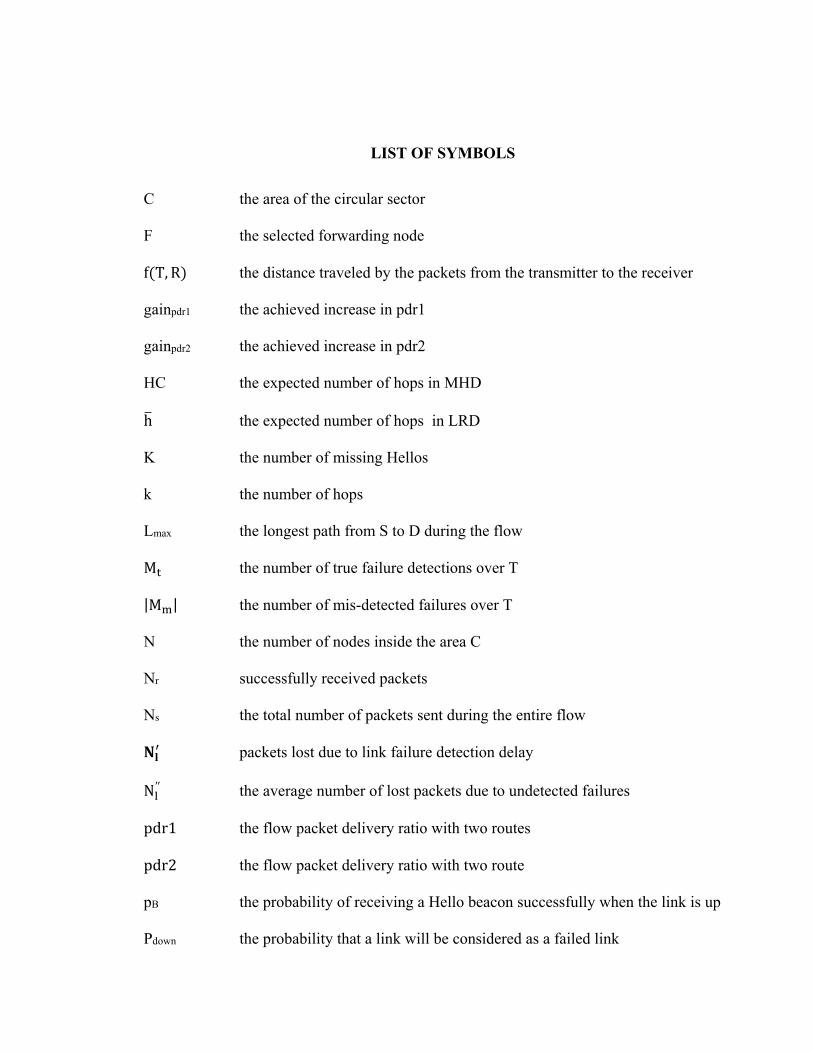
LIST OF SYMBOLS
C the area of the circular sector F the selected forwarding node f(T, R) the distance traveled by the packets from the transmitter to the receiver gainpdr1 the achieved increase in pdr1
gainpdr2 the achieved increase in pdr2 HC the expected number of hops in MHD h the expected number of hops in LRD
K the number of missing Hellos k the number of hops Lmax the longest path from S to D during the flow M the number of true failure detections over T |M | the number of mis-detected failures over T N the number of nodes inside the area C Nr successfully received packets
Ns the total number of packets sent during the entire flow
packets lost due to link failure detection delay N′′ the average number of lost packets due to undetected failures pdr1 the flow packet delivery ratio with two routes pdr2 the flow packet delivery ratio with two route pB the probability of receiving a Hello beacon successfully when the link is up Pdown the probability that a link will be considered as a failed link
XXII
P _ the probability of one-way connectivity in the general case P _ the probability of one-way connectivity in the default case P _ the probability of two-ways connectivity in the general case P the probability that two k-hop routes exist between S and D P(n) the probability that a mobile node has n neighbors inside a specified area R the transmission range r the Euclidean distance between S and F where the nodes are uniformly distributed in the network area rr the expected value of Ω Rfd the reduction in the false link failure detection ratio rFD the false detection rate
rLF link failure rate
rMD misdetection rate
T the flow duration TB the Hello interval tfail the link failure duration t the failure detection delay at sub-duration 1 (phase B) t the failure duration at sub-duration II (phase B') z the remaining distances to D. Z the expected maximum progress in the default case λ the sending rate Є a negligible variance due to channel congestion δ' the average detection delay
XXIII
τ the per-hop delay ρ the node density θ the angle between the line connection S and D and the line connecting S and F ϕ a dummy variable between 0 and π/2 ψ the probability that the source node has at least two neighbors δ the least remaining distance to D ε the forward progress per hop in LRD ε the average progress per hop in LRD Ω the maximum Euclidean distance between S and its neighbor


INTRODUCTION
In this thesis, we study two kinds of multi-hop wireless networks, namely Wireless Mesh
Network (WMN) and Mobile Ad hoc NETworks (MANET). Each client node in WMNs can
operate as a host and a router at the same time. WMNs consist of mesh clients, mesh routers
and gateways organized in a mesh typology in order to increase connectivity. These
components have different functions and specifications. Usually, mesh clients have mobility,
the ability to form a wireless mesh network among themselves (composing MANET), or with
mesh routers, limited power, and relatively simple structure. On the other hand, mesh routers
have minimal mobility, unlimited power, and advanced structure. Actually, mesh routers
form the backbone of WMNs. Finally, the gateways connect WMNs with other kinds of
networks, like Internet, cellular, and sensor networks.
In addition to routing operations, wireless mesh routers perform several other tasks, as shown
below. Usually, they have specialized routing functions to support mesh networking.
Wireless mesh routers achieve the same amount of network coverage with much less power
compared to traditional wireless routers. In addition to that, they have the ability to use some
enhanced Media Access Control (MAC) layer protocol to achieve more scalability.
The nodes in WMNs automatically establish and maintain mesh connectivity on their own,
which makes WMN self-configured, self-organized and self-healed. WMN have many
advantages like low setup cost, easy network maintenance, robustness, and reliable service
coverage (Akyildiz, Wang & Wang, 2005). Mesh clients nodes like phones, laptops and
desktops contain wireless Network Interface Cards (NICs) which connect them directly to
wireless mesh routers. Clients without wireless NICs can access WMNs through an Ethernet
card (Akyildiz et al., 2005). WMN has many applications such as broadband home
networking, community and neighborhood networks and enterprise networking. In July 2004,
industrial standards group IEEE established IEEE Task Group “s” (TGs) in order to propose
a standardized framework for WMNs (Minh, Nguyen, & Yamada, 2013). This group
proposed a new standard, namely the IEEE 802.11s, for flexible and extensible client mesh
2
networks in September 2011 (Minh et al., 2013). Figure 0.1 taken from (Henry, 2011) shows
the architecture of a 802.11s MANET/mesh network.
Figure 0.1 The IEEE 802.11s mesh network architecture
Taken from Henry (2011, p. 9)
As we can see from Figure 0.1, the 802.11s MANET/Mesh Network consists of three kinds
of nodes (Henry, 2011):
• Station: station is a device that cannot route frames. It works just like a host that
associate itself to one of the mesh Access Points (AP); in order to get services, such as
nodes K and H in Figure 0.1;
3
• Mesh station (Mesh STA): an IEEE 802.11 station with mesh capabilities. Thus, it can
work as a host or a router at the same time. Mesh stations can communicate with others
mesh stations, but they cannot communicate directly with non-mesh stations.
• AP: a mesh station with additional functions over mesh stations. It works as proxy to
connect non-mesh nodes with the mesh network. In order for a mesh AP to support both
the traditional IEEE 802.11 stations and IEEE 802.11s stations, MAP should be able to
transform four-address format into six-address format, and vice verse (Minh et al., 2013).
• Mesh Gate: a mesh station, which has the ability to connect mesh stations to IEEE
802.11 networks.
• Portal: a mesh station with bridging capability. It connects IEEE 802.11s mesh network
to the non-802.11 networks.
IEEE 802.11s uses the Hybrid Wireless Mesh Protocol (HWMP) as a routing protocol.
HWMP was firstly proposed by Michael Bahr in 2006 (Minh et al., 2013). This protocol is a
mix of the reactive Ad hoc On Demand Distance Vector (AODV) and the proactive tree-
based routing protocols, and it works on layer 2 instead of layer 3 with MAC addresses
instead of the IP addresses. It is also called the Radio-Metric AODV (RM-AODV), because
it uses a radio-aware metric as routing metrics.
IEEE 802.11s defines a new MAC frame format in order to support the MAC-based routing
protocols. This format has six addresses, while the traditional IEEE 802.11 has four
addresses (Minh et al., 2013). All the six addresses are needed in order to allow a non-mesh
station sends packets to another non-mesh station. If non-mesh station wants to send packets
to a mesh station or vice versa, five addresses are needed. On the other hand, if a mesh
station wants to communicate with other mesh stations, the traditional four addresses are
sufficient. The traditional four addresses in the conventional IEEE 802.11 are Source
Address (SA), Destination Address (DA), Transmitter Address (TA) and Receiver Address
(RA). IEEE 802.11s adds two other addresses to the above four addresses in order to support
layer 2 routing protocols between non IEEE 802.11 stations and IEEE 802.11s stations or
4
vice versa. These two additional addresses are mesh SA and mesh DA, representing the mesh
start and mesh end points, respectively.
There are many reasons to choose WMNs and not other kinds of networks. The first reason is
that WMNs have the ability to resolve the limitation of MANETs, and to improve the
performance of ad hoc networks. WMNs also have higher flexibility over wired networks.
They also provide wireless connection in places where wired connections is not possible, or
it is very expensive, such as large indoor environments (warehouses), and far away rural
areas.
MANETs can be considered as a subset of WMNs. Usually the WMNs are configured in a
mesh topology; in order to increase the network connectivity, while MANETs can take any
topology. MANET's nodes form a network on the fly, and that is why it is named ad hoc
networks. All MANET nodes have the same functionalities, rules, and specification, and can
move randomly without any restrictions. On the other hand, in WMNs some nodes have
certain functions and specifications, and usually they are static nodes.
The big challenge in WMNs and MANETs is the link failures, which are frequent events in
both kinds of networks. Channel interference, dynamic obstacles, mobility, and applications’
bandwidth demands are the causes of link failures in WMNs and MANETs. Link failures
interrupt the communication till the failure is detected and fixed; which causes severe
performance degradation especially for multimedia communications. Based on that, studying
link failure detection and network recovery are interesting and important research topics to
conduct. By implementing a fast and an accurate mechanism to detect link failures, and a
powerful reconfiguration scheme to recover from the link failures, and by proposing a fault
tolerant routing protocols and metrics greatly enhance the WMNs' and MANETs'
performance. The above mitigate the bad impacts of link failures, and increase the network
reliability and availability.
5
In this thesis, we study the approaches used to detect link failures, the techniques used to
recover from these failures, the reliable routing protocols and metrics, and the network
reliability and connectivity. Link layer feedback and Hello based link failure detection
approaches are the two main approaches that are used to detect link failures in WMNs and
MANETs. Since Hello based link failure detection approach is the most used, as we show
later, we give more attention to this approach. Specifically, we mathematically analyze Hello
based link failure detection approach, adapt its parameters to the communications types and
Quality of Service (QoS) requirements, and propose some modifications to it in order to
enhance its performance. After that, we study the reliable routing protocols and metrics used
in MANETs and WMNs, network reliability, and the network requirements to ensure
network connectivity. In addition to that, we propose some techniques to increase the
network reliability and availability. Finally, we propose a novel adaptive greedy forwarding
strategy for MANETs in order to reduce the hop count, save energy and memory size, and
reduce the nodes spatial distributions.
Problem Statement
MANETs and WMNs are two kinds of wireless communications which have properties and
working conditions that are different from wired communications. In wired communications,
all the required BandWidth (BW), to successfully complete a communication session, is
reserved before the communications start. In wireless communications this is not the case,
and nothing is reserved at all. Thus, all networks that are working in the same region, and
using the same frequency band, and even the users at the same network are competing for the
available BW. This sometimes causes wireless communications link failures. In addition to
that, we have other factors that make the communications links frequently fail in MANETs
and WMNs. These factors are nodes mobility, dynamic obstacles, fading, limited energy
resources, and spectrum allocation regulations. Thus, MANETs and WMNs are vulnerable to
frequent link failures that severely degrade the network performance and reduce the network
reliability. Based on that, maintaining an acceptable performance, availability, and reliability
6
of MANETs and WMNs in the face of link failures is a challenging, interesting and
important problem. The above motivate us to investigate how we could handle the frequent
link failures, how we could maintain an acceptable performance and reliability in the face of
link failures, how we could support multimedia communications over MANETs and WMNs,
and the network requirements that ensure the networks are connected.
Research Objectives
Our research objectives can be summarized in the following points:
• Developing a mathematical model for Hello based link failure detection approach
implemented in WMNs routing protocols that use two routes;
• Proposing a powerful technique to recover from link failures that can increase the packet
delivery ratio and the network reliability the most, and can support multimedia
communications;
• Finding the amount of improvement the use of two routes instead of one brings to the
network ;
• Dynamically assigning the values of the Hello interval and the number of missing Hellos
according to the application types and the QoS requirements, while taking into account
the available bandwidth and resources;
• Proposing a novel protocol to enhance Hello based link failure detection scheme
performance;
• Developing a novel reliable routing protocol that suits MANETs the most;
• Investigating the reliable routing protocols and metrics;
• Mathematically finding the node density which is required to ensure the existence of two
routes between any source and destination pair;
• Proposing some techniques that can increase the network reliability and ensure the
network is connected;
• Studying the effects of node mobility on the network connectivity.

7
Thesis Contribution and Innovation
Our contributions in this thesis can be summarized as follows:
• Mathematically analyzing the Hello based link failure detection approach that is
implemented in a WMN routing protocol that catches two routes;
• Providing a closed form formula that finds the packet delivery ratio in the above
approach;
• Finding how much gain we could achieve by using two routes instead of one;
• Comprehensively investigating the effects of the network parameters on the packet
delivery ratio and the achieved gain;
• Providing a novel framework that dynamically assigns the values of Hello based link
failure detection approach parameters, i.e. the Hello interval and the number of missing
Hellos, based on the multimedia communications types and the QoS requirements;
• Proposing a novel protocol to enhance the performance of the traditional Hello based link
failure detection approach;
• Proposing a novel adaptive greedy forwarding strategy that adapts the forwarding region
size to the network node density;
• Providing a complete mathematical framework that determines the optimum forwarding
region which ensures the one-way connectivity or the two-ways connectivity;
• Studying the relationships between the forwarding region size and both the node density
and the transmission range;
• Providing a probabilistic model that finds the node density, in terms of number of
neighbors, which ensures the existence of two routes between any randomly chosen
source node and destination node pair in MANETs where the nodes are either static and
uniformly distributed, or moving according to the random waypoint mobility model;
• Investigating the relationship between the node density and the probability of having two
routes in the above two cases;
• Proposing some solutions to increase the network node density to the required density
that ensures the existence of two routes;

8
• Comparing the optimization criterions in Maximum Hop Distance (MHD) and Least
Remaining Distance (LRD) greedy forwarding strategies potentials to select the shortest
path.

CHAPTER 1
LINK FAILURE DETECTION APPROACHES
1.1 Related work
The first logical step in any network recovery system is the detection of failures, and that is
why the first chapter of this thesis is the link failure detection approaches used in WMNs and
MANETs. The Link failure is a common event, and it is the main reason for network
degradation, and network unreliability in WMNs. To mitigate these failures impacts, we
should at first detect them accurately and fast. The fastest way to detect these failures is to
use a cross layer model which combines the MAC and network layers. However, Hello based
link failure detection scheme is the most used, as we explain later.
The node failure and the link quality degradation to unacceptable levels are the two reasons
of link failures in wireless networks (Gomez, Catalan, Mantecon , Paradells & Calveras,
2005a). Severe and permanent interference and the nodesmobility can cause the quality of a
link to decrease to unacceptably levels, which ultimately will make the link down. Link
failure on a route that is currently in use, interrupts the communication until the link failure is
detected and an alternate route is found. Thus, to increase the overall performance of the
network, we should fast detect link failures.
We have two mechanisms to detect link failures, namely neighbor discovery using Hello
beacons and cross-layer. To accelerate the detection of failed links, the cross-layer
mechanism is used. In the following two subsections, we show how these two mechanisms
work and the literature review for each mechanism.
10
1.1.1 Link layer feedback failure feedback approach
Link failure detection delay in Hello based approach is in the order of one second. Cross-
layer approach has been proposed in order to decrease the above detection delay. To provide
a frame transmission service in wireless networks as reliable as in wired Ethernet networks, a
retransmission mechanism has been implemented in the IEEE 802.11 MAC layer (Lindhorst,
Lukas & Nett, 2010). Each frame transmission must be acknowledged by the receiver to
ensure successful frame transmissions. If a frame is not acknowledged, it is retransmitted
several times until an Acknowledgment is received. After a certain number of
retransmissions, the frame is considered as a lost frame. We can use the above mechanism as
a link failure detection approach by making the MAC layer information regarding frame
transmission available to the routing layer. Thus, the routing layer can decrease the failure
detection delay by using the MAC layer information regarding the frame transmissions and
retransmissions.
Physical data rate influences the transmission errors. As we increase the transmission rate,
the transmission errors also increase. That is why low data rates are used for the last frame
transmission in order to increase the chance that this frame is successfully received. The
IEEE 802.11 standards use several modulation techniques, which results in different physical
data rates. Thus, the transmission rates are not fixed in IEEE 802.11 standards. Transmission
rate algorithm has to adapt with the link quality variations, especially in wireless
communications. In (Lindhorst et al., 2010) two failure detection models based on the Cross-
layer approach was proposed. The first model is independent of the data transmission rates,
while the second model is dependent on data transmission rates. On the following paragraph,
we explain these two models in detail.
The first model is FrmLoss. This model only considers complete frame losses and does not
care about the transmission rates. A counter (np) is used to count the number of complete
frame losses. This counter is incremented by one every time a frame loss occurs, and it is
rested to the initial value when the frame is successfully transmitted. A link failure is
11
assumed when np ≥ n , otherwise the frame losses are due to interference is assumed. The
second model is TxError. This model considers the transmission rates, erroneous frame
transmissions, in addition to complete frame losses. A counter (ne) count the number of
consecutive erroneous frame transmissions at the basic data rates only. ne is rested to the
initial value when a frame transmitted either successfully at basic data rate or any other rate.
A link failure is assumed when ne≥n , otherwise the frame losses are caused by interference
is assumed. How fast the data rates adaptation algorithm switch to the basic data rate
determines the detection delay in this model.
In summary, (Lindhorst et al., 2010) proposed two cross-layer models that emphasized the
importance of distinguishing between transient and permanent transmission errors to ensure
correct link failure detections. They took into account the impact of the physical data rate and
the data rate adaptation algorithm. High data rates provide the highest throughput, but at the
same time the highest transmission error probability (Lindhorst et al., 2010). The challenge in
the above two approaches is how to choose the appropriate threshold values for n and n .
Their results show that the delivery probability strongly depends on the used modulation
modes, and hence the physical transmission rates. The detection delay decreased from the
order of one second to some millisecond was experienced by a test-bed experiment
(Lindhorst et al., 2010).
(Pandey, Pack, Wang, Duan & Zappala, 2007) proposed a Mobility Detection Algorithm
(MDA). MDA is a cross-layer approach that helps MANET routing protocols determine the
real cause of frame losses, whether they are due to link failures (mobility) or congestion. The
main objectives in MDA are to reduce the routing overhead and to increase throughput.
Another approach that can distinguish between the frame losses that are due to congestion or
link failures is signal strength measurements (Goff, Abu-Ghazaleh, Phatak & Kahvecioglu,
2002); (Klemm, Ye, S. V. Krishnamurthy &Tripathi, 2005). As it is known, when a mobile
node starts moving away from a neighbor, the signal strength measured at that neighbor starts
decreasing till it reaches a certain threshold, and at that time that neighbor declares that the
link has broken. The drawback of using signal strength measurements to determine broken

12
links is the complications of fading, multipath effects, and power conservation mechanisms
that affect the accuracy of signal strength measurements (Pandey et al., 2007).
1.1.2 Hello based link failure detection approach
Neighbor discovery detects link failures in the routing layer as a part of the routing protocols.
Most proactive and reactive routing protocols detect link failures by means of Hello beacons.
In proactive routing protocols, like Optimized Link State Routing (OLSR), to discover the
nodes neighborhood and establish links to neighbor nodes, each node periodically sends
Hello beacons to neighbor nodes. After that, information obtained through Hello beacons is
propagated through the network. In this way, all nodes are aware of the whole network
topology. When one node detects a failed link, this node declares this failed links to all
neighbors. On the other hand, in reactive routing protocols like AODV, a route is determined
on demand. However, when this route is established, link failures are also detected by means
of Hello beacons during the rout connection period (Gomez et al., 2005a).
Hello based link failure detection approach is the most used approach to detect link failure,
even though the cross-layer using link layer feedback is faster in detecting link failures. This
is due to many reasons. On the one hand, link layer feedback frequently misinterprets
transient transmission errors as permanent transmission errors. On the other hand, Hello
based link failure detection scheme is easier to implement in MANET routing protocols and
it is a link layer independent (Tschudin, Gunningberg, Lundgren & Nordstrom, 2005);
(Gomez, Cuevas, & Paradells, 2006), and it requires less memory and power resources
(Gomez et al., 2005a).
Link failure detection scheme with Hello beacons works by periodically sending Hello
beacons to all neighbors. If a node receives a certain number of successive Hellos, it
considers the link as active, while if a node does not receive a Hello beacon or any kind of
frames for a certain period of time, a certain number of successive missing Hellos, it
13
considers the link as inactive. Based on that, the failure detection delay is determined by the
Hello interval (TB), and the number of missing Hellos (K). Hello based link failure detection
scheme is used in many WMNs and MANETs routing protocols to detect links failures and
to maintain route connectivity (Perkins, Belding-Royer & Das, 2003) and (Bellur & Ogier,
1999). Traditionally, the routing protocols use fixed values of K and TB. For example, in
AODV TB is chosen to be 1 second and K is chosen to be 2 (Gomez et al., 2006). Later in this
thesis, we will see that the use of fixed values of K and TB is not the best choice.
Some authors were aware that the classical behaviour of choosing fixed values for both TB
and K might not be the best choice, and that was why they proposed some approaches to
adaptively choose the TB. To the best of our knowledge, the proposals available in literature
just adapted the TB parameter and ignored the K parameter to enhance Hello based link
failure detection approach performance. This was due to the fact that the researchers focus
was on maintaining the routing table's accuracy and not in specific link failure detection. In
this thesis, we will consider both TB and K to enhance Hello based link failure detection
approach performance. In the following, we introduce to some proposals that adapt the TB
parameter.
(Gome et al., 2006) proposed a two-state adaptive mechanism for link connectivity
maintenance in AODV, namely Adaptive Hello Rate mechanism (AHR) algorithm to
dynamically choose the Hello interval based on two parameters, Time to Link Failure (TLF)
and Time Without Change (TWC). TLF and TWC parameters determine the link lifetime
duration, and the dynamicity of the communication links, respectively. AHR algorithm has
two states, the first one is a low dynamic state that uses low Hello rate, and the second one is
a highly dynamic state that uses high Hello rate. This mechanism switches between these two
states based on two thresholds. AHR enters the highly dynamic state when the estimated
TLF become smaller than the first threshold; while it enters the low dynamic state, when
TWC becomes greater than the second threshold. The difficulty in this mechanism is how to
choose these two thresholds.
14
(Giruka & Singhal, 2005) proposed three protocols, namely, Adaptive Hello protocol,
Reactive Hello protocols, and Event Based Hello protocol in order to achieve the best trade-
off between Hello overhead and routing tables' accuracy, and to reduce the network
congestion. In Adaptive Hello protocol, the Hello rate is chosen based on the node average
speed, direction, and position. A Hello beacon is sent once the node moves a certain distance.
This protocol assumes that each node knows its average speed, direction, and position. To
deal with very high speeds and long pause times, (Giruka & Singhal, 2005) proposes two
parameters to control the high rate beaconing and low rate beaconing. These parameters are
MIN-BEACON-INTERVAL and MAX-BEACON-INTERVAL. When the Hello interval is
less than MIN-BEACON-INTERVAL, then the Adaptive Hello protocol resets the Hello
interval to MIN-BEACON-INTERVAL. On the other hand, when the Hello interval is
greater than MAX-BEACON-INTERVAL, it resets the Hello interval to MAX-BEACON-
INTERVAL. Reactive Hello protocol works like reactive routing protocols, where the nodes
only send Hellos, when they need to build routes to send data. Finally, Event Based Hello
protocol works as the classic periodic Hello protocol, with the exception that if a node does
not receive any messages and does not need to send any packet, that node stops sending
Hellos. Even though the last protocol reduces the overhead, it comes at the expense that some
nodes may never be detected.
Hello beacon exchanges among neighbors are also used in order to maintain up-to-date
neighbors' positions in the geographic routing, i.e. position based routing protocols. Choosing
fixed value of the Hello interval does not optimize the network performance in terms of
overhead, packet delivery ratio and the average end to end delay is proven in (Chen, Kanhere
& Hassan, 2013). (Chen et al., 2013) recommend to adaptively choosing the Hello interval
based on the node mobility and the traffic patterns, as it is shown below. They propose
Adaptive Position Update (APU) beaconing strategy to adapt the Hello periodic beaconing
scheme employed in position based routing protocols based on the node mobility and the
traffic loads. The Hello interval in APU strategy is chosen based on two rules, which are
Mobility Prediction (MP) rule and On-Demand Learning (ODL) rule. These two rules are
explained in the following two paragraphs.

15
The Hello interval is adapted to the nodes' speeds and directions in the MP rule. The Hello
beacon shall contain the nodes' speeds and directions in order to employ the MP rule track, as
explained later. Each of node i's neighbors records its position and velocity upon receiving a
Hello beacon from it in order to periodically track node i’s position using a simple prediction
scheme (Chen et al., 2013). The neighbors check whether node i is still within their
transmission range, and update their neighbor list accordingly based on the above estimation
(Chen et al., 2013). Based on that, node i broadcasts a Hello beacon when the estimated error
between its actual position and the predicted position in its neighbors is greater than a certain
threshold.
On the other hand, the ODL rule improves the topology accuracy in the vicinity of the active
routes, as shown below. The nodes must be in the promiscuous mode in order to implement
the ODL rule. Node i broadcasts a Hello beacon when it overhears the transmission of a
packet order to ensure that the nodes involved in the packets forwarding maintain a more up-
to-date local network topology (Chen et al., 2013). Thus, the nodes that do not overhear
ongoing data transmissions are not affected by the ODL rule. It is important to mention that
the MP rule and ODL rule separately work and no rule affects the operation of the other rule.
They are shown in (Chen et al., 2013) that the APU beaconing scheme reduces the Hello
beaconing overhead, increases packet delivery ratio, and decreases the packets delay in
comparison with the traditional Hello beaconing scheme and other updating beaconing
schemes. Like other updating scheme, the drawback of APU is the choice of the optimal MP
rule's threshold.
(Zadin & Fevens, 2014) and (Zadin, Fevens & Bdiri, 2016) studied the effects of the Hello
interval and node velocity on different types of greedy forwarding strategies. It was shown
via simulations that decreasing the Hello interval increase the total number of delivered
packets and packet delivery ratio (Zadin et al., 2016).
Recently, new studies have been conducted to improve the network reliability and increase
the packet delivery ratio. However, these studies were not ideal candidates for WMNs and

16
MANETS for many reasons. Firstly, some of these studies had their own constrains and
assumptions. Secondly, some of the main objective was the energy consumption saving and
not the improvement of WMNs' reliability and packet delivery ratio. This is due to the fact
that some of them were specifically designed for Wireless Sensor Networks (WSNs). Finally,
they were a little bit complex to implement them in WMNs or MANETs. In the following,
we briefly introduce some of the above studies.
Link Layer and Learning Automata (LLLA) protocol for channel assignment in multi-radio
WMNs was proposed in (Shojafar, Abolfazli, Mostafaei & Singhal, 2015) and (Shojafar,
Pooranian, Shojafar & Abraham, 2014). As it is names imply, LLLA protocol depends on
learning automata. However, the above protocol has many drawbacks as shown below. At
first, a lot of constraints and assumptions on the networks topology, node structures and data
traffic are put in LLLA. Some of them are not realistic. For example, LLLA assumes each
network node has at least three radios, and uses a combination of Time Division
Multiplexing (TDM) and Frequency Division Multiplexing (FDM) as the MAC layer
protocol to transmit data (Shojafar et al., 2015). As it is known, usually mesh nodes are
equipped with one radio and one channel, and use contention based MAC protocol, i.e. they
neither use TDM nor FDM; therefore, the above assumptions are not realistic. In addition to
that, LLLA is very complex to implement it in mesh nodes and has a lot of overhead in terms
of bandwidth and processing time. Finally, LLLA technique considers an ideal network
where there are no link failures at all. Indeed, this is not a realistic condition in MANETs and
WMNs, where the node mobility causes a lot of link failures.
The first authors who mathematically analyzed Hello based link failure detection approach
implemented in AODV routing protocols that caught just one route were Valera and Tan
(Valera & Tan, 2012). This thesis modifies and extends the above analysis by incorporating
two routes, a primary route and a backup route, instead of one route. To this end, a complete
analytical framework that clarifies how Hello based link failure detection approach
implemented in a routing protocol that uses two routes works is provided. With the aid of
that framework, an equation that can be used to find the packet delivery ratio is formulated.

17
In addition, we find the gain we can achieve by implying a backup route. The obtained
results show that this gain is 1.5, and it is insensitive to the number of loads. Later in this
thesis, we will see that this gain plays a crucial rule to allow WMNs and MANETs support
multimedia communications.
In the following, we analyzed the Hello based link failure detection approach that is
implemented in a WMN routing protocol that catches two routes. After that, we provide a
novel framework that can be used to select the proper Hello based link failure detection
approach parameters to satisfy the QoS requirements for the different kinds of multimedia
communications. Finally, we propose a novel algorithm to enhance the performance of the
traditional Hello based link failure detection approach. The contributions of our studies are as
follows:
(i) It is the first study that mathematically analyzes Hello based link failure detection
approach that is implemented in a WMN routing protocol that catches two routes;
(ii) It calculates the improvement in the packet delivery ratio (pdr) by using two routes
instead of one;
(iii) It provides a novel framework that dynamically assigns the values of Hello based link
failure detection approach parameters based on the multimedia communication types and the
QoS requirements. This framework can be used as a guideline to choose the proper Hello
based link failure detection approach parameters to satisfy the QoS requirements;
(iv) It proposes a novel algorithm to enhance the performance of the traditional Hello based
link failure detection approach.
1.2 Mathematical analysis of Hello based link failure detection approach
This section analyzes the Hello based link failure detection approach that is implemented in a
WMN routing protocol that catches two routes to mathematically find the packet delivery
ratio. This analysis is based on the analysis provided in (Valera & Tan, 2012). The major
difference between our analysis and that analysis is that our analysis analyzes the Hello based

18
link failure detection approach that is implemented in a WMN routing protocol that catches
two routes, while the analysis in (Valera & Tan, 2012) analyzes the same link failure
detection approach, but with just one route. In addition to that, our analysis is more
comprehensive, where it studies the impacts of link failure rates on the packet delivery ratio,
besides the other parameters that affect the packet delivery ratio. The main objective of our
analysis is to mathematically prove that the two routes improve the packet delivery ratio, and
how much improvement the two routes bring to the network.
1.2.1 Network model and assumptions
A WMN is modelled as an undirected graph G = (V, E) where V and E are the set of nodes
and links, respectively. A link (i, j) is up if node i and node j can directly communicate. Our
concern in this study is the QoS requirements based on routing; therefore, we are not
considering physical layer, modulations or channels assignment. In this analysis, we assume
the following:
(i) The Link Failure Rate (rLF) is the same for all links in E;
(ii) A backup path is always available where it is immediately used in case of failures, and
after that the routing protocol starts looking for another route to ensure that a backup route is
always available. The WMN is arranged in a mesh topology that provides multi-route
between any two nodes. Based on that, our assumption to have two routes available is a
realistic assumption that can be easily satisfied in WMNs. For example, the Greedy-Based
Backup Routing (GBR) protocol (Yang, Yang, Yang &Yang, 2011), which is introduced in
chapter 2, can be used to satisfy this requirement.
(iii) The WMN nodes are equipped with just one channel and one radio.
1.2.2 Mathematical analysis
To smoothly start our analysis, we firstly explain how Hello based link failure detection
approach works. It works as follows: mesh or ad hoc network nodes send periodic Hello
beacons to all neighbors. The link is considered active (up) and used for routing, upon the
reception of a certain number of successive Hello beacons. If a node does not receive a Hello

19
beacon for a certain period of time (certain number of successive missing Hellos), it
considers the link as inactive (down) and no more uses it for routing. Thus, the Hello interval
(TB), and the number of missing Hellos (K) determine the maximum delay (δ) to detect link
failures. The following equation taken from Lindhorst et al. (2010, p. 45) determines how we
can find the maximum delay δ mathematically:
δ = KT + Є (1.1)
Taken from Lindhorst et al. (2010, p. 45)
Where : K : the numbers of Hellos.
TB : Hello interval.
Є : a negligible variance due to channel congestion.
δ has a uniform distribution on [(K−1)TB, KTB] (Valera & Tan, 2012). According to that, δ
average (δ′) is:
δ′ = (2K − 1)T2 (1.2)
Where K is an integer ≥ 1, and TB > 0.
Transient and permanent transmission errors are the two kinds of transmission errors.
Transient transmission errors are caused by interference and congestion, while permanent
transmission errors are caused by link failures. To ensure correct link failure detections, we
should distinguish between these two kinds of errors. Retransmissions in the MAC layer
compensate transient transmission errors while finding and using a new path in the routing
layer compensate permanent transmission errors. If a transient error is misinterpreted as a
permanent error, a new route must be found, and this will cause network topology
destabilization and additional incurred overhead, while further retransmissions in the MAC
layer will be sufficient to deliver a frame. Thus, to ensure correct link failure detections, the
misinterpretation of transient transmission errors as permanent transmission errors must be

20
avoided or at least minimized. The false interpretations of transient transmission errors as
permanent transmission errors are called false positives alert. The false positive alert
probability is (1 − pB)K , where pB is the probability of receiving a Hello beacon successfully
when the link is up. To have a meaningful parameter, a false detection rate (r ) is provided,
which is equal to false positive alert probability divided by TB (Valera &Tan, 2012).
Equation 1.3 taken from Valera & Tan (2012, p. 670) findsr .
r = (1 −p )T (1.3)
Taken from Valera & Tan (2012, p. 670)
Where p is the probability of receiving a Hello beacon successfully.
Failures can be missed by Hello based link failure detection approach, when the failure time
is less than minimum detection delay (K − 1)TB. Equation 1.4 taken from Valera & Tan
(2012, p. 670) calculates the misdirection rate (r ) that gives us the number of undetected
failures per second. Note that when K equals to 1, the minimum detection delay is equal to
zero. Based on equation 1.4, r in the above case is equal to zero. In other words, the
probability of missed failures is equal to zero.
r = r P[t < (K − 1)T (1.4)
Taken from Valera & Tan (2012, p. 670)
Where: tfail : the link failure duration. rLF : link failure rate.
1.2.3 Analytical framework
Figure 1.1 shows the events and phases that affect the packet delivery ratio for a single multi-
hop flow from the Source node (S) to the Destination node (D),and it applies to both
proactive and reactive routing protocols that catch two paths. Assume that S sends packets to
D at a rate of λ packets per seconds. Figure 1.1 has two sub-duration (events), sub-duration I
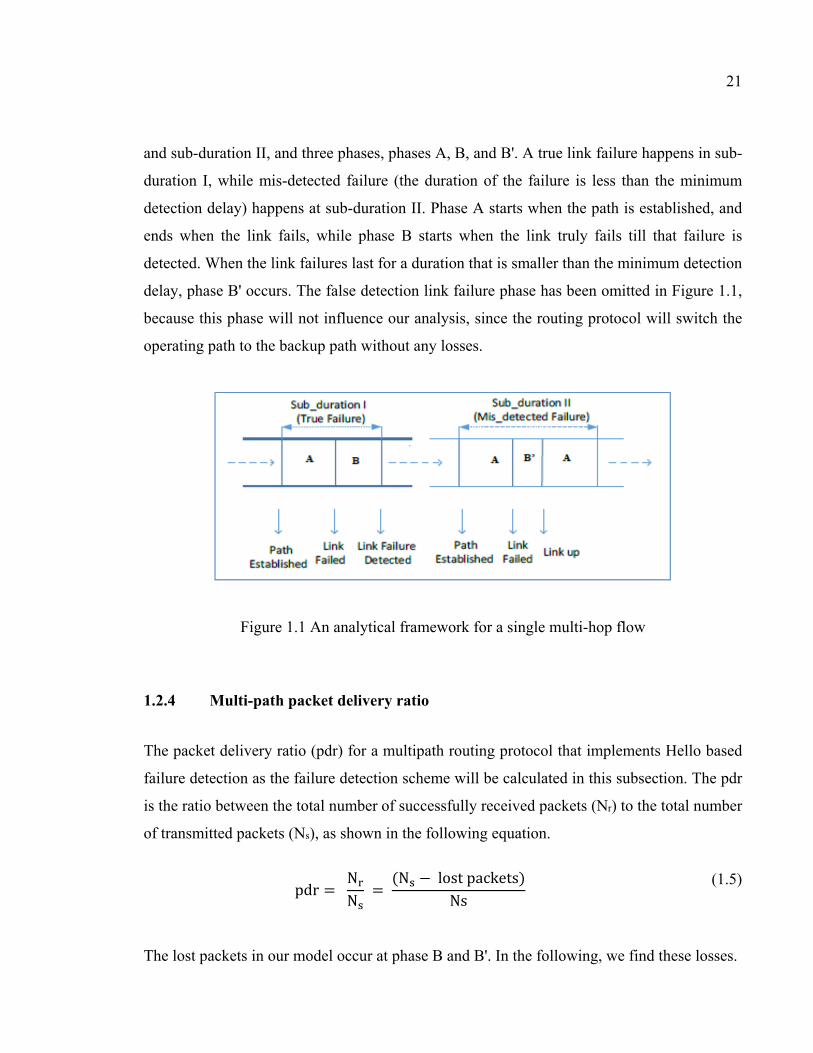
21
and sub-duration II, and three phases, phases A, B, and B'. A true link failure happens in sub-
duration I, while mis-detected failure (the duration of the failure is less than the minimum
detection delay) happens at sub-duration II. Phase A starts when the path is established, and
ends when the link fails, while phase B starts when the link truly fails till that failure is
detected. When the link failures last for a duration that is smaller than the minimum detection
delay, phase B' occurs. The false detection link failure phase has been omitted in Figure 1.1,
because this phase will not influence our analysis, since the routing protocol will switch the
operating path to the backup path without any losses.
Figure 1.1 An analytical framework for a single multi-hop flow
1.2.4 Multi-path packet delivery ratio
The packet delivery ratio (pdr) for a multipath routing protocol that implements Hello based
failure detection as the failure detection scheme will be calculated in this subsection. The pdr
is the ratio between the total number of successfully received packets (Nr) to the total number
of transmitted packets (Ns), as shown in the following equation.
pdr = NN = (N − lostpackets)Ns (1.5)
The lost packets in our model occur at phase B and B'. In the following, we find these losses.

22
1) Packets lost due to link failure detection delay ( )
The packets are lost here, because the link goes down, while the routing protocol is still not
aware of this failure, as shown in phase B in Figure 1.1. Thus, the losses depend on the
average detection delay δ'. The following equation, taken from Valera & Tan (2012, p. 671),
can be used to find these losses:
N = E λ t ∈ = λ|M |δ (1.6)
Taken from Valera & Tan (2012, p. 671)
Where: t : the failure detection delay at sub-duration 1 (phase B). |M | : the number of true failure detections over the flow duration (T).
λ : the packets sending rate.
|M | depends on rLF , rMD, T, and the route length from S to D (the number of hops between S
and D). Suppose that Lmax is the longest path from S to D during the flow, then
N ≤ λL T(r −r )(2K − 1)T2 (1.7)
Taken from Valera & Tan (2012, p. 671)
If we assume that Lmax = L (all the used paths during the flow are of the same length) , then
the total number of packets lost due to link failure detection delay N′ is
N = λLT(r −r )(2K − 1)T2 (1.8)
Taken from Valera & Tan (2012, p. 671)
2) Packets lost due to undetected link failures ( ′′)
The loss occurs here, because the path is temporarily down, while the sending node keeps
sending packets, since it is unaware of this failure. The failure duration in this case is less
than the minimum detection delay (K-1)TB, then
23
E tЄ < |M |δ = |M |(2K − 1)T2 (1.9)
Taken from Valera & Tan (2012, p. 671)
Where: t : the failure duration at sub-duration II (phase B'). |M | : the number of mis-detected failures over T. |M | depends on rMD, T, and the route length from S to D. Then the average number of lost
packets due to undetected failures (N′′) is upper bounded by
N < L Tr (2K − 1)T2 (1.10)
Taken from Valera & Tan (2012, p. 671)
3) The flow packet delivery ratio with two routes (pdr1)
The total number of packets sent during the entire flow (N ) is equal to λT packets, because
the sending rate is λ and the flow duration is T. Then based on equation 1.5, the pdr can be
easily calculated as:
pdr = = 1 − (1.11)
The lost packets are the total number of lost packets that happen at phase B and phase B', as
we said before. Based on that, the lost packets is equal to N +N . Substitute the values of N
and N from equations 1.8 and 1.0, respectively, into equation 1.11. Then the pdr in our
model (pdr1) is lower bounded by
pdr1 1 − (2K − 1)T Lr2 (1.12)
24
1.3 Evaluation
In this section, we comprehensively investigate the effects of the various network parameters
on the packet delivery ratio and the achieved gain. In addition to that, we find how much gain
we could achieve by using two routes instead of one.
1.3.1 The effect of TB and K on the packet delivery ratio
The objective of this subsection is to show how TB and K affect pdr1. To see the effect of TB
and K on pdr1, fixed values of L and rLF are taken. Assume as in (Valera &Tan, 2012) L = 3
hops and rLF = .0167 failures per second. Similar values of L and rLF are assumed as in
(Valera &Tan, 2012) in order to later compare the pdr in our model to the model provided
there that just uses one route. By assuming fixed values of L and rLF , and changing the
values of K from 1 to 4 and TB from 0.25 to 1.75 seconds in equation 1.12, Table 1.1 is
obtained that shows the pdr1 values for different values of K and TB. The reason behind
choosing the above values of K is that in reality K cannot be above 4 or less than 1. In a
practical network operation, TB shall not be below 0.25 second, because otherwise it will
consume a relatively huge bandwidth and power. On the other hand, if TB is larger than 1.75
seconds the pdr will be very small. That is why the values of TB in Table 1.1 are from 0.25 to
1.75 seconds.
Table 1.1 The values of pdr1 for different values of K and TB
TB
K
0.25 0.50 0.75 1.00 1.25 1.50 1.75
1 0.994 0.988 0.981 0.975 0.969 0.962 0.956
2 0.981 0.962 0.944 0.925 0.906 0.887 0.869
3 0.969 0.937 0.906 0.875 0.843 0.812 0.781
4 0.956 0.912 0.869 0.825 0.781 0.737 0.693
25
Figure 1.2 Packet delivery ratio versus TB for K=1, 2, 3 and 4
The relationship between the pdr1 values and the TB values for K=1, 2, 3, and 4 is shown in
Figure 1.2. As it is expected, we have an inverse relationship between the packet delivery
ratio and the Hello interval (see Figure 1.2). To get the highest delivery ratio we should
choose K=1 and TB as small as possible. We can use Figure 1.2 to choose the best values of
K and TB that satisfy the QoS requirements, type of application, or according to the required
data reliability at the expense of more overhead and more bandwidth. For example, for
applications that are sensitive to pdr, like speech communications, we can choose K = 2 and
TB = .25 seconds; while in applications that are insensitive to pdr, we can choose higher
values of K and TB, such as K = 3 and TB = 1.5 seconds. For heavy loaded wireless networks
with limited bandwidth, we should choose higher values of TB in order to save bandwidth. In

26
the next section, we will further study how to assign the values of K and TB according to the
applications types and the QoS requirements.
1.3.2 The effect of the sending rate on the pdr and the achieved gain
To demonstrate the usefulness and effectiveness in implementing two routes instead of one,
we compare the flow packet delivery ratio in two flows, one flow that uses two routes and the
second flow that uses one route. The failure detection scheme in the two flows is Hello based
link failure detection scheme. The pdr for the first flow (pdr1) is achieved by using equation
1.12 in this thesis; while the pdr for the second flow (pdr2) is achieved by using the
following equation:
pdr2 = 1 − L2 r [(2K − 1)T + (L − 1)τ +(1 − p )T[(L − 1)τ
(1.13)
Taken from Valera & Tan (2012, p. 672)
Where:
L : the route length in terms of number of hops between S to D.
rLF : the link failure rate.
K : the number of missing Hellos.
TB : the Hello interval.
τ : the per-hop delay.
pB : the probability of receiving a Hello successfully.
The Misdetection Rate (rMD) is ignored in equation 1.13, because most losses are due to link
failure rate and false link failure detection rate (Valera &Tan, 2012). The achieved gain is
obtained by dividing pdr1 over pdr2.
Gain = pdr1/pdr2 (1.14)
27
Figure 1.3 The relationship between the Gain and pB
Assume L = 3 hops, rLF = 0.0167 failures per second, τ = 0.1 second, K = 2, and TB = 1
second. These values were taken from (Valera &Tan, 2012), because they were realistic
values experimentally determined. To study the effect of the sending rate λ on the achieved
gain, different sending rates are considered. In equation 1.13, pdr2 does not have an explicit
relationship with λ; however, it has an implicit relationship via the probability of receiving
the Hello beacon successfully (pB). When λ increases, pB decreases. For λ equal to 0.0, 25,
50 and 100 packets per second, pB will be equal to 0.85, 0.7, 0.65 and 0.55 (Valera &Tan,
2012), and the achieved gain, produced by using equation 1.14, will be equal to1.4909,
1.5240, 1.5405 and 1.5827, respectively. These results show that the pdr1 increased roughly
by 1.5 for all sending rates, which means that the pB has a negligible impact on the achieved
gain. In summary, by using two routes instead of one route, pdr is roughly increased by a
factor of one and a half for all pB values as shown in Figure 1.3.

28
To have a better understanding of the effect of pB on the packet delivery ratio, we investigate
how pB separately influences pdr1 and pdr2. Equation 1.12 shows that pdr1 does not depend
on pB. This is due to the fact that, pB depends on the sending rate, and when it increases, the
probability that the Hello beacons lost due to collision increases. Thus, pB affects the false
detection rate (rFD) as shown in equation 1.3. In the case of false link failure detections, the
routing protocol will use the backup path without any packets loss. This explains why pB has
no effect in pdr1. On the other hand, pdr2 has an implicit relationship with pB via λ
parameter. In the case of routing protocols that use just one route, when a node erroneously
declares that a link has failed, it drops all the packets that are using this route and sends an
error message all the way back to the source. All the intermediate nodes that are using this
route and the source node drop all packets that are using this route upon the receiving of this
error message. Figure 1.4, shows the relationship between pdr2 and pB, for L = 3 hops, rLF =
0.0167 failures per second, τ = 0.1 second, K = 2 and TB = 1 second.
Figure 1.4 The relationship between pdr2 and the Hello loss probability (pB)
29
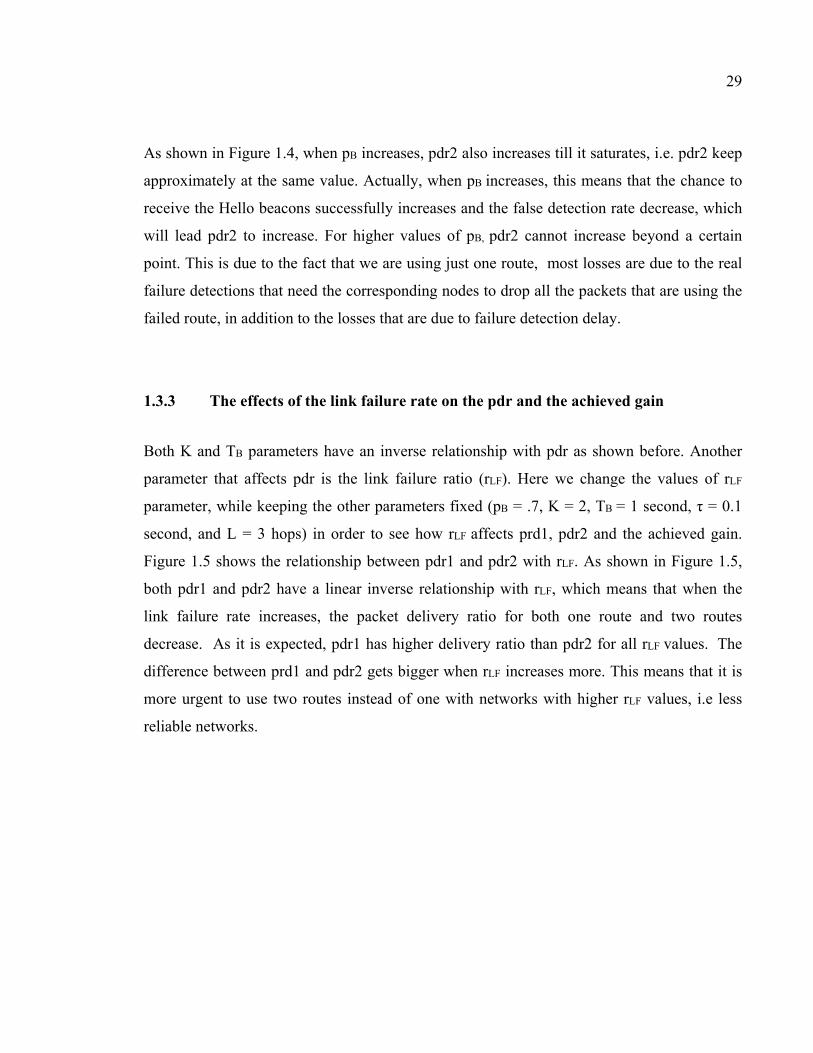
As shown in Figure 1.4, when pB increases, pdr2 also increases till it saturates, i.e. pdr2 keep
approximately at the same value. Actually, when pB increases, this means that the chance to
receive the Hello beacons successfully increases and the false detection rate decrease, which
will lead pdr2 to increase. For higher values of pB, pdr2 cannot increase beyond a certain
point. This is due to the fact that we are using just one route, most losses are due to the real
failure detections that need the corresponding nodes to drop all the packets that are using the
failed route, in addition to the losses that are due to failure detection delay.
1.3.3 The effects of the link failure rate on the pdr and the achieved gain
Both K and TB parameters have an inverse relationship with pdr as shown before. Another
parameter that affects pdr is the link failure ratio (rLF). Here we change the values of rLF
parameter, while keeping the other parameters fixed (pB = .7, K = 2, TB = 1 second, τ = 0.1
second, and L = 3 hops) in order to see how rLF affects prd1, pdr2 and the achieved gain.
Figure 1.5 shows the relationship between pdr1 and pdr2 with rLF. As shown in Figure 1.5,
both pdr1 and pdr2 have a linear inverse relationship with rLF, which means that when the
link failure rate increases, the packet delivery ratio for both one route and two routes
decrease. As it is expected, pdr1 has higher delivery ratio than pdr2 for all rLF values. The
difference between prd1 and pdr2 gets bigger when rLF increases more. This means that it is
more urgent to use two routes instead of one with networks with higher rLF values, i.e less
reliable networks.

30
Figure 1.5 The relationship between the packet delivery ratio for two routes and one route cases and the link failure rate
The values of pdr1, pdr2 and the achieved gain for different values of rLF are shown in Table
1.2. We can notice from Table 1.2 that when the link failure rate becomes very high, the pdr
for both flows goes negative, which means that the Hello based link failure detection scheme
is no more applicable at these link failure rates. At rLF = 0.2 failures per second, pdr2 goes
negative, while pdr1 goes negative at rLF = 0.3 failures per second. These results make sense,
because in pdr1 we have two paths. Based on that Hello based link failure scheme can stand
up in networks that use two routes with higher failure rates. For the above reasons, this thesis
studies the effect of rLF on the achieved gain for networks with rLF less than 0.1 failures per
second.

31
Table 1.2 The effect of rLF on pdr1, pdr2 and gain
rLF pdr1 pdr2 Gain
0.01 0.955 0.637 1.499
0.0167 0.925 0.607 1.524
0.02 0.910 0.592 1.537
0.03 0.865 0.547 1.581
0.04 0.820 0.502 1.633
0.05 0.775 0.457 1.696
0.1 0.550 0.232 2.371
0.2 0.100 0.000 0.000
0.3 0.000 0.000 0.000
0.4 0.000 0.000 0.000
0.5 0.000 0.000 0.000
As shown in Table 1.2 both prd1 and pdr2 increase, when rLF decreases. The highest prd2 we
can achieve is 0.637, while the highest prd1 we can achieve is much bigger, 0.995. The
relationship between the gain and rLF is shown in Figure 1.6. This Figure shows two linear
regions. The first linear region is from rLF 0.01 till 0.05 failures per second, lower rLF region;
while the second linear region is from rLF 0.05 till 0.1 failures per second, higher rLF region.
The slope in the lower rLF region is low, while the slope in the higher rLF region is high. This
means that the achieved gain is higher in networks with higher rLF values (less reliable
networks), and the gain get bigger faster for higher rLF values. From the above results, we can
conclude that the need to use two routes instead of one route is more urgent for less reliable
networks, where the link failure rate is higher.
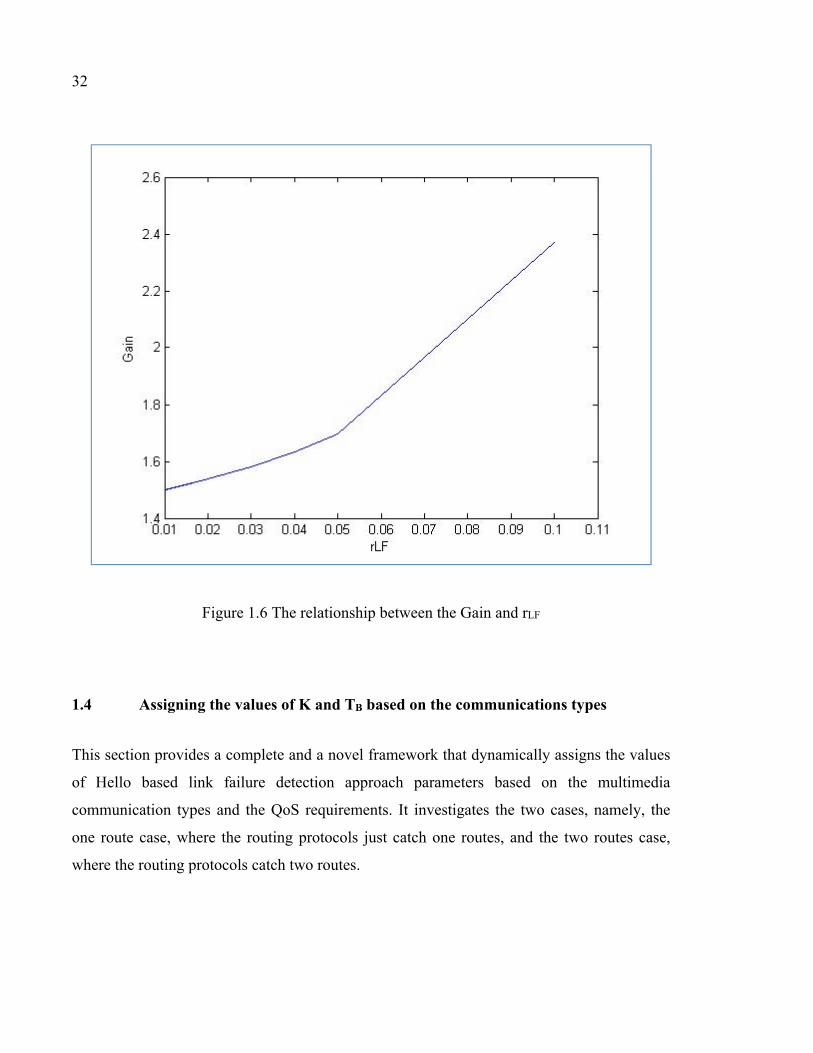
32
Figure 1.6 The relationship between the Gain and rLF
1.4 Assigning the values of K and TB based on the communications types
This section provides a complete and a novel framework that dynamically assigns the values
of Hello based link failure detection approach parameters based on the multimedia
communication types and the QoS requirements. It investigates the two cases, namely, the
one route case, where the routing protocols just catch one routes, and the two routes case,
where the routing protocols catch two routes.

33
1.4.1 Introduction
Wireless Mesh Networks and Mobile Ad-hoc Networks should have the ability to support
speech and video communications, because ordinary customers are more concerned in these
types of communications. Supporting speech and video communications over wireless media
is more challenging than supporting them in wired media, due to the erroneous nature of
wireless communications. The wireless MAC layer stander IEEE 802.11 ensures reliable data
communications by using retransmission techniques at the MAC layer, transport layer or
both. To increase frame transmission reliability, the current IEEE 802.11 standards retransmit
the frames up to 7 times for smaller frames, and up to 4 for bigger frames (Pandey et al.,
2007). After the retransmission counter reaches its maximum values without receiving an
Acknowledgement (ACK), IEEE 802.11 standard declares that the frame cannot be correctly
transmitted (Pandey et al., 2007), and in case of routing protocols that relay on the MAC
layer to maintain the communication link, like Dynamic Source Routing (DSR) protocol,
these routing protocols declare that the link has failed.
Multimedia communications have two main types, speech communications and video
communications. For speech communications, we have three types, which are toll, business
and low quality, while video communications have two types, which are interactive video,
like video conferencing, and streaming video, like YouTube or Netflix (Chakeres, Dong,
Belding-Royer, Gersho & Gibson, 2004). The speech and video quality mainly depend on
the percentage of the packet loss. Toll speech and interactive video can tolerate up to 1
percent of the packet loss, business speech 3 percent, while streaming video 5 percent, and
finally low can tolerate up to 10 percent (Chakeres et al., 2004) and (Szigeti & Hattingh,
2004). Voice encoders and decoders have a great impact on the acceptable packet loss
percentage by hiding some losses (Chakeres et al., 2004). However, they are beyond the
scope of this thesis. To be consistent with our previous work, the loss percentages shall be
converted to the equivalent pdr. This conversion can be easily done based on equation 1.5.
Table 1.3 shows the different multimedia communications types, packet loss percentage and
the equivalent pdr.

34
Table 1.3 Acceptable pdr for different multimedia communications types
Multimedia Communications Quality Acceptable Loss Equivalent pdr
Speech (Toll), Interactive Video 1 % 0.99
Speech (Business) 3% 0.97
Streaming Video 5% 0.95
Speech (Low) 10 % 0.90
In the following, we provide a complete and a novel framework which dynamically assigns
the proper values of K and TB parameters based on the multimedia QoS requirements, instead
of the traditional approach that assigns fix values of K and TB. For example, for speech
communications with Toll or Business quality that needs higher QoS requirements, we shall
assign smaller values for K and TB values; while we assign higher K and TB values for speech
communication with Low quality in order to save bandwidth and power. This framework can
be summarized as follows: the pdr values for different combinations of K and TB are
calculated based on equations 1.13 and 1.12 for the one route case and the two routes case,
respectively. The above pdr values along with the K and TB values are put in a table. Based
on that table, we pick up the pdr value which is not less than the required pdr, as shown in
Table 1.3, to ensure that the QoS requirement is satisfied. Finally, we assign the
corresponding K and TB values to the selected pdr as the Hello based link failure detection
scheme parameters. The following two subsections explain in detail how this framework
works, and what are the suitable values of K and TB parameters for the one route case and the
two routes case to satisfy the different multimedia communication types' requirements?
1.4.2 The one route case
The minimum required pdr2 value in order to support the lowest multimedia communication
quality over WMNs is equal to 0.9, as shown in Table 1.3. On the other hand, the highest pdr
for the one route case, i.e. pdr2, at PB = 0.7, K = 2, TB = 1 second, and rLF = 0.01 failures per
second is equal to 0.637, as shown in Table 1.2. Based on that, the highest pdr2 value in
35
Table 1.2 is lower than the lowest required pdr to support any type of multimedia
communications. This means that the one route case cannot support any type of multimedia
communications. We can increase pdr2 by choosing lower values of rLF, K and TB, and
higher PB values. When K equals to 1, TB is almost 0, rLF equals to 0, and PB equals 1, the
maximum pdr2 is obtained, which is equal to 0.7. This maximum value is still lower than the
minimum required pdr for any type of multimedia communications.
LLLA channel assignment protocol proposed in (Shojafar et al., 2015), which uses one route,
multi-channel and multi-radio, increases pdr2 in the traditional AODV routing protocol that
uses just one route. In the ideal case, where the link failure rate, rLF, is equal to 0, the
maximum achieved pdr in LLLA is equal to 0.77, which is still far away from the minimum
required pdr value to support multimedia communication types over WMNs. Thus, LLLA
channel assignment protocol cannot support any type of multimedia communications.
The maximum achieved pdr in the routing algorithm proposed in (Ahmadi et al., 2014) is
equal to 0.93. Therefore, it cannot support the superior multimedia communications types;
rather it can just support the lowest multimedia communications type that is speech with low
quality. However, the above routing protocol is not suitable for WMNs, because it assumes
constraints that are difficult to satisfy in WMNs. On the one hand, it assumes the existence of
k neighbor nodes around each node, i.e. very high node density is assumed. On the other
hand, it assumes the nodes are fixed, and there are no link failures, i.e. the ideal case is
assumed. Based on the above analysis, we can argue that we cannot support multimedia
communications over WMNs or MANETs by using just one route. The next subsection
investigates the two routes case.
1.4.3 The two routes case
The three main factors that affect the packet delivery ratio in the two routes case, i.e. pdr1,
are K, TB, and rLF, as shown in equation 1.12. Thus, to demonstrate how our framework
works, and how the values of K and TB change according to the QoS requirements and rLF
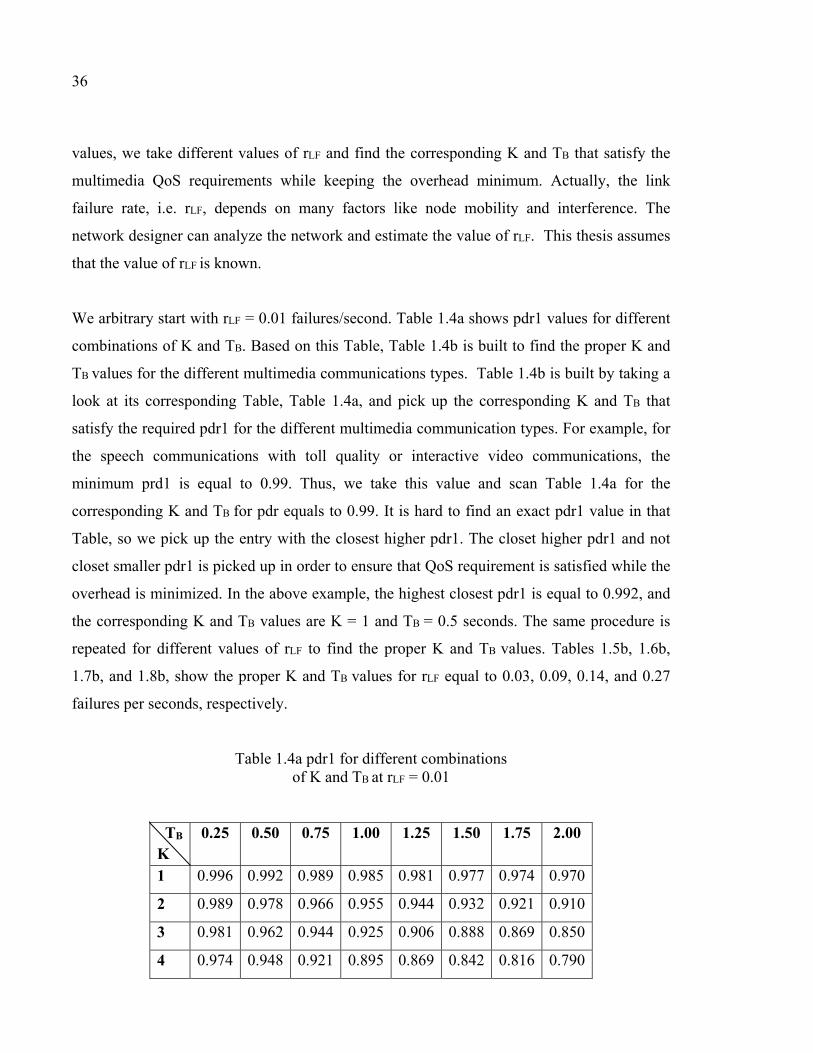
36
values, we take different values of rLF and find the corresponding K and TB that satisfy the
multimedia QoS requirements while keeping the overhead minimum. Actually, the link
failure rate, i.e. rLF, depends on many factors like node mobility and interference. The
network designer can analyze the network and estimate the value of rLF. This thesis assumes
that the value of rLF is known.
We arbitrary start with rLF = 0.01 failures/second. Table 1.4a shows pdr1 values for different
combinations of K and TB. Based on this Table, Table 1.4b is built to find the proper K and
TB values for the different multimedia communications types. Table 1.4b is built by taking a
look at its corresponding Table, Table 1.4a, and pick up the corresponding K and TB that
satisfy the required pdr1 for the different multimedia communication types. For example, for
the speech communications with toll quality or interactive video communications, the
minimum prd1 is equal to 0.99. Thus, we take this value and scan Table 1.4a for the
corresponding K and TB for pdr equals to 0.99. It is hard to find an exact pdr1 value in that
Table, so we pick up the entry with the closest higher pdr1. The closet higher pdr1 and not
closet smaller pdr1 is picked up in order to ensure that QoS requirement is satisfied while the
overhead is minimized. In the above example, the highest closest pdr1 is equal to 0.992, and
the corresponding K and TB values are K = 1 and TB = 0.5 seconds. The same procedure is
repeated for different values of rLF to find the proper K and TB values. Tables 1.5b, 1.6b,
1.7b, and 1.8b, show the proper K and TB values for rLF equal to 0.03, 0.09, 0.14, and 0.27
failures per seconds, respectively.
Table 1.4a pdr1 for different combinations of K and TB at rLF = 0.01
TB K
0.25 0.50 0.75 1.00 1.25 1.50 1.75 2.00
1 0.996 0.992 0.989 0.985 0.981 0.977 0.974 0.970
2 0.989 0.978 0.966 0.955 0.944 0.932 0.921 0.910
3 0.981 0.962 0.944 0.925 0.906 0.888 0.869 0.850
4 0.974 0.948 0.921 0.895 0.869 0.842 0.816 0.790
37
Table 1.4b The required K and TB values at rLF = 0.01
Multimedia Communications Quality pdr K TB
Speech (Toll) & Interactive Video 0.99 1 0.50
Speech (Business) 0.97 2 0.50
Streaming Video 0.95 2 or 3 1.00 (K=2) or 0.50 (k=3)
Speech (Low) 0.90 2 or 3 2.00 (K=2) or 1.25 (k=3)
Table 1.5a pdr1 for different combinations of K and TB at rLF = 0.03
TB K
0.25 0.50 0.75 1.00 1.25 1.50 1.75 2.00
1 0.989 0.978 0.966 0.955 0.944 0.932 0.921 0.910
2 0.966 0.932 0.899 0.865 0.831 0.798 0.764 0.730
3 0.944 0.888 0.831 0.775 0.719 0.663 0.606 0.550
4 0.921 0.843 0.764 0.685 0.606 0.528 0.449 0.370
Table 1.5b The required K and TB values at rLF = 0.03
Multimedia Communications Quality pdr K TB
Speech (Toll) & Interactive Video 0.99 n/a n/a
Speech (Business) 0.97 1 0.50
Streaming Video 0.95 1 or 2 1.00 (K=1) or 0.25 (k=2)
Speech (Low) 0.90 2 or 3 0.50 (K=2) or 0.25 (k=3)

38
Table 1.6a pdr1 for different combinations of K and TB at rLF = 0.09
TB K
0.25 0.50 0.75 1.00 1.25 1.50 1.75 2.00
1 0.966 0.932 0.898 0.940 0.831 0.798 0.764 0.730
2 0.898 0.798 0.696 0.595 0.494 0.392 0.291 0.190
3 0.831 0.662 0.494 0.325 0.156 0.000 0.000 0.000
4 0.764 0.528 0.291 0.055 0.000 0.000 0.000 0.000
Table 1.6b The required K and TB values at rLF = 0.09
Multimedia Communications Quality pdr K TB
Speech (Toll) & Interactive Video 0.99 n/a n/a
Speech (Business) 0.97 n/a n/a
Streaming Video 0.95 1 0.25
Speech (Low) 0.90 1 0.50
As shown in Table 1.5b, the speech communications with toll quality and interactive video
communications, the multimedia communications types with the highest QoS requirement,
cannot be supported when the rLF = 0.03 failures per seconds. This is because at this link
failure rate, the links often fail, which cause more packets to be lost before the routing
protocol detects these failures. Even at K =1, and very small TB value, the routing protocol
cannot handle all these failures to support the superior multimedia quality. However, the
lower three multimedia communication types, namely, speech communications with business
quality, streaming video, and speech communications with low quality, can be supported due
to the backup path, which is used upon recognizing link failures. If the link failure rate keeps
39
increasing, at some point we cannot support the lower multimedia communication types. At
rLF = 0.09 failures per second, the two upper communication types cannot be supported, as
shown in Table 1.6b. On the other hand, at rLF = 0.14 failures per second the upper 3
communication types cannot be supported as shown in Table 1.7b. This is because at very
high link failure rate, the two routes still cannot support the three highest communication
types, because even when the routing protocol recognizes a link failure and switch to the
backup route, after a while it will recognize another one and will keep on switching the route.
Base on that many packets are lost before the routing protocol recognizes the link failures
due to the link failure detection delay. For the same reason at rLF = 0.27 failures per second,
all multimedia communication types cannot be supported, as shown in Table 1.8b. The good
news is that these link failure rates are very high and rarely occurring in reality even in
MANETs with high mobility rate.
From the above analysis, we can conclude that WMNs and MANETs can support all
multimedia communication types in case the routing protocol catches two routes, and cannot
support any multimedia communication type if the routing protocol uses just one route. This
is an important and a novel conclusion that the network designers shall put in mind when
they design their networks that are intended to provide customers with multimedia
communication services.
Table 1.7a pdr1 for different combinations
of K and TB at rLF = 0.14
TB K
0.25 0.50 0.75 1.00 1.25 1.50 1.75 2.00
1 0.947 0.895 0.843 0.790 0.737 0.685 0.633 0.580
2 0.843 0.685 0.527 0.370 0.213 0.055 0.000 0.000
3 0.737 0.475 0.213 0.000 0.000 0.000 0.000 0.000
4 0.633 0.265 0.000 0.000 0.000 0.000 0.000 0.000
40
Table 1.7b The required K and TB values at rLF = 0.14
Multimedia Communications Quality pdr K TB
Speech (Toll) & Interactive Video 0.99 n/a n/a
Speech (Business) 0.97 n/a n/a
Streaming Video 0.95 1 0.25
Speech (Low) 0.90 1 0.50
Table 1.8a pdr1 for different combinations of K and TB at rLF = 0.27
TB K
0.25 0.50 0.75 1.00 1.25 1.50 1.75 2.00
1 0.899 0.797 0.696 0.595 0.494 0.393 0.291 0.190
2 0.696 0.393 0.089 0.000 0.000 0.000 0.000 0.000
3 0.494 0.000 0.000 0.000 0.000 0.000 0.000 0.000
4 0.291 0.000 0.000 0.000 0.000 0.000 0.000 0.000
Table 1.8b The required K and TB values at rLF = 0.27
Multimedia Communications Quality pdr K TB
Speech (Toll) & Interactive Video 0.99 n/a n/a
Speech (Business) 0.97 n/a n/a
Streaming Video 0.95 n/a n/a
Speech (Low) 0.90 n/a n/a
41
1.5 A novel enhanced Hello based link failure detection approach
To enhance the performance of the traditional Hello based link failure detection approach, we
propose a novel link failure detection approach. This approach has two modes. The first
mode has the potential to stabilize the routing protocols by decreasing unnecessary route
changes, while the second mode has the potential to decrease the link failure detection delay
and in turn increase the packet delivery ratio.
1.5.1 The proposed algorithm
As we said before, contention, congestion and link failures cause packet losses in MANETs
and WMNs. Thus, not all packets losses are due to link failures, and that is why a link failure
is declared after several missing Hellos and not after the first missing one, as in the wired
networks. Unstable links, which cause fluctuating in the network topology, are the result of
decreasing the value of K and TB, due to an unnecessary route change, because of the
misinterpretation of the frames losses as link failures. Decreasing the period of Hello beacons
decreases the detection delay and in turn increases the packet delivery ratio on one hand, and
increases the communication overhead on the other hand, because in this case more
bandwidth is used for the Hello beaconing. Thus, we should carefully choose the K and TB
values in order to balance between overhead and performance. In the following paragraphs,
we propose a novel protocol that that enhances the Hello based link failure detection
approach performance with negligible overhead.
Our protocol has two modes of operations. The first mode works as follows: When a node
does not receive the last Hello beacon, that node sends a probe packet to the corresponding
node, and waits for an ACK, before it declares that the link is down. If no ACK is received,
after waiting for a certain period of time, that is greater than round trip time, and less than the
Hello interval, it declares that the link has failed. On the other hand, if the ACK is received,
the node considers the link up. In order to overcome the congestion, buffering in the
42
incoming queue, we mark this prop packet with the highest priority. In this way, we virtually
increase the K value by 1 with negligible overhead, which in turn leads to reduce the false
detected failures, and increase the packet delivery ratio. Increasing the K parameter stabilizes
the routing protocols by decreasing unnecessary route changes. As it is known, finding a new
route in MANETs and WMNs consumes a huge bandwidth, and requires a considerable time
to find that route. Thus, increasing the K value by 1 greatly enhances the performance of data
communications by decreasing the packet delay and by saving bandwidth. This mode can
also improve the transport layer performance. When the routing protocol finds another route
instead of the failed route, the two routes do not necessarily have the same lengths, and this
can affect the transport layer protocol by receiving unordered packets.
For networks, where their main concern is higher packet delivery ratio, like speech
communications, we propose the second mode. In this mode, the probe packet is sent in case
we do not receive two successive Hello beacons in case K = 3. In this way, we virtually
decrease the K value by 1, while the failure detection scheme still works with the same K
value. As we explain earlier, when the K value is decreased, the failure detection delay is
reduced, and in turn the packet delivery ratio is increased. We recommend the use of the this
mode for communication types that need higher QoS requirements, like speech
communications with toll quality; while we recommend the use of the first mode with
communication types that need lower values of packet delivery ratio, like streaming video
and speech communications with low quality. The following algorithm shows in details how
our proposed protocol works.
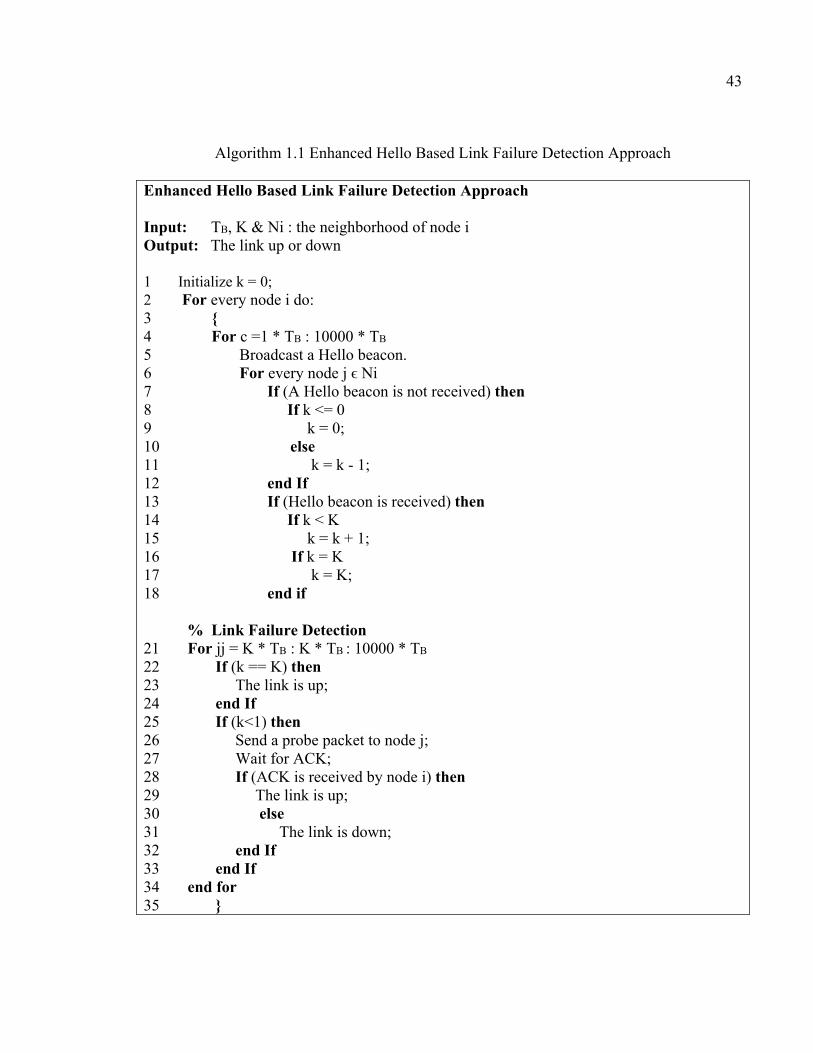
43
Algorithm 1.1 Enhanced Hello Based Link Failure Detection Approach
Enhanced Hello Based Link Failure Detection Approach Input: TB, K & Ni : the neighborhood of node i Output: The link up or down 1 Initialize k = 0; 2 For every node i do: 3 4 For c =1 * TB : 10000 * TB 5 Broadcast a Hello beacon. 6 For every node j ϵ Ni 7 If (A Hello beacon is not received) then 8 If k <= 0 9 k = 0; 10 else 11 k = k - 1; 12 end If 13 If (Hello beacon is received) then 14 If k < K 15 k = k + 1; 16 If k = K 17 k = K; 18 end if % Link Failure Detection 21 For jj = K * TB : K * TB : 10000 * TB
22 If (k == K) then 23 The link is up; 24 end If 25 If (k<1) then 26 Send a probe packet to node j; 27 Wait for ACK; 28 If (ACK is received by node i) then 29 The link is up; 30 else 31 The link is down; 32 end If 33 end If 34 end for 35

44
1.5.2 Evaluation
The Hello loss probability shall initially be found in order to quantify the reduced false link
failure detection in the first mode. pB can be estimated by numbering the Hellos with
sequence numbers (Chen, Toueg & Aguilera, 2002). Thus, during a period of time, we can
estimate pB by dividing the number of the received Hellos over the highest Hellos' sequence
number (Chen et al., 2002). The probability that the link is considered as a failed link is
equal to the probability that we do not receive any Hello during the failure detection period,
i.e. K * TB. Assume the Hello losses are independent events, then the probability that a link
will be considered as a failed link (Pdown) is equal (1 - pB)K . If we virtually increase K by 1,
Pdown will be equal to (1 - pB)(K+1). In this case, the false link failure detection ratio is reduced
by (1 - PB), as shown in the following equation:
R = 1 − p (1.15)
Where:
Rfd : the reduction in the false link failure detection ratio.
pB : the probability of receiving a Hello beacon successfully.
The objective in the second mode is to increase the packet delivery ratio by virtually
decreasing the K value by 1. For the two routes case, the achieved increase in pdr1 (gainpdr1)
is equal to pdr1 with K = K - 1 over pdr1 with K = K. Equation 1.16 determines gainpdr1.
Gain = 1 − (2K − 3)T Lr21 − (2K − 1)T Lr2
(1.16)
Figure 1.7 shows that there is an approximately linear relationship between Gainpdr1 and the
link failure rate. In other words, the improvement in pdr1 (Gainpdr1) is better with higher link
failure rates.
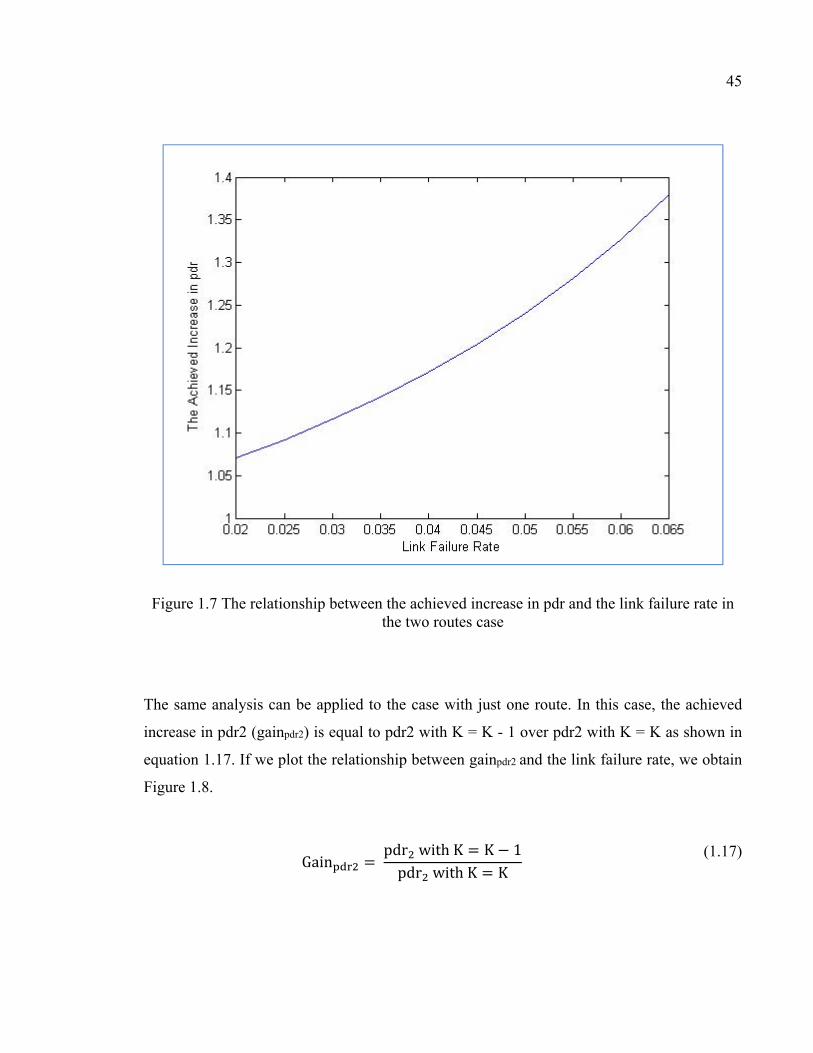
45
Figure 1.7 The relationship between the achieved increase in pdr and the link failure rate in the two routes case
The same analysis can be applied to the case with just one route. In this case, the achieved
increase in pdr2 (gainpdr2) is equal to pdr2 with K = K - 1 over pdr2 with K = K as shown in
equation 1.17. If we plot the relationship between gainpdr2 and the link failure rate, we obtain
Figure 1.8.
Gain = pdr withK = K − 1pdr withK = K
(1.17)
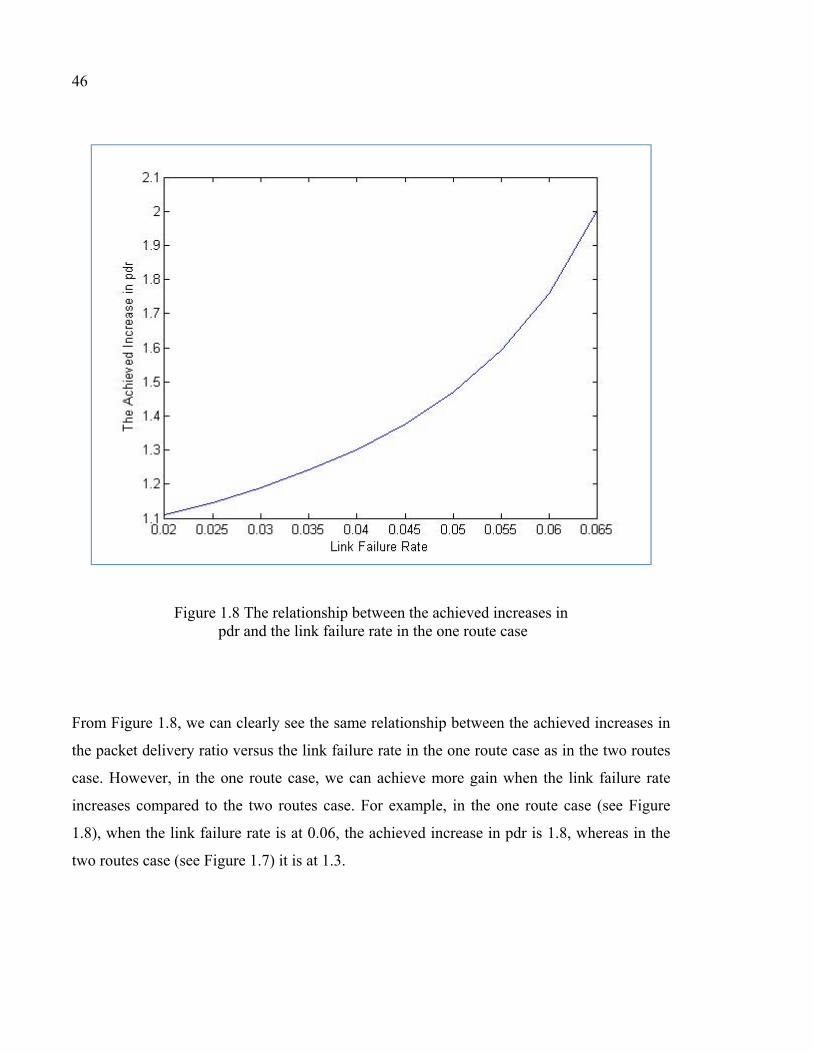
46
Figure 1.8 The relationship between the achieved increases in pdr and the link failure rate in the one route case
From Figure 1.8, we can clearly see the same relationship between the achieved increases in
the packet delivery ratio versus the link failure rate in the one route case as in the two routes
case. However, in the one route case, we can achieve more gain when the link failure rate
increases compared to the two routes case. For example, in the one route case (see Figure
1.8), when the link failure rate is at 0.06, the achieved increase in pdr is 1.8, whereas in the
two routes case (see Figure 1.7) it is at 1.3.
47
1.6 Proposed solutions to network recovery
The network recovers from link failures at the MAC layer, routing layer or both. Initial
resource allocation, greedy channel assignments, fault-tolerant routing protocol, Interference
Aware Channel Assignment (IACA), and Autonomous Reconfiguration System (ARS) are
the techniques used for link recovery in MANETs and WMNs.
1.6.1 Initial resource allocation method
Initial resource allocation method provides theoretical guidelines for initial network resource
planning. It is a comprehensive and optimal network configuration plan. This plan often
requires global configuration changes, which are undesired in case of frequent local link
failures as it is the case in MANETs and WMNs. (Alicherry, Bhati & Li, 2005) propose joint
channel assignment method for link recovery, which is a hybrid approach of channel
assignment and routing based in some concepts in mathematics. It considers interference,
channel availability, and based in them, they find an optimal network configuration.
Experimental results demonstrated the effectiveness of this approach.
The drawback of this approach is that the global configuration requires the recovery from the
link failures. Based on this approach, every time a link fails, the network needs to find an
optimal reconfiguration based overall network setting. This consumes a lot of time and
resources, and interrupts the communications until the network finds an optimal solution.
Thus, we do not need to do a global configuration, every time a failure occurs.
1.6.2 Greedy channel assignment method
(Raniwala & Chiueh, 2005) proposed greedy channel assignment method to eliminate the
global configuration drawback in the initial resource allocation method. Greedy channel
assignment method changes only the setting of faulty links to recover them. Since this
method changes only the setting of faulty links, it may not be able to achieve full

48
improvement, which can be only achieved by considering the configurations of neighbor
nodes as well as the faulty links (Kim & Shin, 2011). Another drawback of this method is the
ripple effect associated with it, where one local change triggers the changes of additional
network setting at neighboring nodes (Kim & Shin, 2011). One solution to the ripple effect
drawback is the transforming the mesh typology into a tree topology at the expense of
reducing network connectivity and path diversity (Kim & Shin, 2011).
1.6.3 Interference aware channel assignments
Interference Aware Channel Assignments protocol (IACA) tries to solve the problem of
interference in multi-radio mesh networks. IACA minimizes the interference between a
mesh network and other wireless networks in a specific region by wisely assigning the
channels to radios (Ramakrishnan, Sankar Ram & Alheyasat, 2012). It implements in all
mesh nodes an interference estimation scheme which estimates the nodes interference.
IACA can only improve the overall capacity by using additional channels, and it does not
consider other aspects besides channel assignments like link associations and local traffic
information (Ramakrishnan et al., 2012).
1.6.4 Autonomous reconfiguration system
(Kim & Shin, 2011) propose a new recovery system for wireless mesh networks that is
Autonomous Reconfiguration System (ARS). ARS is a powerful cross-layer technique which
benefits from channel and radio diversities in WMNs. This system overcomes the major
drawbacks in greedy channel assignment and resource–allocation algorithms. While
recourse–allocation algorithms reconfigure the whole network setting to overcome a link
failure, greedy channel assignment just changes the faulty link setting. ARS comes in the
middle between these two approaches by changing the faulty link setting, and the setting of
the neighborhood to achieve better improvement without changing the whole network
setting. Based on changes in radios, paths and channels, ARS generates a set of plans to

49
overcome link failures. Among this set, ARS chooses one plan which maximizes network
throughput and satisfy some of the QoS constrains. Compared to other types of recovery
systems, ARS greatly improves the performance of WMNs (Kim & Shin, 2011).
ARS preserves network performance by enabling a multi-radio WMN to autonomously
recover from local link failures (Kim & Shin, 2011). Based on channel, radio and route
diversities in WMNs, ARS generates the necessary changes to recover link failures (Kim &
Shin, 2011). After that, the system cooperatively reconfigures network settings among local
mesh routers according to the generated changes. Even though ARS is a powerful network
recovery scheme, it still has some drawbacks. The first drawback is that ARS is not a cost-
aware scheme, which means it gives the channel switch, radio switch and detour path the
same weight. The second drawback is that ARS considers only the channel related failures,
and does not deal with other types of failures. (Ramakrishnan et al., 2012) propose Enhanced
Reconfiguration System (ERS), based on ARS, to make ARS a cost aware scheme.
ARS is a distributed system that runs in every mesh node. It is easily implemented in IEEE
802.11 based multi-radio WMNs. ARS has the following features:
• Localized reconfiguration: in contrast to initial resource allocation method which
recovers a link failure by changing the whole network setting, and greedy channel
method which just changes the faulty link setting, ARS recovers from links failures by
changing the setting of mesh nodes in the vicinity, where the link failures occurred, while
keeping the setting in remote areas without touch. ARS makes these changes based on
multiple channels and radios available;
• QoS-aware planning: the main objective of ARS is the faulty link recovery, but at the
same time, it tries to satisfy the QoS requirements as much as possible;
• Autonomous reconfiguration via link-quality monitoring: ARS measures the quality
of links of each node to detect link failures. After that, it generates feasible plans that
recover from the detected failures;
• Cross-layer approach: ARS use both the network and MAC layer information for
network recovery and planning.

50
ARS works as follows: each node continuously monitors the link quality, and sends the
results to a gateway. In case a node detects a link failure, this node triggers the formation of a
group among local mesh routers that use the faulty channel. Among the group members, one
member is elected as a leader, and this leader sends a planning request message to the
gateway. Upon the receipt of a planning request, the gateway generates a reconfiguration
plan, and sends it to all group members. Finally, once the members receive the plan, they
execute the configuration changes in that plan.
ARS consists of three steps as shown in Figure 1.9. The first step generates feasible plans.
Subsequently, the other steps initiate QoS test and optimal plan selection. A feasible plan is a
set of configuration changes for a network to recover from link failures on a channel. These
changes include channel switch, link association and detour path. As we said before, ARS
generates these plans based on the configuration around the vicinity of the faulty link.
Figure 1.9 ARS steps Taken from Kim & Shin (2011, p. 396)
At first, ARS finds reconfiguration plans that recover the failed links by applying the
connectivity and link-failure constraints. These plans may include changes in channels, links,
and routes around the faulty link. After that, it applies QoS constrains and network utilization
constrains within the reconfiguration plans to identify the one that satisfies the QoS
requirements. To see if a feasible plan passes the QoS test, ARS has to estimate per-link
51
bandwidth by measuring each link’s capacity and its available channel airtime. ARS
passively monitors the transmissions of data or sends probing packets in order to measure
packet delivery ratio and data transmission rate to estimate links capacities (Kim & Shin,
2011). Finally, it chooses the best plan that best satisfies the QoS requirements, and
maximizes the channel utilization.
To avoid the ripple effect occurs in the greedy channel assignment technique, ARS generates
feasible changes, and then combines some of these changes in order to preserve the network
connectivity. After ARS ensures the network is connected, it maximizes the network
utilization by avoiding the use of the same channel among radios in the same node, and
making each radio associates itself with at least one link (Kim & Shin, 2011). ARS tries to
limit the network changes as much as possible. On the other hand, it needs to find a locally
optimal solution by considering more network changes. ARS controls the scope of
reconfiguration changes by using a k-hop reconfiguration parameter, which is the number of
hops from the faulty link, in order to trade off between locality and optimality. Thus, ARS
starts from the faulty link (i.e. k=1) and generates feasible plans, then it increases the k value
by 1 in case it cannot find a local optimal solution, and generates another feasible plans. The
same steps are repeated until a local optimal solution is found.
ARS has been implemented and evaluated extensively on an IEEE 802.11-based WMN test-
bed in a Linux OS, as well as through ns2-based simulation (Kim & Shin, 2011).
Throughout the simulation, a grid topology with 25 nodes in an area of 1 km2 was used.
Adjacent nodes were separated by 180 m, each node was equipped with a number of radios
depending on its proximity to the gateway, and the gateway was located at the centre. The
gateway was equipped with four radios, one-hop away nodes from a gateway with three
radios, and other nodes with two radios. The above experiment and simulation results
showed that compared to local rerouting scheme, ARS improved network throughput and
channel efficiency (the ratio of the number of successfully delivered data packets to the
number of total MAC frame transmissions) by more than 26% and 92%, respectively. They
also showed that the chance to meet the varying QoS demands was increased in ARS by
52
200% on average and up to three times compared to static-assignment algorithms, and for re-
routing it depended on the path the data followed. Note that the ability of ARS to satisfy the
QoS requirements came from discovering and using the idle channels.
ARS takes 15 seconds to recover from link failures (Kim & Shin, 2011). Within this delay,
actual channel switch delay is less than 3 msec, which causes negligible flow disruption,
while the radio switch and detour path take a lot more time (Ramakrishnan et al., 2012). This
fact highlights one of the ARS weaknesses that it is not a cost-aware reconfiguration scheme.
To overcome the above weaknesses, we shall give channel switch less weight compared to
radio switch and detour path. (Ramakrishnan et al., 2012) notices this weakness, and
proposes Enhanced Reconfiguration System (ERS) that is cost aware. The following
subsection introduces ERS.
1.6.5 Enhanced reconfiguration system
Enhanced Reconfiguration System (ERS) is a cost aware reconfiguration technique for
network recovery based on ARS. As in ARS, ERS considers local channels, radio and routes
switch to recover from local link failures. While ARS chooses the best plan that maximizes
channel utilization, ERS chooses the best plan that minimizes the cost associated with the
reconfiguration plan. ERS is used in multi radio wireless mesh networks, and it is running in
every mesh node within the network. By traversing all possible channels, links and route
changes around the faulty link, and by considering the given connectivity and link failure
constraints, ERS generates a set of feasible plans. After that, the QoS and network utilization
constraints are applied to identify a reconfiguration plan that satisfies the QoS requirements
and improves overall network utilization (Ramakrishnan et al., 2012). Finally, the total
reconfiguration cost incurred with each plan generated is computed and the best plan is
chosen based on the minimum cost and the highest utilization.
As in ARS, the first step in ERS algorithm is the feasible plan generation. Figure 1.10 shows
how the feasible plan generation step works. In summary, this step works as follows: ERS
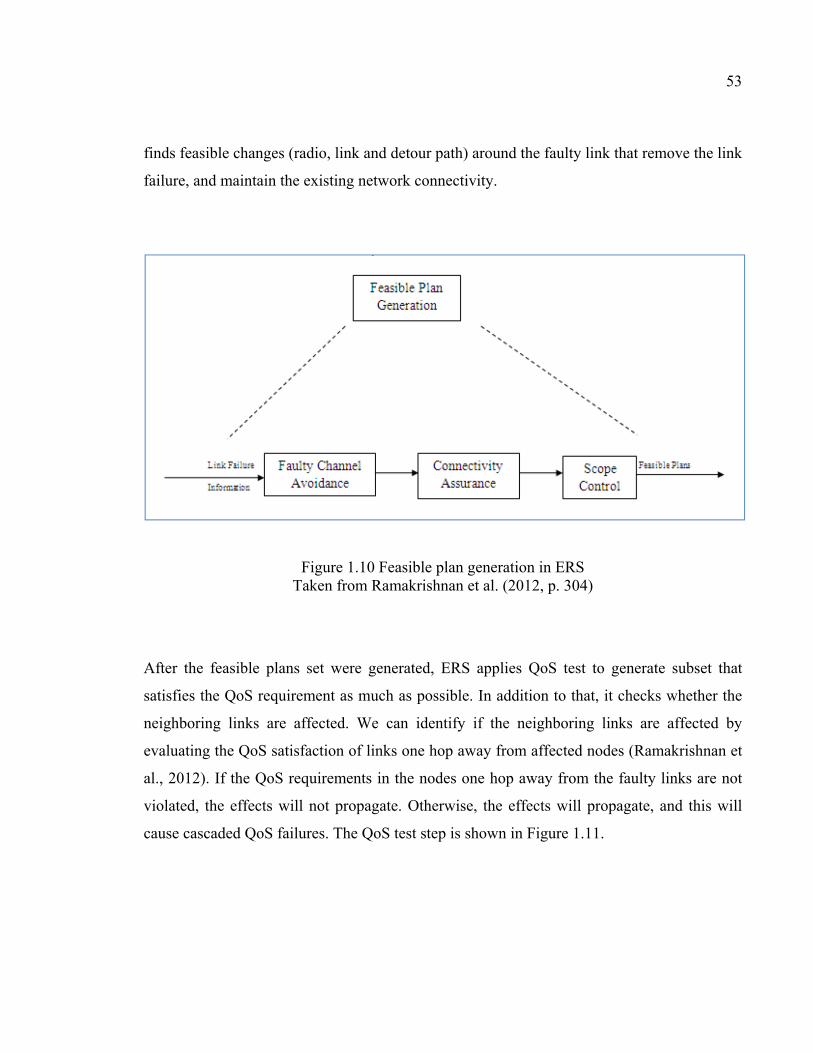
53
finds feasible changes (radio, link and detour path) around the faulty link that remove the link
failure, and maintain the existing network connectivity.
Figure 1.10 Feasible plan generation in ERS Taken from Ramakrishnan et al. (2012, p. 304)
After the feasible plans set were generated, ERS applies QoS test to generate subset that
satisfies the QoS requirement as much as possible. In addition to that, it checks whether the
neighboring links are affected. We can identify if the neighboring links are affected by
evaluating the QoS satisfaction of links one hop away from affected nodes (Ramakrishnan et
al., 2012). If the QoS requirements in the nodes one hop away from the faulty links are not
violated, the effects will not propagate. Otherwise, the effects will propagate, and this will
cause cascaded QoS failures. The QoS test step is shown in Figure 1.11.
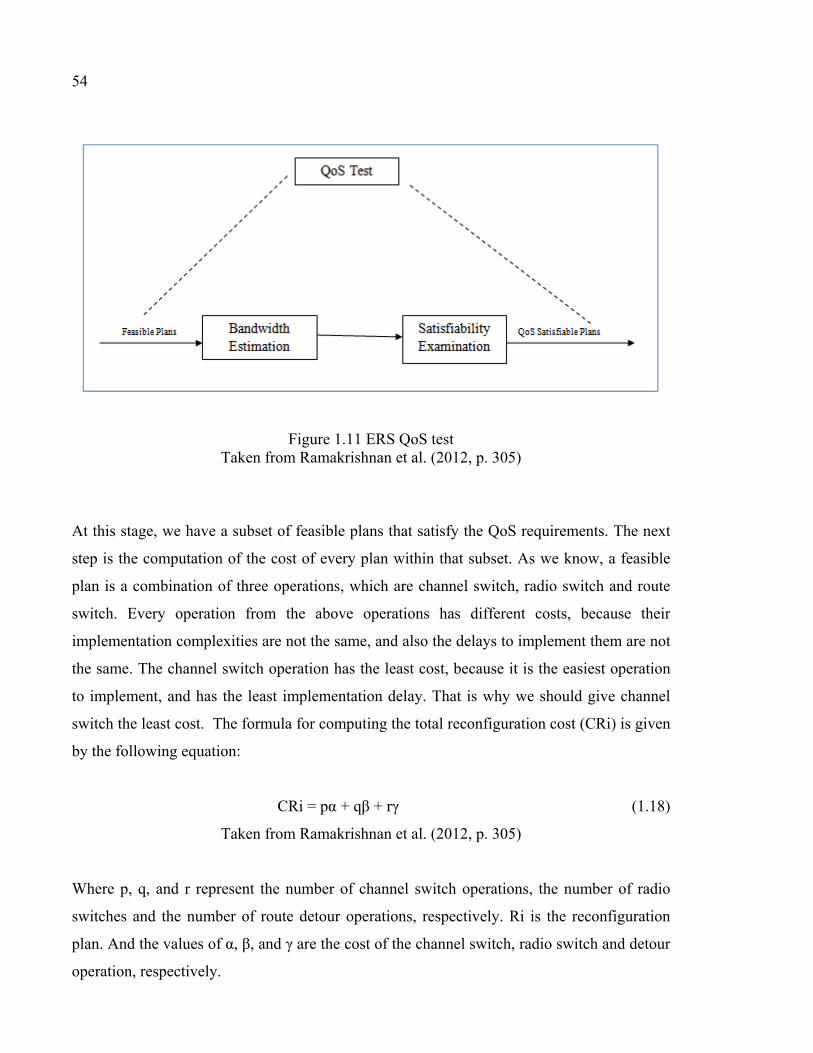
54
Figure 1.11 ERS QoS test Taken from Ramakrishnan et al. (2012, p. 305)
At this stage, we have a subset of feasible plans that satisfy the QoS requirements. The next
step is the computation of the cost of every plan within that subset. As we know, a feasible
plan is a combination of three operations, which are channel switch, radio switch and route
switch. Every operation from the above operations has different costs, because their
implementation complexities are not the same, and also the delays to implement them are not
the same. The channel switch operation has the least cost, because it is the easiest operation
to implement, and has the least implementation delay. That is why we should give channel
switch the least cost. The formula for computing the total reconfiguration cost (CRi) is given
by the following equation:
CRi = pα + qβ + rγ (1.18)
Taken from Ramakrishnan et al. (2012, p. 305)
Where p, q, and r represent the number of channel switch operations, the number of radio
switches and the number of route detour operations, respectively. Ri is the reconfiguration
plan. And the values of α, β, and γ are the cost of the channel switch, radio switch and detour
operation, respectively.
55
Finally, the plan that maximizes the utilization and at the same time minimizes the
reconfiguration cost is chosen as the best plan. That is why a new parameter η, where η is the
ratio of the utilization and the cost, is introduced. The best plan in ERS is the one that has
the maximum η. It is important to mention that both ARS and ERS consider link bandwidth
as the sole QoS parameter. Thus, one way to enhance these systems is to consider other QoS
parameters like delay and jitter. Another direction for future research is the joint optimization
with flow assignment and routing (Kim & Shin, 2011).
1.6.6 Fault tolerant routing protocols
Routing protocols are very important protocols for network recovery. In case of link failures,
the routing protocol shall find an alternate path instead of the faulty path. Multi-path routing,
local rerouting and redundant transmissions are the main techniques used at the routing layer
level to make the routing protocols fault tolerant. This thesis relies on the fault tolerant
routing technique. It specifically relies on the backup route recovery technique. The reason
behind the above selection is that the above technique is the most reliable network recovery
technique and it can support multimedia communications, as proved earlier. Another reason
is that the other network recover techniques usually rely on the redundant channels or radios,
which is not the case in MANETs where the nodes are mostly equipped with one channel and
one radio.

CHAPTER 2
RELIABLE ROUTING
2.1 Introduction
One of the MANETs big challenges is the frequent link failures, which reduces the network
connectivity and reliability, and complicates the routing process. One solution to handle these
failures is to use multi-route instead of the traditional use of one route. The use of multi-route
can virtually decrease the packet loss to zero, and can support multimedia communications
over MANETs and WMNs. Thus, one issue that shall be considered when designing
MANETS is the ensuring of the existence of at least two routes between any randomly
chosen pair of nodes. This depends on the network node density. As such, node density must
be above a certain threshold in order to ensure the existence of two routes.
Ensuring a completely stable route in MANETs is an unachievable task (Moussaoui &
Boukeream, 2015). In addition to that, a MANET routing protocol which catches just one
route cannot support multimedia communications, as it was shown in the first chapter. Thus,
the implementation of routing protocols that catch multi-route is required for reliable and
stable communications, and supporting multimedia communications. Another technique that
can be used to increase the network reliability is the selection of the most stable paths among
the available paths (Moussaoui, Semchedine & Boukerrama, 2014) and (Moussaoui,
Semchedine & Boukerrama, 2014). Based on the above analysis, the only ways to provide
reliable and stable communications, and to support multimedia communications in MANETs
are to use multi-route instead of one, and to let the routing protocol select the most stable
routes among the available routes.
Routing protocols is a complex task in MANETs and WMNs due to the unpredictable nodes'
movements that cause the frequent link failures. Thus, the routing protocols shall be fault
tolerant in order to deal with the frequent link failures. To virtually decrease the packet loss
to zero, and support multimedia communications over MANETs, two routes must be used,
58
one as the main route, and the other one as a backup route, which is used once the main route
fails (Hayajna & Kadoch, 2016) and (Hayajna & Kadoch, 2017b). In case a route failure
happens, the routing protocol must immediately switch to the backup route, and start
searching for another route, in order to ensure it has always two routes available (Hayajna &
Kadoch, 2016) and (Hayajna & Kadoch, 2017b).
2.2 Related work
In general, MANETs routing protocols can be classified into two categories, namely,
topology-based and position-based routing protocols (Mauve, Widmer & Hartenstein, 2001).
Topology-based routing protocols include proactive, reactive and hybrid routing protocols.
The information regarding the links between nodes is used to build routes between the source
and the destination nodes in the topology-based routing protocols. On the other hand,
additional information is required in position-based routing protocols to build the routes. This
information is geographical position of a packet’s destination, its own position, and the
position of its neighbors. Usually, Global Position System (GPS) is used by the nodes to
determine their positions; while one hop broadcasts, like Hello beacons, are used to
determine the neighbors' positions. The destination position must be known by the source
node, which includes it in the packets headers. One of the location services techniques is
used by the source node to obtain the destination position. However, location service
techniques are beyond the scope of this thesis. One advantage of position-based routing
protocols over topology-based routing protocols is that position-based routing protocols have
the ability to transmit the packets to all nodes in a specified geographic region, i.e.
Geocasting (Mauve et al., 2001).
Greedy packet forwarding, restricted directional flooding and hierarchical routing are the
three kinds of position-based routing protocols. Greedy packet forwarding strategy is the
most used protocol due to its simplicity. Packets in greedy forwarding are forwarded to only
one neighbor in the direction of the destination, whereas in restricted directional flooding, the
59
packets are flooded to all neighbors in the direction of the destination (Mauve et al., 2001).
In case a position-based routing protocol fails to find a neighbor node in the direction of the
destination, a recovery technique is used to complete the routing process. Recovery
techniques are usually more complex than both greedy forwarding and restricted directional
flooding protocols. Some form of hierarchy is used in hierarchical routing protocols in order
to reduce the routing complexity and make the network more scalable.
One may ask this question, is it better to use position-based routing protocols or topology-
based routing protocols in MANETs and WMNs? The answer to this question is that it is
better to use position-based routing protocols in MANETs and WMNs due to many reasons,
as illustrated below. Some of the limitations of topology-based routing protocols are
eliminated by using the locations of the neighbors and the destination (Mauve et al., 2001).
Position-based routing protocols eliminate the need of expensive route request beacons to
build routes, broadcasting beacons to keep routing tables fresh, and the worry about routes
failures. In position-based routing, there are no static routes, and the nodes route the packets
by hop basis (Cadger, Curran, Santos & Moffett, 2013). This means that the need to construct
routes from the source node to destination node is eliminated. At the beginning of the routing
process in position-based routing protocols, the source node obtains the destination location
by using one of the locations services techniques, and includes this information in the
packets' headers. After that, the source node and the forwarding nodes route the packets
based on the locations of the neighbors and the destination, in other words, based on a
specified geographic criterion. Thus, the route establishment and maintenance are not
necessary. Based on that, the nodes' storage space and power are minimized. Another
advantage of position-based routing protocols over topology-based routing protocols is that
the packets can be simultaneously transmitted to all nodes in a certain region in position
based routing protocols. Because of all of the above advantages of position-based routing
protocols over topology-based routing protocols, dynamic behaviour of MANET can be
handled better in position-based routing protocols (Cadger et al., 2013).
60
Different strategies have been proposed to greedy forward the packets, which are Most
Forward within R (MFR), Nearest with Forward Progress (NFP), compass routing, random
forwarding, Least Remaining Distance (LRD), and Maximum Hop Distance (MHD). The
following paragraphs explain all these strategies.
MFR was originally proposed in (Takagi & Kleinrock, 1984) as a tool to find the optimal
transmission range, which maximizes the probability of the expected progress and the
probability of successful packet transmissions in the random wireless networks, where the
nodes are uniformly distributed in the network area. According to MFR, the Source node (S)
or the forwarding node chooses a neighbor node that lies inside a half circle with a radius
equal the transmission range, centred at the source node that has the maximum progress
towards the Destination node (D). Maximum progress means here the maximum distance
between S and the projection of the forwarding node into a line connecting S and D, i.e.
maximum X, see Figure 2.1. In case the source node itself has the maximum progress
towards D, MFR will choose a node from all nodes within its transmission range, which has
the least backward progress. The objective of MFR is to reduce the hop count between S and
D (Mauve et al., 2001). The drawbacks of MFR are twofold, the transmission to a node that
has the least backward progress may create loops, and the remaining distance towards D may
not be minimized in MFR (De, 2005) and (Younes & Thomas, 2011). Interestingly, later
MFR used as a potential greedy forwarding strategy, especially for randomly distributed
networks where the nodes cannot adjust their transmission power according to the distance to
the receiver (Mauve et al., 2001). Like other greedy forwarding strategies, MFR should
convert to face routing in order to accomplish the routing process, in case there is no
neighbor in a half-circular area in the direction of D.

61
Figure 2.1 MFR greedy forwarding strategy
The source node or the forwarding node in NFP forwards the packets to a neighbor node
which is closest to itself in the direction of the destination. NFP outperform MFR, in case the
nodes can adapt their transmissions power to the distance to the receiver, and have high loads
(Mauve et al., 2001) and (Hou & Li, 1986). This is due to the fact that, when the sender node
just uses enough power to reach the receiver, the interference is reduced, and in turn, the
collisions are reduced. Even though the packet travels longer distance per hop towards the
destination in MFR, NFP has higher average progress, when the collision probability is

62
considered. The average progress is equal to p ∗ f(T, R), where p is the probability of
successful transmission, and f(T, R) is the distance travelled by the packets from the
transmitter to the receiver (Mauve et al., 2001).
In compass routing, the neighbor, which is closest to the straight line between the sender and
the destination, is selected as the relay node to forward the packets. The goal behind this
selection criterion is to reduce the packets spatial distribution. Another greedy forwarding
strategy is random forwarding which is used to minimize the required accuracy about the
neighbors' positions, and to reduce the complexity of the forwarding strategy (Mauve et al.,
2001). The source node or the forwarding node in random forwarding strategy forwards the
packets to any neighbor in the direction of destination, which is closer to the destination than
the node itself.
Least Remaining Distance (LRD) forwarding strategy was proposed in (De, 2005) and (De,
Caruso, Chaira & Chessa, 2006) to estimate the hop count for MANETs where the nodes are
uniformly distributed in the network area. The packets in LRD are forwarded to a neighbor
node which has the least remaining Euclidean distance to the destination. By using the above
selection criterion, LRD forwarding strategy overcomes one of MFR forwarding strategy
drawbacks by ensuring the chosen forwarding node has the minimum distance to the
destination. The last forwarding strategy is Maximum Hop Distance (MHD), which is
proposed in (Younes & Thomas, 2011) as a tool to estimate the hop count for a MANET
where the nodes are non-uniformly distributed in the network area. The source node in MHD
selects a neighbor node located in the direction of the destination which has the maximum
per hop progress. Even though it makes sense to choose a neighbor which has the maximum
per hop progress, this does not guarantee that such a neighbor node has the minimum
distance to the destination, or it will reduce the hop count. Later in this thesis, we show that
that the chosen path from the source node and the destination node in LRD forwarding
strategy is shorter than the chosen path in MHD forwarding strategy. This means the
selection criterion in LRD forwarding strategy is better than the selection criterion in LRD
forwarding strategy is terms of reducing the hop count.
63
Usually, the expected forwarding region in all greedy forwarding strategies is a half-circular
area, centred at the forwarding nodes with radius equals to the transmission range, in the
direction of the destination. In this thesis, we propose a novel Adaptive Greedy Forwarding
Strategy. Unlike other kinds of greedy forwarding strategies, our strategy adapts the expected
forwarding region to the node density to find the optimum area in order to reduce the hop
count, reduce network nodes spatial distribution, and minimize the switching from the simple
greedy forwarding strategy to the complex and costly face routing. To the best of our
knowledge, this is the first work that provides a complete mathematical framework to
determine the optimum angle based on node density which specifies the circular sector area
in order to ensure the existence of one route or multi-route between any randomly chosen
pair of nodes.
(Ahmadi, Shojafar, Hajeforosh, Dehghan & Singhal, 2014) proposed a novel routing protocol
for WSNs to preserve k-coverage and data reliability with the least energy consumption. k-
coverage refers to the number of nodes that cover an area. In the above routing protocol, all
sensor nodes are assumed fixed and are aware of their locations, residual energies, and
neighbors' positions and residual energies. It consists of three phases that are phase 1:
collection and processing of the required information, phase 2: creation of coverage clusters
for the selected targets and the selection of the cluster heads, and phase 3: the selection of
active transmitting nodes. To preserve the k-coverage and minimize energy consumption, k
nodes are set as active nodes, and the remaining nodes as idle nodes in each cluster.
The above routing protocol forwards the packets based on hop by hop basis, and it works as
follows: Each forwarding node checks its neighbor distances to the sink node. If it finds a
neighbor node whose distance to the sink node is less than the forwarding node itself distance
to the sink node, it selects this node as the next hop node. In case the forwarding node
cannot find such node, it uses a communicative fitness function as the selection criterion to
select the next hop node. The neighbors' distances to the sink node, their residual energies
and distances to the forwarding node determine the next hop in the above fitness function.

64
The neighbor node which has the maximum residual energy, closest to the sink node and
farthest from the forwarding node is selected as the next hop.
An energy-efficient direction based (PDORP) routing protocol for WSNs was proposed in
(Brar et al., 2016). PDORP stands for PEGASIS-DSR Optimized Routing Protocol. The
above routing protocol makes the Dynamic Source Routing (DSR) protocol an energy aware
and a reliable routing protocol by using hybridization of genetic algorithms and bacterial
foraging optimization techniques. PDORP enhances the network reliability by using the
proactive routing and reactive routing methodologies, and by composing a trust list of
forwarding nodes (Brar et al., 2016). However, PDORP has two main drawbacks that make it
not a suitable routing protocol for WMNs and MANETs. On the one hand, it is specifically
designed for WSNs, where the nodes are fixed, and the main objective is power saving. On
the other hand, it is a little bit complex to implement it in WMNs and MANETs nodes.
To support multimedia communications over MANETs and WMNs, stable routes that have
long route lifetimes, low control overheads and high packet delivery ratio are required
(Hayajna & Kadoch, 2016) and (Yang et al., 2011). However, the high dynamic topologies
in MANETs due to the nodes' random movements cause poor route availability. Stable
routing has three main categories that are topology stability routing, communication stability
routing and energy stability routing (Yang et al., 2011). The route instability caused by link
dynamics, wireless interference and energy consumption are addressed by topology stability
routing, communication stability routing and energy stability routing, respectively (Yang et
al., 2011). This thesis concentrates on topology stability routing, which is primarily classified
into single-path stable routing and backup routing.
Al-Akaidi & Alchaita (Al-Akaidi & Alchaita, 2007) recommended using the single-path
stable routing protocol by selecting the path that has the longest link lifetime. It was
analytically shown in (Al-Akaidi & Alchaita, 2007) that the expected path lifetime was
approximately the reciprocal of the sum of the reciprocal of the expected lifetimes of all links
in the path (Yang et al., 2011). This means that the selected stable route should
65
simultaneously satisfy two conditions that are the path length should be the shortest and the
link lifetime should be the largest. Based on that, the routing metric proposed in (Al-Akaidi
& Alchaita, 2007) fails to select the truly stable route, because it does not consider the route
length. On the other hand, different kinds of greedy forwarding strategies, like Greedy
Perimeter Stateless Routing (GPSR) strategy (Karp & Kung, 2000), fails to select the truly
stable route, because they choose the shortest routes, but they do not consider the route link
lifetimes. In addition, longer link distances in the above greedy forwarding strategies,
compared to shorter link distances, may easily cause link failures due to node mobility.
Note that the source node and the forwarding nodes in GPSR strategy choose a neighbor
node which has the minimum distance to the destination. Actually, what we need is a routing
protocol that considers both the route length and the route's link lifetimes.
Backup routing increases the network stability and packet delivery ratio by incorporating a
backup route that is used in case of link failures. The main drawback of some of the existing
backup routing protocols, like Backup Source Routing (BSR) (Guo, Yang & Shu, 2005),
Caching and Multiple Paths (CHAMP) routing (Valera, Seah & Rao, 2005), and Scalable
Multi-path On demand Routing (SMORT) (Reddy & Raghavan, 2007) is that they ignore the
fact that when the primary route fails, the backup path may also fail (Yang et al., 2011). (Lai,
Hsiao & Lin, 2007) tries to solve the above drawback by using the data overhearing
mechanism for the backup routing updating at the expense of more energy used while the
nodes are in the promiscuous mode instead of the sleeping mode.
(Yang et al., 2011) proposed a Greedy-based Backup Routing (GBR) protocol in order to
improve the network stability by considering the route length and the lifetime of each path's
link. GBR protocol builds the primary route based on an ordinary greedy forwarding
strategy; therefore, the primary path usually has the shortest route length. On the other hand,
it builds the local backup routes for each link during the primary path discovery procedure
based on the link lifetime. To explain how GBR works, let us take the example taken from
(Yang et al., 2011).
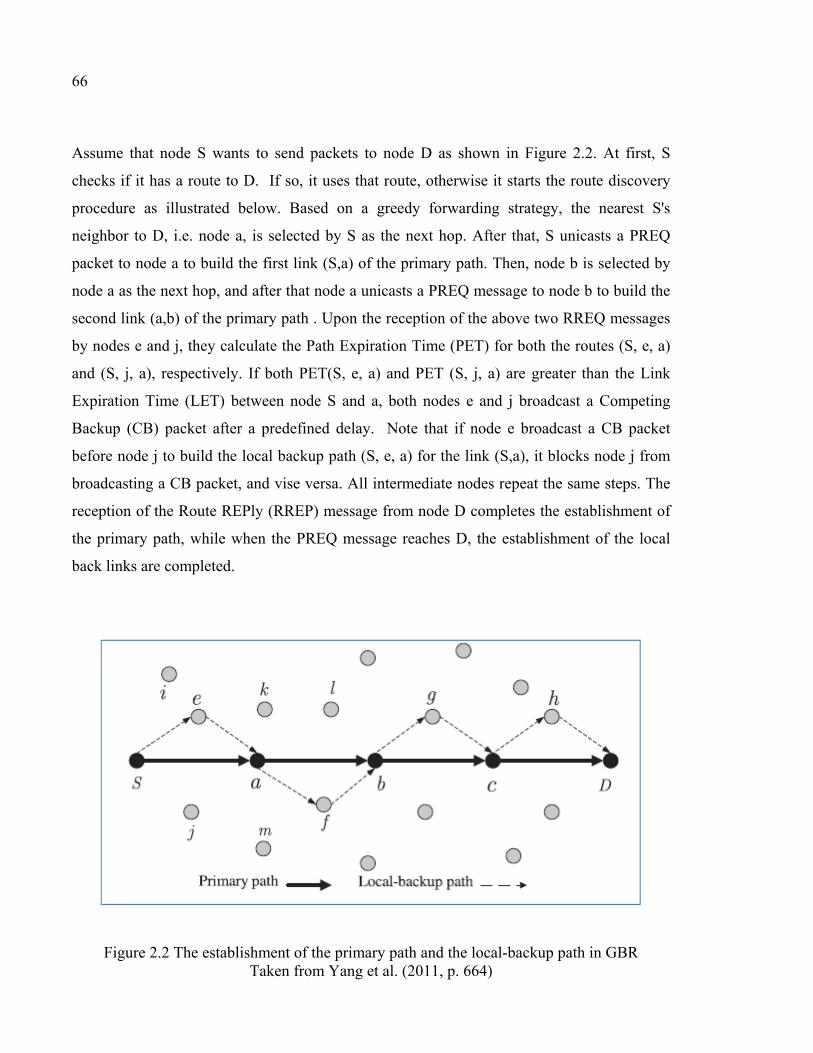
66
Assume that node S wants to send packets to node D as shown in Figure 2.2. At first, S
checks if it has a route to D. If so, it uses that route, otherwise it starts the route discovery
procedure as illustrated below. Based on a greedy forwarding strategy, the nearest S's
neighbor to D, i.e. node a, is selected by S as the next hop. After that, S unicasts a PREQ
packet to node a to build the first link (S,a) of the primary path. Then, node b is selected by
node a as the next hop, and after that node a unicasts a PREQ message to node b to build the
second link (a,b) of the primary path . Upon the reception of the above two RREQ messages
by nodes e and j, they calculate the Path Expiration Time (PET) for both the routes (S, e, a)
and (S, j, a), respectively. If both PET(S, e, a) and PET (S, j, a) are greater than the Link
Expiration Time (LET) between node S and a, both nodes e and j broadcast a Competing
Backup (CB) packet after a predefined delay. Note that if node e broadcast a CB packet
before node j to build the local backup path (S, e, a) for the link (S,a), it blocks node j from
broadcasting a CB packet, and vise versa. All intermediate nodes repeat the same steps. The
reception of the Route REPly (RREP) message from node D completes the establishment of
the primary path, while when the PREQ message reaches D, the establishment of the local
back links are completed.
Figure 2.2 The establishment of the primary path and the local-backup path in GBR Taken from Yang et al. (2011, p. 664)

67
(Zadin & Fevens, 2013) tried to improve the performance of GBR routing protocol by
proposing GBR with Conservative Neighborhood Range (GBR-CNR) routing protocol. It
implements some ideas in the GBR routing protocol in order to improve its performance. The
first idea is the construction of the backup route from nodes farther than two hops from the
two nodes constructing the link in case GBR routing protocol cannot find a backup route
within two hops neighbors. The other idea is the rediscovering of the primary route from the
last reachable node instead of the source node in case of the primary route fails. The last idea
is the restriction of the selections of next hop nodes to neighbors within a Conservative
Neighborhood Range (CNR), which is lower than the actual selection range, i.e. the
transmission range. The Hello interval and the nodes' maximum speed determine the CNR's
size.
Even though GBR-CNR routing protocol has promising ideas, it has two main drawbacks as
shown below. The first one is that it is very hard to know the nodes' maximum speed;
therefore, it is almost impossible to determine CNR. In addition to that, the knowledge of the
nodes' maximum speed only cannot determine the likelihood of link failures. Actually, CNR
depends on the nodes movement directions in addition to their speed, because in some cases
the nodes are moving closer to each other and the link's lifetime is increased. The second
drawback is that GBR-CNR implicitly assumes high node density. In case of lower nodes
density, the probability that GBR-CNR routing protocol fails is high, because the probability
to find a neighbor within CNR is very low.
2.3 Adaptive greedy forwarding strategy in MANETs based on node density
As we illustrated earlier in this thesis, routing protocols play a crucial role in MANETs
recovery systems. Greedy forwarding strategy is a potential forwarding strategies for routing
protocols in MANETs, because it is simple, scalable, and can be easily implemented in this
type of network. In this thesis, we propose a novel adaptive greedy forwarding strategy.
Unlike other greedy forwarding strategies, the forwarding region is not fixed and the size of
68
this region depends on the nodes density. As such, the minimum area that ensures the
network connectivity has to be found. This strategy can be described as follows: For high
node density, the expected forwarding region is relatively small. When the node density
starts decreasing, the expected forwarding region starts increasing to compensate the lower
density until it reaches an area which ensures the existence of a forwarding node in that
region, i.e. keep the network connected. In this way, the hop count and network nodes' spatial
distribution are reduced, the switching from the greedy forwarding strategy to the complex
and costly face routing is minimized, and the size of memory is reduced due to the fewer
neighbors that a node needs to keep their locations. To this end, a complete probabilistic
model will be provided.
2.3.1 Mathematical model analysis
This study considers a MANET, where the nodes are uniformly distributed in the network
area and using MFR greedy forwarding strategy as the greedy forwarding strategy. The node
density (ρ) is the same everywhere in the network area. The nodes are either static or mobile
according to random walk mobility model (Roy, 2011), i.e. the nodes are always uniformly
distributed in the network area. The node transmission range is the same for all nodes, and it
is equal to R. Two nodes are considers neighbors if the distance between them is less than R.
The pdfs of the distance (r) and the angle (θ) between the source node (S) and the selected
forwarding node (F) for uniformly distributed nodes, see Figure 2.1, are given in equation 2.1
and 2.2, respectively, as
f (r) = 2rR , 0 ≤ ≤ 0, ℎ (2.1)
f (θ) = 12ϕ , − ≤ ≤0, ℎ (2.2)

69
Where:
r : the Euclidean distance between S and F.
θ : the angle between the line connection S and D and the line connecting S and F. ϕ : the angle of the circular sector with respect to x (a dummy variable between 0 and π/2).
The expected forwarding region is determined by the angle ϕ, see Figure 2.3. Usually in
literature, the expected forwarding region is taken as a half circle with radius R, i.e. ϕ = π/2.
In contrast, in our adaptive greedy forwarding strategy, ϕ does not take a fixed value, rather
it is determined based on node density. For example, if the node density is high, the range of ϕ will be small. This is because when the node density is high, the probability to find a
neighbor node in smaller area is higher and it is not necessary to consider the whole half
circle, and smaller region will be sufficient to find a neighbor node to forward the packets to
it. On the other hand, if the node density is low, the range of ϕ will be higher.
Figure 2.3 The angle ϕ in our adaptive greedy forwarding strategy

70
To continue our analysis, the joint pdf of r and θ (f (r, θ)) is required. The joint pdf of r and
θ is equal to the multiplication of their pdf, because they are mutually independent events.
Thus,
f (r, θ) = rϕR , 0 ≤ ≤ − ≤ ≤0, ℎ (2.3)
Since our analysis deals with the Cartesian coordinates, f (r, θ) shall be transformed from
the polar coordinates to Cartesian coordinates with x and y axes. As we said before, MFR is
the used greedy forwarding strategy. Thus, x here represents the distance between the source
node and the projection of the forwarding node into the line connecting the source node and
the destination node. The above transformation can be obtained by using random variables
transformation, that is
f (x, y) = 1ϕR , 0 ≤ ≤ ,− . ( ) ≤ ≤ . ( ) x +y ≤ R0, ℎ (2.4)
Here ϕ takes any value between 0 and π/2. Note that y ≤ R −x , then −√R −x ≤y ≤ √R −x . Rewrite the above equation with this condition, then
f (x, y) = 1ϕR , 0 ≤ ≤ ,− R −x ≤ y ≤ R −x 0, ℎ (2.5)
As it is known, the marginal pdf of x (f (x)) is found by integrating the joint pdf f (x, y) over the range of y. Thus,

71
f (x) = 2√R −xϕR , 0 ≤ ≤0, ℎ
(2.6)
Integrating the above equation over x, gives us the cdf F (x). Then,
F (x) = 1ϕR x R −x +R arctan x√R −x , 0 ≤ ≤ ,0, ℎ (2.7)
Assume Z is the maximum distance x among all neighbor nodes inside the circular sector, i.e.
Z = max (x1, x2 ... xn). Thus, Fz(Z) = F (z)
F (z) = 1ϕR z R −z +R arctan z√R −z , 0 ≤ ≤0, ℎ (2.8)
The pdf f (z) can be obtained by taking the derivative of the cdf in equaion 2.8 with respect
to z, as shown in equation 2.9. Note that, the default value of ϕ, which is used in literature, is
equal to π/2. Substitute this value in equation 2.9, we get the default pdf of Z (f _ (z) ), as
shown in equation 2.10.
f (z)= n 1ϕR z R −z + R arctan z√R −z ( ) R − 2z√R −z + R4 − R2z2(R2 − z2)1.5 , 0 ≤ <0, ℎ
(2.9)
f _ (z)= n 2πR z R −z +R arctan z√R −z ( ) R − 2z√R −z + R −R z(R −z ) . , 0 ≤ <0, ℎ
(2.10)

72
The average progress per one hop in the default case is given by the expected maximum
progress ( Z ). Thus,
Z = tf (t)dt (2.11)
The probability that a mobile node has n neighbors inside a specific area can by
approximated by using Poisson distribution, since the mobile nodes are uniformly distributed
in the network area (Dung & An, 2013). Then,
P(n) = (ρC)n! e (2.12)
Where: P(n) : the probability that a mobile node has n neighbors inside a specific area (C). ρ : node density. C : the circular sector area (ϕR ).
Since the uniform distribution is considered in this analysis, the number of potential
forwarding nodes inside a circular sector with angle ϕ (N) is equal to the multiplication of ρ
and C (N = ρ ∗ C = ρϕR ). Thus, equation 2.12 can be rewritten in terms of N as
P(n) = (N)n! e (2.13)
2.3.2 One-way connectivity
The average number of neighbors which ensures one-way connectivity for a single hop
equals to 8 was proven by Takagi and Kleinrock in (Takagi & Kleinrock, 1984). One of the
main drawbacks of the above approach is its complexity, since it involved the MAC layer
and routing layer point of view. In this thesis, we provide another approach to prove that the

73
average number of neighbors equals to 8 indeed ensures one-way connectivity. Our approach
is efficient, simple, and from the routing layer point of view only. This also can provide a
hint that the analysis used in this study that ignores the consideration of the MAC layer has
negligible impacts in terms of network connectivity.
A. The default case
The pdf of the per one hop progress (Z) for the default case (f _ (z)), where ϕ is equal to
π/2, is shown in equation 2.10, and is plotted in Figure 2.4 for N = 4 and R = 100m. Figure
2.4 shows that the probability to find small values of z is very small, and it is more likely to
be greater than 0.6*R. Note that the same result was obtained in (Takagi & Kleinrock, 1984).
Figure 2.4 Probability density function f (z) for
the default case at N = 4 and R = 100m
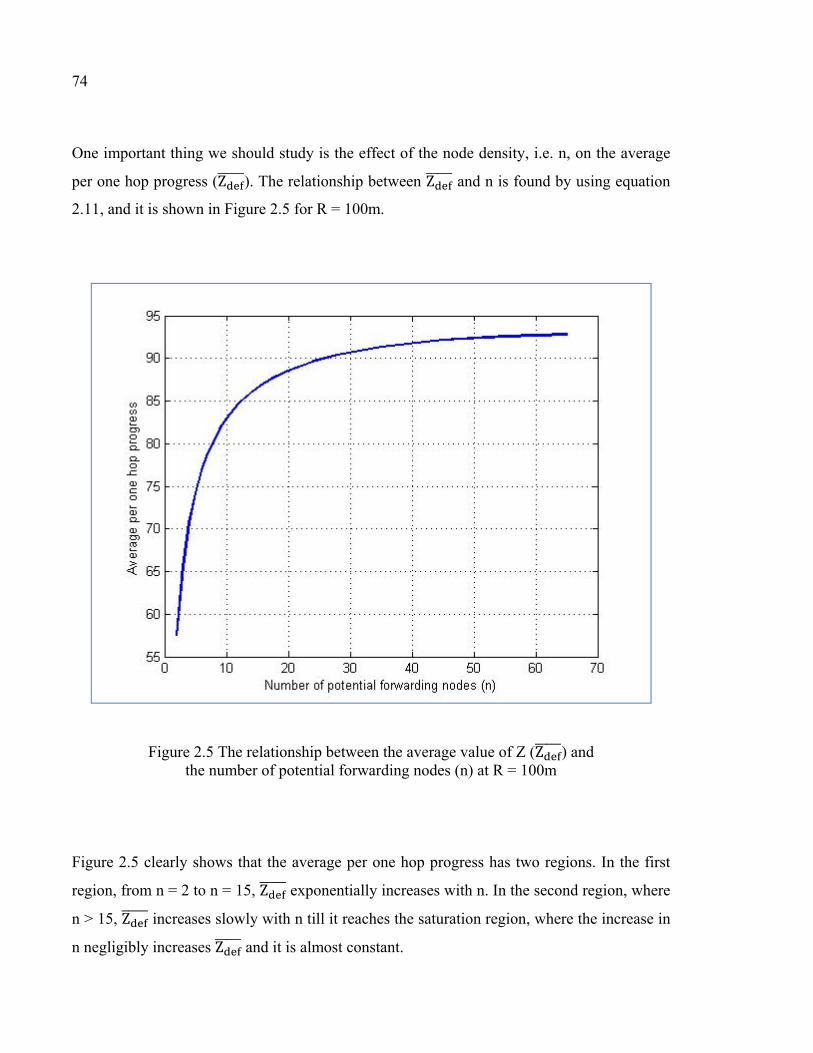
74
One important thing we should study is the effect of the node density, i.e. n, on the average
per one hop progress (Z ). The relationship between Z and n is found by using equation
2.11, and it is shown in Figure 2.5 for R = 100m.
Figure 2.5 The relationship between the average value of Z (Z ) and the number of potential forwarding nodes (n) at R = 100m
Figure 2.5 clearly shows that the average per one hop progress has two regions. In the first
region, from n = 2 to n = 15, Z exponentially increases with n. In the second region, where
n > 15, Z increases slowly with n till it reaches the saturation region, where the increase in
n negligibly increases Z and it is almost constant.

75
Our main objective in this subsection is to find the value of N that ensures the one-way
connectivity. To ensure the one-way connectivity, the source node must have at least one
neighbor node in the expected forwarding region. Thus, we shall put n ≥ 1 in equation 2.13
in order to obtain the probability of one-way connectivity (P _ ). Based on that,
P _ = p(n ≥ 1) = 1 − p(0) = 1 −e (2.14)
Figure 2.6 shows the relationship between P _ and N as indicated in the above
equation. This figure shows that the network is almost surely one-way connected, i.e. P _ is greater than 0.95, at N = 4. This proves that the number of neighbors a node
must have in order to ensure one-way connectivity is 8, i.e. N = 4, which is the same value
obtained in (Takagi & Kleinrock, 1984).
Figure 2.6 The probability that the network is one-way connected vs. N

76
B. The general case
The number of neighbors that ensures that the network is one-way connected is obtained by
using equation 2.12, and putting n ≥ 1. Thus, P _ can be expressed as
P _ = p(n ≥ 1) = 1 −e (2.15)
Now, consider a MANET with square area of 1 km2 and the number of nodes in this area is
1000 nodes. All nodes have the same transmission range (R) equals to 100m. As it is well
known, the node density (ρ) equals the total number of nodes in the network over the
network area. Thus, ρ equals 0.001 m-2. Figure 2.7 shows the relationship between the
probability that the network is one-way connected and the angle ϕ at ρ = 0.001m-2 and R =
100m. As shown in this Figure, ϕ equals to 0.3rad is sufficient in order to achieve almost
surely one-way connected network instead of 1.571rad, the default angle used in literature.
Figure 2.7 The relationship between the probability that the network is
one-way connected and the angle ϕ at ρ = 0.001 m-2 and R = 100m

77
Now consider the network is almost surely one-way connected when P _ is greater
than 0.95. The angle ϕ which ensures the network is almost surely one-way connected is
obtained by substituting the above value into equation 2.15, that is
ϕ ≥2.996ρR (2.16)
The above equation shows that if the network node density (ρ) and the network transmission
range (R) are known, the required angle ϕ to almost ensure the network is one-way
connected can be found. It also shows that there is an inverse relationship between the angle ϕ and both ρ and R. The relationship between the angle ϕ and R, when the network is almost
surely one-way connected, while ρ is fixed at 0.001 m-2 is shown in Figure 2.8.
Figure 2.8 The relationship between the angle ϕ and R when the network is almost surely one-way connected at ρ = 0.001m-2
40 60 80 100 120 140 160 180 2000
0.2
0.4
0.6
0.8
1
1.2
1.4
1.6
1.8
2
The Transmission Range ( R )
The
ang
le (
φ )

78
For relatively high transmission range, it is sufficient to choose a small angle to forward the
packets, as it is shown in Figure 2.8. For example, at ρ = .001m-2 and R greater than 160 m it
is sufficient to choose the angle equals to 0.1rad instead of 1.571rad. There are many
advantages of reducing the angle ϕ as mentioned below:
• Reducing the hop count;
• Reducing the network nodes' spatial distribution;
• Minimizing the conversion from the simple greedy forwarding strategy to the complex
and costly face routing;
• Reducing the nodes' memory sizes due to the fewer neighbors that they need to maintain
their locations.
2.3.3 Two-ways connectivity
To ensure that the network is two-ways connected, n must be greater than or equal to 2 (n ≥
2). Putting this value into equation 2.12 gives us the probability that the network is two-ways
connected P _ . Thus,
P _ = p(n ≥ 2) = 1 −e −(ρC)e (2.17)
Equation 2.17 can be rewritten in terms of ρ, ϕ and R by butting the value of C, which is
equal to ϕR , in this equation. Thus,
P _ = 1 −e −(ρϕR )e (2.18)
Equation 2.18 shows that the probability to have two routes depends only on ρ, R and ϕ. As
in the one route case, the required angle ϕ to almost ensure the network is two-ways
connected can be found if ρ and R are known. Now, we study the relationship between the
probability that the network is two-ways connected and the angle ϕ. In addition, we study the
relationship between the angle ϕ and R.

79
Assume the same values of ρ and R as in the one route case, i.e. ρ = 0.001 m-2 and R = 100m.
By putting these values in equation 2.18 and changing the angle ϕ, we obtain the relationship
between the probability that the network is two-ways connected and the angle ϕ as shown in
Figure 2.9. As in the one-way connectivity, the probability that the network is two-ways
connected exponentially increases when the angle ϕ increases until it reaches the saturation
region, where the probability that the network is two-ways connected is almost constant.
However, the two routes case requires higher angle compare to the single route case to
achieve the same probability that the network is connected as shown in Figure 2.9. This is
because the two route case requires at least two neighbor nodes inside the circular sector;
while in the one route case just one neighbor node is enough. Thus, in the two routes case a
higher area, i.e. higher angle, is required to have at least two nodes; while in the one route
case smaller area is sufficient to find a single node.
Figure 2.9 The probability of one-way and two-ways connectivity vs. ϕ at ρ = 0.001 m-2 and R = 100m

80
One interesting relationship to study is the relationship between ϕ and R when the network is
almost surely two-ways connected. This relationship can be found based on equation 2.19,
where P _ = 0.95. Based on that, the relationship between ϕ and R when the
network is almost surely two-ways connected is shown in the following equation, and it is
plotted in Figure 2.10.
ρϕR = ln 1 + ρϕR0.05 (2.19)
Figure 2.10 The relationship between the angle ϕ and R when the network is almost surely two-ways connected at ρ = 0.001 m-2
40 60 80 100 120 140 160 180 2000
0.5
1
1.5
2
2.5
3
The Transmission Range (R)
The
ang
le ( φ
)

81
Figure 2.10 shows that there is an exponentially inverse relationship between ϕ and R. This
means that if the network nodes have the potential to increase their transmission powers, they
can at the same time decrease the required angle ϕ that almost ensure the network is two-
ways connected. To compare the two paths case with the one path case, we plot the
relationships between the angle ϕ for the one-way connectivity and the two-ways
connectivity versus R when the node density is fixed at 0.001 m-2 in the same figure, Figure
2.11.
Figure 2.11 The relationship between the angle ϕ and R when the network is almost surely one-way and two-ways connected at ρ = 0.001m-2
40 60 80 100 120 140 160 180 2000
0.5
1
1.5
2
2.5
3
The Transmission Range (R)
The
ang
le ( φ
)
Two Paths
One Path
82
Even though the angle ϕ has an exponentially inverse relationship with R in both the one
route case and the two routes case, as shown in Figure 2.11, a larger angle is required for the
two routes case compared to the one route case. For example, when R = 100m, the required
angles to ensures the network are one-way connected and two-ways connected are 0.3 rad
and 0.47 rad, respectively. The above means that the forwarding region sizes can be reduced
by a factor of 5.24 and 3.34 for the one-way connectivity and the two-ways connectivity,
respectively, compared to the sizes usually used in literature. To be more specific, at low
transmission ranges, the angle ϕ in the two routes case is almost double the angle in the one
route case. Furthermore, the ratio between the two cases decreases when R increases, because
in this case the probability to find one node or two nodes is high enough and a small angle
will be sufficient to almost ensure the network connectivity is one-way connected or two-
ways connected.
We conclude this chapter by saying that the position-based routing protocols are more
suitable to MANETs than the topology-based routing protocols, because they eliminate some
of the topology-based routing protocols limitations, handle better the dynamic behavior of
MANETs, and are more scalable. Among the position-based routing protocols, the greedy
based routing protocol is the most used, due to its simplicity and scalability. A novel adaptive
greedy forwarding strategy was proposed in this chapter. Unlike other greedy forwarding
strategies, this strategy adapts the forwarding region size to the network node density. The
main objective behind this strategy is to determine the forwarding region size which ensures
the one-way connectivity or the two-ways connectivity.
CHAPTER 3
NETWORK RELIABILITY AND CONNECTIVITY
3.1 Introduction
Network reliability is the probability of a network performing its intended functions for a
certain period under specified network conditions. In other words, network reliability is the
probability that the network has no failure within a given operating period (Shooman, 2002).
Usually, the availability term is used instead of the reliability term when the network
recovery system is considered to fix the network failures. Network availability can be defined
as the probability that the network is up at a certain point of time (Shooman, 2002). In
general, since the network recovery rate is much larger than the failure rate, network
reliability and network availability are used interchangeably (Shooman, 2002). Network
reliability has three types that are the all-terminal reliability, the k-terminal reliability and the
two-terminal reliability. The All-terminal reliability is the probability that all the network
nodes can communicate to each other, whereas the k-terminal reliability is the probability
that a subset of network nodes can communicate. The two-terminal reliability can be
considered as a sub-case of k-terminal reliability, where k is equal to two.
3.2 Literature review
A framework for modeling, predicting and analyzing the wireless packets transmissions
reliability was proposed in (Sattiraju & Schotten, 2014). This framework considered the
effects of path loss, shadowing and multipath fading, while ignores other effects like nodes
mobility and interference. The above reliability analysis was based on the Reliability Block
Diagram (RBD) technique.
Egeland & Engelstad in (Egeland & Engelstad, 2009) introduced a method to predict the
WMNs k-terminal reliability based on graph theory and the basic reliability concepts.

84
Specifically, this method estimated the increase in the network reliability by adding
redundant nodes for static planned mesh networks and static random mesh networks.
Although, this method can be used by the mesh network designers to find the required node
density to achieve the target reliability, it is however very complicated to implement in real-
world environments.
(Dube, Raia, Wang & Tripathi, 1997) proposed to use signal stability and location stability to
measure the links reliability. In signal stability, the neighbors are classified as either strongly
connected or weakly connected based on the received signal strength from them. The period
of time that a link has existed determines the location stability. (Dube et al., 1997)
recommends favouring the selection of paths that have stronger channels that have operating
periods greater than some threshold (Jiang, He & Rao, 2001). The main drawback of using
signal stability and location stability to measure the link reliability is its dependency on the
links' past information that may fail to predict the future links' status especially when the
nodes are highly mobile.
(McDonald & Znabi, 1999a) and (McDonald & Znabi, 1999b) propose a probabilistic model
to predict the link availability, i.e. the probability that at time t0 + T the link is up given that
the link is available at time t0. In this model, the link is considered available at t0 + T, even if
it has failures during the interval t0 to t0 + T. This model defines the link availability as Ta / T,
where Ta is the sum of all non-continuous time periods where the link is up, and T is the
prediction time period. The above link availability model can be used to form a stable cluster
by selecting only the reliable neighbors, and as a routing metric to choose the most stable
paths.
The main drawback of the above model is that it is impractical, because when the link is
considered down, the rerouting is immediately required and the corresponding nodes will not
wait for the down links to become up again (Jiang, He & Rao, 2005). Thus, a continuous
time period (Tc) during which the link has no failures must be used instead of the Ta
parameter in order to make the above model more practical (Jiang et al., 2005). Another
85
drawback is that this model accurately predicts the link availability when the prediction time
periods are longer than tens of minutes, and substantially underestimates the link availability
when the prediction time periods are less than several minutes (Jiang et al., 2005). However,
the typical flow duration for data applications is often less than several minutes (Jiang et al.,
2005). To overcome the above drawbacks, (Jiang et al., 2005) propose another probabilistic
model to estimate the link availability.
The model proposed in (Jiang et al., 2005) consists of two parameters Tp and L(Tp). Tp is the
continuous time period that the link will remain up when the corresponding nodes do not
change their speed and direction. On the other hand, L(Tp) is the probability that the link will
really remain up for the whole Tp period when the corresponding nodes may change their
speed or direction. An accurate estimation of Tp can be easily calculated based on the nodes'
speeds and directions, while it is more challengeable to estimate L(Tp), because it involves
the node speeds and directions. The authors of this model recommend to use Tp * L(Tp) as a
routing metric to select the most reliable links. Since usually the routing paths consist of
multiple links, the flow duration depends on the link with the minimum Tp * L(Tp). For this
reason, the path with highest minimum Tp * L (Tp) is selected as the most reliable path.
However, as shown in chapter 2, this metric fails to select the truly stable route, because it
does not consider the route length. The simulation results in (Jiang et al., 2005) show that the
use of the above routing metric, instead of the classical routing metric that is used in DSR
(the shortest path and the first selected path), significantly improves the DSR routing
performance.
The mobility model used to estimate L(Tp) has two properties that are the node movements
are uncorrelated and the epochs ( a random time interval variable during which a node does
not change direction or speed) are exponentially distributed. Thus, the model proposed in
(Jiang et al., 2005) is only applicable in networks where the nodes follow the above
mentioned mobility model. Another weakness of this model is that it does not provide an
explicit formula to estimate L(Tp); instead of that it combines the theoretical analysis with
on fly measurements to compensate the errors happen in the theoretical estimation of L(Tp).
86
(An & Papavassiliou, 2002) proposed an entropy based analytical model to evaluate the
MANETs stability and availability. This model used the node mobility parameters, i.e.
speeds and directions, and the concept of entropy to estimate the path availability and
stability. They recommended using the above model as a stability routing metric to select the
most stable path. In (Wu, Liao, Tsao & Lin, 2009), (Pascoe-Chalke, Gomez, Rangel &
Lopez-Guerrero, 2010) and (Namuduri & Pendse, 2012), the link duration was considered as
the major criterion to estimate the path stability. The link duration was mathematically
calculated, and recommended as a routing metric to select the most stable path among the
available paths in the above studies.
Alvi et al. (Alvi et al., 2016) proposed a novel MAC protocol based on Time Division
Multiple Access (TDMA) protocol to be used in smart cities. This protocol was Bitmap-
Assisted Efficient and Scalable TDMA-Based WSN MAC (BEST-MAC) protocol. It could
be used as MAC layer protocol in order to increase the data reliability and the network
throughput. It was specifically designed to be used in smart cities, where the data traffic was
diverse, and the packets loss and delay were unacceptable. The use of small time slots, short
node addresses, and knapsack algorithm to schedule time slots are the main characteristics of
BEST-MAC protocol. The objective behind the use of small size time slots is to improve the
link utilization by efficiently handling the adaptive data traffic in smart cities, while the use
of short node addresses reduces the energy consumption by reducing overheads. Finally, the
use of knapsack algorithm decreases the average packet delay by decreasing the processing
time and improving the link utilization. The simulation results in (Alvi et al., 2016) prove
that BEST-MAC protocol increases the network throughput, and decreases the transmission
delay and energy consumption.

87
3.3 Ensuring reliable communications in MANETs with uniform random distribution
As we explained in chapter 2, to adapt with the frequent link failures in MANETS and
WMNs, the routing protocols shall catch more than one route, at least two routes. In the case
where two routes are used, we can use the first route as the main route, while the other route
is a standby route which is used upon link failures. By allowing the routing protocols catch at
least two routes, the packets loss is virtually decreased to zero on the one hand. On the other
hand, seamless multimedia communications over MANETs and WMNs can be assumed.
3.3.1 Mathematical model analysis
The nodes density in MANETs and WMNs must be above a certain threshold for the
existence of two routes between any randomly chosen source and destination pair with high
probability. In this thesis, we provide a novel mathematical model to find this node density
in terms of the number of node neighbors. In addition to that, we propose some solutions in
case the node density is below the required density in order to increase the node density to
the required one.
A MANET with M nodes that are uniformly distributed in a square area (A) with edge length
equals to a is considered. All nodes have a circular transmission range with radius R. Two
nodes are considered neighbors, and can communicate directly, if the distance between them
is less the transmission range. The forwarding strategy used in this network is LRD greedy
forwarding strategy. Finally, assume that the mobile nodes move according to random walk
mobility model (Roy, 2011), which means that the nodes are always uniformly distributed
over the network area.
A. Path availability
As it is known, the node density is equal to the number of nodes divided by the network area.
Thus, in our case the node density is equal to M/A. Path availability is defined as the
likelihood that at least one path exist between the Source node (S) and the Destination node
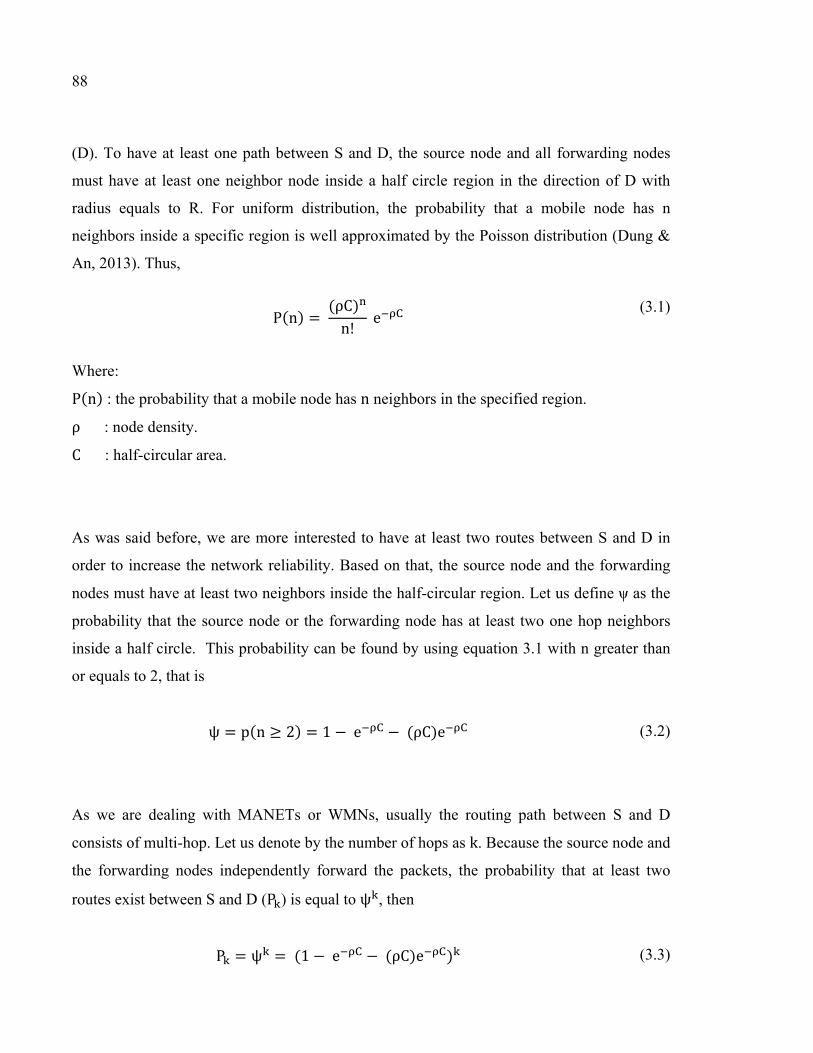
88
(D). To have at least one path between S and D, the source node and all forwarding nodes
must have at least one neighbor node inside a half circle region in the direction of D with
radius equals to R. For uniform distribution, the probability that a mobile node has n
neighbors inside a specific region is well approximated by the Poisson distribution (Dung &
An, 2013). Thus,
P(n) = (ρC)n! e (3.1)
Where: P(n) : the probability that a mobile node has n neighbors in the specified region. ρ : node density. C : half-circular area.
As was said before, we are more interested to have at least two routes between S and D in
order to increase the network reliability. Based on that, the source node and the forwarding
nodes must have at least two neighbors inside the half-circular region. Let us define ψ as the
probability that the source node or the forwarding node has at least two one hop neighbors
inside a half circle. This probability can be found by using equation 3.1 with n greater than
or equals to 2, that is
ψ = p(n ≥ 2) = 1 −e −(ρC)e (3.2)
As we are dealing with MANETs or WMNs, usually the routing path between S and D
consists of multi-hop. Let us denote by the number of hops as k. Because the source node and
the forwarding nodes independently forward the packets, the probability that at least two
routes exist between S and D (P ) is equal to ψ , then
P = ψ = (1 −e −(ρC)e ) (3.3)
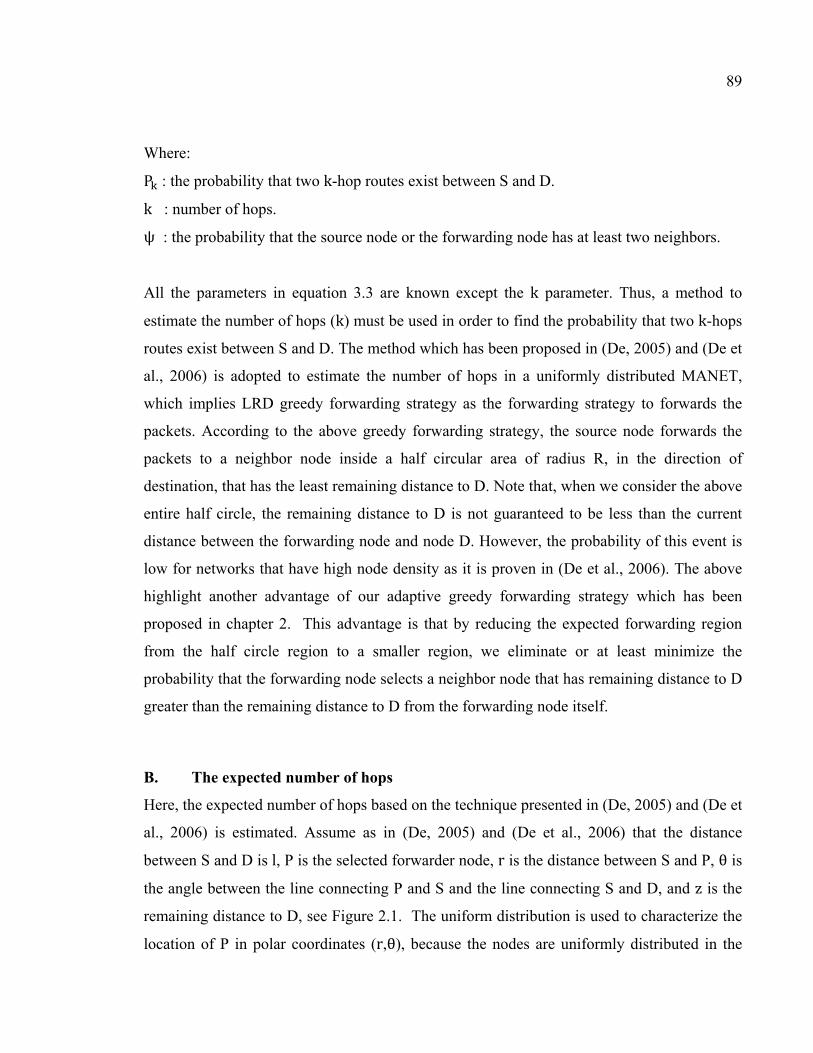
89
Where: P : the probability that two k-hop routes exist between S and D. k : number of hops. ψ : the probability that the source node or the forwarding node has at least two neighbors.
All the parameters in equation 3.3 are known except the k parameter. Thus, a method to
estimate the number of hops (k) must be used in order to find the probability that two k-hops
routes exist between S and D. The method which has been proposed in (De, 2005) and (De et
al., 2006) is adopted to estimate the number of hops in a uniformly distributed MANET,
which implies LRD greedy forwarding strategy as the forwarding strategy to forwards the
packets. According to the above greedy forwarding strategy, the source node forwards the
packets to a neighbor node inside a half circular area of radius R, in the direction of
destination, that has the least remaining distance to D. Note that, when we consider the above
entire half circle, the remaining distance to D is not guaranteed to be less than the current
distance between the forwarding node and node D. However, the probability of this event is
low for networks that have high node density as it is proven in (De et al., 2006). The above
highlight another advantage of our adaptive greedy forwarding strategy which has been
proposed in chapter 2. This advantage is that by reducing the expected forwarding region
from the half circle region to a smaller region, we eliminate or at least minimize the
probability that the forwarding node selects a neighbor node that has remaining distance to D
greater than the remaining distance to D from the forwarding node itself.
B. The expected number of hops
Here, the expected number of hops based on the technique presented in (De, 2005) and (De et
al., 2006) is estimated. Assume as in (De, 2005) and (De et al., 2006) that the distance
between S and D is l, P is the selected forwarder node, r is the distance between S and P, θ is
the angle between the line connecting P and S and the line connecting S and D, and z is the
remaining distance to D, see Figure 2.1. The uniform distribution is used to characterize the
location of P in polar coordinates (r,θ), because the nodes are uniformly distributed in the
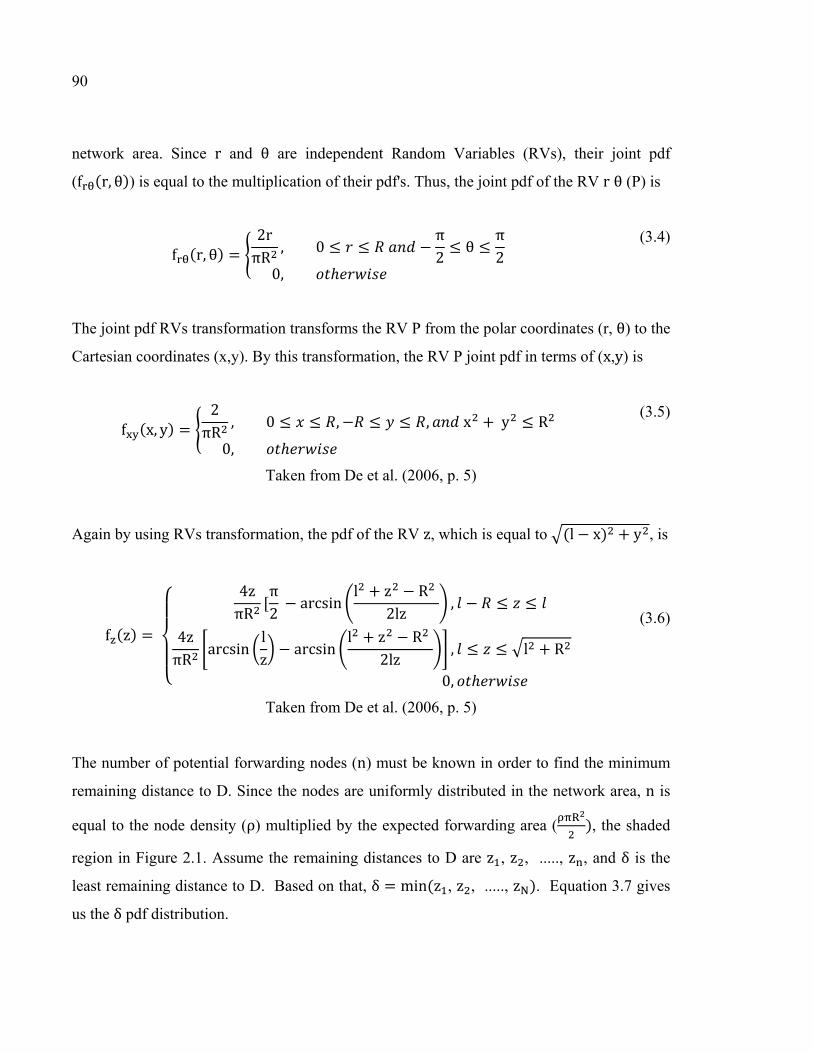
90
network area. Since r and θ are independent Random Variables (RVs), their joint pdf
(f (r, θ)) is equal to the multiplication of their pdf's. Thus, the joint pdf of the RV r θ (P) is
f (r, θ) = 2rπR , 0 ≤ ≤ − π2 ≤ θ ≤ π20, ℎ (3.4)
The joint pdf RVs transformation transforms the RV P from the polar coordinates (r, θ) to the
Cartesian coordinates (x,y). By this transformation, the RV P joint pdf in terms of (x,y) is
f (x, y) = 2πR , 0 ≤ ≤ ,− ≤ ≤ , x +y ≤ R0, ℎ (3.5)
Taken from De et al. (2006, p. 5)
Again by using RVs transformation, the pdf of the RV z, which is equal to (l − x) + y , is
f (z) = 4zπR [π2 −arcsin l + z − R 2lz , − ≤ ≤4zπR arcsin lz − arcsin l + z − R 2lz , ≤ ≤ l + R0, ℎ
(3.6)
Taken from De et al. (2006, p. 5)
The number of potential forwarding nodes (n) must be known in order to find the minimum
remaining distance to D. Since the nodes are uniformly distributed in the network area, n is
equal to the node density (ρ) multiplied by the expected forwarding area ( ), the shaded
region in Figure 2.1. Assume the remaining distances to D are z , z , ....., z , and δ is the
least remaining distance to D. Based on that, δ = min(z , z , ....., z ). Equation 3.7 gives
us the δ pdf distribution.

91
f (δ)
= n 2πR 2δ π2 − arcsin δ + l − R2lδ δ arcsin δ + l − R2lδ+12 4R l − (δ − l − R ) −R arcsin (δ − l − R )2lr − πδ2 , − ≤ ≤
n 2πR 2δ arcsin 1δ − arcsin δ + l − R2lδδ arcsin δ + l − R2lδ+12 4R l −(δ − l − R ) −R arcsin δ − l − R2lR − δ arcsin 1δ − l δ − l , l ≤ δ ≤ l + R
0, otherwise
(3.7)
Taken from De et al. (2006, p. 6)
Let us denote ε as the maximum forward progress per hop ( l − δ). Thus, the pdf of ε is given
by f = f (l − ε). Substitute f (δ) from equation 2.7 into the above equation, we get the pdf
of ε, that is
f (ε)
=n 2πR 2(l − ε) π2 − arcsin 1 + ε − R2l(l − ε) (l − ε) arcsin 1 + ε − R2l(l − ε)+12 4R l −(ε − R − 2lε) −R arcsin (ε − R − 2lε)2lR − π(l − ε)2 , ≥ ≥ 0
n 2πR 2(l − ε) arcsin ll − ε − arcsin 1 + ε − R2l(l − ε)(1 − ε) arcsin 1 + ε − R2l(l − ε)+12 4R l −(ε − R − 2lε) −R arcsin ε − R − 2lε2lR − (l − ε) arcsin 11 − ε−l ε − 2lε
, 0 ≥ ε ≥ l − l + R0, otherwise
(3.8)
Taken from De et al. (2006, p. 6)
By default, the average of ε (ε) which gives the average progress per one hop is
ε = tf (t)dt√ (3.9)
Taken from De et al. (2006, p. 6)

92
The expected progress per hop (ε) is almost independent of l and dependent on ρ and R only
were proven in (De, 2005) and (De et al., 2006). Based on that, an approximation approach to
find the average number of hops (h), which greatly reduce the complexity of the exact
approach, was proposed in (De, 2005) and (De et al., 2006). The approximation approach
works as follows: at first ε is calculated based on equation 3.9, then to obtain the expected
number of hops (h), we divide the distance between S and D (l) over ε as shown in the
following equation:
h= (3.10)
Taken from De et al. (2006, p. 9)
Now, the probability that two k-hops routes exist between S and D (P ) can be found by
replacing the k parameter in equation 3.3 with the h parameter obtained from equation 3.10,
that is
P = (1 −e −(ρC)e ) (3.11)
3.3.2 Evaluation
Assume we have a MANET, where the network nodes are uniformly distributed in the
network area. The network area is a square area with edge length (a) equals to 1000m. The
transmission range (R) for all nodes is fixed at 100m. Our objective here is to find the node
density in terms of the number of neighbors which is required to have two paths between any
randomly chosen source and destination pair with high probability.
At first, we study the pdf of the per one hop progress (ε), which is shown in equation 3.8 and
plotted in Figure 3.1. It can be seen in this Figure that the per one hop progress toward the
destination is more likely to be close to R. To see how the node density in terms of the
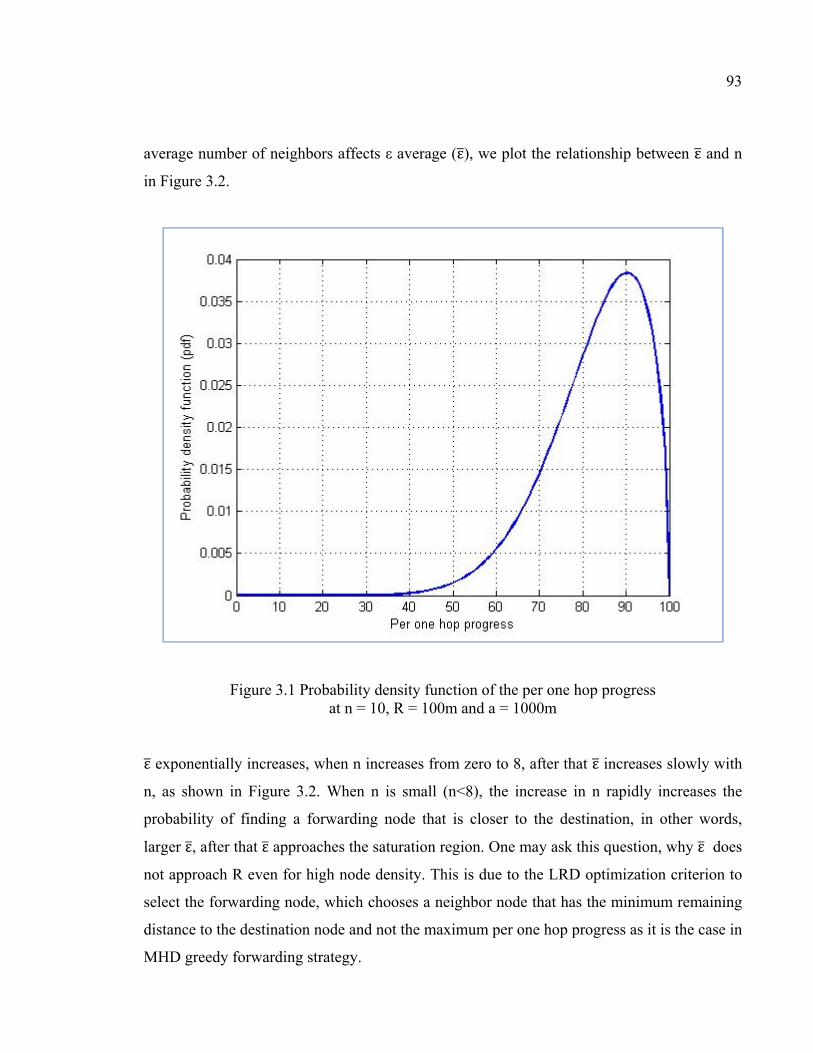
93
average number of neighbors affects ε average (ε), we plot the relationship between ε and n
in Figure 3.2.
Figure 3.1 Probability density function of the per one hop progress at n = 10, R = 100m and a = 1000m
ε exponentially increases, when n increases from zero to 8, after that ε increases slowly with
n, as shown in Figure 3.2. When n is small (n<8), the increase in n rapidly increases the
probability of finding a forwarding node that is closer to the destination, in other words,
larger ε, after that ε approaches the saturation region. One may ask this question, why ε does
not approach R even for high node density. This is due to the LRD optimization criterion to
select the forwarding node, which chooses a neighbor node that has the minimum remaining
distance to the destination node and not the maximum per one hop progress as it is the case in
MHD greedy forwarding strategy.
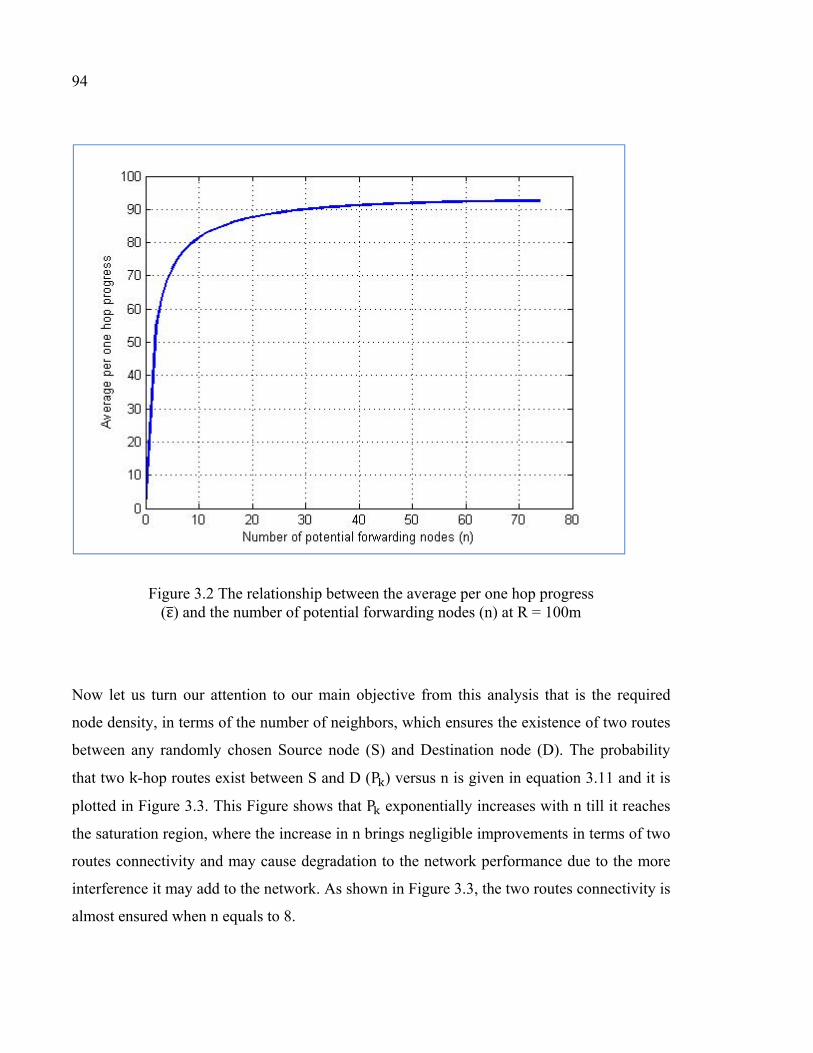
94
Figure 3.2 The relationship between the average per one hop progress (ε) and the number of potential forwarding nodes (n) at R = 100m
Now let us turn our attention to our main objective from this analysis that is the required
node density, in terms of the number of neighbors, which ensures the existence of two routes
between any randomly chosen Source node (S) and Destination node (D). The probability
that two k-hop routes exist between S and D (P ) versus n is given in equation 3.11 and it is
plotted in Figure 3.3. This Figure shows that P exponentially increases with n till it reaches
the saturation region, where the increase in n brings negligible improvements in terms of two
routes connectivity and may cause degradation to the network performance due to the more
interference it may add to the network. As shown in Figure 3.3, the two routes connectivity is
almost ensured when n equals to 8.

95
Figure 3.3 The probability that two k-hop routes exist between S and D versus the number of potential forwarding nodes (n)
It was proven early in this thesis, section 2.2, and in (Takagi & Kleinrock, 1984) that the
magic number 8, i.e. n is equal to 4, is the required number of neighbors to ensure the
existence of one route between any randomly chosen S and D pair. Here, we provides a novel
magic number which is n equals to 8 that ensures the existence of two routes between any
randomly chosen S and D pair. This magic number can encourage the MANETs and WMNs
designers to take the two routes connectivity issue more seriously, when they design their
networks due to the huge improvement it bring to the network performance (Hayajna &
Kadoch, 2017b), (Moussaoui & Boukeream, 2015) and (Hayajna & Kadoch, 2016).
Even though we cannot force people to use the network or to give their permissions to use
their devices to relay the network traffic in order to increase the node density to the required

96
density, we still can somehow increase the node density. This thesis proposes two approaches
that can be used to increase the node density to the required node density that ensures the two
routes connectivity. The first approach is to add extra fixed nodes, i.e. wireless mesh routers,
to the network. In this case, the MANET is turn into WMN. This can be easily done with
little effort and cost due to the ease of implementation of the mesh routers and their relatively
affordable cost. The implementation of wireless mesh routers costs less, because their prices
are relatively low, and do not require wires to connect them to the network. Another
advantage of this approach is its adaptability to the network requirements, where we can
easily add or remove the wireless mesh routers (turn them off), or even change their
positions. In addition, we can control the network node density by adjusting the wireless
mesh routers' transmission range. The other approach is to encourage people to use the
network, or give us the permission to use their devices to relay the network traffic by giving
them some incentives.
3.4 The random waypoint mobility model
Node mobility in MANETs and WMNs makes their analysis more challengeable compared
to other kinds of networks. To analyse the performance of MANETs and WMNs, nodes
mobility models are required. The most used mobility model in the literature is Random
WayPoint mobility model (RWP) (Bettstetter, Resta & Santi, 2003). In RWP, each network
node chooses a random destination point uniformly. After that, the node moves to the
selected destination at a speed, which is chosen uniformly from the interval [vmin, vmax]
(Bettstetter et al., 2003). Then, the network node pauses for a predefined pause time, before
move again and repeat the same steps. It is well known that the nodes moving according to
the RWP have non-uniform spatial distribution regardless of their initial spatial distribution
(Bettstetter et al., 2003) and (Bettstetter & Wagner, 2002).
Even though the RWP mobility model is the most used mobility model, it has some problems
as shown below. Firstly, most theoretical results regarding routing, capacity, connectivity
and power saving assumes uniform node distribution. Thus, the above results cannot be
directly applied to the networks where the nodes are moving according to the RWP mobility

97
model due to its non-uniform node distribution (Bettstetter et al., 2003). Secondly, the initial
uniform distribution and the short term behaviour of the RWP model are not like the actual
long term behaviour, i.e. the steady state distribution, (Bettstetter et al., 2003). Based on that,
many studies' simulation results available in literature that assume the nodes are moving
according to RWP mobility model could be inaccurate, because they take their results after a
few simulation steps (Bettstetter et al., 2003). Third, RWP mobility model has the border
effect. This effect happens, because the network nodes tend to cross the middle of the
network area with relatively high frequency compared to other areas (Bettstetter et al., 2003).
The node distribution converges towards asymptotically stationary distribution with the
maximum node density in the middle of the network area (Bettstetter et al., 2003). Finally,
the nodes' average speed decreases with time and converges to a value that is less than the
initial average speed, i.e.
, where v is the minimum initial speed, v is the
maximum initial speed and v ≠ v (Bettstetter et al., 2003) and (Yoon, Liu & Noble,
2003). In addition to that, if v is equal to zero, as it is done in many studies, the average
speed will be close to zero. In other words, the mobile nodes will converge to almost static
nodes.
(Bettstetter et al., 2003) proposed the generalized RWP mobility model in order to overcome
the above mentioned problems associated with traditional RWP mobility model. The pause
time of the mobile nodes moving according to the generalized RWP mobility model is not
fixed, as it is the case in the traditional RWP mobility model, and it is randomly chosen from
a specified pdf. While in the traditional RWP mobility model all nodes must be mobile, in
generalized RWP mobility model, some nodes are allowed to be static with specific
probability from 0 to 1. To overcome the pitfall that arises when the minimum speed is equal
to zero, i.e. the mobile nodes converge to static nodes, in the traditional RWP mobility
model; the minimum speed in generalized RWP mobility model must be greater than zero.
The purpose of putting the minimum speed (v ) equals to zero in the traditional RWP
mobility model is to let some nodes remain static. The generalized RWP mobility model
achieves the above purpose without letting all the system converges to static system by

98
letting some nodes actually remain static during the whole simulation duration (Bettstetter et
al., 2003).
3.5 Ensuring two routes connectivity with random waypoint mobility model
We have provided in section 3.3 a probabilistic model to find the required node density to
ensure the existence of two routes between any randomly chosen source and destination pair
in a MANET with uniformly distributed nodes. Based on that model, we found that the
number of neighbors for each node must be above 16, i.e n=8, in order to ensure the
existence of two routes. The assumption in the previous section that the network nodes are
uniformly distributed does not apply for all mobility models. For example, RWP mobility
model has non-uniform node distribution, even when the nodes are initially uniformly
distributed in the network area. This motivates us to study the case where the nodes are non-
uniformly distributed in the network area. To the best of our knowledge, this thesis is the first
study that mathematically determines the required node density, in terms of the number of
neighbors that is required to ensure the two routes connectivity where the nodes are
uniformly distributed in the network area or moving according to the RWP mobility model.
(Younes & Thomas, 2011) was the first study that mathematically estimated the hop count in
mobile ad hoc network where the nodes are moving according to the generalized RWP
mobility model. The greedy forwarding strategy used in that study to estimate the hop count
was MHD. In the following, we rely on the analysis provided in (Younes & Thomas, 2011)
to mathematically estimate the required node density in order to ensure the existence of two
routes between any randomly chosen source and destination pair in MANETs where the
nodes are moving according to the generalized RWP mobility model. To this end, a complete
probabilistic model is proposed. We also compare MHD and LRD routing criterions'
potentials to choose the shortest route.

99
3.5.1 The hop count
The hop count has direct impact on packet delivery ratio, per hop and end to end delay,
flooding cost, network traffic load estimation, and network connectivity in MANETs
(Younes & Thomas, 2011). The hop count depends on the used greedy forwarding strategy in
the topology based routing protocols. (De, 2005) and (De et al., 2006) proposed an approach
to estimate the hop count in mobile ad hoc networks where the nodes are uniformly
distributed in the network area. The main drawback of the above approach is that it applies
only for networks where the nodes are uniformly distributed in the network area. Thus, we
need another approach to calculate the hop count for networks where the nodes are non-
uniformly distributed. Younes and Thomas (Younes & Thomas, 2011) propose such
approach to calculate the hop count for networks where the nodes are moving according to
the generalized RWP mobility models, i.e. the nodes are non-uniformly distributed in the
network area.
3.5.2 Mathematical analysis
To the best of our knowledge, this thesis is the first study that mathematically analyzes the
two routes connectivity issue in MANETS where the nodes are moving according to the
generalized RWP mobility model. Our main objective from this study is to mathematically
calculate the required average number of neighbors to ensure the two routes connectivity
between the network nodes. The probability that a route existence between any randomly
chosen Source node (S) and Destination node (D) depends on the Euclidean distance between
S and D and the hop count, in addition to node density. For the calculation of the Euclidean
distance and the hop count, we use the approach presented in (Younes & Thomas, 2011).
In this analysis, we assume A MANET with square area with side length equal to L. MHD
greedy forwarding strategy is the used forwarding strategy. The transmission range is a
circular transmission range with radius equals to R, and it is the same for all nodes. Two
nodes are considers neighbors if the distance between them is less than R.

100
A. The Euclidean distance between the source node and the destination node
Since the node movements are not known, a probabilistic model is needed in order to
estimate the expected Euclidean distance between any randomly chosen S and D pair.
(Younes & Thomas, 2011) calculates the expected Euclidean distance (d) between any two
randomly chosen nodes moving according to the generalized RWP mobility model in a
square network area with side length equals to L as
d = 0.4 ∗ L (3.12)
Taken from Younes & Thomas (2011, p. 149)
B. Per One Hop Progress
The number of hops (HC) between S and D depends on the Euclidean distance between
them, per one hop progress, and the used forwarding strategy. The objective in MHD greedy
forwarding strategy is to minimize the hop count by choosing a neighbor node in the
direction of destination, which has the maximum distance to S as the rely node, i.e. has the
maximum per one hop progress. The pdf of the maximum Euclidean distance between the
node S and its neighbors (Ω), and the expected value of Ω (rr) are found by using equations
(3.13) and (3.14), respectively.
fΩ = (2n) ∗ ΩR (3.13)
Taken from Younes & Thomas (2011, p. 152) rr = 2n2n + 1 R
(3.14)
Taken from Younes & Thomas (2011, p. 152)
C. The remaining distance to the destination
Assume the relay node is located at a point on the circumference of a half circle in the
direction of D with radius equals to Ω and random angle ∂ (Younes & Thomas, 2011). Since
a half circle is considered, ∂ can be any value in the range of [-π/2 , π/2]. ∂ is a uniform
101
random variable with pdf equals to 1/π. From the pdf of ∂, and the relationship between Ω,
the Euclidean distance between S or the forwarding node and D and the reaming distance to
D, we can find the pdf of the remaining distance to D (X) as
f (X) = 2Xπdr ∗ 1 − d +rr − X2dr
(3.15)
Taken from Younes & Thomas (2011, p. 153)
Where:
X : the remaining distance to D.
d : the Euclidean distance between S or the forwarding node and D.
rr : per one hop progress.
The expected value of X (X) is equal to
X= Xf (x)dx√ (3.16)
Taken from Younes & Thomas (2011, p. 153)
D. The expected hop count
An iterative procedure is introduced in (Younes & Thomas, 2011) in order to calculate the
expected Hop Count (HC) .This procedure can be summarized as follows: At the beginning,
S calculates the Euclidean distance to D. If this distance is less than R, then D is one of S
neighbors and HC is equal to 1, otherwise S choose a relay node among its neighbors
according to MHD greedy forwarding strategy to forward the packets to it. After that, the
selected relay node calculates the per hop progress (rr) and the remaining distance to D (X).
In case X is less than R, then D is one neighbor of that relay node, and HC is equal to 2. If X
is greater than R, the same steps are repeated till X falls below R, and each time HC is
incremented by 1.

102
E. Two routes connectivity
Here, we find the node density which is required to ensure two routes connectivity between
any randomly chosen source node and destination node pair. The Poisson distribution can be
used to approximately estimate the probability that a mobile node has n neighbors inside a
specific area (Dung & An, 2013), in our case it is a half-circular area with radius equals to R.
As explained before, to ensure the existence of two routes between S and D, the node S and
all the forwarding nodes must have at least two neighbors inside a half-circular area with
radius R in the direction of D, i.e. n ≥ 2. Since S and each forwarding node independently
forward the packets to a relay node until D is reached, the probability that two routes exist
between S and D (P ) is equal to (P(n ≥ 2))HC. The following equation calculates P :
P = (1 −e − ρCe ) (3.17)
3.5.3 Evaluation
Consider a square area mobile ad hoc network with side length (L) equals to 1000m. The
network nodes are mobile nodes moving according to the generalized RWP mobility model
proposed in (Bettstetter et al., 2003). All nodes have the same transmission range (R), and
follow the MHD greedy forwarding strategy.
Firstly, we study the relationship between the expected per hop progress (rr) and the node
density (n), and compare rr in both MHD and LRD greedy forwarding strategies. For MHD
greedy forwarding strategy, rr is calculated based on equation 3.14, while equation 3.9
calculates rr for the LRD greedy forwarding strategy. Figure 3.4 shows the relationship
between the expected per hop progress in both MHD and LRD versus n based on the above
two equations. We can clearly see in Figure 3.4 that rr in both MHD and LRD exponentially
increases with n till it reaches the saturation region. It also shows that rr approaches R when

103
n is high enough in MHD; in contrast to LRD where rr does not approach R, no matter how
big n is. This is due to the different optimization criterions used in MHD and LRD. MHD
greedy forwarding strategy tries to optimize rr, while LRD greedy forwarding strategy tries
to optimize the remaining distance to D.
Figure 3.4 The average per one hop progress vs. the node density (n) at R = 100m and L = 1000m for both MHD and LRD
To see which optimization criterion is better in terms of reducing the hop count, we plot the
relationship between the hop count in MHD and LRD versus the node density in Figure 3.5.
Actually the one that has the potential to decrease the hop count is better, because this
increases the network connectivity, the packet delivery ratio, especially for less reliable
networks where the link failures occur more frequently, and decreases the end to end delay
and the network interference. Strangely, Figure 3.5 shows that the hop count in MHD does
104
not depend on the node density (n). Even though for low density, MHD potentially decreases
the hop count compared to LRD, but at moderate and high node density LRD performs better
than MHD. This is due to the fact that MHD increases the per hop progress (rr) for each step,
but the optimization criterion to select the shortest path based on rr optimization criterion
fails to select the shortest path with moderate and high node density, as illustrated below.
When the node density (n) increase, rr also increases. However, rr shall be located in the line
connecting S and D in order to reduce the hop count. The probability of the above event is
low and there is same probability that rr be perpendicular to the line connecting S and D and
in this case the remaining distance is higher than the original distance between S and D. In
other words, the bad location selection of the chosen relay node cancels the enhancement
achieved by increasing the per one hop progress (rr).
Figure 3.5 The relationship between the hop count and the node density (n) at R = 150m and L = 1000m for both MHD and LRD

105
Finally, we investigate the effects of node density on the network connectivity. The
relationship between the probability that two k-hop routes exist between S and D (P ) with
node density (n) is calculated based on equation 3.17 and it is plotted in Figure 3.6. As it is
shown in this figure, P is exponentially increased with n until it reaches the saturation
region, where the increase in the node density brings negligible improvement in terms of
network connectivity. When n ≥ 8 almost two routes connectivity is achieved, as shown in
Figure 3.6. In the previous section, we have found that the same node density (n≥ 8) ensures
the existence of two routes in MANETs where the nodes are uniformly distributed in the
network area. The above highlights a novel and an important conclusion that the generalized
RWP mobility model has negligible effect in terms of the required node density to ensure
two routes connectivity.
Figure 3.6 The probability that two k-hop routes exist between S and D vs. the number of potential forwarding nodes

CONCLUSION
Mobile Ad hoc NETwork (MANET) is a kind of multi-hop communication networks that is
formed on the fly without the need of any kind of infrastructure. All client nodes in MANETs
can operate as a host and a router at the same time, and can randomly move without any
restrictions. The above characteristics make MANETS an ideal candidate to extend the
cellular networks coverage, to recover from disasters, and to use them as communication
networks among soldiers in the battlefield or among researchers during the conference.
On the other hand, WMN is a promising wireless technology to resolve the limitations and to
improve the performance of ad hoc networks. In addition, it provides effective solutions to
broadband internet access, community, small business and neighborhood networks, and
industrial and building automation. WMNs have the capability to accommodate multiple
radios and multiple channels in order to solve the capacity issue associated with the use of
single radio and single channel. Due to its importance, industrial standards group IEEE
proposed a new standardized framework, IEEE 802.11s, for WMNs in September 2011.
Link failures in WMNs and MANETs occur more frequently compared to wired
communications, because of node mobility, dynamic obstacles, limited energy resources,
fading, and spectrum allocations etiquette or regulations, in addition to unreserved
bandwidth. These frequent failures interrupt the communications till they are fixed, and make
WMNs and MANETs less reliable compared to other kinds of communication networks.
Based on that, link failures detections and recoveries are important issues to investigate.
The first step to solve the link failures' problem and mitigate their impacts in WMNs and
MANETs, is the link failure detections. The two main link failure detections approaches are
link cross layer feedback approach and Hello based link failure detection approach. Even
though the link cross layer feedback approach detects link failure faster than Hello based link
failure detection approach, the later is the most used, because it is easier to implement it in
the routing protocols by avoiding interlayer interaction complexity, it is link layer

108
independent, and it requires less memory and power resources. For that reason we have
concentrated in our thesis on Hello based link failure detections approach.
The Hello beacon interval (TB) and the number of messing Hello beacons (K) are the two
parameters that determine the link failure detection delay. Transient and permanent
transmission errors are the two kinds of transmission errors. Non permanent interference and
congestion cause transient transmission errors, while link failures cause permanent
transmission errors. The cost of compensating permanent transmission errors is much higher
than the cost of compensating permanent transmission errors. This is because retransmissions
in the MAC layer compensate transient transmission errors; while finding and using a new
path in the routing layer compensate permanent transmission errors. Based on that, it is a
crucial issue to misinterpret the transient transmission errors as permanent transmission
errors, and therefore, the used communication link is declared as a failed link. The incorrect
declaration that the link has failed interrupts the communication till the routing protocol find
an alternative route, which consumes a considerable bandwidth and power resources,
congests the networks with route request messages, and causes a significant delay till
another route is found. The routing protocols play a crucial role in both link failure detections
and fixing these failures. Thus, the routing protocols must be carefully designed to
effectively manage the link failures.
We showed in our thesis that fast and accurate link failure detections play a crucial role in
maintaining WMNs and MANETs performance and increasing the packet delivery ratio. In
this thesis, we analyzed Hello based link failure detection approach deployed in WMNs
routing protocols that catch two routes, the primary route and the backup route. The
objectives behind this analysis were to mathematically calculate the packet delivery ratio
(pdr), and to find how much gain we could achieve by using two routes instead of one. The
results showed an improvement of pdr of roughly 1.5 times for all sending rates. We also
investigated the effect of the other parameters that affects the pdr, like link failure rate (rLF).
Our thesis showed that the Hello based link failure detection approach worked well in
WMNs with low and medium link failure rates, and failed to work in WMNs with very high
109
link failure rates. This conclusion opened up a new research direction, which was the
investigation of other link failure detection approaches that are more suitable for WMNs and
MANETs with higher link failure rates. We also showed that applying two routes was
essential to cover high link failure rate values, and the need using two routes instead of one
was more urgent in WMNs with higher link failure rate values, i.e. less reliable networks.
Another issue we investigated in this thesis was how we could support multimedia
communications in WMNs. To this end, we provided a complete and a novel framework that
could be used as a guideline to choose the proper K and TB values based on the
communications types and their QoS requirements. We showed that the use of two routes and
dynamically assigning the values of K and TB parameters based on the QoS requirements
were required to support multimedia communications in WMNs and MANETs. In addition to
that, we proposed a novel protocol to enhance Hello based link failure detection approach.
The routing process in MANETs is a challengeable task, because of the random movements
of MANET nodes. This is because the nodes' random movements cause the network
topology to change frequently, thus leading to frequent link failures. MANETs routing
protocol must catch more than one route, and select the most stable routes among the
available routes in order to make MANETs more resilience to the frequent link failures, to
provide reliable and stable communications, and to support multimedia communications.
Position-based routing protocols eliminate some of the topology-based routing protocols'
limitations, handle better the dynamic behaviour of MANET, and are more scalable. Based
on that, position-based routing protocols are more suitable to MANETs than topology-based
routing protocols. Three strategies are used for packets forwarding in position-based routing
protocols, which are greedy packet forwarding, restricted directional flooding, and
hierarchical routing. The most used strategy is greedy packet forwarding, because it is simple
and scalable. The above strategy forwards the packets to only one neighbor in the direction of
destination.
110
A novel adaptive greedy forwarding strategy was proposed in this thesis. Unlike other greedy
forwarding strategies, the forwarding region in the proposed strategy is not fixed and its size
is adaptive to the network node density. The above is because the connectivity of the network
depends on the node density. The objective of this strategy is to determine the forwarding
region size, which ensures one-way connectivity or two-ways connectivity. It was
mathematically shown in this thesis that the relationships between the forwarding region size
and both the node density and the transmission range are inverse relationships. It was also
shown that at moderate node density, it is sufficient to use much lower forwarding region
size compared to the sizes used in the literature to achieve one-way connectivity and two-
ways connectivity. For example, at node density equals to 0.001 m-2 and transmission ranges
that are greater than 100 m, the forwarding region sizes can be reduced by a factor of 5.24
and 3.34 for the one-way connectivity and the two-ways connectivity, respectively, compared
to the sizes usually used in literature.
MANETs are less reliable compared to other kind of telecommunication networks, because
of its lack of infrastructure and the random movements of nodes. Network node density
determines if the network is connected or not. In other words, the node density must be above
a certain threshold in order to ensure the network is connected, either one-way connected or
two-ways connected. This thesis proposed a probabilistic model to find such node density in
MANETs where the nodes are static with uniformly distributed or mobile with RWP
mobility model. In addition to that, we proposed some methods to increase the network node
density in case it is lower than the required node density. We proved in this thesis that the
node density must not be less than 8 (n ≥ 8) in order to ensure two-ways connectivity.
Besides that it was shown that the probability of the network is two-ways connected
exponentially increases with the node density till it reaches the saturation region where the
increase of node density has negligible improvements in terms of network connectivity, and
may has drawbacks by the additional interference they add to the network.
RECOMMENDATIONS
Fast and accurate link failure detections play a crucial role in maintaining WMNs and
MANETs performance and increasing the packet delivery ratio. The two major link failure
detection approaches are link layer feedback and Hello based link failure detection. Even
though the cross-layer using link layer feedback is faster in detecting link failures, Hello
based link failure detection approach is the most used approach. The above is because that
the link layer feedback approach frequently misinterprets transient transmission errors as
permanent transmission errors, and Hello based link failure detection approach is easier to
implement in MANETs and WMNs routing protocols, is link layer independent, and requires
less memory and power resources. Based on that, we recommend the use of Hello based link
failure detection approach to detect link failures.
The use of fixed values of K and TB as it is the case in traditional routing protocols does not
optimize the network performance in terms of packet delivery ratio, average end to end delay
and overhead. The Hello based link failure detection approach works well in WMNs with
low and medium link failure rates, and failed to work in WMNs with very high link failure
rates. This opens a new research direction, which is the proposing of a novel failure detection
approach that is suitable for WMNs and MANETs with higher link failure rates. Another
direction is the investigation of node mobility in the performance of Hello based link failure
detection approach.
This thesis proves that the use of two routes instead of one roughly increases the packet
delivery ratio by 1.5 times for the most sending rates. This increase allows WMNs and
MANETs support multimedia communications. It also shows that the need using two routes
instead of one is more urgent in WMNs and MANETs with higher link failure rates, i.e. less
reliable networks, in order to cover the frequent link failures. Thus, we recommend the use of
multi-route, at least two routes, and dynamically assigning the values of K and TB parameters
based on the QoS requirements in order to support multimedia communications over WMNs
and MANETs and increase the network reliability.

112
The node mobility in MANETs causes the network topology to frequently change, and
causes frequent link failures. This makes the routing process in MANET a challengeable task
and their network reliability lower than other kind of telecommunication networks. We
recommend that MANETs routing protocols catch at least two routes, and select the most
stable routes among the available routes in order to make them more resilience to the
changing network topology and the frequent link failures.
MANETs routing protocols are classified into two main categories that are topology-based
and position-based. Topology-based routing protocols consist of proactive, reactive, and
hybrid routing protocols, while position-based routing protocols consist of greedy packet
forwarding, restricted directional flooding and hierarchical routing. Since position-based
routing protocols eliminate some of the topology-based routing protocols limitations, handle
better the dynamic behavior of MANETs and are more scalable, we recommend the use of
position-based routing protocols. In particular, we recommend the use of greedy forwarding
strategy, because it is simple, more scalable and can be easily implemented.
This thesis proposes a novel adaptive greedy forwarding strategy. Unlike the other kinds of
greedy forwarding strategies, our strategy adapts the expected forwarding region based on
the node density to find the optimum area in order to reduce the hop count, reduce network
node spatial distribution, and minimize the switching from the simple greedy forwarding
strategy to the complex and costly face routing. Some interesting research directions for
future works are the study of the effects of the node mobility and the non-uniform node
distribution in our proposed forwarding strategy
Due to the lack of infrastructure and the nodes' random movements, MANETs are less
reliable compared to other kind of telecommunication networks. Thus, we recommend the
use of two routes, and the selection of the most stable and reliable routes among the available
routes in order to increase the network reliability. To ensure the existence of two routes
between any randomly chosen source and destination nodes, the node density must be above
113
a certain threshold. Based on that, the network designers should estimate the node density,
and if it is below the required density, they should try to increase it to the required value.
This thesis suggests two approaches that can be used to increase the node density to the target
density. The first approach is to add extra fixed nodes (wireless mesh routers) to the network,
and in this case the MANET is turn into a WMN. Because of the ease of implementation of
the mesh routers and their relatively low prices, this approach can be easily implemented
with an affordable cost. In addition, wireless mesh routers do not require wires to connect
them to the network, which further reduce the implementation cost of the first approach.
Another reason to recommend the use of the above approach is its adaptability, where we can
control the node density by adding or removing the wireless mesh routers. The other
approach is to encourage people to use the network or give the permission to use their
devices to relay the network traffic by giving them some incentives.
This thesis shows that the probability of having two routes rapidly increases when the node
density increases till it reaches the saturation region where the increase of the node density
has negligible improvements in terms of network availability, and may cause severe
degradation to the network performance due to the more interference it may add to the
network. The above opens a new research direction that is the joint study of the effects of the
node density increase on both the network performance and the network connectivity.
This thesis investigates the effects of nodes' movements according to only random waypoint
mobility model. Thus, another research direction for a future work is the investigation of the
effects of other node mobility models, like Gauss-Markov mobility model, on the network
connectivity.

LIST OF PUBLISHED PAPERS
Hayajna, T. &Kadoch, M. (2017b). Analysis and Enhancements of HELLO Based Link Failure Detection in Wireless Mesh Networks,” Telecommunication Systems Journal, 1-15. Retrieved from https://link.springer.com/article/10.1007%2Fs11235-017-0293-4 Hayajna, T., Kadoch, M., Badarneh, O. S. & Rong, B. (2017a). Adaptive Greedy Forwarding Strategy in Mobile Ad-hoc Networks Based on Node Density. Manuscript submitted for publication. Hayajna, T. & Kadoch, M. (2016, August). Hello-Based Link Failure Detection Analysis in Wireless Mesh Networks. Paper presented at IEEE 4th International Conference on Future Internet of Things and Cloud (FiCloud 2016), Vienna, Austria, (pp.201-206). Retrieved from http://ieeexplore.ieee.org/document/7575864/ Hayajna, T., Kadoch, M. & Rong, B. (in press). Ensuring Reliable and Stable Communications in Mobile Ad-hoc Networks. Paper presented at The 2017 IEEE 86th Vehicular Technology Conference (VTC2017-Fall), Toronto, ON, Canada. Hayajna, T. & Kadoch, M. (in press). Ensuring Two Routes Connectivity in Mobile Ad Hoc Networks with Random Waypoint Mobility Model. Paper presented at 2017 IFIP/IEEE International Symposium on Integrated Network Management (IM 2017), Lisbon, Portugal.


LIST OF BIBLIOGRAPHICAL REFERENCES
Aguayo, D., Bicket, J., Biswas, S., Judd, G. & Morris, R. (2004, August). Link-level measurements from an 802.11 b mesh network,” Paper presented at SIGCOMM '04 Proceedings of the 2004 conference on Applications, technologies, architectures, and protocols for computer communications, Portland, OR, (pp. 121–132). Retrieved from http://dl.acm.org/citation.cfm?id=1015482 Ahmadi, A., Shojafar, M., Hajeforosh, S., Dehghan, M. & Singhal, M. (2014). An efficient routing algorithm to preserve k-coverage in wireless sensor networks. The Journal of Supercomputing, 68(2), 599- 623. Retrieved from http://link.springer.com/article/10.1007/s11227-013-1054-0 Akyildiz, I.F., Wang, X. & Wang, W. (2005). Wireless mesh networks: a survey. Computer Networks Journal, 47(4), 445–487.Retrieved from http://dl.acm.org/citation.cfm?id=1071646 Al-Akaidi, M. & Alchaita, M. (2007), Link stability and mobility in ad hoc wireless networks. IET communications, 1(2), 173–178. Retrieved from http://ieeexplore.ieee.org/document/4167655/ Alicherry, M., Bhatia, R. & Li, L. E. (2005, August). Joint channel assignment and routing for throughput optimization in multi-radio wireless mesh networks. Paper presented at (ACM MobiCom '05) Proceedings of the 11th annual international conference on Mobile computing and networking, Cologne, Germany (pp. 58–72). Retrieved from http://dl.acm.org/citation.cfm?id=1080836 Alvi, A. N., Bouk, S. H., Ahmed, S. H., Yaqub, M. A., Sarkar, M. & Song, H. (2016). BEST-MAC: Bitmap-assisted efficient and scalable TDMA-Based WSN MAC protocol for smart cities. IEEE Access, 4, 312–322. Retrieved from http://ieeexplore.ieee.org/abstract/document/7373553/ An, B. & Papavassiliou, S. (2002). An Entropy-Based Model for Supporting and Evaluating Route Stability in Mobile Ad Hoc Wireless Networks. IEEE Communications Letters, 6(8), 328-330. Retrieved from http://ieeexplore.ieee.org/abstract/document/1025561/
118
Badarneh, O. & Kadoch, M. (2009). Multicast routing protocols in mobile ad hoc networks: A comparative survey and taxonomy. EURASIP J. Wireless Comm. and Networking, 1–42. Retrieved from http://dl.acm.org/citation.cfm?id=1702299 Bellur, B. & and Ogier, R. G. (1999, March). A reliable, efficient topology broadcast protocol for dynamic networks. INFOCOM '99. Eighteenth Annual Joint Conference of the IEEE Computer and Communications Societies, 1, 178–186. Retrieved from http://ieeexplore.ieee.org/document/749266/ Bettstetter, C. & Wagner, C. (2002, March). The Spatial Node Distribution of the Random Waypoint Model. Paper presented at The First German Workshop Mobile Ad Hoc Networks (WMAN 2002). Retrieved from https://pdfs.semanticscholar.org/2554/5c707a4cd70edb0df7680981cbefdcd83098.pdf Bettstetter, C., Resta, G. & Santi, P. (2003). The node distribution of the random waypoint mobility model for wireless ad hoc networks. IEEE Transactions on Mobile Computing, 2(3), 257–269. Retrieved from http://ieeexplore.ieee.org/document/1233531/ Bicket, J. C. (2005). Bit-rate selection in wireless networks. (Master’s thesis, Massachusetts Institute of Technology, Cambridge, MA). Retrieved from https://www.cse.iitb.ac.in/~mythili/teaching/cs653_spring2014/references/samplerate. pdf Brar, G. S., Rani, S., Chopra, V., Malhotra, R., Song, H. & Ahmed, S. H. (2016). Energy Efficient Direction-Based PDORP Routing Protocol for WSN. IEEE Access, 4, 3182- 3194. Retrieved from http://ieeexplore.ieee.org/document/7484723/ Brzezinski, A., Zussman, G. & Modiano, E. (2006, September). Enabling distributed throughput maximization in wireless mesh networks: A partitioning approach. Paper presented at ACM MobiCom '06 Proceedings of the 12th annual international conference on mobile computing and networking, Los Angeles, CA, (pp.26–37). Retrieved from http://dl.acm.org/citation.cfm?id=1161094 Cadger, F., Curran, K., Santos, J. & Moffett, S. (2013). A survey of geographical routing in wireless ad-hoc networks,” IEEE Communications Surveys & Tutorials, 15(2), 621- 653. Retrieved from http://ieeexplore.ieee.org/document/6238283/?tp=&arnumber=6238283
119
Chakeres, I. D. & and Belding-Royer, E. M. (2002, October). The utility of hello messages for determining link connectivity. Paper presented at The 5th International Symposium on Wireless Personal Multimedia Communications, (pp. 504–508). Retrieved from http://ieeexplore.ieee.org/document/1088225/ Chakeres, I., Dong, H., Belding-Royer, E., Gersho, A. & Gibson, J. (2004, August). Allowing errors in speech over wireless LANs. Paper presented at the 4th Workshop on Applications and Services in Wireless Networks (ASWN 2004), Boston, MA. Retrieved from http://ieeexplore.ieee.org/document/1437505/ Chen, W., Toueg, S. & Aguilera, M. K. (2002). On the Quality of Service of Failure Detectors. IEEE Transactions on Computers, 51(1), 13–32. Retrieved from http://ieeexplore.ieee.org/document/980014/ Chen, Q., Kanhere, S. & Hassan, M. (2013). Adaptive Position Update for Geographic Routing in Mobile Ad Hoc Networks. IEEE Transactions on Mobile Computing, 12(3), 489-501. Retrieved from http://ieeexplore.ieee.org/document/6133285/ De, S. (2005). On hop count and euclidean distance in greedy forwarding in wireless ad hoc networks. IEEE Communications Letters, 9(11), 1000-1002. Retrieved from http://ieeexplore.ieee.org/document/1524592/ De, S., Caruso, A., Chaira, T. & Chessa, S. (2006). Bounds on hop distance in greedy routing approach in wireless ad hoc networks. International Journal of Wireless and Mobile Computing, 1(2), 131–140. Retrieved from https://www.researchgate.net/publication/220141202_Bounds_on_hop_distance_in_g reedy_routing_approach_in_wireless_ad_hoc_networks Dube, R., Raia, C., Wang, K. Y. & Tripathi, S. K. (1997). Signal stability based adaptive routing (SSA) for ad hoc mobile networks. IEEE Personal Communications, 4 (1), 36-45. Retrieved from http://ieeexplore.ieee.org/document/575990/ Dung, L.T. & An, B. (2013, December). The analysis of route availability and route stability in mobile ad-hoc wireless networks. Paper presented at Ubiquitous Intelligence and Computing, 2013 IEEE 10th International Conference on and 10th International Conference on Autonomic and Trusted Computing (UIC/ATC), TBD, Italy, (pp. 607– 612). Retrieved from http://ieeexplore.ieee.org/abstract/document/6726267/
120
Egeland, G. & Engelstad, P. E. (2009). The Availability and Reliability of Wireless Multi- Hop Networks with Stochastic Link Failures. IEEE JOURNAL ON SELECTED AREAS IN COMMUNICATIONS, 27(7), 1132-1146. Retrieved from http://ieeexplore.ieee.org/document/5226965/ Giruka, V. C. & Singhal, M. (2005, June). Hello protocols for ad-hoc networks: Overhead and accuracy tradeoffs. Paper presented at IEEE WOWMOM 2005 World of Wireless Mobile and Multimedia Networks. Retrieved from http://ieeexplore.ieee.org/document/1443522/ Goff, T., Abu-Ghazaleh, N., Phatak, D. & Kahvecioglu, R. (2001). Preemptive Routing in Ad Hoc Networks. Paper presented at MobiCom '01 Proceedings of the 7th annual international conference on Mobile computing and networking, (pp. 43-52). Retrieved from http://dl.acm.org/citation.cfm?id=381682 Gomez, C., Catalan, M., Mantecon, X., Paradells, J. & and Calveras, A. (2005a, September). Evaluating Performance of Real Ad-hoc Networks Using AODV with Hello Message Mechanism for Maintaining Local Connectivity. Paper presented at IEEE PIMRC 2005 Personal, Indoor and Mobile Radio Communications. Retrieved from http://ieeexplore.ieee.org/document/1651656/ Gomez, C., Marchador, X., Gonzalez, V. & Paradells, J. (2005b, September). Multilayer Analysis of The Influence of Mobility Models on TCP Flows in AODV ad-hoc networks. Paper presented at The 14th IEEE Workshop on Local and Metropolitan Area Networks (LANMAN 2005), Chania Crete, Greece, (pp. 1-6). Retrieved from http://ieeexplore.ieee.org/document/1541517/ Gomez, C., Cuevas, A. & Paradells, J. (2006, May). AHR: A two-state adaptive mechanism for link connectivity maintenance in AODV. Paper presented at REALMAN '06 Proceedings of the 2nd international workshop on Multi-hop ad hoc networks: from theory to reality, Florence, Italy. Retrieved from http://dl.acm.org/citation.cfm?id=1133001 Guo, S., Yang, O. & Shu, Y. (2005). Improving source routing reliability in mobile ad hoc networks. IEEE Transactions on Parallel and Distributed Systems 16 (4), 362–373. Retrieved from http://ieeexplore.ieee.org/document/1401879/
121
Hayajna, T. & Kadoch, M. (2016, August). Hello-Based Link Failure Detection Analysis in Wireless Mesh Networks. Paper presented at IEEE 4th International Conference on Future Internet of Things and Cloud (FiCloud 2016), Vienna, Austria, (pp.201-206). Retrieved from http://ieeexplore.ieee.org/document/7575864/ Hayajna, T., Kadoch, M., Badarneh, O. S. & Rong, B. (2017a). Adaptive Greedy Forwarding Strategy in Mobile Ad-hoc Networks Based on Node Density. Manuscript submitted for publication. Hayajna, T. & Kadoch, M. (2017b). Analysis and Enhancements of HELLO Based Link Failure Detection in Wireless Mesh Networks,” Telecommunication Systems Journal, 1-15. Retrieved from https://link.springer.com/article/10.1007%2Fs11235-017-0293-4 Hayajna, T., Kadoch, M. & Rong, B. (in press). Ensuring Reliable and Stable Communications in Mobile Ad-hoc Networks. Paper presented at The 2017 IEEE 86th Vehicular Technology Conference (VTC2017-Fall), Toronto, ON, Canada. Hayajna, T. & Kadoch, M. (in press). Ensuring Two Routes Connectivity in Mobile Ad Hoc Networks with Random Waypoint Mobility Model. Paper presented at 2017 IFIP/IEEE International Symposium on Integrated Network Management (IM 2017), Lisbon, Portugal. Henry, J. (2011). 802.11s Mesh Networking. (Whitepaper). Retrieved from https://www.cwnp.com/uploads/802-11s_mesh_networking_v1-0.pdf Herms, A., Lukas, G. & Ivanov, S. (2006). Realism in design and evaluation of wireless routing protocols. Paper presented at Proceedings of First international Workshop on Mobile Services and Personalized Environments (MSPE’06). Retrieved from http://citeseerx.ist.psu.edu/viewdoc/citations;jsessionid=33CF7266A3213C6EAD7D6 D4FC3E1CA65?doi=10.1.1.452.3209 Hou, T. & Li, V. (1986). Transmission Range Control in Multihop Packet Radio Networks. IEEE Transactions on Communications., 34(1), 38–44. Retrieved from http://ieeexplore.ieee.org/document/1096436/

122
Ingelrest, F., Mitton, M. & Simplot-Ryl, D. (2007, October). A turnover based adaptive hello protocol for mobile ad hoc and sensor networks. Paper presented at IEEE 15th International Symposium on Modeling, Analysis, and Simulation of Computer and Telecommunication Systems (MASCOTS '07), (pp. 9–14). Retrieved from http://ieeexplore.ieee.org/document/4674390/ Jiang, S., He, D. & Rao, J. (2001, April). A Prediction-based Link Availability Estimation for Mobile Ad Hoc Networks. IEEE INFOCOM, 3, 1745-1752. Retrieved from http://ieeexplore.ieee.org/document/916672/ Jiang, S., He, D. & Rao, J. (2005). A Prediction-Based Link Availability Estimation for Routing Metrics in MANETs. IEEE/ACM Transactions on Networking, 13(6),1302-1312. Retrieved from http://ieeexplore.ieee.org/document/1561225/ Jiang, D., Nie, L., Lv, Z. & song , H. (2016). Spatio-temporal Kronecker compressive sensing for traffic matrix recovery. IEEE Access, 4, 3046- 3053. Retrieved from http://ieeexplore.ieee.org/document/7479445/ Karp, B. & Kung, H.T. (2000, August). GPSR: Greedy perimeter stateless routing for wireless networks. Paper presented at the 6th Annual International Conference on Mobile Computing and Networking (MobiCom 2000). Retrieved from http://www.eecs.harvard.edu/~htk/publication/2000-mobi-karp-kung.pdf Kim, K. H. & Shin, K. G. (2009). On Accurate and Asymmetry-Aware Measurement of Link Quality in Wireless Mesh Networks. IEEE/ACM Transactions on Networking, 17(4), 1172–1185. Retrieved from http://dl.acm.org/citation.cfm?id=1618575 Kim, K. H. & Shin, K. G. (2011). Self-reconfigurable wireless mesh networks. IEEE/ACM Transactions on Networking, 19(2), 393–404. Retrieved from http://ieeexplore.ieee.org/document/5678602/ Klemm, F., Ye, Z., Krishnamurthy, S. V. & Tripathi, S. K. (2005). Improving TCP Performance in Ad Hoc Networks Using Signal Strength Based Link Management. Ad Hoc Networks, 3(2), 175–191. Retrieved from https://infoscience.epfl.ch/record/55740

123
Kuang, X., Zhang, H., Zhao, S. & McGuffin, M. J. (2012), Tracing tuples across dimensions: A comparison of scatterplots and parallel coordinate plots. Computer Graphics Forum, 31(3pt4), 1365-1374. Retrieved from http://onlinelibrary.wiley.com/doi/10.1111/j.1467-8659.2012.03129.x/abstract Kuo, J. & Liao, W. (2005, May). Modeling the behaviour of flooding on target location discovery in mobile ad hoc networks. Paper presented at IEEE International Conference on Communications (ICC 2005), Seoul, Korea, (pp. 3015-3019). Retrieved from http://ieeexplore.ieee.org/document/1494944/ La, R. L. & Han, Y. (2007). Distribution of path durations in mobile ad hoc networks and path selection. IEEE/ACM Transactions on Networking, 15 (5), 993-1006. Retrieved from http://ieeexplore.ieee.org/document/4346547/ Lai, W. K., Hsiao, S. &Lin, Y. (2007). Adaptive backup routing for ad-hoc networks, Computer Communications, 30(2), 453–464. Retrieved from http://dl.acm.org/citation.cfm?id=1223565 Lindhorst, T., Lukas, G. & Nett, E. (2010, July). Modeling fast link failure detection for dependable wireless mesh networks. Paper presented at IEEE International Symposium on Network Computing and Applications (NCA), (pp. 44–51). Retrieved from http://ieeexplore.ieee.org/document/5598231/ Marcus, M.J. (2005, November). Real time spectrum markets and interruptible spectrum: New concepts of spectrum use enabled by cognitive radio. Paper presented at New Frontiers in Dynamic Spectrum Access Networks (IEEE DySPAN 2005), Baltimore, MD, (pp. 512–517). Retrieved from http://ieeexplore.ieee.org/document/1542664/ Mauve, M., Widmer, J. & Hartenstein, H. (2001). A survey on position based routing in mobile ad hoc networks. IEEE Network Magazine, 15(6), 30-39. Retrieved from http://ieeexplore.ieee.org/document/967595/ McDonald, A. B. & Znati, T. F. (1999a). A mobility-based framework for adaptive clustering in wireless ad hoc networks. IEEE JOURNAL ON SELECTED AREAS IN COMMUNICATIONS, 17 (8), 1466–1487. Retrieved from http://ieeexplore.ieee.org/document/780353/

124
McDonald, A. B. &. Znati, T. (1999b, September). A path availability model for wireless ad hoc networks. Paper presented at Wireless Communications and Networking Conference (WCNC), (pp. 35–40). Retrieved from http://ieeexplore.ieee.org/document/797781/ Minh, Q.T., Nguyen, K. & Yamada, S. (2013, July). DRANs: Resilient Disaster Recovery Access Networks. Paper presented at IEEE 37th Annual Computer Software and Applications Conference Workshops (COMPSACW), Tokyo, Japan, (pp. 754-759). Retrieved from http://ieeexplore.ieee.org/document/6605884/ Moussaoui, A., Semchedine, F. & Boukerrama, A. (2014). A link-state QoS routing protocol based on link stability for Mobile Ad hoc Networks. Journal of Network and Computer Applications, 39, 117-125. Retrieved from http://www.sciencedirect.com/science/article/pii/S1084804513001422 Moussaoui, A. & Boukeream, A. (2015). A survey of routing protocols based on link- stability in mobile ad hoc networks. Journal of Network and Computer Applications, 47, 1-10. Retrieved from http://www.sciencedirect.com/science/article/pii/S1084804514002148 Murthy, C.S. & Manoj, B.S. (2012). Ad Hoc Wireless Networks: Architectures and Protocols. Upper Saddle River, NJ: Prentice Hall. Namuduri, K. & Pendse, R. (2012). Analytical Estimation of Path Duration in Mobile Ad Hoc Networks. IEEE Sensors Journal, 12(6), 1828-1835. Retrieved from http://ieeexplore.ieee.org/document/6095311/ Narendran, B., Agrawal, P. & Anvekar, D. K. (1994, November). Minimizing cellular handover failures without channel utilization loss. Paper presented at Global Telecommunications Conference (GLOBECOM '94), San Francisco, CA, (pp. 1679– 1685). Retrieved from http://ieeexplore.ieee.org/document/513161/ Pandey, M., Pack, R. Wang, L., Duan, Q. & Zappala, D. (2007, May). To Repair or Not To Repair: Helping Ad Hoc Routing Protocols to Distinguish Mobility from Congestion. Paper presented at 26th IEEE International Conference on Computer Communications (INFOCOM). Retrieved from http://ieeexplore.ieee.org/document/4215853/
125
Pascoe-Chalke, M., Gomez, J., Rangel, V. & Lopez-Guerrero, M. (2010). Route duration modeling for mobile ad-hoc networks. Wireless Netw., 16(3), 743–757. Retrieved from http://link.springer.com/article/10.1007/s11276-009-0166-1 Pendke, K. & Nimbhorkar, S.U. (2012). Study of Various Schemes for Link Recovery in Wireless Mesh Network. IJANS , International Journal on AdHoc Networking Systems, 2(4), 51-56. Retrieved from http://airccse.org/journal/ijans/papers/2412ijans05.pdf
Qin, L. & Kunz, T. (2003, January). Increasing packet delivery ratio in DSR by link prediction. Paper presented at IEEE Hawaii International Conference on System Sciences (HICSS’03). Retrieved from http://ieeexplore.ieee.org/document/1174846/ Ramachandran, K.N., Belding-Royer, E. M. & Buddhikot, M. M. (2006, April). Interference- aware channel assignment in multi-radio wireless mesh networks. Paper presented at INFOCOM 2006. 25th IEEE International Conference on Computer Communications, Barcelona, Spain. Retrieved from http://ieeexplore.ieee.org/document/4146830/ Ramakrishnan, R. Ram, N. S. & Alheyasat, O.A. (2012, April). A Cost Aware Reconfiguration Technique for Recovery in Wireless Mesh Networks” Paper presented at Recent Trends In Information Technology (ICRTIT), (pp. 302-307). Retrieved from http://ieeexplore.ieee.org/abstract/document/6206757/ Raniwala, A. & Chiueh, T. ( 2005, March). Architecture and algorithms for an IEEE 802.11- based multi-channel wireless mesh network. INFOCOM 2005. 24th Annual Joint Conference of the IEEE Computer and Communications Societies (INFOCOM),4, 2223–2234. Retrieved from http://ieeexplore.ieee.org/document/1498497/ Rappaport, T. S. (2002). Wireless Communications: Principles and Practice. Englewood Cliffs, NJ: Prentice-Hall. Reddy, L. R. & Raghavan, S.V. (2007). SMORT: scalable multipath on demand routing for mobile ad hoc networks. Ad Hoc Networks, 5(2), 162–188. Retrieved from http://www.sciencedirect.com/science/article/pii/S1570870505000983 Roy, R. R. (2011). Random Walk Mobility. In S. Lagerstrom-Fife (Ed.), Handbook of Mobile Ad-hoc networks for Mobility Models (pp. 35-65). DOI: 10.1007/978-1-4419- 6050-4

126
Santalo, L.A. (1976). Integral Geometry and Geometric Probability (2nd ed.). New York, NY: Addison-Wesley. Sarkar, S.K., Basavaraju, T. G. & Puttamadappa, C. (2008). Ad Hoc Mobile Wireless Networks: Principles, Protocols, and Applications. Boca Raton, FL: Auerbach Publications, Taylor & Francis Group. Sattiraju, R. & Schotten, H. D. (2014, May), Reliability Modeling, Analysis and Prediction of Wireless Mobile Communications. Paper presented at Vehicular Technology Conference (VTC Spring), Seoul, Korea. Retrieved from http://ieeexplore.ieee.org/document/7023170/ Shojafar M., Pooranian Z., Shojafar M., Abraham A. (2014). LLLA: New Efficient Channel Assignment Method in Wireless Mesh Networks. Paper presented at Abraham A., Krömer P., Snášel V. (eds) Innovations in Bio-inspired Computing and Applications. Advances in Intelligent Systems and Computing, vol 237. Springer, Cham. Retrieved from http://link.springer.com/chapter/10.1007/978-3-319-01781-5_14 Shojafar, M., Abolfazli, S., Mostafaei, H. & and Singhal, M. (2015). Improving channel assignment in multi-radio wireless mesh networks with learning automata. Wireless Pers Commun, 82(1), 61–80. Retrieved from http://link.springer.com/article/10.1007/s11277-014-2194-0 Shooman, M. L. (2002). Reliability of Computer Systems and Networks: Fault Tolerance, Analysis, and Design. New York, NY: John Wiley & Sons. Su, W. & Gerla, M. (1999, December). IPv6 flow handoff in ad hoc wireless networks using mobility predication. Paper presented at Global Telecommunications Conference (GLOBECOM '99), Rio De Janeiro, Brazil, (pp. 271–275). Retrieved from http://ieeexplore.ieee.org/document/831647/ Szigeti, T. & Hattingh, C. (2004). End-to-End QoS Network Design: Quality of Service in LANs, WANs, and VPNs. Cisco Press, Part of the Networking Technology series. Retrieved from http://www.ciscopress.com/articles/article.asp?p=357102&seqNum=2/

127
Takagi, H. & Kleinrock, L. (1984). Optimal transmission ranges for randomly distributed packet radio terminals. IEEE Transactions on Communications., 32(3), 246–257. Retrieved from http://ieeexplore.ieee.org/document/1096061/ Tschudin, C., Gunningberg, P., Lundgren, H. & Nordstrom, E. (2005). Lessons from experimental manet research. Ad Hoc Networks, 3(2), 221–233. Retrieved from http://www.sciencedirect.com/science/article/pii/S1570870504000605?np=y&npKey =672ea3eedad2798c018ece7694913f88a9146259a359e4f7c988205fadac4d74
Valarmathi, K. & Malmurugan, N. (2011, December). Multi Path Routing Protocol for Improving Reliability in IEEE 802.16 Wireless Mesh Networks. Paper presented at Trendz in Information Sciences and Computing (TISC), (pp 116-121). Retrieved from http://ieeexplore.ieee.org/document/6169096/?section=abstract Valera, A.C., Seah, W.K.G. & Rao S.V. (2005). Improving protocol robustness in ad hoc networks through cooperative packet caching and shortest multipath routing. IEEE Transactions on Mobile Computing, 4 (5), 443–457. Retrieved from http://ieeexplore.ieee.org/document/1492358/ Valera, A. & Tan, H. (2012, September). Analysis of Hello-based link failure detection in wireless ad hoc networks. Paper presented at Personal Indoor and Mobile Radio Communications (PIMRC), (pp. 669- 674). Retrieved from http://ieeexplore.ieee.org/document/6362868/ Velayos, H. & Karlsson, G. (2004, June). Techniques to reduce the IEEE 802.11b handoff time. Paper presented at Proceedings IEEE International Conference on Communications. Retrieved from http://ieeexplore.ieee.org/document/1313272/ Wu, Y., Liao, W., Tsao, C. & Lin, T. (2009). Impact of Node Mobility on Link Duration in Multihop Mobile Networks. IEEE Transactions on Vehicular Technology, 58(5), 2435-2442. Retrieved from http://ieeexplore.ieee.org/abstract/document/4663887/ Yang, W., Yang, X., Yang, S. & Yang, D. (2011). A greedy-based stable multipath routing protocol in mobile ad hoc networks. Ad Hoc Networks, 9(4), 662–674. Retrieved from http://www.sciencedirect.com/science/article/pii/S1570870510001447
128
Yoon, J., Liu, M. & Noble, B. (2003, April). Random Waypoint Considered Harmful. Paper presented at Twenty-Second Annual Joint Conference of the IEEE Computer and Communications (INFOCOM 2003), San Francisco, CA. Retrieved from http://ieeexplore.ieee.org/document/1208967/ Younes, O. & Thomas, N. (2011, September). Analysis of the Expected Number of Hops in Mobile Ad Hoc Networks with Random Waypoint Mobility. Paper presented at Electronic Notes in Theoretical Computer Science, Fifth International Workshop on the Practical Application of Stochastic Modelling (PASM), 275, (pp. 143-158). Retrieved from http://www.sciencedirect.com/science/article/pii/S1571066111001010 Zadin, A. & Fevens, T. (2013, May). Stable connections using multi-paths and conservative neighborhood ranges in mobile ad hoc networks. Paper presented at 26th Annual IEEE Canadian Conference on Electrical and Computer Engineering (CCECE). Retrieved from http://ieeexplore.ieee.org/document/6567748/ Zadin, A. & Fevens, T. (2014, May). Effect of HELLO Interval Duration on Stable Routing for Mobile Ad Hoc Networks. Paper presented at IEEE 27th Canadian Conference on Electrical and Computer Engineering (CCECE 2014), Toronto, ON, (pp. 1-6). Retrieved from http://ieeexplore.ieee.org/document/6901012/ Zadin, A., Fevens, T. & Bdiri, T. (2016). Impact of Varying Node Velocity and HELLO Interval Duration on Position-Based Stable Routing in Mobile Ad Hoc Networks. Paper presented at The 11th International Conference on Future Networks and Communications (FNC-2016), (pp. 353-358). Retrieved from http://www.sciencedirect.com/science/article/pii/S1877050916318038 IETF Organization. (2003). Optimized Link State Routing Protocol (OLSR). RFC 3626. Retrieved from https://www.ietf.org/rfc/rfc3626.txt IETF Organization. (2003). Ad hoc On-Demand Distance Vector (AODV) Routing. RFC 3561. Retrieved from https://www.ietf.org/rfc/rfc3561.txt