linguistic differences in mother tongue reading performance in … · 2018-04-07 · linguistic...
TRANSCRIPT

Linguistic differences in Mother Tongue Reading Performance in Uganda
Rachel JordanRTI International
CIES 2018

• Role of linguistic differences on program impacts
• Challenges of program implementation in 12 local languages

Language in Uganda
• Over 40 officially recognized languages
• 1993 Local Language Policy
• 2007 Thematic Curriculum
BANTU
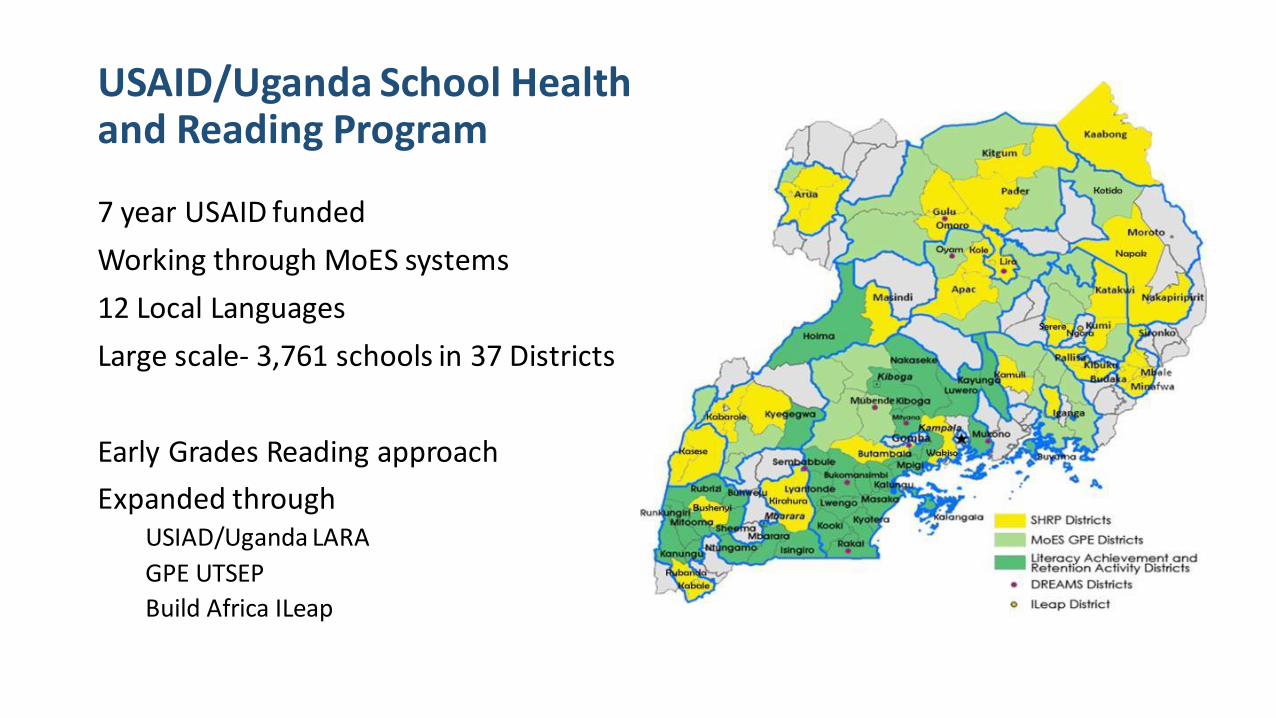
7 year USAID funded
Working through MoES systems
12 Local Languages
Large scale- 3,761 schools in 37 Districts
Early Grades Reading approach
Expanded throughUSIAD/Uganda LARA
GPE UTSEP
Build Africa ILeap
USAID/Uganda School Healthand Reading Program

5
Systems and policies are
strengthened
P1 to P4 pupil books and
teacher guides
Teachers trained and supported
Advocacy for local language
literacy instruction
Rigorous assessment of foundational reading skills
Learners read more fluently
and understand more of what
they are reading in both local language and
English
USAID/Uganda School Health and Reading Program
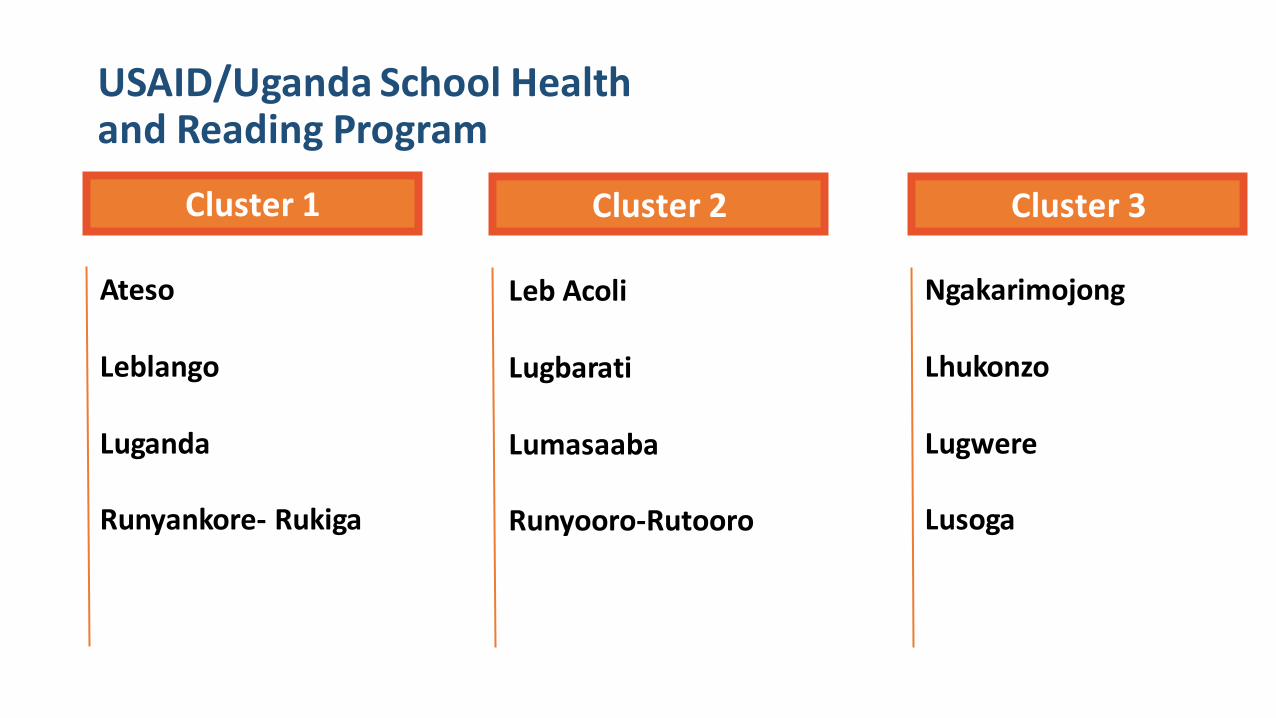
Cluster 1
USAID/Uganda School Healthand Reading Program
Cluster 2 Cluster 3
Ateso
Leblango
Luganda
Runyankore- Rukiga
Leb Acoli
Lugbarati
Lumasaaba
Runyooro-Rutooro
Ngakarimojong
Lhukonzo
Lugwere
Lusoga

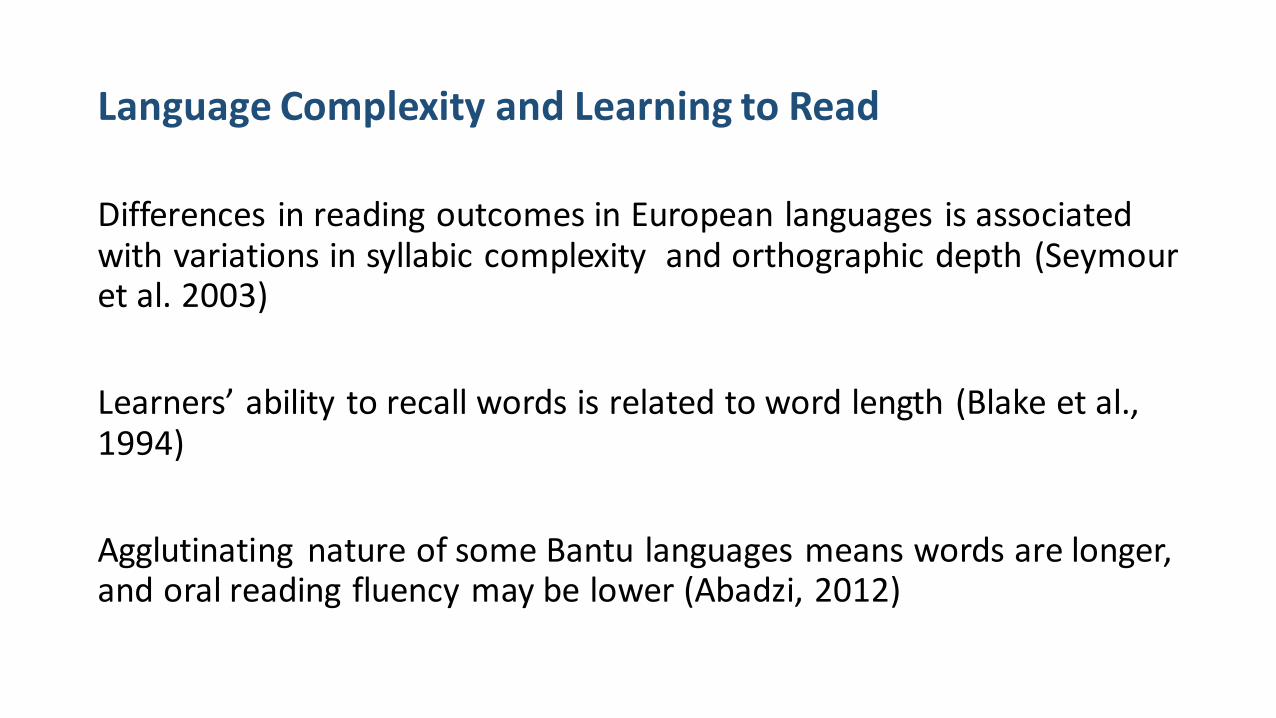
Language Complexity and Learning to Read
Differences in reading outcomes in European languages is associated with variations in syllabic complexity and orthographic depth (Seymour et al. 2003)
Learners’ ability to recall words is related to word length (Blake et al., 1994)
Agglutinating nature of some Bantu languages means words are longer, and oral reading fluency may be lower (Abadzi, 2012)

Language Complexity in UgandaLanguage Language
FamilyAverage Word
LengthTonal Markings? # of non-Latin
lettersComparative rank of language complexity
Acoli Nilotic 3.6 Mark tone 6 High
Ateso Nilotic 5.5 Mark tone 7 High
Leblango Nilotic 3.8 Mark tone 18 High
Lhukonzo Bantu 8.3 16 High
Luganda Bantu 6.4 2 Low
Lugbarati Sudanic 4.2 Mark tone 21 High
Lugwere Bantu 7.1 6 Low
Lumasaaba Bantu 6.0 10 Med
Lusoga Bantu 7.0 11 Med
Ngakarimojong Nilotic 4.8 6 High
Runyankore-Rukiga Bantu 6.9 0 Low
Runyoro-Rutooro Bantu 6.3 8 Med
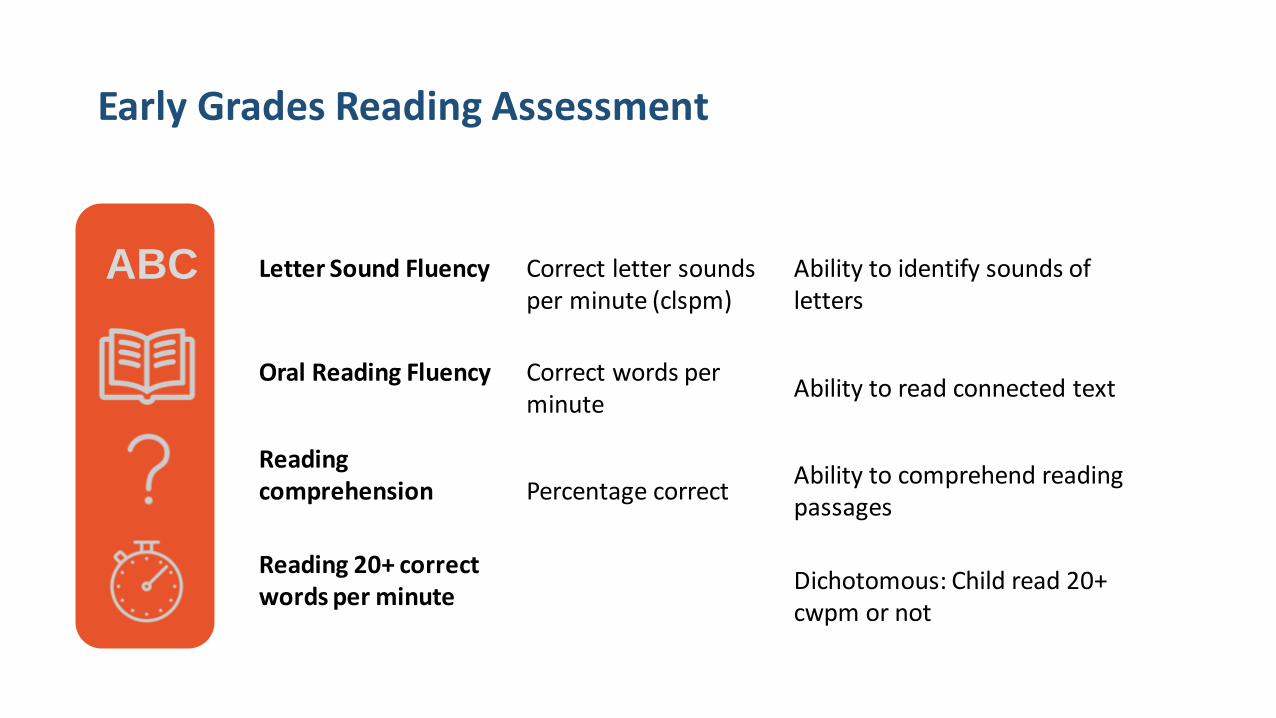
Early Grades Reading Assessment
Subtask & Measure What is measured
Letter Sound Fluency Correct letter sounds per minute (clspm)
Ability to identify sounds of letters
Oral Reading Fluency Correct words per minute
Ability to read connected text
Reading comprehension Percentage correct
Ability to comprehend reading passages
Reading 20+ correct words per minute
Dichotomous: Child read 20+ cwpm or not
ABC

Early Grades Reading Assessment
Schools sampled at Coordinating Centre level
14 treatment/ 14 control
30 P1-P4 pupils randomly sampled (alpha cohort)
Boys and Girls equally represented
1 on 1 oral assessment
Approx. 15 minutes per language 11
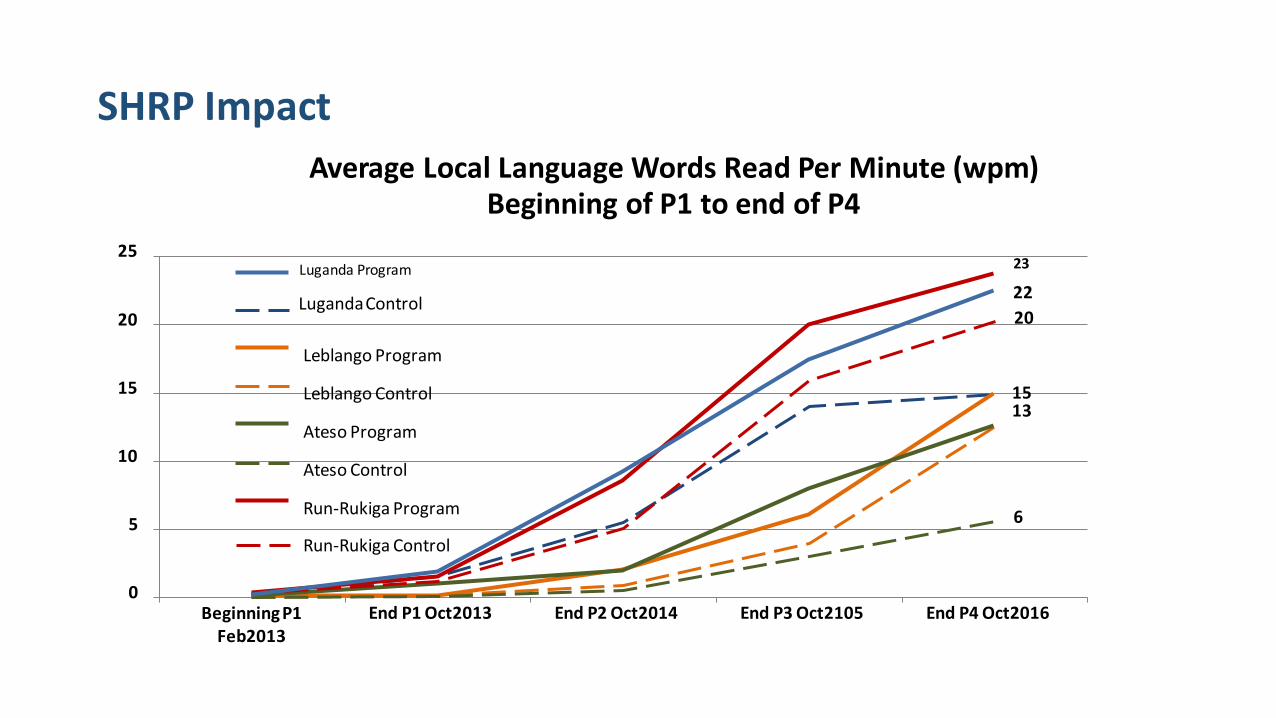
SHRP Impact
25
Average Local Language Words Read Per Minute (wpm)Beginning of P1 to end of P4
20LugandaControl
22
Leblango Program
15 Leblango Control
Ateso Program
1513
10Ateso Control
Run-Rukiga Program5
Run-Rukiga Control
6
0BeginningP1
Feb2013End P1 Oct2013 End P2 Oct2014 End P3 Oct2105 End P4 Oct2016
Luganda Program 23
20
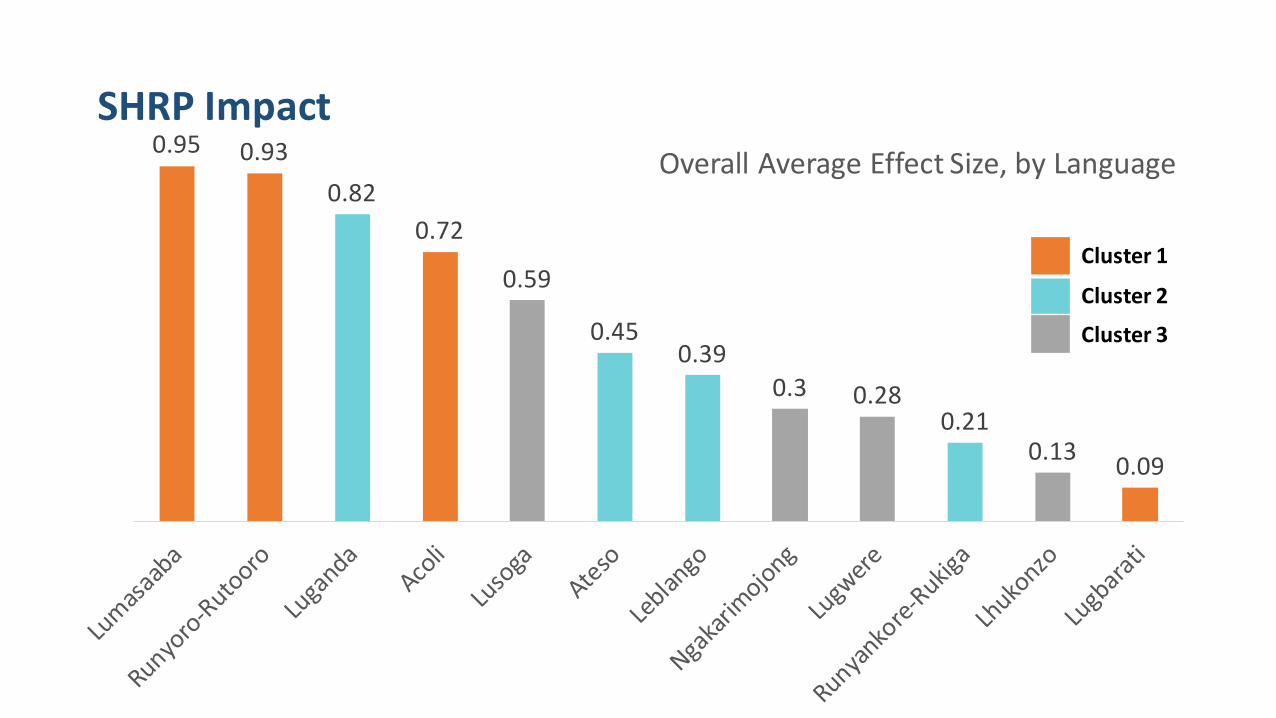
SHRP Impact0.95 0.93
0.82
0.72
0.59
0.450.39
0.3 0.280.21
0.130.09
Overall Average Effect Size, by Language
Cluster 1
Cluster 2
Cluster 3
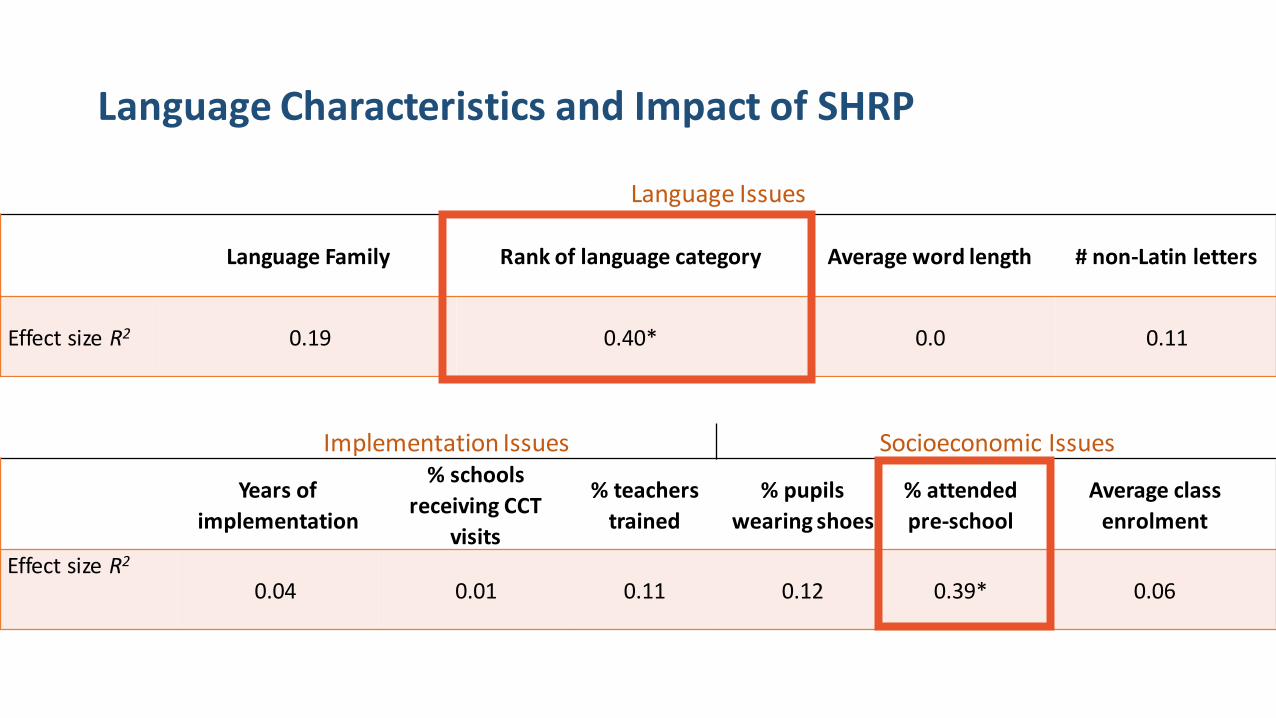
Language Characteristics and Impact of SHRP
Language Issues
Language Family Rank of language category Average word length # non-Latin letters
Effect size R2 0.19 0.40* 0.0 0.11
Implementation Issues Socioeconomic Issues
Years of
implementation
% schools
receiving CCT
visits
% teachers
trained
% pupils
wearing shoes
% attended
pre-school
Average class
enrolment
Effect size R2
0.04 0.01 0.11 0.12 0.39* 0.06

Language Issues Implementation Issues Socioeconomic Issues
Effect size R2 0.71 0.23 0.41
Language Characteristics and Impact of SHRP

Implementation
“Calvin and Hobbes” by Bill Watterson
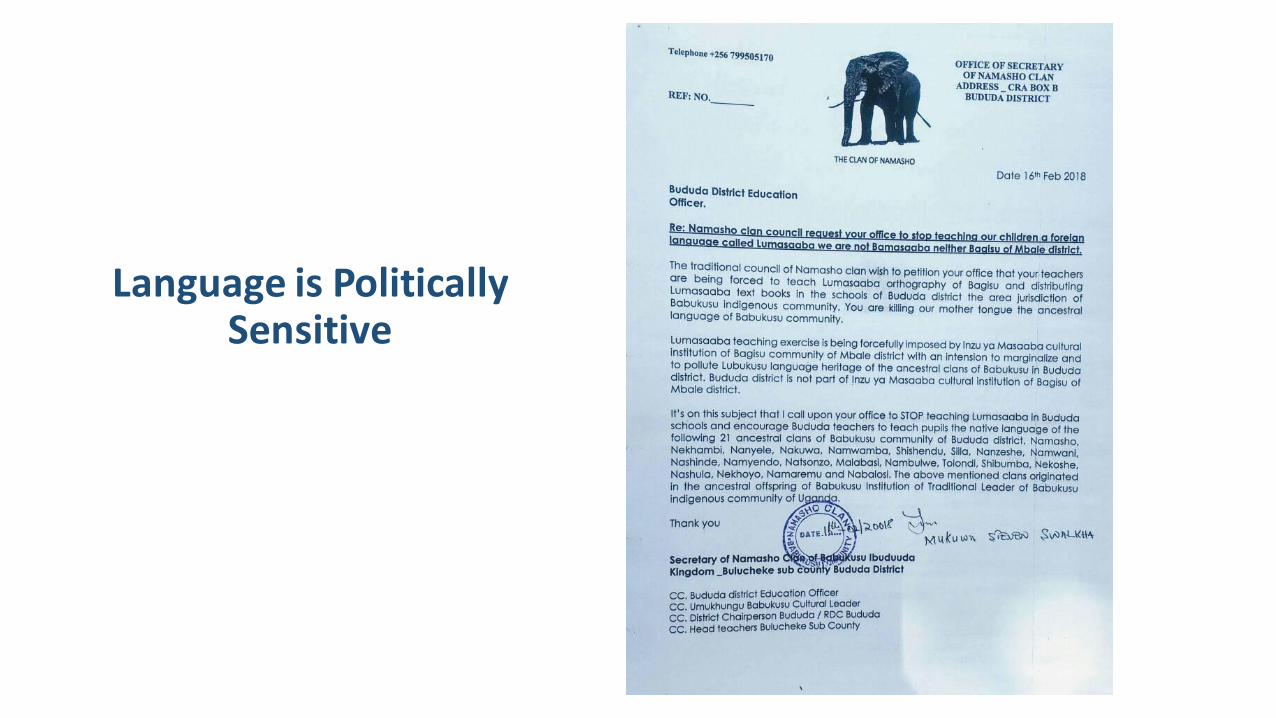
Language is Politically Sensitive
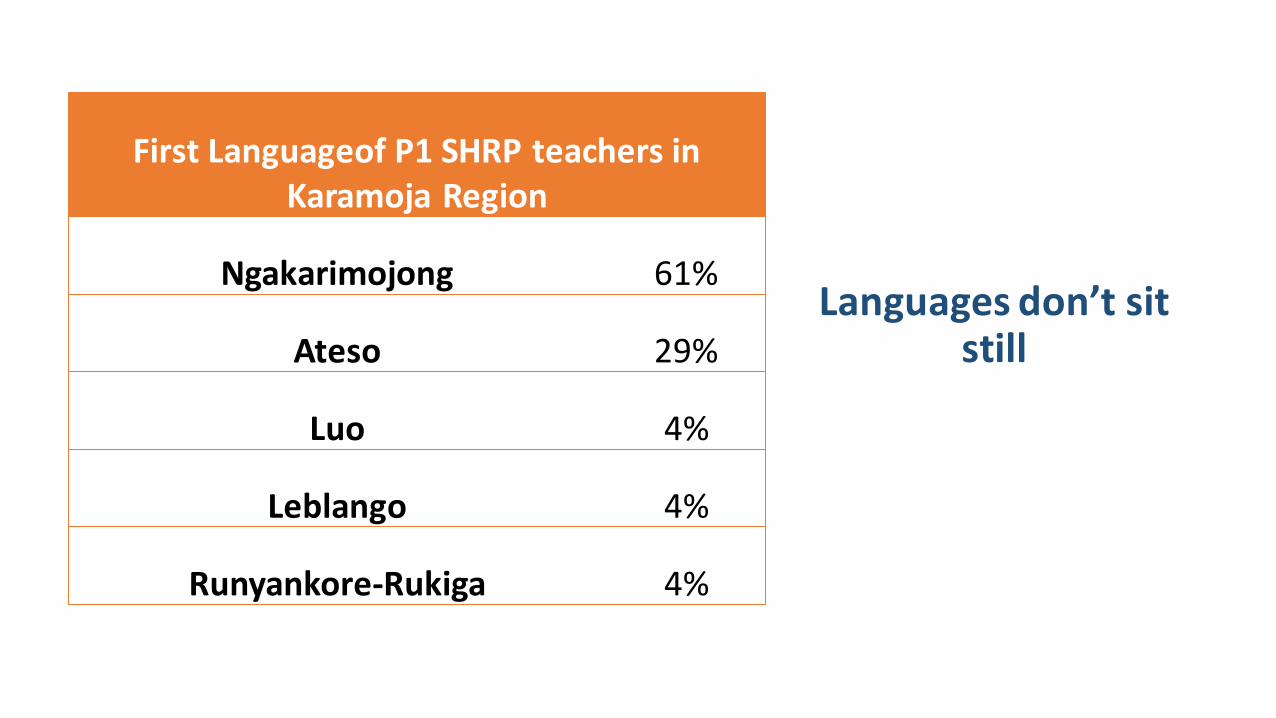
Languages don’t sit still
First Languageof P1 SHRP teachers in Karamoja Region
Ngakarimojong 61%
Ateso 29%
Luo 4%
Leblango 4%
Runyankore-Rukiga 4%
19
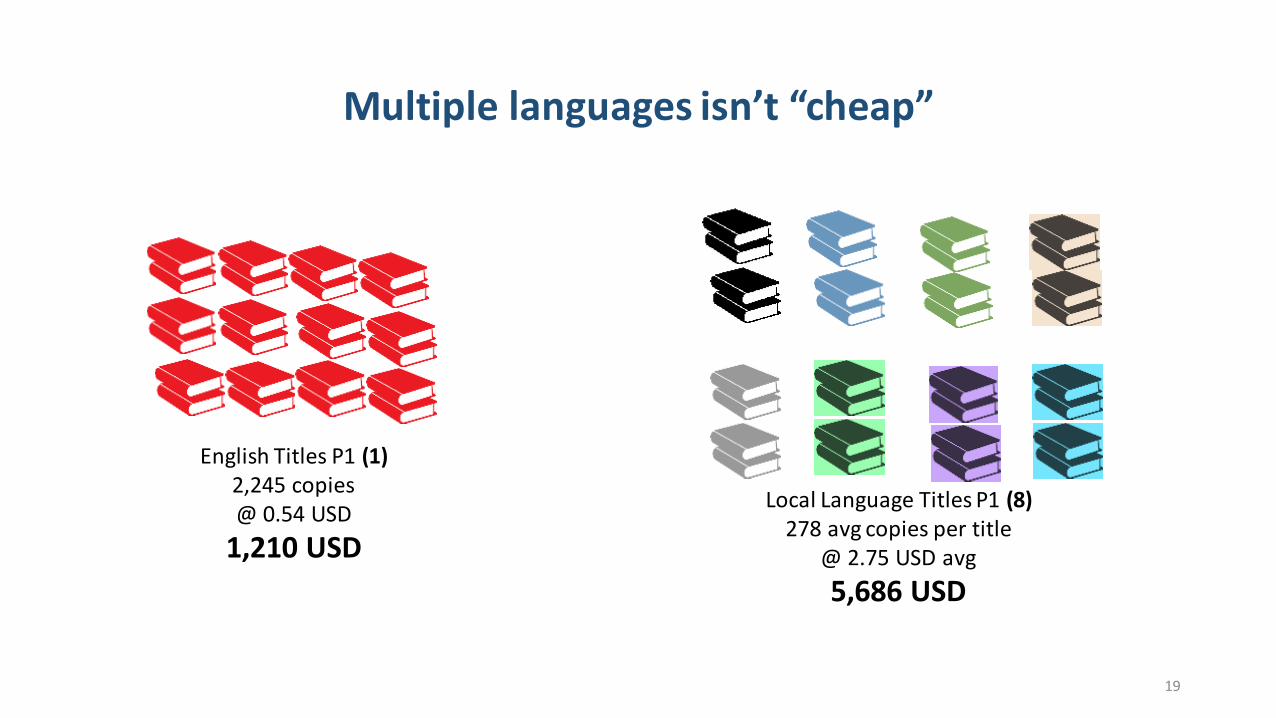
English Titles P1 (1)2,245 copies@ 0.54 USD
1,210 USD
Local Language Titles P1 (8)278 avg copies per title
@ 2.75 USD avg
5,686 USD
Multiple languages isn’t “cheap”
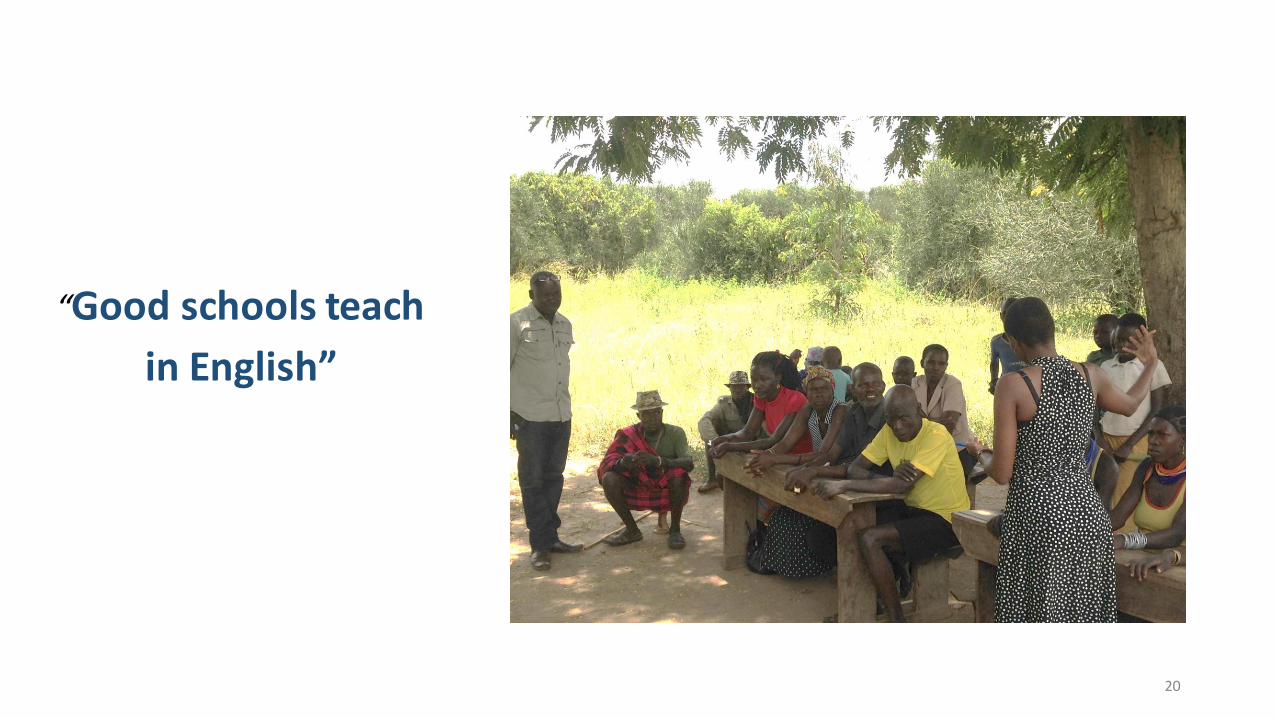
“Good schools teach
in English”
20
Language complexity is a significant predictor of SHRP impacts• More research to guide program adaptation
• Discussions around national assessments and benchmarks
Reading programs in heterogeneous language settings face complex challenges- some strategies for confronting these challenges:
• Staff on the ground and at every school
• Work at local as well as national levels
• Work through the system, so the system owns the processes
• Continuous dialogue
Implications & Conclusion