linear statistical models 2008 model diagnostics residual analysis outliers dependence ...
Post on 21-Dec-2015
220 views
TRANSCRIPT

Linear statistical models 2008
Model diagnostics
Residual analysis Outliers
Dependence
Heteroscedasticity
Violations of distributional assumptions
Identification of influential observations
Examination of over- and under-dispersion

Linear statistical models 2008
A simple model of water clarity
Inputs: year, temperature, salinity, station dummies
Output; Secchi depth (water clarity)
0
2
4
6
8
10
12
14
1985 1990 1995 2000 2005
Sec
chi d
epth
(m
)

Linear statistical models 2008
Sampling sites for water quality in the Stockholm archipelago
Stockholm Baltic Sea

Linear statistical models 2008
Raw residuals in generalized linear models
The predicted values are linear combinations of the observed
values, i.e..
where H is a symmetric idempotent matrix (H = H*H)
The vector of raw residuals can be written
In contrast to residuals in general linear models, the raw residuals
in glims may have a variance that is strongly related to the size of
Hyy ˆ
yHIyye )(ˆ
y

Linear statistical models 2008
Pearson residuals
The Pearson residual is the raw residual standardized with the
standard deviation of the fitted value
Special cases:
Poisson and binomial models
)ˆ(ˆ
ˆ,
i
iiPearsoni
yV
yye
Linear statistical models 2008
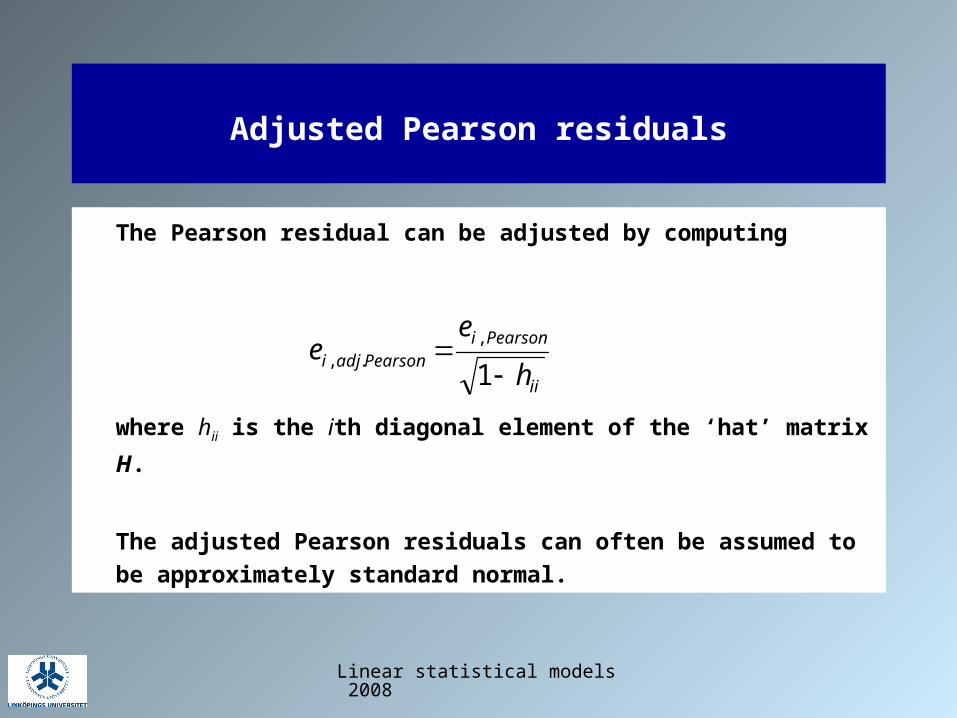
Adjusted Pearson residuals
The Pearson residual can be adjusted by computing
where hii is the ith diagonal element of the ‘hat’ matrix H.
The adjusted Pearson residuals can often be assumed to be
approximately standard normal.
ii
PearsoniPearsonadji
h
ee
1
,.,

Linear statistical models 2008
Deviance
The deviance is defined as
where
is the log likelihood of the full (saturated) model, and
is the log likelihood of the current model at the ML-estimates of its
parameters.
The deviance is a sum of the contributions to the deviance from
each of the observations
);,( yyl
);,ˆ( yl
));,ˆ();,((2 ylyylD
i
idD

Linear statistical models 2008
Deviance residuals
The (unadjusted) deviance residuals are defined as
The adjusted deviance residuals are defined as
where hii is the ith diagonal element of the ‘hat’ matrix H.
iiiDeviancei dyye )ˆsgn(,
ii
DevianceiDevianceadji
h
ee
1
,.,

Linear statistical models 2008
Score residuals
The score equations involve sums of terms Ui, one for each observation.
Properly standardized these terms can be regarded as residuals

Linear statistical models 2008
Approximate likelihood residuals
Likelihood residuals may, in principle, be computed by comparing
the deviance for a model based on all observations with the
deviance for a model based on all but the ith observation
An approximation of these residuals is given by the formula
2,
2,, ))(1()()ˆsgn( DevianceiiiScoreiiiiiLikelihoodi ehehyye

Linear statistical models 2008
Choice of residuals
Type of residuals Test
Pearson residuals Likelihood ratio test
Deviance residuals Wald tests
Score residuals Score tests
Likelihood residuals

Linear statistical models 2008
Influential observations
The leverage (influence) of observation i on the fitted value
is the derivative of this estimate with respect to yi.
Because these derivatives are given by the
diagonal elements hii of the ‘hat’ matrix H.
i
Hyy ˆ

Linear statistical models 2008
Cook’s distance
The combined change in all parameters when observation i is
omitted can be computed as
)()(ˆˆˆˆ1i
TT
ii XXp
C

Linear statistical models 2008
Over-dispersion
Over-dispersion occurs when the variance of the response
is larger than would be expected for the chosen
distribution.
Example:
In a model involving Poisson distributions, the estimated
variance is considerably larger than the estimated mean.
Linear statistical models 2008
Possible causes of over-dispersion
Lack of homogeneity (the distribution of the target variable
varies within experiments that are assumed to be
replicates)
Dependence (the response levels in experiments assumed
to be replicates are actually positively correlated)

Linear statistical models 2008
Modelling over-dispersion
Introduce an extra scale parameter in the variance
function of the response Y.
Note that the variance is a function of the mean for all
members of the exponential family.

Linear statistical models 2008
Software recommendations
General linear models
MINITAB
Generalized linear models
SAS, proc GENMOD