linear spatio-temporal characterization of a uv...
TRANSCRIPT

Journal of Microscopy, Vol. 230, Pt 1 2008, pp. 4–8
Received 16 July 2007; accepted 22 October 2007
Linear spatio-temporal characterization of a UV microscopeobjective for nonlinear imaging and spectroscopy by usingtwo-dimensional spectral interferometry
W. A M I R ∗, C . G . D U R F E E ∗, D. N. S C H A F E R ∗,E . A . G I B S O N†, L . KO S T†, E . P R Z E K WA S ∗, R . J I M E N E Z†& J. A . S Q U I E R ∗∗Center for Microintegrated Optics for Advanced Bioimaging and Control, Department of Physics,Colorado School of Mines, 1523 Illinois Street, Golden, CO 80401, U.S.A.†JILA, 440 UCB, University of Colorado, National Institute of Standards and Technology, andDepartment of Chemistry and Biochemistry, Boulder, CO 80309, U.S.A.
Key words. Aberrations, Fourier transform, Hankel transformation,multiphoton microscopy, spectral interferometry, Ultrafast measurement,wave propagation code.
Summary
Two-dimensional Fourier transform spectral interferometry isused to characterize the spatio-temporal aberrations of a UVmicroscope objective. The spatial and temporal profiles of a420 nm, 38 fs pulse at the focus of a 0.32 NA UV objective arethen deduced using a wave propagation code incorporatingthe measured aberrations.
Introduction
Multielement, refractive, high numerical aperture opticsare commonly used to focus femtosecond laser pulses innonlinear imaging and spectroscopy applications such asCoherent Anti-Stockes Raman Spectroscopy (CARS) or Two-Photon Fluorescence Microscopy. As such, efficient nonlinearoptical excitation is a multidimensional problem because bothdiffraction-limited spatial performance and Fourier transformlimited temporal performance are desirable. To furthercomplicate the focusing problem, these two aspects are oftencoupled, e.g. spatial distortions result in temporal distortions.Many high-resolution, nonlinear imaging applications arenow performed in a pump-probe geometry where thesedistortions can play an especially critical role. For example,artifacts unrelated to molecular dynamics have led to apparentinhomogeneous broadening in photon echo spectroscopy.Passino et al. (1997) report an asymptotic peak shift of1.5 fs when using a 10-cm singlet lens for a laser dye excited at
Correspondence to: Wafa Amir. Tel: 303 273 3794; Fax: 303 273 3919; e-mail:
780 nm with 22 fs pulses. This asymptotic peak shift vanishedwhen using a 20-cm achromatic lens. Furthermore, thereare several unpublished accounts of this problem becomingmore severe at shorter wavelengths. It is highly desirable tomove such forms of spectroscopy to a high-resolution imagingmodality. Clearly, however, the performance of the excitationoptics must be rigorously characterized in order to be ableto reliably interpret the resulting signal. It is the intent ofthis paper to characterize the performance of objectives thatincorporate near-UV femtosecond laser pulses, a regime inwhich there is presently little or no information.
To accomplish this goal, we use a version of spatially resolvedspectral interferometry: two-dimensional Fourier transformspectral interferometry (2D FTSI) (Amir et al., 2006; Amiret al., 2007). This is a linear, single-shot technique that isreadily adapted to any wavelength regime, and can be used todirectly measure the spectrally and spatially dependent phaseshift introduced by the optic. Using the spectral interferogramdata, we model the focal spot by numerically propagating theelectric field (now modified by the measured distortions) fromthe objective through focus. These simulations are then usedto deduce the spatial profile and the duration of the pulse atthe focus of the objective under study.
Method and results
The 2D FTSI experimental set up is shown in Fig. 1. A38 fs pulse centred at 420 nm is first expanded by a telescopeso that the back of the objective is overfilled, ensuring thatthe measurement is made at the full NA of the objective. Theexpanded beam is directed into an interferometer, which is
C© 2008 The AuthorsJournal compilation C© 2008 The Royal Microscopical Society

L I N E A R S PAT I O - T E M P O R A L C H A R AC T E R I Z AT I O N O F A U V M I C RO S C O P E O B J E C T I V E 5
Fig. 1. Experimental setup. Inset is a measured 2D Spectral Interferogram produced with the 0.32 NA, NUV, 15x, objective in the sample arm.
essentially a classic Michelson interferometer configuration.The output of the interferometer is spectrally resolved by animaging spectrometer. The resulting 2D spectral interferogramis recorded by a 2D CCD camera. The arm lengths of theinterferometer are purposely mismatched to create an initialstraight line fringing. After this initial alignment, the objective(0.32 NA, NUV, 15x, LMU from OFR Inc., Caldwell, NJ, USA)to be characterized is placed in one arm (sample arm) of theinterferometer. To ensure that the focus of the microscopeobjective is at the sample arm’s end mirror plane, the fringenear the central wavelength is visually made straight byadjusting the microscope objective longitudinal position.
The inset in Fig. 1 shows a single-shot 2D spectralinterferogram for this particular microscope objective. On themeasured interferogram, the x-axis represents wavelength andthe y-axis represents the spatial dimension. Notice that in thiscase, the fringes curve as a function of wavelength. This effectis indicative of chromatic aberration whereby the differentwavelengths are focusing to slightly different axial planes.
In general, these 2D spectral interferograms containinformation about achromatic spatial aberrations. For on-axismeasurements such as this one, we would expect primarilyspherical aberration. Spherical aberration would show asa fourth-order curvature on the fringes, independent ofwavelength (Amir et al., 2006), which is not visible in the 2Dinterferogram for our objective. What is also apparent is thatthe fringe spacing rapidly varies as a function of wavelength.This is a signature of the large material dispersion produced bythe objective.
Using the method described in Ref. Amir et al. (2006);Amir et al. (2007), we extract from the spectral interferogramthe spatio-spectral amplitude and phase of the beam in thesample arm containing the objective. The spatio-spectralphase contains all the information about the spatio-temporalaberrations of the objective. Figure 2 depicts the radiallyvarying delay produced by the combined chromatic and the
Fig. 2. Experimental propagating time delay crosses, and quadratic fit(solid line) giving τ = 80 fs amount of chromatic aberration, inset: delaydue to spherical aberration.
spherical aberration of the objective under test. The radiallyvarying group delay is written as, Kempe & Rudolph (1993),Amir et al. (2006): GD(r) = –τ r2 + τ 4 r4 + τ 2 r2. Thechromatic aberration coefficient τ , is significant and measures80 fs (double pass value), whereas the measured sphericalaberration (coefficient τ 4) is negligible.
To study the effects of these aberrations on the pulse durationand on the spatial profile of the beam at the focus of theobjective, we numerically propagate the pulse to the focalplane. Numerical wave propagation techniques are a powerfulmethod for visualizing the pulse front at any point along thepropagation axis. Previous publications used numerical wavepropagation to determine the spatial-temporal amplitude of awell-defined beam as it propagates through well-defined optics(Kempe et al., 1992; Fuchs et al., 2005). Here we include
C© 2008 The AuthorsJournal compilation C© 2008 The Royal Microscopical Society, Journal of Microscopy, 230, 4–8

6 W. A M I R E T A L .
Fig. 3. Pulse front of the beam before the objective (a) and just after the objective without compensating for dispersion (b) and with compensating fordispersion (c).
the measured spatio-spectral phase and amplitude of the fieldfrom our 2D FTSI measurement in a cylindrical coordinatewave propagation code based on Hankel transforms (Guizar-Sicairos & Gutierrez-Vega, 2004). This is especially usefulfor characterizing unknown or complicated optical elementsbecause no knowledge of material composition is required.
To propagate the field forward in free space, we use anon-paraxial wave propagation code that assumes azimuthalsymmetry. First we consider propagation in Cartesiancoordinates. Fourier transforming the input field U (x, y, t;z = 0) in both time and space gives a representation of thespatio-temporal field in terms of the angular spectrum A( fX ,fY , ω;z = 0) (Goodman, 2005). Here the angular frequency
(spatial-frequency) variables are defined through the directioncosinesα=λ fXandβ =λ fY . In a uniform medium, the angularspectrum at a later position z is given by a simple phase factor:
A( f X , fY, ω; z)= A( f X , fY, ω; z =0) exp[
i 2π
√1− f 2
X − f 2Y z
].
Spatial frequencies for which the square root is real willpropagate. The paraxial approximation results from keepingterms that are first-order in fX and fY in the Taylor expansionof the root. In an isotropic medium, we may easily calculatenon-paraxial propagation by retaining the square root inevaluating the phase shifts. The inverse Fourier transformationin fX and fY then gives the spatio-spectral diffracted fieldU (x, y, ω;z); the spatio-temporal evolution is finally obtainedby another transform in ω. In our case, the propagation has
azimuthal symmetry, and the field can be represented as U (r ,t;z). Numerically, we use a quasi-dicrete Hankel transformalgorithm (Yu et al., 1998; Guizar-Sicairos & Gutierrez-Vega,2004), that is applicable to this azimuthal coordinates.
Figure 3a shows the pulse front I(r,t) before the objective andFig. 3b the pulse front immediately after. Effect of the wavefrontcurvature due to focusing has been removed in order to be ableto see the spatio-temporal distortions.
The initial pulse front before the objective is straight andwithout distortions and the pulse is transform limited intime. Immediately after the objective (Fig. 3b), the pulse frontdisplays some distortion and curvature due to chromaticaberration. In addition, the pulse duration is also increased as aresultofmaterialdispersion.Usingstandardpulsecompressionmethods, such as a prism pair, the dispersion can only becompensated at a specific radius. For the correct compensationat R = 0, the resultant pulse-front is displayed in Fig. 3c. Thepulse is mainly distorted by chromatic aberration. The impactof the chromatic aberration in that case is most distinctive atthe focal plane (Fig. 4a). Here, clearly, the tightest spatial focusis not achieved over the entire pulse duration, in contrast withthe simulated focal plane without aberration (cf. Fig. 4b).
To obtain the spatial profile at the focal plane of theobjective, the pulse front is integrated over time. The solidline in Fig. 5 depicts the calculated spatial profile for thecase of no aberrations, and the dashed line presents thespatial profile with aberrations, obtained from the aberratedspatio-temporel distribution from Fig. 4a. The maximum of
Fig. 4. Spatio-temporal distribution at the focus. (a) incorporating aberrations from the 2DSI measurement. (b) without aberrations.
C© 2008 The AuthorsJournal compilation C© 2008 The Royal Microscopical Society, Journal of Microscopy, 230, 4–8
L I N E A R S PAT I O - T E M P O R A L C H A R AC T E R I Z AT I O N O F A U V M I C RO S C O P E O B J E C T I V E 7
Fig. 5. Time-integrated spatial profiles at the focus for the case of anaberration free objective (solid line), and for the case of the measuredaberrations with ideal compensation of dispersion (dashed line). Thedashed line curved is normalized relative to the aberration free case.
the focal spot is at 89% of the maximum of the unaberratedfocal spot. This decrease in maximum intensity shows theimpact of chromatic aberration on the peak intensity. Besidethe decrease in peak intensity, the presence of chromaticaberration broadens slightly the wings of the focal spot,but the Full Width at Half Maximum (FWHM) value isalmost unchanged. The FWHM value of the spatial profile is1.03 μm when no aberration is present and 1.06 μm with themeasured aberrations. Compensating for distortion of this focalspot cannot be accomplished with spatial-only adaptive optics,but would necessitate a device that can induce programmablespatio-spectral phase (Feurer et al., 2002; Amir et al., 2007).
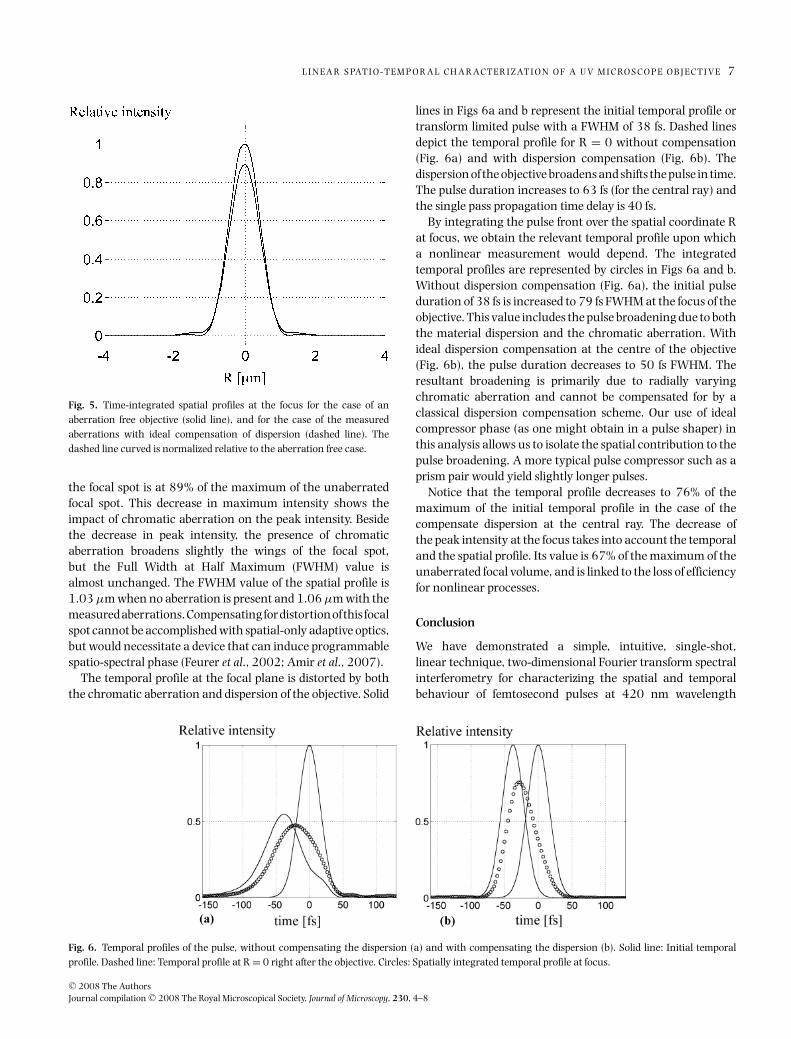
The temporal profile at the focal plane is distorted by boththe chromatic aberration and dispersion of the objective. Solid
lines in Figs 6a and b represent the initial temporal profile ortransform limited pulse with a FWHM of 38 fs. Dashed linesdepict the temporal profile for R = 0 without compensation(Fig. 6a) and with dispersion compensation (Fig. 6b). Thedispersion of the objective broadens and shifts the pulse in time.The pulse duration increases to 63 fs (for the central ray) andthe single pass propagation time delay is 40 fs.
By integrating the pulse front over the spatial coordinate Rat focus, we obtain the relevant temporal profile upon whicha nonlinear measurement would depend. The integratedtemporal profiles are represented by circles in Figs 6a and b.Without dispersion compensation (Fig. 6a), the initial pulseduration of 38 fs is increased to 79 fs FWHM at the focus of theobjective. This value includes the pulse broadening due to boththe material dispersion and the chromatic aberration. Withideal dispersion compensation at the centre of the objective(Fig. 6b), the pulse duration decreases to 50 fs FWHM. Theresultant broadening is primarily due to radially varyingchromatic aberration and cannot be compensated for by aclassical dispersion compensation scheme. Our use of idealcompressor phase (as one might obtain in a pulse shaper) inthis analysis allows us to isolate the spatial contribution to thepulse broadening. A more typical pulse compressor such as aprism pair would yield slightly longer pulses.
Notice that the temporal profile decreases to 76% of themaximum of the initial temporal profile in the case of thecompensate dispersion at the central ray. The decrease ofthe peak intensity at the focus takes into account the temporaland the spatial profile. Its value is 67% of the maximum of theunaberrated focal volume, and is linked to the loss of efficiencyfor nonlinear processes.
Conclusion
We have demonstrated a simple, intuitive, single-shot,linear technique, two-dimensional Fourier transform spectralinterferometry for characterizing the spatial and temporalbehaviour of femtosecond pulses at 420 nm wavelength
Fig. 6. Temporal profiles of the pulse, without compensating the dispersion (a) and with compensating the dispersion (b). Solid line: Initial temporalprofile. Dashed line: Temporal profile at R = 0 right after the objective. Circles: Spatially integrated temporal profile at focus.
C© 2008 The AuthorsJournal compilation C© 2008 The Royal Microscopical Society, Journal of Microscopy, 230, 4–8

8 W. A M I R E T A L .
focused by a UV microscope objective. We incorporated themeasured phase distortions in a wave propagation code toreconstruct the full pulse characteristics in both space andtime at the focus of the objective, providing all the informationneeded to interpret nonlinear spectroscopy experiments. Forthis objective, the focal spot was not significantly aberrated, butwe found that radially varying chromatic aberrations result intemporal broadening that cannot be pre-compensated with apulse compressor.
Acknowledgements
The authors acknowledge Dr. T. A. Planchon for helpfuldiscussion on the propagation code. This work is supportedby the NSF under the grant DBI-0454686.
References
Amir, W., Planchon, T.A., Durfee, C.G., Squier, J.A., Gabolde, P., Trebino,R. & Muller, M. (2006) Simultaneous visualization of spatial andchromatic aberrations by two-dimensional Fourier transform spectralinterferometry. Opt. Lett. 31, 2927–2929.
Amir, W., Planchon, T.A., Durfee, C.G., Squier, J.A. (2007) Completecharacterization of a spatio-temporal pulse shaper with two dimensionalFourier transform spectral interferometry. Opt. Lett. 32, 939–941.
Feurer, T., Vaughan, J.C., Koehl, R.M. & Nelson, K.A. (2002)Multidimensional control of femtosecond pulses by use of aprogrammable liquid-crystal matrix. Opt. Lett. 27, 652–654.
Fuchs, U., Zeitner, U. & Tunnermann, A. (2005) Ultra-short pulsepropagation in complex optical systems. Opt. Express 13, 3852–3861.
Goodman, J.W. (2005) Fourier Optics, 3rd edn., section 3.10. Roberts &Compagny Publishers, Englewood, CO.
Guizar-Sicairos, M., Gutierrez-Vega, J.C. (2004) Computation of quasi-discrete Hankel transforms of integer order for propagating optical wavefields. J. Opt. Soc. Am. A 21, 53–58.
Kempe, M. & Rudolph, W. (1993) Femtosecond pulses in the focal regionof lenses. Phys. Rev. A 48, 4721–4729.
Kempe, M., Stamm, U., Wilhelmi, B. & Rudolph, W. (1992) Spatial andtemporal transformation of femptosecond laser pulses by lenses andlens systems. J. Opt. Soc. Am. B 19, 1158–1165.
Passino, S.A., Nagasawa, Y., Joo, T. & Flemming, G.R. (1997) Three-pulseecho peak shift studies of polar solvation dynamics. J. Phys. Chem. A101, 725–731.
Yu, L., Huang, M., Chen, M., Chen, W., Huang, W., Zhu, Z. (1998) Quasi-discrete Hankel transform. Opt. Lett. 23, 409–411.
C© 2008 The AuthorsJournal compilation C© 2008 The Royal Microscopical Society, Journal of Microscopy, 230, 4–8