linear methods: regression & discrimination sec 4.6
Post on 20-Dec-2015
220 views
TRANSCRIPT

Linear methods: Regression & Discrimination
Sec 4.6

Corrections & Hints•The formula for the entropy of a split
(Lec 4, Sep 2) is incorrect. Should be:
•Where is fraction of complete data that ends up in branch i

Corrections & Hints•Best way to do a random shuffle of a
data set?
•Given:
•Want something like:

Corrections & Hints•Usual way is an index shuffle
•Generate an index vector and a random vector:
•Then sort on the random vector:
•Finally, use the “sorted” index row as index into X
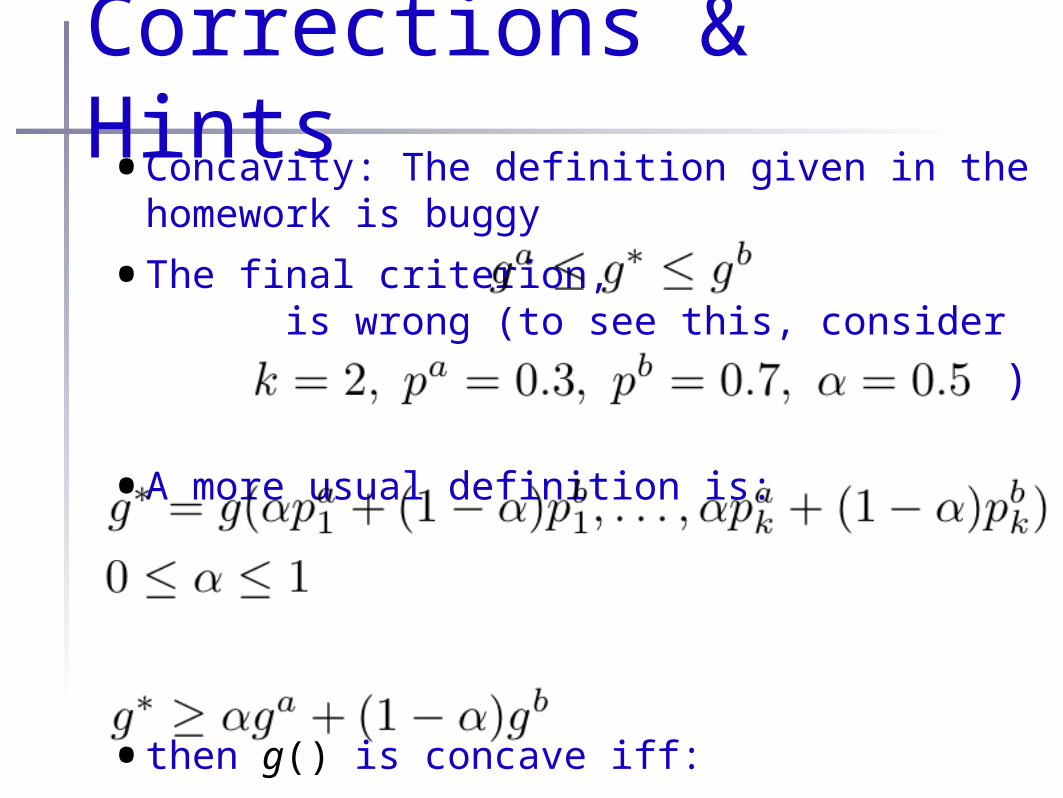
Corrections & Hints•Concavity: The definition given in the
homework is buggy
•The final criterion, is wrong (to see this, consider
•A more usual definition is:
•then g() is concave iff:
)

Corrections & Hints•Missing values
•Both hepatitis and hypothyroid have many missing attribute (feature) values
•You have 3 choices
•Drop all points (instances) w/ missing values
•Report on effects on your data/results
•Handle missing attr as in Sec 4.7 or 4.1 of text
•Report (if you can) on effects
•Find new similar data sets with no missing values
•Many available in UCI data or other data sets from Weka group

Reminders•Office hours, Wed 9:00-11:00 AM, FEC345B•Homework due at start of next class (Thurs)•Late policy (from front material):
•1 day late => 50% off•I will relax for this assignment. Policy for
HW1:•15% per day late (incl weekend days)•You may “checkpoint” by handing in what
you have on the due date -- penalty points applied only to “delta”
•E.g. Turn in 60% of proj on Thurs, 40% on Sat before 4:00 (electronic)•Total score is 60%+0.7*40%=88%
•Read cheating policy -- don’t do it!!!

Reminder: 1-NN alg•Nearest neighbor: find the nearest
instance to the query point in feature space, return the class of that instance
•Simplest possible distance-based classifier
•With more notation:
•Distance function is anything appropriate to your data

Reminder: k-NN
•Slight generalization: k-Nearest neighbors (k-NN)
•Find k training instances closest to query point
•Vote among them for label
•Q: How does this affect system?
•Q: Why does it work?

Exercise•Show that k-NN does something reasonable:
•Assume binary data
•Let X be query point, X’ be any k-neighbor of X
•Let p=Pr[Class(X’)==Class(X)] (p>1/2)
•What is Pr[X receives correct label]?
•What happens as k grows?
•But there are tradeoffs...
•Let V(k,N)=volume of sphere enclosing k neighbors of X, assuming N points in data set
•For fixed N, what happens to V(k,N) as k grows?
•For fixed k, what happens to V(k,N) as N grows?
•What about radius of V(k,N)?

The volume question•Let V(k,N)=volume of sphere enclosing k
neighbors of X, assuming N points in data set
•Assume uniform point distribution
•Total volume of data is (1, w.l.o.g.)
•So, on average,

1-NN in practice•Most common use of 1-nearest neighbor
in daily life?

1-NN & speech proc.•1-NN closely related to technique of Vector
Quantization (VQ)•Used to compress speech data for cell
phones•CD quality sound:•16 bit/sample•44.1 kHz•⇒ 88.2 kB/sec ⇒ ~705 kbps
•Telephone (land line) quality:•~10 bit/sample•10 kHz•⇒ ~12.5 kB/sec ⇒ 100 kpbs
•Cell phones run at ~9600 bps...
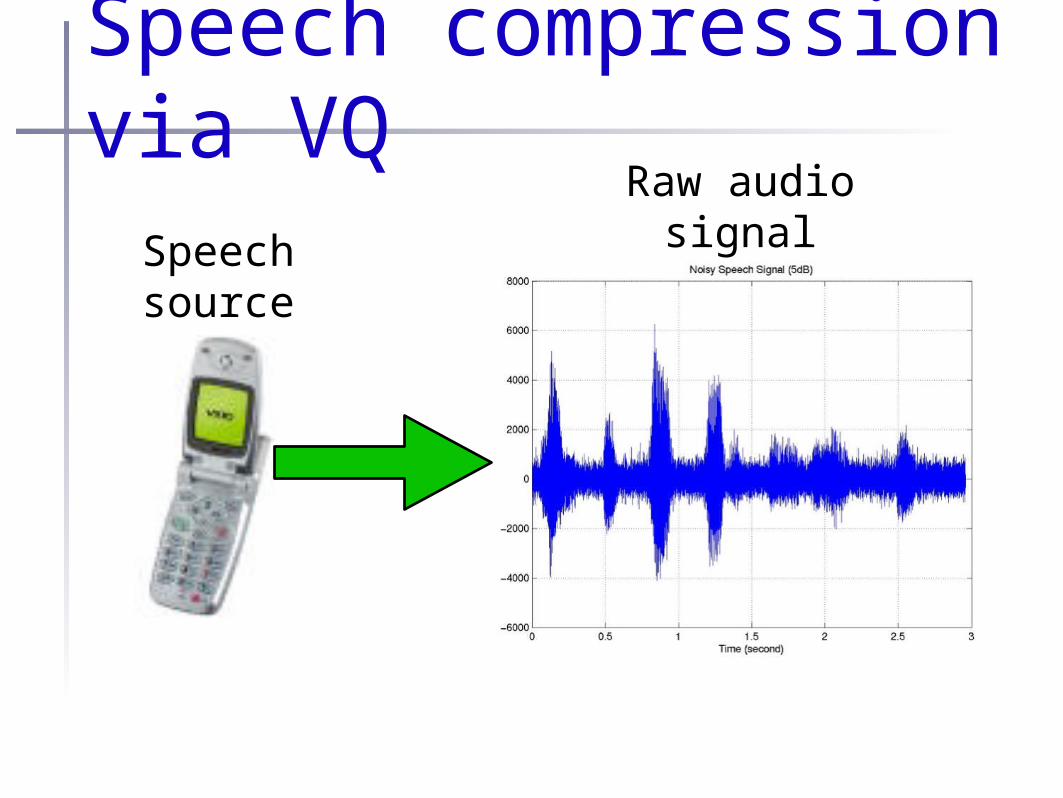
Speech compression via VQ
Speechsource
Raw audiosignal
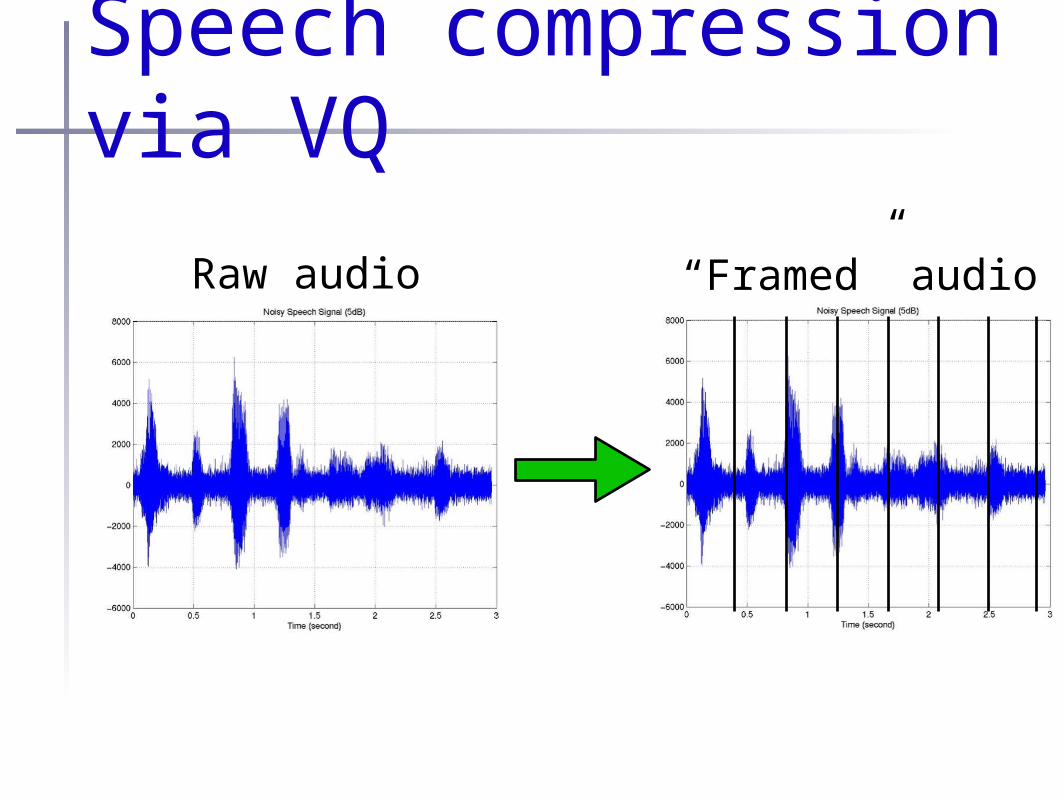
Speech compression via VQ
Raw audio “Framed” audio

Speech compression via VQ
Framedaudio
Cepstral(~ smoothed frequency)
representation

Speech compression via VQ
Cepstrum
Downsampledcepstrum
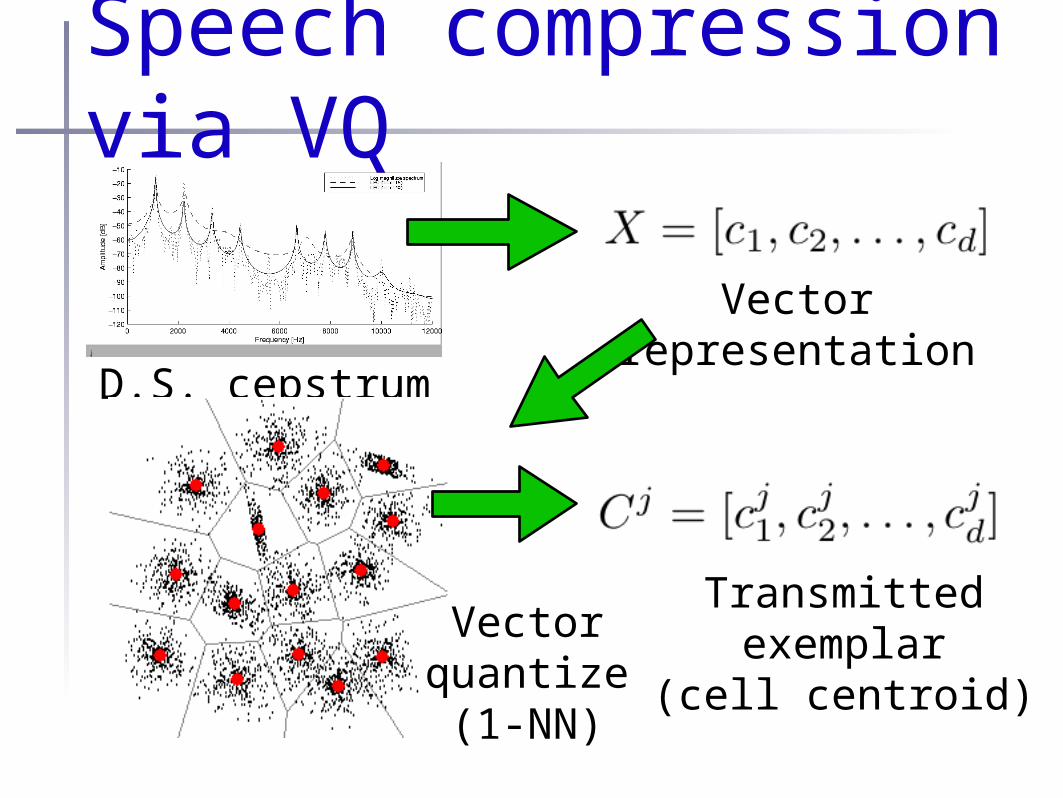
Speech compression via VQ
D.S. cepstrum
Vectorrepresentation
Vectorquantize(1-NN)
Transmittedexemplar
(cell centroid)

Compression ratio•Original:
•10 bits
•10 kHz; 250 samples/“frame” (25ms/frame)
•⇒ 100 kbps; 2500 bits/frame
•VQ compressed:
•40 frames/sec
•1 VC centroid/frame
•~1M centroids ⇒ ~20 bits/centroid
•⇒ ~800 bits/sec!

Signal reconstruction
Transmittedcell centroid
Look upcepstral
coefficientsReconstruct
cepstrum
Convert to audio
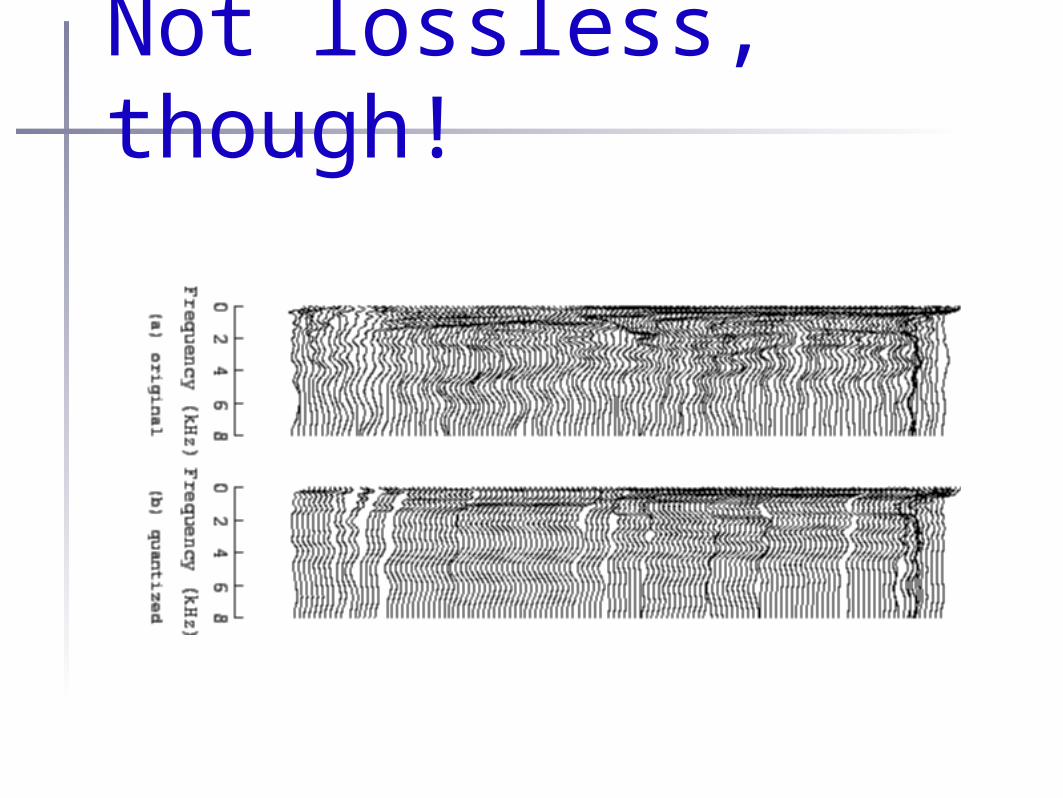
Not lossless, though!

Linear Methods

Linear methods•Both methods we’ve seen so far:
•Are classification methods
•Use intersections of linear boundaries
•What about regression?
•What can we do with a single linear surface?
•Not as much as you’d like...
•... but still surprisingly a lot
•Linear regression is the proto-learning method
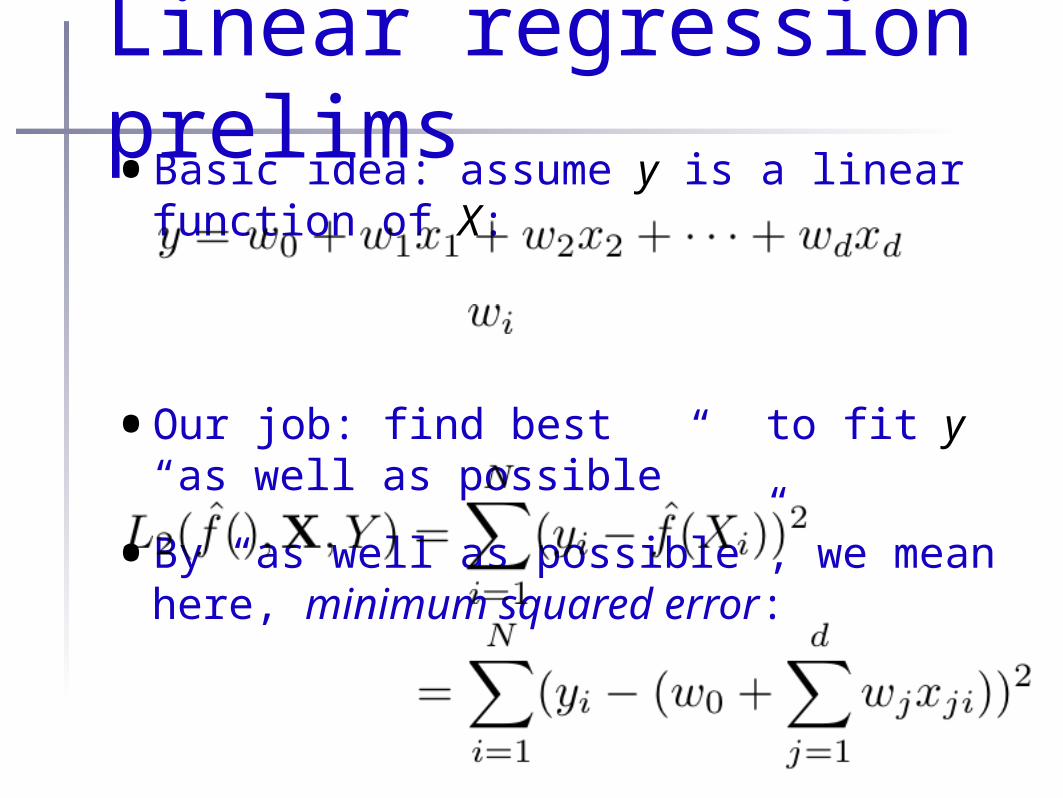
Linear regression prelims•Basic idea: assume y is a linear function
of X:
•Our job: find best to fit y “as well as possible”
•By “as well as possible”, we mean here, minimum squared error:

Useful definitions
•Definition: A trick is a clever mathematical hack
•Definition: A method is a trick you use more than once

A helpful “method”•Recall
•Want to be able to easily write
•Introduce “pseudo-feature” of X,
•Now have:
•And:
•So:
•And our “loss function” becomes:

Minimizing loss•Finally, can write:
•Want the “best” set of w: the weights that minimize the above
•Q: how do you find the minimum of a function w.r.t. some parameter?
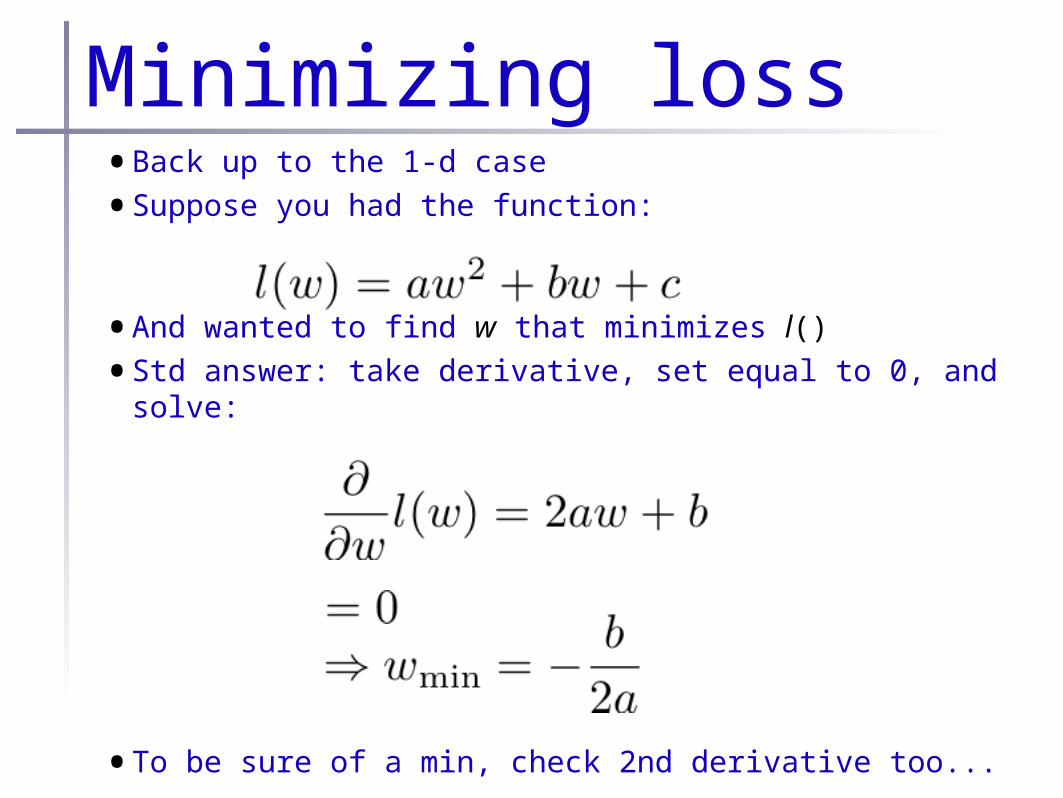
Minimizing loss•Back up to the 1-d case
•Suppose you had the function:
•And wanted to find w that minimizes l()
•Std answer: take derivative, set equal to 0, and solve:
•To be sure of a min, check 2nd derivative too...

5 minutes of math...•Some useful linear algebra identities:
•If A and B are matrices,
(for invertible square matrices)

5 minutes of math...•What about derivatives of
vectors/matrices?
•There’s more than one kind...
•For the moment, we’ll need the derivative of a vector function with respect to a vector
•If x is a vector of variables, y is a vector of constants, and A is a matrix of constants, then:

Exercise•Derive the vector derivative expressions:
•Find an expression for the minimum squared error weight vector, w, in the loss function: