lÍnea tÍtulo # 1 - hochschildmining.com · ramp entrance primary crusher being installed ......
TRANSCRIPT

HOCHSCHILD MINING Annual Results 2014
18 March 2015

DISCLAIMER
2
Some statements contained in this presentation or in documents referred to in it are or may be forward-looking statements. Actual results may differ from those expressed in such statements, depending on a variety of factors.
Past performance of the Company or its shares cannot be relied on as a guide to future performance.
Any forward-looking information contained in this presentation has been prepared on the basis of a number of assumptions which may prove to be incorrect, and accordingly, actual results may vary.
This presentation does not constitute, or form part of or contain any invitation or offer to any person to underwrite, subscribe for, otherwise acquire, or dispose of any shares in Hochschild Mining plc or advise persons to do so in any jurisdiction, nor shall it, or any part of it, form the basis of or be relied on in any connection with or act as an inducement to enter into any contract or commitment therefore. No reliance may be placed for any purpose whatsoever on the information or opinions contained in this document or on its completeness and no liability whatsoever is accepted for any loss howsoever arising from any use of this document or its contents otherwise in connection therewith. Nothing in this presentation is to be construed as a profit forecast.
This presentation has been prepared in compliance with English law and English courts will have exclusive jurisdiction over any disputes arising from or connected with this presentation.

INCREASING PRODUCTION, REDUCING COSTS, OPTIMISING OPERATIONS
Key Highlights
3
Delivering profitable growth
Aggressive cash optimisation plan: $300m of savings
New Inmaculada mine poised to double free cash flows: 12m oz @ $11-12/oz (Ag Eq)
Delivering consistent production increases: from 20 to 29m oz (Ag Eq)
AISC reduced from $21.7/oz to $15-16/oz (Ag Eq)
Secure financial position: growth fully financed

HOCHSCHILD MINING Ramon Barua, CFO
Financial Results
Angela vein (Inmaculada)

(42.1)
(56.9)
(56.7)
19.7
17.9
10.3
10.2
7.8
3.2
(20.9)
(5.9)
5
P&L
$m (pre-exceptional) 2014 2013 variance
Revenue 493.0 622.2 (129.2)
Cost of sales (404.6) (466.8) 62.0
Gross profit 88.3 155.4 (67.1)
Gross profit margin 17.9% 25.0% (7.1)
Administrative exp. (43.3) (54.4) 11.1
Selling exp. (28.7) (28.8) 0.1
Exploration exp. (17.2) (42.9) 25.7
Others net (13.4) (11.6) (1.8)
Finance net (30.9) (1.0) (29.9)
FX loss (5.0) (19.8) 14.8
PBT (50.2) 2.9 53.1
Tax (6.5) (45.0) 38.5
Net (loss)/profit (56.7) (42.1) (14.6)
Attrib. net profit (54.9) (50.3) (4.6)
EPS (0.15) (0.15) -
Adjusted EBITDA 135.6 201.0 (65.4)
2014 vs 2013 net profit reconciliation
$m (pre-excep post tax)
2013 Net profit
Production cost
Finance net
Admin
Exploration
Hedge
Prices
Others
2014 Net profit
10
15
20
25
30
35
2013 2014 2015
Average mkt prices for silver
$/oz
Avg: $23.9/oz
Avg: $19.1/oz
FX
Volume

6
ALL-IN SUSTAINING COSTS REDUCED BY ALMOST 30% SINCE 2012
Main operation AISC reconciliation (pre-exceptional)
$/oz Ag Eq
All-in sustaining costs continuing to fall
21.7
18.6 17.4
15-16
(1.0 ) (0.5) (0.2)
0.5
AISC 2012 AISC 2013 Capex Production costs Admin expenses Commercial discounts AISC 2014 AISC 2015
-29%

7
Growth strategy financed
BALANCE SHEET ANALYSIS
286
299
116
3
27 14 3
(33)
19
(26)
(187)
10
Dec 2013 cash balance
Arcata cash generation**
Pallancata cash
generation
San Jose cash generation
Ares cash generation
Corporate & Exploration
Cash balance Debt Interest Project capex & opex
Others Dec 2014 cash balance
Liquidity position
• Cash position: $116m* + $75m in 2015
• Low cost Inmaculada project fully funded
― Remaining construction capex: $72m
• Forward sale of:
― 6moz Ag @$17.75/oz for 2015
― 38,000oz Au @$1,300/oz for 2015
Debt Commitment
size Maturity
Rate (pre tax)
Rate (post tax)
Senior notes 350 2021 7.75% 5.58%
Medium term loan 100 2019 Libor +2.6% 2.06%
Short term funding 75 Feb 2016 1.56% 1.12%
Evolution of cash balance
*As at 31 Dec 2014 **Cash generation is calculated as EBITDA less operational capex & exploration capex
$m
Operations showing positive cash generation

HOCHSCHILD MINING Ignacio Bustamante, CEO
18 March 2015

PRESERVING CAPITAL & OPTIMISING CASHFLOW
9
Cashflow optimisation programme*
Well over $300m of savings identified since plan announcement in mid 2013
• Production costs reduced by $101m (vs initial 2013 guidance)
• Administration costs reduced by $30m (vs 2012)
• Sustaining capex reduced by $135m (2015 guidance of $45m vs initial 2013 guidance)
• Exploration costs reduced by $58m (vs initial 2013 guidance)
• Operational efficiencies in dilution control, supply chain management, commercial negotiations & working capital improvements
• Significant headcount reduction
*Includes dividend suspension in 2013 of $20.2m

INMACULADA
10
• World class gold/silver project close to completion
• Located in Hochschild’s Southern Peru Cluster
• Set to deliver 11-12m oz in 2016
• Operations set to commence in Q2 2015
• Expected to be Hochschild’s lowest cost operation @11.8/oz AISC (Ag Eq)
• Strong geological upside potential

11
Plant commissioning set for Q2 2015
GFMS/UBS Global gold AISC curve (Jan 2015)*
INMACULADA: AISC OF $711/OZ
Initial resource Life-of-Mine 11.3 yrs
Average annual production (Au Eq) 189k oz
Average annual production (Ag Eq) 11.3m oz
Production Data
Pre production capex $420m
AISC (Au Eq) 711/oz
AISC (Ag Eq) 11.8/oz
Updated Operating Summary
*Source: GFMS/UBS Global I/O®: Miner’s Price Review (15 Jan 2015)
Inmaculada (e)
Costs and Capex
GFMS/UBS Global gold AISC curve (Jan 2015)*

90%
34%
90%
100%
100%
100%
100%
100%
100%
90%
10%
66%
10%
Overall progress
Paste backfill
Plant construction
Contracts & Procurement
EIS approval
Permitting
Engineering
Mine development
Electricity transmission line
Infrastructure & Access
Completed Remaining
12
12
Majority of key deliverables completed
Overall project progress
INMACULADA PROGRESS
On track to produce 6-7m oz in 2015
Approx. 200kt of mineral already stockpiled

Processing plant - building housing grinding mills Processing plant - grinding mill installation
Processing plant – pre-thickener Processing plant – lixiviation tanks
Primary crusher being installed Ramp entrance
Main camp Processing plant: CCD tanks
HOCHSCHILD MINING: INMACULADA
13
Hochschild’s new mine set to deliver 11-12m oz in 2016

INMACULADA UPSIDE
14
Quellopata system
Upside outside current Angela resource base
6m average vein width
Selected key intercepts
[email protected] g/t Au & 1,851 g/t Ag [email protected] g/t Au & 531 g/t Ag
[email protected] g/t Au & 188 g/t Ag
[email protected] g/t Au & 81 g/t Ag [email protected] g/t Au & 81 g/t Ag
3.50m@ 7.12g/t Au & 369g/t Ag 1.50m@ 6.34g/t Au & 180g/t Ag
3.12m@ 31.55g/t Au & 199g/t Ag
[email protected] g/t Au & 153 g/t Ag
[email protected] g/t Au & 214 g/t Ag
Inmaculada area

REGIONAL UPSIDE
15
Consolidating a major mining district
• Mining concession & superficial rights secured
• 60km mineralised belt with new veins discovered
• Geochemical results show Au/Ag presence at surface
• Mapping over the whole district to be completed in 2015
• Corina: 100% earn-in with Lara Exploration Ltd.
― 4 km vein with Au values at surface - 20 km from Selene
• Strong potential to:
― Increase resource base at Inmaculada & Pallancata
― Discover a new mine
Substantial land package in Hochschild’s Southern Peru cluster

• Substantial areas of the deposit still to be explored
• Continuing the extension of the Tunnel 4 vein system
• Baja vein re-evaluation including base metal potential
• New Lucero vein discovery:
― Potentially two veins with known 400m strike
― Very high Ag values (>1,000 g/t Ag)
• Pamela Sur veins: Up to 3 km of inferred strike length. Testing for continuity in 2015
PERUVIAN BROWNFIELD EXPLORATION: ARCATA
16
Peruvian assets remain highly prospective
Strong exploration potential remains at Arcata
DDH764 LM-14 (4337) • Vein width: up to 1.43m • Au: up to 4.94 g/t • Ag: up to 2,102 g/t
DDH742 LM-14 (4339) • Vein width: up to 0.97m • Au: up to 11.12 g/t • Ag: up to 1,437 g/t
Lucero veins
DDH742 LM-14 (4335) • Vein width: up to 1.11m • Au: up to 1.55 g/t • Ag: up to 329 g/t
Pamela Sur Veins
Baja SW Baja
Tunel 4
Marion
Marion NW
Pamela NS
PamelaPamela W
Lucero4333
4335
43374339
784000
784000
792000
792000
83
40
00
0
83
40
00
0
83
48
00
0
83
48
00
0
LEGEND
Samples
Mine
Vein
Arcata
Arcata
5Km
DDH742 LM-14 (4335) • Vein width: up to 0.9m • Au: up to 1.75 g/t • Ag: up to 661 g/t

PERUVIAN BROWNFIELD EXPLORATION: PALLANCATA
17
Peruvian assets remain highly prospective
Pallancata exploration programme recommenced
BenefitPlant
Yanacochita
Bolsa
Farallón
Royropata
Pallancata
Mercedes
Rina
Charo
LuisaYurika Virgen del
Carmen
San
CayetanoFalla NS
Alizze
Pacapausa
Pallancata
695000
695000
700000
700000
83
70
00
0
83
70
00
0
83
75
00
0
83
75
00
0
2Km
LEGEND
Resources potential areas
Veins
Observed vein
Pallancata vein
Infered vein
Mine
Project
Claims
• 2014 brownfield exploration programme delayed due to surface rights permission – now secured
• Exploring & drilling new targets in the Yurika – Luisa area
• 19,100m programme in 2015 to focus on inferred resource exploration
• Additional geological mapping of west and south side for new target definition

0
10
20
30
40
2013 2014 2015 2016
PRODUCTION IMPACT
Production uplift
18
3 years of growth
20.5 22.2
M Ag eq oz
24.0
29.0
Inmaculada Ageing operations Core operations
Expected attributable production

MEDIUM TO LONG TERM GROWTH POTENTIAL
19
Pipeline of projects spread across the Americas
Strong portfolio optionality
• Brownfield potential at all current
operations
• Portfolio of growth options spread across
the Americas
• 2015 greenfield activity focused on most
promising options including:
―Riverside JV in Mexico
―Corina & Ibel projects in Peru
Volcan (100% owned)
• Acquired as future strategic resource
• Large Chilean gold deposit
• Water rights purchased by Andina
• 9.6m oz of gold resources
• Open pit project in S.Peru Cluster
• Expected 2.7m Ag Eq p.a.
• Construction permit approved
• Remaining capex of $80m
Crespo (100% owned)
• Several veins delineated
• Over 100m oz of silver Eq resources
• Geological potential in district
• Large overall land package
Azuca (100% owned)
Chile
Peru
Peru

MARKET NOT RECOGNISING INMACULADA VALUE
20
Valuation gap exists versus other primary silver producers
4.8x
5.7x
11.9x
12.0x
12.9x
14.2x
2.9x 3.4x
9.0x
8.0x 8.5x
13.3x
First Majestic Hochschild Tahoe Fresnillo Hecla Pan American
2015e 2016e
*Source: BAML European Metals & Mining Weekly/ North American Precious Metal Weekly
29 40
54
95
132
175
22
41 42
87
120 130
Hochschild Pan American First Majestic Tahoe Hecla Fresnillo
2015e 2016e
BAML EV/EBITDA forecasts vs
primary silver peers*
BAML 2015e adjusted market cap per oz
production vs primary silver peers*

SUMMARY
21
Delivering profitable growth
2015 AISC: $15-16/oz
Key value catalyst
Growth fully financed
Cost Competitiveness • Company savings targets exceeded • All operations cashflow positive
Project Execution • Close to completion of low cost growth driver • Production set to increase by over 30%
Financial Efficiency • Flexible balance sheet strategy • Cashflow set to double

23 Hanover Square, London, W1S 1JB, Tel: +44 (0) 20 3714 9040 www.hochschildmining.com
Charlie Gordon +44 (0)20 3714 9042 [email protected]

CORE ASSETS OPTIMISED
• Located in Southern Peru Cluster - 4,600 MASL
•Underground operation - commenced in 1964
• Conventional & mechanised cut-and-fill mining
• 2014 All-in sustaining costs: $17.7/oz
• Current plant capacity: 1,500 t/day
Arcata
23
100% owned Pallancata 100% owned
• Located in Southern Peru Cluster
•Underground operation – commenced in 2007
•Mined using cut and fill
• 2014 All-in sustaining costs: $16.7/oz
• Current plant capacity:1,800 t/day
San Jose 51% owned
• Located in Argentina, in Santa Cruz province
•Underground operation – commenced in 2007
• Low sulphidation with quartz sulphide veins
• 2014 All-in sustaining costs: $17.8/oz
• Current plant capacity: 1,650 t/day
2014 2013
Ore production (tonnes) 701,947 900,861
Average silver grade (g/t) 286 217
Average gold grade (g/t) 0.85 0.74
Silver produced (koz) 5,827 4,984
Gold produced (koz) 16.89 16.83
Silver equivalent produced (koz) 6,841 5,994
Unit cost ($/t) 89.1 81.3
Total cash cost ($/oz Ag co-product) 12.6 12.7
All-in sustaining cost ($/oz) 17.7 20.9
2014 2013
Ore production (tonnes) 1,051,068 1,088,712
Average silver grade (g/t) 238 264
Average gold grade (g/t) 1.03 1.13
Silver produced (koz) 6,527 7,628
Gold produced (koz) 24.34 27.83
Silver equivalent produced (koz) 7,988 9,298
Unit cost ($/t) 69.3 68.3
Total cash cost ($/oz Ag co-product) 11.0 10.3
All-in sustaining cost ($/oz) 16.7 16.7
2014 2013
Ore production (tonnes) 571,017 536,937
Average silver grade (g/t) 404 425
Average gold grade (g/t) 5.77 6.42
Silver produced (koz) 6,469 6,357
Gold produced (koz) 94.16 98.83
Silver equivalent produced (koz) 12,119 12,286
Unit cost ($/t) 197.8 210.0
Total cash cost ($/oz Ag co-product) 12.1 13.4
All-in sustaining cost ($/oz) 17.8 19.0
24
0
400
800
1200
1600
2000
Bol Koni Mansur
Pascua Lama
Navidad La Pitarrilla Deep Glogow
Oroyek Metates Toromocho Cordero Mehdiabad Cumo Corani
Resources Reserves
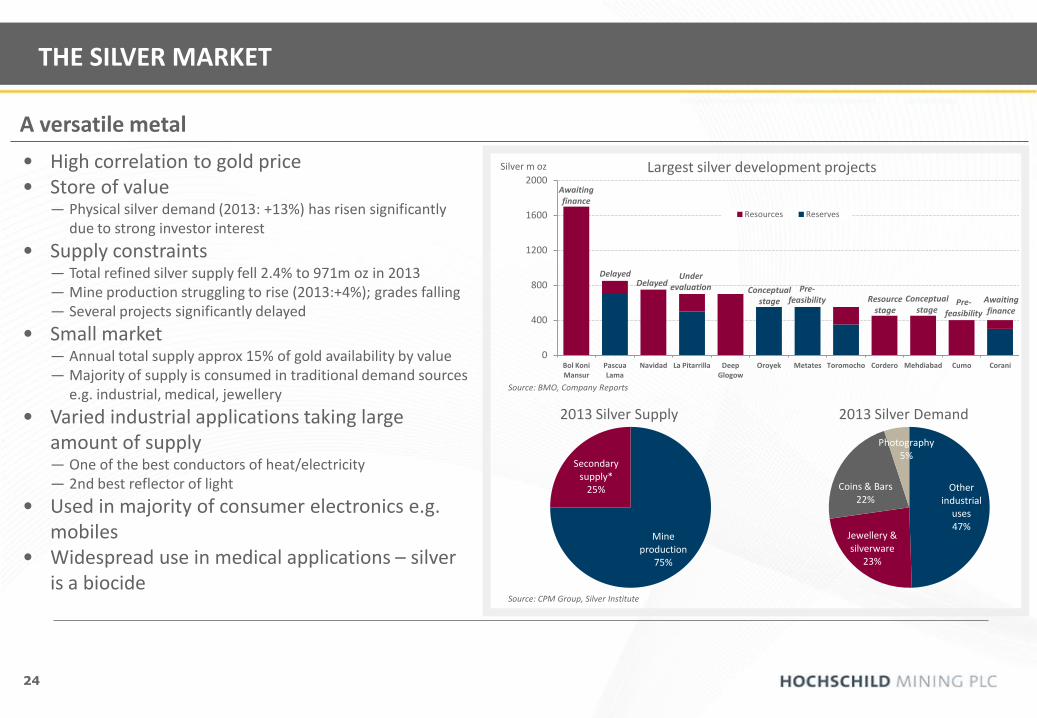
Largest silver development projects
Source: BMO, Company Reports
Silver m oz • High correlation to gold price • Store of value
― Physical silver demand (2013: +13%) has risen significantly due to strong investor interest
• Supply constraints ― Total refined silver supply fell 2.4% to 971m oz in 2013 ― Mine production struggling to rise (2013:+4%); grades falling ― Several projects significantly delayed
• Small market ― Annual total supply approx 15% of gold availability by value ― Majority of supply is consumed in traditional demand sources
e.g. industrial, medical, jewellery
• Varied industrial applications taking large amount of supply ― One of the best conductors of heat/electricity ― 2nd best reflector of light
• Used in majority of consumer electronics e.g. mobiles
• Widespread use in medical applications – silver is a biocide
Mine production
75%
Secondary supply*
25%
2013 Silver Supply
Other industrial
uses 47%
Jewellery & silverware
23%
Coins & Bars 22%
Photography 5%
2013 Silver Demand
A versatile metal
THE SILVER MARKET
Source: CPM Group, Silver Institute
Awaiting finance
Delayed Delayed
Under evaluation Conceptual
stage
Pre-feasibility Resource
stage Conceptual
stage Pre-
feasibility
Awaiting finance