lindsey ann czarnecki in partial fulfillment of the
TRANSCRIPT

INTRANASAL CADMIUM EXPOSURE INDUCES OLFACTORY
PATHOPHYSIOLOGY AND SENSORY DEFICITS
By
LINDSEY ANN CZARNECKI
A thesis submitted to the
Graduate School-New Brunswick
Rutgers, The State University of New Jersey
in partial fulfillment of the requirements
for the degree of
Master of Science
Graduate Program in Psychology
written under the direction of
Dr. John P. McGann
and approved by
________________________
________________________
________________________
New Brunswick, New Jersey
May 2012

ii
ABSTRACT OF THE THESIS
Intranasal cadmium exposure induces olfactory pathophysiology, disruption of sensory
afferents, and sensory impairment in the mouse olfactory system
By LINDSEY ANN CZARNECKI
Thesis Advisor: John P. McGann, PhD
Intranasal exposure to cadmium has been related to olfactory dysfunction in humans and
to nasal epithelial damage and altered odorant-guided behavior in rodent models. The
pathophysiology underlying these deficits has not been fully elucidated. Here we use
optical imaging techniques to visualize odorant-evoked neurotransmitter release from the
olfactory nerve into the brain’s olfactory bulbs in vivo in mice. Intranasal cadmium
chloride instillations reduced this sensory activity by up to 91% in a dose-dependent
manner. In the olfactory bulbs, afferents from the olfactory epithelium could be
quantified by their expression of a genetically-encoded fluorescent marker for olfactory
marker protein. At the highest dose tested, cadmium exposure reduced the density of
these projections by 20%. In a behavioral psychophysical task, mice were trained to
sample from an odor port and make a response when they detected an odorant against a
background of room air. After intranasal cadmium exposure, mice were unable to detect
the target odor. These experiments serve as proof of concept for a new approach to the
study of the neural effects of inhaled toxicants. The use of in vivo functional imaging of
the neuronal populations exposed to the toxicant permits the direct observation of

iii
primary pathophysiology. In this study optical imaging revealed significant reductions in
odorant-evoked release from the olfactory nerve at a cadmium chloride dose two orders
of magnitude less than that required to induce morphological changes in the nerve in the
same animals, demonstrating that it is a more sensitive technique for assessing the
consequences of intranasal neurotoxicant exposure. This approach is potentially useful in
exploring the effects of any putative neurotoxicant that can be delivered intranasally.

iv
Acknowledgement
First, I would like to thank my advisor, Dr. John P. McGann, for his guidance and
support. I would also like to thank my committee members, Dr. Tracey Shors and Dr.
Jason Richardson for their feedback and comments on this thesis. I would like to
acknowledge my fellow lab members Andrew Moberly, Tom Rubenstein, Daniel Turkel
and Joseph Potackal for their assistance. Finally, a huge thank you to my fellow graduate
students, friends and family for their support and encouragement. Data in this thesis were
published in the August 2011 issue of NeuroToxicology.

v
Table of Contents
Abstract................................................................................................................................ii
Acknowledgement..............................................................................................................iv
Table of contents..................................................................................................................v
List of figures......................................................................................................................vi
Introduction......................................................................................................................... 1
Olfactory bulb..........................................................................................................2
Cadmium..................................................................................................................3
Techniques...............................................................................................................6
Materials and methods.........................................................................................................8
Subjects....................................................................................................................8
In vivo imaging of neurotransmitter release.............................................................9
Olfactory bulb histology........................................................................................12
Odorant detection...................................................................................................13
Results................................................................................................................................15
Effect of cadmium on odorant-evoked neurotransmitter release...........................15
Effect of cadmium on ORN axonal connectivity...................................................18
Effect of cadmium on odorant detection................................................................20
Discussion..........................................................................................................................21
References..........................................................................................................................25

vi
List of Figures
Figure 1. Schematic of olfactory bulb circuitry...................................................................3
Figure 2. SynaptopHluorin in vivo.......................................................................................6
Figure 3. SynaptopHluorin in histological section..............................................................7
Figure 4. Odorant response maps after acute cadmium exposure.....................................17
Figure 5. Odorant evoked neurotransmitter release after acute cadmium exposure.........18
Figure 6. ORN axonal innervation of olfactory bulbs after cadmium exposure................19
Figure 7. Odorant detection performance after cadmium exposure..................................20

1
Introduction
The primary sensory neurons of the olfactory system, olfactory receptor neurons
(ORNs), reside in the olfactory epithelium lining the nasal cavity and are exposed to the
external environment. Inhaled odorants bind to a subset of ORNs, which project their
axons to the olfactory bulb. ORN exposure to the environment may also provide a route
of entry for aerosolized toxicants to enter the central nervous system. Following toxicant
exposure (Adams & Crabtree, 1961; Hastings & Evans, 1991; Mascagni et al., 2003;
Rose et al., 1992) and in some neurodegenerative diseases such as Alzheimer’s and
Parkinson’s diseases (Mesholam et al., 1998; Haehner et al., 2007; Ross et al., 2008),
olfactory dysfunction may present as one of the earliest or most prominent symptoms. It
has been suggested that the olfactory system may act as a vector in these disease states, as
the olfactory bulb projects to numerous brain regions. The olfactory system may serve as
a vector by either transporting toxicants into the brain via the olfactory nerve or, being
particularly sensitive to neurodegeneration, inducing pathological processes in brain
regions receiving bulbar projections, thus producing clinical hallmarks and classic
symptoms (see Doty, 2008). Here, we focus on the pathophysiological, histopathological
and perceptual deficits induced by acute intranasal exposure to the heavy metal cadmium.
The current experiment used a genetically encoded excocytosis indicator,
synaptopHluorin (spH) to visualize odorant-evoked neurotransmitter release from ORNs,
quantified ORN innervation of the olfactory bulb, and tested olfactory function in mice
exposed to intranasal cadmium. We found that in vivo optical imaging revealed a
significant functional impairment at a dose 1/2000th of that seen in previous work

2
analyzing histological sections (Bondier et al., 2008) and at a dose 1/100th of that which
produced histopathology in the same animals.
1. Olfactory bulb
Interaction with environmental stimuli and basic structure
Olfactory transduction begins when volatile compounds bind to ORNs located in
the olfactory epithelium lining the inside of the nasal cavity. A multigene family codes
for approximately 1000 different receptor types in the rodent (Buck & Axel, 1991). Each
of the millions of ORNs in the olfactory epithelium expresses only one receptor type.
Receptor types differ in binding affinities for odor molecules of varying chemical
features (Cagan & Zeiger, 1978; Caprio & Byrd, 1984; Malnic et al. 1999). From the
epithelium, axons from ORNs expressing the same receptor type segregate as they project
to the olfactory bulb (via the olfactory nerve) such that ORNs expressing the same
receptor converge onto one or a few corresponding ipsilateral olfactory bulb glomeruli
(Ressler et al., 1994; Potter et al., 2001). Olfactory bulb glomeruli are neuropils
composed of ORN axons, mitral/tufted cells, top-down inputs from higher brain areas and
are surrounded by a ring of juxtaglomerular interneurons (see Fig. 1) (Pinching & Powell,
1971; Shepherd, 2004). When an odorant enters the nasal cavity, it is sorbed into the
mucosa and binds to a subset of ORNs in the epithelium depending on the odorant-
affinity of the receptor each expresses. Odorant binding activates an intracellular
signaling cascade that induces the firing of an action potential, which propagates down
the axon to the olfactory bulb glomerulus targeted by ORNs expressing that odorant
receptor type. Because odorants drive sensory input into corresponding, odorant-specific

3
subsets of glomeruli, there is a “spatial map” of activity in the olfactory bulbs that codes
for odor quality (Malnic et al., 1999; Stewart et al., 1979; Sharp et al., 1975).
The consistency of glomerular innervation by ORN axons is remarkable
considering that cells in the olfactory epithelium are constantly being turned over. The
cycle of generation and turnover normally occurs on a 28-day timescale (Carr &
Farbman, 1993; Graziadei & Monti Graziadei, 1979) and continues throughout an
animal’s life. Neuronal precursor cells in the olfactory epithelium either reside in the
epithelium or migrate as proliferated ORNs (Calof et al., 1995). This adult neurogenesis
in the olfactory epithelium may be particularly beneficial in a system that is continually
exposed to environmental toxicants.
2. Cadmium
Cadmium (Cd) is a heavy metal found as an airborne particulate in cigarette
smoke and industrial settings such as smelters and battery manufacturing plants. The
OSHA permissible limit in workplace air is 5 µg/m3 averaged over 8 hours (ATSDR,
Figure 1. Olfactory receptor neurons projecting to the olfactory bulb. Modified from Mori (1995). Similar olfactory receptor neurons interspersed in the olfactory epithelium converge into the same glomerulus in the olfactory bulb.

4
2008). Cadmium toxicity is characterized clinically by olfactory dysfunction,
osteoporosis, and renal failure (ATSDR, 2008). Intranasal exposure to cadmium may
impair ORN signaling due to damage to the olfactory epithelium or olfactory bulb tissue,
either by direct pharmacological actions of cadmium or through cadmium’s neurotoxic
effects.
Cadmium has been shown to transport to the olfactory bulbs after aerosolized
exposure (Evans & Hastings, 1992; Tallkvist et al., 2002; Tjälve et al., 1996). Once
inside the cell, cadmium can trigger inflammatory, necrotic and apoptotic processes. In
vitro, CdCl2 exposure has been shown to upregulate p38 MAPK in endothelial cells (Jung
et al., 2008) and increase reactive oxygen species in cortical neurons (López et al., 2006).
Cadmium increases intracellular IP3, thus increasing calcium concentration by releasing it
from intracellular stores (Wang et al., 2008). Resulting cytosolic calcium concentration
alterations can lead to cellular apoptosis (Wang et al., 2008; Jung, et al., 2008). In
cortical neurons, cadmium incubation resulted in apoptosis through increased caspase-3
activity as well as necrotic cell death at higher concentrations (Kim, et al., 2000; López et
al., 2003). Both L- and T-type voltage-sensitive calcium channels are expressed in
olfactory ORNs and may provide a potential mechanism for cadmium-induced olfactory
pathology (Gautam et al., 2007; Miyamoto et al., 1992). Through disruption of calcium
channels or inducing cell death, cadmium may impair neurotransmitter release in vivo, a
potential mechanism of cadmium induced dysosmias.
Cadmium and Olfaction
Olfactory deficits linked to cadmium exposure have been documented since the
1950’s (Friberg, 1950). Industrial workers exposed to airborne cadmium for as little as 4

5
years have an increased olfactory detection threshold (Adams & Crabtree, 1961;
Mascagni et al., 2003; Rose et al., 1992; Sułkowski et al., 2000) and impaired ability to
identify odors (Sułkowskiet al., 2000). With longer exposure durations, more than 30
years in one population, over 90% of workers presented with olfactory dysfunction
(Potts, 1965). Because cadmium may become aerosolized and inhaled and there are
numerous clinical reports of olfactory deficits after cadmium exposure, the olfactory
system may be a powerful model system to study the effects of cadmium on neural
function.
Rodent models of cadmium exposure report conflicting results. Findings vary
from no olfactory impairment (Sun et al., 1996) to immediate but reversible anosmia
(Bondier et al., 2008). The inconsistent reports apply both to varying degrees of
pathology and behavioral impairment in odorant-guided tasks (Bondier et al., 2008;
Hastings, 1990; Sun et al., 1996). In one such study, histological analysis revealed that
one intranasal instillation of 400µg CdCl2 reduced epithelial cell thickness to 3 or 4 cell
layers, compared to 20 cell layers in control tissue. Behaviorally, the animals exposed to
cadmium showed no difference in preference between butanol (aversive) and water
containing arms in a y-maze. This suggests an inability of animals exposed to Cd to
discriminate between the aversive and neutral olfactory stimuli (Bondier et al., 2008).
When allowed to recover, cadmium-exposed animals began showing an increase towards
water arm preference at 10 days post instillation and normalized around 18 days post
instillation, but at this time point epithelial thickness had recovered only to about half of
control thickness. This disconnect between epithelial histopathology and sensory
function suggests that although a subset of cells in the epithelium remained after Cd-

6
exposure, they may not have been functional or may not be sufficient to drive activity in
areas receiving bulbar projections, leading to disrupted odorant perception. Physiological
measurements from remaining ORNs could reveal important aspects of the
pathophysiology underlying cadmium-induced olfactory dysfunction.
3. Techniques
SynaptopHluorin (spH) is a construct composed of pH-sensitive green fluorescent
protein (GFP) bound to vesicle-associated membrane protein (vamp) and used to
visualize exocytosis (Fig. 2) (Miesenböck et al., 1998). The pH-sensitive GFP is
sequestered inside the lumen of synaptic vesicles, and consequently quenched by the
intravesicular acidic pH. During exocytosis, docked vesicles and the spH therein are
exposed to the neutral extracellular pH, causing a rapid increase in fluorescence (see Fig.
2C). This change in fluorescent spH signal is a linear indicator of neurotransmitter
release from the olfactory nerve into the olfactory bulb glomeruli (Wachowiak et al.,
2005). In the mice used here, spH is expressed under the control of olfactory marker
protein (OMP) promoter (Bozza et al., 2004). OMP is normally expressed in mature
A
B
C
Figure 2. SynaptopHluorin (spH) is a linear indicator of neurotransmitter release. (A) In vivo resting light image of the dorsal olfactory bulbs visualized through a cranial window in the OMP-spH mouse. (B) 20x magnification visualizing individual axons converging into glomeruli. (C) Schematic of spH activity. pH-sensitive GFP is bound within each synaptic vesicle, where its fluorescence is normally quenched by the acidity of the intravesicular lumen. When the vesicle releases its transmitter, the neutralization of the vesicular pH causes a rapid increase in GFP fluorescence. The fluorescence then gradually returns to baseline fluorescence levels with vesicle reuptake.
7
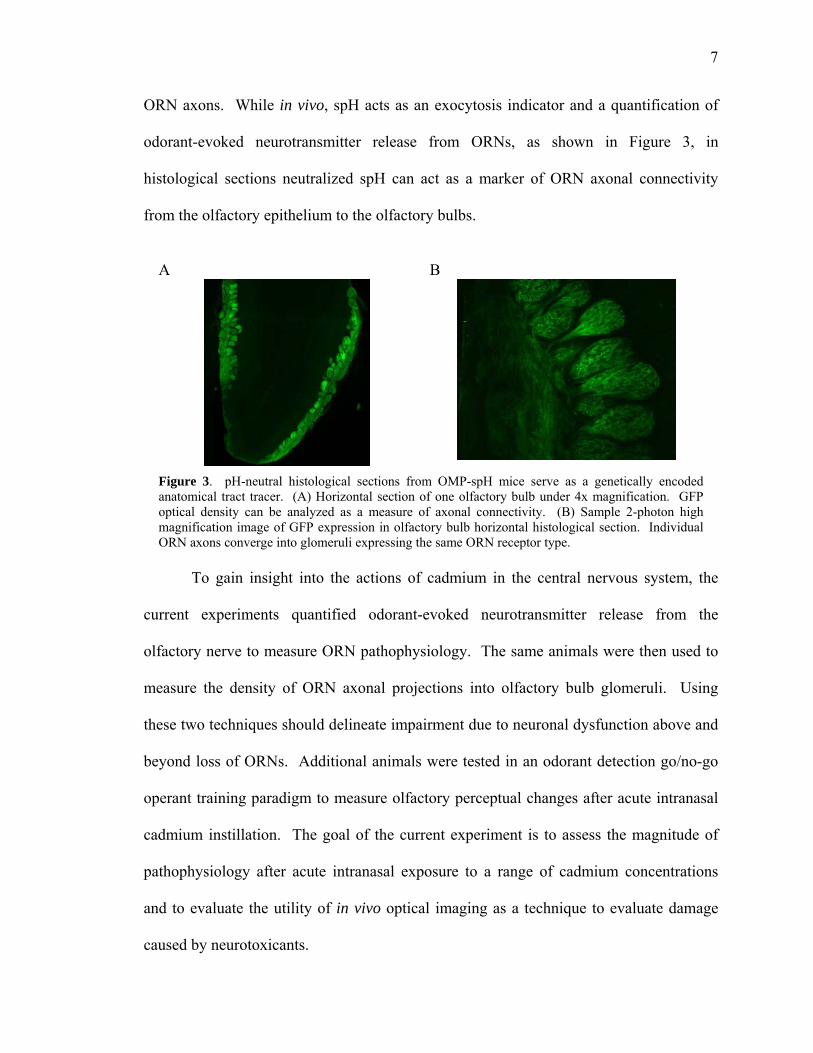
ORN axons. While in vivo, spH acts as an exocytosis indicator and a quantification of
odorant-evoked neurotransmitter release from ORNs, as shown in Figure 3, in
histological sections neutralized spH can act as a marker of ORN axonal connectivity
from the olfactory epithelium to the olfactory bulbs.
To gain insight into the actions of cadmium in the central nervous system, the
current experiments quantified odorant-evoked neurotransmitter release from the
olfactory nerve to measure ORN pathophysiology. The same animals were then used to
measure the density of ORN axonal projections into olfactory bulb glomeruli. Using
these two techniques should delineate impairment due to neuronal dysfunction above and
beyond loss of ORNs. Additional animals were tested in an odorant detection go/no-go
operant training paradigm to measure olfactory perceptual changes after acute intranasal
cadmium instillation. The goal of the current experiment is to assess the magnitude of
pathophysiology after acute intranasal exposure to a range of cadmium concentrations
and to evaluate the utility of in vivo optical imaging as a technique to evaluate damage
caused by neurotoxicants.
A
B
Figure 3. pH-neutral histological sections from OMP-spH mice serve as a genetically encoded anatomical tract tracer. (A) Horizontal section of one olfactory bulb under 4x magnification. GFP optical density can be analyzed as a measure of axonal connectivity. (B) Sample 2-photon high magnification image of GFP expression in olfactory bulb horizontal histological section. Individual ORN axons converge into glomeruli expressing the same ORN receptor type.

8
4. Materials and methods
4.1 Subjects
OMP-spH mice express the spH construct from the locus for OMP. Homozygous
OMP-spH are on an albino C57BL/6 background. Animals heterozygous for OMP-spH
were homozygous OMP-spH mice crossed with a 129 strain. Previous reports show no
differences between mice homozygous and heterozygous for spH (Bozza et al., 2004;
McGann et al., 2005). Imaging experiments were conducted on 12 male homozygous
and heterozygous OMP-spH mice aged 6 to 10 weeks. Subjects in behavioral
experiments were eleven female C57BL/6 mice initially aged 6 weeks, purchased from
Charles River Laboratories. All animals were group housed with a 12:12 h light:dark
cycle. Mice used for imaging procedures had food and water available ad libitum.
Animals used in behavioral testing were water restricted and maintained at 90% of
original body weight. All procedures were performed in accordance with protocols
approved by the Rutgers University Animal Care and Use Committee.
4.2 Intranasal infusions
Mice in cadmium-exposed groups received intranasal instillations of 6 µL of pH
7.4 buffer solution containing 200 mM HEPES, 0.9% NaCl, and either 18.18 mM, 1.818
mM, or 0.182 mM CdCl2 as noted. These concentrations yield individual infusions of
20µg, 2 µg, and 0.2 µg of cadmium chloride, respectively. Mice used in imaging
experiments received an infusion of cadmium solution into one external naris and vehicle
solution (without CdCl2) into the contralateral naris, with side randomly counterbalanced
across subjects. Because the nasal passages on the left and right sides are separated by a
nasal septum and the ORN projections are strictly ipsilateral, this design permitted

9
within-subjects, left vs. right comparisons. Mice used in behavioral experiments received
bilateral infusions of either cadmium or vehicle solution. Reflux of the instillate was not
observed.
For the intranasal instillation procedure, animals were lightly anesthetized with
1000µg/kg metatomadine and 70mg/kg ketamine administered intraperitoneally (i.p). An
Eppendorf microloader attached to a 10µL Hamilton syringe containing the infusate was
inserted 7mm into one naris, the mouse was placed on its back, and the infusion was
delivered. The animal remained on its back for five min and was then rotated to its side
for another 20 min to ensure coverage across the epithelium. The procedure was repeated
for the other naris. Anesthesia was then reversed by subcutaneous (s.c.) injection of
1mg/kg atipamezole hydrochloride. The mouse was maintained on a heating pad and
given food and water ad libitum during overnight recovery from anesthesia. The
experimenter was blind to the contents of all infusates.
4.3 In vivo imaging of neurotransmitter release
4.3.1 Surgical implantation of cranial window
Two days after intranasal cadmium exposure, mice were anesthetized with 0.01
mL/g of 10 mg/mL pentobarbital (i.p.), with 0.05 mL boosters as needed to maintain
anesthetic plane. Body temperature was maintained using a rectal temperature probe and
feedback-regulated heating pad. Mice were administered 0.005mL/g 0.1% atropine (s.c.)
to reduce nasal secretions and ~0.25mL of 0.25% bupivacaine (s.c.) as a local anesthetic
along the scalp. The scalp was shaved, then surgically opened with a midline incision.
The periosteal membrane was removed and the skull dried with a 70% ethanol solution.

10
A headbar was fixed to the skull using dental acrylic to rigidly mount the mouse’s skull
to a custom headholder. Using a micromotor dental handpiece, the skull overlying both
olfactory bulbs was thinned until transparent when wet. Ringer’s solution containing
140 mM NaCl, 5 mM KCl, 1 mM CaCl2, 1 mM MgCl2, 10 mM HEPES and 10 mM
dextrose was applied over this cranial window, then topped with a glass coverslip.
4.3.2 Imaging apparatus
Optical imaging was performed using a custom apparatus composed of an
Olympus epifluorescence illuminator coupled to an Olympus XLFluor4X macro
objective (0.28 NA). Illumination was provided by an Opti-Quip 150W Xenon arc lamp
with a 25% neutral density filter and controlled by a Uniblitz shutter. Macro-format
fluorescence filter cubes included an HQ480/40 excitation filter, Q505LP dichroic mirror,
and HQ535/50 emission filter (Chroma Technology). Images were acquired using a
RedShirtImaging monochrome, back-illuminated CCD camera (NeuroCCD SM256) at
256 x 256 pixel resolution and frame acquisition rate of 7 Hz. The mouse was positioned
under the microscope using a custom 3-axis optomechanical stage. The entire apparatus
floated on a TMC vibration isolation table.
Odorants were presented by a custom built eight-channel, air dilution
olfactometer controlled by a computer running software written for MatLab
(Mathworks). Nitrogen was passed through vials of pure odorant to produce a saturated
carrier vapor that was then diluted into ~500 mL/minute ultrazero-humidity compressed
air by computer-controlled mass flow controllers at a user-specified ratio. Wetted parts
downstream of the odorants were made of PTFE or PEEK, and source gases were filtered

11
by a hydrocarbon/moisture gas purification system (Chromatography Research Services).
Stimulus onset and offset were controlled by a computer controlled valve that shunted a
vacuum from and to an odorant-removal tube concentric with the odorant delivery tube
after the manner of Kauer and Moulton (1974). The odorant delivery tube was placed
within 2cm of the mouse’s nose. Odorants included methyl valerate, 2-methyl 2-butanal,
hexanone and butyl acetate, which are known to evoke transmitter release on the dorsal
aspect of the olfactory bulb (Bozza et al., 2004; Wachowiak & Cohen, 2001). They were
presented in 6 sec trials at a 2-6% dilution of saturated vapor. The minimum intertrial
interval was 60 sec. The experimenter was blind to the experimental condition of the
mouse.
4.3.3 Imaging data analysis
Imaging data were analyzed as described previously (McGann et al., 2005).
Briefly, blank trials on which no odorants were presented were subtracted from each
odorant trial to correct for bleaching. Odorant-evoked glomerular responses were
measured as the average of 15 frames centered on the peak of the fluorescence increase
minus the average of 15 baseline frames immediately prior to odorant onset. Trials were
treated individually for amplitude measurements and averaged within odorants to create
spatial maps of odorant-evoked responses. Candidate regions of interest corresponding to
olfactory glomeruli were initially selected by hand and then confirmed statistically. A
glomerulus was operationally defined as responding to an odorant if its average response
across trials of that odorant was greater than zero by three standard errors or more.

12
Analysis was performed using custom software written in MatLab and exported to Excel,
SPSS, and SigmaPlot for statistical analysis.
4.4 Olfactory bulb histology
4.4.1 Histological procedures
Immediately after imaging, animals were intracardially perfused with 0.1M
phosphate-buffered solution (PBS) followed by 4% paraformaldehyde. Brains were
removed and post-fixed in 4% paraformaldehyde. Tissue was transferred to PBS at least
24 h before sectioning. Brains were blocked to include both olfactory bulbs and the
frontal cortex and sectioned horizontally at 50 µm on a vibratome. Slices were mounted
in ProLong Gold antifade agent (Invitrogen) containing DAPI on glass slides and sealed
under a glass coverslip.
4.4.2 Quantification of glomerular afferents
Photos of approximately 20sections from each olfactory bulb were taken at a
resolution of 1360 x 1024 pixels and 14 bit analog-to-digital conversion with a Jenoptik
MFcool Peltier-cooled CCD camera mounted on an Olympus BX41 microscope at 4X
(0.16 NA). Images were collected with both DAPI (D350/50x excitation filter, T400LP
dichroic mirror, and ET460/50m emission) and GFP (ET470/40x excitation filter,
T495LP dichroic mirror, and ET525/50m emission) appropriate filter sets. Images were
opened in ImageJ (NIH) and the glomerular layer of each olfactory bulb was selected as a
region of interest based on the rings of periglomerular interneurons visualized by the
DAPI stain. The optical density of these regions of interest was then measured in the

13
corresponding image taken using the GFP-appropriate optical filter. Optical densities
were recorded in Excel and exported to SPSS for statistical analysis. Experimenters were
blind to the experimental condition of the animal until after the quantification was
completed.
4.5 Behavioral experimentation
4.5.1 Apparatus
Eleven wild type mice were trained in operant conditioning chambers (Coulbourn
Apparatus Habitest system) enclosed within sound attenuating cubicles (Med Associates
or Coulbourn Apparatus). Reinforcements were delivered through a reward port, where
0.01 mL of 2% sucrose solution was delivered by a liquid dipper when the mouse broke a
nosepoke photobeam on rewarded trials. Olfactory stimuli were presented through a
custom controlled-access odor port consisting of a nose poke operandum with odorant
and vacuum ports and a guillotine door on the front to prevent odorant access during the
intertrial interval. A house light and ventilation fan were also included. Odorants were
presented using custom computer controlled liquid dilution olfactometers, which passed
room air through odorant vials containing a 1:100 dilution of the odorant in mineral oil
and then on to the odor port. The rewarded olfactory stimulus was butyl acetate. Actual
concentrations in the odor ports were measured and standardized across chambers and
days of training using a ppb photoionization detector (HNU DL-101, NHU Systems,
Inc.). Each chamber and floor was washed with 70% ethanol after every session.
4.5.2 Training and testing protocols

14
Mice underwent two to three days of water restriction prior to initial training to
achieve 90% of initial weight. Training began with conventional magazine training, in
which mice received a liquid reward upon poking into the dipper port, as cued by the
magazine light. The odor port remained closed throughout magazine training. Mice
completed magazine training after 60 successful trials. In the second phase, mice were
trained to nose poke into the odor port (in the absence of odorant) when the door opened,
and then move to the reward port for reinforcement. Over at least 4 training sessions,
mice were shaped to hold the initial nose poke for at least 1 sec (based on the break of a
photobeam across the odor port) in order to receive a reinforcement. Each session lasted
60 successful trials or 60 min, whichever came first. After the mice achieved 60
successful trials in a single session, they were advanced to the odorant detection training.
In this final phase of the training, mice were trained to nose poke in the odor port when
the door opened and then to poke for reward if and only if they received the odorant butyl
acetate. The intertrial interval after correct responses was 5 sec, and incorrect responses
triggered a “time-out” punishment of 25 sec added to the intertrial interval. All training
was performed daily. Mice received their daily ration of water at the conclusion of
training to maintain body weight.
4.5.3 Testing and data analysis
Detection performance was measured by the discrimination metric (DM), defined
as the proportion of trials in which the mouse poked at the reward port when the odor was
presented (hits) minus the proportion of trials in which the mouse poked at the reward
port when the odor was absent (false alarms). Mice were considered to have reached

15
criterion performance when they exhibited a DM of 0.5 or greater (equivalent to 75%
correct performance) on three consecutive days. The average DM of these three days to
criterion served as the baseline measurement. Immediately after reaching criterion, mice
received bilateral intranasal instillations of either cadmium or vehicle solution. Mice
received ad libitum water access overnight following intranasal infusion to support their
recovery from anesthesia, and were given a single recovery day on water restriction after
the infusion. They were then tested for performance on the second day post-infusion. A
mixed model ANOVA was run with discrimination index as the dependent variable using
time point (baseline measurement, test measurement) as a within-subjects independent
variable and instillation group (cadmium, vehicle) as a between-subjects independent
variable.
5. Results
5.1 Cadmium exposure disrupts odorant-evoked neurotransmitter release from the
olfactory nerve
To assess the effects of intranasal cadmium exposure on olfactory physiology, we
used optical imaging techniques to visualize odorant-evoked neurotransmitter release
from the olfactory nerve in vivo in OMP-spH mice (Bozza et al., 2004). Consistent with
previous results (Bozza et al., 2004; Soucy et al., 2009), the patterns of odorant-evoked
activity were typically bilateral and approximately symmetric. In five control mice,
averaging across a panel of four odorants, the number of glomeruli receiving synaptic
input was not different between the left and right olfactory bulbs (average ratio 0.95 ±
0.10, one-sample t-test, p = 0.66) nor was the distribution of glomerular response
amplitudes (two-sample Kolmogorov-Smirnov test, p = 0.07).

16
To assess the effects of intranasal cadmium exposure, we measured odorant-
evoked neurotransmitter release from the olfactory nerve in twelve mice that received
intranasal instillations of cadmium chloride in one naris and vehicle in the other, thus
allowing for a within-subjects left-right comparison. We varied the dose of cadmium
chloride across mice to include 20, 2, or 0.2 g. For each odorant tested in each mouse,
we measured the number of olfactory bulb glomeruli receiving synaptic input from ORNs
and computed the ratio of glomeruli receiving input on the cadmium-exposed side to that
on the vehicle-exposed side. We then averaged these ratios across odorants to generate
an overall metric of asymmetry for each mouse. We also compared the amplitude
distributions of the observed glomerular inputs between cadmium-exposed and control-
bulbs bulbs across odorants.
As illustrated in Figures 4 and 5, intranasal exposure to 20 g cadmium chloride
greatly reduced both the number of odorant-responsive glomeruli and the amplitude of
the observed responses. As shown in Fig. 5B (upper), the overall distribution of
glomerular response amplitudes was significantly different between the olfactory bulbs
on the cadmium-exposed and vehicle-exposed sides (two-sample Kolmogorov-Smirnov
test, p < 0.001). On average, the olfactory bulb on the cadmium-exposed side included
only 9.3 ± 3.8% as many glomeruli receiving measurable input from ORNs as the
contralateral, vehicle-exposed bulb (Fig. 4 left, and Fig. 5A), a significant decrease (one-
sample t-test, p < 0.001). Among glomeruli that did receive measurable ORN input, the
response amplitudes were significantly smaller on the cadmium-exposed side (Mann-
Whitney U-test, p < 0.001).

17
Figure 4. Acute intranasal cadmium instillation reduces neurotransmitter release from the olfactory nerve into olfactory bulb glomeruli in a dose dependent manner. (Upper) Baseline fluorescence images of the dorsal olfactory bulbs visualized in vivo through a cranial window. (Lower) Pseudocolored response maps visualizing the relative increase in fluorescence during odorant presentation (horizontal black line) compared to pre-odorant baseline. Each spot corresponds to an olfactory bulb glomerulus. Traces show change in fluorescence for the specified glomerulus during entire trial.
The pathophysiological effects of cadmium exposure were strongly dose-
dependent (one-way ANOVA, p = 0.001). As shown in Figures 4 and 5A, intranasal
exposure to 2 g cadmium chloride significantly changed the distribution of glomerular
responses between cadmium-exposed and vehicle-exposed bulbs (Fig. 5B, middle;
Kolmogorov-Smirnov test, p = 0.013). The number of responsive glomeruli in the
cadmium-exposed bulb was significantly reduced to 53% ± 9% of the number on the
vehicle-exposed side (one-sample t-test, p = 0.012). The amplitude of the observed
responses was also significantly reduced (Mann-Whitney U-test, p < 0.001). Exposure to
0.2 µg cadmium chloride did not significantly change the overall distribution of
responses, which takes into account both the number and size of the observed responses
(Fig. 5B, lower; Kolmogorov-Smirnov test, p = 0.054). The number of glomeruli
receiving ORN input was not reduced (one-sample t-test, p = 0.51). However, the
18
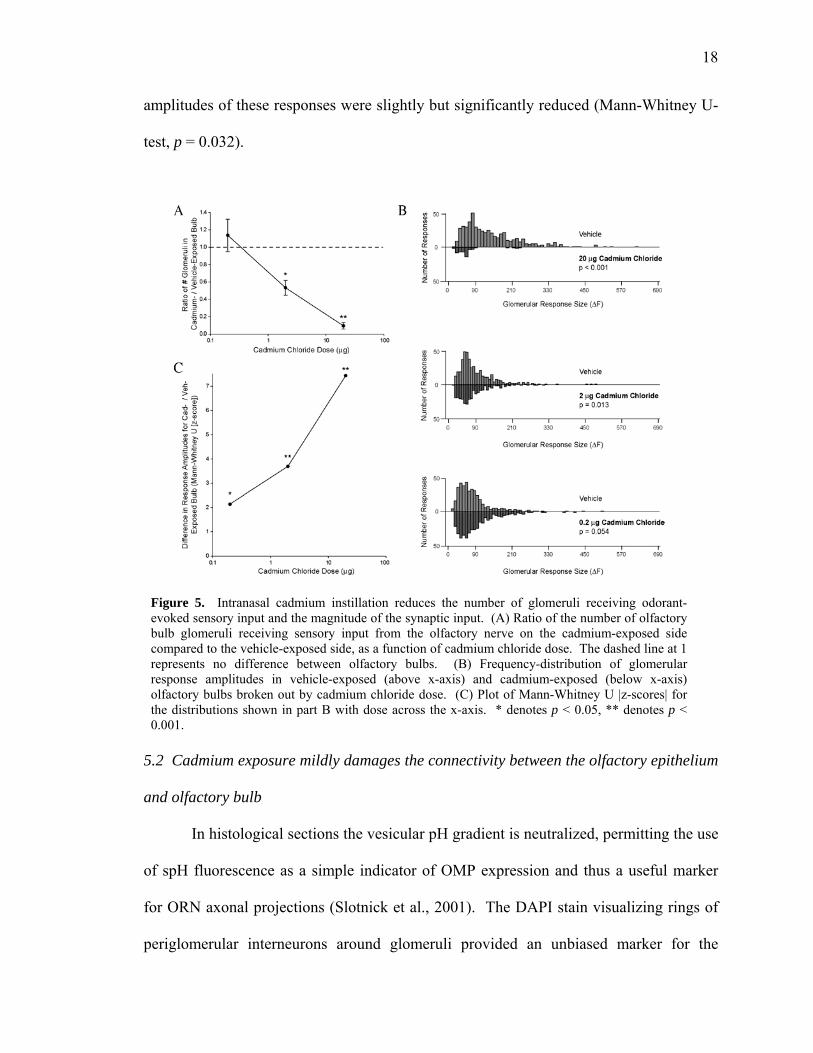
amplitudes of these responses were slightly but significantly reduced (Mann-Whitney U-
test, p = 0.032).
Figure 5. Intranasal cadmium instillation reduces the number of glomeruli receiving odorant-evoked sensory input and the magnitude of the synaptic input. (A) Ratio of the number of olfactory bulb glomeruli receiving sensory input from the olfactory nerve on the cadmium-exposed side compared to the vehicle-exposed side, as a function of cadmium chloride dose. The dashed line at 1 represents no difference between olfactory bulbs. (B) Frequency-distribution of glomerular response amplitudes in vehicle-exposed (above x-axis) and cadmium-exposed (below x-axis) olfactory bulbs broken out by cadmium chloride dose. (C) Plot of Mann-Whitney U |z-scores| for the distributions shown in part B with dose across the x-axis. * denotes p < 0.05, ** denotes p < 0.001.
5.2 Cadmium exposure mildly damages the connectivity between the olfactory epithelium
and olfactory bulb
In histological sections the vesicular pH gradient is neutralized, permitting the use
of spH fluorescence as a simple indicator of OMP expression and thus a useful marker
for ORN axonal projections (Slotnick et al., 2001). The DAPI stain visualizing rings of
periglomerular interneurons around glomeruli provided an unbiased marker for the

19
selection of glomerular layer regions of interest. As shown in Fig. 6, in mice exposed to
20 µg cadmium chloride, the optical density of GFP fluorescence in the glomeruli of
cadmium-exposed olfactory bulbs was significantly reduced to 80 ± 4% of that in the
contralateral, vehicle-exposed bulbs (one-sample t-test, p = 0.003). No significant
reductions were observed in mice exposed to the 2.0µg (p = 0.185) or 0.2µg (p = 0.253)
doses (Fig. 6B). These results suggest that at our highest concentration, intranasal
cadmium exposure can induce a reduction in axonal projections from the olfactory
epithelium to the olfactory bulb.
Figure 6. Axonal projection density from the olfactory epithelium to the olfactory bulbs is reduced at the highest cadmium dose tested. (A) Representative sections of cadmium- and vehicle-exposed olfactory bulbs across cadmium chloride doses. DAPI nuclear stain marks rings of periglomerular interneurons, while GFP is exclusively expressed in ORN axons from the olfactory epithelium into olfactory bulb glomeruli. (B) The ratio of GFP optical density from cadmium- compared to vehicle-exposed olfactory bulbs as a function of cadmium chloride dose. The dashed line at 1 represents to change in GFP expression between bulbs. ** denotes p < 0.01.
20
5.3 Intranasal cadmium exposure profoundly impairs odor detection
To investigate the functional and perceptual significance of the cadmium-induced
pathophysiology, we evaluated the effects of intranasal cadmium exposure on mice
trained to perform an odor detection go/no-go task. After reaching a criterion DM of 0.5
(equivalent to 75% correct) for three consecutive days, each mouse was randomly
assigned to receive a bilateral intranasal infusion of either 20 µg CdCl2 or vehicle. Mice
were returned to the operant task on the second day after the infusion, and their detection
performance was recorded.
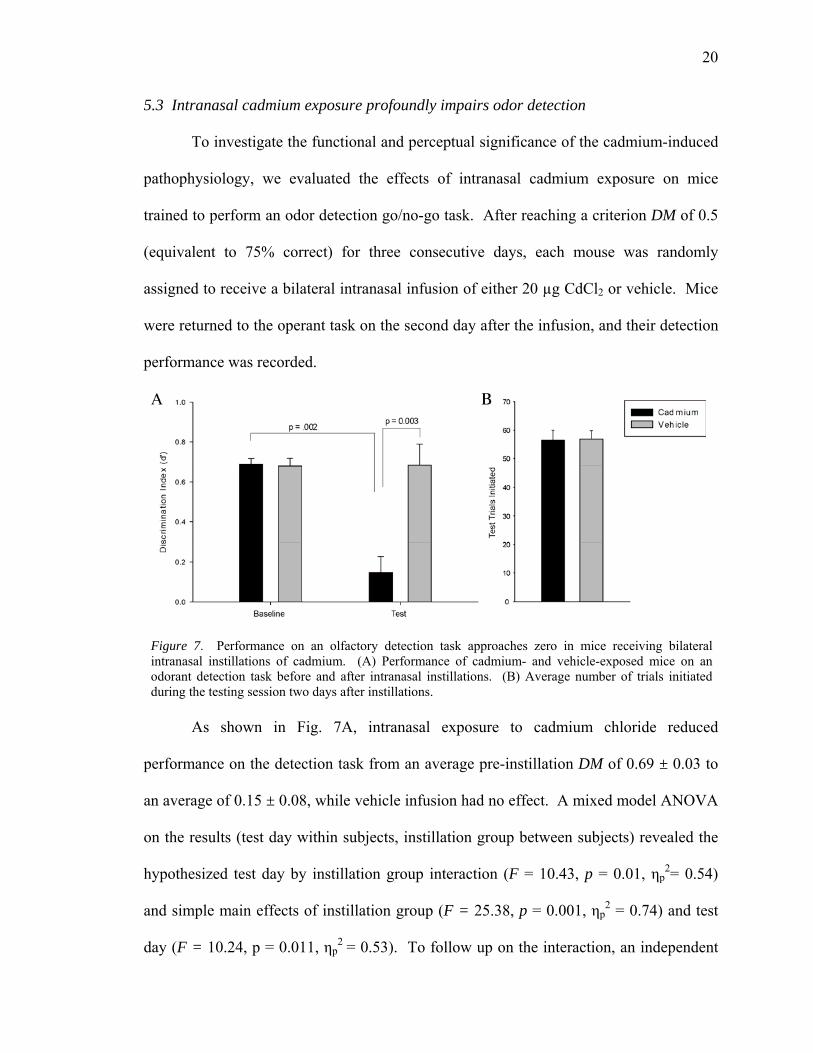
Figure 7. Performance on an olfactory detection task approaches zero in mice receiving bilateral intranasal instillations of cadmium. (A) Performance of cadmium- and vehicle-exposed mice on an odorant detection task before and after intranasal instillations. (B) Average number of trials initiated during the testing session two days after instillations.
As shown in Fig. 7A, intranasal exposure to cadmium chloride reduced
performance on the detection task from an average pre-instillation DM of 0.69 ± 0.03 to
an average of 0.15 ± 0.08, while vehicle infusion had no effect. A mixed model ANOVA
on the results (test day within subjects, instillation group between subjects) revealed the
hypothesized test day by instillation group interaction (F = 10.43, p = 0.01, ηp2= 0.54)
and simple main effects of instillation group (F = 25.38, p = 0.001, ηp2 = 0.74) and test
day (F = 10.24, p = 0.011, ηp2 = 0.53). To follow up on the interaction, an independent

21
samples t-test revealed that the average baseline discrimination index of the cadmium
animals was not significantly different (p = 0.87) from the baseline average performance
of control animals. On test day after instillation, the average DM of the cadmium-treated
animals was significantly lower (p = 0.003) than the average performance of control
animals indicating impaired odor detection. This represents a significant reduction in
cadmium-treated animal’s odor detection performance on test day compared to their own
average baseline performance (paired t-test, p = 0.002). Vehicle instilled animals did not
show this reduction on test day compared to baseline (paired t-test, p = 0.985). The
performance of the cadmium-infused animals was not significantly different from zero
(one-sample t-test, p = 0.11), demonstrating a complete lack of discrimination between
odorant-present and odorant-absent cues.
In principle, our experimental design controls for global changes in motivation
because each odor discrimination trial only occurs when the mouse initiates it by nose-
poking into the odorant-delivery port. We also observed no significant differences in the
number of trials initiated by cadmium-infused mice compared to vehicle controls
(independent samples t-test, p = 0.96), see Fig. 7B. Because the cadmium-infused mice
were just as engaged in the discrimination task but entirely failed to discriminate despite
being punished for wrong answers, we conclude that they were no longer able to detect
the odorant.
6. Discussion
Here, we used in vivo optical imaging to show that one intranasal instillation of 20 µg
cadmium chloride reduces odorant-evoked neurotransmitter release from the olfactory
nerve by 91% compared to control. At the same dose, there is only a 20% reduction in
22
ORN axonal innervation from the olfactory epithelium to olfactory bulb glomeruli.
While there was a significant reduction in the number of glomeruli receiving odorant-
evoked neurotransmitter release after exposure to 2 µg cadmium chloride and a small, but
significant reduction in the amplitude of odorant-evoked responses after 0.2 µg exposure,
neither of these doses caused a reduction in the density of ORN axonal projections when
analyzed in histological sections. Behaviorally, mice bilaterally exposed to 20 µg
cadmium chloride were significantly impaired in a previously trained go/no-go odorant-
detection task two days following instillation. This was not an effect of sickness
behavior, as the cadmium and vehicle-exposed animals initiated the same number of
trials during the post-instillation testing session. Taken together, these data show a
significant effect of acute exposure to cadmium chloride in both pathophysiology and
odorant-guided behavior.
Cadmium can pharmacologically block voltage-sensitive calcium channels
(Swandulla & Armstrong, 1989; Chow, 1991) or enter neurons through L- or T-type
calcium channels (Hinkle et al., 1987; Hinkle et al., 1992; Leslie et al., 2002), both of
which are expressed in the olfactory epithelium (Gautam et al., 2007; Miyamoto et al.,
1992). Though speculative, this may inform future investigations of the mechanism
causing the cadmium-induced dysfunction of neurotransmitter release presented here.
Our results showing a reduction in neurotransmitter release by glutamatergic ORNs is
consistent with previous work using in vivo microdialysis in the central amygdaloid
nuclei to show a significant reduction of glutamate release in response to perfusion with
30µm CdCl2 in artificial CSF (Minami et al., 2001). The current experiments extend this
idea and visualize first order sensory neurons in order to elucidate the mechanism behind
23
hyposmia and anosmia documented in human cases of cadmium toxicity through
inhalation exposure.
The OSHA permissible limit of cadmium in workplace air is 5 µg/m3 averaged
over 8 hours. While cadmium exposure occurs in many industrial settings, perhaps the
most widespread route of exposure is through cigarette smoke. Cadmium content in
cigarettes varies, from about 0.28 – 3.38 µg per cigarette (ADSDR, 2008). It has been
estimated that smokers are exposed, on average, to 1.7 µg of cadmium per cigarette and
about 10% of that content is inhaled (ATSDR, 2008). Smoking increases the incidence
of olfactory deficits, with severity of impairment related to duration and number of
cigarettes smoked (Frye et al., 1990; Katotomichelakis et al., 2007; Vennemann et al.,
2007). It is difficult to draw a direct dose comparison between human exposure from
chronic inhalation and direct intranasal instillation in liquid dilution performed here.
Species also differ in tidal volume, epithelial size, and other variables that may impact
transport of inhaled cadmium. However, with the large range of doses investigated here
and the estimates of cadmium contained in cigarette smoke or industrial exposure, we
believe environmentally relevant concentrations were encompassed in this experiment.
Perhaps the most important finding presented here is the disparity between
functional and anatomical changes after acute exposure to cadmium chloride. Previous
experiments have shown reversible impairments in odorant-guided behavior tasks and
histological damage following intranasal instillation of 400 µg cadmium chloride
(Bondier et al., 2008). Here, we show pathophysiological effects after an acute exposure
to 0.2 µg cadmium chloride. The use of optical imaging revealed a deficit in olfactory
nerve functioning at a lower dose compared to previous reports and even when compared

24
to histological measurements within this experiment. Optical imaging was one hundred
fold more sensitive to the effects of cadmium than histological measurement of axonal
projections in the same animals. While morphological connections may be intact, they
may not be functional. Therefore, a histological evaluation showing no difference in
anatomical connections in control versus exposed tissue may be missing potentially large
deficits in neuronal functioning. It is these functional deficits that may be most
explanatory of toxicant-induced sensory deficits, as the one shown here in an odorant
detection go/no-go task. The sensitivity of in vivo optical imaging makes it a potentially
invaluable technique to evaluate damage after exposure to any putative toxicant that can
be delivered intranasally.

25
References
Adams, R.G., & Crabtree, N. (1961). Anosmia in alkaline battery workers. Br J Ind Med 18:216-21.
Agency for Toxic Substances & Disease Registry. (2008). Toxicological profile for cadmium. Chemical Abstract Service Registry No. 7440-43-9. Atlanta, GA: Division of Toxicology and Environmental Medicine.
Bondier, J.R., Michel, G. & Propper, A. (2008). Harmful effects of cadmium on olfactory system in mice. Inhalation Toxicol. 20: 1169-1177.
Bozza, T., McGann, J.P., Mombaerts, P. & Wachowiak, M. (2004). In vivo imaging of neuronal activity by targeted expression of a genetically encoded probe in the mouse. Neuron. 42: 9-21.
Buck, L. & Axel, R. (1991). A novel multigene family may encode for odor receptors: A molecular basis for odor recognition. Cell. 65:175-187.
Cagan, R.H. & Zeiger, W.N. (1978). Biochemical studies of olfaction: Binding specificity of radioactively labeled stimuli to an isolated olfactory preparation from rainbow trout (Salmo gairdneri). Proc Natl Acad Sci. 75:4679-4683.
Calof, A.L., Hagiwara, N., Holcomb, J.D., Mumm, J.S. & Shou, J. (1995). Neurogenesis and cell death in the olfactory epithelium. J Neurobiol. 30: 67-81.
Caprio, J. & Byrd, R.P. Jr. (1984). Electrophysiological evidence for acidic, basic, and neutral amino acid olfactory receptor sites in the catfish. J Gen Physiol. 84:403-422.
Carr, V.M. & Farbman, A.I. (1993). The dynamics of cell death in the olfactory epithelium. Exp Neurol. 124: 308-314.
Chow, R.H. (1991). Cadmium block of squid calcium currents. J Gen Physiol. 98: 751-770.
Doty, R.L. (2008). The olfactory vector hypothesis of neurodegenerative disease: Is it viable? Ann. Neurol. 63: 7–15.
Evans, J. & Hastings, L. (1992) Accumulation of Cd(II) in the CNS depending on the route of administration: Intraperitoneal, intratracheal, or intranasal. Fundam of Appl Toxicol 19:275-8.
Friberg, L. (1950). Health hazards in the manufacture of alkaline accumulators with, special reference to chronic cadmium poisoning. In: Doty, R.L. (ed) Handbook of olfaction and gustation. Marcel Dekker, New York, pp 579-580.
Frye, R.E., Schwartz, B.S. & Doty, R.L. (1990). Dose-related effects of cigarette smoking on olfactory function. J Am Med Assoc. 263:1233-1236.
Gautam, S.H., Otsuguro, K.-I., Ito, S., Saito, T. & Habara, Y. (2007). T-type Ca2+ channels mediate propagation of odor-induced Ca2+ transients in rat olfactory receptor neurons. Neurosci. 144:703-713.
Graziadei, P.P.C. & Monti Graziadei, G.A. (1979). Neurogenesis and neuron regeneration in the olfactory system of mammals. I. Morphological aspects of differentiation and structural organization of the olfactory sensory neurons. J Neurocytol. 8:1-18.
Haehner, A., Hummel, T., Hummel, C., Sommer, U., Junghanns, S. & Reichmann, H. (2007). Olfactory loss may be a first sign of idiopathic Parkinson’s disease. Mov Disord. 22:839-842.

26
Hastings, L. (1990) Sensory neurotoxicology: use of the olfactory system in the assessment of toxicity. Neurotoxicol and Teratol 12:455-9.
Hastings, L. & Evans, J.E. (1991) Olfactory primary neurons as a route of entry for toxic agents into the CNS. Neurotoxicology 12:707-14.
Hinkle, P.M., Kinsella, P.A. & Osterhoudt, K.C. (1987). Cadmium uptake and toxicity via voltage-sensitive calcium channels. J Biol Chem. 262: 16333-16337.
Jung, Y-S., Jeong, E-M., Park, E.K., Kim, Y-M., Sohn, S., Lee, S.H., Baik, E.J. & Moon, C-H. (2008). Cadmium induces apoptotic cell death through p38 MAPK in brain microvessel endothelial cells. Eur J Pharmacol. 578: 11-18.
Katotomichelakis, M., Balatsouras, D., Tripsianis, G., Davris, S., Maroudias, N., Danielides, V. & Simopoulos, C. (2007). Rhinology. 45:273-280.
Kauer, J. S., & Moulton, D. G. (1974) Responses of olfactory bulb neurones to odour stimulation of small nasal areas in the salamander. J Physiol (Lond) 243:717-37.
Kim, M.S., Kim, B.J., Woo, H.N., Kim, K.W., Kim, I.K. & Jung, Y.K. (2000). Cadmium induces caspase-mediated cell death: Suppression by Bcl-2. Toxicology. 145: 27-37.
Leslie, E.M., Liu, J., Klaassen, C.D. & Waalkes, M.P. (2002). Acquired cadmium resistance in metallothionein-I/II(-/-) knockout cells: Role of T-type calcium channel Cacnα1G in cadmium uptake. Mol Pharmacol. 69:629-639.
López, E., Arce, c., Oset-Gasque, M.J, Cañadas, S. & González. (2006). Cadmium induces reactive oxygen species generation and lipid peroxidation in cortical neurons in culture. Free Radical Biol Med. 40:940-951.
López, E., Figueroa, S., Oset-Gasque, M.J. & González, M.P. (2003). Apoptosis and necrosis: Two distinct events induced by cadmium in cortical neurons in culture. British Journal of Pharmacology. 138: 901-911.
Malnic, B., Hirono, J., Sato, T. & Buck, L.B. (1999). Combinatorial receptor codes for odors. Cell. 96:713-723.
Mascagni, P., Consonni, D., Bregante, G., Chiappino, G. & Toffoletto, F. (2003). Olfactory function in workers exposed to moderate airborne cadmium levels. NeuroToxicology. 24:717-724.
McGann, J. P., Pirez, N., Gainey, M. A., Muratore, C., Elias, A. S. & Wachowiak, M. (2005). Odorant representations are modulated by feedback but not lateral presynaptic inhibition of olfactory sensory neurons. Neuron 48:1039-53.
Mesholam, R.I., Moberg, P.J., Mahr, R.N. & Doty, R.L. (1998). Olfaction in neurodegenerative disease: A meta-analysis of olfactory functioning in Alzheimer’s and Parkinson’s diseases. Arch Neurol. 55:84-90
Miesenböck, G., DeAngelis, D.A. & Rothman, J.E. (1998). Visualizing secretion and synaptic transmission with pH-sensitive green fluorescent proteins. Nature. 394: 192-195.
Minami, A., Takeda, A., Nishibaba, D., Takefuta, S. & Oku, N. (2001). Cadmium toxicity in synaptic neurotransmission in the brain. Brain Res. 894:336-339.
Miyamoto, T., Restrepo, D. & Teeter, J.H. (1992). Voltage-dependent and odorant-regulated currents in isolated olfactory receptor neurons of the channel catfish. J Gen Physiol. 99:505-530.
Mori, K. (1995). Relation of chemical structure to specificity of response in olfactory glomeruli. Curr Opin Neurobiol. 5: 467-474.

27
Pinching, A.J. & Powell, T.P.S. (1971). The neuropil of the glomeruli of the olfactory bulb. J Cell Sci. 9:347-377.
Potter, S.M., Zheng, C., Koos, D.S., Feinstein, P., Fraser, S.E. & Mombaerts, P. (2001). Structure and emergence of specific olfactory glomeruli in the mouse. J Neurosci. 21:9713-9723.
Potts, C.L. (1965). Cadmium proteinuria-the health of battery workers exposed to cadmium oxide dust. In: Doty, R.L. (ed) Handbook of olfaction and gustation. Marcel Dekker, New York, pp 579-580.
Ressler, K.J., Sullivan, S.L. & Buck, L.B. (1994). Information coding in the olfactory system: Evidence for a stereotyped and highly organized epitope map in the olfactory bulb. Cell. 79:1245-1255.
Rose, C.S., Heywood, P.G. & Costanzo, R.M. (1992) Olfactory impairment after chronic occupational cadmium exposure. J Occup Med. 34:600-5.
Ross, G.W., Petrovitch, H., Abbott, R.D., Tanner, C.M., Popper, J., Masaki, K., Launer, L. & White, L.R. (2008). Association of olfactory dysfunction with risk for future Parkinson’s disease. Ann Neurol. 63:167-173.
Sharp, F.R., Kauer, J.S. & Shepherd, G.M. (1975). Local sites of activity-related glucose metabolism in rat olfactory bulb during olfactory stimulation. Brain Res. 98:596-600.
Shepherd, G.M. (2004). The Synaptic Organization of the Brain: Fifth Edition. New York: Oxford University Press.
Slotnick, B., Bodyak, N. & Davis, B.J. (2001). Olfactory marker protein immunohistochemistry and the anterograde transport of horseradish peroxidase as indicies of damage to the olfactory epithelium. Chem Senses 26:605-10.
Soucy, E.R., Albeanu, D.F., Fantana, A.L., Murthy, V.N. & Meister, M. (2009). Precision and diversity in an odor map on the olfactory bulb. Nat Neurosci 12:210-20.
Stewart, E.B., Kauer, J.S. & Shepherd, G.M. (2004). Functional organization of rat olfactory bulb analysed by the 2-deoxyglucose method. J Comp Neurol. 4:715-734.
Sułkowski, W., Rydzewski, B. & Miarzynka, M. (2000). Smell impairment in workers occupationally exposed to cadmium. Acta Oto-laryngologia. 120:316-318.
Sun, T.J., Miller, M.L. & Hastings, L. (1996) Effects of Inhalation of cadmium on the rat olfactory system: Behavior and morphology. Neurotoxicol Teratol 18:89-98.
Swandulla, D. & Armstrong, C.M. (1989). Calcium channel block by cadmium in chicken sensory neurons. Proc Natl Acad Sci. 86:1736-1740.
Tallkvist, J., Persson, E., Henriksson, J. & Tjälve, H. (2002). Cadmium-metallothionein interactions in the olfactory pathways of rats and pikes. Toxicol Sci. 67:108-113.
Tjälve, H., Henriksson, J., Tallkvist, J., Larsson, B.S. & Lindquist, N.G. (1996). Uptake of manganese and cadmium from the nasal mucosa into the central nervous system via olfactory pathways in rats. Pharmacol Toxicol. 79:347-356.
Vennemann, M.M., Hummel, T. & Berger, K. (2007). The association between smoking and smell and taste impairment in the general population. J Neurol. 255:1121-1126.
Wachowiak, M. & Cohen, L.B. (2001). Representation of odorants by receptor neuron input to the mouse olfactory bulb. Neuron 32:723-35.

28
Wachowiak, M., McGann, J. P., Heyward, P., Shao, Z., Puche, A. C. & Shipley, M. (2005). Inhibition of olfactory receptor neuron input to olfactory bulb glomeruli mediated by suppression of presynaptic calcium influx. J Neurophysiol 94:2700-12.
Wang, S.H., Shih, Y.L., Ko, W.C., Wei, Y.H. & Shih, C.M. (2008). Cadmium-induced autophagy and apoptosis are mediated by a calcium signaling pathway. Cell Mol Life Sci. 65:3640-3652.