limnology - university of liverpoolric/lfs/pdf/limnolocean_blw_2015.pdf · limnology and...
TRANSCRIPT

Physical controls of variability in North Atlantic phytoplanktoncommunities
Andrew D. Barton,1,2* M. Susan Lozier,1 Richard G. Williams 2
1Division of Earth and Ocean Sciences, Nicholas School of the Environment, Duke University, Durham, North Carolina2Department of Earth, Ocean, and Ecological Sciences, School of Environmental Sciences, University of Liverpool, Liverpool,United Kingdom
Abstract
The structure of marine phytoplankton communities in the North Atlantic Ocean varies considerably on sea-sonal, interannual, and longer timescales in response to environmental change. However, the causes of ecologi-cal variability on interannual and longer timescales remain uncertain. Here, using a half-century ofobservations, we compare changes in atmospheric forcing (surface wind speed and heat fluxes) and ocean sur-face properties (sea surface temperature, mixed layer depth, thermal stratification, and turbulent kinetic energy)with variability in total phytoplankton biomass and the abundances of diatoms and dinoflagellates, as meas-ured by the Continuous Plankton Recorder survey. On seasonal timescales, there is a clear connection betweenobserved changes in the physical environment and the phytoplankton assemblages. Strong turbulence, deepmixed layers, and weak stratification decrease diatom abundance in the subpolar gyre, but increase diatoms inthe subtropical gyre, a pattern broadly consistent with growth limitation of phytoplankton in high and low lati-tudes by light and nutrients, respectively. In contrast, dinoflagellates prosper in stratified, weakly turbulent con-ditions in sampled portions of the subpolar and subtropical gyres. On interannual to multidecadal timescales,however, the links between observed ecological and physical changes are much weaker. The physical mecha-nisms that differentiate the fates of diatoms and dinoflagellates on seasonal timescales do not appear to controltheir longer-term variability, perhaps because year-to-year variability in the phytoplankton assemblages isgreater than in the physical drivers. This suggests that other biological (e.g., zooplankton grazing, chaos in theplankton) or physical mechanisms (e.g., changes in ocean circulation) may play important regulatory roles.
The structure of North Atlantic phytoplankton commun-ities varies in response to changes in ocean surface conditionsand atmospheric forcing (Sverdrup 1953; Margalef 1978; Tay-lor et al. 1993). These ecological changes are importantbecause they have the potential to affect the broader marinefood web, global biogeochemical cycles, and the climate sys-tem (Falkowski et al. 1998; Henson et al. 2012). Although thephysical drivers of seasonal changes in North Atlantic phyto-plankton communities are relatively well studied (Sverdrup1953; Follows and Dutkiewicz 2002), if still debated (Behren-feld 2010; Taylor and Ferrari 2011), considerably less is knownabout how and why phytoplankton communities have variedon interannual to multidecadal timescales. Do the same physi-cal mechanisms that guide seasonal ecological change governecological variability on longer timescales? In particular, how
do subtropical and subpolar gyre communities and distinctphytoplankton assemblages, such as diatoms and dinoflagel-lates, respond to the physical forcing?
To address these questions, we examine and compare ahalf-century of concomitant phytoplankton assemblage,atmospheric forcing, and surface oceanographic observationstaken in the subtropical and subpolar North Atlantic. The Con-tinuous Plankton Recorder (CPR) survey has sampled greaterthan 100 common diatom and dinoflagellate species over theNorth Atlantic subpolar and northern subtropical gyres since1958, and provides an internally consistent and unparalleledview of surface ecological variability (Richardson et al. 2006).Although the CPR data have known limitations associatedwith sampling procedures (e.g., Richardson et al. 2006; Bartonet al. 2013), they offer temporal, spatial, and taxonomic cover-age not possible with any other dataset, and therefore, offer aunique and crucial perspective of how marine phytoplanktonassemblages shift through time and space (Edwards andRichardson 2004; Leterme et al. 2005; Hinder et al. 2012). Weconsider long-term records of phytoplankton color index
*Correspondence: [email protected] is an open access article under the terms of the Creative CommonsAttribution License, which permits use, distribution and reproduction inany medium, provided the original work is properly cited.
181
LIMNOLOGYand
OCEANOGRAPHYLimnol. Oceanogr. 60, 2014, 181–197
VC 2014 The Authors Limnology and Oceanography published by Wiley Periodicals, Inc.on behalf of Association for the Sciences of Limnology and Oceanography
doi: 10.1002/lno.10011

(PCI), a proxy for total surface phytoplankton biomass, andthe total abundances of diatoms and dinoflagellates, two keyphytoplankton functional groups with strongly contrastingecological niches and contributions to marine biogeochemicalcycles (Henson et al. 2012; Irwin et al. 2012). By decomposingthe observed ecological variability into seasonal, interannual tomultidecadal (variations longer than one year, but less thanthe ! 50-year long record), and a long-term trend component(comparable to the ! 50-year record), we assess which physicalmechanisms act as key drivers at each timescale, their regionalrelevance, and their importance to diatom and dinoflagellateabundance. The primary physical drivers that are believed toshape phytoplankton community structure include wind forc-ing and surface buoyancy fluxes from the atmosphere, whichthen alter the physical environment (turbulent kinetic energy[TKE] in the mixed layer, sea surface temperature [SST], mixedlayer depth [MLD], and upper water column stratification).These key physical drivers potentially impact the light andnutrients experienced by phytoplankton in the ocean surface(Sverdrup 1953; Follows and Dutkiewicz 2002) but also theinteractions and imbalances between predators and prey (Beh-renfeld 2010; Behrenfeld and Boss 2014). The goal of our anal-ysis is to evaluate and assess the statistical links between eachphytoplankton metric (PCI, abundance of diatom and dinofla-gellates) and likely physical drivers for different timescalesacross the northern subtropical and subpolar North AtlanticOcean.
Contrasting dynamics and habitats in subpolar andsubtropical gyres
The CPR survey covers portions of the North Atlantic sub-polar and subtropical gyres, and allows the environmentalcontrols of phytoplankton assemblages to be assessed in a con-sistent manner. Here, we highlight key differences between
the gyres, in terms of circulation, nutrient supply, and lightavailability, as the contrasts provide a guiding framework forinterpreting the results of our study.
In the subtropical North Atlantic, prevailing surface windstress patterns drive Ekman downwelling and deepen thenutricline (Fig. 1). The water column is stably stratified, andaside from entrainment due to seasonal or episodic mixingevents and horizontal transports of nutrients (Williams andFollows 1998; Williams et al. 2000; Palter and Lozier 2008),the supply of nutrients to the surface euphotic zone is weak.Although light is generally abundant at these latitudes, thelimited supply of nutrients leads to low phytoplankton bio-mass and to assemblages dominated by picoplankton andflagellates, with larger cells such as diatoms being relativelyscarce (Tarran et al. 2006; Ward et al. 2012). Populationgrowth by photoautotrophs is typically balanced by grazing(Lessard and Murrell 1998), and much of the primary pro-duction in the ocean surface is fueled by nutrients remineral-ized locally within the surface layer (Azam et al. 1983).
In these relatively stratified waters, seasonality in atmos-pheric forcing mediates the entrainment flux of nutrients(Fig. 1B) and leads to changes in the phytoplankton commu-nity. For example, at the Bermuda Atlantic Time Series sta-tion (BATS; 31"500 N, 64"100 W) and the European Stationfor Time-series in the Ocean, Canary Islands (ESTOC; 29"100
N, 15"300 W), located on opposite sides of the North Atlanticgyre but at similar latitudes, increased surface winds andcooling in winter drive deeper mixing and entrainment ofnutrients, spurring a contemporary surface increase in chlo-rophyll and primary production (Steinberg et al. 2001; Neueret al. 2002). Weaker winds and surface warming in springand summer restratify the water column, leading to lowerprimary production at the surface. In accord with this view,Follows and Dutkiewicz (2002) found that spatial variations
Fig. 1. (A) Ekman upwelling velocity (wek; m y21) in downwelling (wek < 0) subtropical and upwelling (wek > 0) subpolar gyres in the North Atlantic.The black contours indicate the annual mean nitrate concentration at the surface (lmol L21). (B) Mean nitrate concentration (lmol L21) with depth inthe subtropical (red lines, ‘ST’ on map) and subpolar (blue lines, ‘SP’ on map) gyres for August (dashed line) and February (solid line). MLDs in Febru-ary (F, deeper) and August (A, shallower) are shown at right. Ekman upwelling velocity is calculated using NCEP/NCAR annual mean wind stress data(Kalnay et al. 1996). Monthly mean nitrate data are taken from the World Ocean Atlas (Garcia et al. 2010) and averaged over a 5" 3 5" area.
Barton et al. North Atlantic phytoplankton community variability
182
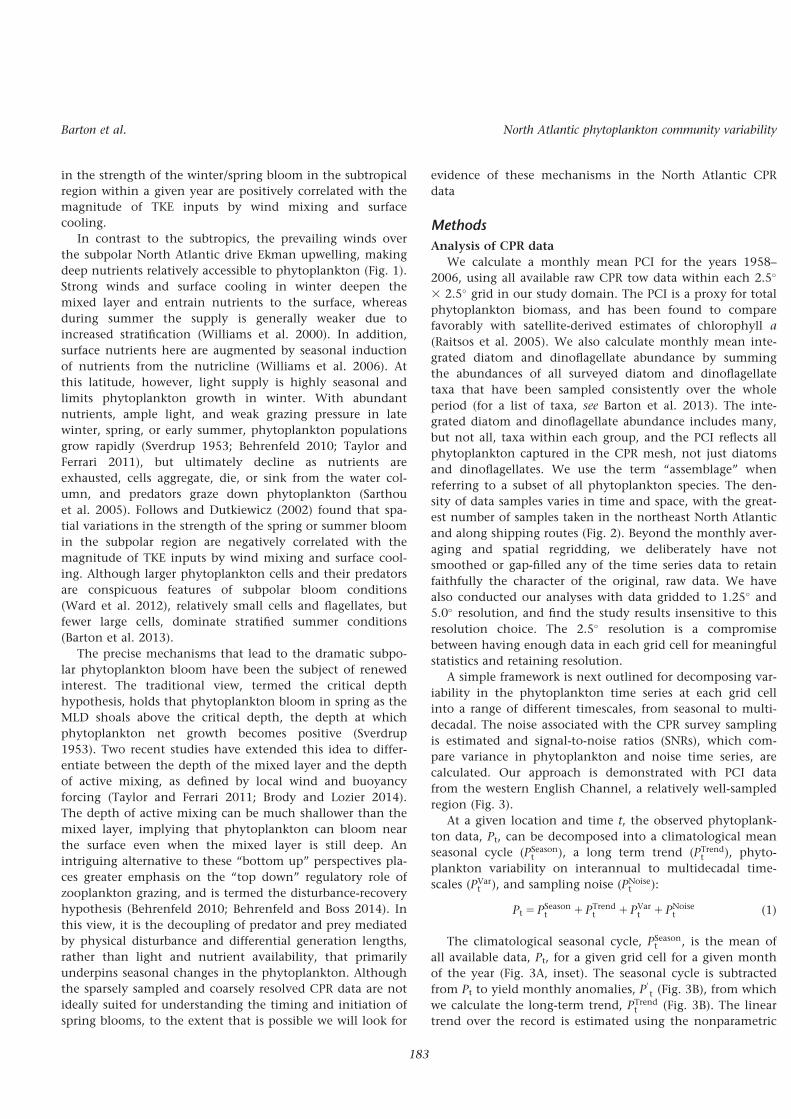
in the strength of the winter/spring bloom in the subtropicalregion within a given year are positively correlated with themagnitude of TKE inputs by wind mixing and surfacecooling.
In contrast to the subtropics, the prevailing winds overthe subpolar North Atlantic drive Ekman upwelling, makingdeep nutrients relatively accessible to phytoplankton (Fig. 1).Strong winds and surface cooling in winter deepen themixed layer and entrain nutrients to the surface, whereasduring summer the supply is generally weaker due toincreased stratification (Williams et al. 2000). In addition,surface nutrients here are augmented by seasonal inductionof nutrients from the nutricline (Williams et al. 2006). Atthis latitude, however, light supply is highly seasonal andlimits phytoplankton growth in winter. With abundantnutrients, ample light, and weak grazing pressure in latewinter, spring, or early summer, phytoplankton populationsgrow rapidly (Sverdrup 1953; Behrenfeld 2010; Taylor andFerrari 2011), but ultimately decline as nutrients areexhausted, cells aggregate, die, or sink from the water col-umn, and predators graze down phytoplankton (Sarthouet al. 2005). Follows and Dutkiewicz (2002) found that spa-tial variations in the strength of the spring or summer bloomin the subpolar region are negatively correlated with themagnitude of TKE inputs by wind mixing and surface cool-ing. Although larger phytoplankton cells and their predatorsare conspicuous features of subpolar bloom conditions(Ward et al. 2012), relatively small cells and flagellates, butfewer large cells, dominate stratified summer conditions(Barton et al. 2013).
The precise mechanisms that lead to the dramatic subpo-lar phytoplankton bloom have been the subject of renewedinterest. The traditional view, termed the critical depthhypothesis, holds that phytoplankton bloom in spring as theMLD shoals above the critical depth, the depth at whichphytoplankton net growth becomes positive (Sverdrup1953). Two recent studies have extended this idea to differ-entiate between the depth of the mixed layer and the depthof active mixing, as defined by local wind and buoyancyforcing (Taylor and Ferrari 2011; Brody and Lozier 2014).The depth of active mixing can be much shallower than themixed layer, implying that phytoplankton can bloom nearthe surface even when the mixed layer is still deep. Anintriguing alternative to these “bottom up” perspectives pla-ces greater emphasis on the “top down” regulatory role ofzooplankton grazing, and is termed the disturbance-recoveryhypothesis (Behrenfeld 2010; Behrenfeld and Boss 2014). Inthis view, it is the decoupling of predator and prey mediatedby physical disturbance and differential generation lengths,rather than light and nutrient availability, that primarilyunderpins seasonal changes in the phytoplankton. Althoughthe sparsely sampled and coarsely resolved CPR data are notideally suited for understanding the timing and initiation ofspring blooms, to the extent that is possible we will look for
evidence of these mechanisms in the North Atlantic CPRdata
Methods
Analysis of CPR dataWe calculate a monthly mean PCI for the years 1958–
2006, using all available raw CPR tow data within each 2.5!
3 2.5! grid in our study domain. The PCI is a proxy for totalphytoplankton biomass, and has been found to comparefavorably with satellite-derived estimates of chlorophyll a(Raitsos et al. 2005). We also calculate monthly mean inte-grated diatom and dinoflagellate abundance by summingthe abundances of all surveyed diatom and dinoflagellatetaxa that have been sampled consistently over the wholeperiod (for a list of taxa, see Barton et al. 2013). The inte-grated diatom and dinoflagellate abundance includes many,but not all, taxa within each group, and the PCI reflects allphytoplankton captured in the CPR mesh, not just diatomsand dinoflagellates. We use the term “assemblage” whenreferring to a subset of all phytoplankton species. The den-sity of data samples varies in time and space, with the great-est number of samples taken in the northeast North Atlanticand along shipping routes (Fig. 2). Beyond the monthly aver-aging and spatial regridding, we deliberately have notsmoothed or gap-filled any of the time series data to retainfaithfully the character of the original, raw data. We havealso conducted our analyses with data gridded to 1.25! and5.0! resolution, and find the study results insensitive to thisresolution choice. The 2.5! resolution is a compromisebetween having enough data in each grid cell for meaningfulstatistics and retaining resolution.
A simple framework is next outlined for decomposing var-iability in the phytoplankton time series at each grid cellinto a range of different timescales, from seasonal to multi-decadal. The noise associated with the CPR survey samplingis estimated and signal-to-noise ratios (SNRs), which com-pare variance in phytoplankton and noise time series, arecalculated. Our approach is demonstrated with PCI datafrom the western English Channel, a relatively well-sampledregion (Fig. 3).
At a given location and time t, the observed phytoplank-ton data, Pt, can be decomposed into a climatological meanseasonal cycle (PSeason
t ), a long term trend (PTrendt ), phyto-
plankton variability on interannual to multidecadal time-scales (PVar
t ), and sampling noise (PNoiset ):
Pt 5 PSeasont 1 PTrend
t 1 PVart 1 PNoise
t (1)
The climatological seasonal cycle, PSeasont , is the mean of
all available data, Pt, for a given grid cell for a given monthof the year (Fig. 3A, inset). The seasonal cycle is subtractedfrom Pt to yield monthly anomalies, P
0
t (Fig. 3B), from whichwe calculate the long-term trend, PTrend
t (Fig. 3B). The lineartrend over the record is estimated using the nonparametric
Barton et al. North Atlantic phytoplankton community variability
183

Theil-Sen approach, which reduces the sensitivity to largeoutliers (Theil 1950), a common feature in the anomaly timeseries. PVar
t is the residual after subtracting PTrendt from the
monthly anomalies, P0t, and includes ecological variability
on interannual to multidecadal timescales. Only significant(p < 0.05), non-zero trends are subtracted when calculatingPVar
t . We also examined log-transformed CPR time series, butfound the final results did not differ appreciably from thenon-log-transformed data.
Lastly, the SNR for each phytoplankton time series is cal-culated to assess whether observed variability in the phyto-plankton time series exceeds what might occur from variablesampling density. Our approach here assumes that measure-ment errors in the CPR survey are random and small andthat errors in the CPR time series are associated with sam-pling intensity. To estimate the sampling noise at time t,PNoise
t the standard error of all available raw data is calculatedwithin each grid cell for each month during 1958–2006. Asynthetic time series of noise is generated, and repeated10,000 times, by multiplying the standard error by a ran-domly generated Gaussian white noise time series (with amean of zero and standard deviation of one). The SNR is cal-culated as the variance in each phytoplankton time seriesdivided by the variance in the noise time series, r2
Phy=r2Noise
(Fleming 2010). At each location, r2Phy is the variance in each
phytoplankton time series—PSeasont , PTrend
t , and PVart —and
r2Noise is the mean variance of 10,000 randomly generated
noise time series. A large SNR (SNR > 1) indicates that thevariability in the phytoplankton time series is not likely aproduct of potential sampling biases.
Analysis of environmental dataThe physical data for the North Atlantic basin are similarly
decomposed using the framework (1), including surface windspeed (m s21), total heat flux (H; H > 0 for fluxes out of theocean; W m22), depth-integrated TKE generation in the surfaceboundary layer (m3 s23), SST (!C), stratification (!C), and MLD(m). The SST is the temperature in the surface layer (0–13 mdepth) obtained from the UK Met Office temperature andsalinity reanalysis dataset (Smith and Murphy 2007), whichcombines historical and more recent Argo measurements oftemperature and salinity with model covariance fields to pro-duce a gap-free global dataset. Stratification is evaluated fromthe difference in temperature between the surface and 200 m,again using the temperature reanalysis data. The MLD is diag-nosed using a potential density threshold method (De BoyerMont!egut et al. 2004), where the MLD is defined as the depthat which the potential density changes by 0.03 kg m23 fromthe surface layer. Potential density profiles were calculatedfrom UK Met Office reanalysis temperature and salinity data.
Fig. 2. (A) Log10 total number of raw CPR samples taken within each 2.5! 3 2.5! grid cell during 1958–2006. Log10 annual mean (B) PCI, (C) totaldiatoms, and (D) total dinoflagellates.
Barton et al. North Atlantic phytoplankton community variability
184

Sea surface wind and air-sea heat fluxes are taken frommonthly mean NCEP/NCAR reanalysis data (Kalnay et al.1996), and we have summed latent, sensible, longwave, andshortwave heat fluxes to get the total, net heat flux. Localmechanical forcing from the wind and penetrative convec-tion from surface cooling generate TKE in the surface bound-ary layer, some of which is converted to potential energy(PE) by deepening the mixed layer and increasing its density.The dominant terms in the TKE budget are diagnosed follow-ing Niiler and Kraus (1977), and as applied by Follows andDutkiewicz (2002):
dh
dthDb 5 m1u3
! 1 m2agh
qCp2H (2)
where the rate of conversion of TKE to PE (first term) is sus-tained by the inputs of TKE from the wind (second term)
and penetrative convection from surface cooling (thirdterm); here Db is the change in buoyancy between the mixedlayer and the thermocline (m s22), g is gravity (m s22), a isthe thermal expansion coefficient (K21), Cp is heat capacityof water (J kg21 K21), h is MLD (m), u! (m s21) is frictionalwind velocity (5
ffiffiffiffiffiffiffiffiffiffiffiffij s!j=q
p), s! is surface wind stress (N m22)
from NCEP/NCAR monthly mean data, and q is density ofseawater (kg m23). Coefficients m1 and m2 define theamount of energy available for mixing; m1 is typically 1.25,whereas m2 is " 1.0 during periods of surface warming and0.15 in periods of surface cooling (Kraus 1988). IncreasingTKE lowers the time-averaged light experienced by a phyto-plankton cell, and is associated with entrainment ofnutrients into the surface layer.
Finally, the connection between the ecosystem and physi-cal variables is assessed using Kendall’s s coefficient, which isless sensitive to outliers than the more traditional Pearsoncorrelation.
Results
Seasonal environmental change and biological responsesOur analysis confirms a cornerstone of biological ocean-
ography: clear and widespread connections between seasonalcycles of key environmental drivers and seasonal cycles oftotal phytoplankton biomass and the abundance of diatomsand dinoflagellates in the North Atlantic (Margalef 1978;Taylor et al. 1993; Barton et al. 2013). Although these pat-terns have been previously described using a range of inde-pendent datasets, their robust signature and gyre-scalecoherence lend confidence to the ability of the CPR surveyto faithfully capture meaningful ecological patterns.
The seasonal analysis also highlights important differen-ces in the mechanisms that regulate subtropical and subpo-lar PCI, as well as novel distinctions between the diatom anddinoflagellate assemblages. In the subpolar gyre, PCI is posi-tively correlated with stratification and SST, but negativelycorrelated with surface wind stress, heat flux, TKE, and MLD(Fig. 4A). In contrast, in the subtropical gyre, PCI is nega-tively correlated with stratification and SST, but positivelycorrelated with surface wind stress, heat flux, TKE, and MLD(Fig. 4A). Diatoms exhibit seasonal correlations with physicaldrivers that are similar to the total phytoplankton biomass(Fig. 4B). Dinoflagellates, by contrast, exhibit seasonalresponses to physical drivers that are distinct from the totalbiomass and diatom abundance (Fig. 4C). Across the subpo-lar and subtropical gyres, dinoflagellates prosper duringwarm, stratified conditions, and their abundance is nega-tively correlated with surface wind speed, cooling, turbu-lence, and deeper mixed layers.
We provide additional context for these correlations byshowing the climatological seasonal cycles of PCI, diatomabundance, dinoflagellate abundance, and MLD (with scaleinverted to show negative depths) for a subtropical and
Fig. 3. (A) Absolute value PCI time series in the western English Chan-nel (49.4# N, 5# W) for 1990–2000, with climatological seasonal cycle(PCISeason) inset. (B) PCI monthly anomalies (PCI’) with seasonal cyclesubtracted and long term trend overlaid (PCITrend), (C) detrended anom-aly time series (PCIVar), and (D) estimate of sampling noise (PCINoise) for1958–2006. The example noise time series is created by multiplying thestandard error by a randomly generated Gaussian white noise timeseries.
Barton et al. North Atlantic phytoplankton community variability
185

subpolar location (Fig. 5). In the northern subtropical loca-tion (Fig. 5A), mixed layers are relatively shallow but stillseasonally variable, reaching a maximum depth in February.PCI peaks in May, but there is a robust fall bloom in thisarea, unlike the subpolar location. Diatoms bloom early inspring (March), decline through the summer, and show avery weak fall bloom. Dinoflagellates are generally more
abundant in warm season months, with maxima in May andJuly to August. Interestingly, the fall PCI bloom does notappear to be primarily driven by changes in diatom or dino-flagellate populations, implying that other taxa (e.g., smallbut captured cells, taxonomic groups, and species notsampled by the CPR survey or considered in this study) areresponsible for the peak in PCI here. In the subpolar location
Fig. 4. Kendall’s s correlation between the climatological mean seasonal cycles of PCI (PCISeason; A), summed diatoms (DiaSeason; B), and summeddinoflagellates (DinoSeason; C) and, from top to bottom down each column, climatological seasonal cycles of surface wind speed, total heat flux, TKEgeneration, MLD, stratification, and SST. Only significant correlations (p < 0.05) are shown. The dashed black contour shows the approximate bound-ary between the subpolar and subtropical gyres, as defined by the 4 lmol L21 mean annual surface nitrate contour. Nitrate data from the WorldOcean Atlas 2009 (Garcia et al. 2010).
Barton et al. North Atlantic phytoplankton community variability
186

(Fig. 5B), mixed layers are deepest in March, shoal rapidlythrough early summer, and then deepen again through latesummer and fall. There is a robust spring bloom peaking inJune and much more modest fall bloom of diatoms and PCIpeaking in September. Dinoflagellates are most abundant insummer, with a maximum in July. These seasonal cycles oftotal biomass, diatoms, and dinoflagellates are broadly con-sistent with previous CPR studies (Barton et al. 2013) andsatellite observations (D’Ortenzio et al. 2012).
Multidecadal trendsBetween 1958 and 2006, phytoplankton biomass increased
over a swath of the subpolar North Atlantic (Fig. 6A), a pat-tern that has been previously reported and linked to climatevariability (Barton et al. 2003). A few isolated areas exhibiteda decline in PCI, but for most areas there has been no signifi-cant trend. The abundances of diatoms and dinoflagellateshave decreased in the northeast Atlantic but have not signifi-cantly changed elsewhere (Fig. 6A). Hinder et al. (2012), sam-pling only the most common taxa in this region, reported a
strong decline of dinoflagellates, but little change in diatoms.The contrast in the northeast Atlantic between increasing PCIbut decreasing diatoms and dinoflagellates is striking, as it isgenerally believed that periods and places with greater chloro-phyll or biomass also have proportionally more large phyto-plankton cells, such as diatoms and dinoflagellates (Chisholm1992). It is also interesting that the increase in PCI in the cen-tral North Atlantic does not appear to be driven by anincrease in diatoms or dinoflagellates. The mismatch betweenPCI and diatom and dinoflagellate assemblage trends impliesthat other types of phytoplankton are varying independentlyfrom diatoms and dinoflagellates. However, the CPR surveydoes not fully resolve these other taxa.
During this same period, there has been a long-termincrease in wind speed over the central subpolar gyre, theNorth Sea, and northeast Atlantic, with a decline in watersoff of Spain and North Africa (Fig. 6B). Surface heat lossincreased along the path of the Gulf Stream and NorthAtlantic Current, with some enhanced heat input elsewhere(recall that H > 0 implies a flux out of the ocean). Trends inmixed layer TKE have less spatial coherence, but there is anarea of decreasing turbulence near Spain and North Africa(Fig. 6B), in the same vicinity as the weakened winds. SST inmuch of the subtropical and subpolar North Atlantic haswarmed strongly, yet much of the region of increasing PCIhas not shown significant surface warming (Fig. 6C). TheseSST trends are consistent with other observational studies(Deser et al. 2010). At the same time, mixed layers havedeepened in waters near Greenland and Iceland but haveshoaled in the central North Atlantic on the intergyre mar-gin and in the northeast Atlantic near Europe (Fig. 6C). Thespatial pattern of trends for stratification is nearly thereverse, with decreased stratification in the Labrador Sea andnear Greenland, but increased stratification in the centraland northeast North Atlantic (Fig. 6C). Although it is impos-sible to rule out or prove a connection between slow-movingenvironmental and ecological change based on these dataalone, none of the long-term trends in atmospheric forcingor ocean conditions examined here correspond closely to thespatial patterns seen in the multidecadal biological trends.
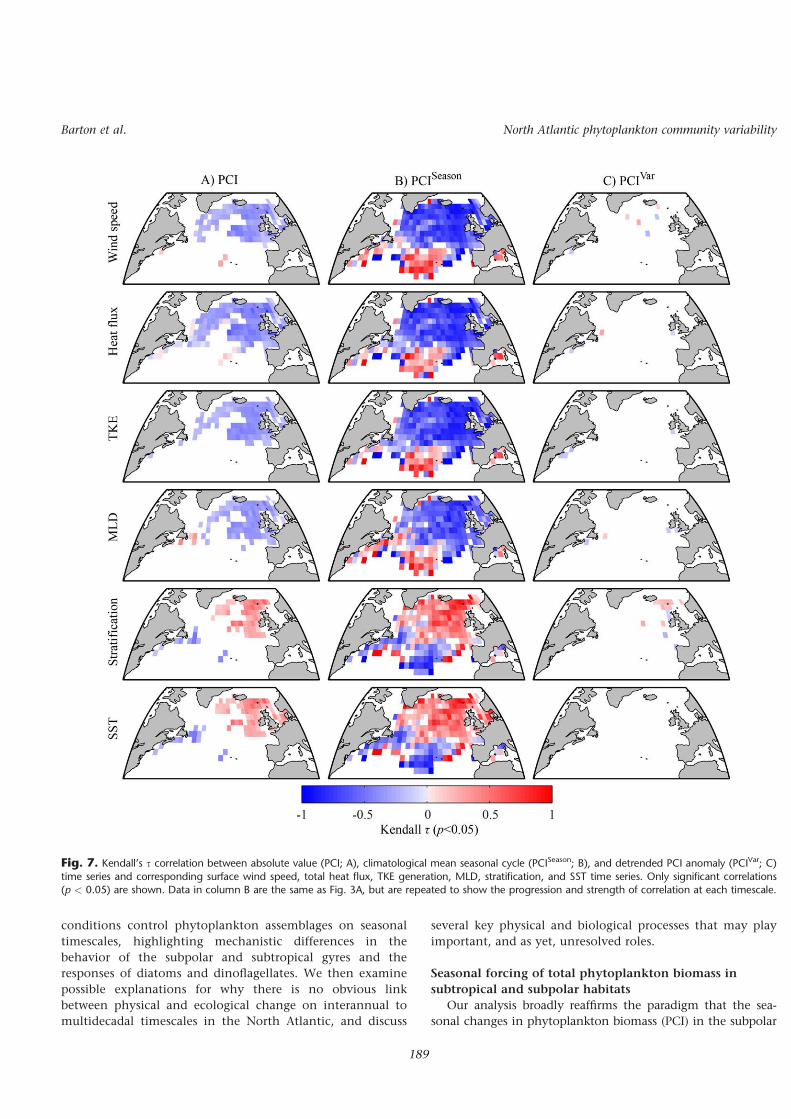
Interannual to multidecadal variabilityAlthough there is strong correlation between observed
physical and PCI time series in the North Atlantic (Fig. 7A),this correlation is largely a consequence of seasonal varia-tions (Fig. 7B). After the seasonal cycles (e.g., Fig. 4) and lin-ear trends (e.g., Fig. 6) have been removed from PCI timeseries, there is little connection between ecological variabilityand physical forcing occurring on interannual to multideca-dal timescales (Fig. 7C). A similar pattern is true for both dia-toms and dinoflagellates (data not shown). The apparentinsensitivity of the phytoplankton assemblages to interan-nual to multidecadal variability in the environment can beseen at a subtropical and subpolar location in the North
Fig. 5. Climatological seasonal cycles of PCI (solid line), diatom abun-dance (dotted line), dinoflagellate abundance (dashed line), and MLD(solid line with filled circles; scale inverted to show negative depths) insubtropical (A) and subpolar (B) locations noted in Fig. 1 (averaged overa 10! 3 10! area). The vertical gray line shows when heat fluxes switchfrom cooling to heating the ocean surface in spring. We have includedin shaded gray the 95% confidence interval for PCI (6 2r, where r isthe monthly standard error).
Barton et al. North Atlantic phytoplankton community variability
187

Atlantic, where there is no correlation between PCIVar, DiaVar,DinoVar, and MLDVar (Fig. 8). For example, the phytoplank-ton assemblage in the subpolar North Atlantic (Fig. 8B) doesnot appear to track the deepening of the mixed layer fromthe 1970s to 1990s, associated with a change in the NorthAtlantic Oscillation (NAO) phase from negative to positive.
The lack of a clear connection between physical forcingand ecological change on interannual to multidecadal time-scales, however, does not preclude significant ecological vari-ability on these timescales. After subtracting the seasonalcycles and trends from the PCI time series, there is strong PCIvariability that exceeds our estimates of sampling noise, asindicated by signal to noise ratios that are generally greaterthan one (Fig. 9; the same is true for diatoms and dinoflagel-lates; data not shown). Thus, there is considerable variabilityoccurring on these timescales that is not easily or simplylinked to the principal physical drivers considered in thisstudy. The variance in phytoplankton and physical time seriesat each timescale provides further context for the lack of cor-relation: year-to-year variability in the plankton assemblage isconsiderably greater than in the physical drivers (Table 1).
Our analyses focus on monthly relationships betweenatmospheric forcing and oceanographic conditions and the
phytoplankton assemblages. However, we have also investi-gated whether environmental changes in winter could havesubsequent ecological impacts throughout the growing sea-son. We find no widespread and robust correlation betweenthe maximum depth of winter mixing and the maximum (orthe average) phytoplankton biomass (PCI) throughout thegrowing season (defined here as January through August;data not shown).
We have also diagnosed the correlations between theNAO index and each of the physical and ecological timeseries across the North Atlantic, using monthly time seriesand the winter NAO index (December to March). There arestrong and significant correlations between the NAO andeach of the physical variables considered in our study, as hasbeen reported elsewhere (Marshall et al. 2001). However,similar to Barton et al. (2003), we find no widespread, signifi-cant link between the winter NAO index and PCI or diatomand dinoflagellate assemblages (data not shown).
Discussion
In the following discussion, we first consider the empiri-cal evidence for how atmospheric forcing and ocean surface
Fig. 6. Linear trends, indicated by the Kendall’s s coefficient, in (A) CPR metrics, (B) atmospheric forcing, and (C) surface ocean conditions over1958–2006. Only significant correlations (p < 0.05) are shown. The dashed black perimeter in the biological trends at left indicates where CPR dataare available.
Barton et al. North Atlantic phytoplankton community variability
188
conditions control phytoplankton assemblages on seasonaltimescales, highlighting mechanistic differences in thebehavior of the subpolar and subtropical gyres and theresponses of diatoms and dinoflagellates. We then examinepossible explanations for why there is no obvious linkbetween physical and ecological change on interannual tomultidecadal timescales in the North Atlantic, and discuss
several key physical and biological processes that may playimportant, and as yet, unresolved roles.
Seasonal forcing of total phytoplankton biomass insubtropical and subpolar habitats
Our analysis broadly reaffirms the paradigm that the sea-sonal changes in phytoplankton biomass (PCI) in the subpolar
Fig. 7. Kendall’s s correlation between absolute value (PCI; A), climatological mean seasonal cycle (PCISeason; B), and detrended PCI anomaly (PCIVar; C)time series and corresponding surface wind speed, total heat flux, TKE generation, MLD, stratification, and SST time series. Only significant correlations(p < 0.05) are shown. Data in column B are the same as Fig. 3A, but are repeated to show the progression and strength of correlation at each timescale.
Barton et al. North Atlantic phytoplankton community variability
189

Fig. 8. Detrended anomaly time series (indicated by the “Var” superscript) for PCI (solid line), diatom abundance (dotted line), dinoflagellate abun-dance (dashed line), and MLD (solid line with filled circles) in subtropical (A) and subpolar (B) locations noted in Fig. 1 (annually averaged over a 10!
3 10! area). Positive MLD anomalies indicate deeper MLDs. We have included in shaded gray the 95% confidence interval for PCI (6 2r, where r isthe standard error of all anomalies within the region over a year).
Fig. 9. (A) Signal variance for absolute value (PCI; top) and detrended PCI anomaly (PCIVar; middle) time series, normalized by the noise variance(PCINoise; bottom) to calculate the signal to noise ratio (B). Signal variance and SNR are presented in log10 units; values greater than one (i.e., 100)indicate ecological variability above and beyond our estimate of CPR sampling noise.
Barton et al. North Atlantic phytoplankton community variability
190

and subtropical North Atlantic are constrained by the avail-ability of light and nutrients, respectively, as mediated by sea-sonal changes in atmospheric forcing (Sverdrup 1953; Followsand Dutkiewicz 2002). In the subpolar gyre, strong winds,cooling, and deep mixing tend to decrease phytoplankton bio-mass, whereas stratification and warmer SSTs are correlatedwith increased phytoplankton biomass (Figs. 4, 5). In thenorthern subtropical gyre, strong winds, cooling, and deepmixing lead to increased PCI, whereas stratification andwarmer SSTs lead to decreased PCI (Fig. 4, 5). In the northernsubtropical regions covered by the CPR survey (Fig. 5A), thereis also a robust autumn bloom driven by deepening mixedlayers and entrainment of nutrients (Colebrook 1982).
The CPR data offer unique perspectives on the applicabil-ity of the “top-down” disturbance-recovery mechanismacross contrasting ocean regimes. In the northern subtropicalareas (Fig. 5A), phytoplankton bloom strongly in winter orspring while mixed layers are deepest, and increase well inadvance of the switch from cooling to heating at the oceansurface. Thus, we argue that the best explanation for sea-sonal dynamics here is the seasonal entrainment ofnutrients, rather than the critical depth (Sverdrup 1953) ordisturbance-recovery hypotheses (Behrenfeld and Boss 2014).In subpolar seas, PCI begins increasing while the mixed layeris deepest and light is still low (Fig. 5B), consistent with thedisturbance-recovery hypothesis. However, rapid shoaling ofthe mixed layer and a switch from cooling to warming theocean surface precede the period of greatest PCI increases inthese latitudes (Fig. 5B), consistent with a more traditionalbiophysical view of how subpolar spring phytoplanktonblooms proceed (Sverdrup 1953; Taylor and Ferrari 2011;Brody and Lozier 2014). However, we note that the MLDmay not be the appropriate metric for gauging phytoplank-ton exposure to light: Brody and Lozier (2014) demonstrated
that the depth of active mixing is shallower than the MLDprior to the onset of stratification. Thus, although we findtentative support for both the critical depth hypothesis and“top-down” disturbance-recovery mechanism in the subpolarNorth Atlantic, the coarsely sampled and averaged CPR surveydata and the lack of mixing length data preclude further spec-ulation on the precise triggers and timing of phytoplankton.
Contrasting seasonal responses of diatoms anddinoflagellates
Diatoms and dinoflagellates are significant components ofthe phytoplankton community in the North Atlantic, andhave different life histories, physiologies, and trophic strat-egies (Sarthou et al. 2005). The traditional view of their ecol-ogy, formalized by Ramon Margalef’s mandala paradigm,holds that diatoms prefer turbulent, nutrient-rich condi-tions, and dinoflagellates calm, nutrient-poor conditions(Margalef 1978; Irwin et al. 2012). Our present analysis andincreasing knowledge of how diatom and dinoflagellate traitsdetermine their fitness under different environmental condi-tions (Ward et al. 2011; Irwin et al. 2012; Barton et al. 2013)allow us to update and refine this paradigm to account fordifferences between subtropical and subpolar systems.
In the downwelling, nutrient-limited subtropical gyre,increasing turbulence and mixing increases diatom abun-dance, as expected, whereas in the upwelling, light-limitedsubpolar gyre, the opposite is generally true (Fig. 4). Diatomsare largely photoautotrophic, nonmotile phytoplankton thatrequire silica to form their covering frustules. For a given cellsize, diatoms are able to grow relatively quickly, comparedwith other taxa, and have high affinities for nitrate andphosphate (Edwards et al. 2012). They can also tolerate lowand variable light conditions (Depauw et al. 2012). Thesetraits are thought to enable diatoms to form conspicuousblooms in relatively turbulent, nutrient rich conditions athigh latitudes (Rynearson et al. 2013) and low latitudeupwelling systems in the North Atlantic (Taylor et al. 2012).However, where light may be limiting, such as in the highlatitudes in spring and winter, increasing turbulence mayexacerbate light limitation. Thus, while pulses of nutrients(Schartau et al. 2010) and increased uptake of nutrients dueto turbulence favor diatoms (Barton et al. 2014), and supportclassical Margalef’s mandala paradigm, we have shown herethat this perspective should be refined on seasonal timescalesto be specific to the dynamics within each gyre.
The relationship between seasonal environmental changeand dinoflagellate dynamics is quite different from that ofdiatoms (Fig. 4). Generally speaking, diatom abundancepeaks before dinoflagellates in seasonal ecological succession(Barton et al. 2013). In both the subtropical and subpolargyres, strong winds, surface cooling, turbulence, and deepmixing are negatively correlated with dinoflagellate abun-dance, whereas increasing stratification and SST coincidewith increases in dinoflagellate abundance. Dinoflagellates
Table 1. Pooled variance for ecological and physical timeseries describing the original observations (Absolute values; PCI),the long-term trend (PCITrend), the seasonal cycle (PCISeason),and the detrended anomalies (PCIVar). The pooled variance is aweighted, spatial average of the temporal variance at each loca-tion, where the weights are the number of monthly observa-tions. Values have been normalized by the pooled variance inthe seasonal cycle, such that seasonal cycle values are one andvalues are unitless. Values greater than one indicate greater var-iance than in the seasonal cycle
Absolutevalues
Long-termtrend
Seasonalcycle
Detrendedanomalies
PCI 3.039 0.130 1.000 1.999
Diatoms 3.374 0.274 1.000 2.345
Dinoflagellates 4.771 0.093 1.000 3.450
Wind speed 1.602 0.002 1.000 0.599
Heat flux 1.122 0.001 1.000 0.120
SST 1.053 0.004 1.000 1.048
Barton et al. North Atlantic phytoplankton community variability
191
tend to have relatively low nutrient affinities and growthrates (Edwards et al. 2012), and are, thus, not generallyopportunistic bloom formers like diatoms (with the notableexception of harmful algal blooms; Smayda 1997). Most, ifnot all, dinoflagellates are either mixotrophic (exhibitingboth photosynthetic and heterotrophic modes of nutrition)or heterotrophic (Barton et al. 2013). Mixotrophy is thoughtto be favored in resource-poor conditions (Ward et al. 2011),such as in stratified summer conditions in the North Atlan-tic. Heterotrophic dinoflagellates appear to be most abun-dant during stratified summer conditions characterized byan abundance of small prey cells (Barton et al. 2013). Finally,dinoflagellates are motile, yet their ability to swim effectivelyto maximize exposure to light, nutrients, and prey is nega-tively impacted by strong turbulence and shear (Durhamet al. 2009), which may help explain the widespread nega-tive correlation with turbulence. Taken together, these traitshelp explain the strong and basin-wide negative correlationof dinoflagellates with winds, cooling, turbulence, and mix-ing, as well as the positive connection with stratification andSST (Fig. 4).
The strong contrasts between diatoms and dinoflagellateshighlight an important point: there is no single, universalmechanism that drives the seasonal cycles and blooms of allphytoplankton species. Not only does the importance of dif-ferent physical mechanisms vary across the ocean andthrough time (e.g., Fig. 4) but also the range of phytoplank-ton species traits and complexity of predator-prey interac-tions implies that links between environmental forcing andpopulation change should be distinct for groups of similarphytoplankton. The seasonal ecological succession of phyto-plankton species in marine and freshwater systems illustratesthe complex variations present in the microbial community(Taylor et al. 1993), and these patterns almost certainly can-not be explained without considering differences among spe-cies, as we have highlighted here.
Ecological variability on interannual and longertimescales
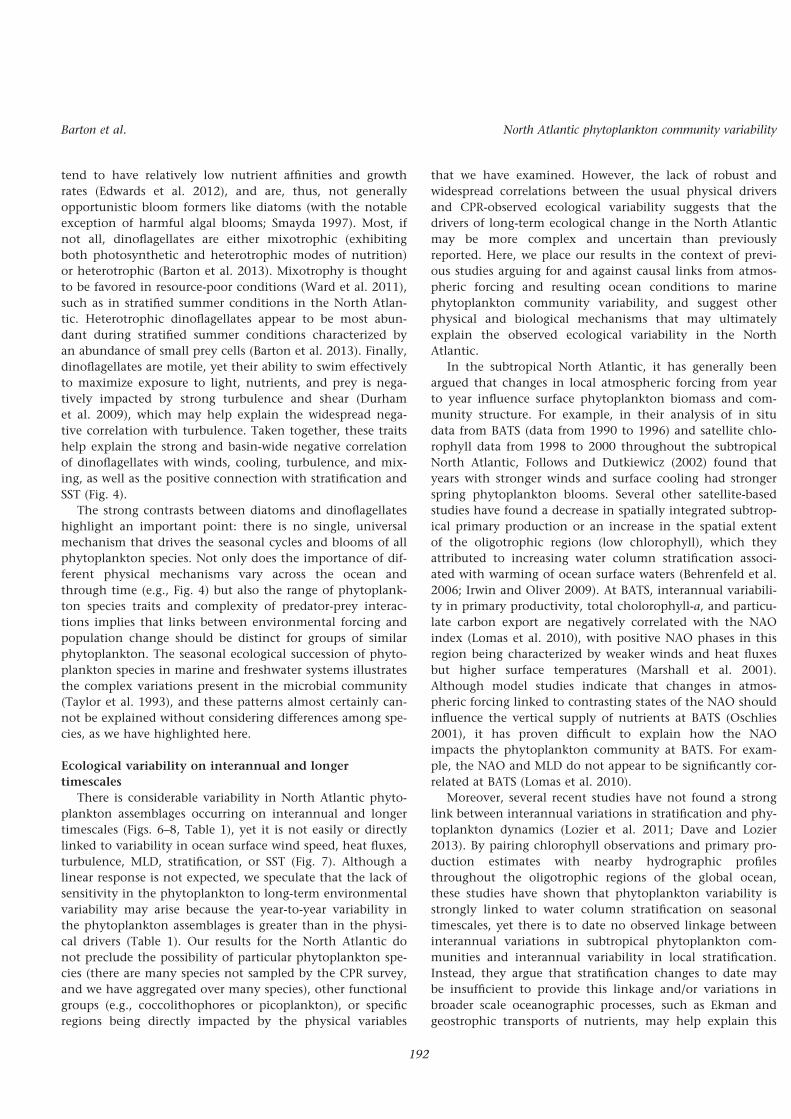
There is considerable variability in North Atlantic phyto-plankton assemblages occurring on interannual and longertimescales (Figs. 6–8, Table 1), yet it is not easily or directlylinked to variability in ocean surface wind speed, heat fluxes,turbulence, MLD, stratification, or SST (Fig. 7). Although alinear response is not expected, we speculate that the lack ofsensitivity in the phytoplankton to long-term environmentalvariability may arise because the year-to-year variability inthe phytoplankton assemblages is greater than in the physi-cal drivers (Table 1). Our results for the North Atlantic donot preclude the possibility of particular phytoplankton spe-cies (there are many species not sampled by the CPR survey,and we have aggregated over many species), other functionalgroups (e.g., coccolithophores or picoplankton), or specificregions being directly impacted by the physical variables
that we have examined. However, the lack of robust andwidespread correlations between the usual physical driversand CPR-observed ecological variability suggests that thedrivers of long-term ecological change in the North Atlanticmay be more complex and uncertain than previouslyreported. Here, we place our results in the context of previ-ous studies arguing for and against causal links from atmos-pheric forcing and resulting ocean conditions to marinephytoplankton community variability, and suggest otherphysical and biological mechanisms that may ultimatelyexplain the observed ecological variability in the NorthAtlantic.
In the subtropical North Atlantic, it has generally beenargued that changes in local atmospheric forcing from yearto year influence surface phytoplankton biomass and com-munity structure. For example, in their analysis of in situdata from BATS (data from 1990 to 1996) and satellite chlo-rophyll data from 1998 to 2000 throughout the subtropicalNorth Atlantic, Follows and Dutkiewicz (2002) found thatyears with stronger winds and surface cooling had strongerspring phytoplankton blooms. Several other satellite-basedstudies have found a decrease in spatially integrated subtrop-ical primary production or an increase in the spatial extentof the oligotrophic regions (low chlorophyll), which theyattributed to increasing water column stratification associ-ated with warming of ocean surface waters (Behrenfeld et al.2006; Irwin and Oliver 2009). At BATS, interannual variabili-ty in primary productivity, total cholorophyll-a, and particu-late carbon export are negatively correlated with the NAOindex (Lomas et al. 2010), with positive NAO phases in thisregion being characterized by weaker winds and heat fluxesbut higher surface temperatures (Marshall et al. 2001).Although model studies indicate that changes in atmos-pheric forcing linked to contrasting states of the NAO shouldinfluence the vertical supply of nutrients at BATS (Oschlies2001), it has proven difficult to explain how the NAOimpacts the phytoplankton community at BATS. For exam-ple, the NAO and MLD do not appear to be significantly cor-related at BATS (Lomas et al. 2010).
Moreover, several recent studies have not found a stronglink between interannual variations in stratification and phy-toplankton dynamics (Lozier et al. 2011; Dave and Lozier2013). By pairing chlorophyll observations and primary pro-duction estimates with nearby hydrographic profilesthroughout the oligotrophic regions of the global ocean,these studies have shown that phytoplankton variability isstrongly linked to water column stratification on seasonaltimescales, yet there is to date no observed linkage betweeninterannual variations in subtropical phytoplankton com-munities and interannual variability in local stratification.Instead, they argue that stratification changes to date maybe insufficient to provide this linkage and/or variations inbroader scale oceanographic processes, such as Ekman andgeostrophic transports of nutrients, may help explain this
Barton et al. North Atlantic phytoplankton community variability
192

variability (Williams and Follows 1998; Palter and Lozier2008; Ayers and Lozier 2010). It is possible that thestratification-phytoplankton link will become more apparentas climate warms in the coming century (Bopp et al. 2013).However, our analysis of northern subtropical CPR data sup-ports these more recent studies questioning the direct linkbetween local stratification changes and phytoplanktondynamics observed in the North Atlantic subtropical regionover the past several decades.
In North Atlantic subpolar gyre, we also argue that theevidence for a link between local atmospheric forcing andthe phytoplankton assemblage variability occurring on inter-annual and longer timescales is equivocal. Stronger surfacewinds and deeper mixed layers associated with positivephases of the NAO have been found to favor diatoms overdinoflagellates in the pelagic northeast North Atlantic,whereas dinoflagellates were more abundant in negativeNAO conditions, characterized by weaker winds and shal-lower mixed layers (Henson et al. 2012). In a study of pri-marily continental shelf waters, Hinder et al. (2012) found along-term increase in the relative abundance of diatoms vs.dinoflagellates, and linked this change to increases in windand SST. Leterme et al. (2005) found that the winter NAOindex was positively correlated with PCI and diatom abun-dance in the central North Atlantic during the spring bloomperiod (April to June), possibly in support of the hypothesisthat deeper mixed layers should favor diatoms (Henson et al.2012).
However, it is unclear how broadly these processes applythroughout the subpolar gyre. For example, CPR data fromthe northeast Atlantic indicate a negative correlation betweendiatoms and the NAO index in May and a positive correlationbetween dinoflagellates and the NAO index in April and May(Leterme et al. 2005), seemingly in contrast with the mecha-nism outlined above for the central North Atlantic. Moreover,Follows and Dutkiewicz (2002) found no year-on-year connec-tion between atmospheric forcing and satellite-measured sur-face chlorophyll concentration throughout the subpolar gyreor in observations from Ocean Weather Station “India” (59!
N, 19! W). Much as within the subtropical gyre, these linksmay become clearer as the climate changes in the comingcentury (Bopp et al. 2013). Yet our analyses of historicalobservations imply that interannual variations in phytoplank-ton assemblages are not neatly explained by local atmos-pheric forcing and oceanographic conditions, suggesting thatother mechanisms may have been important. But what mightthese mechanisms be? In the following, we speculate on thepotential roles of ocean circulation, zooplankton predation,and chaos in the plankton assemblages, and suggest that test-ing the importance of each potential alternative explanationshould be the subject of future research.
First, ocean circulation, including Ekman and geostrophiccurrents, has the capacity to impact surface phytoplanktoncommunities by mediating the three-dimensional transport
of nutrients. For example, along the northern flank of thesubtropical gyre, strong winter winds generate a southwardEkman flux of subpolar nutrients into the subtropics (Wil-liams and Follows 1998; Ayers and Lozier 2010). In the sub-polar gyre, by contrast, horizontal Ekman fluxes generallyremove nutrients from the euphotic zone. As the windsacross the North Atlantic are marked by spatially coordi-nated, low frequency variability (e.g., NAO), this mechanismmay play a role in structuring phytoplankton communitieson interannual to decadal timescales, particularly at theintergyre boundary and margins. Geostrophic currents havealso been shown to affect nutrient supply: geostrophic flowadvects relatively nutrient-poor waters toward the subpolargyre (Williams and Follows 1998; Williams et al. 2011),while nutrients are imported to the subtropical gyre via theupper limb of the meridional overturning circulation (Wil-liams et al. 2006; Palter and Lozier 2008). Additionally, eddymixing along the intergyre boundary has been shown todeliver nutrients from the subpolar to the subtropical basin(Bower et al. 1984). Therefore, interannual to decadalchanges in the strength and geometry of the gyre circula-tions, as have been observed in the North Atlantic (H!at!unet al. 2005), are expected to impact the horizontal deliveryof nutrients to the euphotic zone. Thus, we suggest thatfuture studies of phytoplankton variability consider the eco-logical significance of broad scale changes in the three-dimensional ocean circulation.
Although our focus has been largely on “bottom-up”processes, zooplankton predation clearly plays an instrumen-tal role in regulating phytoplankton assemblages. Mecha-nisms that disrupt the balance between predator and preyover longer timescales would make it more difficult to detectdirect “bottom up” links between atmospheric and oceano-graphic forcing variability and phytoplankton assemblages.For example, growth rates of zooplankton and phytoplank-ton have different sensitivities to temperature (Rose andCaron 2007); many larger zooplankton, such as copepods,have multiple developmental stages and relatively long gen-eration times that are dependent on temperature (Kiørboeand Hirst 2008); and many zooplankton have overwinteringstrategies (e.g., diapause in copepods) or dormant phases(e.g., dinoflagellate cysts) that may be cued by environmen-tal conditions (Hairston et al. 1990). Finally, as the environ-ment changes through time, predator and prey speciesranges and phenologies may change at different rates (Beau-grand et al. 2002; Edwards and Richardson 2004). Each ofthese mechanisms has the potential to alter the relative bal-ance of top-down and bottom-up regulation of phytoplank-ton assemblages, yet our limited understanding of theirimpacts on long-term variability in phytoplankton assemb-lages precludes an assessment of their impact on the observa-tions we report here (Chen et al. 2012).
There is also growing appreciation of the importance ofchaos in plankton communities, resulting possibly from
Barton et al. North Atlantic phytoplankton community variability
193

resource competition or predator-prey dynamics (Beninc!aet al. 2008; Kenitz et al. 2013). The presence of chaos,although still unsubstantiated in open ocean phytoplanktoncommunities, would make detecting links between physicalforcing and ecological change even more difficult.
Summary and wider implications
Large seasonal changes in atmospheric forcing and oceansurface conditions shape, to a great degree, the seasonalcycles of phytoplankton biomass, but also the relative abun-dance of phytoplankton species. These ecological changes inthe phytoplankton are felt throughout the marine food web,and help define the strength and efficiency of the ocean’sbiological pump. At the same time, there are real variationsin the North Atlantic phytoplankton assemblages occurringon interannual to multidecadal timescales. Explanations forthis variability have often focused on longer-term variabilityin the same physical mechanisms (i.e., changes in atmos-pheric forcing and ocean surface conditions) that shape sea-sonal change in the phytoplankton community (Bartonet al. 2003; Behrenfeld et al. 2006; Irwin and Oliver 2009).
Here, however, we have carefully examined a well vetted,decades-long observational record of the subpolar and sub-tropical North Atlantic phytoplankton assemblage, andfound that interannual to multidecadal changes in atmos-pheric forcing and surface oceanographic properties do notclearly or simply explain the historical variations in theNorth Atlantic phytoplankton assemblage. The lack of sensi-tivity in the phytoplankton to long-term variability in localatmospheric forcing and ocean conditions may arise, in part,because the year-to-year variability in the phytoplanktonassemblage is much greater than in the physical drivers. It isalso possible that other ecological (e.g., zooplankton grazing,chaos in the plankton) and physical mechanisms (e.g., oceancirculation) may play crucial, and as yet, poorly understoodroles in driving observed ecological changes. For example,several recent studies have considered how changes in oceancirculation impact phytoplankton biomass or chlorophyll inthe Pacific (Ayers and Lozier 2010; Rykaczewski and Dunne2010) and Atlantic Oceans (H"at"un et al. 2009; Johnson et al.2013), but considerably uncertainty remains. Thus, our workindicates that the traditional “bottom up” view that focusedsolely on local changes in atmospheric forcing and oceanconditions may not be sufficient to understand how phyto-plankton communities respond to changing climates, bothin the historical record and in anthropogenic climate changescenarios.
References
Ayers, J. M., and M. S. Lozier. 2010. Physical controls on theseasonal migration of the North Pacific transition zonechlorophyll front. J. Geophys. Res. 115: C05001. doi:10.1029/2009jc005596
Azam, F., T. Fenchel, J. G. Field, J. S. Gray, L. A. Meyer-Reil,and T. F. Thingstad. 1983. The ecological role of water-column microbes in the sea. Mar. Ecol. Prog. Ser. 10:257–263. doi:10.3354/meps010257
Barton, A. D., Z. V. Finkel, B. A. Ward, D. G. Johns, and M.J. Follows. 2013. On the roles of cell size and trophicstrategy in North Atlantic diatom and dinoflagellate com-munities. Limnol. Oceanogr. 58: 254–266. doi:10.4319/lo.2013.58.1.0254
Barton, A. D., C. H. Greene, B. C. Monger, and A. J.Pershing. 2003. The continuous plankton recorder surveyand the North Atlantic Oscillation: Interannual-to multi-decadal-scale patterns of phytoplankton variability in theNorth Atlantic Ocean. Prog. Oceanogr. 58: 337–358. doi:10.1016/j.pocean.2003.08.012
Barton, A. D., B. A. Ward, R. G. Williams, and M. J. Follows.2014. The impact of fine-scale turbulence on phytoplank-ton community structure. Limnol. Oceanogr. Fluids Envi-ron. 4: 34–49. doi:10.1215/21573689-2651533
Beaugrand, G., P. C. Reid, F. Iba~nez, J. A. Lindley, and M.Edwards. 2002. Reorganization of North Atlantic marinecopepod biodiversity and climate. Science 296: 1692–1694. doi:10.1126/science.1071329
Behrenfeld, M. 2010. Abandonding Sverdrup’s crtical depthhypothesis on phytoplankton blooms. Ecology 91: 977–989. doi:10.1890/09-1207.1
Behrenfeld, M. J., and E. S. Boss. 2014. Resurrecting the eco-logical underpinnings of ocean plankton blooms. Ann.Rev. Mar. Sci. 6: 167–194. doi:10.1146/annurev-marine-052913-021325
Behrenfeld, M. J., and others. 2006. Climate-driven trends incontemporary ocean productivity. Nature 444: 752–755.doi:10.1038/nature05317
Beninc!a, E., and others. 2008. Chaos in a long-term experi-ment with a plankton community. Nature 451: 822–825.doi:10.1038/nature06512
Bopp, L., and others. 2013. Multiple stressors of ocean eco-systems in the 21st century: Projections with CMIP5 mod-els. Biogeosciences 10: 3627–3676. doi:10.5194/bgd-10-3627-2013
Bower, A. S., H. T. Rossby, and J. L. Lillibridge. 1984. The GulfStream—Barrier or blender? J. Phys. Oceanogr. 15: 24–32.doi:10.1175/1520-0485(1985)015<0024:TGSOB>2.0.CO;2
Brody, S. R., and M. S. Lozier. 2014. Changes in dominantmixing length scales as a driver of subpolar phytoplank-ton bloom initiation in the North Atlantic. Geophys. Res.Lett. 41: 3197–3203. doi:10.1002/2014gl059707
Chen, B., M. R. Landry, B. Huang, and H. Liu. 2012. Doeswarming enhance the effect of microzooplankton grazingon marine phytoplankton in the ocean? Limnol. Ocean-ogr. 57: 519–526. doi:10.4319/lo.2012.57.2.0519
Chisholm, S. W. 1992. Phytoplankton size. In P. G. Falkow-ski and A. D. Woodhead [eds.], Primary productivity andbiogeochemical cycles in the sea. Plenum Press.
Barton et al. North Atlantic phytoplankton community variability
194

Colebrook, J. M. 1982. Continuous plankton records: Sea-sonal variations in the distribution and abundance ofplankton in the North Atlantic Ocean and the North Sea.J. Plankton. Res. 4: 435–462. doi:10.1093/plankt/4.3.435
D’Ortenzio, F., D. Antoine, E. Martinez, and M. Riberad’Alcal!a. 2012. Phenological changes of oceanic phyto-plankton in the 1980s and 2000s as revealed by remotelysensed ocean-color observations. Glob. Biogeochem. Cyc.26: GB4003. doi:10.1029/2011gb004269
Dave, A. C., and M. S. Lozier. 2013. Examining the globalrecord of interannual variability in stratification and marineproductivity in the low-latitude and mid-latitude ocean. J.Geophys. Res. 118: 3114–3127. doi:10.1002/jgrc.20224
De Boyer Mont"egut, C., G. Madec, A. Fischer, A. Lazar, and D.Iudicone. 2004. Mixed layer depth over the global ocean:An examination of profile data and a profile-based clima-tology. J. Geophys. Res. 109. doi:10.1029/2004jc002378
Depauw, F. A., A. Rogato, M. Ribera d’Alcal"a, and A.Falciatore. 2012. Exploring the molecular basis ofresponses to light in marine diatoms. J. Exp. Bot. 63:1575–1591. doi:10.1093/jxb/ers005
Deser, C., A. S. Phillips, and M. A. Alexander. 2010. Twentiethcentury tropical sea surface temperature trends revisited.Geophys. Res. Lett. 37: L10701. doi:10.1029/2010GL043321
Durham, W. M., J. O. Kessler, and R. Stocker. 2009. Disrup-tion of vertical motility by shear triggers formation ofthin phytoplankton layers. Science 323: 1067–1070. doi:1067-1070, 10.1126/science.1167334
Edwards, K. F., M. K. Thomas, C. A. Klausmeier, and E.Litchman. 2012. Allometric scaling and taxonomic varia-tion in nutrient utilization traits and maximum growthrate of phytoplankton. Limnol. Oceanogr. 57: 554–566.doi:10.4319/lo.2012.57.2.0554
Edwards, M., and A. J. Richardson. 2004. Impact of climatechange on marine pelagic phenology and trophic mis-match. Nature 430: 881–884. doi:10.1038/nature02808
Falkowski, P. G., R. T. Barber, and V. Smetacek. 1998. Bio-geochemical controls and feedbacks on ocean primaryproduction. Science 281: 200–206. doi:10.1126/science.281.5374.200
Fleming, S. W. 2010. Signal-to-noise ratios in geophysicaland environmental time series. Environ. Eng. Geosci. 16:389–399. doi:10.2113/gseegeosci.16.4.389
Follows, M., and S. Dutkiewicz. 2002. Meteorological modu-lation of the North Atlantic spring bloom. Deep Sea Res.49: 321–344. doi:10.1016/S0967-0645(01)00105-9
Garcia, H. E., and others. 2010. World Ocean Atlas 2009, V.4: Nutrients (phosphate, nitrate, silicate), p. 398. In S. Lev-itus [ed.], NOAA Atlas NESDIS.
Hairston, N. G., T. A. Dillon, and B. T. De Stasio. 1990. Fieldtest for the cues of diapause in a freshwater copepod.Ecology 71: 2218–2223. doi:10.2307/1938634
H"at"un, H., A. B. Sando, H. Drange, B. Hansen, and H.Valdimarsson. 2005. Influence of the Atlantic subpolar
gyre on the thermohaline circulation. Science 309: 1841–1844. doi:10.1126/science.1114777
H"at"un, H., and others. 2009. Large bio-geographical shifts inthe north-eastern Atlantic Ocean: From the subpolar gyre,via plankton, to blue whiting and pilot whales. Prog. Oce-anogr. 80: 149–162. doi:10.1016/j.pocean.2009.03.001
Henson, S., R. Lampitt, and D. Johns. 2012. Variability inphytoplankton community structure in response to theNorth Atlantic Oscillation and implications for organiccarbon flux. Limnol. Oceanogr. 57: 1591–1601. doi:10.4319/lo.2012.57.6.1591
Hinder, S. L., G. C. Hays, M. Edwards, E. C. Roberts, A. W.Walne, and M. B. Gravenor. 2012. Changes in marine dino-flagellate and diatom abundance under climate change.Nat. Clim. Change 2: 271–275. doi:10.1038/nclimate1388
Irwin, A. J., A. M. Nelles, and Z. V. Finkel. 2012. Phytoplank-ton niches estimated from field data. Limnol. Oceanogr.57: 787–797. doi:10.4319/lo.2012.57.3.0787
Irwin, A. J., and M. J. Oliver. 2009. Are ocean deserts gettinglarger? Geophys. Res. Lett. 36. doi:10.1029/2009gl039883
Johnson, C., M. Inall, and S. H€akkinen. 2013. Decliningnutrient concentrations in the northeast Atlantic as aresult of a weakening Subpolar Gyre. Deep Sea Res. I. 82:95–107. doi:10.1016/j.dsr.2013.08.007
Kalnay, E., and others. 1996. The NCEP/NCAR 40-Year Rean-alysis Project. Bull. Am. Met. Soc. 77: 437–471. doi:10.1175/1520-0477(1996)077<0437:tnyrp>2.0.co;2
Kenitz, K., R. G. Williams, J. Sharples, €O. Selsil, and V. N.Biktashev. 2013. The paradox of the plankton: Speciescompetition and nutrient feedback sustain phytoplanktondiversity. Mar. Ecol. Prog. Ser. 490: 107–119. doi:10.3354/meps10452
Kiørboe, T., and A. G. Hirst. 2008. Optimal developmenttime in pelagic copepods. Mar. Ecol. Prog. Ser. 367: 15–22. doi:10.3354/meps07572
Kraus, E. B. 1988. Merits and defects of different approachesto mixed layer modeling, p. 37–50. In J. C. J. Nihoul andB. M. Jamart [eds.], Small scale turbulence and mixing inthe ocean. Elsevier.
Lessard, E. J., and M. C. Murrell. 1998. Microzooplanktonherbivory and phytoplankton growth in the northwesternSargasso Sea. Aquat. Microb. Ecol. 16: 173–188. doi:10.3354/ame016173
Leterme, S. C., M. Edwards, L. Seuront, M. J. Attrill, P. C.Reid, and A. W. G. John. 2005. Decadal basin-scalechanges in diatom, dinoflagellates, and phytoplankotoncolor across the North Atlantic. Limnol. Oceanogr. 50:1244–1253. doi:10.4319/lo.2005.50.4.1244
Lomas, M. W., and others. 2010. Increased ocean carbonexport in the Sargasso Sea linked to climate variability iscountered by its enhanced mesopelagic attenuation. Bio-geosciences 7: 57–70. doi:10.5194/bg-7-57-2010
Lozier, M. S., A. C. Dave, J. B. Palter, L. M. Gerber, and R. T.Barber. 2011. On the relationship between stratification
Barton et al. North Atlantic phytoplankton community variability
195

and primary productivity in the North Atlantic. Geophys.Res. Lett. 38: L18609. doi:10.1029/2011GL049414
Margalef, R. 1978. Life-forms of phytoplankton as survivalalternatives in an unstable environment. Ocean. Acta 1:493–509.
Marshall, J., and others. 2001. North Atlantic climate vari-ability: Phenomena, impacts and mechanisms. Int. J.Clim. 21: 1863–1898. doi:10.1002/joc.693
Neuer, S., and others. 2002. Differences in the biological car-bon pump at three subtropical ocean sites. Geophys. Res.Lett. 29. doi:10.1029/2002GL015393
Niiler, P. P., and E. B. Kraus. 1977. One-dimensional modelsof the upper ocean, p. 143–172. In E. B. Kraus [ed.], Mod-eling and prediction of the upper layers of the ocean.Pergamon.
Oschlies, A. 2001. NAO-induced long-term changes in nutri-ent supply to the surface waters of the North Atlantic.Geophys. Res. Lett. 28: 1751–1754. doi:10.1029/2000gl012328
Palter, J. B., and M. S. Lozier. 2008. On the source of GulfStream nutrients. J. Geophys. Res. 113: C06018. doi:10.1029/2007jc004611
Raitsos, D. E., P. C. Reid, S. J. Lavender, M. Edwards, and A.J. Richardson. 2005. Extending the SeaWiFS chlorophylldata set back 50 years in the northeast Atlantic. Geophys.Res. Lett. 32: L06603. doi:10.1029/2005gl022484
Richardson, A. J., and others. 2006. Using continuous plank-ton recorder data. Prog. Oceanogr. 68: 27–74. doi:10.1016/j.pocean.2005.09.011
Rose, J. M., and D. A. Caron. 2007. Does low temperature con-strain the growth rates of heterotrophic protists? Evidenceand implications for algal blooms in cold waters. Limnol.Oceanogr. 52: 886–895 doi:10.4319/lo.2007.52.2.0886
Rykaczewski, R. R., and J. P. Dunne. 2010. Enhanced nutri-ent supply to the California Current Ecosystem withglobal warming and increased stratification in an earthsystem model. Geophys. Res. Lett. 37: L21606. doi:10.1029/2010GL045019
Rynearson, T. A., and others. 2013. Major contribution ofdiatom resting spores to vertical flux in the sub-polarNorth Atlantic. Deep Sea Res. I 82: 60–71. doi:10.1016/j.dsr.2013.07.013
Sarthou, G., K. R. Timmermans, S. Blain, and P. Tr!eguer.2005. Growth physiology and fate of diatoms in theocean: A review. J. Sea Res. 53: 25–42. doi:10.1016/j.seares.2004.01.007
Schartau, M., M. R. Landry, and R. A. Armstrong. 2010. Den-sity estimation of plankton size spectra: A reanalysis ofIronEx II data. J. Plankton Res. 32: 1167–1184. doi:10.1093/plankt/fbq072
Smayda, T. J. 1997. Harmful algal blooms: Their ecophysiol-ogy and general relevance to phytoplankton blooms inthe sea. Limnol. Oceanogr. 42: 1137–1153. doi:10.4319/lo.1997.42.5_part_2.1137
Smith, D., and J. Murphy. 2007. An objective ocean tempera-ture and salinity analysis using covariances from a globalclimate model. J. Geophys. Res. 112: C02022. doi:10.1029/2005JC003172
Steinberg, D. K., C. A. Carlson, N. R. Bates, R. J. Johnson, A.Michaels, and A. H. Knap. 2001. Overview of the USJGOFS Bermuda Atlantic Time-series Study (BATS): Adecade-scale look at ocean biology and biogeochemistry.Deep Sea Res. II 48: 1405–1447. doi:10.1016/S0967-0645(00)00148-X
Sverdrup, H. 1953. On conditions of the vernal blooming ofphytoplankton. ICES J. Mar. Sci. 18: 287–295. doi:10.1093/icesjms/18.3.287
Tarran, G. A., J. L. Heywood, and M. V. Zubkov. 2006. Lati-tudinal changes in the standing stocks of nano- andpicoeukaryotic phytoplankton in the Atlantic Ocean.Deep Sea Res. II 53: 1516–1529. doi:10.1016/j.dsr2.2006.05.004
Taylor, A. H., D. S. Harbour, R. P. Harris, P. H. Burkill, and E.S. Edwards. 1993. Seasonal succession in the pelagic eco-system of the North Atlantic and the utilization of nitro-gen. J. Plankton Res. 15: 875–891. doi:10.1093/plankt/15.8.875
Taylor, G. T., and others. 2012. Ecosystem responses in thesouthern Caribbean Sea to global climate change. Proc.Natl. Acad. Sci. USA 109: 19315–19320. doi:10.1073/pnas.1207514109
Taylor, J. R., and R. Ferrari. 2011. Shutdown of turbulentconvection as a new criterion for the onset of spring phy-toplankton blooms. Limnol. Oceanogr. 56: 2293–2307.doi:10.4319/lo.2011.56.6.2293
Theil, H. 1950. A rank-invariant method of linear and poly-nomial regression analysis. Proc. R. Neth. Acad. Sci. LIII:1397–1412.
Ward, B. A., S. Dutkiewicz, A. D. Barton, and M. J. Follows.2011. Biophysical aspects of resource acquisition andcompetition in algal mixotrophs. Am. Nat. 178: 98–112.doi:10.1086/660284
Ward, B. A., S. Dutkiewicz, O. Jahn, and M. J. Follows. 2012. Asize-structured food-web model for the global ocean. Limnol.Oceanogr. 57: 1877–1891. doi:10.4319/lo.2012.57.6.1877
Williams, R. G., and M. J. Follows. 1998. The Ekman transferof nutrients and maintenance of new production over theNorth Atlantic. Deep Sea Res. I. 45: 461–489. doi:10.1016/S0967-0637(97)00094-0
Williams, R. G., A. J. McClaren, and M. J. Follows. 2000. Esti-mating the convective supply of nitrate and implied vari-ability in export production over the North Atlantic.Global Biogeochem. Cycles 14: 1299–1313. doi:10.1029/2000GB001260
Williams, R. G., V. Roussenov, and M. J. Follows. 2006.Nutrient streams and their induction into the mixedlayer. Global Biogeochem. Cycles 20: GB1016. doi:10.1029/2005gb002586
Barton et al. North Atlantic phytoplankton community variability
196

Williams, R. G., and others. 2011. Nutrient streams in theNorth Atlantic: Advective pathways of inorganic and dis-solved organic nutrients. Global Biogeochem. Cycles 25:GB4008. doi:10.1029/2010gb003853
AcknowledgmentsWe thank: David Johns and the Sir Alister Hardy Foundation for Ocean
Science for maintaining and providing the Continuous PlanktonRecorder data used in this study; Doug Smith of the UK MetOffice forproviding the gridded temperature and salinity data; the National Cen-ters for Environmental Prediction and National Center for AtmosphericResearch (NCEP/NCAR) for providing the heat flux and wind data.
A.D.B. was supported by the NSF International Research FellowshipProgram; M.S.L. was supported by the Ocean Biology and Biogeochem-istry Program at the National Aeronautics and Space Administration;R.G.W. was supported by the UK Natural Environment Research Council(NE/H02087X/1).
Submitted 10 June 2014
Revised 3 October 2014
Accepted 2 October 2014
Associate editor: David A. Caron
Barton et al. North Atlantic phytoplankton community variability
197