limits to sustained metabolic rate: the link between food ... · capacity and basal (or standard)...
TRANSCRIPT

746
Limits to Sustained Metabolic Rate: The Link between Food Intake, Basal Metabolic Rate, and Morphology in Reproducing Mice, Mus musculus
J. R. Speakman
J. McQueenie Department of Zoology, University of Aberdeen, Aberdeen AB9 2TN, Scotland
Accepted 9/21/95
Abstract Thirty virgin female white (MF1) mice (Mus musculus) were divided into three
groups: an unmated control group; a second, mated group, allowed to proceed to peak gestation; and a third, mated group, allowed to proceed to peak lactation.
Nine unmated animals and eight of each of the two mated groups had their basal
metabolism (oxygen consumption at 28°C) measured and were then killed by
means ofa CO2 overdose, and the wet masses of 14 different body components
measured. Body mass of the control animals averaged 265 g, not significantly
different from animals in the other two groups immediately postmating. At peak
gestation body mass averaged 505 g, immediate postpartum mass was 35.5 g, and by the end of lactation it was 38. 4 g. Basal metabolic rate (BMR) of the con
trol animals (0313 W) was Significantly lower than the BMR of both pregnant
(078 W") and lactating (0.95 W) animals. Food intake of controls was 97.9 kj d- 1
(3. 6 X BMR). At peak gestation food intake was 1193 kj d- 1 (2.4 X BMR), and at
peak lactation it was 405.5 k] d- 1 (5.96 X BMR). IfBMR had not increased
throughout reproduction, the peak food intake would have represented 12.2
times BMR. Morphological changes associated with the reproductive cycle mainly
included increases in tbe masses of tbe alimentary tract, liver, kidneys, heart, and lungs. A principal components analysis revealedfour major dominant axes
of variability in the morphology. The first principal component was dominated by
tbe combined alimentary effects and explained 71.8% of the variation in BMR.
Tbese data are consistent with the hypotheses that maximal sustainable metabolic
rate reflects a link between structure of the alimentary tract, maximal daily food assimilation, and BMR. That is, as mice progressed through reproduction, their
increasingfood requirements were beyond tbe capacity of their guts to supply
them. This led to hypertrophy of the alimentary tract and associated organs, with a consequent increase in BMR.
Physiologicalloology 69(4):746-769. 1996. © 1996 by The University of Chicago. All rights reserved. 0031-935Xj96j6904-9446$02.00
Energetics ofReproducing Mice 747
Introduction
Energy has been frequently invoked as a key resource, limits on the avail
ability and expenditure of which have been implied to have a profound
effect on the evolution of many morphological and behavioural traits (Stenseth et a1. 1980; Feder et a1. 1987; Tomasi and Horton 1993). The rate at
which an animal can expend energy is negatively linked to the duration of the performance at any particular level of expenditure. Hence, behaviours
of very short duration (seconds) can involve expenditure of energy at a rate
considerably greater than that of behaviours that have to be sustained for several minutes (Peterson et a1. 1990). It has been suggested that this neg
ative relationship in short-term expenditure is linked to constraints in the physiological capacity and fatigue resistance of skeletal muscle (Peterson
et a1. 1990). Over considerably longer periods, of hours and days, the maximal rate of
energy expenditure that can be sustained appears to be limited at some lower level than short-duration rates of energy expenditure. Since it is ev
ident that for short periods animals can expend energy considerably faster
than these sustainable levels, the question arises as to which factors influence
the sustainable rate of energy expenditure. This is a critical question because the rates of energy expenditure that can be sustained for long durations
have (in theory at least; see Fisher 1930) consequences for life-history pa
rameters, such as litter size. If there is a limit on how much energy an animal
can expend for prolonged periods, this may place a proximate, and ultimate, constraint on the life history of the animal in question.
Two contrasting hypotheses have been advanced to explain the limits to sustainable metabolic rate. The first hypothesis is that long-duration rates
of expenditure are limited centrally by the structure of the alimentary tract
(Weiner 1987; Daan et a1. 1989; Peterson et a1. 1990; Diamond 1993; Wunder 1993). That is, species with alimentary systems that allow greater extraction
of food energy will have greater potential sustainable metabolic rates. This central limitation hypothesis predicts that limits on an animal's energy ex
penditure should be independent of the factors leading to the increased expenditure. The alternative hypothesis is that the limits to sustainable met
abolic rates act more peripherally at the sites where energy is actually used. This peripheral limitation hypothesis predicts that different causes of in
crease in energy expenditure will lead to different sustainable rates of ex
penditure. Direct tests of these predictions have, however, proved equivocal, with some species showing similar sustainable expenditures under different
causes of increased expenditure, whilst others have shown different sustainable responses (Weiner 1987, 1989).

748 J. R. Speakman and J. McQueenie
A principal line of evidence supporting the central limitation hypothesis
is the suggestion that the association between alimentary tract energy uptake
capacity and basal (or standard) metabolic rate (BMR) can explain the well
documented correlation between maximal field energy expenditure and BMR. Drent and Daan (1980) were probably the first to explore this con
nection, and they came to the conclusion that the maximal rates of sustainable field energy expenditure were around four times BMR. However, more
recent evaluations, using larger databases, have suggested the actual limit
may be somewhat higher, at six to seven times BMR (Bryant and Tamer
1989; Peterson et al. 1990; Koteja 1991). An argument frequently advanced
to explain this linkage is that animals that sustain greater energy expenditures
over prolonged periods must support this demand by having a greater-capacity alimentary system (i.e., the sustainable rate is centrally limited) and
that such systems are themselves costly to maintain, leading to increases in
BMRs (Daan et al. 1990; Hammond and Diamond 1992; Diamond 1993).
This interpretation is further reinforced by a review of maximal energy intake
(food) rates, which also suggests a limit of around six to seven times BMR
(Kirkwood 1983). If this latter interpretation, that the connection between BMR, field met
abolic rate, and food intake is dependent on central limitation, is correct,
it should lead to some predictable consequences of manipulations made
on animals' long-term energy demands. For example, if an animal has its
sustainable energy demands inflated above the limit of six to seven times
BMR, it should respond to this, if possible, by hypertrophy of the gut, a direct consequence of which should be an increase in the animal's BMR,
which would result in the ratio between BMR and sustainable metabolic
rate remaining at about six- to sevenfold. On the other hand, if peripheral
factors limit the sustainable metabolic rate, such an increase in BMR to
sustain the ratio would not be anticipated unless the peripheral tissues in
volved also contribute in a major way to the BMR. A potential test of the linkage between sustainable metabolic rate, gut hypertrophy, and BMR is
provided by the reproductive cycle of eutherian mammals. As most mammals
move from nonbreeding through pregnancy to peak lactation, their demands
for food generally increase enormously (Smith and McManus [1975]; Ran
dolph et al. [1977]; Millar [1978]; Studier [1979]; Innes and Millar [1981]; Mattingly and McClure [1982]; Heasley [1983]; Glazier [1985]; Kenagy [1987];
Thompson [1993]; but see Oftedal [1984] for an exception). It has been long established that to accommodate the large increase in food demands, lac
tating mammals experience massive hypertrophy of the gut (Fell et al. 1962;
Myrcha 1962, 1965; Campbell and Fell 1964; Wunder 1993). If there is a link between the food intake, gut morphology, and BMR, then we would

Energetics of Reproducing Mice 749
predict that the large increase in gut size during lactation would be matched
by a similar increase in BMR. However, many studies of small mammals
have found that lactation and gestation are not associated with an increase in BMR relative to that of nonbreeding animals (Trojan and Wojciechowska
1967; Dryden et al. 1974; Randolph et al 1977; Studier 1979; McClure and Randolph 1980; Mattingly and McClure 1982; Nicoll and Thompson 1987;
Prentice and Whitehead 1987; Rose 1987; Weiner 1987) or that increases are trivially small (Migula 1969; Fleming et al. 1981). Unfortunately, few
studies have correlated the changes that occur in food intake, BMR, and gut morphology in the same individual. In the present study we used three
groups of mice: control animals, which were nonbreeding, and late-pregnant and late-lactating animals. In each group we assessed the food intake, BMR,
and changes in the gut and other aspects of morphology to further assess
the interrelationships between these traits.
Material and Methods
We used a total of 30 white (MFl) virgin female mice. Each mouse was
housed separately in a plastic shoe-box cage, where it was provided with
sawdust and ad lib. supplies of a dry pelleted food (SDS RM3 pellets, SDS, Witham) and water. The ambient temperature was regulated at 22°C (± 2°C),
and the photoperiod was 16L:8D, with lights on at 0400 hours. The mice were allocated at random to three groups (10 in each). The first group
comprised control animals, which were not mated. The remaining 20 females (in two groups of 10) were each placed with a different male mouse for 7
d. After this period the males were removed. We staggered the matings so
that, in theory, each animal would reach the end of gestation, or lactation,
on a different day. One of the experimental groups was allowed to proceed to peak gestation (ca. 18 d from conception), while the second experimental
group was allowed to proceed to the peak of lactation (14 d from parturition). Each morning at 0900 hours we measured (to 0.01 g) all the female body
masses and the food remaining in the hopper (plus any large pieces of pellet in the cage). The hoppers were then refilled and reweighed. In this
way we could calculate the food that had been taken from the hopper over the previous 24 h. We have assumed that this missing food was equal to
food intake. This slightly overestimates food intake because some small fragments of food were lost from the hopper, as the mice removed some
pellets but did not ingest them. Sorting through the sawdust of several animals revealed that these losses were very small.
750 J. R. Speakman and J. McQueenie
On one day, we sorted through the sawdust of six control animals, four
pregnant animals, and three animals in late lactation and collected all the faeces produced by the female. The faeces were dried to constant weight
at 60°c (14 d) and weighed (to 0.001 g). Since the food supplied to the
animals was dry (dry matter content ca. 99%), we evaluated the dry mass absorption as the ingested mass minus the faecal dry mass. We then cal
culated the apparent dry mass absorption efficiency as the absorbed mass
divided by ingested mass. We assumed that energy absorption was equal to
dry mass absorption and multiplied this by the food intake. This underes
timates energy intake because the faeces probably had lower energy content than the food. However, this latter effect is also small; for example, in wood
mice (Apodemus sylvaticus) feeding on mealworms the dry mass absorption
efficiency was 84% and the energy absorption efficiency 87.7%, but when
feeding on grain the dry mass efficiency was 90.5% and the energy efficiency 88.7% (N. Corp, M. Gorman, and J. R. Speakman, unpublished data).
Respirometry
We measured the BMR (oxygen consumption) of mice during the day
(quiescent phase). Technically, it is not possible to establish a BMR for
reproducing individuals, since in the original prescriptions of requirements
for BMR (Kleiber 1961) it was required that the animals be nonreproducing. Nevertheless, many previous articles have referred to the change in BMR
throughout reproduction (e.g., Thompson 1993) or have regarded BMR and
standard metabolic rate as synonymous (Bartholomew 1982; MacMillen and
Hinds 1993). Given this semantic caveat, we shall use the term BMR to refer to the measurements we made using the same protocol for each of the three
groups of animals. We used an open-flow dual channel respirometry system
similar to that used previously (Speakman and Racey 1988; Speakman et al.
1991). The temperature was regulated at 28°C, previous studies having indicated that this was the lower critical temperature for these mice (J. R.
Speakman, unpublished data). All estimates of oxygen consumption were
corrected to standard temperature and pressure, dry. We did not deprive the mice of food prior to measurements, as they were already at least 5 h
into the light phase before measurements commenced. The protocol for
assessing BMR can significantly affect the generated estimate (Hayes et al.
1992b). In this study measurements were made for 3 h. Behavioural observations of single mice in the same chambers have indicated that they rest
for on average 90% of the time after the first hour in the chamber (F. P. Rossi and]. R. Speakman, unpublished data). We took as the estimated basal
oxygen consumption the average oxygen consumption over the entire last
Energetics ofReproducing Mice 751
hour spent in the chamber. We did not measure CO 2 production in this
experiment, but in other studies of these mice on this diet we recorded a
respiratory quotient between 0.75 and 0.85. We therefore converted oxygen consumption to energy expenditure using an oxy-calorific equivalent of 20.08 J mL-] (equivalent to a respiratory quotient of 0.8).
Body Composition Analysis
Within 30 min of the end of respirometry measurements, each animal was
killed by CO 2 inhalation. The animals were then immediately dissected.
We removed and immediately recorded the masses (to 0.1 mg, with a Sartorius balance) of the liver, kidneys, spleen, uterus (including any foetuses
in utero), visceral fat, pelt (skin, subdermal fat, and fur combined), lungs,
heart, and thymus. The gut was cut at the pyloric and cardiac sphincters, the ileocaecal junction, and anus. The small intestine was subdivided into
the ileum and the remainder. We defined the ileum from the pyloric sphinc
ter to the bile duct. The removed stomach and small and large intestines
were then cut open longitudinally, washed with 0.9% saline, and blotted
dry before wet masses were recorded. This removed any residual gut con
tents and mucous. Gut contents were generally minimal.
Statistics
We analyzed the variability in morphology between the three groups using
one-way ANOVA of the data for each organ separately, since we were not
interested in the extent of differences in the sizes of the different organs in
each group. We also used one-way ANOVAs to establish variability between
groups in the BMRand absorption efficiency (percentage). Percentage values were arcsine square-root transformed prior to analysis. We determined the
locations of significant effects in significant ANOVAs using the Tukey minimum significant difference test (Sokal and Rohlf 1981). The responses of
the organs to reproductive events were closely correlated; thus it was in
appropriate to use them as independent predictors of BMR. To relate the morphological variability to the measured BMR, we performed a principal
components analysis on the masses of the organs across all individuals to extract orthogonal axes for subsequent use in regression analysis. We used
the correlation matrix rather than the covariance matrix (Jolliffe 1982) as,
although the masses were all measured in the same dimensions, there was large variability in the absolute values between the different organs. We
entered scores for each individual along all the orthogonal axes (n = 14) as independent predictors in a stepwise multiple regression analysis, using

752 J. R. Speakman and J. McQueenie
both forward inclusion and backward deletion approaches, to establish those morphological axes explaining the most variability in the observed BMR.
Results
Body Mass
Nine of the 10 animals in each of the pregnant and lactating groups were
successfully mated. Eight animals from each of these groups and nine control animals were used in respirometry and body composition analysis. Not all
animals were used because, despite our attempts to stagger matings, some
matings resulted in simultaneous development and we could not measure
more than one animal on each day. The mean body mass of the control group was 24.8 g (standard deviation [SD] = 1.8, n = 10). This was not
significantly different from the mean mass of the animals in the other two
groups at the start of gestation (25.1 g, SD = 1.44, n = 18). Throughout
gestation, body mass increased curvilinearly to peak at 52.3 g (SD = 2.98
g, n = 9 animals in pregnant group; Fig. 1) immediately preceding partu
rition. The mean number of embryos in utero for the eight animals that
were killed was 11.1 (SD = 0.781, n = 8).
The mean mass of the adult females in the lactating group on the day
after parturition was 35.3 g (SD = 1.65, n = 9). The mean body mass of
GESTATION 60
LACTATION
50
§ fII ifFfII
40E >'C 0
IV
yf ffHHHHI 30
m
~! "
20 -20 -10 0 10 20
Day of reproduction
Fig. 1. Mean (± SD) body mass (g) of white mice throughout pregnancy
and lactation. During gestation, n = 18; during lactation, n = 9.
Energetics ofReproducing Mice 753
single neonates born to these animals, measured less than 12 h after parturition, was 1.47 g (SD = 0.23, n = 30). After parturition body mass of the
females continued to rise to a maximum at peak lactation (14 d after par
turition), averaging 38.8 g in those that were killed (SD = 3.4, n = 8).
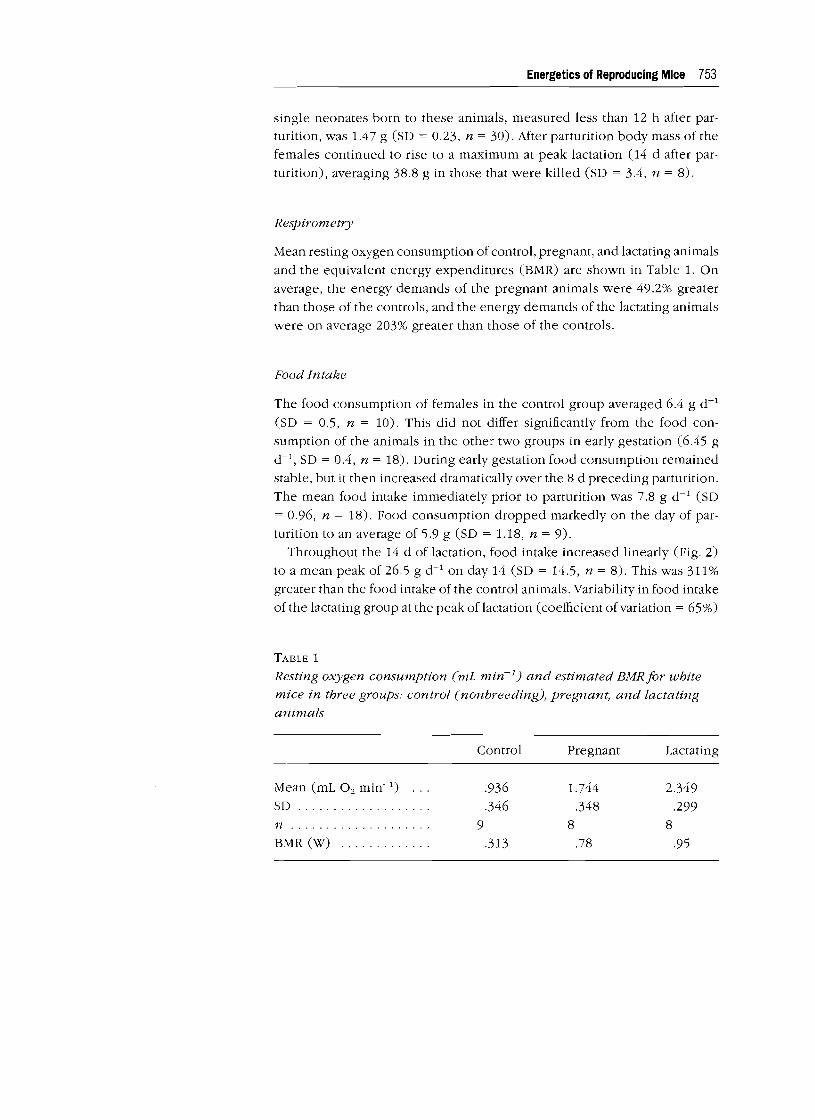
Respirometry
Mean resting oxygen consumption of control, pregnant, and lactating animals
and the equivalent energy expenditures (BMR) are shown in Table 1. On
average, the energy demands of the pregnant animals were 49.2% greater than those of the controls, and the energy demands of the lactating animals
were on average 203% greater than those of the controls.
Food Intake
The food consumption of females in the control group averaged 6.4 g d- I
(SD = 0.5, n = 10). This did not differ Significantly from the food con
sumption of the animals in the other two groups in early gestation (6.45 g
d", SD = 0.4, n = 18). During early gestation food consumption remained
stable, but it then increased dramatically over the 8 d preceding parturition. The mean food intake immediately prior to parturition was 7.8 g d- I (SD
= 0.96, n = 18). Food consumption dropped markedly on the day of par
turition to an average of 5.9 g (SD = 1.18, n = 9).
Throughout the 14 d of lactation, food intake increased linearly (Fig. 2)
to a mean peak of 26.5 g d- I on day 14 (SD = 14.5, n = 8). This was 311%
greater than the food intake of the control animals. Variability in food intake
of the lactating group at the peak of lactation (coefficient of variation = 65%)
TABLE 1
Resting oxygen consumption (mL min-I) and estimated BMRfor white
mice in three groups: control (nonbreeding), pregnant, and lactating
animals
Control Pregnant Lactating
Mean (mL O2 min-I) .936 1.744 2.349 SD . .346 .348 .299 n . 9 8 8
BMR (W) . .313 .78 .95

754 J. R. Speakman and J. McQueenie
GESTATION LACTATION
30
>: C'CI "0 Cl
20 -.. (I) .lll: ell c
"0
fff0 LL
0 10 •••••••t"f 0 -10 0 10 20
Day of reproduction
Fig. 2. Mean (± SD) daily food intake (g/d) ojwhite mice throughout the
last 10 d ojgestation and 15 d oj lactation. During gestation, n = 18;
during lactation, n = 9.
was much greater than it had been in gestation (coefficient of variation =
15%) or the controls (coefficient of variation = 12%). This variability reflected
the different numbers of offspring that had survived to late lactation. The
average number of young remaining in the litters at peak lactation was 9.0.
There was a significant positive relationship between food intake at peak
lactation and the number of offspring in the litter (Fig. 3). The least-squares
regression equation (food intake [g d-1j = 8.51 + 1.97. n young) explained
84.3% of the variation in food intake (n = 8). There was no indication of
an asymptote in this relationship.
Dry mass absorption efficiency (percentage) averaged 86.1 % (SD = 0.63,
n = 6) in control animals, 83.4% (SD = 1.18, n = 4) in late-pregnant animals,
and 83.7% (SD = 0.61, n = 3) in late-lactating animals. This variation was
significant (F = 12.33, P < 0.005). The difference between pregnant and
lactating animals was not significant (p> 0.05), but both differed significantly
from the control animals (p < 0.005).
Assuming that dry mass absorption efficiency was equivalent to the energy
absorption efficiency and using the manufacturer's estimate of the gross
energy content of the food (15.3 k] g-l), we estimated that the daily energy
absorption of control animals averaged 97.9 k] d-1, equivalent to a sustained
metabolic rate of 1.13 W. For pregnant animals the daily energy absorption

Energetics of Reproducing Mice 755
40 •
30
20
10
O+---r---.-~........,.~,...-.--~.---~"""""T'"~--'
2 4 6 8 10 12 14
Litter size (n)
Fig. 3. Peak daily food intake of white mice during lactation as a function of litter size. There was a significant positive relationship. The least-squares fit curve is also shown. Each point represents a differ
ent individual.
averaged 119.3 k] d- 1, equivalent to 1.38 W, and for lactating animals the
intake averaged 405.5 k] d-l, equivalent to 4.69 W, if all this energy was
metabolised and appeared as respiratory output. In practise, however, much
of this energy was exported as milk, and the sustained metabolic rate of
these animals would have been substantially lower than this.
We expressed the daily energy absorption relative to the measured BMR
for each of the three groups. For control animals energy absorption averaged
3.60 times BMR, for pregnant animals 2.36 times BMR, and for lactating
animals 5.96 times BMR.
Morphology
The mean wet masses (and SDs) of all the tissues removed from the mice
in each group are shown in Table 2. There was significant intergroup vari
ability in the masses of all the tissues except the pelt and visceral fat (for
details of the ANOVA, see Table 2). In all sections of the gut, the wet mass
increased significantly between controls and pregnant animals and increased
even more between controls and lactating animals. The mean total wet mass
of the alimentary tract of controls was 0.98 g; that of pregnant animals was
1.39 g, and that of lactating animals was 2.11 g. This pattern of increase
between control and pregnant animals, with greater increases between con
trols and lactating mice, was repeated for the liver, kidneys, lungs, and
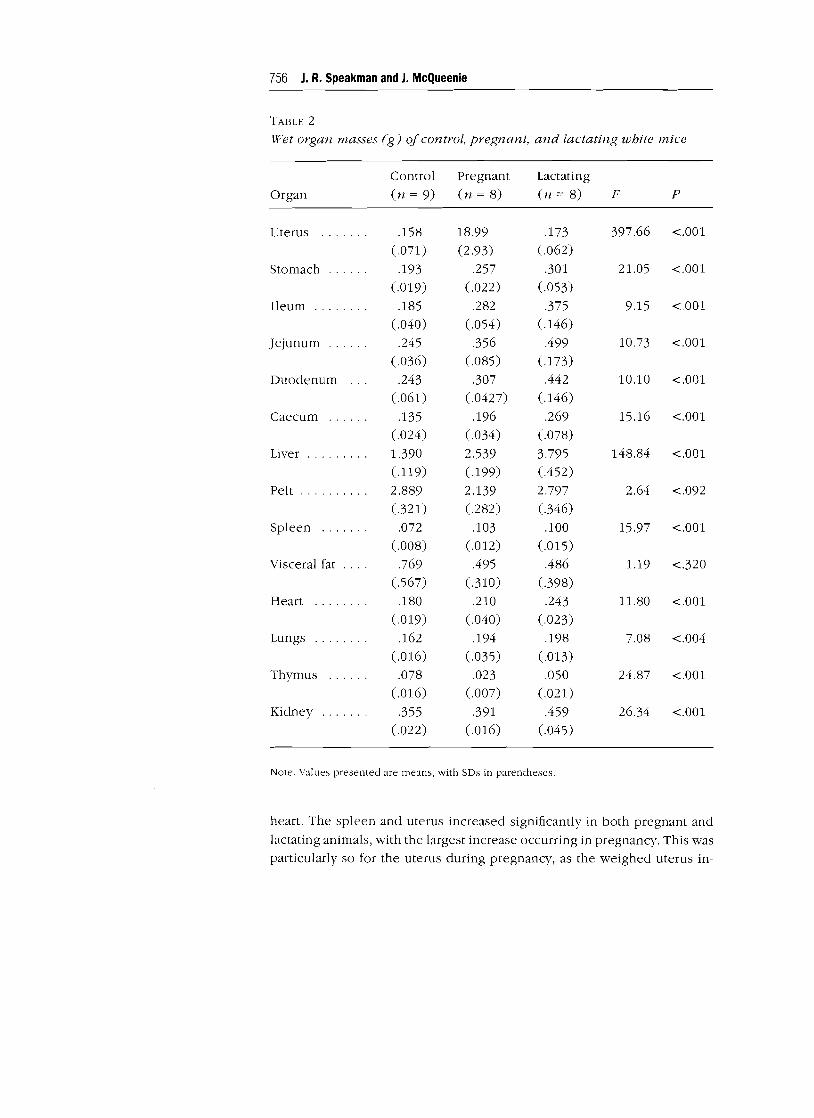
756 J. R. Speakman and J. McQueenie
TABLE 2
Wfet organ masses (g] of control, pregnant, and lactating white mice
Control Pregnant Lactating
Organ (n = 9) (n = 8) (n = 8) F P
Uterus · ...... .158 18.99 .173 397.66 <.001
(.071) (2.93) (.062)
Stomach .193 .257 .301 21.05 <.001
(.019) (.022) (.053)
Ileum ........ .185 .282 .375 9.15 <.001
(.040) (.054) (.146)
Jejunum ... .245 .356 .499 10.73 <.001
(.036) (.085) (.173)
Duodenum .243 .307 .442 10.10 <.001
(.061) (.0427) (.146)
Caecum .135 .196 .269 15.16 <.001
(.024) (.034) (.078)
Liver ......... 1.390 2.539 3.795 148.84 <.001
(.119) (.199) (.452)
Pelt .......... 2.889 2.139 2.797 2.64 <.092 (.321) (.282) (.346)
Spleen · ...... .072 .103 .100 15.97 <.001
(.008) (.012) (.015)
Visceral fat .769 .495 .486 1.19 <.320
(.567) (.310) (.398)
Heart ........ .180 .210 .243 11.80 <.001
(.019) (.040) (.023)
Lungs .162 .194 .198 7.08 <.004 (.016) (.035) (.013)
Thymus ...... .078 .023 .050 24.87 <.001 (.016) (.007) (.021)
Kidney · ...... .355 .391 .459 26.34 <.001 (.022) (.016) (.045)
Note. Values presented are means, with SDs in parentheses.
heart. The spleen and uterus increased significantly in both pregnant and
lactating animals, with the largest increase occurring in pregnancy. This was
particularly so for the uterus during pregnancy, as the weighed uterus in

Energetics of Reproducing Mice 757
eluded the masses of in utero foetuses. The uterus in pregnancy thus weighed
about 100 times the mass of the empty uterus in either controls or lactating
animals. The mass of the thymus declined in both pregnant and lactating
animals relative to controls.
Relationship between Morphological and Metabolic Changes
When data for all the individuals were pooled, the morphological parameters
(wet masses) were highly intercorrelated (Table 3). This matrix of corre
lations reveals some major patterns of intercorrelation. Notably, the masses
of each of the gut components, along with the liver, kidneys, heart, and
lungs, were all positively correlated. The animals therefore responded to
changes in their reproductive state by hypertrophy of the entire alimentary
tract and organs connected with nutritional processing. Changes in all these
features were negatively correlated with the mass of the thymus. The uterus
mass was poorly correlated with everything except the thymus mass.
As the morphological variables were highly correlated, it was inappropriate
to attempt to explain individual variations in the BMR using the wet masses
of these tissues as independent predictors. We performed a principal com
ponents analysis to extract orthogonal axes of variability in organ morphology
between the animals (Table 4). There were three dominant principal com
ponents (eigenvalues> 1.0). The eigenvectors for the first four, sixth, eighth,
and tenth components with respect to the original variables are shown in
Table 4. The major factors influencing the first principal component were
the masses of the alimentary tract, liver, and kidneys. The second principal
component was predominantly affected by the masses of the uterus, spleen,
pelt, and thymus. The third principal component was dominated by the
uterus, visceral fat, and thymus, and the fourth principal component was
dominated by the visceral fat content and the pancreas.
Across all 25 individuals (nine controls, eight pregnant, and eight lactat
ing) for which we had measurements of both the morphology and BMR,
we entered the measured BMR as the dependent variable in a stepwise
multiple regression, with scores on all the 13 principal components as in
dependent predictor variables. Independent of the stepwise procedure em
ployed (forward inclusion or backward deletion), four principal components
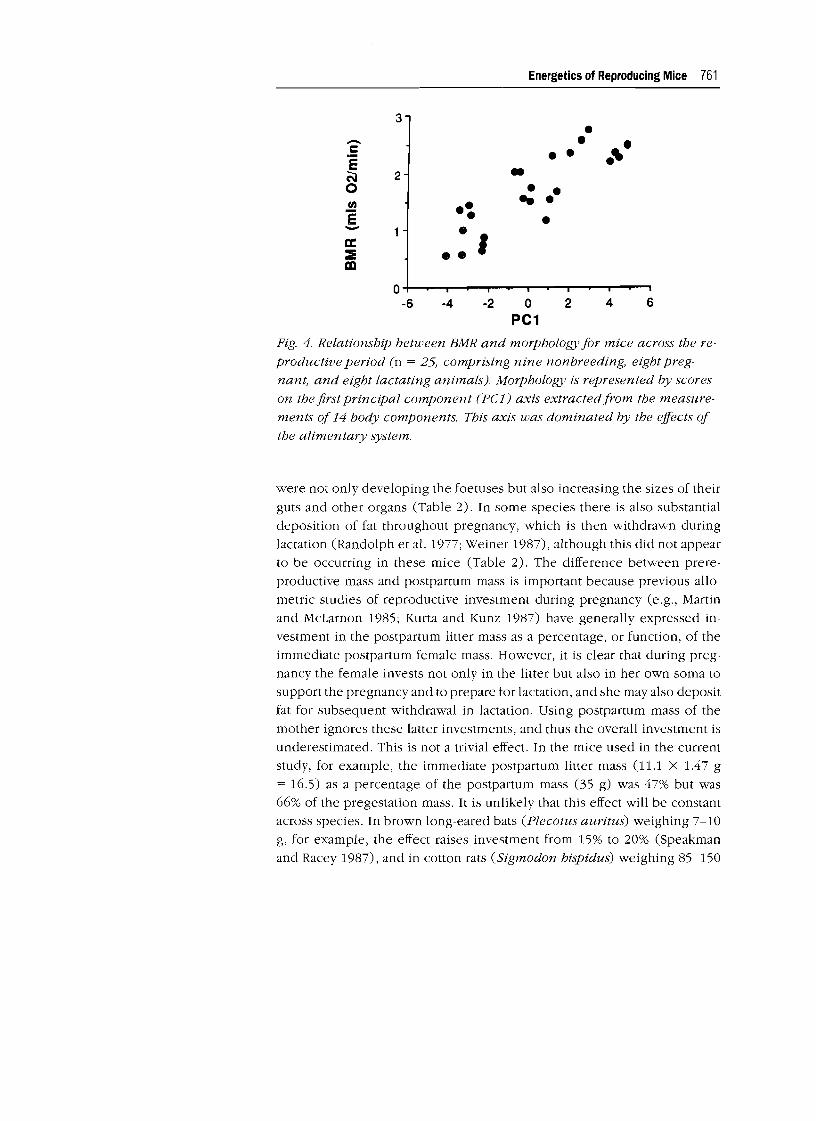
came out as significant predictors of the BMR (Table 5). The most important
predictor was the first principal component-the alimentary component
(Fig. 4). This component alone explained 71.8% of the observed variation
in the BMR. The second most significant predictor was the sixth principal
component, which explained a further 7.4% of the variation in BMR. The
dominant factor influencing the sixth principal component was the pelt
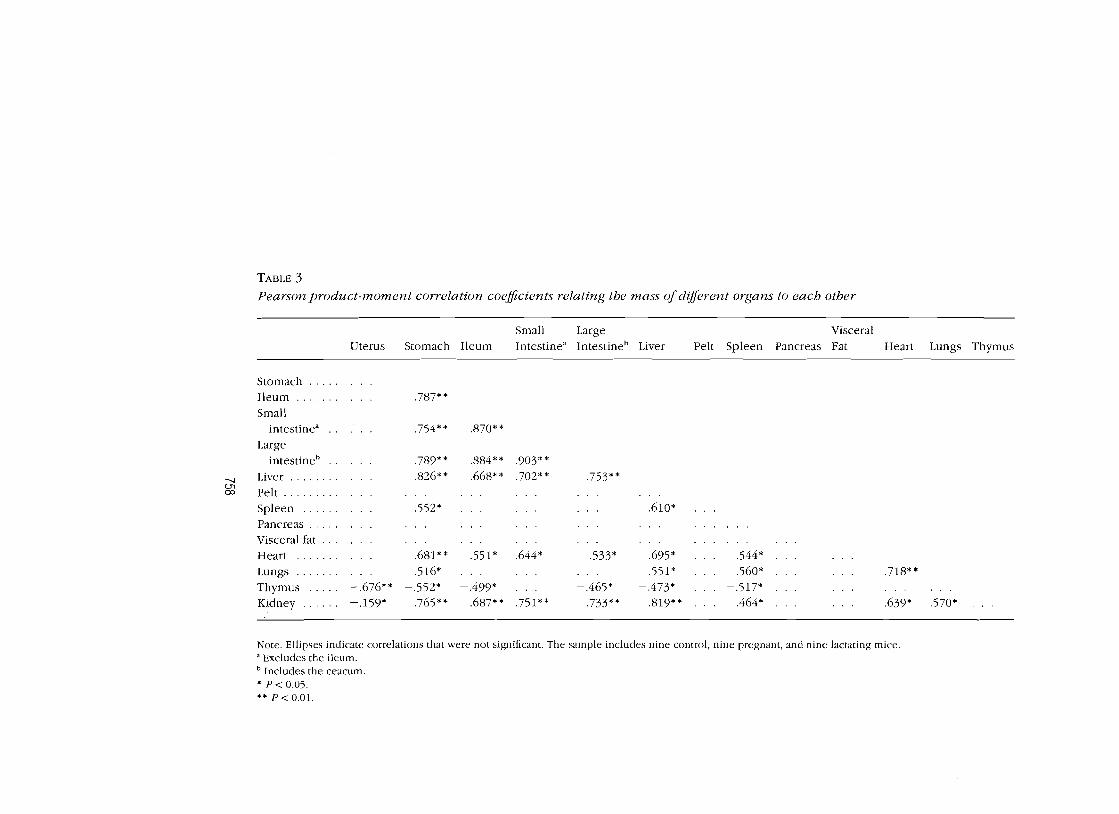
TABLE 3 Pearson product-moment correlation coefficients relating the mass ofdifferent organs to each other
Small Large Visceral Uterus Stomach Ileum Intestine" Intestine" Liver Pelt Spleen Pancreas Fat Heart Lungs Thymus
Stomach ..... Ileum ....... · .. .787** Small
intestine" · .. .754* * .870* * Large
intestine" .789** .884** .903**
--.J Liver ........ .826** .668* * .702** .753* * c..n co Pelt .........
Spleen ..... . · .. .552* . . . ... .610* Pancreas ..... Visceral fat ... Heart ...... , · .. .681* * .551* .644* .533* .695* .544* Lungs ....... · .. .516* . .. .551* .560* . .. .718** Thymus .... . -.676** -.552* -.499* ... - .465* -.473* - .517* Kidney ...... -.159* .765** .687* * .751* * .733* * .819* * .464* ... .639* .570*
Note. Ellipses indicate correlations that were not significant. The sample includes nine control, nine pregnant, and nine lactating mice. a Excludes the ileum. b Includes the ceacum . • P< 0.05.
** P< 0.01.

TABLE 4
Principal components analysis of morphological variation in masses of14 organs measured across 27 mice
PCl PC2 PC3 PC4 pc6 PC8 PCI0
........ (}1 CD
Eigenvalue ........
Proportion .........
Cumulative ........
Eigenvectors:
Uterus ..........
Stomach .........
Ileum ...........
Small intestine ...
Large intestine ...
Liver ............
Pelt .............
Spleen ..........
Pancreas . . . . . . . .
Visceral fat .......
Heart ...........
Lungs ...........
Thymus .........
Kidney ..........
6.637
.474
.474
.033
.356
.332
.338
.339
.345 -.060
.231
.143 -.130
.306
.251
-.233
.331
2.221
.159
.633
.538 -.006
-.180
-.211
-.160
-.003
.496
.404
-.088
.044
.050
.271
-.322
-.099
1.376
.098
.731
-.453 .008
-.169
-.054
-.052
.169
.325
.210
-.263
.377
.229
.243
.453
.235
1.171
.084
.815
.062
.049
.012
-.072
-.137
-.110
-.068
-.140
.740
.562 -.017
.254
-.003
.066
.555
.034
.905
.073 -.116
.228
.150
.197 -.304
.628 -.364
.168
-.309
-.076
.125
.262
.185
.276
.020
.933
.094 -.242
-.293 -.054
.208
.295 -.165
-.309
-.189
.018 -.468
.437 -.148
.352
.1536
.011
.978
.415
.043 -.217
.278
-.329
.150
.026
-.328 -.112
.146
.304
-.393 .058
.423
Note. Dominant variables influencing the principal components as revealed by the eigenvectors (>0.3 or < -0.3) are in italic.

760 J. R. Speakman and J. McQueenie
TABLE 5 Results ofstepwise multiple regression with BMR the dependent variable
and scores on all 14 of the principal components describing the
morphological variability in the organ masses of reproductive mice
entered as the independent predictor variables
Predictor Coefficient SD t Ratio P
Constant ... 1.65814 .05298 31.30 .0009
PC1 · ...... .21552 .02007 10.74 .0009 pc6 · . . . . . . -.25874 .08865 -2.92 .008
PC10 ...... .4160 .1383 3.01 .007
PC8 · ...... .2356 .1016 2.32 .031
Note. The regression equation is BMR = 1.66 + 0.216 PC1 - 0.259 pc6 + 0.416 PC10 + 0.236 PC8. Results of ANOYA: for the regression, sum of squares = 9.9058, mean square = 2.4765, elf = 4, F= 35.81, P= 0.000; for the error, sum of squares = 1.3831, mean square = 0.0692, elf = 20; total, sum of squares = 11.2889, elf = 24; for PC1, sequential sum of squares = 8.1021, elf = 1, r 2 = 0.7177; for pc6, sequential sum of squares = 0.8604, elf = 1, r 2 = 0.0736; for PC10, sequential sum of squares = 0.5715, elf = 1, r 2 = 0.0546; for PC8, sequential sum of squares = 0.3719, elf = 1, r 2 = 0.0330.
mass (Table 4). The tenth principal component was the third most important
predictor, explaining 5.4% of the BMR. This component was predominantly
influenced by the uterus, kidney, small and large intestine, and lungs, al
though the directions of these effects were not consistent; therefore, de
scribing this component proved difficult. The eighth component explained
3.3% of the variation in BMR. This component was most influenced by the
heart and lungs. In total, the four significant principal components explained
87.7% of the variation in the BMR.
Discussion
Body Mass
The pattern of change in total body mass throughout the reproductive cycle
was typical for a small mammal. In many other species the immediate post
partum mass significantly exceeds that at the start of gestation (Weiner 1987;
Thompson 1993). In this case the postpartum animals were 20%-40% heavier
than the animals at the start of gestation: 31-35 g compared with 25.1 g.
This difference in mass reflects the fact that throughout gestation the animals
• •
Energetics of Reproducing Mice 761
3 •
0
---c - • ~. E • • • C'l 2 ..• •• ~ ••E • •-a: • I::i! a:l
0 -6 ·4 -2 0 2 4 6
PC1
Fig. 4. Relationship between BMR and morphology for mice across the re
productive period (n = 25, comprising nine nonbreeding, eight preg
nant, and eight lactating animals). Morphology is represented by scores
on the first principal component (pel) axis extracted from the measure
ments of 14 body components. This axis was dominated by the effects of
the alimentary system.
were not only developing the foetuses but also increasing the sizes of their
guts and other organs (Table 2). In some species there is also substantial
deposition of fat throughout pregnancy, which is then withdrawn during
lactation (Randolph et al. 1977; Weiner 1987), although this did not appear to be occurring in these mice (Table 2). The difference between prere
productive mass and postpartum mass is important because previous allo
metric studies of reproductive investment during pregnancy (e.g., Martin
and McLarnon 1985; Kurta and Kunz 1987) have generally expressed investment in the postpartum litter mass as a percentage, or function, of the
immediate postpartum female mass. However, it is clear that during pregnancy the female invests not only in the litter but also in her own soma to
support the pregnancy and to prepare for lactation, and she may also deposit
fat for subsequent withdrawal in lactation. Using postpartum mass of the mother ignores these latter investments, and thus the overall investment is
underestimated. This is not a trivial effect. In the mice used in the current study, for example, the immediate postpartum litter mass (11.1 X 1.47 g
= 16.5) as a percentage of the postpartum mass (35 g) was 47% but was
66% of the pregestation mass. It is unlikely that this effect will be constant across species. In brown long-eared bats (Plecotus auritus) weighing 7-10
g, for example, the effect raises investment from 15% to 20% (Speakman and Racey 1987), and in cotton rats (Sigmodon hispidus) weighing 85-150

762 J. R. Speakman and J. McQueenie
g, the effect raises investment from 22% to 26% (Randolph et al. 1977). If
the extent of the difference varies consistently with mass, this might seriously compromise allometric studies of reproductive investment during pregnancy
(e.g., Martin and MacLarnon 1985).
Respirometry
The pattern of change in BMR throughout reproduction was not consistent
with the majority of previous studies, which have indicated no, or only very
minor, increases in BMR between pregnancy and lactation (Trojan and
Wojciechowska 1967; Dryden et al. 1974; Randolph et al. 1977; Studier 1979;
McClure and Randolph 1980; Mattingly and McClure 1982; Nicoll and Thompson 1987; Prentice and Whitehead 1987; Rose 1987; Weiner 1987).
The increases in BMR reported here are considerably greater than reported in these previous studies. This includes several previous studies of white
mice (e.g., Myrcha et al. 1969; Studier 1979; Hammond and Diamond 1992).
Some species do show a substantial increase in BMR throughout pregnancy
and into lactation (Thompson and Nicoll 1986; Thompson 1993). These
species tend to be those that have very low metabolic rates compared with the Kleiber prediction (Thompson 1993), very slow growth rates of the
young, and extended lactational periods. We have recently shown that the
increase in BMR during reproduction in at least one species (the pygmy
hedgehog tenrec, Echinops telfairii is probably associated with a shift from
heterothermy and shallow daily torpor to continuous endothermy (Poppitt
et al. 1994). For mice, however, a shift in thermoregulatory strategy as an explanation for the observed trend seems unlikely, since they are normally
continuously endothermic. In addition, mice offspring typically have rapid
growth and short lactation periods, characteristics that are generally not
found in those animals in which BMR has been shown to increase during
reproduction (Thompson 1993). These differences in response remain unexplained. However, the changes observed here are more consistent with
what might be expected from the morphological changes that occur during lactation reported previously elsewhere (e.g., Mover et al. 1988; Poppitt et
al. 1993).
Food Intake
The pattern of food intake was consistent with most other studies of small
mammals (Thompson 1993), particularly rodents, that primarily appear to
fund the current reproductive effort by increasing food intake (Myrcha et
al. 1969; Millar 1978; Studier 1979; Innes and Millar 1981; Glazier 1985;
Energetics of Reproducing Mice 763
Weiner 1987). Despite this massive increase in food intake, we found only
a slight decrease in apparent absorption efficiency. This is consistent with
most previous studies, which have also reported little change in the dry
mass absorption efficiency between pregnancy and lactation (Migula 1969;
Weiner 1987).
Morphological Changes
Despite increasing their food intake so dramatically, the mice were able to
maintain their absorption efficiency between pregnancy and lactation by
changes in the structure of the alimentary tract. Mass changes and length
ening of the alimentary tract have also been reported in several other mam
mals during lactation (Myrcha 1962, 1965; Campbell and Fell 1964; Wunder
1993). The increase in the mass of the liver during lactation was similar to
that reported previously in rats (Kennedy et al. 1958) and presumably serves
to process the increased absorption of nutrients from the gut. The increase
in the size of the heart and lungs probably serves to handle the increased
requirement for delivery of oxygen to the tissues (Hanwell and Peaker 1977).
The increase in BMR that we found was closely linked to the increase in
the size of the alimentary tissues (gut and liver) as revealed by the dominant
effect of the first principal component as a factor influencing BMR when the
data for all the individuals were pooled. This effect is consistent with previous
suggestions that the gut and liver represent the major sites of heat production
(Krebs 1950). However, the current relationship is based only on a corre
lation, and, although it is consistent with changes in the alimentary system
causing the elevated BMR, it is important to note that such causality may
be an artefact of some other covariable factor. Several potential covariable
factors were not taken into account in the current study. First, we did not
separate out the mammary glands from the carcass, and these would likely
also show the same pattern of variation in size as the alimentary variables.
Second, although the animals were starved for at least 2 h in the chamber
prior to making the measurements, and had potentially not fed for up to 7
h (the time since clark period ended), there may have been variability in
the time since the animals fed that was linked to their total daily food intake,
and the consequent variation in specific dynamic action may have contributed
to the observed differences. Hammond and Diamond (1992), however,
found that specific dynamic action in mice increased resting metabolism at
therrnoneutrality by only 5%, compared with the observed elevation between
control and lactating animals of 200%.
It was surprising that the second principal component, which was pre
dominantly influenced by uterine mass, did not emerge as a significant factor

764 J. R. Speakman and J. McQueenie
influencing BMR. These data suggest that although the mass of the uterus
(and foetuses) occupied approximately 40% of the animals' total mass at the end of pregnancy, this mass was not contributing to the observed increase
in BMR in these pregnant animals. These data are supported by direct studies of foetal metabolism that indicate that it is low and insufficient to account
for any increase in maternal metabolic rate in pregnancy (Cotter et al. 1969;
Bissonette et al. 1980; Pike 1981). Rather, the increase in BMR possibly reflected the more modest increases in the sizes of the alimentary tracts and
livers of these animals (Smith and Baldwin 1974; Canas et al. 1982).
The dominant role of the first principal component-the alimentary component-is consistent with the previously hypothesised links between max
imal food intake, gut morphology, and BMR (Daan et al. 1989; Peterson et
al. 1990; Hammond and Diamond 1992; Diamond 1993). That is, animals with larger guts can take in more food, but the penalty is that larger guts
require greater maintenance costs (or BMR), which leads to a close link
between BMR and food intake (Kirkwood 1983). The interrelationships we
have discovered in this study match closely these hypothetical expectations.
If the lactating animals had not increased their BMRs above those of controls but had still increased their energy absorption in the way they did, the
energy absorption would have been 15.0 times BMR. This would clearly
have exceeded the supposed limit of six times BMR on both the food intake and the sustainable metabolic rate. The expansion of the BMR such that the
food intake represented only 5.96 times BMR is thus clearly consistent with
the interpretation that the energy demands of lactation were such that they could not be accommodated by the animals without morphological changes.
However, the interrelationships raise several important questions concerning the findings of previous studies. In particular, why have many previous stud
ies of reproductive energy expenditure not found an increase in BMR be
tween pregnancy and lactation or between nonreproductive and lactating
animals, when food intake has been shown to increase dramatically and presumably gut morphology has changed to accommodate this increase?
The scope for plasticity in the size of the gut and liver, in response to changes in energy demand, may be a significant effect that explains some
of the confusion in the current debate concerning the links between BMR
and reproductive output. If a species has no scope to alter its organs in response to energy demands, then it is clear we might expect a correlation
between BMR (measured in nonreproductive animals) and reproductive output. This is because BMR would reflect the gut and liver morphology,
which would also define the maximal food intake rate and thus sustainable metabolic rates and litter sizes (Hayssen 1984). However, if a species has
the scope to alter its gut and liver morphology in response to energy de

Energetics ofReproducing Mice 765
mands, then a link between BMR (measured in the animals prior to repro
duction) and reproductive output would not be anticipated. This is because the BMR measured outside reproduction would only reflect whatever energy demands were currently being levied on the animal, and these might bear no relation to the energy demands experienced later in reproduction. This may explain why Hayes et a1. (l992a) failed to find an intraspecific link between BMR (measured prereproduction) and subsequent reproductive
output of laboratory mice and may also explain why many attempts to establish interspecific links between BMR and reproductive output have failed
(e.g., Harvey and Bennett 1983; Hayssen 1984; Hayssen et a1. 1985; Trevelyan et a1. 1990) despite the intuitive attractiveness of such a linkage (MacNab 1980, 1987). Two key questions arise from this inquiry. First, what is the variability in the extent of plasticity in the alimentary system to changes in energy demand? Second, what factors influence or limit the extent of this
plasticity? Finally, although the food intake at peak lactation was 6.0 times BMR,
which is very close to the maximal limit suggested previously to impose a
central constraint on sustainable metabolic rate, the current data cannot be used to establish whether the limit on sustainable metabolic rate acts centrally, via the gut, or peripherally at the sites where the energy is used. This is because during lactation not all the energy is being respired, and a sub
stantial portion is exported as milk. Consequently, the sustainable metabolic rate of these animals must have been substantially below the observed 6.0
times BMR. These data can therefore be interpreted in two ways. First, the gut structure limited the available energy at 6.0 times BMR, and this limit then defined both the sustainable energy expenditure and export as milk (i.e., a central limitation) . However, an equally tenable interpretation is that
a constraint was acting peripherally to hold the sustainable metabolic rate at some level lower than 6.0 times BMRand that this constrained the maximal milk export and thus the total energy requirement: The gut is then interpreted to have responded to meet these demands by a plastic response yielding the relationship of 6.0 times BMR (t.e., a peripheral limitation). Recent studies of mice under simultaneous reproductive and thermoregulatory loads have suggested that the limits in reproduction may indeed be peripheral and not centrally mediated (Hammond et a1. 1994).
Acknowledgments
We are grateful to Kim Hammond, Regina McDevitt, Ian Wallis, and two
anonymous referees for their helpful and constructive criticisms of an earlier draft of this article.

766 J. R. Speakman and J. McQueenie
Literature Cited
BARTHOLOMEW G.A. 1982. Energy metabolism. Pp. 46-93 in M.S. GORDON, G.A. BAR
THOLOMEW, A.D. GRINNELL, C.B.JORGENSON, and F.N. WHITE, eds. Animal Physiology: Principles and Adaptations. Macmillan, New York.
BISSONETTEJ.M., J. METCALFE, A.R. HOHIMER, and M.L. PERNOLL. 1980. Uterine oxygen uptake in the pregnant pygmy goat. Respir. Physio!. 'i2:373-381.
BRYANT D.M. and P. TATNER. 1989. Intraspecies variation in avian energy expenditure:
correlates and constraints. Ibis 133:236-245. CAMPBELL R.M. and B.F. FELL. 1964. Gastrointestinal hypertrophy in the lactating rat
and its relation to food intake. J. Physio!. 171:90-98.
CANAS R., J. ROMERO, and R.L. BALDWIN. 1982. Maintenance energy requirements during lactation in rats. J. Nutr. 112:1176-1180.
COTTER J.R., J.N. BELCHER, and H. PRYSTOWSKY. 1969. Blood flow and oxygen consumption of pregnant goats. Am. J. Obster. Gyneco!. 103:1098-1101.
DAAN S., D. MASMAN, and A. GROENEWOLD. 1990. Avian basal metabolic rates: their
association with body composition and energy expenditure in nature. Am. J. Phys
io!. 259:R333-R340. DAAN S., D. MASMAN,]. STRlJKSTRA, and S. VERHULST. 1989. Intraspecific allometry of
basal metabolic rate: relations with body size, temperature, composition, and cir
cadian phase in the kestrel (Falco tinnunculus). J. Bio!. Rhythms 4:267-283.
DIAMOND J. 1993. Evolutionary physiology. Pp. 89-109 in CAR. BOYD and D. NOBLE, eds. The Logic of Life: The Challenge of Integrative Physiology. Oxford University
Press, Oxford. DRENT R. and S. DAAN. 1980. The prudent parent: energetic adjustments in avian
breeding. Ardea 68:225-252.
DRYDEN G.L., M. GEBCZYNSKI, and E.L. DOUGLAS. 1974. Oxygen consumption by nursling and adult musk shrews. Acta Theriol. 19:453-'i61.
FEDER E., A.F. BENNETT, W.W. BURGGREN, and R.B. HUEY. 1987. New Directions in Ecological Physiology. Cambridge University Press, Cambridge.
FELL B.F., K.A.SMITH, and R.M. CAMPBELL. 1962. Hypertrophic and hyperplastic changes in the alimentary canal of the lactating rat. J. Patho!. Bacteriol. 85: 179-188.
FISHER R.A. 1930. The Genetical Theory of Natural Selection. Dover, New York.
FLEMING M.W., J.D. HARDER, and J.J. WUKIE. 1981. Reproductive energetics of the Virginia opossum compared with some eutherians. Compo Biochem. Physiol. 70B: 645-648.
GLAZIER D.S. 1985. Energetics of litter size in five species of Peromyscus with generalisations for other mammals. J. Mamma!. 66:629-642.
HAMMOND K.A. andI. DIAMOND. 1992. An experimental test for a ceiling on sustained metabolic rate in lactating mice. Physio!. Zoo!' 65:952-977.
HAMMOND K.A., M. KONARZEWSKI, R.M. TORRES, and J. DIAMOND. 1994. Metabolic ceilings under a combination of peak energy demands. Physiol. Zoo!. 67:14791507.
HANWELL A. and M. PEAKER. 1977. Physiological effects of lactation on the mother.
Symp. ZooI. Soc. Lond. 41:297-312. HARVEY P.H. and P.M. BENNETT. 1983. Brain size, energetics, ecology and life history
patterns. Nature 306:244-252.

Energetics ofReproducing Mice 767
HAYES ].P., T. GARLAND, and M.R. DOHM. 1992a. Individual variation in metabolism and reproduction in Mus: are energetics and life history linked? Funct. Ecol. 6:5-14.
HAYES ].P., ].R. SPEAKMAN, and P.A. RACEY. 1992b. Sampling bias in respirometry. Physiol. Zool. 65:604-619.
HAYSSEN V. 1984. Basal metabolic rate and intrinsic rate of increase: an empirical and theoretical re-examination. Oecologia 64:419-421.
HAYSSEN V., R. LACY, and P.]. PARKER. 1985. Metatherian reproduction: transitional or transcending? Am. Nat. 126:617-632.
HEASLEY].E. 1983. Energy allocation in response to reduced food intake in pregnant and lactating laboratory mice. Acta Theriol. 28:55-71.
INNES D.G. and ].S. MILLAR. 1981. Body weight, litter size, and energetics of reproduction in Clethryonomys gapperi and Microtus pennsyluanicus. Can.]. Zool. 59: 785-789.
JOLLIFFE LT. 1982. Principal Component Analysis. Springer, Berlin. KENAGY G.]. 1987. Energy allocation for reproduction in the golden mantelled ground
squirrel. Symp. Zool. Soc. Lond. 57:259-273. KENNEDY G.c., W.M. PEARCE, and D.M.V. PARROTT. 1958. Liver growth in the lactating
rat. ]. Endocrinol. 17:158-165. KIRKWOOD].K. 1983. A limit to metabolisable energy intake in mammals and birds.
Compo Biochem. Physiol. 75A:1-3. KLEIBER M. 1961. The Fire of Life: An Introduction to Animal Energetics. Wiley, New
York. KOTEJA P. 1991. On the relation between basal and field metabolic rates in birds and
mammals. Funct. Ecol. 5:56-64. KREBS H.A. 1950. Body size and tissue respiration. Biochim. Biophys. Acta 4:249
269. KURTA A. and T.H. KUNZ. 1987. Size of bats at birth and maternal investment during
pregnancy. Symp. Zool. Soc. Lond. 57:79-106. MACMILLEN R.E. and D.S. HINDS. 1993. Standard, cold-induced, metabolism of rodents
and exercise induced. Pp. 16-34 in T.E. TOMASI and T.H. HORTON, eds. Mammalian Energetics: Interdisciplinary Views of Metabolism and Reproduction. Comstock, Ithaca, NY
MACNAB B.K. 1980. Food habits, energetics, and the population biology of mammals. Am. Nat. 116:106-124.
---. 1987. The reproduction of marsupial and eutherian mammals in relation to energy expenditure. Symp. Zool. Soc. Lond. 57:29-41.
MARTIN R.D. and A.M. McLARNON. 1985. Gestation period, neonatal size and maternal investment in placental mammals. Nature 313:220-223.
MATTINGLY K.D. and P.A. MCCLURE. 1982. Energetics of reproduction in large-littered cotton rats (Sigmodon bispidus). Ecology 63:183-195.
MCCLURE P.A. and].C. RANDOLPH. 1980. Relative allocation of energy to growth and development of homeothermy in the eastern wood rat (Neotema jlridana) and hispid cotton rat (Sigmodon bispidus), Ecol. Monogr. 50:199-219.
MIGULA P. 1969. Bioenergetics of pregnancy and lactation in the European vole. Acta Theriol. 14:167-179.
MILLAR ].S. 1978. Energetics of reproduction in Peromyscus leu copus. the cost of lactation. Ecology 59:1055-1061.
768 J. R. Speakman and J. McQueenie
MOVER H., S. HELLWING, and A. AR. 1988. Energetic cost of gestation in the white
toothed shrew Crocidura russula monacha (Soricidae, Insectivora). Physiol. Zool.
61:17-26.
MYRCHA A. 1962. Variations in length and weight of the alimentary tract of Cleth
rionomys glareolus (Schreber, 1780). Acta Theriol. 9:139-148.
---.1965. Length and alimentary tract of Apodemusflaoicollis (Melchoir, 1834).
Acta Theriol. 10:225-228.
MYRCIIA A., L. RYSKOWSKI, and W. WALKOWA. 1969. Bioenergetics of pregnancy and
lactation in the white mouse. Acta Theriol. 12:161-166.
NICOLL M.E. and S.D. THOMPSON. 1987. The energetics of reproduction in therian
mammals: didelphids and tenrecs. Symp. Zool. Soc. Lond. 57:7-27.
OFTEDAL O. 1984. Milk composition, milk yield and energy output at peak lactation:
a comparative review. Symp. Zool. Soc. Lond. 51:33-85.
PETERSON e.e., K.A. NAGY, and].M. DIAMOND. 1990. Sustained metabolic scope. Proc.
Natl. Acad. Sci. USA 87:2324-2328.
PIKE I.L. 1981. Comparative studies of embryo metabolism in early pregnancy. ].
Reprod. Ferril. Suppl. 29:203-213.
POppITT S.D., ].R. SPEAKMAN, and P.A. RACEY. 1993. The energetics of reproduction
in the common shrew (Sorex areneusi, a comparison of indirect calorimetry and
the doubly labeled water technique. Physiol. Zool. 66:964-982.
---. 1994. The energy cost of reproduction in the pygmy hedgehog tenrec
(Echinops telfairi), Physiol. Zool. 67 :976-994.
PRENTICE A.M. and R.G. WHITEHEAD. 1987. The energetics of human reproduction.
Symp. Zool. Soc. Lond. 57:275-304.
RANDOLI'll P.A., J.e. RANDOLPH, K. MATTINGLY, and M.M. FOSTER. 1977. Energy costs
of reproduction in the cotton rat (Sigmodon bispidus), Ecology 58:31-45.
ROSE R. 1987. Reproductive energetics of two Tasmanian rat kangaroos (Potorinae. Marsupialia): Symp Zool. Soc. Land. 57:149-165.
SMITII B.W. and J-J- McMANUS. 1975. The effects of litter size on the bioenergetics
and water requirements of lactating Mils musculus. Compo Biochem. Physiol. 51A:
111-115.
SMITH N.E. and R.L. BALDWIN. 1974. Effects of breed, pregnancy, lactation and energy use in dairy cattle. J- Dairy Sci. 57:1055-1060.
SOKAL R.R. and F.]. ROHLF. 1981. Biometry. 2d ed. W. H. Freeman, New York.
SPEAKMAN J-R. and P.A. RACEY. 1987. The energetics of pregnancy and lactation in
the brown long-eared bat Plecotus auritus. Pp. 367-393 in M.B. FENTON, P.A.
RACEY, and J-M.V. RAYNER, eds. Recent Advances in the Study of Bats. Cambridge University Press, Cambridge.
---. 1988. Validation of the doubly-labelled water technique in insectivorous
bats by comparison with indirect calorimetry. Physiol. Zool. 61 :514-526.
SPEAKMAN ].R., P.I. WEBB, and P.A. RACEY. 1991. Effects of disturbance on the energy
expenditure of hibernating bats. J- Appl. Ecol. 28:1087-1104.
STENSETH N.e., E. FRAMSTEAD, P. MIGULA, P. TROJAN, and B. WOJCIECIIOWSKA-TROJAN.
1980. Energy models for the common vole (Microtus arualis). energy as a limiting
resource for reproductive output. Oikos 34:1-22.
STlIDlER E.H. 1979. Bioenergetics of growth, pregnancy and lactation in the laboratory
mouse, Mus musculus. Comp Biochem Physiol. 44A:467-471.
Energetics of Reproducing Mice 769
THOMPSON S.D. 1993. Gestation and lactation in small mammals: basal metabolic rate and the limits to energy use. Pp. 213~260 in T.E. TOMASI and T.H. HORTON, eds. Mammalian Energetics: Interdisciplinary Views of Metabolism and Reproduction. Comstock, Ithaca, N.Y.
THOMPSON S.D. and M.E. NICOLL. 1986. Basal metabolic rate and energetics of reproduction in therian mammals. Nature 321:690-693.
TOMASI TE. and T.H. HORTON. 1993. Mammalian Energetics: Interdisciplinary Views of Metabolism and Reproduction. Comstock, Ithaca, N.Y.
TREVELYAN R., P.H. HARVEY, and M.D. PAGEL. 1990. Metabolic rates and life histories in birds. Funct. Ecol. 4:135-141.
TROJAN P. and B. WOJCIECHOWSKA. 1967. Resting metabolic rate during pregnancy and lactation in the European common vole Microtus arvalis (Pall.). Ekol. Pol. 15A:811-817.
WEINER]. 1987. Limits to energy budget and tactics in energy investments during reproduction in the Djungarian hamster (Phodopus sungorus sungorus Pallas 1770). Symp. Zool. Soc. Land. 57:167-187.
---.1989. Metabolic constraints to mammalian energy budgets. Acta Theriol. 34: 3-35.
WUNDER B.A. 1993. Morphophysiological indicators of the energy state of small mammals. Pp. 83-105 in TE. TOMASI and TH. HORTON, eds. Mammalian Energetics: Interdisciplinary Views of Metabolism and Reproduction. Comstock, Ithaca, N.Y.