limestone county - groesbeck isd - 2006 texas school survey of drug and alcohol use
TRANSCRIPT

8/14/2019 LIMESTONE COUNTY - Groesbeck ISD - 2006 Texas School Survey of Drug and Alcohol Use
http://slidepdf.com/reader/full/limestone-county-groesbeck-isd-2006-texas-school-survey-of-drug-and-alcohol 1/77
Groesbeck
Spring 2006
Table T-1: How recently, if ever, have you used ..
Past
Month
School
Year
Ever
Used
Never
Used
Any tobacco product
All 25.0% 33.4% 50.5% 49.5%Grade 8 12.9% 21.5% 40.9% 59.1%
Grade 10 32.1% 41.7% 57.1% 42.9%
Grade 12 29.8% 36.9% 53.6% 46.4%
Cigarettes
All 21.4% 28.8% 44.6% 55.4%
Grade 8 8.6% 15.1% 32.3% 67.7%
Grade 10 27.7% 37.3% 50.6% 49.4%
Grade 12 28.0% 34.1% 51.2% 48.8%
Smokeless tobacco
All 11.0% 16.4% 25.7% 74.3%
Grade 8 4.4% 6.7% 13.3% 86.7%
Grade 10 14.8% 22.2% 33.3% 66.7%
Grade 12 13.9% 20.3% 30.4% 69.6%
Table T-2: How often do you normally use ..
Never
Used
Every
Day
Several
Times a
Week
Several
Times a
Month
About
Once a
Month
About
Once a
Year
Less than
Once a
Year
Any tobacco product?
All 54.4% 13.1% 4.8% 6.0% 6.4% 5.8% 9.5%
Grade 8 58.9% 3.3% 5.6% 4.4% 5.6% 10.0% 12.2%
Grade 10 46.8% 13.9% 5.1% 10.1% 7.6% 5.1% 11.4%Grade 12 57.3% 22.0% 3.7% 3.7% 6.1% 2.4% 4.9%
Cigarettes?
All 59.4% 9.9% 4.9% 4.5% 6.1% 6.5% 8.8%
Grade 8 67.4% 3.4% 4.5% 2.2% 3.4% 6.7% 12.4%
Grade 10 51.9% 10.1% 5.1% 7.6% 6.3% 8.9% 10.1%
Grade 12 58.8% 16.3% 5.0% 3.8% 8.8% 3.8% 3.8%
Smokeless tobacco?
All 76.3% 6.5% 1.3% 3.0% 3.8% 3.3% 5.9%
Grade 8 82.8% 1.1% 1.1% 2.3% 3.4% 4.6% 4.6%
Grade 10 69.3% 6.7% 2.7% 5.3% 5.3% 1.3% 9.3%
Grade 12 76.6% 11.7% 0.0% 1.3% 2.6% 3.9% 3.9%
T-3: In the past 30 days, how many cigarettes have you smoked?
None <1 Per Day 1-9 Per Day
10 but < Pack
Per Day
1 Pack but <2
Packs Per Day
>2 Packs Per
Day
All 76.5% 9.8% 9.3% 2.4% 2.1% 0.0%
Grade 8 87.8% 4.4% 5.6% 2.2% 0.0% 0.0%
Grade 10 69.5% 17.1% 8.5% 2.4% 2.4% 0.0%
Grade 12 72.2% 7.6% 13.9% 2.5% 3.8% 0.0%
Secondary Report-Page

8/14/2019 LIMESTONE COUNTY - Groesbeck ISD - 2006 Texas School Survey of Drug and Alcohol Use
http://slidepdf.com/reader/full/limestone-county-groesbeck-isd-2006-texas-school-survey-of-drug-and-alcohol 2/77
Groesbeck
Spring 2006
Secondary Report-Page
8/14/2019 LIMESTONE COUNTY - Groesbeck ISD - 2006 Texas School Survey of Drug and Alcohol Use
http://slidepdf.com/reader/full/limestone-county-groesbeck-isd-2006-texas-school-survey-of-drug-and-alcohol 3/77
Groesbeck
Spring 2006
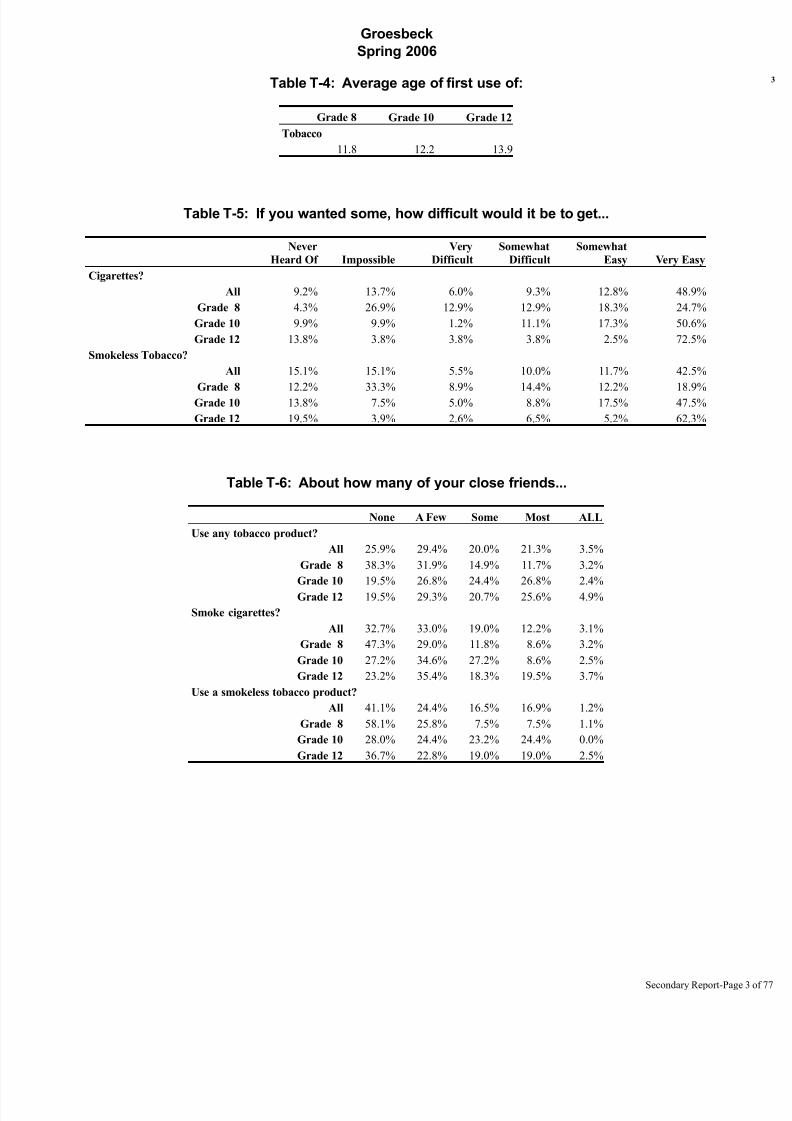
Table T-4: Average age of first use of:
Grade 8 Grade 10 Grade 12
Tobacco
11.8 12.2 13.9
Table T-5: If you wanted some, how difficult would it be to get...
Never
Heard Of Impossible
Very
Difficult
Somewhat
Difficult
Somewhat
Easy Very Easy
Cigarettes?
All 9.2% 13.7% 6.0% 9.3% 12.8% 48.9%
Grade 8 4.3% 26.9% 12.9% 12.9% 18.3% 24.7%
Grade 10 9.9% 9.9% 1.2% 11.1% 17.3% 50.6%
Grade 12 13.8% 3.8% 3.8% 3.8% 2.5% 72.5%
Smokeless Tobacco?
All 15.1% 15.1% 5.5% 10.0% 11.7% 42.5%
Grade 8 12.2% 33.3% 8.9% 14.4% 12.2% 18.9%Grade 10 13.8% 7.5% 5.0% 8.8% 17.5% 47.5%
Grade 12 19.5% 3.9% 2.6% 6.5% 5.2% 62.3%
Table T-6: About how many of your close friends...
None A Few Some Most ALL
Use any tobacco product?
All 25.9% 29.4% 20.0% 21.3% 3.5%
Grade 8 38.3% 31.9% 14.9% 11.7% 3.2%
Grade 10 19.5% 26.8% 24.4% 26.8% 2.4%
Grade 12 19.5% 29.3% 20.7% 25.6% 4.9%
Smoke cigarettes?
All 32.7% 33.0% 19.0% 12.2% 3.1%
Grade 8 47.3% 29.0% 11.8% 8.6% 3.2%
Grade 10 27.2% 34.6% 27.2% 8.6% 2.5%
Grade 12 23.2% 35.4% 18.3% 19.5% 3.7%
Use a smokeless tobacco product?
All 41.1% 24.4% 16.5% 16.9% 1.2%
Grade 8 58.1% 25.8% 7.5% 7.5% 1.1%
Grade 10 28.0% 24.4% 23.2% 24.4% 0.0%
Grade 12 36.7% 22.8% 19.0% 19.0% 2.5%
Secondary Report-Page

8/14/2019 LIMESTONE COUNTY - Groesbeck ISD - 2006 Texas School Survey of Drug and Alcohol Use
http://slidepdf.com/reader/full/limestone-county-groesbeck-isd-2006-texas-school-survey-of-drug-and-alcohol 4/77
Groesbeck
Spring 2006
Table T-7: How do your parents feel about kids your age smoking cigarettes?
Strongly
Disapprove
Mildly
Disapprove Neither
Mildly
Approve
Strongly
Approve Don't know
All 65.0% 14.5% 9.7% 3.9% 0.9% 6.0%
Grade 8 79.8% 6.0% 4.8% 3.6% 0.0% 6.0%
Grade 10 59.5% 14.9% 12.2% 4.1% 2.7% 6.8%
Grade 12 55.4% 23.0% 12.2% 4.1% 0.0% 5.4%
Table T-8: How dangerous do you think it is for kids your age to use tobacco?
Very
Dangerous
Somewhat
Dangerous
Not very
Dangerous
Not at All
Dangerous Do Not Know
All 43.9% 26.4% 20.3% 6.7% 2.7%
Grade 8 63.8% 26.3% 10.0% 0.0% 0.0%
Grade 10 34.6% 30.9% 24.7% 7.4% 2.5%
Grade 12 34.3% 21.4% 25.7% 12.9% 5.7%
Secondary Report-Page

8/14/2019 LIMESTONE COUNTY - Groesbeck ISD - 2006 Texas School Survey of Drug and Alcohol Use
http://slidepdf.com/reader/full/limestone-county-groesbeck-isd-2006-texas-school-survey-of-drug-and-alcohol 5/77
Groesbeck
Spring 2006
Table A-1: How recently, if ever, have you used...
Past
Month
School
Year
Ever
Used
Never
Used
Any alcohol product
All 32.3% 49.8% 69.4% 30.6%
Grade 8 18.3% 34.4% 59.1% 40.9%
Grade 10 40.5% 57.1% 77.4% 22.6%Grade 12 38.3% 58.0% 71.6% 28.4%
Beer
All 27.9% 39.4% 58.6% 41.4%
Grade 8 15.1% 24.7% 50.5% 49.5%
Grade 10 34.1% 43.9% 61.0% 39.0%
Grade 12 35.1% 50.6% 64.9% 35.1%
Wine coolers
All 14.7% 28.3% 50.4% 49.6%
Grade 8 8.8% 16.5% 40.7% 59.3%
Grade 10 16.5% 36.7% 57.0% 43.0%
Grade 12 19.2% 32.1% 53.8% 46.2%
Wine
All 9.3% 19.0% 40.2% 59.8%
Grade 8 4.4% 8.9% 26.7% 73.3%
Grade 10 11.1% 23.5% 49.4% 50.6%
Grade 12 12.3% 24.7% 44.4% 55.6%
Liquor
All 21.9% 36.0% 54.6% 45.4%
Grade 8 6.5% 16.1% 35.5% 64.5%
Grade 10 32.1% 46.4% 67.9% 32.1%
Grade 12 27.2% 45.7% 60.5% 39.5%
Secondary Report-Page

8/14/2019 LIMESTONE COUNTY - Groesbeck ISD - 2006 Texas School Survey of Drug and Alcohol Use
http://slidepdf.com/reader/full/limestone-county-groesbeck-isd-2006-texas-school-survey-of-drug-and-alcohol 6/77
Groesbeck
Spring 2006
Table A-2: How often do you normally use...
Never
Used
Every
Day
Several
Times a
Week
Several
Times a
Month
About
Once a
Month
About
Once a
Year
Less than
Once a
Year
Any alcohol product?
All 33.6% 3.2% 2.8% 16.6% 14.0% 18.9% 10.9%
Grade 8 37.8% 3.3% 1.1% 7.8% 10.0% 23.3% 16.7%Grade 10 24.4% 1.2% 2.4% 22.0% 18.3% 18.3% 13.4%
Grade 12 38.8% 5.0% 5.0% 20.0% 13.8% 15.0% 2.5%
Beer?
All 42.5% 2.1% 2.5% 15.3% 12.6% 13.9% 11.0%
Grade 8 47.7% 1.1% 1.1% 5.7% 9.1% 18.2% 17.0%
Grade 10 39.5% 1.3% 2.6% 21.1% 14.5% 10.5% 10.5%
Grade 12 40.3% 3.9% 3.9% 19.5% 14.3% 13.0% 5.2%
Wine coolers?
All 49.4% 0.8% 1.3% 6.0% 13.0% 13.5% 16.0%
Grade 8 58.8% 2.4% 0.0% 4.7% 7.1% 16.5% 10.6%
Grade 10 37.7% 0.0% 1.3% 6.5% 16.9% 13.0% 24.7%
Grade 12 52.1% 0.0% 2.7% 6.8% 15.1% 11.0% 12.3%
Wine?
All 54.6% 0.4% 1.8% 3.9% 11.2% 15.2% 13.0%
Grade 8 65.6% 1.1% 0.0% 2.2% 7.8% 16.7% 6.7%
Grade 10 41.3% 0.0% 1.3% 4.0% 14.7% 17.3% 21.3%
Grade 12 56.3% 0.0% 4.2% 5.6% 11.3% 11.3% 11.3%
Liquor?
All 50.2% 0.9% 2.6% 8.7% 13.0% 14.8% 9.8%
Grade 8 65.5% 0.0% 1.1% 3.4% 5.7% 14.9% 9.2%
Grade 10 34.7% 0.0% 4.0% 13.3% 17.3% 14.7% 16.0%
Grade 12 50.0% 2.7% 2.7% 9.5% 16.2% 14.9% 4.1%
Secondary Report-Page
8/14/2019 LIMESTONE COUNTY - Groesbeck ISD - 2006 Texas School Survey of Drug and Alcohol Use
http://slidepdf.com/reader/full/limestone-county-groesbeck-isd-2006-texas-school-survey-of-drug-and-alcohol 7/77
Groesbeck
Spring 2006
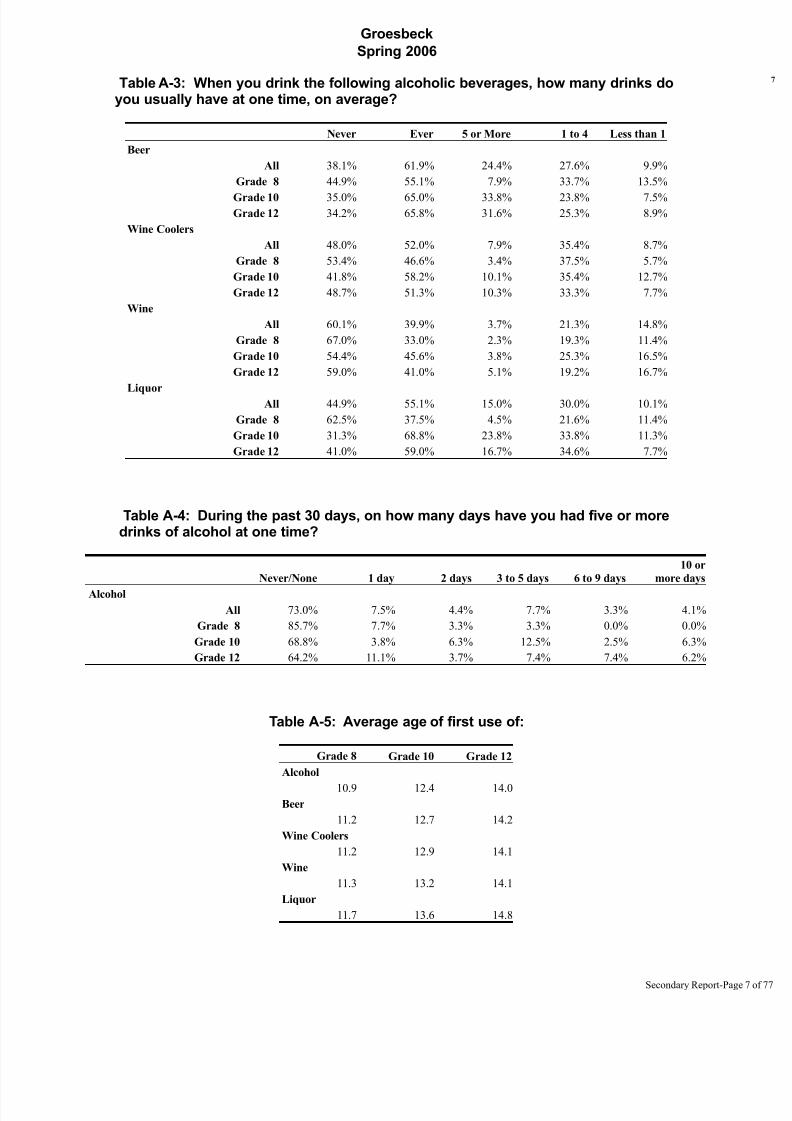
Table A-3: When you drink the following alcoholic beverages, how many drinks doyou usually have at one time, on average?
Never Ever 5 or More 1 to 4 Less than 1
Beer
All 38.1% 61.9% 24.4% 27.6% 9.9%
Grade 8 44.9% 55.1% 7.9% 33.7% 13.5%
Grade 10 35.0% 65.0% 33.8% 23.8% 7.5%Grade 12 34.2% 65.8% 31.6% 25.3% 8.9%
Wine Coolers
All 48.0% 52.0% 7.9% 35.4% 8.7%
Grade 8 53.4% 46.6% 3.4% 37.5% 5.7%
Grade 10 41.8% 58.2% 10.1% 35.4% 12.7%
Grade 12 48.7% 51.3% 10.3% 33.3% 7.7%
Wine
All 60.1% 39.9% 3.7% 21.3% 14.8%
Grade 8 67.0% 33.0% 2.3% 19.3% 11.4%
Grade 10 54.4% 45.6% 3.8% 25.3% 16.5%
Grade 12 59.0% 41.0% 5.1% 19.2% 16.7%
LiquorAll 44.9% 55.1% 15.0% 30.0% 10.1%
Grade 8 62.5% 37.5% 4.5% 21.6% 11.4%
Grade 10 31.3% 68.8% 23.8% 33.8% 11.3%
Grade 12 41.0% 59.0% 16.7% 34.6% 7.7%
Table A-4: During the past 30 days, on how many days have you had five or moredrinks of alcohol at one time?
Never/None 1 day 2 days 3 to 5 days 6 to 9 days
10 or
more days
Alcohol
All 73.0% 7.5% 4.4% 7.7% 3.3% 4.1%
Grade 8 85.7% 7.7% 3.3% 3.3% 0.0% 0.0%
Grade 10 68.8% 3.8% 6.3% 12.5% 2.5% 6.3%
Grade 12 64.2% 11.1% 3.7% 7.4% 7.4% 6.2%
Table A-5: Average age of first use of:
Grade 8 Grade 10 Grade 12
Alcohol
10.9 12.4 14.0
Beer
11.2 12.7 14.2
Wine Coolers
11.2 12.9 14.1
Wine
11.3 13.2 14.1
Liquor
11.7 13.6 14.8
Secondary Report-Page

8/14/2019 LIMESTONE COUNTY - Groesbeck ISD - 2006 Texas School Survey of Drug and Alcohol Use
http://slidepdf.com/reader/full/limestone-county-groesbeck-isd-2006-texas-school-survey-of-drug-and-alcohol 8/77
8/14/2019 LIMESTONE COUNTY - Groesbeck ISD - 2006 Texas School Survey of Drug and Alcohol Use
http://slidepdf.com/reader/full/limestone-county-groesbeck-isd-2006-texas-school-survey-of-drug-and-alcohol 9/77
Groesbeck
Spring 2006
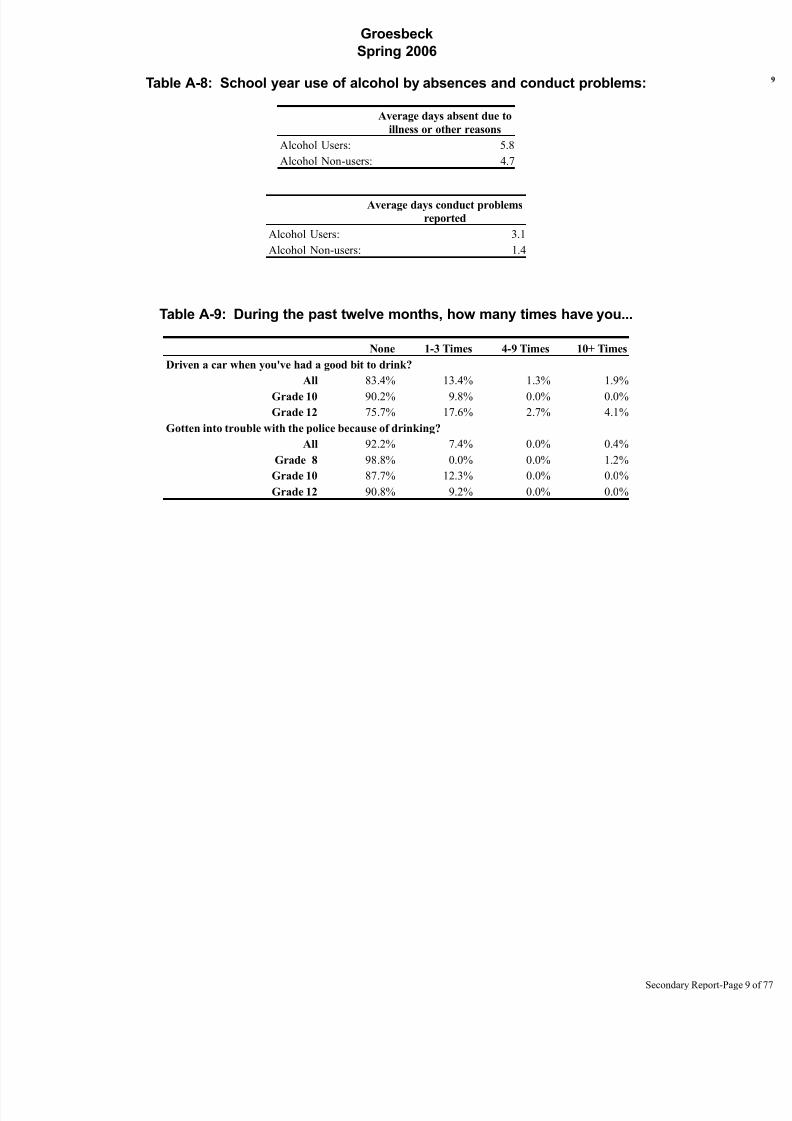
Table A-8: School year use of alcohol by absences and conduct problems:
Average days absent due to
illness or other reasons
Alcohol Users: 5.8
Alcohol Non-users: 4.7
Average days conduct problems
reported
Alcohol Users: 3.1
Alcohol Non-users: 1.4
Table A-9: During the past twelve months, how many times have you...
None 1-3 Times 4-9 Times 10+ Times
Driven a car when you've had a good bit to drink?
All 83.4% 13.4% 1.3% 1.9%
Grade 10 90.2% 9.8% 0.0% 0.0%
Grade 12 75.7% 17.6% 2.7% 4.1%
Gotten into trouble with the police because of drinking?
All 92.2% 7.4% 0.0% 0.4%
Grade 8 98.8% 0.0% 0.0% 1.2%
Grade 10 87.7% 12.3% 0.0% 0.0%
Grade 12 90.8% 9.2% 0.0% 0.0%
Secondary Report-Page

8/14/2019 LIMESTONE COUNTY - Groesbeck ISD - 2006 Texas School Survey of Drug and Alcohol Use
http://slidepdf.com/reader/full/limestone-county-groesbeck-isd-2006-texas-school-survey-of-drug-and-alcohol 10/77
Groesbeck
Spring 2006
Table A-10: About how many of your close friends use...
None A Few Some Most ALL
Any alcohol product?
All 20.5% 21.4% 17.2% 29.1% 11.8%
Grade 8 31.9% 30.9% 12.8% 18.1% 6.4%
Grade 10 12.2% 18.3% 18.3% 35.4% 15.9%
Grade 12 17.1% 14.6% 20.7% 34.1% 13.4%Beer?
All 26.0% 19.8% 17.0% 26.8% 10.4%
Grade 8 42.6% 25.5% 12.8% 13.8% 5.3%
Grade 10 15.0% 17.5% 20.0% 32.5% 15.0%
Grade 12 19.8% 16.0% 18.5% 34.6% 11.1%
Wine coolers?
All 39.9% 25.4% 15.6% 14.7% 4.3%
Grade 8 50.5% 22.6% 9.7% 11.8% 5.4%
Grade 10 31.3% 31.3% 17.5% 17.5% 2.5%
Grade 12 37.5% 22.5% 20.0% 15.0% 5.0%
Wine?
All 52.8% 23.6% 12.7% 8.2% 2.7%Grade 8 61.3% 18.3% 8.6% 7.5% 4.3%
Grade 10 50.6% 27.2% 16.0% 6.2% 0.0%
Grade 12 46.3% 25.6% 13.4% 11.0% 3.7%
Liquor?
All 33.0% 21.6% 18.1% 20.5% 6.8%
Grade 8 53.8% 17.2% 10.8% 12.9% 5.4%
Grade 10 22.8% 21.5% 22.8% 24.1% 8.9%
Grade 12 21.3% 26.3% 21.3% 25.0% 6.3%
Table A-11: During the past twelve months, how many times have you...
None 1-3 Times 4-9 Times 10+ Times
Had difficulties of any kind with your friends because of your drinking?
All 88.0% 10.8% 0.0% 1.2%
Grade 8 90.5% 8.3% 0.0% 1.2%
Grade 10 88.0% 12.0% 0.0% 0.0%
Grade 12 85.5% 11.8% 0.0% 2.6%
Been criticized by someone you were dating because of drinking?
All 90.2% 7.2% 0.9% 1.7%
Grade 8 93.9% 4.9% 0.0% 1.2%
Grade 10 93.9% 4.9% 1.2% 0.0%
Grade 12 82.2% 12.3% 1.4% 4.1%
Secondary Report-Page
8/14/2019 LIMESTONE COUNTY - Groesbeck ISD - 2006 Texas School Survey of Drug and Alcohol Use
http://slidepdf.com/reader/full/limestone-county-groesbeck-isd-2006-texas-school-survey-of-drug-and-alcohol 11/77
Groesbeck
Spring 2006
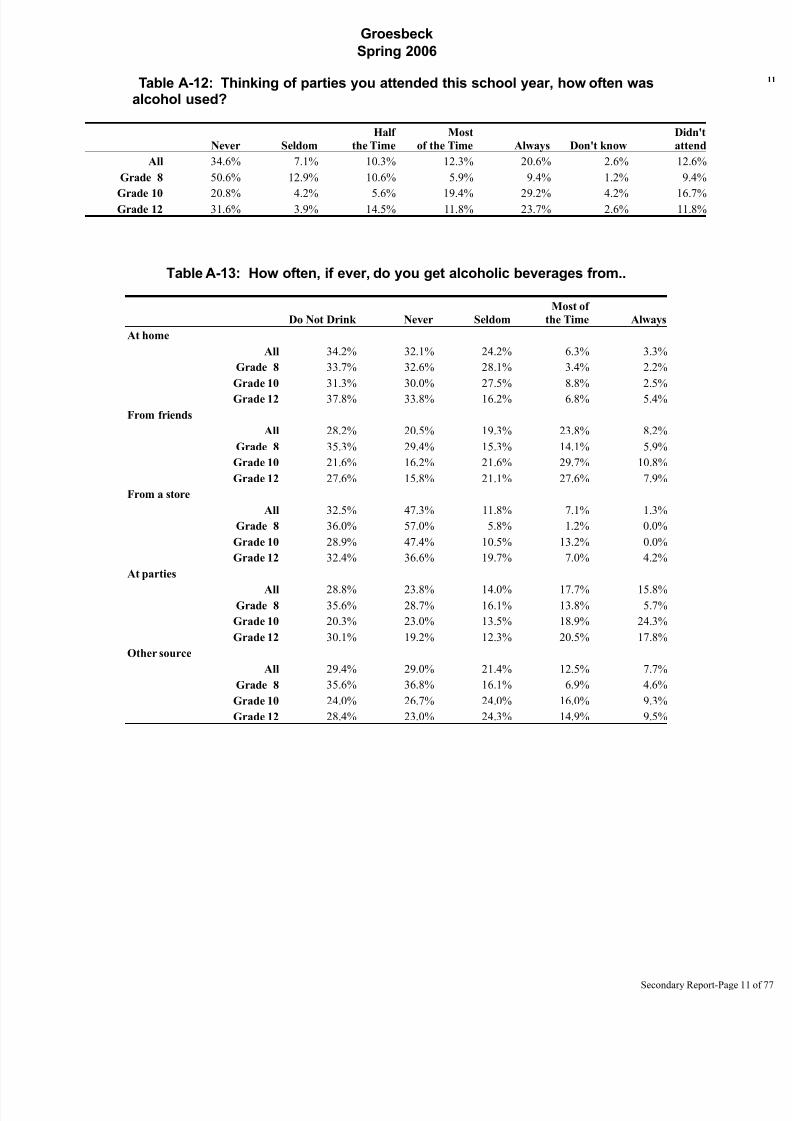
Table A-12: Thinking of parties you attended this school year, how often wasalcohol used?
Never Seldom
Half
the Time
Most
of the Time Always Don't know
Didn't
attend
All 34.6% 7.1% 10.3% 12.3% 20.6% 2.6% 12.6%
Grade 8 50.6% 12.9% 10.6% 5.9% 9.4% 1.2% 9.4%
Grade 10 20.8% 4.2% 5.6% 19.4% 29.2% 4.2% 16.7%Grade 12 31.6% 3.9% 14.5% 11.8% 23.7% 2.6% 11.8%
Table A-13: How often, if ever, do you get alcoholic beverages from..
Do Not Drink Never Seldom
Most of
the Time Always
At home
All 34.2% 32.1% 24.2% 6.3% 3.3%
Grade 8 33.7% 32.6% 28.1% 3.4% 2.2%
Grade 10 31.3% 30.0% 27.5% 8.8% 2.5%
Grade 12 37.8% 33.8% 16.2% 6.8% 5.4%
From friends
All 28.2% 20.5% 19.3% 23.8% 8.2%
Grade 8 35.3% 29.4% 15.3% 14.1% 5.9%
Grade 10 21.6% 16.2% 21.6% 29.7% 10.8%
Grade 12 27.6% 15.8% 21.1% 27.6% 7.9%
From a store
All 32.5% 47.3% 11.8% 7.1% 1.3%
Grade 8 36.0% 57.0% 5.8% 1.2% 0.0%
Grade 10 28.9% 47.4% 10.5% 13.2% 0.0%
Grade 12 32.4% 36.6% 19.7% 7.0% 4.2%
At parties
All 28.8% 23.8% 14.0% 17.7% 15.8%Grade 8 35.6% 28.7% 16.1% 13.8% 5.7%
Grade 10 20.3% 23.0% 13.5% 18.9% 24.3%
Grade 12 30.1% 19.2% 12.3% 20.5% 17.8%
Other source
All 29.4% 29.0% 21.4% 12.5% 7.7%
Grade 8 35.6% 36.8% 16.1% 6.9% 4.6%
Grade 10 24.0% 26.7% 24.0% 16.0% 9.3%
Grade 12 28.4% 23.0% 24.3% 14.9% 9.5%
Secondary Report-Page
8/14/2019 LIMESTONE COUNTY - Groesbeck ISD - 2006 Texas School Survey of Drug and Alcohol Use
http://slidepdf.com/reader/full/limestone-county-groesbeck-isd-2006-texas-school-survey-of-drug-and-alcohol 12/77
Groesbeck
Spring 2006
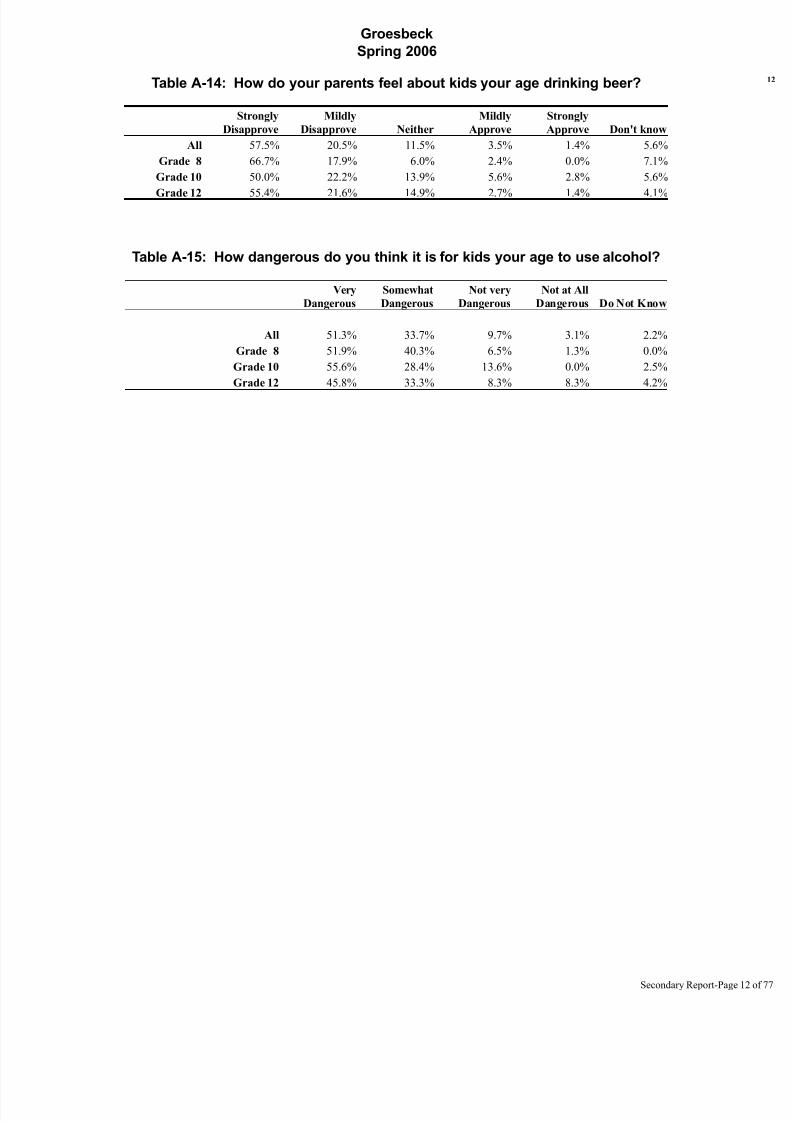
Table A-14: How do your parents feel about kids your age drinking beer?
Strongly
Disapprove
Mildly
Disapprove Neither
Mildly
Approve
Strongly
Approve Don't know
All 57.5% 20.5% 11.5% 3.5% 1.4% 5.6%
Grade 8 66.7% 17.9% 6.0% 2.4% 0.0% 7.1%
Grade 10 50.0% 22.2% 13.9% 5.6% 2.8% 5.6%
Grade 12 55.4% 21.6% 14.9% 2.7% 1.4% 4.1%
Table A-15: How dangerous do you think it is for kids your age to use alcohol?
Very
Dangerous
Somewhat
Dangerous
Not very
Dangerous
Not at All
Dangerous Do Not Know
All 51.3% 33.7% 9.7% 3.1% 2.2%
Grade 8 51.9% 40.3% 6.5% 1.3% 0.0%
Grade 10 55.6% 28.4% 13.6% 0.0% 2.5%
Grade 12 45.8% 33.3% 8.3% 8.3% 4.2%
Secondary Report-Page

8/14/2019 LIMESTONE COUNTY - Groesbeck ISD - 2006 Texas School Survey of Drug and Alcohol Use
http://slidepdf.com/reader/full/limestone-county-groesbeck-isd-2006-texas-school-survey-of-drug-and-alcohol 13/77
Groesbeck
Spring 2006
Table D-1: How recently, if ever, have you used...
Past
Month
School
Year
Ever
Used
Never
Used
Marijuana?
All 5.1% 11.3% 24.9% 75.1%
Grade 8 2.1% 6.4% 14.9% 85.1%
Grade 10 7.2% 13.3% 27.7% 72.3%Grade 12 6.0% 14.3% 32.1% 67.9%
Cocaine?
All 0.8% 2.0% 3.1% 96.9%
Grade 8 1.1% 1.1% 3.2% 96.8%
Grade 10 1.2% 2.4% 2.4% 97.6%
Grade 12 0.0% 2.4% 3.7% 96.3%
Crack?
All 0.0% 0.0% 0.4% 99.6%
Grade 8 0.0% 0.0% 1.1% 98.9%
Grade 10 0.0% 0.0% 0.0% 100.0%
Grade 12 0.0% 0.0% 0.0% 100.0%
Hallucinogens?
All 0.4% 1.6% 2.8% 97.2%
Grade 8 0.0% 0.0% 1.1% 98.9%
Grade 10 0.0% 0.0% 2.4% 97.6%
Grade 12 1.2% 4.8% 4.8% 95.2%
Uppers?
All 0.8% 1.6% 2.8% 97.2%
Grade 8 0.0% 0.0% 1.1% 98.9%
Grade 10 0.0% 0.0% 1.2% 98.8%
Grade 12 2.4% 4.9% 6.1% 93.9%
Downers?
All 1.2% 2.0% 4.0% 96.0%
Grade 8 0.0% 0.0% 1.1% 98.9%
Grade 10 1.2% 1.2% 4.9% 95.1%Grade 12 2.4% 4.9% 6.1% 93.9%
Rohypnol?
All 0.8% 1.2% 2.0% 98.0%
Grade 8 0.0% 0.0% 1.1% 98.9%
Grade 10 1.2% 1.2% 2.4% 97.6%
Grade 12 1.2% 2.4% 2.4% 97.6%
Steroids?
All 0.8% 1.2% 2.8% 97.2%
Grade 8 0.0% 0.0% 0.0% 100.0%
Grade 10 1.2% 1.2% 4.8% 95.2%
Grade 12 1.2% 2.5% 3.7% 96.3%
Ecstasy?All 0.4% 0.4% 0.8% 99.2%
Grade 8 0.0% 0.4% 0.4% 99.6%
Grade 10 0.0% 0.4% 0.4% 99.6%
Grade 12 1.2% 1.6% 2.9% 97.1%
Secondary Report-Page

8/14/2019 LIMESTONE COUNTY - Groesbeck ISD - 2006 Texas School Survey of Drug and Alcohol Use
http://slidepdf.com/reader/full/limestone-county-groesbeck-isd-2006-texas-school-survey-of-drug-and-alcohol 14/77
Groesbeck
Spring 2006
Table D-1: How recently, if ever, have you used...(Continued)
Past
Month
School
Year
Ever
Used
Never
Used
Heroin?
All 0.0% 0.0% 0.8% 99.2%
Grade 8 0.0% 0.0% 0.0% 100.0%
Grade 10 0.0% 0.0% 1.2% 98.8%
Grade 12 0.0% 0.0% 1.2% 98.8%
Secondary Report-Page
8/14/2019 LIMESTONE COUNTY - Groesbeck ISD - 2006 Texas School Survey of Drug and Alcohol Use
http://slidepdf.com/reader/full/limestone-county-groesbeck-isd-2006-texas-school-survey-of-drug-and-alcohol 15/77
Groesbeck
Spring 2006
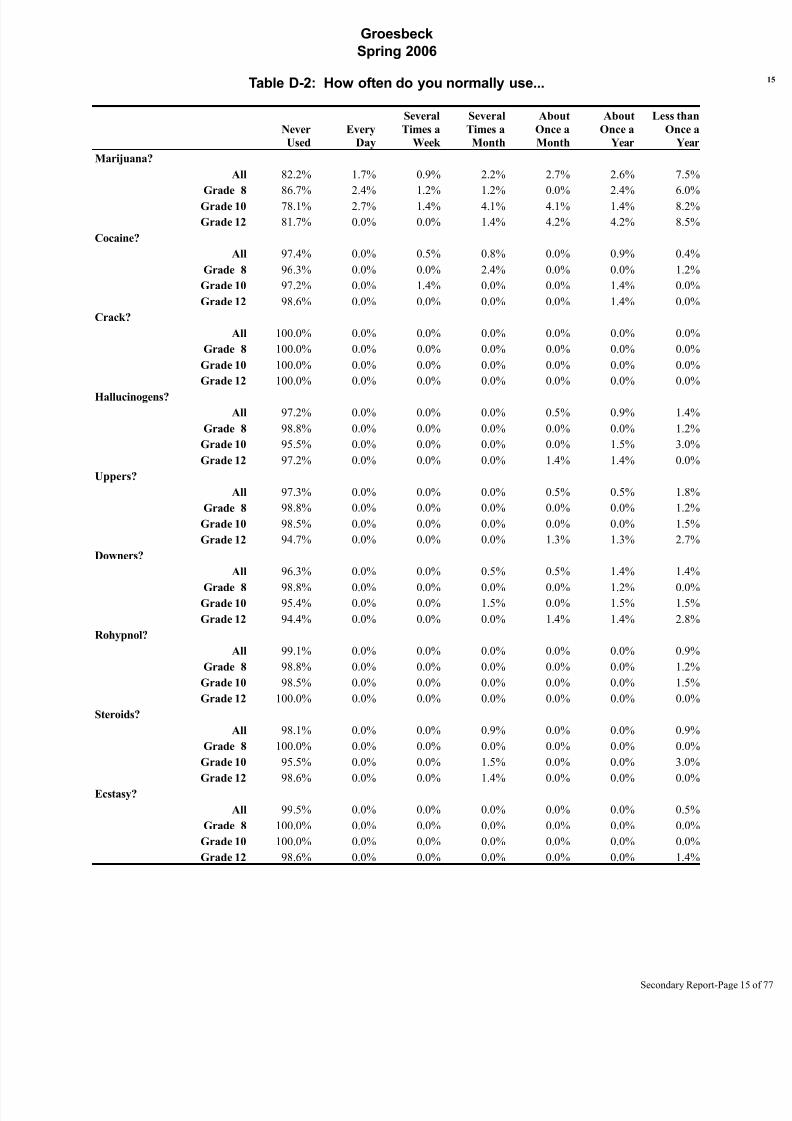
Table D-2: How often do you normally use...
Never
Used
Every
Day
Several
Times a
Week
Several
Times a
Month
About
Once a
Month
About
Once a
Year
Less than
Once a
Year
Marijuana?
All 82.2% 1.7% 0.9% 2.2% 2.7% 2.6% 7.5%
Grade 8 86.7% 2.4% 1.2% 1.2% 0.0% 2.4% 6.0%Grade 10 78.1% 2.7% 1.4% 4.1% 4.1% 1.4% 8.2%
Grade 12 81.7% 0.0% 0.0% 1.4% 4.2% 4.2% 8.5%
Cocaine?
All 97.4% 0.0% 0.5% 0.8% 0.0% 0.9% 0.4%
Grade 8 96.3% 0.0% 0.0% 2.4% 0.0% 0.0% 1.2%
Grade 10 97.2% 0.0% 1.4% 0.0% 0.0% 1.4% 0.0%
Grade 12 98.6% 0.0% 0.0% 0.0% 0.0% 1.4% 0.0%
Crack?
All 100.0% 0.0% 0.0% 0.0% 0.0% 0.0% 0.0%
Grade 8 100.0% 0.0% 0.0% 0.0% 0.0% 0.0% 0.0%
Grade 10 100.0% 0.0% 0.0% 0.0% 0.0% 0.0% 0.0%
Grade 12 100.0% 0.0% 0.0% 0.0% 0.0% 0.0% 0.0%
Hallucinogens?
All 97.2% 0.0% 0.0% 0.0% 0.5% 0.9% 1.4%
Grade 8 98.8% 0.0% 0.0% 0.0% 0.0% 0.0% 1.2%
Grade 10 95.5% 0.0% 0.0% 0.0% 0.0% 1.5% 3.0%
Grade 12 97.2% 0.0% 0.0% 0.0% 1.4% 1.4% 0.0%
Uppers?
All 97.3% 0.0% 0.0% 0.0% 0.5% 0.5% 1.8%
Grade 8 98.8% 0.0% 0.0% 0.0% 0.0% 0.0% 1.2%
Grade 10 98.5% 0.0% 0.0% 0.0% 0.0% 0.0% 1.5%
Grade 12 94.7% 0.0% 0.0% 0.0% 1.3% 1.3% 2.7%
Downers?
All 96.3% 0.0% 0.0% 0.5% 0.5% 1.4% 1.4%
Grade 8 98.8% 0.0% 0.0% 0.0% 0.0% 1.2% 0.0%Grade 10 95.4% 0.0% 0.0% 1.5% 0.0% 1.5% 1.5%
Grade 12 94.4% 0.0% 0.0% 0.0% 1.4% 1.4% 2.8%
Rohypnol?
All 99.1% 0.0% 0.0% 0.0% 0.0% 0.0% 0.9%
Grade 8 98.8% 0.0% 0.0% 0.0% 0.0% 0.0% 1.2%
Grade 10 98.5% 0.0% 0.0% 0.0% 0.0% 0.0% 1.5%
Grade 12 100.0% 0.0% 0.0% 0.0% 0.0% 0.0% 0.0%
Steroids?
All 98.1% 0.0% 0.0% 0.9% 0.0% 0.0% 0.9%
Grade 8 100.0% 0.0% 0.0% 0.0% 0.0% 0.0% 0.0%
Grade 10 95.5% 0.0% 0.0% 1.5% 0.0% 0.0% 3.0%
Grade 12 98.6% 0.0% 0.0% 1.4% 0.0% 0.0% 0.0%
Ecstasy?
All 99.5% 0.0% 0.0% 0.0% 0.0% 0.0% 0.5%
Grade 8 100.0% 0.0% 0.0% 0.0% 0.0% 0.0% 0.0%
Grade 10 100.0% 0.0% 0.0% 0.0% 0.0% 0.0% 0.0%
Grade 12 98.6% 0.0% 0.0% 0.0% 0.0% 0.0% 1.4%
Secondary Report-Page
8/14/2019 LIMESTONE COUNTY - Groesbeck ISD - 2006 Texas School Survey of Drug and Alcohol Use
http://slidepdf.com/reader/full/limestone-county-groesbeck-isd-2006-texas-school-survey-of-drug-and-alcohol 16/77
Groesbeck
Spring 2006
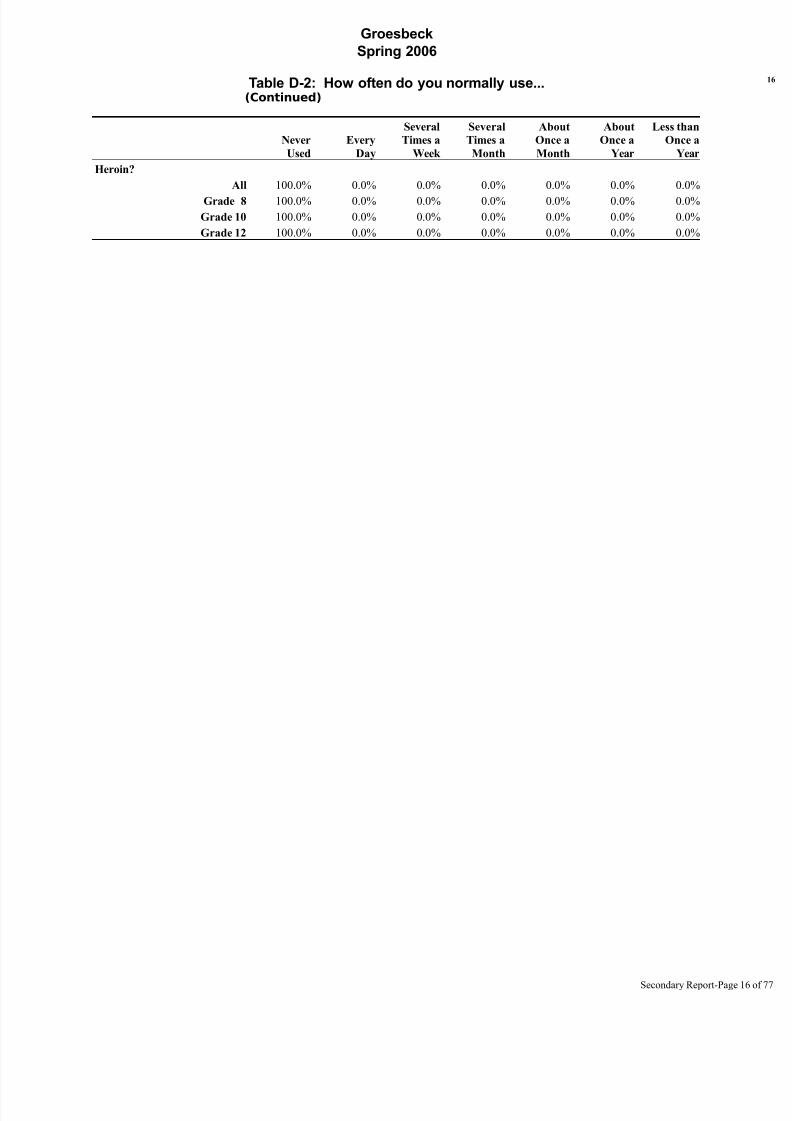
Table D-2: How often do you normally use...(Continued)
Never
Used
Every
Day
Several
Times a
Week
Several
Times a
Month
About
Once a
Month
About
Once a
Year
Less than
Once a
Year
Heroin?
All 100.0% 0.0% 0.0% 0.0% 0.0% 0.0% 0.0%
Grade 8 100.0% 0.0% 0.0% 0.0% 0.0% 0.0% 0.0%
Grade 10 100.0% 0.0% 0.0% 0.0% 0.0% 0.0% 0.0%
Grade 12 100.0% 0.0% 0.0% 0.0% 0.0% 0.0% 0.0%
Secondary Report-Page
8/14/2019 LIMESTONE COUNTY - Groesbeck ISD - 2006 Texas School Survey of Drug and Alcohol Use
http://slidepdf.com/reader/full/limestone-county-groesbeck-isd-2006-texas-school-survey-of-drug-and-alcohol 17/77
Groesbeck
Spring 2006
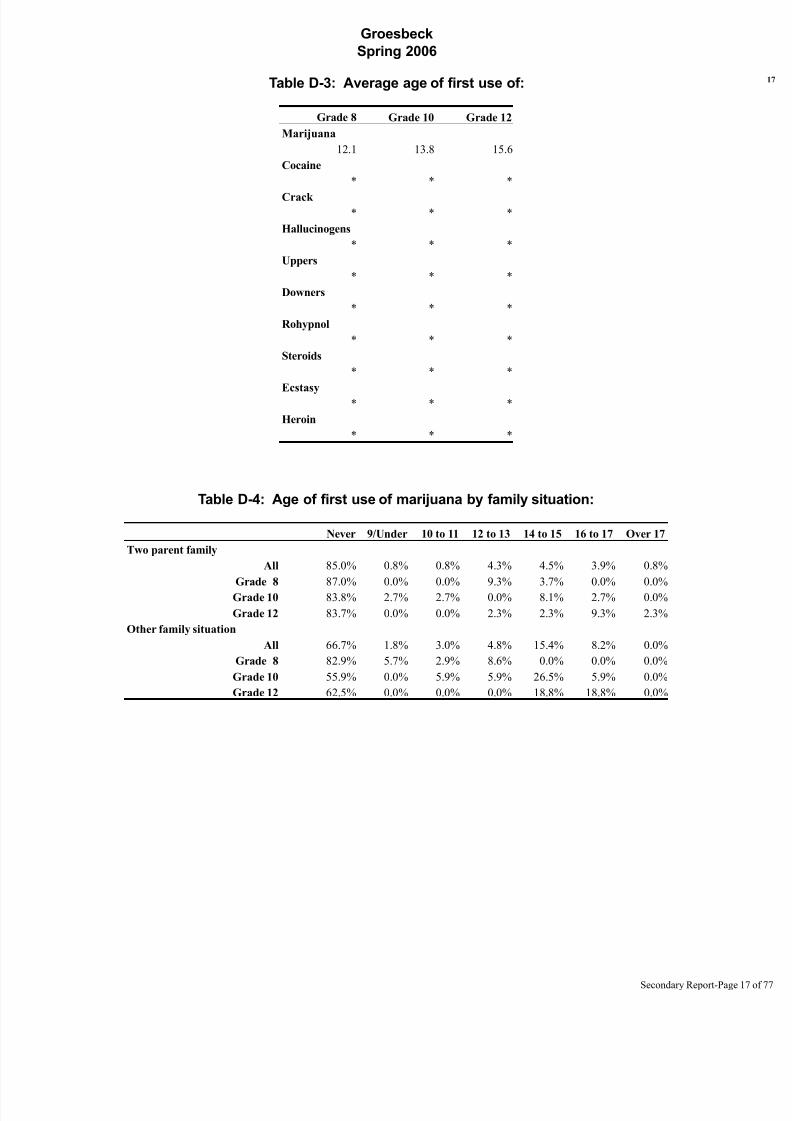
Table D-3: Average age of first use of:
Grade 8 Grade 10 Grade 12
Marijuana
12.1 13.8 15.6
Cocaine
* * *
Crack * * *
Hallucinogens
* * *
Uppers
* * *
Downers
* * *
Rohypnol
* * *
Steroids
* * *
Ecstasy* * *
Heroin
* * *
Table D-4: Age of first use of marijuana by family situation:
Never 9/Under 10 to 11 12 to 13 14 to 15 16 to 17 Over 17
Two parent family
All 85.0% 0.8% 0.8% 4.3% 4.5% 3.9% 0.8%
Grade 8 87.0% 0.0% 0.0% 9.3% 3.7% 0.0% 0.0%
Grade 10 83.8% 2.7% 2.7% 0.0% 8.1% 2.7% 0.0%
Grade 12 83.7% 0.0% 0.0% 2.3% 2.3% 9.3% 2.3%
Other family situation
All 66.7% 1.8% 3.0% 4.8% 15.4% 8.2% 0.0%
Grade 8 82.9% 5.7% 2.9% 8.6% 0.0% 0.0% 0.0%
Grade 10 55.9% 0.0% 5.9% 5.9% 26.5% 5.9% 0.0%
Grade 12 62.5% 0.0% 0.0% 0.0% 18.8% 18.8% 0.0%
Secondary Report-Page

8/14/2019 LIMESTONE COUNTY - Groesbeck ISD - 2006 Texas School Survey of Drug and Alcohol Use
http://slidepdf.com/reader/full/limestone-county-groesbeck-isd-2006-texas-school-survey-of-drug-and-alcohol 18/77
Groesbeck
Spring 2006
Table D-5: If you wanted some, how difficult would it be to get..
Never
Heard Of Impossible
Very
Difficult
Somewhat
Difficult
Somewhat
Easy Very Easy
Marijuana?
All 17.9% 30.7% 10.0% 12.7% 12.8% 15.8%
Grade 8 7.7% 54.9% 9.9% 4.4% 13.2% 9.9%
Grade 10 15.0% 22.5% 15.0% 12.5% 13.8% 21.3%Grade 12 31.6% 13.9% 5.1% 21.5% 11.4% 16.5%
Cocaine?
All 24.6% 41.6% 15.2% 8.4% 4.5% 5.8%
Grade 8 10.0% 65.6% 13.3% 3.3% 3.3% 4.4%
Grade 10 26.6% 32.9% 19.0% 11.4% 3.8% 6.3%
Grade 12 38.2% 25.0% 13.2% 10.5% 6.6% 6.6%
Crack?
All 25.7% 41.8% 15.1% 8.7% 3.3% 5.4%
Grade 8 11.0% 64.8% 13.2% 4.4% 3.3% 3.3%
Grade 10 24.7% 35.1% 19.5% 10.4% 5.2% 5.2%
Grade 12 42.3% 24.4% 12.8% 11.5% 1.3% 7.7%
Hallucinogens?
All 40.1% 31.0% 14.4% 4.1% 5.0% 5.3%
Grade 8 33.0% 50.0% 9.1% 2.3% 1.1% 4.5%
Grade 10 40.0% 23.8% 16.3% 5.0% 10.0% 5.0%
Grade 12 47.4% 19.2% 17.9% 5.1% 3.8% 6.4%
Uppers?
All 54.7% 24.8% 6.7% 3.4% 4.7% 5.5%
Grade 8 50.0% 40.7% 4.7% 1.2% 1.2% 2.3%
Grade 10 51.3% 17.1% 9.2% 6.6% 10.5% 5.3%
Grade 12 62.8% 16.7% 6.4% 2.6% 2.6% 9.0%
Downers?
All 54.9% 23.3% 7.0% 3.8% 5.1% 5.9%
Grade 8 50.6% 39.1% 5.7% 1.1% 1.1% 2.3%
Grade 10 51.9% 14.3% 9.1% 7.8% 9.1% 7.8%Grade 12 62.0% 16.5% 6.3% 2.5% 5.1% 7.6%
Rohypnol?
All 56.9% 24.6% 8.4% 4.3% 3.0% 2.9%
Grade 8 49.4% 40.2% 5.7% 1.1% 0.0% 3.4%
Grade 10 58.4% 16.9% 10.4% 9.1% 5.2% 0.0%
Grade 12 62.8% 16.7% 9.0% 2.6% 3.8% 5.1%
Steroids?
All 27.4% 38.2% 9.6% 10.2% 7.4% 7.3%
Grade 8 14.4% 58.9% 12.2% 5.6% 3.3% 5.6%
Grade 10 26.9% 30.8% 11.5% 10.3% 15.4% 5.1%
Grade 12 40.7% 24.7% 4.9% 14.8% 3.7% 11.1%
Ecstasy?All 35.2% 35.6% 12.6% 8.2% 3.8% 4.6%
Grade 8 25.8% 59.6% 7.9% 1.1% 2.2% 3.4%
Grade 10 35.1% 23.4% 19.5% 13.0% 3.9% 5.2%
Grade 12 45.3% 22.7% 10.7% 10.7% 5.3% 5.3%
Secondary Report-Page

8/14/2019 LIMESTONE COUNTY - Groesbeck ISD - 2006 Texas School Survey of Drug and Alcohol Use
http://slidepdf.com/reader/full/limestone-county-groesbeck-isd-2006-texas-school-survey-of-drug-and-alcohol 19/77
Groesbeck
Spring 2006
Table D-5: If you wanted some, how difficult would it be to get..Continue
d
Never
Heard Of Impossible
Very
Difficult
Somewhat
Difficult
Somewhat
Easy Very Easy
Heroin?
All 33.6% 42.2% 12.9% 6.5% 2.0% 2.8%
Grade 8 19.4% 64.5% 9.7% 2.2% 1.1% 3.2%
Grade 10 34.6% 35.8% 16.0% 9.9% 3.7% 0.0%
Grade 12 48.1% 24.7% 13.0% 7.8% 1.3% 5.2%
Secondary Report-Page

8/14/2019 LIMESTONE COUNTY - Groesbeck ISD - 2006 Texas School Survey of Drug and Alcohol Use
http://slidepdf.com/reader/full/limestone-county-groesbeck-isd-2006-texas-school-survey-of-drug-and-alcohol 20/77
Groesbeck
Spring 2006
Table D-6: Since school began in the fall, on how many days (if any) have you..
None 1-3 Times 4-9 Times 10+ Times
Attended class while high from marijuana use?
All 96.9% 1.3% 0.4% 1.3%
Grade 8 96.4% 1.2% 1.2% 1.2%
Grade 10 94.1% 2.9% 0.0% 2.9%
Grade 12 100.0% 0.0% 0.0% 0.0%Attended class while high from use of some other drug?
All 98.7% 1.3% 0.0% 0.0%
Grade 8 97.6% 2.4% 0.0% 0.0%
Grade 10 100.0% 0.0% 0.0% 0.0%
Grade 12 98.6% 1.4% 0.0% 0.0%
Gotten into trouble with teachers because of your drug use?
All 98.8% 0.4% 0.8% 0.0%
Grade 8 98.8% 0.0% 1.2% 0.0%
Grade 10 100.0% 0.0% 0.0% 0.0%
Grade 12 97.4% 1.3% 1.3% 0.0%
Secondary Report-Page
8/14/2019 LIMESTONE COUNTY - Groesbeck ISD - 2006 Texas School Survey of Drug and Alcohol Use
http://slidepdf.com/reader/full/limestone-county-groesbeck-isd-2006-texas-school-survey-of-drug-and-alcohol 21/77
Groesbeck
Spring 2006
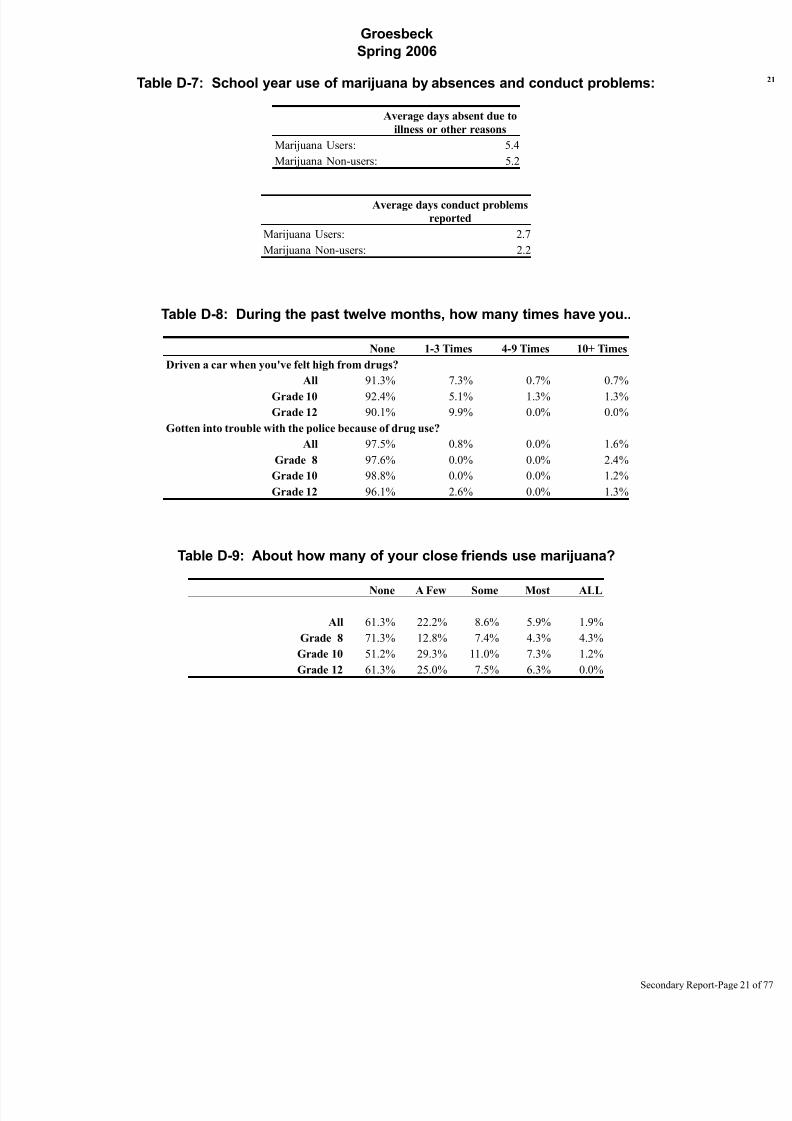
Table D-7: School year use of marijuana by absences and conduct problems:
Average days absent due to
illness or other reasons
Marijuana Users: 5.4
Marijuana Non-users: 5.2
Average days conduct problems
reported
Marijuana Users: 2.7
Marijuana Non-users: 2.2
Table D-8: During the past twelve months, how many times have you..
None 1-3 Times 4-9 Times 10+ Times
Driven a car when you've felt high from drugs?
All 91.3% 7.3% 0.7% 0.7%
Grade 10 92.4% 5.1% 1.3% 1.3%
Grade 12 90.1% 9.9% 0.0% 0.0%
Gotten into trouble with the police because of drug use?
All 97.5% 0.8% 0.0% 1.6%
Grade 8 97.6% 0.0% 0.0% 2.4%
Grade 10 98.8% 0.0% 0.0% 1.2%
Grade 12 96.1% 2.6% 0.0% 1.3%
Table D-9: About how many of your close friends use marijuana?
None A Few Some Most ALL
All 61.3% 22.2% 8.6% 5.9% 1.9%
Grade 8 71.3% 12.8% 7.4% 4.3% 4.3%
Grade 10 51.2% 29.3% 11.0% 7.3% 1.2%
Grade 12 61.3% 25.0% 7.5% 6.3% 0.0%
Secondary Report-Page
8/14/2019 LIMESTONE COUNTY - Groesbeck ISD - 2006 Texas School Survey of Drug and Alcohol Use
http://slidepdf.com/reader/full/limestone-county-groesbeck-isd-2006-texas-school-survey-of-drug-and-alcohol 22/77
Groesbeck
Spring 2006
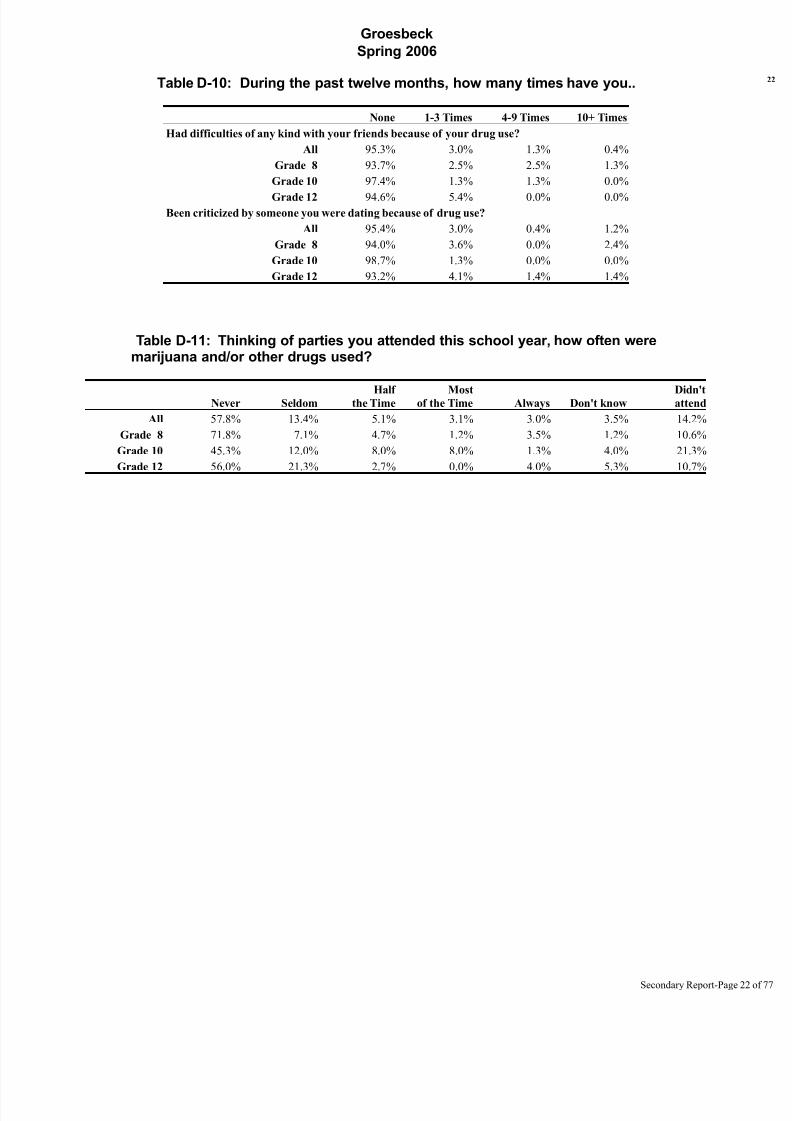
Table D-10: During the past twelve months, how many times have you..
None 1-3 Times 4-9 Times 10+ Times
Had difficulties of any kind with your friends because of your drug use?
All 95.3% 3.0% 1.3% 0.4%
Grade 8 93.7% 2.5% 2.5% 1.3%
Grade 10 97.4% 1.3% 1.3% 0.0%
Grade 12 94.6% 5.4% 0.0% 0.0%Been criticized by someone you were dating because of drug use?
All 95.4% 3.0% 0.4% 1.2%
Grade 8 94.0% 3.6% 0.0% 2.4%
Grade 10 98.7% 1.3% 0.0% 0.0%
Grade 12 93.2% 4.1% 1.4% 1.4%
Table D-11: Thinking of parties you attended this school year, how often weremarijuana and/or other drugs used?
Never SeldomHalf
the TimeMost
of the Time Always Don't knowDidn'tattend
All 57.8% 13.4% 5.1% 3.1% 3.0% 3.5% 14.2%
Grade 8 71.8% 7.1% 4.7% 1.2% 3.5% 1.2% 10.6%
Grade 10 45.3% 12.0% 8.0% 8.0% 1.3% 4.0% 21.3%
Grade 12 56.0% 21.3% 2.7% 0.0% 4.0% 5.3% 10.7%
Secondary Report-Page
8/14/2019 LIMESTONE COUNTY - Groesbeck ISD - 2006 Texas School Survey of Drug and Alcohol Use
http://slidepdf.com/reader/full/limestone-county-groesbeck-isd-2006-texas-school-survey-of-drug-and-alcohol 23/77
Groesbeck
Spring 2006
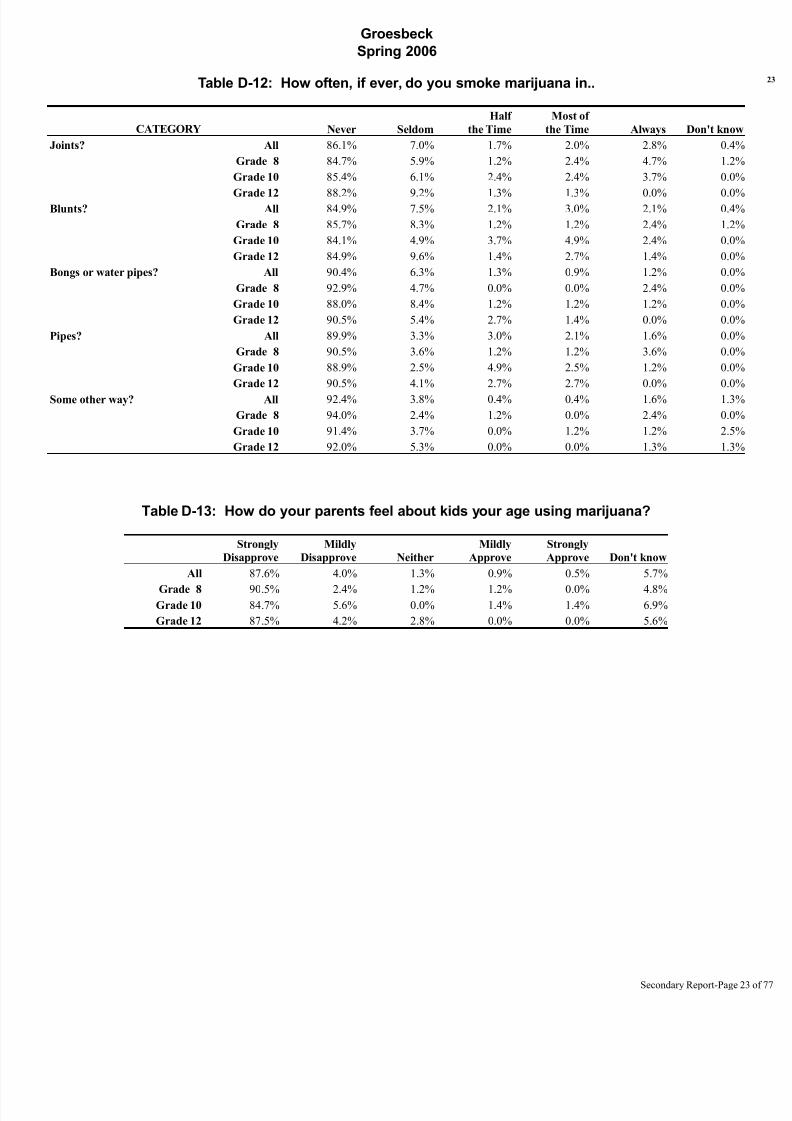
Table D-12: How often, if ever, do you smoke marijuana in..
CATEGORY Never Seldom
Half
the Time
Most of
the Time Always Don't know
Joints? All 86.1% 7.0% 1.7% 2.0% 2.8% 0.4%
Grade 8 84.7% 5.9% 1.2% 2.4% 4.7% 1.2%
Grade 10 85.4% 6.1% 2.4% 2.4% 3.7% 0.0%
Grade 12 88.2% 9.2% 1.3% 1.3% 0.0% 0.0%Blunts? All 84.9% 7.5% 2.1% 3.0% 2.1% 0.4%
Grade 8 85.7% 8.3% 1.2% 1.2% 2.4% 1.2%
Grade 10 84.1% 4.9% 3.7% 4.9% 2.4% 0.0%
Grade 12 84.9% 9.6% 1.4% 2.7% 1.4% 0.0%
Bongs or water pipes? All 90.4% 6.3% 1.3% 0.9% 1.2% 0.0%
Grade 8 92.9% 4.7% 0.0% 0.0% 2.4% 0.0%
Grade 10 88.0% 8.4% 1.2% 1.2% 1.2% 0.0%
Grade 12 90.5% 5.4% 2.7% 1.4% 0.0% 0.0%
Pipes? All 89.9% 3.3% 3.0% 2.1% 1.6% 0.0%
Grade 8 90.5% 3.6% 1.2% 1.2% 3.6% 0.0%
Grade 10 88.9% 2.5% 4.9% 2.5% 1.2% 0.0%
Grade 12 90.5% 4.1% 2.7% 2.7% 0.0% 0.0%
Some other way? All 92.4% 3.8% 0.4% 0.4% 1.6% 1.3%
Grade 8 94.0% 2.4% 1.2% 0.0% 2.4% 0.0%
Grade 10 91.4% 3.7% 0.0% 1.2% 1.2% 2.5%
Grade 12 92.0% 5.3% 0.0% 0.0% 1.3% 1.3%
Table D-13: How do your parents feel about kids your age using marijuana?
Strongly
Disapprove
Mildly
Disapprove Neither
Mildly
Approve
Strongly
Approve Don't know
All 87.6% 4.0% 1.3% 0.9% 0.5% 5.7%
Grade 8 90.5% 2.4% 1.2% 1.2% 0.0% 4.8%Grade 10 84.7% 5.6% 0.0% 1.4% 1.4% 6.9%
Grade 12 87.5% 4.2% 2.8% 0.0% 0.0% 5.6%
Secondary Report-Page

8/14/2019 LIMESTONE COUNTY - Groesbeck ISD - 2006 Texas School Survey of Drug and Alcohol Use
http://slidepdf.com/reader/full/limestone-county-groesbeck-isd-2006-texas-school-survey-of-drug-and-alcohol 24/77
Groesbeck
Spring 2006
Table D-14: How dangerous do you think it is for kids your age to use...
Very
Dangerous
Somewhat
Dangerous
Not very
Dangerous
Not at All
Dangerous Do Not Know
Marijuana?
All 69.6% 13.8% 7.1% 3.1% 6.4%
Grade 8 83.3% 9.0% 5.1% 2.6% 0.0%
Grade 10 68.4% 13.2% 7.9% 3.9% 6.6%Grade 12 57.5% 19.2% 8.2% 2.7% 12.3%
Cocaine?
All 85.6% 7.2% 0.5% 0.0% 6.8%
Grade 8 95.0% 3.8% 0.0% 0.0% 1.3%
Grade 10 87.3% 7.6% 0.0% 0.0% 5.1%
Grade 12 73.5% 10.3% 1.5% 0.0% 14.7%
Crack?
All 87.3% 5.6% 0.4% 0.0% 6.6%
Grade 8 95.2% 3.6% 0.0% 0.0% 1.2%
Grade 10 87.3% 7.6% 0.0% 0.0% 5.1%
Grade 12 79.2% 5.6% 1.4% 0.0% 13.9%
Ecstasy?
All 86.4% 5.6% 0.9% 0.0% 7.1%
Grade 8 93.9% 4.9% 0.0% 0.0% 1.2%
Grade 10 87.3% 5.1% 1.3% 0.0% 6.3%
Grade 12 77.8% 6.9% 1.4% 0.0% 13.9%
Steroids?
All 79.7% 10.9% 2.9% 0.4% 6.0%
Grade 8 87.1% 8.2% 2.4% 1.2% 1.2%
Grade 10 77.8% 16.0% 2.5% 0.0% 3.7%
Grade 12 74.3% 8.1% 4.1% 0.0% 13.5%
Heroin?
All 87.5% 4.2% 0.0% 0.0% 8.4%
Grade 8 95.3% 2.3% 0.0% 0.0% 2.3%
Grade 10 86.6% 7.3% 0.0% 0.0% 6.1%Grade 12 80.5% 2.6% 0.0% 0.0% 16.9%
Secondary Report-Page
8/14/2019 LIMESTONE COUNTY - Groesbeck ISD - 2006 Texas School Survey of Drug and Alcohol Use
http://slidepdf.com/reader/full/limestone-county-groesbeck-isd-2006-texas-school-survey-of-drug-and-alcohol 25/77

8/14/2019 LIMESTONE COUNTY - Groesbeck ISD - 2006 Texas School Survey of Drug and Alcohol Use
http://slidepdf.com/reader/full/limestone-county-groesbeck-isd-2006-texas-school-survey-of-drug-and-alcohol 26/77
Groesbeck
Spring 2006
Table I-1: How recently, if ever, have you used...
Past
Month
School
Year
Ever
Used
Never
Used
Any inhalant?
All 3.1% 7.2% 16.4% 83.6%
Grade 8 3.2% 9.6% 20.2% 79.8%
Grade 10 1.2% 3.7% 18.3% 81.7%Grade 12 4.8% 8.3% 10.7% 89.3%
Liquid or spray paint?
All 0.0% 0.8% 4.9% 95.1%
Grade 8 0.0% 2.1% 5.3% 94.7%
Grade 10 0.0% 0.0% 5.6% 94.4%
Grade 12 0.0% 0.0% 3.8% 96.2%
Whiteout, correction fld?
All 1.2% 1.9% 7.2% 92.8%
Grade 8 2.1% 4.3% 10.6% 89.4%
Grade 10 0.0% 0.0% 7.0% 93.0%
Grade 12 1.3% 1.3% 3.8% 96.3%
Gasoline?
All 0.4% 0.8% 3.7% 96.3%
Grade 8 1.1% 1.1% 3.2% 96.8%
Grade 10 0.0% 1.4% 4.3% 95.7%
Grade 12 0.0% 0.0% 3.8% 96.2%
Freon?
All 0.9% 1.2% 2.1% 97.9%
Grade 8 0.0% 1.1% 1.1% 98.9%
Grade 10 0.0% 0.0% 1.4% 98.6%
Grade 12 2.5% 2.5% 3.8% 96.2%
Poppers, Locker Room?
All 0.4% 0.4% 0.8% 99.2%
Grade 8 1.1% 1.5% 1.5% 98.5%
Grade 10 0.0% 1.5% 1.5% 98.5%Grade 12 0.0% 1.5% 2.8% 97.2%
Glue?
All 0.4% 0.8% 1.6% 98.4%
Grade 8 1.1% 2.2% 2.2% 97.8%
Grade 10 0.0% 0.0% 1.3% 98.7%
Grade 12 0.0% 0.0% 1.3% 98.7%
Paint,lacquer thinner?
All 0.4% 1.6% 4.8% 95.2%
Grade 8 0.0% 2.2% 5.4% 94.6%
Grade 10 0.0% 0.0% 5.3% 94.7%
Grade 12 1.3% 2.5% 3.8% 96.2%
Nitrous oxide?All 0.8% 2.4% 4.7% 95.3%
Grade 8 1.1% 2.2% 4.3% 95.7%
Grade 10 0.0% 0.0% 2.5% 97.5%
Grade 12 1.2% 4.9% 7.4% 92.6%
Secondary Report-Page
8/14/2019 LIMESTONE COUNTY - Groesbeck ISD - 2006 Texas School Survey of Drug and Alcohol Use
http://slidepdf.com/reader/full/limestone-county-groesbeck-isd-2006-texas-school-survey-of-drug-and-alcohol 27/77
Groesbeck
Spring 2006
Table I-1: How recently, if ever, have you used...(Continued)
Past
Month
School
Year
Ever
Used
Never
Used
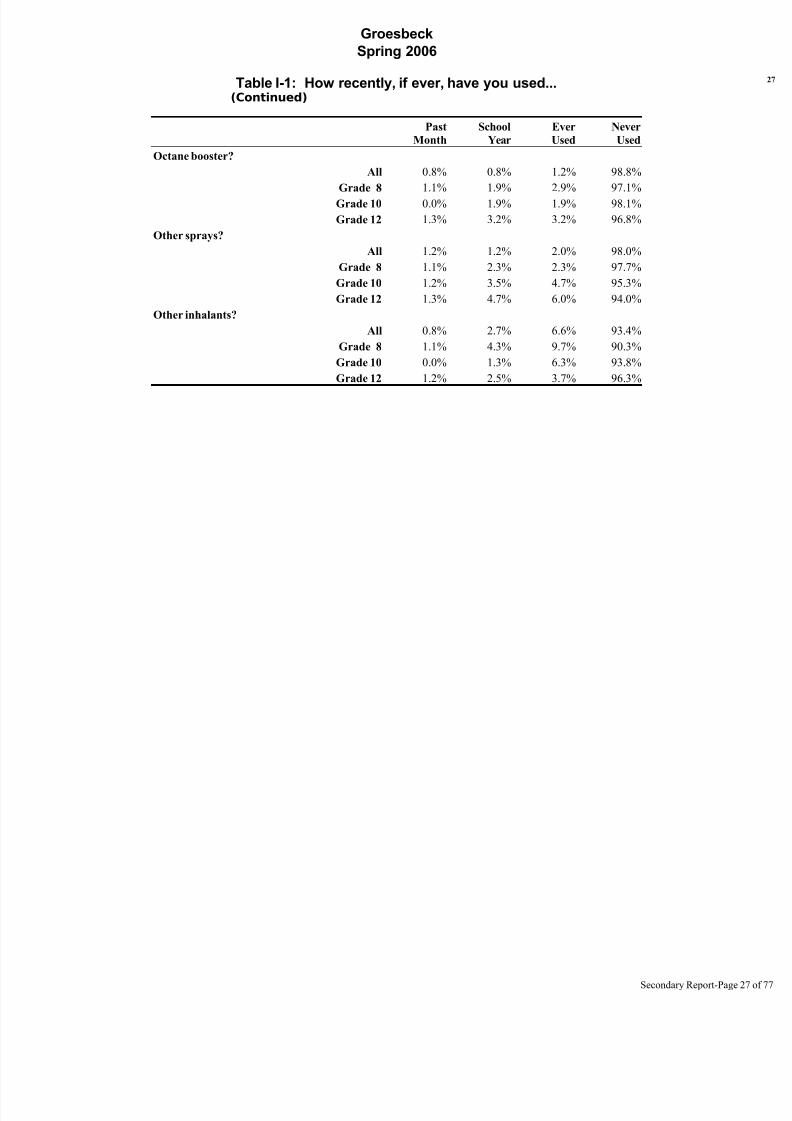
Octane booster?
All 0.8% 0.8% 1.2% 98.8%
Grade 8 1.1% 1.9% 2.9% 97.1%
Grade 10 0.0% 1.9% 1.9% 98.1%
Grade 12 1.3% 3.2% 3.2% 96.8%
Other sprays?
All 1.2% 1.2% 2.0% 98.0%
Grade 8 1.1% 2.3% 2.3% 97.7%
Grade 10 1.2% 3.5% 4.7% 95.3%
Grade 12 1.3% 4.7% 6.0% 94.0%
Other inhalants?
All 0.8% 2.7% 6.6% 93.4%
Grade 8 1.1% 4.3% 9.7% 90.3%
Grade 10 0.0% 1.3% 6.3% 93.8%
Grade 12 1.2% 2.5% 3.7% 96.3%
Secondary Report-Page

8/14/2019 LIMESTONE COUNTY - Groesbeck ISD - 2006 Texas School Survey of Drug and Alcohol Use
http://slidepdf.com/reader/full/limestone-county-groesbeck-isd-2006-texas-school-survey-of-drug-and-alcohol 28/77
Groesbeck
Spring 2006
Table I-2: How often do you normally use inhalants?
Never
Used
Every
Day
Several
Times a
Week
Several
Times a
Month
About
Once a
Month
About
Once a
Year
Less than
Once a
Year
All 91.1% 0.0% 0.4% 0.8% 0.0% 1.3% 6.4%
Grade 8 83.7% 0.0% 1.2% 2.3% 0.0% 2.3% 10.5%Grade 10 91.5% 0.0% 0.0% 0.0% 0.0% 0.0% 8.5%
Grade 12 98.6% 0.0% 0.0% 0.0% 0.0% 1.4% 0.0%
I-3: Number of different kinds of inhalants used
None One Two to Three Four Plus
All 86.0% 7.1% 4.9% 1.9%
Grade 8 83.0% 9.6% 5.3% 2.1%
Grade 10 85.7% 7.1% 6.0% 1.2%
Grade 12 89.4% 4.7% 3.5% 2.4%
Table I-4: Average age of first use of:
Grade 8 Grade 10 Grade 12
Inhalants
11.9 11.7 *
Table I-5: Since school began in the fall, on how many days (if any) have youattended class while high from inhalant use?
None 1-3 Times 4-9 Times 10+ Times
All 98.3% 1.3% 0.4% 0.0%
Grade 8 96.4% 2.4% 1.2% 0.0%
Grade 10 100.0% 0.0% 0.0% 0.0%
Grade 12 98.6% 1.4% 0.0% 0.0%
Secondary Report-Page
8/14/2019 LIMESTONE COUNTY - Groesbeck ISD - 2006 Texas School Survey of Drug and Alcohol Use
http://slidepdf.com/reader/full/limestone-county-groesbeck-isd-2006-texas-school-survey-of-drug-and-alcohol 29/77
Groesbeck
Spring 2006
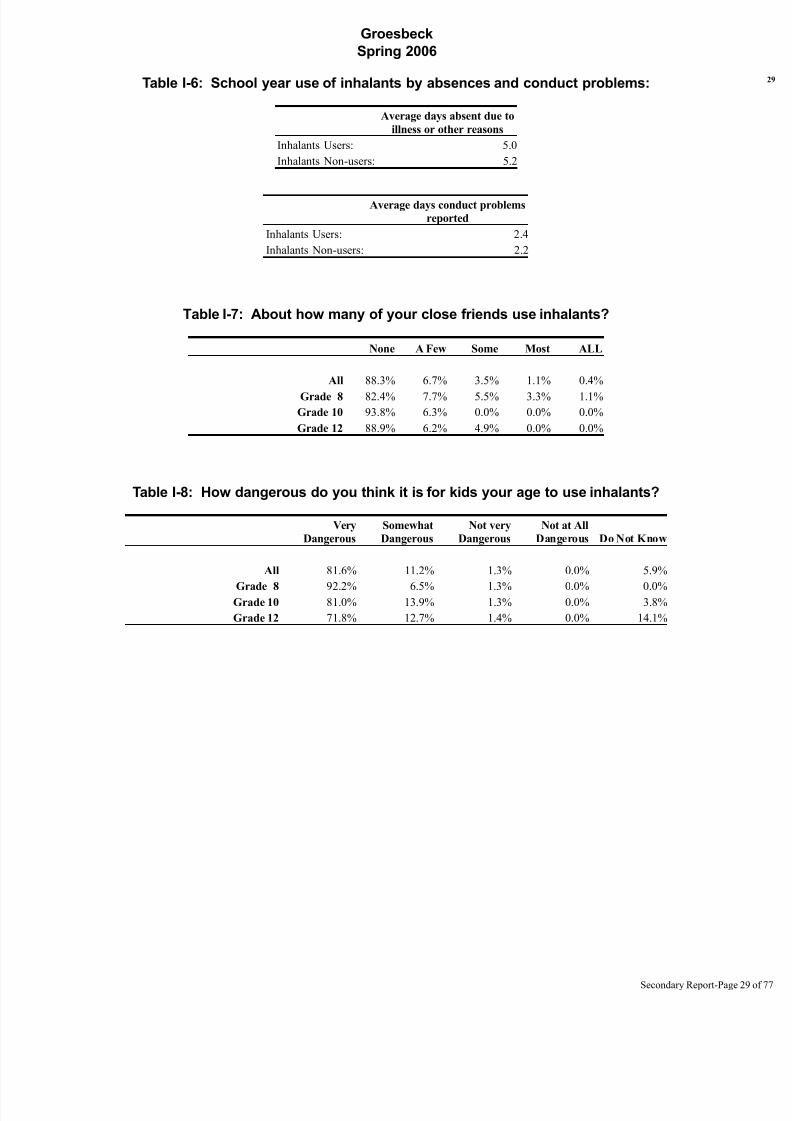
Table I-6: School year use of inhalants by absences and conduct problems:
Average days absent due to
illness or other reasons
Inhalants Users: 5.0
Inhalants Non-users: 5.2
Average days conduct problems
reported
Inhalants Users: 2.4
Inhalants Non-users: 2.2
Table I-7: About how many of your close friends use inhalants?
None A Few Some Most ALL
All 88.3% 6.7% 3.5% 1.1% 0.4%
Grade 8 82.4% 7.7% 5.5% 3.3% 1.1%
Grade 10 93.8% 6.3% 0.0% 0.0% 0.0%
Grade 12 88.9% 6.2% 4.9% 0.0% 0.0%
Table I-8: How dangerous do you think it is for kids your age to use inhalants?
Very
Dangerous
Somewhat
Dangerous
Not very
Dangerous
Not at All
Dangerous Do Not Know
All 81.6% 11.2% 1.3% 0.0% 5.9%
Grade 8 92.2% 6.5% 1.3% 0.0% 0.0%Grade 10 81.0% 13.9% 1.3% 0.0% 3.8%
Grade 12 71.8% 12.7% 1.4% 0.0% 14.1%
Secondary Report-Page

8/14/2019 LIMESTONE COUNTY - Groesbeck ISD - 2006 Texas School Survey of Drug and Alcohol Use
http://slidepdf.com/reader/full/limestone-county-groesbeck-isd-2006-texas-school-survey-of-drug-and-alcohol 30/77
8/14/2019 LIMESTONE COUNTY - Groesbeck ISD - 2006 Texas School Survey of Drug and Alcohol Use
http://slidepdf.com/reader/full/limestone-county-groesbeck-isd-2006-texas-school-survey-of-drug-and-alcohol 31/77
Groesbeck
Spring 2006
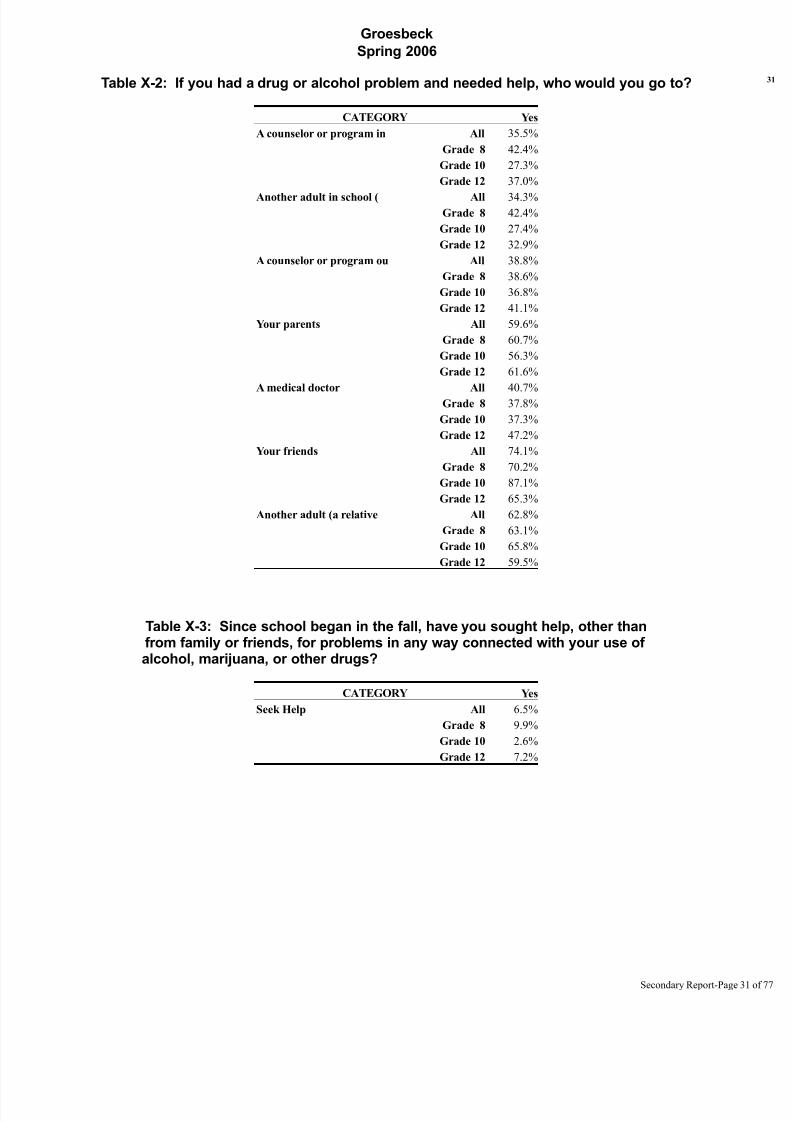
Table X-2: If you had a drug or alcohol problem and needed help, who would you go to?
CATEGORY Yes
A counselor or program in All 35.5%
Grade 8 42.4%
Grade 10 27.3%
Grade 12 37.0%
Another adult in school ( All 34.3%Grade 8 42.4%
Grade 10 27.4%
Grade 12 32.9%
A counselor or program ou All 38.8%
Grade 8 38.6%
Grade 10 36.8%
Grade 12 41.1%
Your parents All 59.6%
Grade 8 60.7%
Grade 10 56.3%
Grade 12 61.6%
A medical doctor All 40.7%Grade 8 37.8%
Grade 10 37.3%
Grade 12 47.2%
Your friends All 74.1%
Grade 8 70.2%
Grade 10 87.1%
Grade 12 65.3%
Another adult (a relative All 62.8%
Grade 8 63.1%
Grade 10 65.8%
Grade 12 59.5%
Table X-3: Since school began in the fall, have you sought help, other thanfrom family or friends, for problems in any way connected with your use of alcohol, marijuana, or other drugs?
CATEGORY Yes
Seek Help All 6.5%
Grade 8 9.9%
Grade 10 2.6%
Grade 12 7.2%
Secondary Report-Page

8/14/2019 LIMESTONE COUNTY - Groesbeck ISD - 2006 Texas School Survey of Drug and Alcohol Use
http://slidepdf.com/reader/full/limestone-county-groesbeck-isd-2006-texas-school-survey-of-drug-and-alcohol 32/77
Groesbeck
Spring 2006
Table X-4: About how many of your friends:
None A Few Some Most ALL
Feel close to their parents?
All 3.4% 27.0% 23.2% 37.4% 9.1%
Grade 8 5.3% 25.5% 20.2% 36.2% 12.8%
Grade 10 2.4% 25.3% 28.9% 39.8% 3.6%
Grade 12 2.4% 30.1% 20.5% 36.1% 10.8%Sometimes carry weapons?
All 38.1% 28.7% 17.0% 13.0% 3.1%
Grade 8 57.4% 22.3% 13.8% 5.3% 1.1%
Grade 10 30.5% 32.9% 19.5% 14.6% 2.4%
Grade 12 26.2% 31.0% 17.9% 19.0% 6.0%
Care about making good grades?
All 2.8% 12.4% 22.7% 43.1% 19.0%
Grade 8 1.1% 15.4% 20.9% 39.6% 23.1%
Grade 10 3.7% 11.0% 9.8% 54.9% 20.7%
Grade 12 3.6% 10.8% 37.3% 34.9% 13.3%
Belong/want to belong to a gang?
All 83.8% 8.6% 3.1% 2.3% 2.2%Grade 8 75.5% 13.8% 3.2% 3.2% 4.3%
Grade 10 83.1% 9.6% 2.4% 3.6% 1.2%
Grade 12 92.9% 2.4% 3.6% 0.0% 1.2%
Wish they could drop out of school?
All 64.0% 26.4% 6.5% 2.3% 0.8%
Grade 8 55.9% 33.3% 7.5% 2.2% 1.1%
Grade 10 66.3% 25.3% 6.0% 2.4% 0.0%
Grade 12 69.9% 20.5% 6.0% 2.4% 1.2%
Secondary Report-Page

8/14/2019 LIMESTONE COUNTY - Groesbeck ISD - 2006 Texas School Survey of Drug and Alcohol Use
http://slidepdf.com/reader/full/limestone-county-groesbeck-isd-2006-texas-school-survey-of-drug-and-alcohol 33/77
Groesbeck
Spring 2006
Table X-5: How safe do you feel when you are:
Very Safe
Somewha
t Safe
Not Very
Safe
Not Safe
at All
Don't
Know
In your home?
All 79.7% 18.7% 0.8% 0.0% 0.8%
Grade 8 78.7% 20.2% 1.1% 0.0% 0.0%
Grade 10 75.6% 22.0% 1.2% 0.0% 1.2%Grade 12 84.7% 14.1% 0.0% 0.0% 1.2%
Out in your neighbourhood
All 51.5% 41.9% 3.0% 1.2% 2.4%
Grade 8 46.8% 47.9% 4.3% 1.1% 0.0%
Grade 10 50.6% 41.0% 1.2% 1.2% 6.0%
Grade 12 57.1% 36.9% 3.6% 1.2% 1.2%
At school
All 46.4% 40.6% 6.0% 3.9% 3.1%
Grade 8 44.7% 51.1% 0.0% 2.1% 2.1%
Grade 10 43.9% 39.0% 9.8% 3.7% 3.7%
Grade 12 50.6% 31.8% 8.2% 5.9% 3.5%
Table X-6: Since school began in the fall, have you gotten any informationon drugs or alcohol from the following sources?
CATEGORY Yes
A website or online chat All 36.1%
Grade 8 39.8%
Grade 10 46.4%
Grade 12 22.2%
Books, magazines, poster All 54.7%
Grade 8 62.2%
Grade 10 52.2%
Grade 12 49.3%
TV, radio, or other audi All 58.4%
Grade 8 67.9%
Grade 10 60.3%
Grade 12 46.5%
Your parents All 52.2%
Grade 8 63.9%
Grade 10 52.8%
Grade 12 39.4%
Secondary Report-Page
8/14/2019 LIMESTONE COUNTY - Groesbeck ISD - 2006 Texas School Survey of Drug and Alcohol Use
http://slidepdf.com/reader/full/limestone-county-groesbeck-isd-2006-texas-school-survey-of-drug-and-alcohol 34/77
Groesbeck
Spring 2006
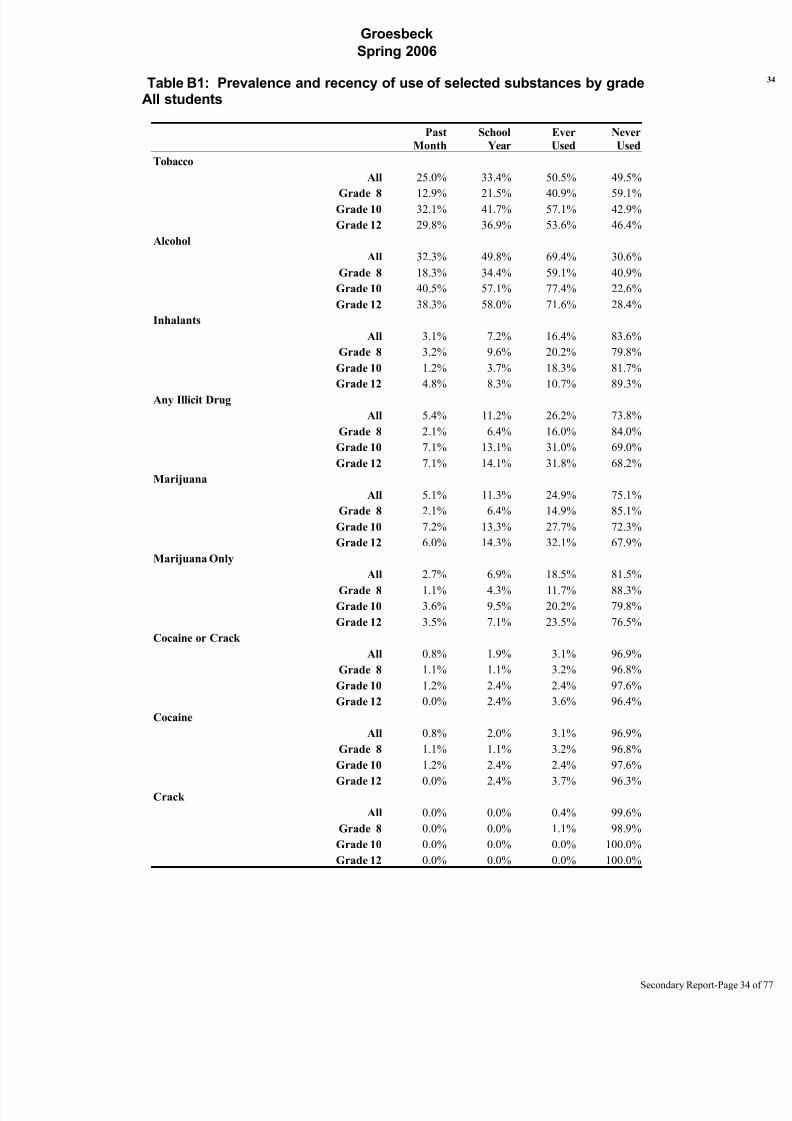
Table B1: Prevalence and recency of use of selected substances by gradeAll students
Past
Month
School
Year
Ever
Used
Never
Used
Tobacco
All 25.0% 33.4% 50.5% 49.5%
Grade 8 12.9% 21.5% 40.9% 59.1%Grade 10 32.1% 41.7% 57.1% 42.9%
Grade 12 29.8% 36.9% 53.6% 46.4%
Alcohol
All 32.3% 49.8% 69.4% 30.6%
Grade 8 18.3% 34.4% 59.1% 40.9%
Grade 10 40.5% 57.1% 77.4% 22.6%
Grade 12 38.3% 58.0% 71.6% 28.4%
Inhalants
All 3.1% 7.2% 16.4% 83.6%
Grade 8 3.2% 9.6% 20.2% 79.8%
Grade 10 1.2% 3.7% 18.3% 81.7%
Grade 12 4.8% 8.3% 10.7% 89.3%
Any Illicit Drug
All 5.4% 11.2% 26.2% 73.8%
Grade 8 2.1% 6.4% 16.0% 84.0%
Grade 10 7.1% 13.1% 31.0% 69.0%
Grade 12 7.1% 14.1% 31.8% 68.2%
Marijuana
All 5.1% 11.3% 24.9% 75.1%
Grade 8 2.1% 6.4% 14.9% 85.1%
Grade 10 7.2% 13.3% 27.7% 72.3%
Grade 12 6.0% 14.3% 32.1% 67.9%
Marijuana Only
All 2.7% 6.9% 18.5% 81.5%
Grade 8 1.1% 4.3% 11.7% 88.3%Grade 10 3.6% 9.5% 20.2% 79.8%
Grade 12 3.5% 7.1% 23.5% 76.5%
Cocaine or Crack
All 0.8% 1.9% 3.1% 96.9%
Grade 8 1.1% 1.1% 3.2% 96.8%
Grade 10 1.2% 2.4% 2.4% 97.6%
Grade 12 0.0% 2.4% 3.6% 96.4%
Cocaine
All 0.8% 2.0% 3.1% 96.9%
Grade 8 1.1% 1.1% 3.2% 96.8%
Grade 10 1.2% 2.4% 2.4% 97.6%
Grade 12 0.0% 2.4% 3.7% 96.3%Crack
All 0.0% 0.0% 0.4% 99.6%
Grade 8 0.0% 0.0% 1.1% 98.9%
Grade 10 0.0% 0.0% 0.0% 100.0%
Grade 12 0.0% 0.0% 0.0% 100.0%
Secondary Report-Page
8/14/2019 LIMESTONE COUNTY - Groesbeck ISD - 2006 Texas School Survey of Drug and Alcohol Use
http://slidepdf.com/reader/full/limestone-county-groesbeck-isd-2006-texas-school-survey-of-drug-and-alcohol 35/77
Groesbeck
Spring 2006
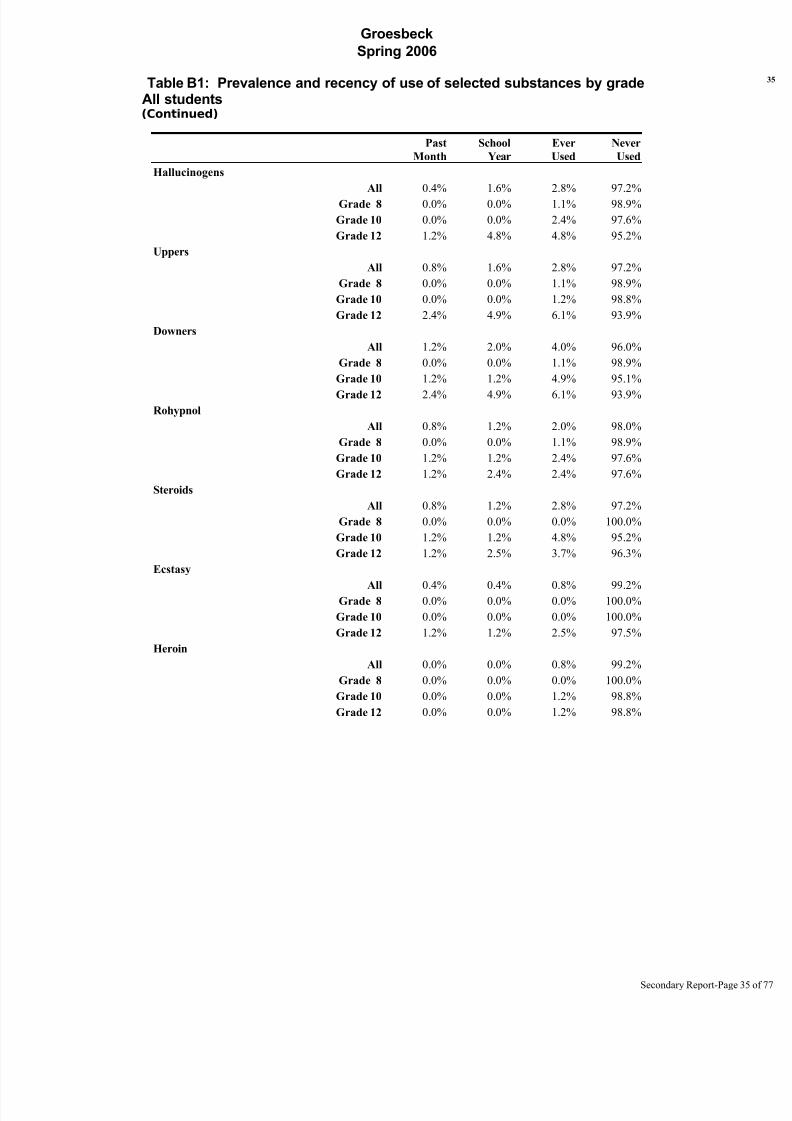
Table B1: Prevalence and recency of use of selected substances by gradeAll students(Continued)
Past
Month
School
Year
Ever
Used
Never
Used
Hallucinogens
All 0.4% 1.6% 2.8% 97.2%
Grade 8 0.0% 0.0% 1.1% 98.9%
Grade 10 0.0% 0.0% 2.4% 97.6%
Grade 12 1.2% 4.8% 4.8% 95.2%
Uppers
All 0.8% 1.6% 2.8% 97.2%
Grade 8 0.0% 0.0% 1.1% 98.9%
Grade 10 0.0% 0.0% 1.2% 98.8%
Grade 12 2.4% 4.9% 6.1% 93.9%
Downers
All 1.2% 2.0% 4.0% 96.0%
Grade 8 0.0% 0.0% 1.1% 98.9%
Grade 10 1.2% 1.2% 4.9% 95.1%
Grade 12 2.4% 4.9% 6.1% 93.9%Rohypnol
All 0.8% 1.2% 2.0% 98.0%
Grade 8 0.0% 0.0% 1.1% 98.9%
Grade 10 1.2% 1.2% 2.4% 97.6%
Grade 12 1.2% 2.4% 2.4% 97.6%
Steroids
All 0.8% 1.2% 2.8% 97.2%
Grade 8 0.0% 0.0% 0.0% 100.0%
Grade 10 1.2% 1.2% 4.8% 95.2%
Grade 12 1.2% 2.5% 3.7% 96.3%
Ecstasy
All 0.4% 0.4% 0.8% 99.2%Grade 8 0.0% 0.0% 0.0% 100.0%
Grade 10 0.0% 0.0% 0.0% 100.0%
Grade 12 1.2% 1.2% 2.5% 97.5%
Heroin
All 0.0% 0.0% 0.8% 99.2%
Grade 8 0.0% 0.0% 0.0% 100.0%
Grade 10 0.0% 0.0% 1.2% 98.8%
Grade 12 0.0% 0.0% 1.2% 98.8%
Secondary Report-Page

8/14/2019 LIMESTONE COUNTY - Groesbeck ISD - 2006 Texas School Survey of Drug and Alcohol Use
http://slidepdf.com/reader/full/limestone-county-groesbeck-isd-2006-texas-school-survey-of-drug-and-alcohol 36/77
Groesbeck
Spring 2006
Table B2: Prevalence and recency of use of selected substances by gradeMale students
Past
Month
School
Year
Ever
Used
Never
Used
Tobacco
All 32.1% 41.1% 58.7% 41.3%
Grade 8 14.0% 18.6% 41.9% 58.1%Grade 10 51.3% 61.5% 69.2% 30.8%
Grade 12 31.0% 42.9% 64.3% 35.7%
Alcohol
All 37.7% 51.8% 66.2% 33.8%
Grade 8 16.3% 25.6% 48.8% 51.2%
Grade 10 53.8% 71.8% 76.9% 23.1%
Grade 12 42.5% 57.5% 72.5% 27.5%
Inhalants
All 3.3% 5.8% 15.8% 84.2%
Grade 8 2.3% 2.3% 7.0% 93.0%
Grade 10 0.0% 2.6% 25.6% 74.4%
Grade 12 7.3% 12.2% 14.6% 85.4%
Any Illicit Drug
All 8.3% 14.8% 24.6% 75.4%
Grade 8 2.3% 7.0% 11.6% 88.4%
Grade 10 10.3% 17.9% 28.2% 71.8%
Grade 12 11.9% 19.0% 33.3% 66.7%
Marijuana
All 7.5% 14.9% 24.0% 76.0%
Grade 8 2.3% 7.0% 11.6% 88.4%
Grade 10 10.5% 18.4% 26.3% 73.7%
Grade 12 9.5% 19.0% 33.3% 66.7%
Marijuana Only
All 3.3% 8.2% 16.4% 83.6%
Grade 8 0.0% 4.7% 9.3% 90.7%Grade 10 5.1% 12.8% 17.9% 82.1%
Grade 12 4.8% 7.1% 21.4% 78.6%
Cocaine or Crack
All 1.6% 3.3% 3.3% 96.7%
Grade 8 2.3% 2.3% 2.3% 97.7%
Grade 10 2.6% 5.1% 5.1% 94.9%
Grade 12 0.0% 2.4% 2.4% 97.6%
Cocaine
All 1.6% 3.4% 3.4% 96.6%
Grade 8 2.4% 2.4% 2.4% 97.6%
Grade 10 2.6% 5.3% 5.3% 94.7%
Grade 12 0.0% 2.5% 2.5% 97.5%Crack
All 0.0% 0.0% 0.0% 100.0%
Grade 8 0.0% 0.0% 0.0% 100.0%
Grade 10 0.0% 0.0% 0.0% 100.0%
Grade 12 0.0% 0.0% 0.0% 100.0%
Secondary Report-Page

8/14/2019 LIMESTONE COUNTY - Groesbeck ISD - 2006 Texas School Survey of Drug and Alcohol Use
http://slidepdf.com/reader/full/limestone-county-groesbeck-isd-2006-texas-school-survey-of-drug-and-alcohol 37/77
Groesbeck
Spring 2006
Table B2: Prevalence and recency of use of selected substances by gradeMale students(Continued)
Past
Month
School
Year
Ever
Used
Never
Used
Hallucinogens
All 0.9% 3.4% 5.1% 94.9%
Grade 8 0.0% 0.0% 0.0% 100.0%
Grade 10 0.0% 0.0% 5.3% 94.7%
Grade 12 2.4% 9.8% 9.8% 90.2%
Uppers
All 1.7% 2.6% 2.6% 97.4%
Grade 8 0.0% 0.0% 0.0% 100.0%
Grade 10 0.0% 0.0% 0.0% 100.0%
Grade 12 5.0% 7.5% 7.5% 92.5%
Downers
All 2.6% 3.4% 4.3% 95.7%
Grade 8 0.0% 0.0% 0.0% 100.0%
Grade 10 2.6% 2.6% 5.3% 94.7%
Grade 12 4.9% 7.3% 7.3% 92.7%Rohypnol
All 0.8% 1.7% 1.7% 98.3%
Grade 8 0.0% 0.0% 0.0% 100.0%
Grade 10 0.0% 0.0% 0.0% 100.0%
Grade 12 2.4% 4.9% 4.9% 95.1%
Steroids
All 1.7% 2.6% 5.1% 94.9%
Grade 8 0.0% 0.0% 0.0% 100.0%
Grade 10 2.6% 2.6% 7.9% 92.1%
Grade 12 2.4% 4.9% 7.3% 92.7%
Ecstasy
All 0.9% 0.9% 0.9% 99.1%Grade 8 0.0% 0.0% 0.0% 100.0%
Grade 10 0.0% 0.0% 0.0% 100.0%
Grade 12 2.5% 2.5% 2.5% 97.5%
Heroin
All 0.0% 0.0% 0.9% 99.1%
Grade 8 0.0% 0.0% 0.0% 100.0%
Grade 10 0.0% 0.0% 0.0% 100.0%
Grade 12 0.0% 0.0% 2.4% 97.6%
Secondary Report-Page
8/14/2019 LIMESTONE COUNTY - Groesbeck ISD - 2006 Texas School Survey of Drug and Alcohol Use
http://slidepdf.com/reader/full/limestone-county-groesbeck-isd-2006-texas-school-survey-of-drug-and-alcohol 38/77
Groesbeck
Spring 2006
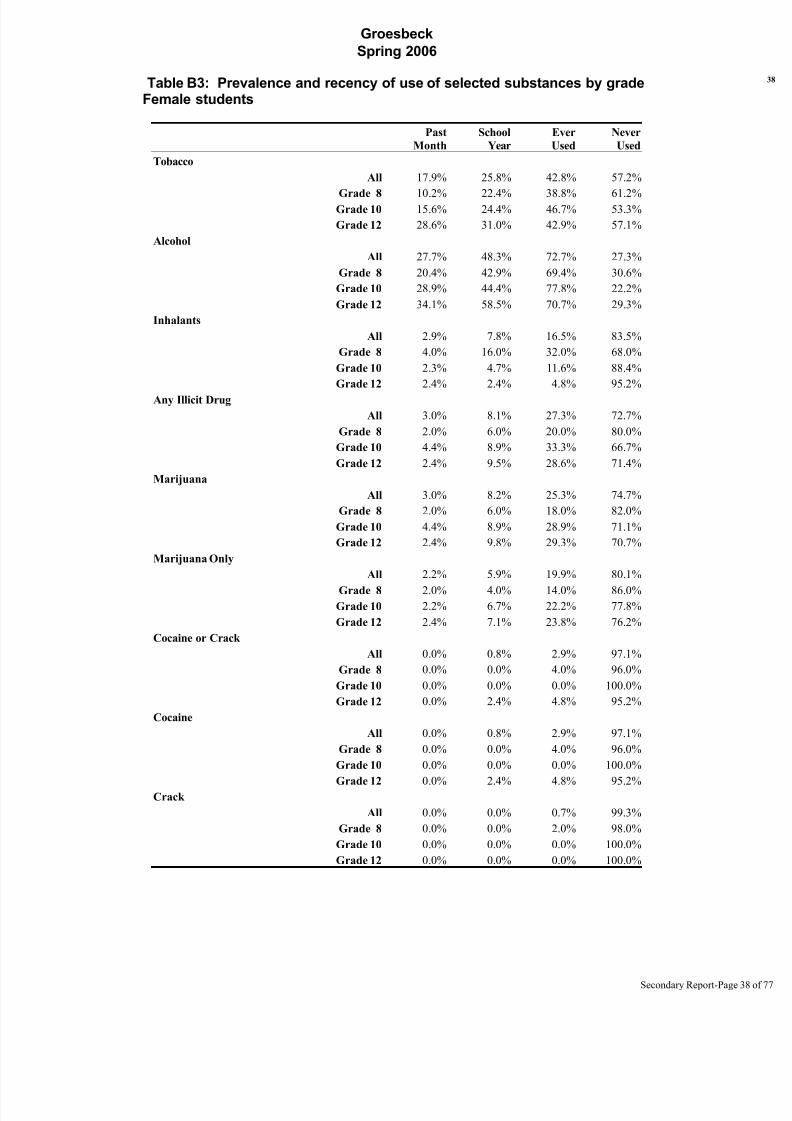
Table B3: Prevalence and recency of use of selected substances by gradeFemale students
Past
Month
School
Year
Ever
Used
Never
Used
Tobacco
All 17.9% 25.8% 42.8% 57.2%
Grade 8 10.2% 22.4% 38.8% 61.2%Grade 10 15.6% 24.4% 46.7% 53.3%
Grade 12 28.6% 31.0% 42.9% 57.1%
Alcohol
All 27.7% 48.3% 72.7% 27.3%
Grade 8 20.4% 42.9% 69.4% 30.6%
Grade 10 28.9% 44.4% 77.8% 22.2%
Grade 12 34.1% 58.5% 70.7% 29.3%
Inhalants
All 2.9% 7.8% 16.5% 83.5%
Grade 8 4.0% 16.0% 32.0% 68.0%
Grade 10 2.3% 4.7% 11.6% 88.4%
Grade 12 2.4% 2.4% 4.8% 95.2%
Any Illicit Drug
All 3.0% 8.1% 27.3% 72.7%
Grade 8 2.0% 6.0% 20.0% 80.0%
Grade 10 4.4% 8.9% 33.3% 66.7%
Grade 12 2.4% 9.5% 28.6% 71.4%
Marijuana
All 3.0% 8.2% 25.3% 74.7%
Grade 8 2.0% 6.0% 18.0% 82.0%
Grade 10 4.4% 8.9% 28.9% 71.1%
Grade 12 2.4% 9.8% 29.3% 70.7%
Marijuana Only
All 2.2% 5.9% 19.9% 80.1%
Grade 8 2.0% 4.0% 14.0% 86.0%Grade 10 2.2% 6.7% 22.2% 77.8%
Grade 12 2.4% 7.1% 23.8% 76.2%
Cocaine or Crack
All 0.0% 0.8% 2.9% 97.1%
Grade 8 0.0% 0.0% 4.0% 96.0%
Grade 10 0.0% 0.0% 0.0% 100.0%
Grade 12 0.0% 2.4% 4.8% 95.2%
Cocaine
All 0.0% 0.8% 2.9% 97.1%
Grade 8 0.0% 0.0% 4.0% 96.0%
Grade 10 0.0% 0.0% 0.0% 100.0%
Grade 12 0.0% 2.4% 4.8% 95.2%Crack
All 0.0% 0.0% 0.7% 99.3%
Grade 8 0.0% 0.0% 2.0% 98.0%
Grade 10 0.0% 0.0% 0.0% 100.0%
Grade 12 0.0% 0.0% 0.0% 100.0%
Secondary Report-Page

8/14/2019 LIMESTONE COUNTY - Groesbeck ISD - 2006 Texas School Survey of Drug and Alcohol Use
http://slidepdf.com/reader/full/limestone-county-groesbeck-isd-2006-texas-school-survey-of-drug-and-alcohol 39/77
Groesbeck
Spring 2006
Table B3: Prevalence and recency of use of selected substances by gradeFemale students(Continued)
Past
Month
School
Year
Ever
Used
Never
Used
Hallucinogens
All 0.0% 0.0% 0.7% 99.3%
Grade 8 0.0% 0.0% 2.0% 98.0%
Grade 10 0.0% 0.0% 0.0% 100.0%
Grade 12 0.0% 0.0% 0.0% 100.0%
Uppers
All 0.0% 0.8% 3.0% 97.0%
Grade 8 0.0% 0.0% 2.1% 97.9%
Grade 10 0.0% 0.0% 2.3% 97.7%
Grade 12 0.0% 2.4% 4.8% 95.2%
Downers
All 0.0% 0.8% 3.8% 96.2%
Grade 8 0.0% 0.0% 2.1% 97.9%
Grade 10 0.0% 0.0% 4.5% 95.5%
Grade 12 0.0% 2.4% 4.9% 95.1%Rohypnol
All 0.8% 0.8% 2.3% 97.7%
Grade 8 0.0% 0.0% 2.1% 97.9%
Grade 10 2.2% 2.2% 4.4% 95.6%
Grade 12 0.0% 0.0% 0.0% 100.0%
Steroids
All 0.0% 0.0% 0.8% 99.2%
Grade 8 0.0% 0.0% 0.0% 100.0%
Grade 10 0.0% 0.0% 2.2% 97.8%
Grade 12 0.0% 0.0% 0.0% 100.0%
Ecstasy
All 0.0% 0.0% 0.8% 99.2%Grade 8 0.0% 0.0% 0.0% 100.0%
Grade 10 0.0% 0.0% 0.0% 100.0%
Grade 12 0.0% 0.0% 2.4% 97.6%
Heroin
All 0.0% 0.0% 0.8% 99.2%
Grade 8 0.0% 0.0% 0.0% 100.0%
Grade 10 0.0% 0.0% 2.2% 97.8%
Grade 12 0.0% 0.0% 0.0% 100.0%
Secondary Report-Page

8/14/2019 LIMESTONE COUNTY - Groesbeck ISD - 2006 Texas School Survey of Drug and Alcohol Use
http://slidepdf.com/reader/full/limestone-county-groesbeck-isd-2006-texas-school-survey-of-drug-and-alcohol 40/77
Groesbeck
Spring 2006
Table B4: Prevalence and recency of use of selected substances by gradeWhite students
Past
Month
School
Year
Ever
Used
Never
Used
Tobacco
All 24.8% 33.9% 50.5% 49.5%
Grade 8 7.6% 18.2% 36.4% 63.6%Grade 10 35.3% 45.6% 57.4% 42.6%
Grade 12 30.8% 36.5% 57.7% 42.3%
Alcohol
All 35.9% 55.0% 72.8% 27.2%
Grade 8 21.2% 36.4% 57.6% 42.4%
Grade 10 45.6% 64.7% 80.9% 19.1%
Grade 12 40.0% 64.0% 80.0% 20.0%
Inhalants
All 2.2% 6.4% 16.2% 83.8%
Grade 8 1.5% 7.5% 16.4% 83.6%
Grade 10 1.5% 4.5% 19.4% 80.6%
Grade 12 3.9% 7.8% 11.8% 88.2%
Any Illicit Drug
All 6.1% 10.4% 24.0% 76.0%
Grade 8 1.5% 3.0% 11.9% 88.1%
Grade 10 8.8% 13.2% 29.4% 70.6%
Grade 12 7.7% 15.4% 30.8% 69.2%
Marijuana
All 5.6% 10.5% 22.6% 77.4%
Grade 8 1.5% 3.0% 10.4% 89.6%
Grade 10 9.0% 13.4% 26.9% 73.1%
Grade 12 5.9% 15.7% 31.4% 68.6%
Marijuana Only
All 3.3% 5.5% 15.8% 84.2%
Grade 8 1.5% 1.5% 9.0% 91.0%Grade 10 4.4% 8.8% 19.1% 80.9%
Grade 12 3.8% 5.8% 19.2% 80.8%
Cocaine or Crack
All 0.6% 2.2% 3.3% 96.7%
Grade 8 0.0% 0.0% 1.5% 98.5%
Grade 10 1.5% 3.0% 3.0% 97.0%
Grade 12 0.0% 3.9% 5.9% 94.1%
Cocaine
All 0.6% 2.3% 3.3% 96.7%
Grade 8 0.0% 0.0% 1.5% 98.5%
Grade 10 1.5% 3.0% 3.0% 97.0%
Grade 12 0.0% 3.9% 5.9% 94.1%Crack
All 0.0% 0.0% 0.5% 99.5%
Grade 8 0.0% 0.0% 1.5% 98.5%
Grade 10 0.0% 0.0% 0.0% 100.0%
Grade 12 0.0% 0.0% 0.0% 100.0%
Secondary Report-Page
8/14/2019 LIMESTONE COUNTY - Groesbeck ISD - 2006 Texas School Survey of Drug and Alcohol Use
http://slidepdf.com/reader/full/limestone-county-groesbeck-isd-2006-texas-school-survey-of-drug-and-alcohol 41/77
Groesbeck
Spring 2006
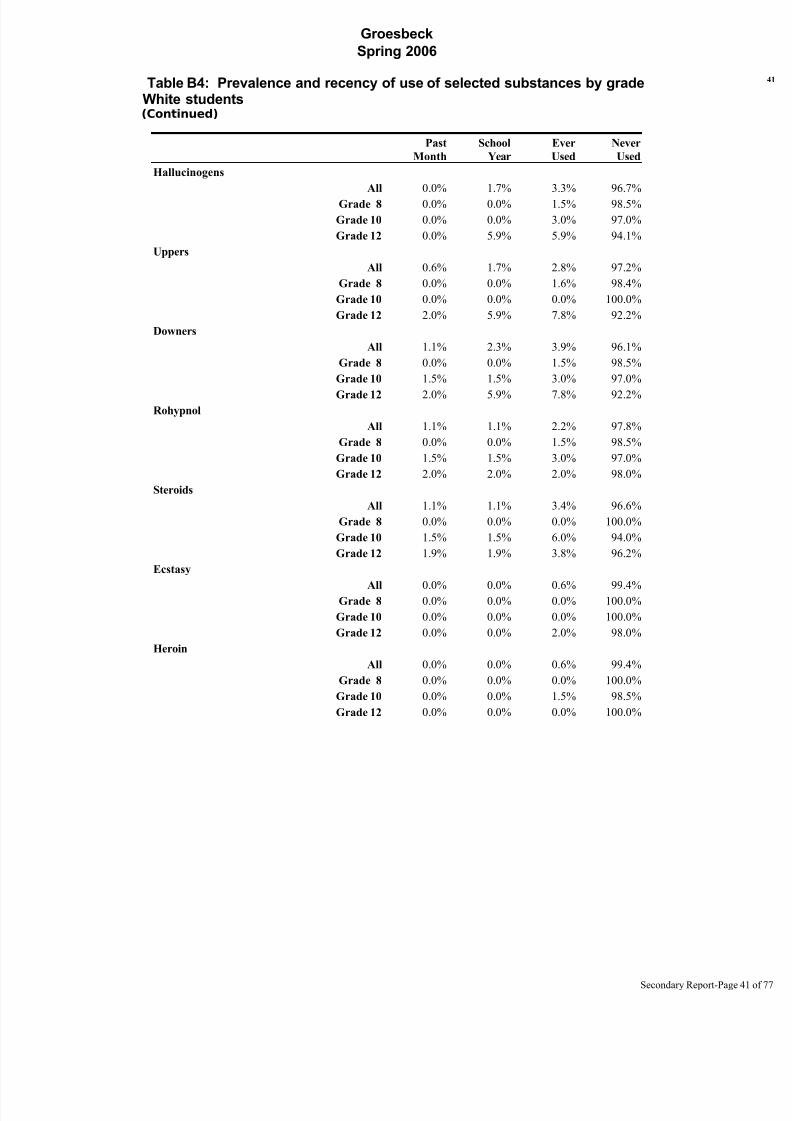
Table B4: Prevalence and recency of use of selected substances by gradeWhite students(Continued)
Past
Month
School
Year
Ever
Used
Never
Used
Hallucinogens
All 0.0% 1.7% 3.3% 96.7%
Grade 8 0.0% 0.0% 1.5% 98.5%
Grade 10 0.0% 0.0% 3.0% 97.0%
Grade 12 0.0% 5.9% 5.9% 94.1%
Uppers
All 0.6% 1.7% 2.8% 97.2%
Grade 8 0.0% 0.0% 1.6% 98.4%
Grade 10 0.0% 0.0% 0.0% 100.0%
Grade 12 2.0% 5.9% 7.8% 92.2%
Downers
All 1.1% 2.3% 3.9% 96.1%
Grade 8 0.0% 0.0% 1.5% 98.5%
Grade 10 1.5% 1.5% 3.0% 97.0%
Grade 12 2.0% 5.9% 7.8% 92.2%Rohypnol
All 1.1% 1.1% 2.2% 97.8%
Grade 8 0.0% 0.0% 1.5% 98.5%
Grade 10 1.5% 1.5% 3.0% 97.0%
Grade 12 2.0% 2.0% 2.0% 98.0%
Steroids
All 1.1% 1.1% 3.4% 96.6%
Grade 8 0.0% 0.0% 0.0% 100.0%
Grade 10 1.5% 1.5% 6.0% 94.0%
Grade 12 1.9% 1.9% 3.8% 96.2%
Ecstasy
All 0.0% 0.0% 0.6% 99.4%Grade 8 0.0% 0.0% 0.0% 100.0%
Grade 10 0.0% 0.0% 0.0% 100.0%
Grade 12 0.0% 0.0% 2.0% 98.0%
Heroin
All 0.0% 0.0% 0.6% 99.4%
Grade 8 0.0% 0.0% 0.0% 100.0%
Grade 10 0.0% 0.0% 1.5% 98.5%
Grade 12 0.0% 0.0% 0.0% 100.0%
Secondary Report-Page

8/14/2019 LIMESTONE COUNTY - Groesbeck ISD - 2006 Texas School Survey of Drug and Alcohol Use
http://slidepdf.com/reader/full/limestone-county-groesbeck-isd-2006-texas-school-survey-of-drug-and-alcohol 42/77
Groesbeck
Spring 2006
Table B5: Prevalence and recency of use of selected substances by gradeBlack students
Past
Month
School
Year
Ever
Used
Never
Used
Tobacco
All 35.9% 42.3% 55.0% 45.0%
Grade 8 25.0% 33.3% 50.0% 50.0%Grade 10 * * * *
Grade 12 42.9% 50.0% 64.3% 35.7%
Alcohol
All 20.5% 33.0% 56.3% 43.7%
Grade 8 8.3% 41.7% 66.7% 33.3%
Grade 10 999.0% 999.0% 998.0% -19898
Grade 12 30.8% 30.8% 46.2% 53.8%
Inhalants
All 9.4% 9.4% 12.4% 87.6%
Grade 8 16.7% 16.7% 25.0% 75.0%
Grade 10 0.0% 0.0% 0.0% 100.0%
Grade 12 7.1% 7.1% 7.1% 92.9%
Any Illicit Drug
All 0.0% 16.1% 22.8% 77.2%
Grade 8 0.0% 16.7% 16.7% 83.3%
Grade 10 * * * *
Grade 12 0.0% 14.3% 28.6% 71.4%
Marijuana
All 0.0% 16.1% 22.8% 77.2%
Grade 8 0.0% 16.7% 16.7% 83.3%
Grade 10 * * * *
Grade 12 0.0% 14.3% 28.6% 71.4%
Marijuana Only
All 0.0% 16.1% 22.8% 77.2%
Grade 8 0.0% 16.7% 16.7% 83.3%Grade 10 * * * *
Grade 12 0.0% 14.3% 28.6% 71.4%
Cocaine or Crack
All 0.0% 0.0% 0.0% 100.0%
Grade 8 0.0% 0.0% 0.0% 100.0%
Grade 10 0.0% 0.0% 0.0% 100.0%
Grade 12 0.0% 0.0% 0.0% 100.0%
Cocaine
All 0.0% 0.0% 0.0% 100.0%
Grade 8 0.0% 0.0% 0.0% 100.0%
Grade 10 0.0% 0.0% 0.0% 100.0%
Grade 12 0.0% 0.0% 0.0% 100.0%Crack
All 0.0% 0.0% 0.0% 100.0%
Grade 8 0.0% 0.0% 0.0% 100.0%
Grade 10 0.0% 0.0% 0.0% 100.0%
Grade 12 0.0% 0.0% 0.0% 100.0%
Secondary Report-Page
8/14/2019 LIMESTONE COUNTY - Groesbeck ISD - 2006 Texas School Survey of Drug and Alcohol Use
http://slidepdf.com/reader/full/limestone-county-groesbeck-isd-2006-texas-school-survey-of-drug-and-alcohol 43/77
Groesbeck
Spring 2006
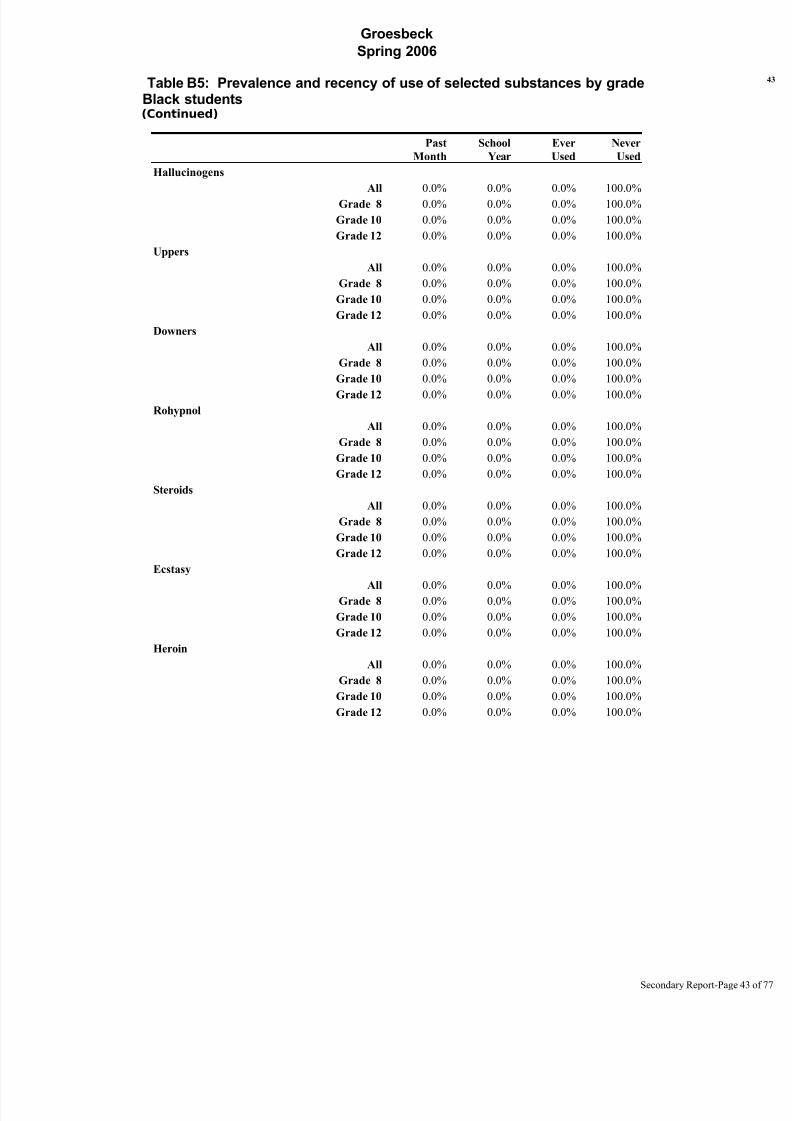
Table B5: Prevalence and recency of use of selected substances by gradeBlack students(Continued)
Past
Month
School
Year
Ever
Used
Never
Used
Hallucinogens
All 0.0% 0.0% 0.0% 100.0%
Grade 8 0.0% 0.0% 0.0% 100.0%
Grade 10 0.0% 0.0% 0.0% 100.0%
Grade 12 0.0% 0.0% 0.0% 100.0%
Uppers
All 0.0% 0.0% 0.0% 100.0%
Grade 8 0.0% 0.0% 0.0% 100.0%
Grade 10 0.0% 0.0% 0.0% 100.0%
Grade 12 0.0% 0.0% 0.0% 100.0%
Downers
All 0.0% 0.0% 0.0% 100.0%
Grade 8 0.0% 0.0% 0.0% 100.0%
Grade 10 0.0% 0.0% 0.0% 100.0%
Grade 12 0.0% 0.0% 0.0% 100.0%Rohypnol
All 0.0% 0.0% 0.0% 100.0%
Grade 8 0.0% 0.0% 0.0% 100.0%
Grade 10 0.0% 0.0% 0.0% 100.0%
Grade 12 0.0% 0.0% 0.0% 100.0%
Steroids
All 0.0% 0.0% 0.0% 100.0%
Grade 8 0.0% 0.0% 0.0% 100.0%
Grade 10 0.0% 0.0% 0.0% 100.0%
Grade 12 0.0% 0.0% 0.0% 100.0%
Ecstasy
All 0.0% 0.0% 0.0% 100.0%Grade 8 0.0% 0.0% 0.0% 100.0%
Grade 10 0.0% 0.0% 0.0% 100.0%
Grade 12 0.0% 0.0% 0.0% 100.0%
Heroin
All 0.0% 0.0% 0.0% 100.0%
Grade 8 0.0% 0.0% 0.0% 100.0%
Grade 10 0.0% 0.0% 0.0% 100.0%
Grade 12 0.0% 0.0% 0.0% 100.0%
Secondary Report-Page

8/14/2019 LIMESTONE COUNTY - Groesbeck ISD - 2006 Texas School Survey of Drug and Alcohol Use
http://slidepdf.com/reader/full/limestone-county-groesbeck-isd-2006-texas-school-survey-of-drug-and-alcohol 44/77

8/14/2019 LIMESTONE COUNTY - Groesbeck ISD - 2006 Texas School Survey of Drug and Alcohol Use
http://slidepdf.com/reader/full/limestone-county-groesbeck-isd-2006-texas-school-survey-of-drug-and-alcohol 45/77
Groesbeck
Spring 2006
Table B6: Prevalence and recency of use of selected substances by gradeMexican/American students(Continued)
Past
Month
School
Year
Ever
Used
Never
Used
Hallucinogens
All 3.8% 3.8% 3.8% 96.2%
Grade 8 0.0% 0.0% 0.0% 100.0%
Grade 10 0.0% 0.0% 0.0% 100.0%
Grade 12 7.7% 7.7% 7.7% 92.3%
Uppers
All 4.0% 4.0% 8.0% 92.0%
Grade 8 0.0% 0.0% 0.0% 100.0%
Grade 10 * * * *
Grade 12 7.7% 7.7% 7.7% 92.3%
Downers
All 4.0% 4.0% 8.0% 92.0%
Grade 8 0.0% 0.0% 0.0% 100.0%
Grade 10 * * * *
Grade 12 8.3% 8.3% 8.3% 91.7%Rohypnol
All 0.0% 4.0% 4.0% 96.0%
Grade 8 0.0% 0.0% 0.0% 100.0%
Grade 10 0.0% 0.0% 0.0% 100.0%
Grade 12 0.0% 8.3% 8.3% 91.7%
Steroids
All 0.0% 0.0% 0.0% 100.0%
Grade 8 0.0% 0.0% 0.0% 100.0%
Grade 10 0.0% 0.0% 0.0% 100.0%
Grade 12 0.0% 0.0% 0.0% 100.0%
Ecstasy
All 4.0% 4.0% 4.0% 96.0%Grade 8 0.0% 0.0% 0.0% 100.0%
Grade 10 0.0% 0.0% 0.0% 100.0%
Grade 12 8.3% 8.3% 8.3% 91.7%
Heroin
All 0.0% 0.0% 3.8% 96.2%
Grade 8 0.0% 0.0% 0.0% 100.0%
Grade 10 0.0% 0.0% 0.0% 100.0%
Grade 12 0.0% 0.0% 7.7% 92.3%
Secondary Report-Page

8/14/2019 LIMESTONE COUNTY - Groesbeck ISD - 2006 Texas School Survey of Drug and Alcohol Use
http://slidepdf.com/reader/full/limestone-county-groesbeck-isd-2006-texas-school-survey-of-drug-and-alcohol 46/77
Groesbeck
Spring 2006
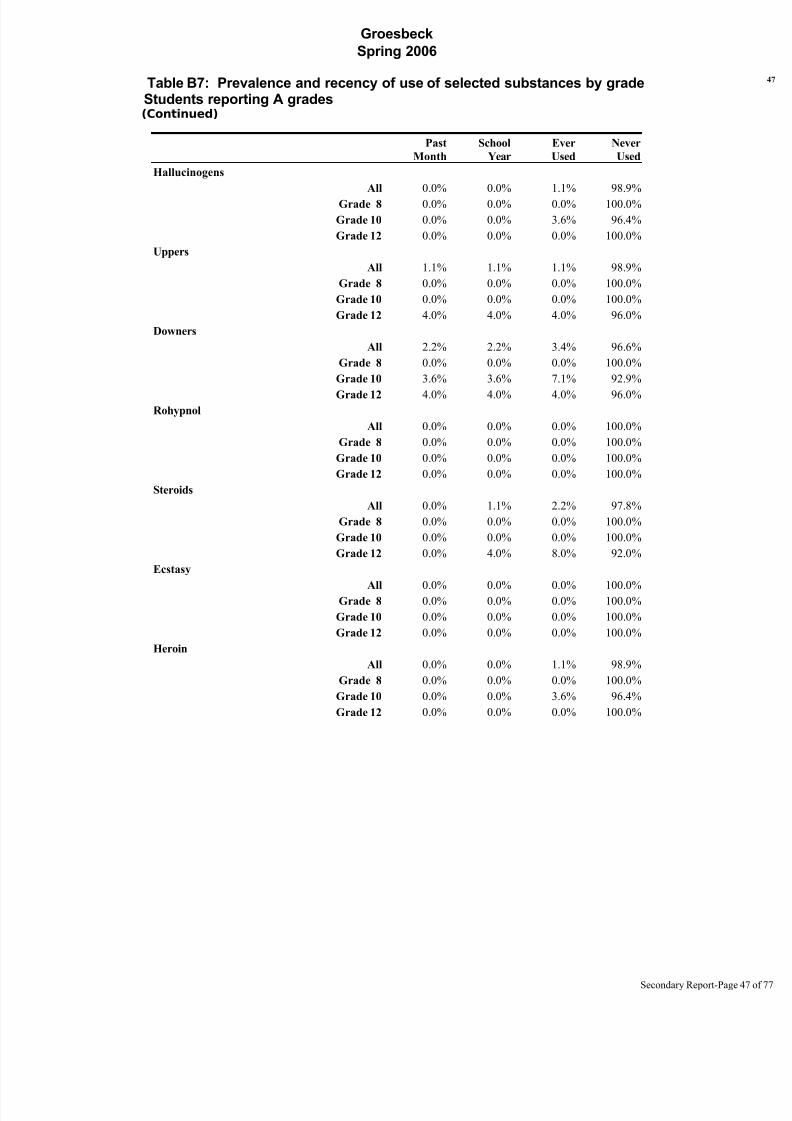
Table B7: Prevalence and recency of use of selected substances by gradeStudents reporting A grades
Past
Month
School
Year
Ever
Used
Never
Used
Tobacco
All 15.2% 22.9% 35.9% 64.1%
Grade 8 12.5% 15.0% 27.5% 72.5%Grade 10 17.9% 32.1% 46.4% 53.6%
Grade 12 16.0% 24.0% 36.0% 64.0%
Alcohol
All 22.0% 38.5% 60.8% 39.2%
Grade 8 10.0% 20.0% 47.5% 52.5%
Grade 10 28.6% 57.1% 75.0% 25.0%
Grade 12 32.0% 44.0% 64.0% 36.0%
Inhalants
All 2.3% 4.4% 15.4% 84.6%
Grade 8 0.0% 2.5% 12.5% 87.5%
Grade 10 0.0% 0.0% 22.2% 77.8%
Grade 12 8.0% 12.0% 12.0% 88.0%
Any Illicit Drug
All 3.3% 5.4% 14.3% 85.7%
Grade 8 2.5% 5.0% 7.5% 92.5%
Grade 10 3.6% 7.1% 21.4% 78.6%
Grade 12 4.0% 4.0% 16.0% 84.0%
Marijuana
All 2.1% 5.4% 10.9% 89.1%
Grade 8 2.5% 5.0% 7.5% 92.5%
Grade 10 3.6% 7.1% 10.7% 89.3%
Grade 12 0.0% 4.0% 16.0% 84.0%
Marijuana Only
All 1.0% 3.2% 8.6% 91.4%
Grade 8 2.5% 5.0% 7.5% 92.5%Grade 10 0.0% 3.6% 7.1% 92.9%
Grade 12 0.0% 0.0% 12.0% 88.0%
Cocaine or Crack
All 0.0% 1.1% 1.1% 98.9%
Grade 8 0.0% 0.0% 0.0% 100.0%
Grade 10 0.0% 3.6% 3.6% 96.4%
Grade 12 0.0% 0.0% 0.0% 100.0%
Cocaine
All 0.0% 1.1% 1.1% 98.9%
Grade 8 0.0% 0.0% 0.0% 100.0%
Grade 10 0.0% 3.6% 3.6% 96.4%
Grade 12 0.0% 0.0% 0.0% 100.0%Crack
All 0.0% 0.0% 0.0% 100.0%
Grade 8 0.0% 0.0% 0.0% 100.0%
Grade 10 0.0% 0.0% 0.0% 100.0%
Grade 12 0.0% 0.0% 0.0% 100.0%
Secondary Report-Page
8/14/2019 LIMESTONE COUNTY - Groesbeck ISD - 2006 Texas School Survey of Drug and Alcohol Use
http://slidepdf.com/reader/full/limestone-county-groesbeck-isd-2006-texas-school-survey-of-drug-and-alcohol 47/77

8/14/2019 LIMESTONE COUNTY - Groesbeck ISD - 2006 Texas School Survey of Drug and Alcohol Use
http://slidepdf.com/reader/full/limestone-county-groesbeck-isd-2006-texas-school-survey-of-drug-and-alcohol 48/77

8/14/2019 LIMESTONE COUNTY - Groesbeck ISD - 2006 Texas School Survey of Drug and Alcohol Use
http://slidepdf.com/reader/full/limestone-county-groesbeck-isd-2006-texas-school-survey-of-drug-and-alcohol 49/77
8/14/2019 LIMESTONE COUNTY - Groesbeck ISD - 2006 Texas School Survey of Drug and Alcohol Use
http://slidepdf.com/reader/full/limestone-county-groesbeck-isd-2006-texas-school-survey-of-drug-and-alcohol 50/77
8/14/2019 LIMESTONE COUNTY - Groesbeck ISD - 2006 Texas School Survey of Drug and Alcohol Use
http://slidepdf.com/reader/full/limestone-county-groesbeck-isd-2006-texas-school-survey-of-drug-and-alcohol 51/77
Groesbeck
Spring 2006
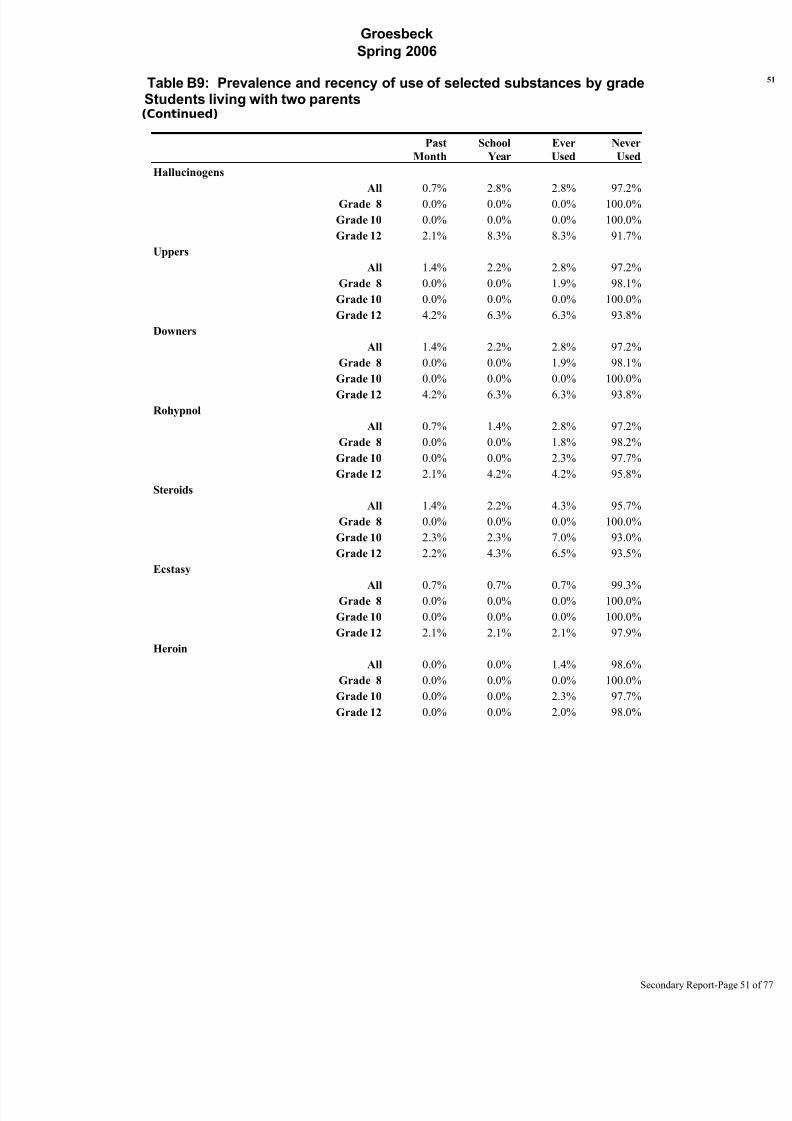
Table B9: Prevalence and recency of use of selected substances by gradeStudents living with two parents(Continued)
Past
Month
School
Year
Ever
Used
Never
Used
Hallucinogens
All 0.7% 2.8% 2.8% 97.2%
Grade 8 0.0% 0.0% 0.0% 100.0%
Grade 10 0.0% 0.0% 0.0% 100.0%
Grade 12 2.1% 8.3% 8.3% 91.7%
Uppers
All 1.4% 2.2% 2.8% 97.2%
Grade 8 0.0% 0.0% 1.9% 98.1%
Grade 10 0.0% 0.0% 0.0% 100.0%
Grade 12 4.2% 6.3% 6.3% 93.8%
Downers
All 1.4% 2.2% 2.8% 97.2%
Grade 8 0.0% 0.0% 1.9% 98.1%
Grade 10 0.0% 0.0% 0.0% 100.0%
Grade 12 4.2% 6.3% 6.3% 93.8%Rohypnol
All 0.7% 1.4% 2.8% 97.2%
Grade 8 0.0% 0.0% 1.8% 98.2%
Grade 10 0.0% 0.0% 2.3% 97.7%
Grade 12 2.1% 4.2% 4.2% 95.8%
Steroids
All 1.4% 2.2% 4.3% 95.7%
Grade 8 0.0% 0.0% 0.0% 100.0%
Grade 10 2.3% 2.3% 7.0% 93.0%
Grade 12 2.2% 4.3% 6.5% 93.5%
Ecstasy
All 0.7% 0.7% 0.7% 99.3%Grade 8 0.0% 0.0% 0.0% 100.0%
Grade 10 0.0% 0.0% 0.0% 100.0%
Grade 12 2.1% 2.1% 2.1% 97.9%
Heroin
All 0.0% 0.0% 1.4% 98.6%
Grade 8 0.0% 0.0% 0.0% 100.0%
Grade 10 0.0% 0.0% 2.3% 97.7%
Grade 12 0.0% 0.0% 2.0% 98.0%
Secondary Report-Page

8/14/2019 LIMESTONE COUNTY - Groesbeck ISD - 2006 Texas School Survey of Drug and Alcohol Use
http://slidepdf.com/reader/full/limestone-county-groesbeck-isd-2006-texas-school-survey-of-drug-and-alcohol 52/77
Groesbeck
Spring 2006
Table B10: Prevalence and recency of use of selected substances by gradeStudents not living with two parents
Past
Month
School
Year
Ever
Used
Never
Used
Tobacco
All 30.2% 39.4% 59.0% 41.0%
Grade 8 16.2% 21.6% 45.9% 54.1%Grade 10 42.5% 57.5% 70.0% 30.0%
Grade 12 29.4% 35.3% 58.8% 41.2%
Alcohol
All 40.6% 62.8% 76.2% 23.8%
Grade 8 18.9% 40.5% 67.6% 32.4%
Grade 10 52.5% 75.0% 82.5% 17.5%
Grade 12 48.4% 71.0% 77.4% 22.6%
Inhalants
All 4.4% 7.0% 21.4% 78.6%
Grade 8 7.9% 13.2% 28.9% 71.1%
Grade 10 2.6% 2.6% 25.6% 74.4%
Grade 12 2.9% 5.9% 8.8% 91.2%
Any Illicit Drug
All 7.2% 16.0% 37.7% 62.3%
Grade 8 5.3% 13.2% 23.7% 76.3%
Grade 10 10.0% 20.0% 47.5% 52.5%
Grade 12 5.7% 14.3% 40.0% 60.0%
Marijuana
All 7.2% 16.2% 35.3% 64.7%
Grade 8 5.3% 13.2% 21.1% 78.9%
Grade 10 10.3% 20.5% 43.6% 56.4%
Grade 12 5.7% 14.3% 40.0% 60.0%
Marijuana Only
All 4.5% 12.5% 28.7% 71.3%
Grade 8 2.6% 10.5% 18.4% 81.6%Grade 10 5.0% 15.0% 32.5% 67.5%
Grade 12 5.7% 11.4% 34.3% 65.7%
Cocaine or Crack
All 0.8% 2.7% 3.6% 96.4%
Grade 8 2.6% 2.6% 2.6% 97.4%
Grade 10 0.0% 2.6% 2.6% 97.4%
Grade 12 0.0% 2.9% 5.9% 94.1%
Cocaine
All 0.9% 2.8% 3.8% 96.2%
Grade 8 2.7% 2.7% 2.7% 97.3%
Grade 10 0.0% 2.6% 2.6% 97.4%
Grade 12 0.0% 3.1% 6.3% 93.8%Crack
All 0.0% 0.0% 0.0% 100.0%
Grade 8 0.0% 0.0% 0.0% 100.0%
Grade 10 0.0% 0.0% 0.0% 100.0%
Grade 12 0.0% 0.0% 0.0% 100.0%
Secondary Report-Page

8/14/2019 LIMESTONE COUNTY - Groesbeck ISD - 2006 Texas School Survey of Drug and Alcohol Use
http://slidepdf.com/reader/full/limestone-county-groesbeck-isd-2006-texas-school-survey-of-drug-and-alcohol 53/77
8/14/2019 LIMESTONE COUNTY - Groesbeck ISD - 2006 Texas School Survey of Drug and Alcohol Use
http://slidepdf.com/reader/full/limestone-county-groesbeck-isd-2006-texas-school-survey-of-drug-and-alcohol 54/77
Groesbeck
Spring 2006
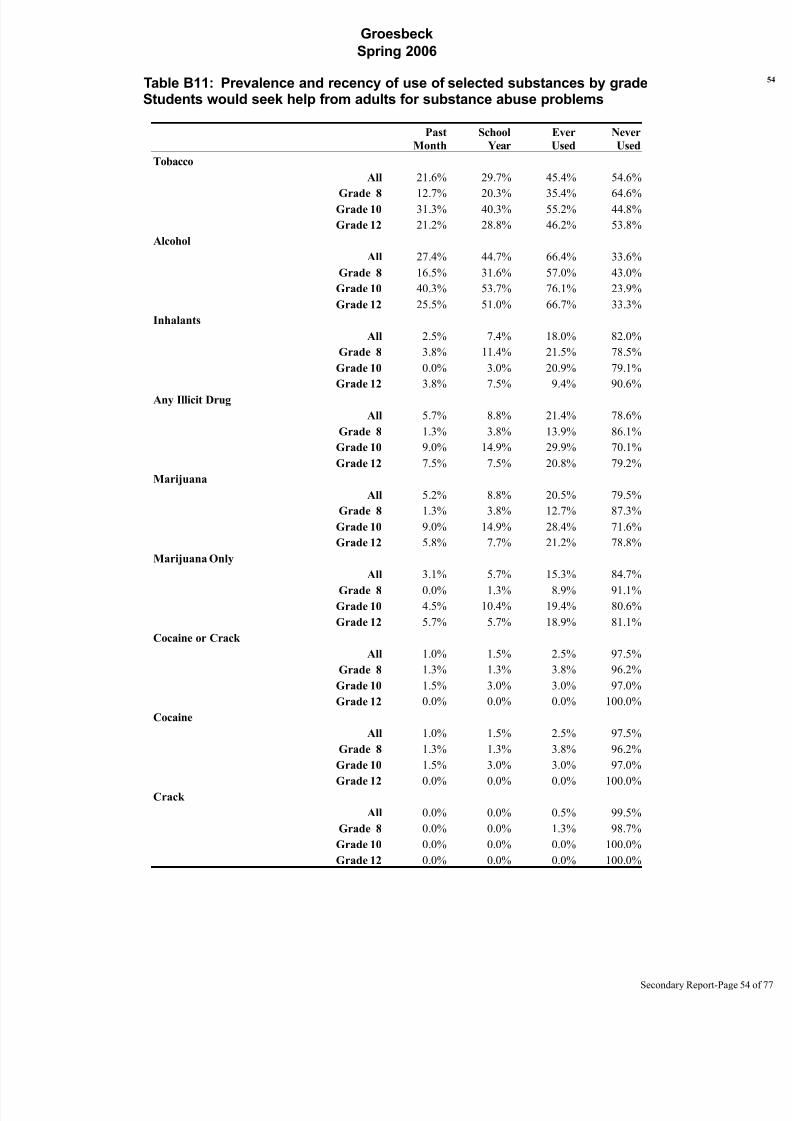
Table B11: Prevalence and recency of use of selected substances by gradeStudents would seek help from adults for substance abuse problems
Past
Month
School
Year
Ever
Used
Never
Used
Tobacco
All 21.6% 29.7% 45.4% 54.6%
Grade 8 12.7% 20.3% 35.4% 64.6%Grade 10 31.3% 40.3% 55.2% 44.8%
Grade 12 21.2% 28.8% 46.2% 53.8%
Alcohol
All 27.4% 44.7% 66.4% 33.6%
Grade 8 16.5% 31.6% 57.0% 43.0%
Grade 10 40.3% 53.7% 76.1% 23.9%
Grade 12 25.5% 51.0% 66.7% 33.3%
Inhalants
All 2.5% 7.4% 18.0% 82.0%
Grade 8 3.8% 11.4% 21.5% 78.5%
Grade 10 0.0% 3.0% 20.9% 79.1%
Grade 12 3.8% 7.5% 9.4% 90.6%
Any Illicit Drug
All 5.7% 8.8% 21.4% 78.6%
Grade 8 1.3% 3.8% 13.9% 86.1%
Grade 10 9.0% 14.9% 29.9% 70.1%
Grade 12 7.5% 7.5% 20.8% 79.2%
Marijuana
All 5.2% 8.8% 20.5% 79.5%
Grade 8 1.3% 3.8% 12.7% 87.3%
Grade 10 9.0% 14.9% 28.4% 71.6%
Grade 12 5.8% 7.7% 21.2% 78.8%
Marijuana Only
All 3.1% 5.7% 15.3% 84.7%
Grade 8 0.0% 1.3% 8.9% 91.1%Grade 10 4.5% 10.4% 19.4% 80.6%
Grade 12 5.7% 5.7% 18.9% 81.1%
Cocaine or Crack
All 1.0% 1.5% 2.5% 97.5%
Grade 8 1.3% 1.3% 3.8% 96.2%
Grade 10 1.5% 3.0% 3.0% 97.0%
Grade 12 0.0% 0.0% 0.0% 100.0%
Cocaine
All 1.0% 1.5% 2.5% 97.5%
Grade 8 1.3% 1.3% 3.8% 96.2%
Grade 10 1.5% 3.0% 3.0% 97.0%
Grade 12 0.0% 0.0% 0.0% 100.0%Crack
All 0.0% 0.0% 0.5% 99.5%
Grade 8 0.0% 0.0% 1.3% 98.7%
Grade 10 0.0% 0.0% 0.0% 100.0%
Grade 12 0.0% 0.0% 0.0% 100.0%
Secondary Report-Page

8/14/2019 LIMESTONE COUNTY - Groesbeck ISD - 2006 Texas School Survey of Drug and Alcohol Use
http://slidepdf.com/reader/full/limestone-county-groesbeck-isd-2006-texas-school-survey-of-drug-and-alcohol 55/77
Groesbeck
Spring 2006
Table B11: Prevalence and recency of use of selected substances by gradeStudents would seek help from adults for substance abuse problems(Continued)
Past
Month
School
Year
Ever
Used
Never
Used
Hallucinogens
All 0.0% 0.0% 1.5% 98.5%
Grade 8 0.0% 0.0% 1.3% 98.7%
Grade 10 0.0% 0.0% 3.0% 97.0%
Grade 12 0.0% 0.0% 0.0% 100.0%
Uppers
All 0.5% 0.5% 1.5% 98.5%
Grade 8 0.0% 0.0% 1.3% 98.7%
Grade 10 0.0% 0.0% 1.5% 98.5%
Grade 12 2.0% 2.0% 2.0% 98.0%
Downers
All 1.1% 1.1% 2.6% 97.4%
Grade 8 0.0% 0.0% 1.3% 98.7%
Grade 10 1.5% 1.5% 4.5% 95.5%
Grade 12 1.9% 1.9% 1.9% 98.1%Rohypnol
All 0.5% 0.5% 1.5% 98.5%
Grade 8 0.0% 0.0% 1.3% 98.7%
Grade 10 1.5% 1.5% 3.0% 97.0%
Grade 12 0.0% 0.0% 0.0% 100.0%
Steroids
All 0.5% 1.1% 3.2% 96.8%
Grade 8 0.0% 0.0% 0.0% 100.0%
Grade 10 1.5% 1.5% 6.0% 94.0%
Grade 12 0.0% 2.0% 3.9% 96.1%
Ecstasy
All 0.0% 0.0% 0.0% 100.0%Grade 8 0.0% 0.0% 0.0% 100.0%
Grade 10 0.0% 0.0% 0.0% 100.0%
Grade 12 0.0% 0.0% 0.0% 100.0%
Heroin
All 0.0% 0.0% 0.0% 100.0%
Grade 8 0.0% 0.0% 0.0% 100.0%
Grade 10 0.0% 0.0% 0.0% 100.0%
Grade 12 0.0% 0.0% 0.0% 100.0%
Secondary Report-Page

8/14/2019 LIMESTONE COUNTY - Groesbeck ISD - 2006 Texas School Survey of Drug and Alcohol Use
http://slidepdf.com/reader/full/limestone-county-groesbeck-isd-2006-texas-school-survey-of-drug-and-alcohol 56/77
Groesbeck
Spring 2006
Table B12: Prevalence and recency of use of selected substances by gradeStudents wouldn''t seek help from adults for substance abuse problems
Past
Month
School
Year
Ever
Used
Never
Used
Tobacco
All 33.6% 43.0% 61.8% 38.2%
Grade 8 999.0% 998.0% 997.0% -29897Grade 10 30.8% 38.5% 53.8% 46.2%
Grade 12 39.1% 47.8% 65.2% 34.8%
Alcohol
All 42.6% 62.4% 79.7% 20.3%
Grade 8 999.0% 998.0% 997.0% -29897
Grade 10 30.8% 61.5% 76.9% 23.1%
Grade 12 52.4% 61.9% 76.2% 23.8%
Inhalants
All 2.5% 2.5% 7.2% 92.8%
Grade 8 * * * *
Grade 10 0.0% 0.0% 0.0% 100.0%
Grade 12 4.5% 4.5% 9.1% 90.9%
Any Illicit Drug
All 6.8% 16.3% 37.3% 62.7%
Grade 8 999.0% 999.0% 998.0% -19898
Grade 10 0.0% 7.7% 23.1% 76.9%
Grade 12 8.7% 21.7% 47.8% 52.2%
Marijuana
All 7.0% 16.7% 35.8% 64.2%
Grade 8 999.0% 999.0% 998.0% -19898
Grade 10 0.0% 8.3% 16.7% 83.3%
Grade 12 8.7% 21.7% 47.8% 52.2%
Marijuana Only
All 2.1% 9.2% 25.5% 74.5%
Grade 8 999.0% 999.0% 998.0% -19898Grade 10 0.0% 7.7% 15.4% 84.6%
Grade 12 0.0% 8.7% 30.4% 69.6%
Cocaine or Crack
All 0.0% 2.4% 4.8% 95.2%
Grade 8 0.0% 0.0% 0.0% 100.0%
Grade 10 0.0% 0.0% 0.0% 100.0%
Grade 12 0.0% 4.5% 9.1% 90.9%
Cocaine
All 0.0% 2.5% 5.1% 94.9%
Grade 8 0.0% 0.0% 0.0% 100.0%
Grade 10 0.0% 0.0% 0.0% 100.0%
Grade 12 0.0% 4.5% 9.1% 90.9%Crack
All 0.0% 0.0% 0.0% 100.0%
Grade 8 0.0% 0.0% 0.0% 100.0%
Grade 10 0.0% 0.0% 0.0% 100.0%
Grade 12 0.0% 0.0% 0.0% 100.0%
Secondary Report-Page

8/14/2019 LIMESTONE COUNTY - Groesbeck ISD - 2006 Texas School Survey of Drug and Alcohol Use
http://slidepdf.com/reader/full/limestone-county-groesbeck-isd-2006-texas-school-survey-of-drug-and-alcohol 57/77
Groesbeck
Spring 2006
Table B12: Prevalence and recency of use of selected substances by gradeStudents wouldn''t seek help from adults for substance abuse problems(Continued)
Past
Month
School
Year
Ever
Used
Never
Used
Hallucinogens
All 2.6% 5.2% 5.2% 94.8%
Grade 8 0.0% 0.0% 0.0% 100.0%
Grade 10 0.0% 0.0% 0.0% 100.0%
Grade 12 4.5% 9.1% 9.1% 90.9%
Uppers
All 2.6% 7.8% 10.3% 89.7%
Grade 8 0.0% 0.0% 0.0% 100.0%
Grade 10 0.0% 0.0% 0.0% 100.0%
Grade 12 4.5% 13.6% 18.2% 81.8%
Downers
All 2.6% 7.8% 10.4% 89.6%
Grade 8 0.0% 0.0% 0.0% 100.0%
Grade 10 0.0% 0.0% 0.0% 100.0%
Grade 12 4.8% 14.3% 19.0% 81.0%Rohypnol
All 2.6% 5.2% 5.2% 94.8%
Grade 8 0.0% 0.0% 0.0% 100.0%
Grade 10 0.0% 0.0% 0.0% 100.0%
Grade 12 4.8% 9.5% 9.5% 90.5%
Steroids
All 2.5% 2.5% 2.5% 97.5%
Grade 8 0.0% 0.0% 0.0% 100.0%
Grade 10 0.0% 0.0% 0.0% 100.0%
Grade 12 4.8% 4.8% 4.8% 95.2%
Ecstasy
All 2.6% 2.6% 5.2% 94.8%Grade 8 0.0% 0.0% 0.0% 100.0%
Grade 10 0.0% 0.0% 0.0% 100.0%
Grade 12 4.8% 4.8% 9.5% 90.5%
Heroin
All 0.0% 0.0% 5.0% 95.0%
Grade 8 0.0% 0.0% 0.0% 100.0%
Grade 10 0.0% 0.0% 8.3% 91.7%
Grade 12 0.0% 0.0% 4.5% 95.5%
Secondary Report-Page

8/14/2019 LIMESTONE COUNTY - Groesbeck ISD - 2006 Texas School Survey of Drug and Alcohol Use
http://slidepdf.com/reader/full/limestone-county-groesbeck-isd-2006-texas-school-survey-of-drug-and-alcohol 58/77
Groesbeck
Spring 2006
Table B13: Prevalence and recency of use of selected substances by gradeStudents living in town three years or less
Past
Month
School
Year
Ever
Used
Never
Used
Tobacco
All 20.6% 33.0% 45.3% 54.7%
Grade 8 8.0% 28.0% 48.0% 52.0%Grade 10 30.4% 39.1% 43.5% 56.5%
Grade 12 999.0% 999.0% 998.0% -19898
Alcohol
All 35.7% 52.0% 62.9% 37.1%
Grade 8 24.0% 48.0% 64.0% 36.0%
Grade 10 39.1% 47.8% 56.5% 43.5%
Grade 12 999.0% 998.0% 998.0% -19898
Inhalants
All 5.7% 13.0% 20.6% 79.4%
Grade 8 4.0% 16.0% 24.0% 76.0%
Grade 10 0.0% 4.5% 13.6% 86.4%
Grade 12 * * * *
Any Illicit Drug
All 9.3% 16.6% 32.9% 67.1%
Grade 8 4.0% 12.0% 28.0% 72.0%
Grade 10 13.0% 17.4% 30.4% 69.6%
Grade 12 999.0% 998.0% 997.0% -29897
Marijuana
All 9.3% 16.6% 32.9% 67.1%
Grade 8 4.0% 12.0% 28.0% 72.0%
Grade 10 13.0% 17.4% 30.4% 69.6%
Grade 12 999.0% 998.0% 997.0% -29897
Marijuana Only
All 3.6% 7.2% 20.0% 80.0%
Grade 8 4.0% 8.0% 20.0% 80.0%Grade 10 4.3% 8.7% 17.4% 82.6%
Grade 12 * * * *
Cocaine or Crack
All 2.0% 5.9% 9.5% 90.5%
Grade 8 0.0% 0.0% 8.0% 92.0%
Grade 10 4.5% 9.1% 9.1% 90.9%
Grade 12 * * * *
Cocaine
All 2.0% 5.9% 9.5% 90.5%
Grade 8 0.0% 0.0% 8.0% 92.0%
Grade 10 4.5% 9.1% 9.1% 90.9%
Grade 12 * * * *Crack
All 0.0% 0.0% 1.8% 98.2%
Grade 8 0.0% 0.0% 4.0% 96.0%
Grade 10 0.0% 0.0% 0.0% 100.0%
Grade 12 0.0% 0.0% 0.0% 100.0%
Secondary Report-Page
8/14/2019 LIMESTONE COUNTY - Groesbeck ISD - 2006 Texas School Survey of Drug and Alcohol Use
http://slidepdf.com/reader/full/limestone-county-groesbeck-isd-2006-texas-school-survey-of-drug-and-alcohol 59/77
Groesbeck
Spring 2006
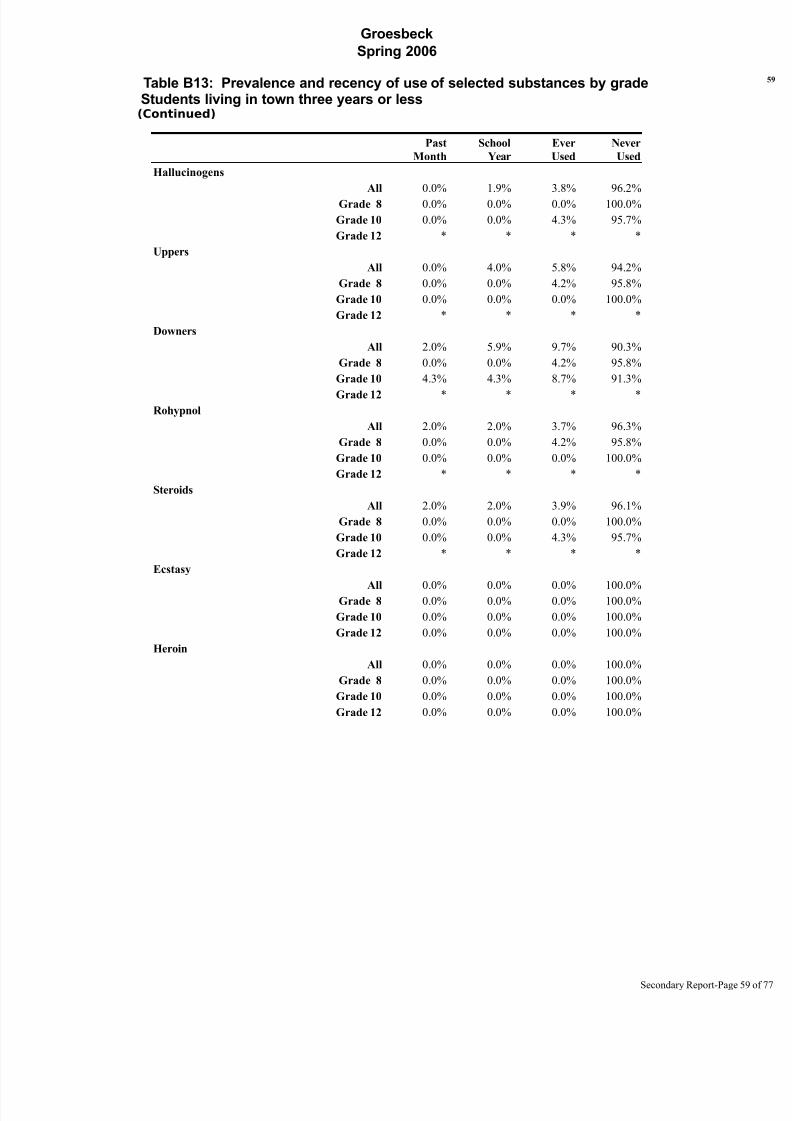
Table B13: Prevalence and recency of use of selected substances by gradeStudents living in town three years or less(Continued)
Past
Month
School
Year
Ever
Used
Never
Used
Hallucinogens
All 0.0% 1.9% 3.8% 96.2%
Grade 8 0.0% 0.0% 0.0% 100.0%
Grade 10 0.0% 0.0% 4.3% 95.7%
Grade 12 * * * *
Uppers
All 0.0% 4.0% 5.8% 94.2%
Grade 8 0.0% 0.0% 4.2% 95.8%
Grade 10 0.0% 0.0% 0.0% 100.0%
Grade 12 * * * *
Downers
All 2.0% 5.9% 9.7% 90.3%
Grade 8 0.0% 0.0% 4.2% 95.8%
Grade 10 4.3% 4.3% 8.7% 91.3%
Grade 12 * * * *Rohypnol
All 2.0% 2.0% 3.7% 96.3%
Grade 8 0.0% 0.0% 4.2% 95.8%
Grade 10 0.0% 0.0% 0.0% 100.0%
Grade 12 * * * *
Steroids
All 2.0% 2.0% 3.9% 96.1%
Grade 8 0.0% 0.0% 0.0% 100.0%
Grade 10 0.0% 0.0% 4.3% 95.7%
Grade 12 * * * *
Ecstasy
All 0.0% 0.0% 0.0% 100.0%Grade 8 0.0% 0.0% 0.0% 100.0%
Grade 10 0.0% 0.0% 0.0% 100.0%
Grade 12 0.0% 0.0% 0.0% 100.0%
Heroin
All 0.0% 0.0% 0.0% 100.0%
Grade 8 0.0% 0.0% 0.0% 100.0%
Grade 10 0.0% 0.0% 0.0% 100.0%
Grade 12 0.0% 0.0% 0.0% 100.0%
Secondary Report-Page
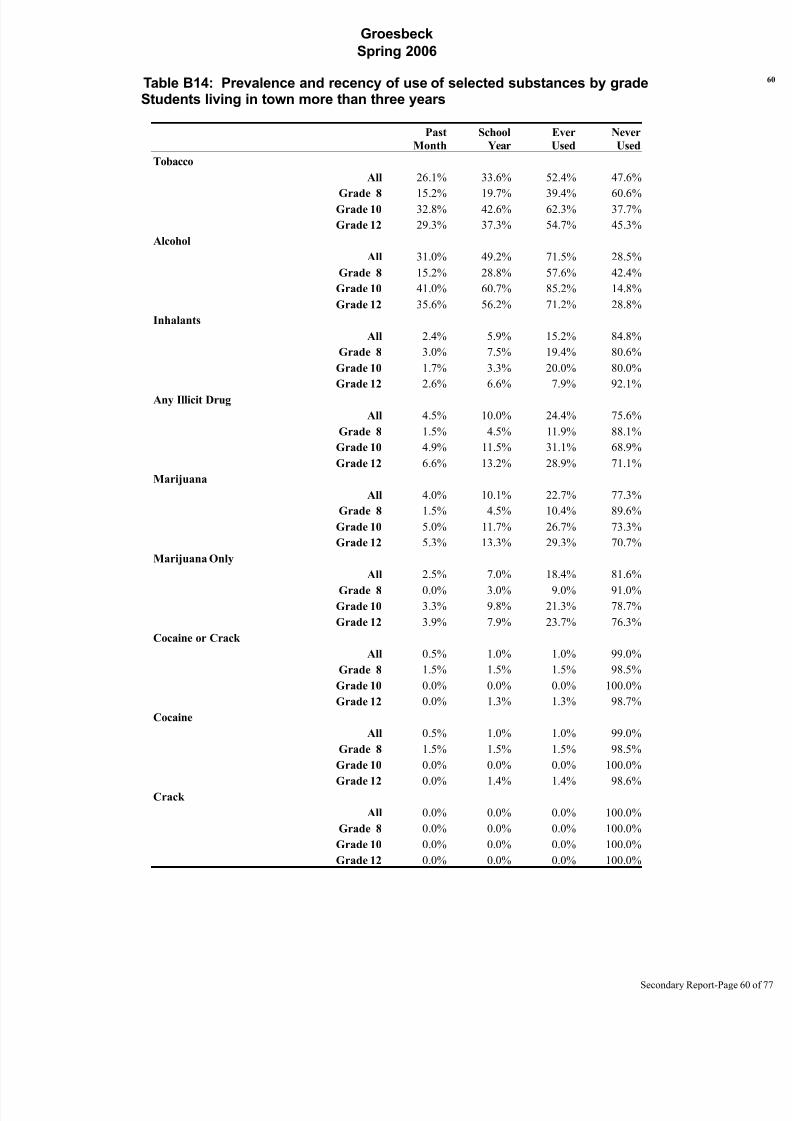
8/14/2019 LIMESTONE COUNTY - Groesbeck ISD - 2006 Texas School Survey of Drug and Alcohol Use
http://slidepdf.com/reader/full/limestone-county-groesbeck-isd-2006-texas-school-survey-of-drug-and-alcohol 60/77
Groesbeck
Spring 2006
Table B14: Prevalence and recency of use of selected substances by gradeStudents living in town more than three years
Past
Month
School
Year
Ever
Used
Never
Used
Tobacco
All 26.1% 33.6% 52.4% 47.6%
Grade 8 15.2% 19.7% 39.4% 60.6%Grade 10 32.8% 42.6% 62.3% 37.7%
Grade 12 29.3% 37.3% 54.7% 45.3%
Alcohol
All 31.0% 49.2% 71.5% 28.5%
Grade 8 15.2% 28.8% 57.6% 42.4%
Grade 10 41.0% 60.7% 85.2% 14.8%
Grade 12 35.6% 56.2% 71.2% 28.8%
Inhalants
All 2.4% 5.9% 15.2% 84.8%
Grade 8 3.0% 7.5% 19.4% 80.6%
Grade 10 1.7% 3.3% 20.0% 80.0%
Grade 12 2.6% 6.6% 7.9% 92.1%
Any Illicit Drug
All 4.5% 10.0% 24.4% 75.6%
Grade 8 1.5% 4.5% 11.9% 88.1%
Grade 10 4.9% 11.5% 31.1% 68.9%
Grade 12 6.6% 13.2% 28.9% 71.1%
Marijuana
All 4.0% 10.1% 22.7% 77.3%
Grade 8 1.5% 4.5% 10.4% 89.6%
Grade 10 5.0% 11.7% 26.7% 73.3%
Grade 12 5.3% 13.3% 29.3% 70.7%
Marijuana Only
All 2.5% 7.0% 18.4% 81.6%
Grade 8 0.0% 3.0% 9.0% 91.0%Grade 10 3.3% 9.8% 21.3% 78.7%
Grade 12 3.9% 7.9% 23.7% 76.3%
Cocaine or Crack
All 0.5% 1.0% 1.0% 99.0%
Grade 8 1.5% 1.5% 1.5% 98.5%
Grade 10 0.0% 0.0% 0.0% 100.0%
Grade 12 0.0% 1.3% 1.3% 98.7%
Cocaine
All 0.5% 1.0% 1.0% 99.0%
Grade 8 1.5% 1.5% 1.5% 98.5%
Grade 10 0.0% 0.0% 0.0% 100.0%
Grade 12 0.0% 1.4% 1.4% 98.6%Crack
All 0.0% 0.0% 0.0% 100.0%
Grade 8 0.0% 0.0% 0.0% 100.0%
Grade 10 0.0% 0.0% 0.0% 100.0%
Grade 12 0.0% 0.0% 0.0% 100.0%
Secondary Report-Page

8/14/2019 LIMESTONE COUNTY - Groesbeck ISD - 2006 Texas School Survey of Drug and Alcohol Use
http://slidepdf.com/reader/full/limestone-county-groesbeck-isd-2006-texas-school-survey-of-drug-and-alcohol 61/77
Groesbeck
Spring 2006
Table B14: Prevalence and recency of use of selected substances by gradeStudents living in town more than three years(Continued)
Past
Month
School
Year
Ever
Used
Never
Used
Hallucinogens
All 0.5% 1.5% 2.5% 97.5%
Grade 8 0.0% 0.0% 1.5% 98.5%
Grade 10 0.0% 0.0% 1.7% 98.3%
Grade 12 1.4% 4.1% 4.1% 95.9%
Uppers
All 1.0% 1.0% 1.6% 98.4%
Grade 8 0.0% 0.0% 0.0% 100.0%
Grade 10 0.0% 0.0% 1.7% 98.3%
Grade 12 2.7% 2.7% 2.7% 97.3%
Downers
All 1.0% 1.0% 2.1% 97.9%
Grade 8 0.0% 0.0% 0.0% 100.0%
Grade 10 0.0% 0.0% 3.4% 96.6%
Grade 12 2.7% 2.7% 2.7% 97.3%Rohypnol
All 0.5% 1.0% 1.6% 98.4%
Grade 8 0.0% 0.0% 0.0% 100.0%
Grade 10 1.7% 1.7% 3.3% 96.7%
Grade 12 0.0% 1.4% 1.4% 98.6%
Steroids
All 0.5% 1.0% 2.6% 97.4%
Grade 8 0.0% 0.0% 0.0% 100.0%
Grade 10 1.7% 1.7% 5.0% 95.0%
Grade 12 0.0% 1.4% 2.8% 97.2%
Ecstasy
All 0.5% 0.5% 0.5% 99.5%Grade 8 0.0% 0.0% 0.0% 100.0%
Grade 10 0.0% 0.0% 0.0% 100.0%
Grade 12 1.4% 1.4% 1.4% 98.6%
Heroin
All 0.0% 0.0% 1.0% 99.0%
Grade 8 0.0% 0.0% 0.0% 100.0%
Grade 10 0.0% 0.0% 1.7% 98.3%
Grade 12 0.0% 0.0% 1.3% 98.7%
Secondary Report-Page
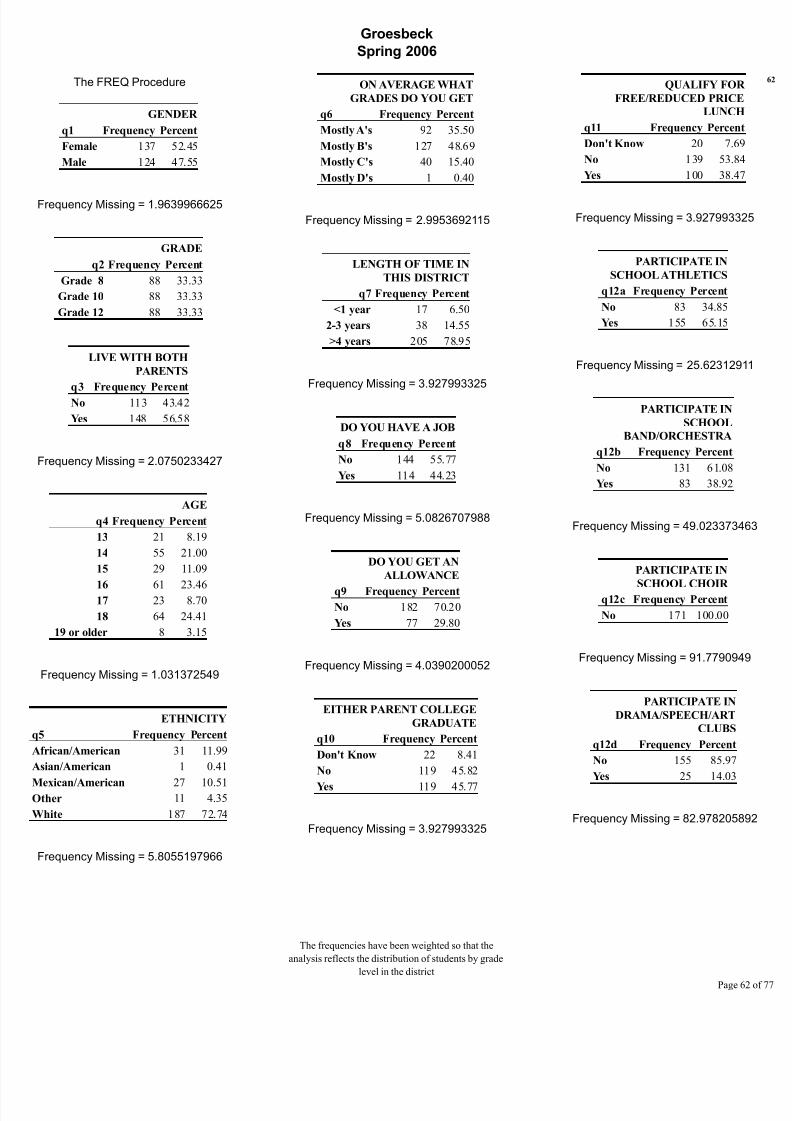
8/14/2019 LIMESTONE COUNTY - Groesbeck ISD - 2006 Texas School Survey of Drug and Alcohol Use
http://slidepdf.com/reader/full/limestone-county-groesbeck-isd-2006-texas-school-survey-of-drug-and-alcohol 62/77
Groesbeck
Spring 2006
The FREQ Procedure
GENDER
q1 Frequency Percent
Female 137 52.45
Male 124 47.55
Frequency Missing = 1.9639966625
GRADE
q2 Frequency Percent
Grade 8 88 33.33
Grade 10 88 33.33
Grade 12 88 33.33
LIVE WITH BOTH
PARENTS
q3 Frequency PercentNo 113 43.42
Yes 148 56.58
Frequency Missing = 2.0750233427
AGE
q4 Frequency Percent
13 21 8.19
14 55 21.00
15 29 11.09
16 61 23.4617 23 8.70
18 64 24.41
19 or older 8 3.15
Frequency Missing = 1.031372549
ETHNICITY
q5 Frequency Percent
African/American 31 11.99
Asian/American 1 0.41
Mexican/American 27 10.51Other 11 4.35
White 187 72.74
Frequency Missing = 5.8055197966
ON AVERAGE WHAT
GRADES DO YOU GET
q6 Frequency Percent
Mostly A's 92 35.50
Mostly B's 127 48.69
Mostly C's 40 15.40
Mostly D's 1 0.40
Frequency Missing = 2.9953692115
LENGTH OF TIME IN
THIS DISTRICT
q7 Frequency Percent
<1 year 17 6.50
2-3 years 38 14.55
>4 years 205 78.95
Frequency Missing = 3.927993325
DO YOU HAVE A JOB
q8 Frequency Percent
No 144 55.77
Yes 114 44.23
Frequency Missing = 5.0826707988
DO YOU GET AN
ALLOWANCE
q9 Frequency Percent
No 182 70.20
Yes 77 29.80
Frequency Missing = 4.0390200052
EITHER PARENT COLLEGE
GRADUATE
q10 Frequency Percent
Don't Know 22 8.41
No 119 45.82
Yes 119 45.77
Frequency Missing = 3.927993325
QUALIFY FOR
FREE/REDUCED PRICE
LUNCH
q11 Frequency Percen
Don't Know 20 7.69
No 139 53.84
Yes 100 38.47
Frequency Missing = 3.9279933
PARTICIPATE IN
SCHOOL ATHLETICS
q12a Frequency Percent
No 83 34.85
Yes 155 65.15
Frequency Missing = 25.623129
PARTICIPATE IN
SCHOOL
BAND/ORCHESTRA
q12b Frequency Percent
No 131 61.08
Yes 83 38.92
Frequency Missing = 49.0233734
PARTICIPATE IN
SCHOOL CHOIR q12c Frequency Percent
No 171 100.00
Frequency Missing = 91.779094
PARTICIPATE IN
DRAMA/SPEECH/ART
CLUBS
q12d Frequency Percent
No 155 85.97
Yes 25 14.03
Frequency Missing = 82.9782058
The frequencies have been weighted so that the
analysis reflects the distribution of students by grade
level in the district
Page
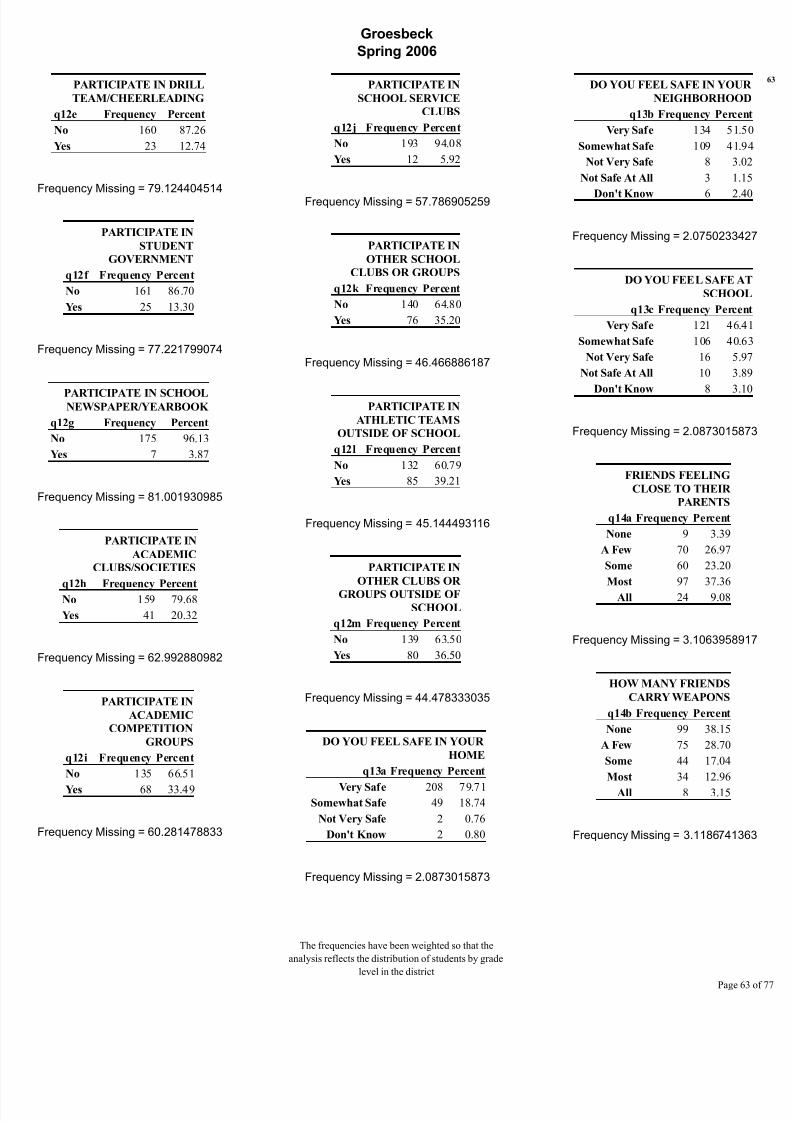
8/14/2019 LIMESTONE COUNTY - Groesbeck ISD - 2006 Texas School Survey of Drug and Alcohol Use
http://slidepdf.com/reader/full/limestone-county-groesbeck-isd-2006-texas-school-survey-of-drug-and-alcohol 63/77
Groesbeck
Spring 2006
PARTICIPATE IN DRILL
TEAM/CHEERLEADING
q12e Frequency Percent
No 160 87.26
Yes 23 12.74
Frequency Missing = 79.124404514
PARTICIPATE IN
STUDENT
GOVERNMENT
q12f Frequency Percent
No 161 86.70
Yes 25 13.30
Frequency Missing = 77.221799074
PARTICIPATE IN SCHOOLNEWSPAPER/YEARBOOK
q12g Frequency Percent
No 175 96.13
Yes 7 3.87
Frequency Missing = 81.001930985
PARTICIPATE IN
ACADEMIC
CLUBS/SOCIETIES
q12h Frequency PercentNo 159 79.68
Yes 41 20.32
Frequency Missing = 62.992880982
PARTICIPATE IN
ACADEMIC
COMPETITION
GROUPS
q12i Frequency Percent
No 135 66.51
Yes 68 33.49
Frequency Missing = 60.281478833
PARTICIPATE IN
SCHOOL SERVICE
CLUBS
q12j Frequency Percent
No 193 94.08
Yes 12 5.92
Frequency Missing = 57.786905259
PARTICIPATE IN
OTHER SCHOOL
CLUBS OR GROUPS
q12k Frequency Percent
No 140 64.80
Yes 76 35.20
Frequency Missing = 46.466886187
PARTICIPATE IN
ATHLETIC TEAMS
OUTSIDE OF SCHOOL
q12l Frequency Percent
No 132 60.79
Yes 85 39.21
Frequency Missing = 45.144493116
PARTICIPATE IN
OTHER CLUBS OR
GROUPS OUTSIDE OF
SCHOOL
q12m Frequency Percent
No 139 63.50
Yes 80 36.50
Frequency Missing = 44.478333035
DO YOU FEEL SAFE IN YOUR
HOME
q13a Frequency Percent
Very Safe 208 79.71Somewhat Safe 49 18.74
Not Very Safe 2 0.76
Don't Know 2 0.80
Frequency Missing = 2.0873015873
DO YOU FEEL SAFE IN YOU
NEIGHBORHOO
q13b Frequency Perce
Very Safe 134 51.
Somewhat Safe 109 41.
Not Very Safe 8 3.
Not Safe At All 3 1.
Don't Know 6 2.
Frequency Missing = 2.07502334
DO YOU FEEL SAFE A
SCHOO
q13c Frequency Perce
Very Safe 121 46.
Somewhat Safe 106 40.
Not Very Safe 16 5.
Not Safe At All 10 3.
Don't Know 8 3.
Frequency Missing = 2.08730158
FRIENDS FEELING
CLOSE TO THEIR
PARENTS
q14a Frequency Percent
None 9 3.39
A Few 70 26.97
Some 60 23.20
Most 97 37.36
All 24 9.08
Frequency Missing = 3.10639589
HOW MANY FRIENDS
CARRY WEAPONS
q14b Frequency Percent
None 99 38.15
A Few 75 28.70
Some 44 17.04
Most 34 12.96
All 8 3.15
Frequency Missing = 3.11867413
The frequencies have been weighted so that the
analysis reflects the distribution of students by grade
level in the district
Page
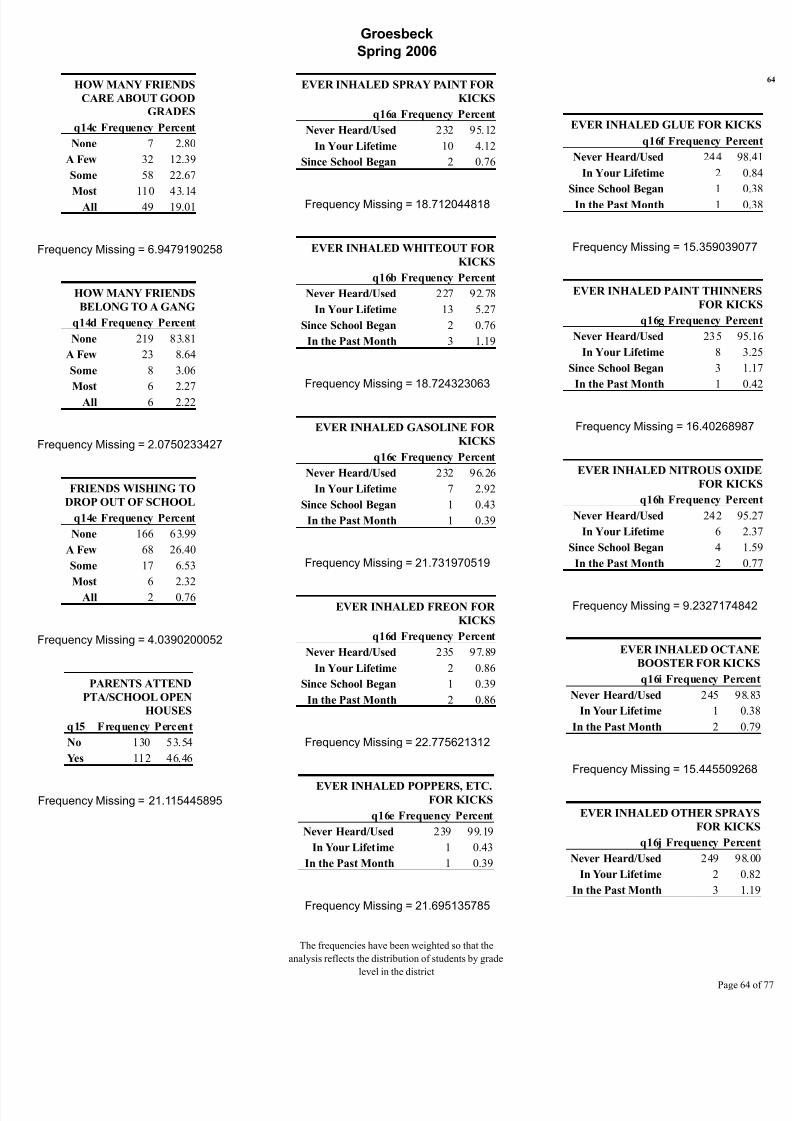
8/14/2019 LIMESTONE COUNTY - Groesbeck ISD - 2006 Texas School Survey of Drug and Alcohol Use
http://slidepdf.com/reader/full/limestone-county-groesbeck-isd-2006-texas-school-survey-of-drug-and-alcohol 64/77
Groesbeck
Spring 2006
HOW MANY FRIENDS
CARE ABOUT GOOD
GRADES
q14c Frequency Percent
None 7 2.80
A Few 32 12.39
Some 58 22.67
Most 110 43.14All 49 19.01
Frequency Missing = 6.9479190258
HOW MANY FRIENDS
BELONG TO A GANG
q14d Frequency Percent
None 219 83.81
A Few 23 8.64
Some 8 3.06
Most 6 2.27
All 6 2.22
Frequency Missing = 2.0750233427
FRIENDS WISHING TO
DROP OUT OF SCHOOL
q14e Frequency Percent
None 166 63.99
A Few 68 26.40
Some 17 6.53
Most 6 2.32
All 2 0.76
Frequency Missing = 4.0390200052
PARENTS ATTEND
PTA/SCHOOL OPEN
HOUSES
q15 Frequency Percent
No 130 53.54
Yes 112 46.46
Frequency Missing = 21.115445895
EVER INHALED SPRAY PAINT FOR
KICKS
q16a Frequency Percent
Never Heard/Used 232 95.12
In Your Lifetime 10 4.12
Since School Began 2 0.76
Frequency Missing = 18.712044818
EVER INHALED WHITEOUT FOR
KICKS
q16b Frequency Percent
Never Heard/Used 227 92.78
In Your Lifetime 13 5.27
Since School Began 2 0.76
In the Past Month 3 1.19
Frequency Missing = 18.724323063
EVER INHALED GASOLINE FOR
KICKS
q16c Frequency Percent
Never Heard/Used 232 96.26
In Your Lifetime 7 2.92
Since School Began 1 0.43
In the Past Month 1 0.39
Frequency Missing = 21.731970519
EVER INHALED FREON FOR
KICKS
q16d Frequency Percent
Never Heard/Used 235 97.89
In Your Lifetime 2 0.86
Since School Began 1 0.39
In the Past Month 2 0.86
Frequency Missing = 22.775621312
EVER INHALED POPPERS, ETC.FOR KICKS
q16e Frequency Percent
Never Heard/Used 239 99.19
In Your Lifetime 1 0.43
In the Past Month 1 0.39
Frequency Missing = 21.695135785
EVER INHALED GLUE FOR KIC
q16f Frequency Per
Never Heard/Used 244 9
In Your Lifetime 2
Since School Began 1
In the Past Month 1
Frequency Missing = 15.3590390
EVER INHALED PAINT THINN
FOR KIC
q16g Frequency Per
Never Heard/Used 235 9
In Your Lifetime 8
Since School Began 3
In the Past Month 1
Frequency Missing = 16.402689
EVER INHALED NITROUS OX
FOR KIC
q16h Frequency Per
Never Heard/Used 242 9
In Your Lifetime 6
Since School Began 4
In the Past Month 2
Frequency Missing = 9.23271748
EVER INHALED OCTA
BOOSTER FOR KIC
q16i Frequency Per
Never Heard/Used 245 9
In Your Lifetime 1
In the Past Month 2
Frequency Missing = 15.4455092
EVER INHALED OTHER SPRA
FOR KIC
q16j Frequency Per
Never Heard/Used 249 9
In Your Lifetime 2
In the Past Month 3
The frequencies have been weighted so that the
analysis reflects the distribution of students by grade
level in the district
Page

8/14/2019 LIMESTONE COUNTY - Groesbeck ISD - 2006 Texas School Survey of Drug and Alcohol Use
http://slidepdf.com/reader/full/limestone-county-groesbeck-isd-2006-texas-school-survey-of-drug-and-alcohol 65/77
Groesbeck
Spring 2006
Frequency Missing = 9.2204392395
EVER INHALED OTHER
INHALANTS FOR KICKS
q16k Frequency Percent
Never Heard/Used 237 93.42
In Your Lifetime 10 3.89
Since School Began 5 1.92
In the Past Month 2 0.77
Frequency Missing = 9.2327174842
RECENT CIGARETTE USE
q17a Frequency Percent
Never Heard/Used 143 55.36
In Your Lifetime 41 15.83
Since School Began 19 7.41
In the Past Month 55 21.40
Frequency Missing = 5.0703925542
RECENT SMOKELESS TOBACCO
USE
q17b Frequency Percent
Never Heard/Used 186 74.35
In Your Lifetime 23 9.30
Since School Began 13 5.31
In the Past Month 28 11.04
Frequency Missing = 13.049684129
RECENT BEER USE
q17c Frequency Percent
Never Heard/Used 104 41.37
In Your Lifetime 48 19.20
Since School Began 29 11.57
In the Past Month 70 27.86
Frequency Missing = 11.270906093
RECENT WINE COOLER USE
q17d Frequency Percent
Never Heard/Used 123 49.63
In Your Lifetime 55 22.10
Since School Began 34 13.54
In the Past Month 36 14.73
Frequency Missing = 15.235734152
RECENT WINE USE
q17e Frequency Percent
Never Heard/Used 151 59.82
In Your Lifetime 53 21.17
Since School Began 24 9.71
In the Past Month 23 9.30
Frequency Missing = 10.986939031
RECENT LIQUOR USE
q17f Frequency Percent
Never Heard/Used 117 45.41
In Your Lifetime 48 18.59
Since School Began 36 14.11
In the Past Month 56 21.89
Frequency Missing = 5.0581143096
RECENT MARIJUANA USE
q18a Frequency Percent
Never Heard/Used 196 75.12
In Your Lifetime 35 13.59
Since School Began 16 6.20
In the Past Month 13 5.09
Frequency Missing = 2.0750233427
RECENT COCAINE USE
q18b Frequency Percent
Never Heard/Used 249 96.89In Your Lifetime 3 1.13
Since School Began 3 1.21
In the Past Month 2 0.77
Frequency Missing = 6.1140433478
RECENT CRACK U
q18c Frequency Per
Never Heard/Used 257 9
In Your Lifetime 1
Frequency Missing = 5.08267079
RECENT HALLUCINOGEN
q18e Frequency Per
Never Heard/Used 251 9
In Your Lifetime 3
Since School Began 3
In the Past Month 1
Frequency Missing = 4.97164411
RECENT UPPER
q18f Frequency Per
Never Heard/Used 246 9
In Your Lifetime 3
Since School Began 2
In the Past Month 2
Frequency Missing = 9.84453980
RECENT DOWNER
q18g Frequency Per
Never Heard/Used 245 9In Your Lifetime 5
Since School Began 2
In the Past Month 3
Frequency Missing = 7.97929157
RECENT ROHYPNOL
q18h Frequency Per
Never Heard/Used 252 9
In Your Lifetime 2
Since School Began 1 In the Past Month 2
Frequency Missing = 6.00301666
The frequencies have been weighted so that the
analysis reflects the distribution of students by grade
level in the district
Page

8/14/2019 LIMESTONE COUNTY - Groesbeck ISD - 2006 Texas School Survey of Drug and Alcohol Use
http://slidepdf.com/reader/full/limestone-county-groesbeck-isd-2006-texas-school-survey-of-drug-and-alcohol 66/77
Groesbeck
Spring 2006
RECENT STEROID USE
q18i Frequency Percent
Never Heard/Used 249 97.16
In Your Lifetime 4 1.63
Since School Began 1 0.40
In the Past Month 2 0.81
Frequency Missing = 7.0343892167
RECENT ECSTASY USE
q18j Frequency Percent
Never Heard/Used 254 99.19
In Your Lifetime 1 0.40
In the Past Month 1 0.40
Frequency Missing = 7.0343892167
RECENT HEROIN USE
q18k Frequency Percent
Never Heard/Used 257 99.20
In Your Lifetime 2 0.80
Frequency Missing = 4.0390200052
TOBACCO USE IN PAST MONTH
q19a Frequency Percent
Never Heard/Used 178 69.36
1-2 times 20 7.743-10 times 18 6.94
11+ times 41 15.96
Frequency Missing = 5.7932415519
ALCOHOL USE IN PAST MONTH
q19b Frequency Percent
Never Heard/Used 146 57.03
1-2 times 52 20.28
3-10 times 35 13.62
11+ times 23 9.07
Frequency Missing = 6.9479190258
INHALANT USE IN PAST MONTH
q19c Frequency Percent
Never Heard/Used 244 94.70
1-2 times 11 4.21
3-10 times 3 1.08
Frequency Missing = 4.959365874
MARIJUANA USE IN PAST MONTH
q19d Frequency Percent
Never Heard/Used 233 91.78
1-2 times 9 3.51
3-10 times 5 2.00
11+ times 7 2.70
Frequency Missing = 9.2081609949
COCAINE USE IN PAST MONTH
q19e Frequency Percent
Never Heard/Used 253 98.47
1-2 times 2 0.76
3-10 times 1 0.36
11+ times 1 0.41
Frequency Missing = 6.0030166677
CRACK USE IN PAST MONTH
q19f Frequency Percent
Never Heard/Used 256 100.00
Frequency Missing = 7.1331376522
CLOSE FRIENDS USE
CIGARETTES
q20a Frequency Percent
Never heard/None 84 32.67
A few 84 32.96
Some 49 19.03
Most 31 12.22
All 8 3.12
Frequency Missing = 7.1576941415
CLOSE FRIENDS U
SMOKELESS TOBAC
q20b Frequency Perc
Never heard/None 104 4
A few 62 24
Some 42 16
Most 43 16
All 3
Frequency Missing = 9.20816099
CLOSE FRIENDS USE BE
q20c Frequency Perc
Never heard/None 66 26
A few 50 19
Some 43 17
Most 68 26
All 26 10
Frequency Missing = 8.30009337
CLOSE FRIENDS USE WI
COOLE
q20d Frequency Perc
Never heard/None 101 3
A few 64 2
Some 40 1
Most 37 14
All 11 4
Frequency Missing = 10.2640900
CLOSE FRIENDS USE WI
q20e Frequency Perc
Never heard/None 135 5
A few 60 23
Some 32 12
Most 21
All 7 2
Frequency Missing = 7.15769414
The frequencies have been weighted so that the
analysis reflects the distribution of students by grade
level in the district
Page

8/14/2019 LIMESTONE COUNTY - Groesbeck ISD - 2006 Texas School Survey of Drug and Alcohol Use
http://slidepdf.com/reader/full/limestone-county-groesbeck-isd-2006-texas-school-survey-of-drug-and-alcohol 67/77
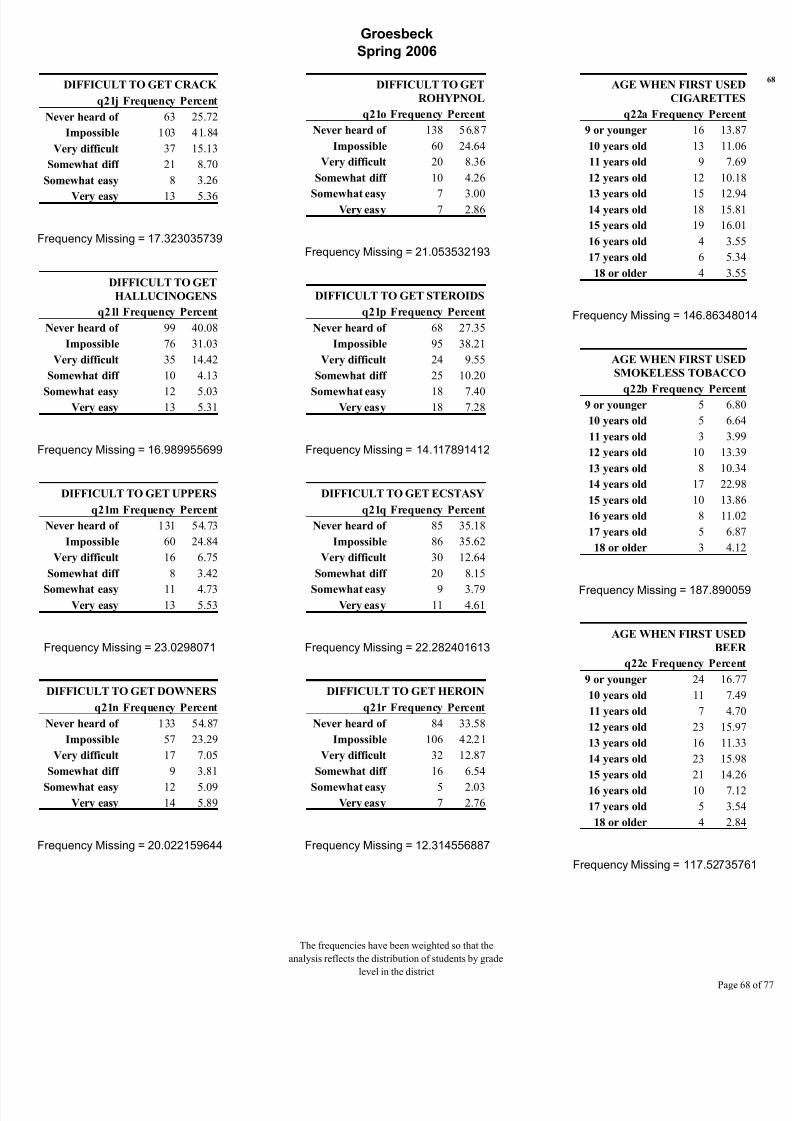
8/14/2019 LIMESTONE COUNTY - Groesbeck ISD - 2006 Texas School Survey of Drug and Alcohol Use
http://slidepdf.com/reader/full/limestone-county-groesbeck-isd-2006-texas-school-survey-of-drug-and-alcohol 68/77
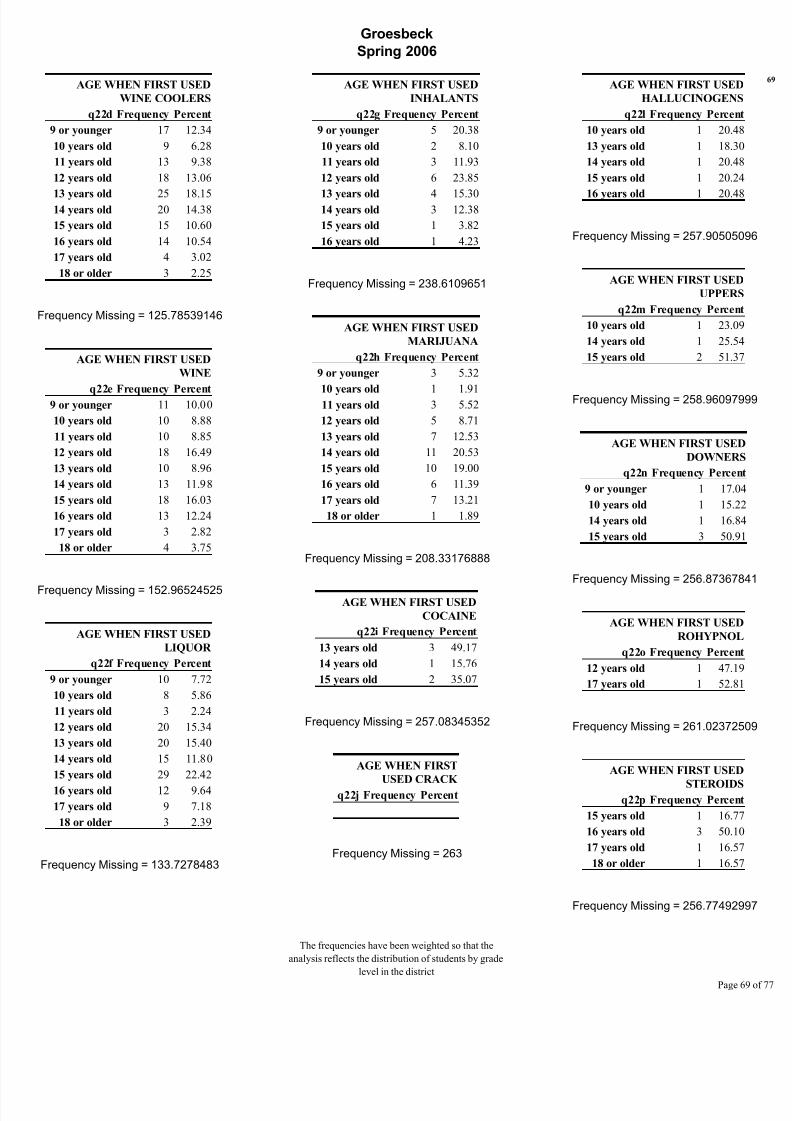
8/14/2019 LIMESTONE COUNTY - Groesbeck ISD - 2006 Texas School Survey of Drug and Alcohol Use
http://slidepdf.com/reader/full/limestone-county-groesbeck-isd-2006-texas-school-survey-of-drug-and-alcohol 69/77
Groesbeck
Spring 2006
AGE WHEN FIRST USED
WINE COOLERS
q22d Frequency Percent
9 or younger 17 12.34
10 years old 9 6.28
11 years old 13 9.38
12 years old 18 13.06
13 years old 25 18.1514 years old 20 14.38
15 years old 15 10.60
16 years old 14 10.54
17 years old 4 3.02
18 or older 3 2.25
Frequency Missing = 125.78539146
AGE WHEN FIRST USED
WINE
q22e Frequency Percent9 or younger 11 10.00
10 years old 10 8.88
11 years old 10 8.85
12 years old 18 16.49
13 years old 10 8.96
14 years old 13 11.98
15 years old 18 16.03
16 years old 13 12.24
17 years old 3 2.82
18 or older 4 3.75
Frequency Missing = 152.96524525
AGE WHEN FIRST USED
LIQUOR
q22f Frequency Percent
9 or younger 10 7.72
10 years old 8 5.86
11 years old 3 2.24
12 years old 20 15.34
13 years old 20 15.40
14 years old 15 11.80
15 years old 29 22.42
16 years old 12 9.64
17 years old 9 7.18
18 or older 3 2.39
Frequency Missing = 133.7278483
AGE WHEN FIRST USED
INHALANTS
q22g Frequency Percent
9 or younger 5 20.38
10 years old 2 8.10
11 years old 3 11.93
12 years old 6 23.85
13 years old 4 15.3014 years old 3 12.38
15 years old 1 3.82
16 years old 1 4.23
Frequency Missing = 238.6109651
AGE WHEN FIRST USED
MARIJUANA
q22h Frequency Percent
9 or younger 3 5.32
10 years old 1 1.9111 years old 3 5.52
12 years old 5 8.71
13 years old 7 12.53
14 years old 11 20.53
15 years old 10 19.00
16 years old 6 11.39
17 years old 7 13.21
18 or older 1 1.89
Frequency Missing = 208.33176888
AGE WHEN FIRST USED
COCAINE
q22i Frequency Percent
13 years old 3 49.17
14 years old 1 15.76
15 years old 2 35.07
Frequency Missing = 257.08345352
AGE WHEN FIRST
USED CRACK
q22j Frequency Percent
Frequency Missing = 263
AGE WHEN FIRST USED
HALLUCINOGENS
q22l Frequency Percen
10 years old 1 20.48
13 years old 1 18.30
14 years old 1 20.48
15 years old 1 20.24
16 years old 1 20.48
Frequency Missing = 257.905050
AGE WHEN FIRST USED
UPPERS
q22m Frequency Percen
10 years old 1 23.09
14 years old 1 25.54
15 years old 2 51.37
Frequency Missing = 258.960979
AGE WHEN FIRST USED
DOWNER
q22n Frequency Percen
9 or younger 1 17.0
10 years old 1 15.2
14 years old 1 16.8
15 years old 3 50.9
Frequency Missing = 256.873678
AGE WHEN FIRST USED
ROHYPNOL
q22o Frequency Percen
12 years old 1 47.19
17 years old 1 52.81
Frequency Missing = 261.023725
AGE WHEN FIRST USED
STEROIDSq22p Frequency Percen
15 years old 1 16.77
16 years old 3 50.10
17 years old 1 16.57
18 or older 1 16.57
Frequency Missing = 256.774929
The frequencies have been weighted so that the
analysis reflects the distribution of students by grade
level in the district
Page
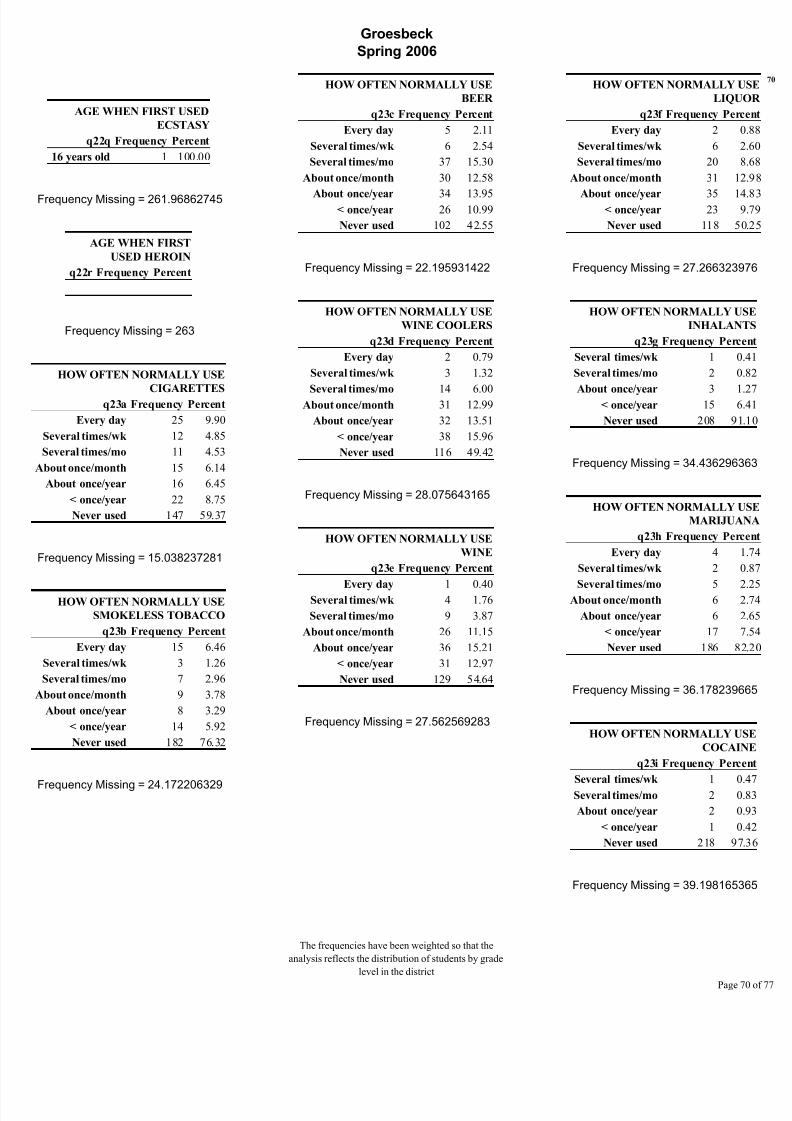
8/14/2019 LIMESTONE COUNTY - Groesbeck ISD - 2006 Texas School Survey of Drug and Alcohol Use
http://slidepdf.com/reader/full/limestone-county-groesbeck-isd-2006-texas-school-survey-of-drug-and-alcohol 70/77
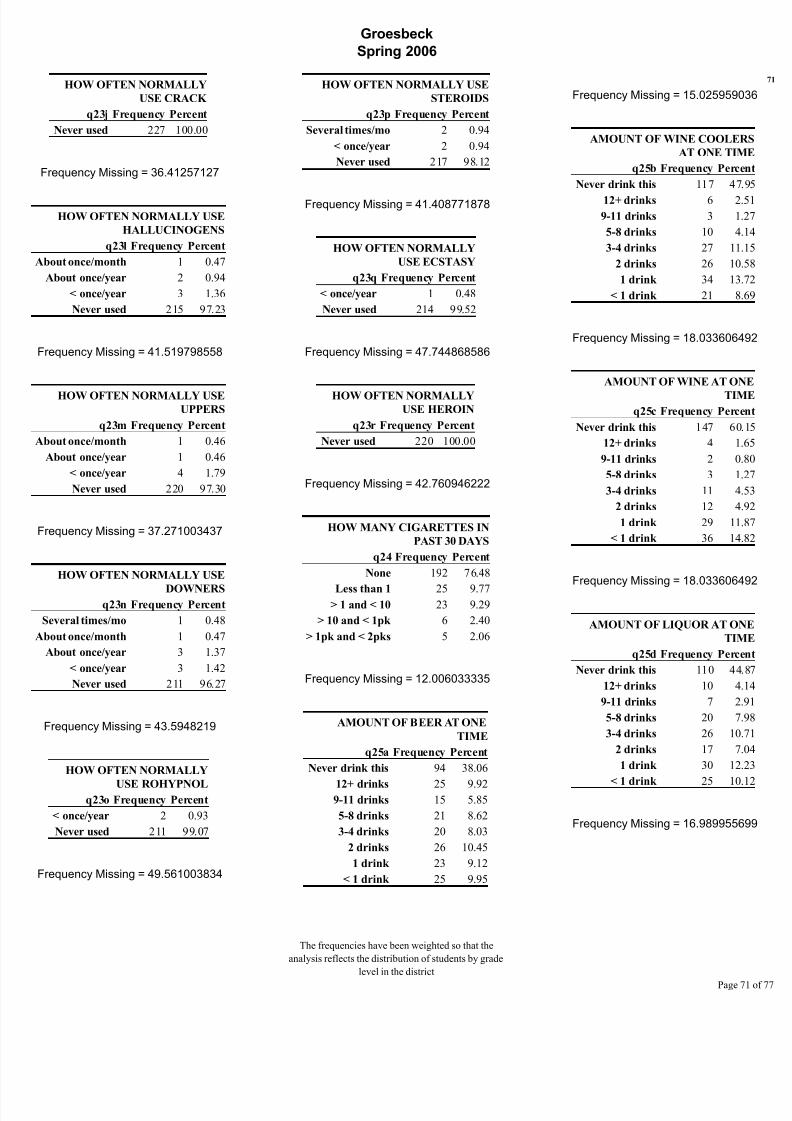
8/14/2019 LIMESTONE COUNTY - Groesbeck ISD - 2006 Texas School Survey of Drug and Alcohol Use
http://slidepdf.com/reader/full/limestone-county-groesbeck-isd-2006-texas-school-survey-of-drug-and-alcohol 71/77
Groesbeck
Spring 2006
HOW OFTEN NORMALLY
USE CRACK
q23j Frequency Percent
Never used 227 100.00
Frequency Missing = 36.41257127
HOW OFTEN NORMALLY USE
HALLUCINOGENS
q23l Frequency Percent
About once/month 1 0.47
About once/year 2 0.94
< once/year 3 1.36
Never used 215 97.23
Frequency Missing = 41.519798558
HOW OFTEN NORMALLY USEUPPERS
q23m Frequency Percent
About once/month 1 0.46
About once/year 1 0.46
< once/year 4 1.79
Never used 220 97.30
Frequency Missing = 37.271003437
HOW OFTEN NORMALLY USE
DOWNERSq23n Frequency Percent
Several times/mo 1 0.48
About once/month 1 0.47
About once/year 3 1.37
< once/year 3 1.42
Never used 211 96.27
Frequency Missing = 43.5948219
HOW OFTEN NORMALLY
USE ROHYPNOLq23o Frequency Percent
< once/year 2 0.93
Never used 211 99.07
Frequency Missing = 49.561003834
HOW OFTEN NORMALLY USE
STEROIDS
q23p Frequency Percent
Several times/mo 2 0.94
< once/year 2 0.94
Never used 217 98.12
Frequency Missing = 41.408771878
HOW OFTEN NORMALLY
USE ECSTASY
q23q Frequency Percent
< once/year 1 0.48
Never used 214 99.52
Frequency Missing = 47.744868586
HOW OFTEN NORMALLYUSE HEROIN
q23r Frequency Percent
Never used 220 100.00
Frequency Missing = 42.760946222
HOW MANY CIGARETTES IN
PAST 30 DAYS
q24 Frequency Percent
None 192 76.48
Less than 1 25 9.77> 1 and < 10 23 9.29
> 10 and < 1pk 6 2.40
> 1pk and < 2pks 5 2.06
Frequency Missing = 12.006033335
AMOUNT OF BEER AT ONE
TIME
q25a Frequency Percent
Never drink this 94 38.06
12+ drinks 25 9.929-11 drinks 15 5.85
5-8 drinks 21 8.62
3-4 drinks 20 8.03
2 drinks 26 10.45
1 drink 23 9.12
< 1 drink 25 9.95
Frequency Missing = 15.0259590
AMOUNT OF WINE COOLE
AT ONE TIM
q25b Frequency Perc
Never drink this 117 47
12+ drinks 6 2
9-11 drinks 3 1
5-8 drinks 10 4
3-4 drinks 27 11
2 drinks 26 10
1 drink 34 13
< 1 drink 21 8
Frequency Missing = 18.0336064
AMOUNT OF WINE AT ON
TIM
q25c Frequency Perc
Never drink this 147 60
12+ drinks 4 1
9-11 drinks 2 0
5-8 drinks 3 1
3-4 drinks 11 4
2 drinks 12 4
1 drink 29 11
< 1 drink 36 14
Frequency Missing = 18.0336064
AMOUNT OF LIQUOR AT ON
TIM
q25d Frequency Perc
Never drink this 110 44
12+ drinks 10 4
9-11 drinks 7 2
5-8 drinks 20 7
3-4 drinks 26 10
2 drinks 17 7
1 drink 30 12
< 1 drink 25 10
Frequency Missing = 16.9899556
The frequencies have been weighted so that the
analysis reflects the distribution of students by grade
level in the district
Page
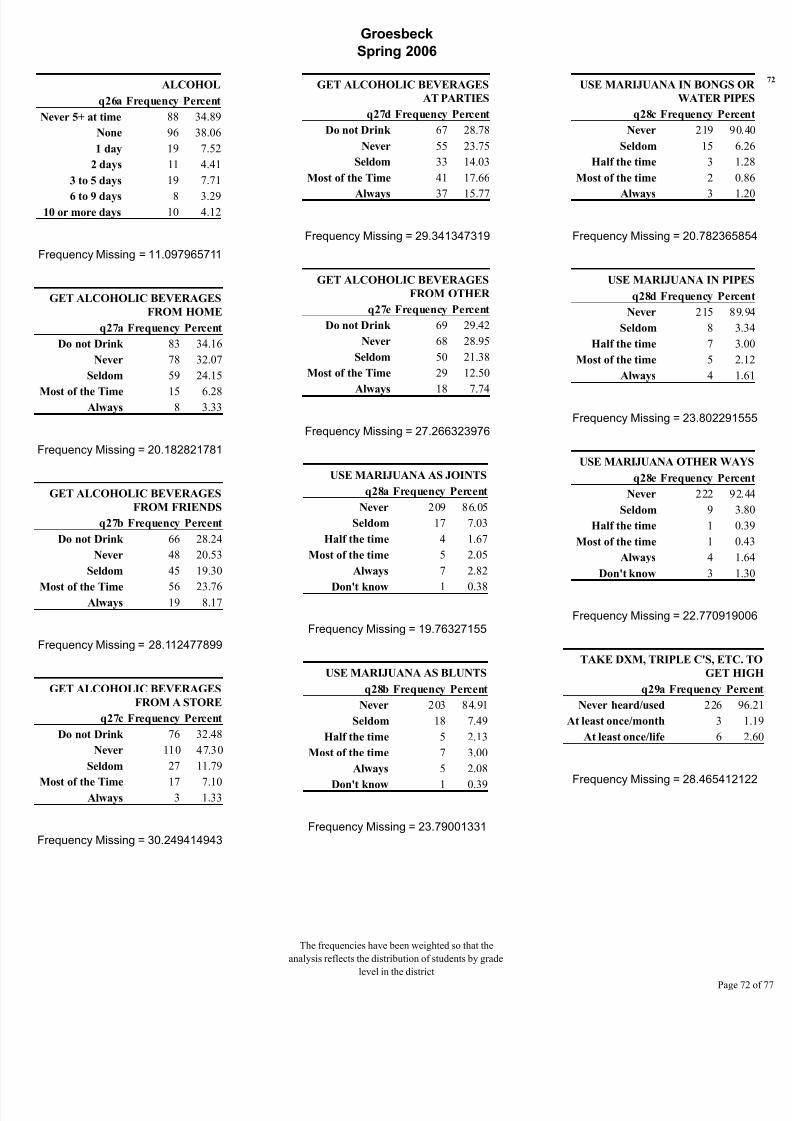
8/14/2019 LIMESTONE COUNTY - Groesbeck ISD - 2006 Texas School Survey of Drug and Alcohol Use
http://slidepdf.com/reader/full/limestone-county-groesbeck-isd-2006-texas-school-survey-of-drug-and-alcohol 72/77
Groesbeck
Spring 2006
ALCOHOL
q26a Frequency Percent
Never 5+ at time 88 34.89
None 96 38.06
1 day 19 7.52
2 days 11 4.41
3 to 5 days 19 7.71
6 to 9 days 8 3.2910 or more days 10 4.12
Frequency Missing = 11.097965711
GET ALCOHOLIC BEVERAGES
FROM HOME
q27a Frequency Percent
Do not Drink 83 34.16
Never 78 32.07
Seldom 59 24.15
Most of the Time 15 6.28Always 8 3.33
Frequency Missing = 20.182821781
GET ALCOHOLIC BEVERAGES
FROM FRIENDS
q27b Frequency Percent
Do not Drink 66 28.24
Never 48 20.53
Seldom 45 19.30
Most of the Time 56 23.76Always 19 8.17
Frequency Missing = 28.112477899
GET ALCOHOLIC BEVERAGES
FROM A STORE
q27c Frequency Percent
Do not Drink 76 32.48
Never 110 47.30
Seldom 27 11.79
Most of the Time 17 7.10Always 3 1.33
Frequency Missing = 30.249414943
GET ALCOHOLIC BEVERAGES
AT PARTIES
q27d Frequency Percent
Do not Drink 67 28.78
Never 55 23.75
Seldom 33 14.03
Most of the Time 41 17.66
Always 37 15.77
Frequency Missing = 29.341347319
GET ALCOHOLIC BEVERAGES
FROM OTHER
q27e Frequency Percent
Do not Drink 69 29.42
Never 68 28.95
Seldom 50 21.38
Most of the Time 29 12.50
Always 18 7.74
Frequency Missing = 27.266323976
USE MARIJUANA AS JOINTS
q28a Frequency Percent
Never 209 86.05
Seldom 17 7.03
Half the time 4 1.67
Most of the time 5 2.05
Always 7 2.82
Don't know 1 0.38
Frequency Missing = 19.76327155
USE MARIJUANA AS BLUNTS
q28b Frequency Percent
Never 203 84.91
Seldom 18 7.49
Half the time 5 2.13
Most of the time 7 3.00
Always 5 2.08
Don't know 1 0.39
Frequency Missing = 23.79001331
USE MARIJUANA IN BONGS O
WATER PIP
q28c Frequency Perc
Never 219 90
Seldom 15 6
Half the time 3 1
Most of the time 2 0
Always 3 1
Frequency Missing = 20.7823658
USE MARIJUANA IN PIP
q28d Frequency Perc
Never 215 89
Seldom 8 3
Half the time 7 3
Most of the time 5 2
Always 4 1
Frequency Missing = 23.8022915
USE MARIJUANA OTHER WA
q28e Frequency Perc
Never 222 92
Seldom 9 3
Half the time 1 0
Most of the time 1 0
Always 4 1
Don't know 3 1
Frequency Missing = 22.7709190
TAKE DXM, TRIPLE C'S, ETC
GET H
q29a Frequency Per
Never heard/used 226 9
At least once/month 3
At least once/life 6
Frequency Missing = 28.4654121
The frequencies have been weighted so that the
analysis reflects the distribution of students by grade
level in the district
Page
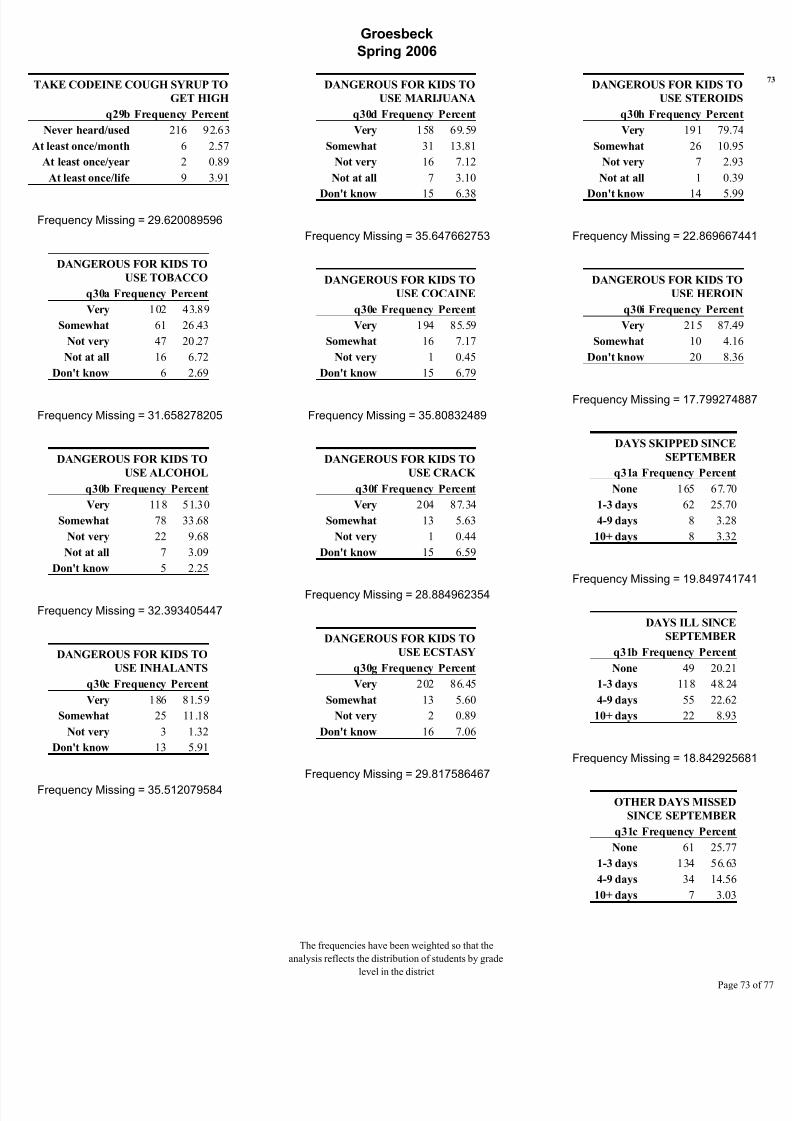
8/14/2019 LIMESTONE COUNTY - Groesbeck ISD - 2006 Texas School Survey of Drug and Alcohol Use
http://slidepdf.com/reader/full/limestone-county-groesbeck-isd-2006-texas-school-survey-of-drug-and-alcohol 73/77
Groesbeck
Spring 2006
TAKE CODEINE COUGH SYRUP TO
GET HIGH
q29b Frequency Percent
Never heard/used 216 92.63
At least once/month 6 2.57
At least once/year 2 0.89
At least once/life 9 3.91
Frequency Missing = 29.620089596
DANGEROUS FOR KIDS TO
USE TOBACCO
q30a Frequency Percent
Very 102 43.89
Somewhat 61 26.43
Not very 47 20.27
Not at all 16 6.72
Don't know 6 2.69
Frequency Missing = 31.658278205
DANGEROUS FOR KIDS TO
USE ALCOHOL
q30b Frequency Percent
Very 118 51.30
Somewhat 78 33.68
Not very 22 9.68
Not at all 7 3.09
Don't know 5 2.25
Frequency Missing = 32.393405447
DANGEROUS FOR KIDS TO
USE INHALANTS
q30c Frequency Percent
Very 186 81.59
Somewhat 25 11.18
Not very 3 1.32
Don't know 13 5.91
Frequency Missing = 35.512079584
DANGEROUS FOR KIDS TO
USE MARIJUANA
q30d Frequency Percent
Very 158 69.59
Somewhat 31 13.81
Not very 16 7.12
Not at all 7 3.10
Don't know 15 6.38
Frequency Missing = 35.647662753
DANGEROUS FOR KIDS TO
USE COCAINE
q30e Frequency Percent
Very 194 85.59
Somewhat 16 7.17
Not very 1 0.45
Don't know 15 6.79
Frequency Missing = 35.80832489
DANGEROUS FOR KIDS TO
USE CRACK
q30f Frequency Percent
Very 204 87.34
Somewhat 13 5.63
Not very 1 0.44
Don't know 15 6.59
Frequency Missing = 28.884962354
DANGEROUS FOR KIDS TO
USE ECSTASY
q30g Frequency Percent
Very 202 86.45
Somewhat 13 5.60
Not very 2 0.89
Don't know 16 7.06
Frequency Missing = 29.817586467
DANGEROUS FOR KIDS TO
USE STEROIDS
q30h Frequency Percen
Very 191 79.74
Somewhat 26 10.95
Not very 7 2.93
Not at all 1 0.39
Don't know 14 5.99
Frequency Missing = 22.8696674
DANGEROUS FOR KIDS TO
USE HEROIN
q30i Frequency Percen
Very 215 87.49
Somewhat 10 4.16
Don't know 20 8.36
Frequency Missing = 17.7992748
DAYS SKIPPED SINCE
SEPTEMBER
q31a Frequency Percent
None 165 67.70
1-3 days 62 25.70
4-9 days 8 3.28
10+ days 8 3.32
Frequency Missing = 19.8497417
DAYS ILL SINCE
SEPTEMBER
q31b Frequency Percent
None 49 20.21
1-3 days 118 48.24
4-9 days 55 22.62
10+ days 22 8.93
Frequency Missing = 18.8429256
OTHER DAYS MISSED
SINCE SEPTEMBER
q31c Frequency Percent
None 61 25.77
1-3 days 134 56.63
4-9 days 34 14.56
10+ days 7 3.03
The frequencies have been weighted so that the
analysis reflects the distribution of students by grade
level in the district
Page
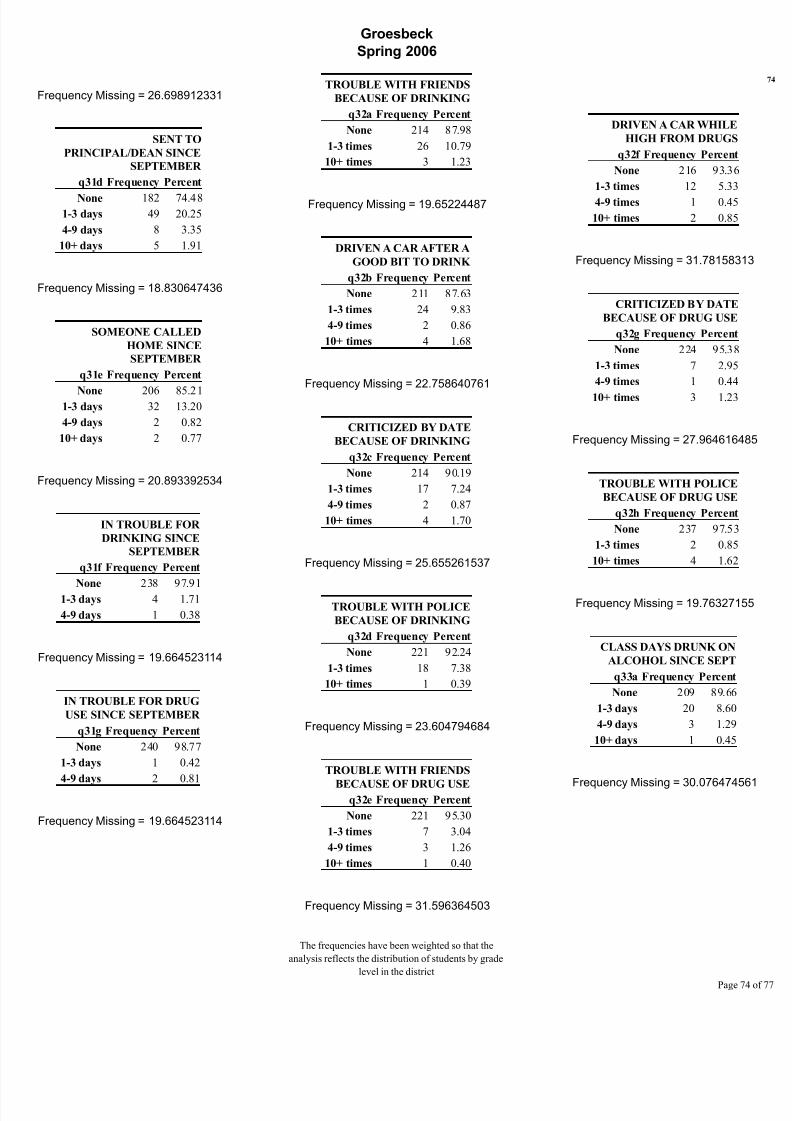
8/14/2019 LIMESTONE COUNTY - Groesbeck ISD - 2006 Texas School Survey of Drug and Alcohol Use
http://slidepdf.com/reader/full/limestone-county-groesbeck-isd-2006-texas-school-survey-of-drug-and-alcohol 74/77
Groesbeck
Spring 2006
Frequency Missing = 26.698912331
SENT TO
PRINCIPAL/DEAN SINCE
SEPTEMBER
q31d Frequency Percent
None 182 74.481-3 days 49 20.25
4-9 days 8 3.35
10+ days 5 1.91
Frequency Missing = 18.830647436
SOMEONE CALLED
HOME SINCE
SEPTEMBER
q31e Frequency Percent
None 206 85.211-3 days 32 13.20
4-9 days 2 0.82
10+ days 2 0.77
Frequency Missing = 20.893392534
IN TROUBLE FOR
DRINKING SINCE
SEPTEMBER
q31f Frequency Percent
None 238 97.911-3 days 4 1.71
4-9 days 1 0.38
Frequency Missing = 19.664523114
IN TROUBLE FOR DRUG
USE SINCE SEPTEMBER
q31g Frequency Percent
None 240 98.77
1-3 days 1 0.42
4-9 days 2 0.81
Frequency Missing = 19.664523114
TROUBLE WITH FRIENDS
BECAUSE OF DRINKING
q32a Frequency Percent
None 214 87.98
1-3 times 26 10.79
10+ times 3 1.23
Frequency Missing = 19.65224487
DRIVEN A CAR AFTER A
GOOD BIT TO DRINK
q32b Frequency Percent
None 211 87.63
1-3 times 24 9.83
4-9 times 2 0.86
10+ times 4 1.68
Frequency Missing = 22.758640761
CRITICIZED BY DATE
BECAUSE OF DRINKING
q32c Frequency Percent
None 214 90.19
1-3 times 17 7.24
4-9 times 2 0.87
10+ times 4 1.70
Frequency Missing = 25.655261537
TROUBLE WITH POLICE
BECAUSE OF DRINKING
q32d Frequency Percent
None 221 92.24
1-3 times 18 7.38
10+ times 1 0.39
Frequency Missing = 23.604794684
TROUBLE WITH FRIENDS
BECAUSE OF DRUG USEq32e Frequency Percent
None 221 95.30
1-3 times 7 3.04
4-9 times 3 1.26
10+ times 1 0.40
Frequency Missing = 31.596364503
DRIVEN A CAR WHILE
HIGH FROM DRUGS
q32f Frequency Percent
None 216 93.36
1-3 times 12 5.33
4-9 times 1 0.45
10+ times 2 0.85
Frequency Missing = 31.781583
CRITICIZED BY DATE
BECAUSE OF DRUG USE
q32g Frequency Percent
None 224 95.38
1-3 times 7 2.95
4-9 times 1 0.44
10+ times 3 1.23
Frequency Missing = 27.9646164
TROUBLE WITH POLICE
BECAUSE OF DRUG USE
q32h Frequency Percent
None 237 97.53
1-3 times 2 0.85
10+ times 4 1.62
Frequency Missing = 19.763271
CLASS DAYS DRUNK ON
ALCOHOL SINCE SEPT
q33a Frequency Percent
None 209 89.66
1-3 days 20 8.60
4-9 days 3 1.29
10+ days 1 0.45
Frequency Missing = 30.0764745
The frequencies have been weighted so that the
analysis reflects the distribution of students by grade
level in the district
Page
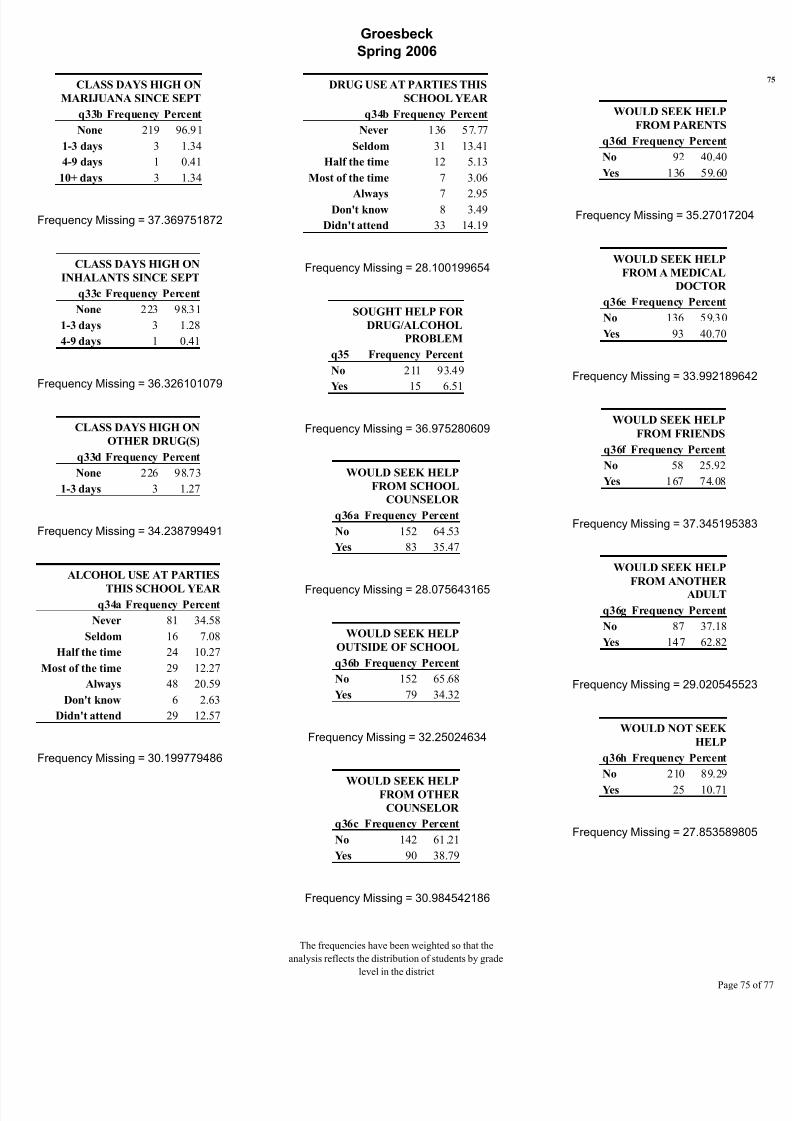
8/14/2019 LIMESTONE COUNTY - Groesbeck ISD - 2006 Texas School Survey of Drug and Alcohol Use
http://slidepdf.com/reader/full/limestone-county-groesbeck-isd-2006-texas-school-survey-of-drug-and-alcohol 75/77
Groesbeck
Spring 2006
CLASS DAYS HIGH ON
MARIJUANA SINCE SEPT
q33b Frequency Percent
None 219 96.91
1-3 days 3 1.34
4-9 days 1 0.41
10+ days 3 1.34
Frequency Missing = 37.369751872
CLASS DAYS HIGH ON
INHALANTS SINCE SEPT
q33c Frequency Percent
None 223 98.31
1-3 days 3 1.28
4-9 days 1 0.41
Frequency Missing = 36.326101079
CLASS DAYS HIGH ON
OTHER DRUG(S)
q33d Frequency Percent
None 226 98.73
1-3 days 3 1.27
Frequency Missing = 34.238799491
ALCOHOL USE AT PARTIES
THIS SCHOOL YEAR q34a Frequency Percent
Never 81 34.58
Seldom 16 7.08
Half the time 24 10.27
Most of the time 29 12.27
Always 48 20.59
Don't know 6 2.63
Didn't attend 29 12.57
Frequency Missing = 30.199779486
DRUG USE AT PARTIES THIS
SCHOOL YEAR
q34b Frequency Percent
Never 136 57.77
Seldom 31 13.41
Half the time 12 5.13
Most of the time 7 3.06
Always 7 2.95Don't know 8 3.49
Didn't attend 33 14.19
Frequency Missing = 28.100199654
SOUGHT HELP FOR
DRUG/ALCOHOL
PROBLEM
q35 Frequency Percent
No 211 93.49
Yes 15 6.51
Frequency Missing = 36.975280609
WOULD SEEK HELP
FROM SCHOOL
COUNSELOR
q36a Frequency Percent
No 152 64.53
Yes 83 35.47
Frequency Missing = 28.075643165
WOULD SEEK HELP
OUTSIDE OF SCHOOL
q36b Frequency Percent
No 152 65.68
Yes 79 34.32
Frequency Missing = 32.25024634
WOULD SEEK HELPFROM OTHER
COUNSELOR
q36c Frequency Percent
No 142 61.21
Yes 90 38.79
Frequency Missing = 30.984542186
WOULD SEEK HELP
FROM PARENTS
q36d Frequency Percent
No 92 40.40
Yes 136 59.60
Frequency Missing = 35.270172
WOULD SEEK HELP
FROM A MEDICAL
DOCTOR
q36e Frequency Percent
No 136 59.30
Yes 93 40.70
Frequency Missing = 33.9921896
WOULD SEEK HELP
FROM FRIENDS
q36f Frequency Percent
No 58 25.92
Yes 167 74.08
Frequency Missing = 37.3451953
WOULD SEEK HELP
FROM ANOTHER
ADULT
q36g Frequency Percent
No 87 37.18
Yes 147 62.82
Frequency Missing = 29.0205455
WOULD NOT SEEK
HELP
q36h Frequency Percent
No 210 89.29
Yes 25 10.71
Frequency Missing = 27.8535898
The frequencies have been weighted so that the
analysis reflects the distribution of students by grade
level in the district
Page

8/14/2019 LIMESTONE COUNTY - Groesbeck ISD - 2006 Texas School Survey of Drug and Alcohol Use
http://slidepdf.com/reader/full/limestone-county-groesbeck-isd-2006-texas-school-survey-of-drug-and-alcohol 76/77
Groesbeck
Spring 2006
DRUG/ALCOHOL
INFO--SCHOOL
HEALTH CLASS
q37a Frequency Percent
No 99 52.40
Yes 90 47.60
Frequency Missing = 73.826733814
DRUG/ALCOHOL
INFO--SCHOOL
ASSEMBLY PROGRAM
q37b Frequency Percent
No 74 38.91
Yes 116 61.09
Frequency Missing = 73.103884816
DRUG/ALCOHOL
INFO--SCHOOL
GUIDANCE
COUNSELOR
q37c Frequency Percent
No 117 66.35
Yes 59 33.65
Frequency Missing = 86.301430359
DRUG/ALCOHOL
INFO--SCIENCE CLASS
q37d Frequency Percent
No 141 76.84
Yes 43 23.16
Frequency Missing = 79.267041143
DRUG/ALCOHOL
INFO--SOCIAL
STUDIES CLASS
q37e Frequency Percent
No 162 87.66Yes 23 12.34
Frequency Missing = 77.890310309
DRUG/ALCOHOL
INFO--SCHOOL
STUDENT GROUP OR
CLUB
q37f Frequency Percent
No 154 82.53
Yes 33 17.47
Frequency Missing = 76.994520929
DRUG/ALCOHOL
INFO--INVITED
SCHOOL GUEST
q37g Frequency Percent
No 95 50.63
Yes 92 49.37
Frequency Missing = 75.96314838
DRUG/ALCOHOL
INFO--ANOTHER
SCHOOL SOURCE
q37h Frequency Percent
No 113 59.79
Yes 76 40.21
Frequency Missing = 74.808470906
DRUG/ALCOHOL INFO--
WEBSITE/ONLINE CHAT
GROUP
q38a Frequency Percent
No 143 63.93
Yes 81 36.07
Frequency Missing = 39.32147029
DRUG/ALCOHOL INFO--
BOOKS/MAGAZINES/POSTERS/PA
MPHLETS
q38b FrequencyNo 100
Yes 121
DRUG/ALCOHOL IN
BOOKS/MAGAZINES/POSTERS
MPHL
q38b Per
No 4
Yes 5
Frequency Missing = 41.2854669
DRUG/ALCOHOL INFO--
TV/RADIO/OTHER
AUDIO/VIDEO
q38c Frequency Percent
No 95 41.55
Yes 133 58.45
Frequency Missing = 35.2456155
DRUG/ALCOHOL
INFO--PARENTS
q38d Frequency Percent
No 108 47.75
Yes 118 52.25
Frequency Missing = 37.2218904
PARENTS FEEL ABOUT K
SMOKING CIGAR
q39a Frequency Per
Strong disapprove 151 6
Mild disapprove 34 1
Neither 22
Mildly approve 9
Strongly approve 2
Don't know 14
Frequency Missing = 31.107847
PARENTS FEEL ABOUT K
DRINKING BE
q39b Frequency Per
Strong disapprove 132 5
Mild disapprove 47 2
Neither 26 1
Mildly approve 8
Strongly approve 3
Don't know 13
The frequencies have been weighted so that the
analysis reflects the distribution of students by grade
level in the district
Page

8/14/2019 LIMESTONE COUNTY - Groesbeck ISD - 2006 Texas School Survey of Drug and Alcohol Use
http://slidepdf.com/reader/full/limestone-county-groesbeck-isd-2006-texas-school-survey-of-drug-and-alcohol 77/77
Groesbeck
Spring 2006
Frequency Missing = 33.195148698
PARENTS FEEL ABOUT KIDS
USING MARIJUANA
q39c Frequency Percent
Strong disapprove 200 87.61
Mild disapprove 9 4.01
Neither 3 1.32
Mildly approve 2 0.87
Strongly approve 1 0.46
Don't know 13 5.74
Frequency Missing = 35.257893796
TESTED FOR DRUG
USE AT SCHOOL
q40 Frequency Percent
No 184 79.10
Yes 49 20.90
Frequency Missing = 30.101031051
PURCHASED
LOTTERY TICKET IN
PAST YEAR
q41 Frequency Percent
No 171 75.90
Yes 54 24.10
Frequency Missing = 37.271003437