lignin-based polyurethanes: characterisation, synthesis ... · lignin-based polyurethanes:...
TRANSCRIPT
Lignin-Based Polyurethanes: Characterisation, Synthesis and Applications
A dissertation submitted to:
Faculdade de Engenharia da Universidade do Porto (FEUP) to obtain the degree of Doctor
in Biological and Chemical Engineering
and
Ecole Internationale du Papier, de la Communication Imprimée et des Biomatériaux de
l´Institut Polytechnique de Grenoble (PAGORA-INP) to obtain the degree Doctor in
Materials, Mechanics, Civil Engineering and Electrochemistry.
by
Carolina Andreia Borges Cateto
December 2008
Supervisors:
Portuguese Part: Doutor Alírio Egídio Rodrigues (supervisor)
Professor Catedrático
Faculdade de Engenharia da Universidade do Porto
Doutora Maria Filomena Filipe Barreiro (co-supervisor)
Professora Adjunta
Instituto Politécnico de Bragança
French Part: Docteur Naceur Belgacem (supervisor)
Professeur de l’INP
Institut Polytechnique de Grenoble
Acknowledgements
To the Laboratory of Separation and Reaction Engineering (LSRE), in the person of
Professor Alírio Rodrigues and to the Laboratory of Pulp and Paper Science and
Graphic Arts (LGP2), in the person of Professor Naceur Belgacem, for conjunctly having
provided the facilities and technical conditions needed to perform this work.
To EStiG-IPB, in the person of Professor Paulo Leitão, for the support given during my
long stays at LSRE-IPB.
I deeply thank my supervisors, Professor Alírio Rodrigues, Professor Filomena Barreiro
and Professor Naceur Belgacem for their guidance, comments and constructive advices.
Thank you, for having contributed for my scientific and personal growth and having
provided me the opportunity to perform this work.
I deeply express my gratitude to Filomena Barreiro and Naceur Belgacem for their
continuous friendship, confidence and encouragement during the past four years.
I would like to express my gratitude to Marie-Christine for her help with NMR
experiments and data interpretation, as well as, for constant encouragement and friendship.
To Wim Thielemans for the support and patience demonstrated during my first stay at
PAGORA. Thank you for always solved/answered my little “problems and questions”.
I thank Professor Dmitry Evtuguin (Aveiro University) for having provided the facilities to
perform the VPO experiments and to the CSTB and LEPMI-INP (Grenoble) for having
provided the access to their facilities.
I thank to my colleagues from the LSRE-Bragança for their friendship and help during the
course of this work. A special thank to Patrícia, Miguel and Patrick.
To the personnel of PAGORA for the friendship demonstrated and assistance given during
the realisation of this work. I thank in particular to Charlotte, Chu Ly Bliamay, Bertine
Khelifi and Philippe Serpollet and to all personnel from the technical department (merci
pour l´aide avec le réacteur!). I cannot let to mention the help given by Nicolas Benattar
(sugars determination) and by Professor Didier Chaussy (RPU foams characterisation).

To Sandra and Michael from the Technological Centre of Paper (CTP) for the friendship
demonstrated.
I would like to mention the generations of “thésards” and “stagiaires” that I had
opportunity to meet at PAGORA (Ergi, Sabrina, Carla, Gisela, Alessandra, Sebastian,
Mishra, “les Jeremies”, Abdelkader, Filipe, Mário, Olivier, Sandeep...). Thank you for the
good ambience and for making each period at PAGORA, each time so different, always so
rich and special. A special thank to my close friends Mercês, Marta, Gilberto, Babacar and
Quim, for being my family during my Grenoble stays. I will never forget your continuous
support, care, the “coffee breaks” at the end of the day, and of course, ours enthusiastic
scientific discussions. Thank you, for always being there when I needed the most.
I would like to make a special dedication to Mathieu for its love, patience, comprehension,
and continuous encouragement (thank you for always making me see the good side of life).
I acknowledge Meadwestvaco, BorregaardLignoTech and Dr. Jairo Lora for kindly
providing the lignin samples used in this work. I would like also to thank Solvay Interox
(U.K.) and Elastogran-BASF (France) for kindly providing some of the reactants used in
this work.
I acknowledge the financial support provided by the Portuguese Foundation for Science
and Technology (grant SFRH/BD/18415/2004) and by the French-Portuguese Scientific
Cooperation Programme (actions F-13/06 and F32/08).
I thank to all the persons that directly or indirectly contributed to the accomplishment of
this work.
Thank you all of you!
Obrigado a todos vocês!
Merci beaucoup à vous tous!

To my parents and brother
To my grand-mother Maria

The world lies in the hands of those who
have the courage to dream and who take
the risk of living out their dreams.
(Albert Schweitzer)
SUMMARY
In this work, lignins role as a macromonomer in polyurethane synthesis was evaluated following two different approches: (i) utilisation after chemical modification and (ii) direct utilisation. Lignin as a renewable raw material was evaluated considering aspects such as structure, type, sources and extraction processes. Thus, Alcell, Sarkanda, Indulin AT and Curan 27-11P were chosen aiming to represent three different botanical origins (hardwood, softwood and non-wood), as well as three different pulp processes (kraft, soda and organosolv) and a study was performed regarding its structural characterisation, quantification of its functional groups and evaluation of thermal properties. Moreover, a comparative study regarding lignin hydroxyl groups characterisation was performed using several techniques and methods available in the literature including titration, 1H-, 13C- and 31P-NMR spectroscopy. The obtained results were compared and their reliability evaluated. In the first approach, the four technical lignins were converted into liquid polyols by chain extension reaction with propylene oxide (oxypropylation). Polyol formulation was first optimised with Alcell lignin by inspecting the effect of lignin/propylene oxide ratio, and the catalyst content on homopolymer content, molecular weight, hydroxyl number, viscosity and glass transition temperature. Based on the obtained results three formulations were chosen and applied to the other lignin samples. The produced polyols were characterised and their hydroxyl number and viscosity were found to be in the range of those typical of commercial polyols employed in rigid polyurethane foam preparation. Finally, two formulations were produced at a large scale and used to produce rigid polyurethane (RPU) foams with lignin-based polyols contents from 25 to 100% (w/w). The produced RPU foams were evaluated in terms of density, morphology, mechanical and insulating properties. In the second approach Alcell and Indulin AT lignins were used directly as co-monomer in combination with a linear polycaprolactone (PCL). The polymerisation reaction was carried in bulk and without catalyst which clearly evidences green connotations. The following variables were studied: kraft and organosolv lignins with different contents (10, 15, 20 and 25% (w/w)), PCL with molecular weights of 400, 750 and 1000 and [NCO]/[OH] ratios of 0.8, 1.0 and 1.25. Formation of lignin-based polyurethanes was monitored by fourier transform infrared spectroscopy working in attenuated total reflectance mode (FTIR-ATR) and kinetics was analysed according to a global second order model. The thermo-mechanical properties of the resulting materials were determined by dynamical mechanical analysis (DMA), differential scanning calorimetry (DSC) and by performing swelling tests. Face to the achieved results, this study provides irrefutable evidence about the possibility to incorporate lignin in polyurethane materials. A wide range of polyurethane materials presenting properties which depend on the lignin type and content were prepared. Moreover, both approaches of using lignin (as such or after chemical modification, oxypropylation) yielded materials with very promising properties. In most cases, these materials exhibit properties similar to those of conventional ones, thus presenting a viable option to rationally valorise an abundant renewable industrial by-product.
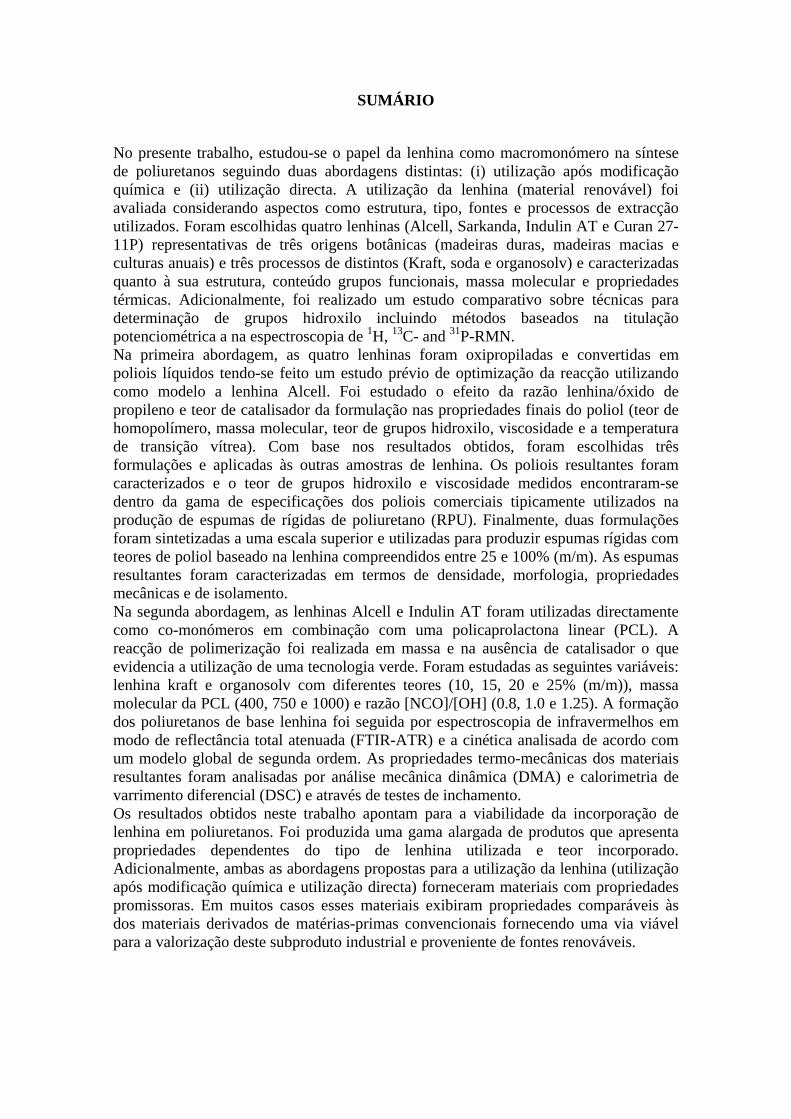
SUMÁRIO
No presente trabalho, estudou-se o papel da lenhina como macromonómero na síntese de poliuretanos seguindo duas abordagens distintas: (i) utilização após modificação química e (ii) utilização directa. A utilização da lenhina (material renovável) foi avaliada considerando aspectos como estrutura, tipo, fontes e processos de extracção utilizados. Foram escolhidas quatro lenhinas (Alcell, Sarkanda, Indulin AT e Curan 27-11P) representativas de três origens botânicas (madeiras duras, madeiras macias e culturas anuais) e três processos de distintos (Kraft, soda e organosolv) e caracterizadas quanto à sua estrutura, conteúdo grupos funcionais, massa molecular e propriedades térmicas. Adicionalmente, foi realizado um estudo comparativo sobre técnicas para determinação de grupos hidroxilo incluindo métodos baseados na titulação potenciométrica a na espectroscopia de 1H, 13C- and 31P-RMN. Na primeira abordagem, as quatro lenhinas foram oxipropiladas e convertidas em poliois líquidos tendo-se feito um estudo prévio de optimização da reacção utilizando como modelo a lenhina Alcell. Foi estudado o efeito da razão lenhina/óxido de propileno e teor de catalisador da formulação nas propriedades finais do poliol (teor de homopolímero, massa molecular, teor de grupos hidroxilo, viscosidade e a temperatura de transição vítrea). Com base nos resultados obtidos, foram escolhidas três formulações e aplicadas às outras amostras de lenhina. Os poliois resultantes foram caracterizados e o teor de grupos hidroxilo e viscosidade medidos encontraram-se dentro da gama de especificações dos poliois comerciais tipicamente utilizados na produção de espumas de rígidas de poliuretano (RPU). Finalmente, duas formulações foram sintetizadas a uma escala superior e utilizadas para produzir espumas rígidas com teores de poliol baseado na lenhina compreendidos entre 25 e 100% (m/m). As espumas resultantes foram caracterizadas em termos de densidade, morfologia, propriedades mecânicas e de isolamento. Na segunda abordagem, as lenhinas Alcell e Indulin AT foram utilizadas directamente como co-monómeros em combinação com uma policaprolactona linear (PCL). A reacção de polimerização foi realizada em massa e na ausência de catalisador o que evidencia a utilização de uma tecnologia verde. Foram estudadas as seguintes variáveis: lenhina kraft e organosolv com diferentes teores (10, 15, 20 e 25% (m/m)), massa molecular da PCL (400, 750 e 1000) e razão [NCO]/[OH] (0.8, 1.0 e 1.25). A formação dos poliuretanos de base lenhina foi seguida por espectroscopia de infravermelhos em modo de reflectância total atenuada (FTIR-ATR) e a cinética analisada de acordo com um modelo global de segunda ordem. As propriedades termo-mecânicas dos materiais resultantes foram analisadas por análise mecânica dinâmica (DMA) e calorimetria de varrimento diferencial (DSC) e através de testes de inchamento. Os resultados obtidos neste trabalho apontam para a viabilidade da incorporação de lenhina em poliuretanos. Foi produzida uma gama alargada de produtos que apresenta propriedades dependentes do tipo de lenhina utilizada e teor incorporado. Adicionalmente, ambas as abordagens propostas para a utilização da lenhina (utilização após modificação química e utilização directa) forneceram materiais com propriedades promissoras. Em muitos casos esses materiais exibiram propriedades comparáveis às dos materiais derivados de matérias-primas convencionais fornecendo uma via viável para a valorização deste subproduto industrial e proveniente de fontes renováveis.
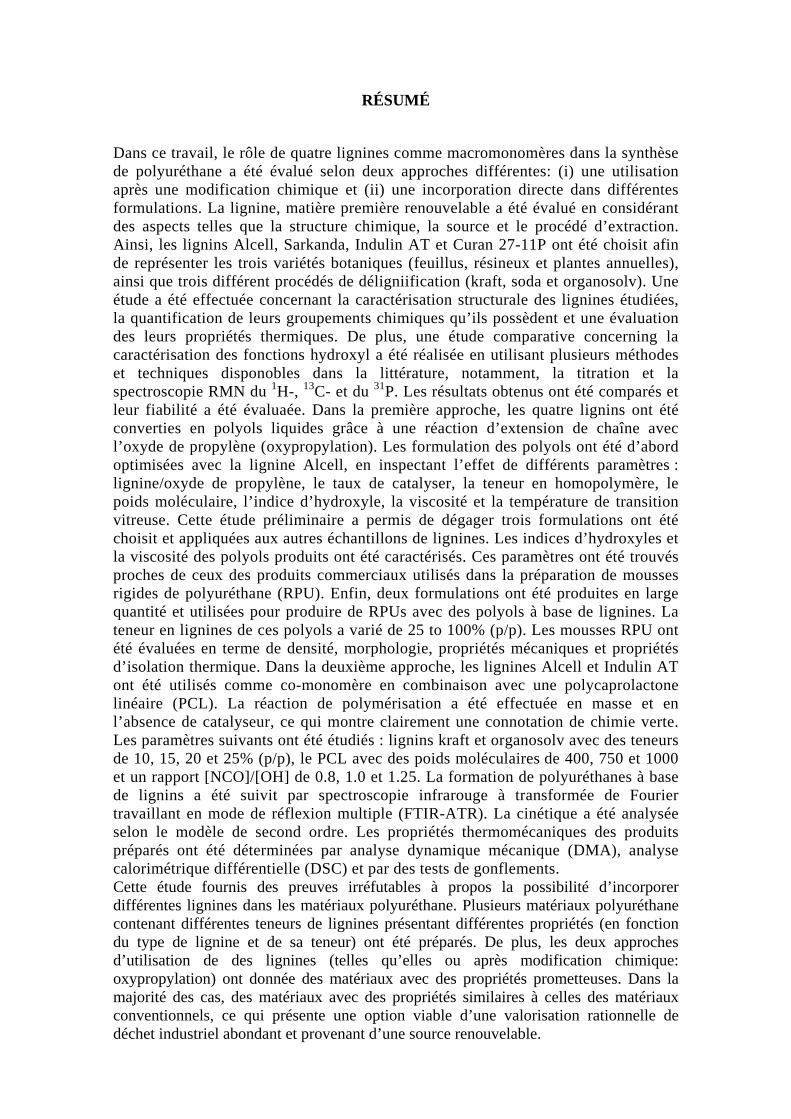
RÉSUMÉ
Dans ce travail, le rôle de quatre lignines comme macromonomères dans la synthèse de polyuréthane a été évalué selon deux approches différentes: (i) une utilisation après une modification chimique et (ii) une incorporation directe dans différentes formulations. La lignine, matière première renouvelable a été évalué en considérant des aspects telles que la structure chimique, la source et le procédé d’extraction. Ainsi, les lignins Alcell, Sarkanda, Indulin AT et Curan 27-11P ont été choisit afin de représenter les trois variétés botaniques (feuillus, résineux et plantes annuelles), ainsi que trois différent procédés de déligniification (kraft, soda et organosolv). Une étude a été effectuée concernant la caractérisation structurale des lignines étudiées, la quantification de leurs groupements chimiques qu’ils possèdent et une évaluation des leurs propriétés thermiques. De plus, une étude comparative concerning la caractérisation des fonctions hydroxyl a été réalisée en utilisant plusieurs méthodes et techniques disponobles dans la littérature, notamment, la titration et la spectroscopie RMN du 1H-, 13C- et du 31P. Les résultats obtenus ont été comparés et leur fiabilité a été évaluaée. Dans la première approche, les quatre lignins ont été converties en polyols liquides grâce à une réaction d’extension de chaîne avec l’oxyde de propylène (oxypropylation). Les formulation des polyols ont été d’abord optimisées avec la lignine Alcell, en inspectant l’effet de différents paramètres : lignine/oxyde de propylène, le taux de catalyser, la teneur en homopolymère, le poids moléculaire, l’indice d’hydroxyle, la viscosité et la température de transition vitreuse. Cette étude préliminaire a permis de dégager trois formulations ont été choisit et appliquées aux autres échantillons de lignines. Les indices d’hydroxyles et la viscosité des polyols produits ont été caractérisés. Ces paramètres ont été trouvés proches de ceux des produits commerciaux utilisés dans la préparation de mousses rigides de polyuréthane (RPU). Enfin, deux formulations ont été produites en large quantité et utilisées pour produire de RPUs avec des polyols à base de lignines. La teneur en lignines de ces polyols a varié de 25 to 100% (p/p). Les mousses RPU ont été évaluées en terme de densité, morphologie, propriétés mécaniques et propriétés d’isolation thermique. Dans la deuxième approche, les lignines Alcell et Indulin AT ont été utilisés comme co-monomère en combinaison avec une polycaprolactone linéaire (PCL). La réaction de polymérisation a été effectuée en masse et en l’absence de catalyseur, ce qui montre clairement une connotation de chimie verte. Les paramètres suivants ont été étudiés : lignins kraft et organosolv avec des teneurs de 10, 15, 20 et 25% (p/p), le PCL avec des poids moléculaires de 400, 750 et 1000 et un rapport [NCO]/[OH] de 0.8, 1.0 et 1.25. La formation de polyuréthanes à base de lignins a été suivit par spectroscopie infrarouge à transformée de Fourier travaillant en mode de réflexion multiple (FTIR-ATR). La cinétique a été analysée selon le modèle de second ordre. Les propriétés thermomécaniques des produits préparés ont été déterminées par analyse dynamique mécanique (DMA), analyse calorimétrique différentielle (DSC) et par des tests de gonflements. Cette étude fournis des preuves irréfutables à propos la possibilité d’incorporer différentes lignines dans les matériaux polyuréthane. Plusieurs matériaux polyuréthane contenant différentes teneurs de lignines présentant différentes propriétés (en fonction du type de lignine et de sa teneur) ont été préparés. De plus, les deux approches d’utilisation de des lignines (telles qu’elles ou après modification chimique: oxypropylation) ont donnée des matériaux avec des propriétés prometteuses. Dans la majorité des cas, des matériaux avec des propriétés similaires à celles des matériaux conventionnels, ce qui présente une option viable d’une valorisation rationnelle de déchet industriel abondant et provenant d’une source renouvelable.
i
Table of Contents
Table of contents ................................................................................................................i
List of Figures .................................................................................................................... v
List of Tables ................................................................................................................... xv
Nomenclature.................................................................................................................. xix
1. Motivation and objectives ........................................................................................... 1
2. Introduction ................................................................................................................. 7
2.1 References ..................................................................................................... 16
3. Lignin characterisation ............................................................................................. 19
3.1 Literature review ........................................................................................... 20
3.1.1 Wet chemical methods for structural analysis....................................................... 21
3.1.2 Wet chemical methods for functional group analysis ........................................... 25
3.1.3 Spectroscopic techniques applied to lignin characterisation ................................. 28
3.1.4 Molecular weight determination ........................................................................... 33
3.1.5 Determination of thermal properties ..................................................................... 35
3.2 Materials and methods ................................................................................... 36
3.2.1 Lignin samples ...................................................................................................... 36
3.2.2 Ash content ............................................................................................................ 37
3.2.3 External acidity/ alkalinity determination ............................................................. 37
3.2.4 Elemental analysis ................................................................................................. 38
3.2.5 Sugar content determination .................................................................................. 38
3.2.6 Fourier transform infrared spectroscopy (FTIR) analysis ..................................... 39
3.2.7 Hydroxyl determination by titration ...................................................................... 39
3.2.8 Sample preparation for NMR analysis .................................................................. 40
3.2.8.1 13C-NMR analysis ................................................................................... 40
3.2.8.2 1H-NMR analysis .................................................................................... 41
3.2.8.3 31P-NMR analysis .................................................................................... 41
3.2.9 NMR instrumentation and procedures ................................................................... 41
3.2.9.1 13C-NMR analysis ................................................................................... 41
3.2.9.2 1H-NMR analysis .................................................................................... 42
3.2.9.3 31P-NMR analysis .................................................................................... 42
3.2.9.4 DEPT, APT and 2D-NMR analysis ......................................................... 43
ii
3.2.10 Molecular weight determination ......................................................................... 43
3.2.10.1 Size exclusion chromatography (SEC) analysis .................................... 43
3.2.10.2 Vapour pressure osmometry (VPO) analysis ........................................ 44
3.2.11 Thermal analysis ................................................................................................. 44
3.2.11.1 Thermogravimetric analysis (TGA) ...................................................... 44
3.2.11.2 Differential scanning calorimetric (DSC) analysis ............................... 44
3.3 Results and discussion ................................................................................... 45
3.3.1 Elemental analysis, ash content and external acidity/ alkalinity ........................... 45
3.3.2 Sugar content determination ................................................................................. 46
3.3.3 Structural characterisation .................................................................................... 46
3.3.3.1 FTIR analysis .......................................................................................... 46
3.3.3.2 NMR analysis.......................................................................................... 49
3.3.4 Determination of approximate C9 empirical formula ........................................... 56
3.3.5 Hydroxyl groups determination ............................................................................ 57
3.3.5.1 Total hydroxyl content ............................................................................ 57
3.3.5.2 Phenolic hydroxyl content ...................................................................... 61
3.3.5.3 Aliphatic hydroxyl content ...................................................................... 64
3.3.6 Molecular weight determination ........................................................................... 64
3.3.7 Thermal analysis ................................................................................................... 66
3.3.7.1 Thermogravimetric analysis (TGA) ........................................................ 66
3.3.7.2 Differential scanning calorimetric (DSC) analysis ................................. 68
3.4 Conclusions ................................................................................................... 69
3.5 References ..................................................................................................... 71
4. Utilisation of modified lignin by oxypropylation .................................................... 85
4.1 Literature review ........................................................................................... 86
4.1.1 Lignin oxypropylation .......................................................................................... 86
4.1.2 Rigid polyurethane foams ..................................................................................... 91
4.2 Material and methods .................................................................................... 97
4.2.1 Lignin oxypropylation reaction ............................................................................ 97
4.2.1.1 Starting materials .................................................................................... 97
4.2.1.2 Oxypropylation reaction conditions ........................................................ 97
4.2.1.3 Characterisation of oxypropylated lignins .............................................. 98
Fourier transform infrared spectroscopy (FTIR) analysis .......................... 98
NMR measurements ................................................................................... 98
Homopolymer content determination ......................................................... 98
Size exclusion chromatography (SEC) measurements ............................... 98
Hydroxyl number (IOH) determination........................................................ 99
Viscosity (µ) measurements ..................................................................... 100
iii
Differential scanning calorimetric (DSC) analysis ................................... 101
4.2.2 Rigid polyurethane foams preparation ................................................................ 101
4.2.2.1 Starting materials ................................................................................... 101
4.2.2.2 Formulation details and preparation ...................................................... 101
4.2.2.3 Characterisation of RPU foams ............................................................. 102
Apparent density determination ................................................................ 102
Compression measurements ..................................................................... 103
Conductivity measurements ...................................................................... 103
Morphologic analysis ............................................................................... 103
4.3 Results and Discussion ................................................................................ 104
4.3.1 Oxypropylation optimisation study ..................................................................... 104
4.3.1.1 General considerations .......................................................................... 104
4.3.1.2 Homopolymer content ........................................................................... 108
4.3.1.3 Average-molecular weight analysis....................................................... 110
4.3.1.4 Hydroxyl number .................................................................................. 114
4.3.1.5 Viscosity ................................................................................................ 117
4.3.1.6 Glass transition temperature .................................................................. 118
4.3.2 Lignin-based polyols preparation ........................................................................ 121
4.3.3 Rigid polyurethane foams preparation ................................................................ 129
4.3.3.1 General considerations .......................................................................... 129
4.3.3.2 Rigid polyurethane foams prepared with 20/80/5 polyols ..................... 129
4.3.3.3 Rigid polyurethane foams prepared with 30/70/2 polyols ..................... 134
4.4 Conclusions and perspectives ...................................................................... 136
4.5 References ................................................................................................... 139
5. Utilisation of lignin without chemical modification ............................................. 143
5.1 Literature review ......................................................................................... 144
5.2 Materials and methods ................................................................................. 153
5.2.1 Synthesis of lignin based polyurethanes ............................................................. 153
5.2.1.1 Starting materials ................................................................................... 153
5.2.1.2 Lignin-based polyurethanes: formulations and synthesis ...................... 154
5.2.2 FTIR-ATR monitoring ........................................................................................ 155
5.2.3 Thermo-mechanical characterisation of lignin-based polyurethanes .................. 157
5.2.3.1 Differential scanning calorimetric (DSC) analysis ................................ 157
5.2.3.2 Dynamical mechanical analysis (DMA) ............................................... 157
5.2.4 Swelling tests ...................................................................................................... 158
5.3 Results and discussion ................................................................................. 159
5.3.1 FTIR-ATR monitoring data analysis .................................................................. 159
5.3.1.1 Analysis of a typical FTIR-ATR spectrum ........................................... 159
iv
5.3.1.2 Isocyanate absorption analysis .............................................................. 160
5.3.2 Isocyanate conversion analysis ........................................................................... 162
5.3.2.1 Alcell based polyurethanes ................................................................... 162
5.3.2.2 Indulin AT based polyurethanes ........................................................... 163
5.3.3 Kinetic data analysis ........................................................................................... 166
5.3.3.1 Considerations about the used kinetic model ........................................ 166
5.3.3.2 Reference experiments .......................................................................... 168
5.3.3.3 Alcell based polyurethanes ................................................................... 168
5.3.3.4 Indulin AT based polyurethanes ........................................................... 173
5.3.4 Characterisation of lignin-based polyurethane samples ..................................... 178
5.3.4.1 Samples planning and general observations .......................................... 178
5.3.4.2 Alcell based polyurethanes ................................................................... 179
5.3.4.3 Indulin AT based polyurethanes ........................................................... 186
5.4 Conclusions and perspectives ...................................................................... 191
5.5 References ................................................................................................... 194
6. Final conclusions and perspectives of future work .............................................. 199
Annexes ....................................................................................................................... 203
A Additional data for chapter 3 ........................................................................ 204
B Additional data for chapter 4 ........................................................................ 214
C Additional data for chapter 5 ........................................................................ 227
v
List of Figures
1. Motivation and objectives
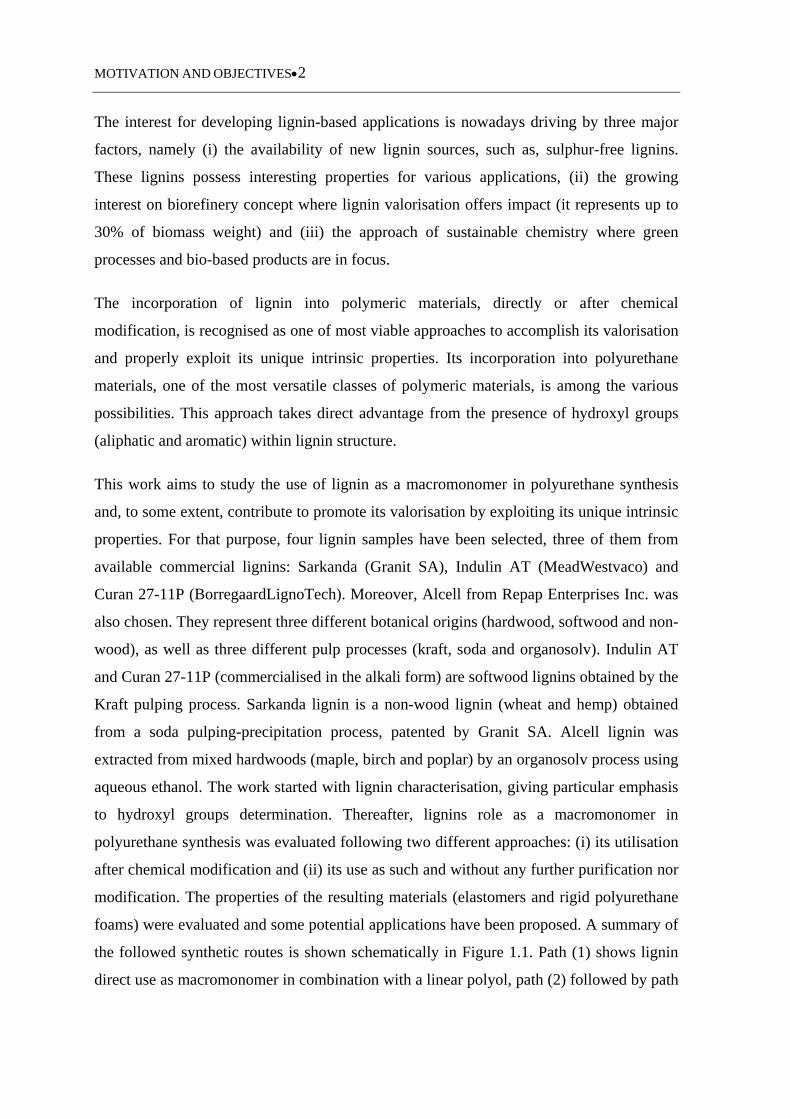
Figure 1.1 Schematic representation of the approaches followed in this work to
incorporate lignin into polyurethane materials, namely: (1) direct use, (2)
synthesis of liquid polyols and (3) synthesis of rigid polyurethane foams
using lignin-based polyols ......................................................................... 3
2. Introduction
Figure 2.1 Lignin primary precursors .......................................................................... 9
Figure 2.2 Lignin phenylpropane structural units ....................................................... 9
Figure 2.3 Lignin structure proposed by Adler (1977) ............................................. 10
Figure 2.4 New product opportunities from lignin (in Holladay et al., 2007) .......... 15
3. Lignin characterisation
Figure 3.1 FTIR spectra obtained for the four lignin samples (a) Alcell (b) Sarkanda
(c) Indulin AT (d) Curan 27-11P. The region between 1800-750 cm-1 is
shown in detail ......................................................................................... 48
Figure 3.2 Main linkages found between phenylpropane units ................................. 53
Figure 3.3 13C-NMR spectra obtained for the four lignin samples (a) Alcell (b)
Sarkanda (c) Indulin AT (d) Curan 27-11P ............................................. 54
Figure 3.4 13C-NMR and FTIR spectra of Curan 27-11P lignin, acetylated according
to the ISO standard procedure. Comparison between original and
acetylated samples ................................................................................... 58
Figure 3.5 31P-NMR spectra of Alcell lignin ............................................................ 60
Figure 3.6 Comparison between the total hydroxyl content by different techniques,
namely: titration using the ISO standard, 13C-NMR (1: acetylation
according to ISO standard and 2: acetylation according to the modified
Månsson method) and by 31P-NMR. To clarify the representation the
Alcell lignin was identified by smaller orange symbols .......................... 60
vi
Figure 3.7 Comparison between the phenolic hydroxyl content obtained by different
techniques, namely: 13C-NMR (1: acetylation according to ISO standard
and 2: acetylation according to the modified Månsson method), by 31P-
NMR and by 1H-NMR ............................................................................. 62
Figure 3.8 1H-NMR spectra obtained for Alcell lignin before and after the addition
of D2O ...................................................................................................... 63
Figure 3.9 Elution profiles obtained for Alcell, Sarkanda and Indulin AT lignins ... 65
Figure 3.10 Thermogravimetric curves obtained for the four lignin samples under (i)
helium and (ii) air atmosphere ................................................................. 67
Figure 3.11 DSC traces obtained for the four lignin samples. Tg is assigned by a
black marker ............................................................................................ 68
4. Utilisation of modified lignin by oxypropylation
Figure 4.1 Schematic representation of a second order nucleophilic substitution (i)
normal SN-2 and (ii) abnormal SN-2 type .............................................. 87
Figure 4.2 Secondary reactions occurring during oxypropylation reactions (i)
homopolymerisation of PO and (ii) transfer reaction with PO monomer ...
................................................................................................................. 88
Figure 4.3 Schematic representation of the reactions involved in lignin
oxypropylation ......................................................................................... 89
Figure 4.4 Urethane group reaction formation .......................................................... 93
Figure 4.5 Formation of an allophanate group .......................................................... 93
Figure 4.6 First step of the blow reaction ................................................................. 94
Figure 4.7 Formation of a biuret group ..................................................................... 94
Figure 4.8 Isocyanate dimerisation reactions ............................................................ 95
Figure 4.9 Isocyanate trimerisation reaction ............................................................. 95
Figure 4.10 FTIR and 1H-NMR comparative spectra of (a) Alcell original lignin and
(b) Alcell lignin after oxypropylation reaction (formulation 30/70/2) ........
............................................................................................................... 105
Figure 4.11 Comparison between 13C-NMR spectra of (a) original polyol mixture, (b)
oxypropylated lignin fraction, (c) homopolymer fraction and (c)
commercial polypropylene glycol ......................................................... 108
Figure 4.12 Typical structure of a PPO head-to-tail ................................................. 109
vii
Figure 4.13 Comparison between the chromatograms obtained for the original polyol
mixture, homopolymer and oxypropylated lignin fractions .................. 111
Figure 4.14 Evolution of homopolymer content as a function of catalyst content for
the series 10/90, 20/30, 30/70 and 40/60 ............................................... 111
Figure 4.15 Chromatographic profile evolution as a function of catalyst content for
the series (i) 10/90, (ii) 20/80, (iii) 30/70 and (iv) 40/60 ....................... 112
Figure 4.16 Chromatographic profile evolution as a function of L/PO ratios for a
fixed catalyst content of 4% ................................................................... 112
Figure 4.17 Chromatographic profile evolution as a function of the catalyst content
for the series 20/80 of (i) oxypropylated lignin and (ii) homopolymer
fractions.................................................................................................. 113
Figure 4.18 Chromatographic profile evolution as a function of L/PO ratio for a
catalyst content of 3% for (i) oxypropylated lignin and (ii) homopolymer
fractions.................................................................................................. 113
Figure 4.19 Evolution of hydroxyl number as a function of catalyst content for the
series 10/90, 20/30, 30/70 and 40/60 ..................................................... 115
Figure 4.20 Schematic representation of the extend and average length of the grafted
chains in the presence of (a) low catalyst content and (b) high catalyst
content .................................................................................................... 116
Figure 4.21 Evolution of viscosity as a function of catalyst content for the series
10/90, 20/80, 30/70 and 40/60 ............................................................... 118
Figure 4.22 Comparison of DSC traces obtained for (a) 10/90, (b) 20/80, (c) 30/70
and (d) 40/60 series for a fixed catalyst content of 3%. Tg is assigned by
a black marker ........................................................................................ 119
Figure 4.23 Comparison of the DSC traces obtained for (a) original polyol mixture,
(b) oxypropylated lignin fraction, (c) homopolymer fraction and (d)
commercial polypropylene glycol. Tg is assigned by a black marker .........
................................................................................................................ 119
Figure 4.24 Comparative FTIR spectra of original lignin and oxypropylated lignin
(formulation 30/70/2) for (i) Sarkanda, (ii) Indulin AT, and (iii) Curan
27-11P .................................................................................................... 123
viii
Figure 4.25 Comparative 13C-NMR spectra of original lignin and oxypropylated
lignin (formulation 30/70/2) for (i) Sarkanda, (ii) Indulin AT, and (iii)
Curan 27-11P ......................................................................................... 124
Figure 4.26 Comparison of the chromatographic profile obtained for (i) Alcell, (ii)
Sarkanda, (iii) Indulin AT and (iv) Curan 27-1P lignin-based polyols .......
............................................................................................................... 126
Figure 4.27 Comparison of the chromatographic profiles obtained for (i)
oxypropylated lignin and (ii) homopolymer fractions of Indulin AT based
polyols ................................................................................................... 126
Figure 4.28 Comparison of the DSC traces obtained for (a) 20/80/5 (b) 30/70/2 and
(c) 35/65/2 polyols and (d) original Curan 27-11P lignin. Tg is assigned
by a black marker .................................................................................. 128
Figure 4.29 Tentative representation of the suitability of the prepared polyols in view
of their use in rigid polyurethane foam formulations ............................ 129
Figure 4.30 RPU reference foam SEM micrograph (free-rise direction) obtained at
different magnifications (i) 30X and (ii) 100X ..................................... 131
Figure 4.31 RPU foam containing 100% Sarkanda polyol and corresponding SEM
micrograph taken in free-rise direction with a magnification of 50X .........
............................................................................................................... 131
Figure 4.32 SEM micrographs obtained for RPU foams containing (i)100%, (ii) 75%,
(iii) 50%, and (iv) 25% of Alcell (first series) and Indulin AT (second
series) based polyols, respectively. Free-rise direction and a
magnification of 30X ............................................................................. 132
Figure 4.33 Relationship between compressive modulus and density of RPU foams
produced with (i) Alcell (ii) Sarkanda (iii) Indulin AT and (iv) Curan 27-
11P based polyols .................................................................................. 133
Figure 4.34 SEM micrographs obtained for RPU foams containing (i) 50% and (ii)
25% of Curan 27-11P based polyol (free-rise direction, magnification of
50X ........................................................................................................ 134
Figure 4.35 SEM micrographs obtained for RPU foams containing (i) 100% and (ii)
50% Curan 27-11P based polyol (free-rise direction, magnification of
30X) ....................................................................................................... 135
ix
Figure 4.36 RPU foams prepared with 100% of (i) Alcell and (ii) Indulin AT 30/70/2
based polyols (free-rise direction, magnification of 30X) ..................... 136
5. Utilisation of lignin without chemical modification
Figure 5.1 Urethane group formation ...................................................................... 144
Figure 5.2 Resonance structures of isocyanate group ............................................. 145
Figure 5.3 Isocyanate chemical reactions most common in the synthesis of
polyurethanes ......................................................................................... 145
Figure 5.4 Formation of allophanate and biuret groups .......................................... 146
Figure 5.5 Schematic representation of a lignin-based polyurethane network ....... 151
Figure 5.6 FTIR Bomen working in the ATR mode ............................................... 156
Figure 5.7 Three-dimensional plot of absorbance versus wavenumber versus time
for the region 1500-4000 cm-1. The approximate assignments of the most
relevant bands are point out ................................................................... 160
Figure 5.8 (i) Decay in the integrated absorbance (ANCO) and (ii) the corresponding
calculated isocyanate conversion obtained for the formulation
A(PCL750/1/25) .................................................................................... 161
Figure 5.9 Comparative schematic representation between Indulin AT and Alcell
lignins putting in evidence the type of structures formed (1-Network, 2-
Isolated sequence containing lignin and 3-Isolated sequence without
lignin). Possible entrapped hydroxyls are highlighted in red ................ 165
Figure 5.10 Evolution of isocyanate conversion with time (i), and the corresponding
second-order plots (ii), for reference experiments (PCL400/1/0),
(PCL750/1/0) and (PCL1000/1/0)) ........................................................ 168
Figure 5.11 Second-order plots for the chemical system PCL, MDI and Alcell lignin
at [NCO]/[OH] ratio of 1 . Effect of PCL molecular weight for a fixed
lignin content: (i) 10%, (ii) 15%,(iii) 20%, and (iv) 25% ...................... 169
Figure 5.12 Second-order plots for the chemical system PCL, MDI and Alcell lignin
at [NCO]/[OH] ratio of 1 . Effect of lignin content (10, 15, 20 and 25%)
for a fixed PCL molecular weight: (i) PCL400, (ii) PCL750, and (iii)
PCL1000 ................................................................................................ 170
x
Figure 5.13 Second-order plots for the chemical system PCL750, MDI and Alcell
lignin. Effect of [NCO]/[OH] ratio for a fixed lignin content: (i) 10%, (ii)
15%,(iii) 20%, and (iv) 25% .................................................................. 171
Figure 5.14 Second-order plots for the chemical system PCL, MDI and Indulin AT
lignin at [NCO]/[OH] ratio of 1. Effect of PCL molecular weight for a
fixed lignin content: (i) 10%, (ii) 15%,(iii) 20%, and (iv) 25% ............ 174
Figure 5.15 Second-order plots for the chemical system PCL, MDI and Indulin AT
lignin at [NCO]/[OH] ratio of 1. Effect of lignin content (10, 15, 20 and
25%) for a fixed PCL molecular weight: (i) PCL400, (ii) PCL750, and
(iii) PCL1000 ......................................................................................... 175
Figure 5.16 Second-order plots for the chemical system PCL750, MDI and Indulin
AT lignin. Effect of [NCO]/[OH] ratio for a fixed lignin content: (i) 10,
(ii) 15,(iii) 20, and (iv) 25% .................................................................. 176
Figure 5.17 Aspect of Alcell based polyurethane corresponding to the formulation
A(PCL750/0.8/25) ................................................................................. 179
Figure 5.18 DSC traces of Alcell based polyurethanes obtained at (i) different lignin
contents, (ii) different PCL molecular weights and (iii) different
[NCO]/[OH] ratios. Tg is assigned by a black marker .......................... 181
Figure 5.19 Loss tangent as a function of temperature for Alcell based polyurethanes
obtained at (i) different lignin contents, (ii) different PCL molecular
weights and (iii) different [NCO]/[OH] ratios ....................................... 182
Figure 5.20 Storage modulus as a function of temperature for Alcell based
polyurethanes obtained at (i) different lignin contents, (ii) different PCL
molecular weights and (iii) different [NCO]/[OH] ratios ...................... 185
Figure 5.21 DSC traces obtained for the series of experiments performed with Indulin
AT at (i) different lignin contents, (ii) different PCL molecular weights
and (iii) different [NCO]/[OH] ratios. Tg is assigned by a black marker ...
............................................................................................................... 188
Figure 5.22 Loss tangent as a function of temperature for the series of experiments
performed with Indulin AT lignin at (i) different lignin contents, (ii)
different PCL molecular weights and (iii) different [NCO]/[OH] ratios .....
............................................................................................................... 189
xi
Figure 5.23 Storage modulus as a function of temperature for the series of
experiments performed with Indulin AT at (i) different lignin contents,
(ii) different PCL molecular weights and (iii) different [NCO]/[OH]
ratios ....................................................................................................... 190
Annexe A
Figure A.1 FTIR spectra of lignin samples (Alcell, Sarkanda, Indulin AT and Curan
27 11P) before and after acetylation (acetylation time of 1 hour and 2
hours) ..................................................................................................... 206
Figure A.2 13C-NMR spectra of lignin samples (Alcell, Indulin AT, Sarkanda and
Curan 27 11P) before and after acetylation (acetylation time of 1 hour
and 2 hours)............................................................................................ 207
Figure A.3 2D HMQC spectra obtained for Alcell lignin ........................................ 208
Figure A.4 2D HMQC spectra obtained for Sarkanda lignin ................................... 208
Figure A.5 13C-NMR and FTIR spectra of Alcell lignin, acetylated according to the
ISO standard procedure. Comparison between original and acetylated
samples ................................................................................................... 209
Figure A.6 13C-NMR and FTIR spectra of Sarkanda lignin, acetylated according to
the ISO standard procedure. Comparison between original and acetylated
samples ................................................................................................... 209
Figure A.7 13C-NMR and FTIR spectra of Indulin AT lignin, acetylated according to
the ISO standard procedure. Comparison between original and acetylated
samples ................................................................................................... 210
Figure A.8 31P-NMR spectra of Sarkanda lignin ..................................................... 210
Figure A.9 31P-NMR spectra of Indulin AT lignin .................................................. 211
Figure A.10 31P-NMR spectra of Curan 27-11P lignin .............................................. 211
Figure A.11 1H-NMR spectra obtained for Sarkanda lignin before and after the
addition of D2O ...................................................................................... 212
Figure A.12 1H-NMR spectra obtained for Indulin AT lignin before and after the
addition of D2O ...................................................................................... 212
Figure A.13 1H-NMR spectra obtained for Curan 27-11P lignin before and after the
addition of D2O ...................................................................................... 213
xii
Annexe B
Figure B.1 FTIR spectra obtained for Alcell 20/80/5 and 35/65/2 based polyols ... 215
Figure B.2 FTIR spectra obtained for Sarkanda 20/80/5 and 35/65/2 based polyols ....
............................................................................................................... 215
Figure B.3 FTIR spectra obtained for Indulin AT 20/80/5 and 35/65/2 based polyols .
............................................................................................................... 216
Figure B.4 FTIR spectra obtained for Curan 27-11P 20/80/5 and 35/65/2 based
polyols ................................................................................................... 216
Figure B.5 13C-NMR spectra obtained for Alcell 20/80/5 and 35/65/2 based polyols ..
............................................................................................................... 217
Figure B.6 13C-NMR spectra obtained for Sarkanda 20/80/5 and 35/65/2 based
polyols ................................................................................................... 217
Figure B.7 13C-NMR spectra obtained for Indulin AT 20/80/5 and 35/65/2 based
polyols ................................................................................................... 218
Figure B.8 13C-NMR spectra obtained for Curan 27-11P 20/80/5 and 35/65/2 based
polyols ................................................................................................... 218
Figure B.9 Chromatographic profile evolution as a function of the catalyst content
for the series 10/90 of (i) oxypropylated lignin and (ii) homopolymer
fractions ................................................................................................. 219
Figure B.10 Chromatographic profile evolution as a function of the catalyst content
for the series 30/70 of (i) oxypropylated lignin and (ii) homopolymer
fractions ................................................................................................. 220
Figure B.11 Chromatographic profile evolution as a function of the catalyst content
for the series 40/60 of (i) oxypropylated lignin and (ii) homopolymer
fractions ................................................................................................. 221
Figure B.12 Comparison of the chromatographic profiles obtained for (i)
oxypropylated lignin and (ii) homopolymer fractions of Alcell based
polyols ................................................................................................... 222
Figure B.13 Comparison of the chromatographic profiles obtained for (i)
oxypropylated lignin and (ii) homopolymer fractions of Sarkanda based
polyols ................................................................................................... 223
xiii
Figure B.14 Comparison of the chromatographic profiles obtained for (i)
oxypropylated lignin and (ii) homopolymer fractions of Curan based
polyols .................................................................................................... 224
Figure B.15 Comparison of DSC traces obtained for (a) 20/80/5 (b) 30/70/2 and (c)
35/65/2 polyols and (d) original Alcell lignin ........................................ 225
Figure B.16 Comparison of DSC traces obtained for (a) 20/80/5 (b) 30/70/2 and (c)
35/65/2 polyols and (d) original Sarkanda lignin .................................. 225
Figure B.17 Comparison of DSC traces obtained for (a) 20/80/5 (b) 30/70/2 and (c)
35/65/2 polyols and (d) original Indulin AT lignin ............................... 226
Annexe C
Figure C.1 Plot showing the three replicas (R1, R2 and R3) obtained for the
formulation A(PCL750/1/25) in terms of relative absorbance (i) and the
corresponding calculated isocyanate conversion (ii) ............................. 228
Figure C.2 DSC traces obtained for the reference materials: (PCL400/1/0),
(PCL750/1/0) and (PCL1000/1/0) ......................................................... 230
Figure C.3 (i) Storage module and (ii) loss tangent as a function of temperature
obtained for the ,reference materials: (PCL400/1/0), (PCL750/1/0) and
(PCL1000/1/0) ....................................................................................... 230
xv
List of Tables
3. Lignin characterisation
Table 3.1 Elemental analysis and ash contents obtained for the four lignin samples ..
.................................................................................................................. 45
Table 3.2 Content of neutral sugars and total neutral sugar content corresponding to
each lignin sample ................................................................................... 46
Table 3.3 Assignment of infrared absorption bands of lignin samples ................... 50
Table 3.4 13C chemical shifts and signal assignments corresponding to each lignin
sample ...................................................................................................... 51
Table 3.5 Quantification of C atoms per C9 unit in each lignin sample ................. 53
Table 3.6 Empirical formula and molecular weight (MW) of C9 units .................. 57
Table 3.7 Number of C atoms associated with OH groups per C9 unit using the two
acetylation procedures ............................................................................. 59
Table 3.8 Data obtained for total hydroxyl content using titration, 13C-NMR (two
acetylation procedures) and 31P-NMR ..................................................... 59
Table 3.9 Data obtained for phenolic hydroxyl content using 13C-NMR (two
acetylation procedures), 1H-NMR and 31P-NMR .................................... 61
Table 3.10 Quantification of several types of hydroxyl groups in mmol/g by 31P-
NMR. Values are represented on a free ashes base ................................. 64
Table 3.11 Apparent average-molecular weights and polidispersity index by SEC
and number-average molecular number weight by VPO ........................ 66
Table 3.12 Data from TGA experiments, under helium and air atmosphere, obtained
for each lignin sample ............................................................................. 67
Table 3.13 Glass transition temperatures obtained for the four lignin samples ........ 68
4. Utilisation of modified lignin by oxypropylation
Table 4.1 Typical properties of rigid polyurethane foams (in Szycher, 1999) ........ 92
Table 4.2 Some properties of the materials used in RPU foams formulations ...... 102
Table 4.3 Formulations and operating conditions used in the oxypropylation
optimisation study ................................................................................. 106
xvi
Table 4.4 Hydroxyl number, viscosity, average-molecular weights, polydispersity
index, homopolymer content and Tg of the ensuing polyols ................ 107
Table 4.5 Apparent average-molecular weights and polydispersity index obtained
for homopolymer and oxypropylated lignin fractions ........................... 114
Table 4.6 Integrals obtained from 1H-NMR spectra and determined average
number of PO units for each one of the study series ............................. 117
Table 4.7 Tg obtained for some homopolymer and oxypropylated lignin samples
and theoretical Tg values obtained for polyols mixtures according to Fox
law ......................................................................................................... 120
Table 4.8 Summary of the reaction conditions (Tmax, Pmax and Time Tmax) and
characterisation (µ, IOH, homopolymer, average-molecular weights, PI
and Tg) of the resulting lignin-based polyols ........................................ 122
Table 4.9 Average-molecular weights and polydispersity index obtained for
homopolymer and oxypropylated lignin fractions of lignin-based polyols
............................................................................................................... 127
Table 4.10 Density, thermal conductivity, compressive modulus and average cell
size obtained for 20/80/5 RPU based foams. A 100% Lupranol 3323
based foam is presented as a reference .................................................. 130
Table 4.11 Density, thermal conductivity, mechanical properties and average cell
size of RPU foams from 30/70/2 polyols .............................................. 135
5. Utilisation of lignin without chemical modification
Table 5.1 Some properties of the materials used to produce lignin-based
polyurethanes ........................................................................................ 154
Table 5.2 Formulation details and final isocyanate conversion obtained for the series
based on Alcell lignin, as well as, for the reference experiments.......... 162
Table 5.3 Formulation details and final isocyanate conversion obtained for the
series based on Indulin AT lignin, as well as, for the reference
experiments ........................................................................................... 164
Table 5.4 Second order kinetic constant (k) and associated domain of validity for
the series of experiments performed with Alcell lignin ........................ 172
Table 5.5 Second order kinetic constant (k) and associated domain of validity for
the series of experiments performed with Indulin AT lignin ................ 177
xvii
Table 5.6 Glass transition temperature of Alcell based polyurethanes determined by
DSC and DMA analysis ........................................................................ 183
Table 5.7 Crosslink density determined by DMA and crosslink density and sol
fraction determined using swelling tests in DMF obtained for Alcell
based polyurethanes ............................................................................... 184
Table 5.8 Glass transition temperature determined by DSC and DMA analysis for
Indulin AT based polyurethanes ............................................................ 187
Table 5.9 Crosslink density determined by DMA and crosslink density and sol
fraction determined using swelling tests in DMF obtained for Indulin AT
based polyurethanes ............................................................................... 187
Annexe A
Table A.1 Number of C atoms associated with OH groups per C9 unit (acetylated
lignins) ................................................................................................... 205
Annexe C
Table C.1 Isocyanate conversion (p(30 minutes)) and corresponding coefficient of
variation obtained for the series of experiments performed with Alcell
lignin ...................................................................................................... 228
Table C.2 Isocyanate conversion (p(30 minutes)) and corresponding coefficient of
variation obtained for the series of experiments performed with Indulin
AT lignin ............................................................................................... 229
xix
Nomenclature
AE - Activation energy
A - Area
x - Average value
E - Compressive modulus
e - Crosslinking density
n - Density exponent
C - Effective number of moles of crosslinked chains
NCOA - Integrated absorbance for the isocyanate band
0,NCOA - Integrated absorbance for the isocyanate group extrapolated for time zero
NCOp - Isocyanate conversion
R - Molar gas constant
1V - Molar volume of the solvent
nM - Number-average molecular weight
- Polymer-solvent interaction parameter
q - Power
k - Second order kinetic constant
T - Temperature
- Temperature difference
- Thermal conductivity
l - Thickness
0V - Volume of dry polymer
V - Volume of the swollen gel at equilibrium
wM - Weight-average molecular weight
[NCO]- Isocyanate groups concentration
[NCO]/[OH]- Molecular ratio of isocyanate to hydroxyl groups
[OH]- Hydroxyl groups concentration
<S2>z- z-average root mean square radius of gyration
µ- Viscosity
xx
13C-NMR- Carbon 13 nuclear magnetic resonance 19F-NMR- Fluor 19 nuclear magnetic resonance 1H-NMR- Proton nuclear magnetic resonance
2D-NMR- Two-dimensional nuclear magnetic resonance 31P-NMR- Phosphorus nuclear magnetic resonance
3D-NMR- Three-dimensional nuclear magnetic resonance
A2- Second virial coefficient
APT- Attached proton test
AR- Aromatic ring
ATR- Attenuated total reflectance
BP- Boiling point
C- Carbon
CDCl3- Deuterated chloroform
CFCs- Chlorofluorocarbons
Cp- Heat capacity
CV- Coefficient of variation
D2O- Deuterated water
DABCO- Di-azobicyclooctane
DBTDL- Dibuthyltin dilaurate
DEPT- Distortionless enhancement by polarisation transfer
DFRC- Derivatisation followed by reductive cleavage
DMA- Dynamic mechanical analysis
DMAc- Dimethylacetamide
DMCHA- Dimethylcyclohexylamine
DMF- N-N-dimethylformamide
DMSO- Dimethylsulfoxide
DMSO-d6- Deuterated dimethylsulfoxide
DR- Diffuse reflectance
DRIFT- Diffuse refletance fourier transform infrared
DSC- Differential scanning calorimetry
DTA- Differential thermal analysis
e- Etherified
e.g.- For example
xxi
E´- Storage modulus
E´´- Loss modulus
ESI-MS- Electrospray ionisation mass spectrometry
ESI-MS- Electrospray ionisation mass spectrometry
EtOH- Ethanol
FTIR- Fourier transform infrared spectroscopy
G- Guaiacyl
GC- Gas chromatography
GPC- Gel permeation chromatography
GS- Guaiacyl-syringyl
H- Hydrogen
H2SO4- Sulphuric acid
HCFC- Hydrochlorofluorcarbon
HCL- Chloridric acid
HFCs- Hydrofluorocarbons
HGS- p-hydroxyphenyl-guaiacyl-syringyl
HMQC- Heteronuclear multiple quantum correlation
HPAEC/PAD- High performance anion exchange chromatography with pulsed
amperometric detection
HPLC- High performance liquid chromatography
hr- Hour
HSQC- Heteronuclear single quantum correlation
H-T- Head-to-tail
i.e.- That is
INEPT- Insensitive nuclei enhancement by polarisation transfer
IOH- Hydroxyl number
IR- Infrared
JMOD- J-modulated spin-echo
KBr- Potassium bromide
L/PO- Lignin/propylene oxide
LALLS- Low angle laser light scattering
LiBr- Lithium bromide
LiCl- Lithium chloride
xxii
LPS- Lignin process system
LS- Light scattering
MALDI-TOF-MS- Matrix assisted laser desorption ionisation time-of-flight mass
spectrometry
MALLS- Multi angle laser light scattering
MDI- 4,4’-methylene-diphenylene diisocyanate
MW- molecular weight
MWD- Molecular weight distribution
Na- Sodium
NaCl- Sodium chloride
NaOH- Potassium hydroxide
NCO- Isocyanate group
nd- Not determined
ndt- Not detected
ne- Non etherified
NIAX- Bis(dimethylaminoethyl)ether
NMR- Nuclear magnetic resonance
nv- Linear fit not valid
O- Oxygen
p(30 minutes)- Isocyanate conversion achieved for a reaction time of 30 minutes
PA- Polyadipates
PCL- Polycaprolactone
PE- Polyethylene
PEG- Poly(ethylene glycol)
PEO- Poly(ethylene oxide)
PET- Polyethylene terephthalate
PI- Polidispersity index
Pmax- Maximum pressure
PMDI- Polymeric 4,4’-methylene-diphenylene diisocyanate
PMMA- Polymethylmethacrylate
PO- Propylene oxide
PPG- Poly(propylene glycol)
PPO- Poly(propylene oxide)
xxiii
Prelative- Relative pressure
PS- Polystyrene
PS-DVB- Poly(stryrene-divinylbenzene)
PTMO- Poly(tetramethylene oxide)
QUAT- Quaternary carbon
R2- Determination coefficient
Rg- Radius of gyration
RI- Refractive index
RPU- Rigid polyurethane
s- Standard deviation
S- Sulphur
SEC- Size exclusion chromatography
SEM- Scanning electron microscope or scanning electron microscopy
SN-2- Second order nucleophilic substitution
sol fraction- Soluble fraction
SR-321 NIAX- Copolymer of polyalkylèneoxideméthylsiloxane
t- Time
Tanδ- Loss tangent
Td- Degradation temperature
TDI- Toluene diisocyanate
TEA-Trietylamine
Tg- Glass transition temperature
TGA- Thermogravimetric analysis
THF- Tetrahydrofuran
Tmax- Maximum temperature
TMS- Tetramethylsilane
TnBAH- Tetra-n-butylammonium hydroxide
UV- Ultraviolet
UV-VIS- Ultraviolet-visible
VOC- Volatile organic compounds
VPO- Vapour pressure osmometry
ρ- Density
1. Motivation and objectives
The synthesis of polymeric materials from renewable resources has been and remains until
date as one of the greatest challenges for the scientific community. Nowadays, economical
and environmental concerns, together with an increasing dependence on petroleum
resources, have reinforced the need of using renewable resources. Initiatives and efforts
involving academics, industrials and governments are notorious and are mainly directed
towards the rational exploitation of vegetable biomass in terms of separation and integrated
valorisation of each one of its components (cellulose, hemicelluloses and lignin).
Additionally, renewable resources present unique intrinsic properties that can contribute to
the development of a novel generation of high performance materials offering economical
advantage over its petroleum-based counterparts. The conjunction of all these factors
constitutes, undoubtedly, a driving force to promote and consolidate the utilisation of
renewable materials in the synthesis of new products including polymeric materials.
Lignin is a renewable material obtained in huge quantities as a by-product of the pulp
industry. Until now, it is mainly used as fuel and only a small amount is isolated from
spent pulping and commercialised. Nevertheless, this quantity, estimated at 2%,
corresponds to 1 million of tons per year worldwide. Additionally, based on its interesting
functionalities and properties, lignin offers perspective for higher added-value applications.
MOTIVATION AND OBJECTIVES2
The interest for developing lignin-based applications is nowadays driving by three major
factors, namely (i) the availability of new lignin sources, such as, sulphur-free lignins.
These lignins possess interesting properties for various applications, (ii) the growing
interest on biorefinery concept where lignin valorisation offers impact (it represents up to
30% of biomass weight) and (iii) the approach of sustainable chemistry where green
processes and bio-based products are in focus.
The incorporation of lignin into polymeric materials, directly or after chemical
modification, is recognised as one of most viable approaches to accomplish its valorisation
and properly exploit its unique intrinsic properties. Its incorporation into polyurethane
materials, one of the most versatile classes of polymeric materials, is among the various
possibilities. This approach takes direct advantage from the presence of hydroxyl groups
(aliphatic and aromatic) within lignin structure.
This work aims to study the use of lignin as a macromonomer in polyurethane synthesis
and, to some extent, contribute to promote its valorisation by exploiting its unique intrinsic
properties. For that purpose, four lignin samples have been selected, three of them from
available commercial lignins: Sarkanda (Granit SA), Indulin AT (MeadWestvaco) and
Curan 27-11P (BorregaardLignoTech). Moreover, Alcell from Repap Enterprises Inc. was
also chosen. They represent three different botanical origins (hardwood, softwood and non-
wood), as well as three different pulp processes (kraft, soda and organosolv). Indulin AT
and Curan 27-11P (commercialised in the alkali form) are softwood lignins obtained by the
Kraft pulping process. Sarkanda lignin is a non-wood lignin (wheat and hemp) obtained
from a soda pulping-precipitation process, patented by Granit SA. Alcell lignin was
extracted from mixed hardwoods (maple, birch and poplar) by an organosolv process using
aqueous ethanol. The work started with lignin characterisation, giving particular emphasis
to hydroxyl groups determination. Thereafter, lignins role as a macromonomer in
polyurethane synthesis was evaluated following two different approaches: (i) its utilisation
after chemical modification and (ii) its use as such and without any further purification nor
modification. The properties of the resulting materials (elastomers and rigid polyurethane
foams) were evaluated and some potential applications have been proposed. A summary of
the followed synthetic routes is shown schematically in Figure 1.1. Path (1) shows lignin
direct use as macromonomer in combination with a linear polyol, path (2) followed by path
MOTIVATION AND OBJECTIVES3
(3) illustrates lignin liquefaction by chemical modification (oxypropylation) and its
subsequent use in rigid polyurethane foams preparation.
Figure 1.1 Schematic representation of the approaches followed in this work to incorporate lignin into polyurethane materials, namely: (1) direct use, (2) synthesis of liquid polyols and (3) synthesis of rigid polyurethane foams using lignin-based polyols.
The performed work has been organised in the following chapters:
Chapter 2 presents a general introduction focusing lignin structure and chemistry, a
survey of producers, applications and availability. New lignin sources are listed including
those potentially available from biomass conversion technologies (biorefineries). Some
novel high added-value applications have been introduced.
Chapter 3 is dedicated to the characterisation of lignin samples. Firstly, a literature
review centred on the available characterisation techniques and methods has been
performed, emphasising the advantages and limitations associated with each one of
them. The four lignin samples were characterised regarding their structural features,
quantification of their functional groups, molecular weight and evaluation of their
thermal properties. A comparative study regarding lignin hydroxyl groups
MOTIVATION AND OBJECTIVES4
characterisation was performed using several techniques available in the literature
including titration, 1H-, 13C- and 31P-NMR spectroscopy. The aim of this study was to
carry out a detailed and reliable characterisation of the different hydroxyl groups
present in the four technical lignin samples investigated and identify the most suitable
ones to be used in polyurethane synthesis.
Chapter 4 describes the approach of using lignin as a macromonomer in rigid
polyurethane foam synthesis after chemical modification by oxypropylation. Thus, lignin-
based polyether polyols were successfully synthesised using four technical lignins (Alcell,
Indulin AT, Curan 27-11P and Sarkanda). First, a literature review was performed
including: (i) general aspects of oxypropylation reaction and its application to lignin (ii)
reference to the main works performed using lignin-based polyols, and (iii) review of the
chemistry involved on rigid polyurethane foams preparation. Polyol formulation was first
optimised with Alcell lignin by inspecting the effect of lignin/propylene oxide ratio, and
catalyst content on homopolymer content, molecular weight, hydroxyl number, viscosity
and glass transition temperature. Based on the obtained results three formulations were
chosen and applied to the other lignin samples. The produced polyols were characterised
and their hydroxyl number and viscosity were found to be in the range of those typical of
commercial polyols employed in rigid polyurethane foam preparation. Finally, two
formulations were produced at a large scale and used to produce rigid polyurethane (RPU)
foams with lignin-based polyols contents from 25 to 100% (w/w). The produced RPU
foams were evaluated in terms of density, morphology, mechanical and insulating
properties. Generally, RPU foams exhibited properties similar to those of RPU foams
commercially available. Some exceptions were detected mainly in which regards foams
produced with Sarkanda based polyols and 30/70/2 Curan 27-11P based polyols.
Chapter 5 addresses the utilisation of lignin as a macromonomer in polyurethane
synthesis, as such and without any chemical modification or purification. The literature
review includes concepts involving polyurethane synthesis and analysis of the previous
published work concerning this topic. Alcell and Indulin AT lignins were used directly as
co-monomer in combination with a linear polycaprolactone (PCL). The polymerisation
reaction was carried in bulk and without catalyst. The following variables were studied:
kraft and organosolv lignins with different contents (10, 15, 20 and 25% (w/w)), PCL with
molecular weights of 400, 750 and 1000 and [NCO]/[OH] ratios of 0.8, 1.0 and 1.25. The
MOTIVATION AND OBJECTIVES5
formation of lignin-based polyurethanes was monitored by Fourier transform infrared
spectroscopy working in attenuated total reflectance mode (FTIR-ATR) and the kinetics
was analysed according to a global second order model. The thermo-mechanical properties
of the resulting materials were determined by dynamical mechanical analysis (DMA),
differential scanning calorimetry (DSC) and by performing swelling tests. The results
obtained from FTIR-ATR monitoring were corroborated by thermo-mechanical
characterisation and swelling tests and pointed out the effective lignin incorporation into
the final three component (MDI, PCL and lignin) polyurethane network. Moreover, Indulin
AT acts more as crosslinking agent, while Alcell lignin assumes the role of chain extensor.
In Chapter 6 the main conclusions of this work are presented, as well as, some
perspectives of future work.
2. Introduction
This chapter aims to report the state of the art of lignin in the actual social-economical
context. It is given emphasis to the actual growing interest of using lignin within the scope
of its contribution to global sustainability and reduction of dependence on crude oil. Thus,
a general introduction focusing lignin structure and chemistry, a survey of producers,
applications and availability, is presented. The global characteristics of available
commercial lignins, according to the used process (kraft, soda, sulphite and organosolv
processes) for its obtaining, are also mentioned. The new lignin sources are listed
including those potentially available from biomass conversion technologies (biorefineries).
Its impact in promoting the use of lignin in more noble applications rather than fuel is
referred. Finally, some novel high added-value applications were introduced.
INTRODUCTION8
Lignin (from Latin lignum which means wood) is, after cellulose, the most abundant
biopolymer on earth constituting about 15-30% of the wood and 12-20% of the annual
plants. Anselme Payen (Payen, 1838) was the first to recognise the presence of lignin in
wood when, in 1838, he referred in his work to an “encrusting material” embedding
cellulose. Later, in 1865, Schulze defined this “encrusting material” as lignin (see Adler,
1977).
In plants lignin plays a vital role, ensuring water transportation and providing structural
support by cementing cellulose fibres and fibrils. It also acts as a protection against
biological attack. From a chemical point of view, lignin is composed of carbon, hydrogen
and oxygen in different proportions and built up of phenylpropane units (C9 or C6-C3)
linked together covalently by several types of ether (-O-4, -O-4, 4-O-5) and carbon-
carbon bonds (Sarkanen and Ludwig, 1971).
Lignin arises from an enzyme-initiated dehydrogenative polymerisation of three
precursors, namely p-coumaryl, coniferyl and sinapyl alcohol (Figure 2.1). These
monolignols originate, p-hydroxyphenyl, guaiacyl, and syringyl phenylpropanoid units,
respectively, when incorporated in lignin macromolecule (Figure 2.2) (Sarkanen and
Ludwig, 1971). The type of monomeric units and its relative abundance, present in lignin
structure, depend of its botanic origin. In general, guaiacyl lignins are present in softwoods
where trace amounts of syringyl and p-hydroxyphenyl structural units can also be
identified. In hardwoods, guaiacyl and syringyl phenylpropanoid units are present in
various ratios together with trace amounts of p-hydroxyphenyl units. Lignin from annual
plants incorporate guaiacyl and syringyl units at comparable levels, and additionally
significant amounts of structural elements derived from p-coumaryl alcohol. In these
lignins the presence of p-coumaric and ferulic acid residues is also often detected
(Sarkanen and Ludwig, 1971; Lora, 2002).
The major chemical functional groups present in lignin structure include hydroxyl,
methoxyl, carbonyl and carboxyl moieties in various amounts depending on its botanic
origin (Sarkanen and Hergert, 1971). Hydroxyl groups and free positions in the aromatic
ring are the most characteristic functions in lignin, which determine its reactivity and
constitute the reactive sites to be exploited in macromolecular chemistry.
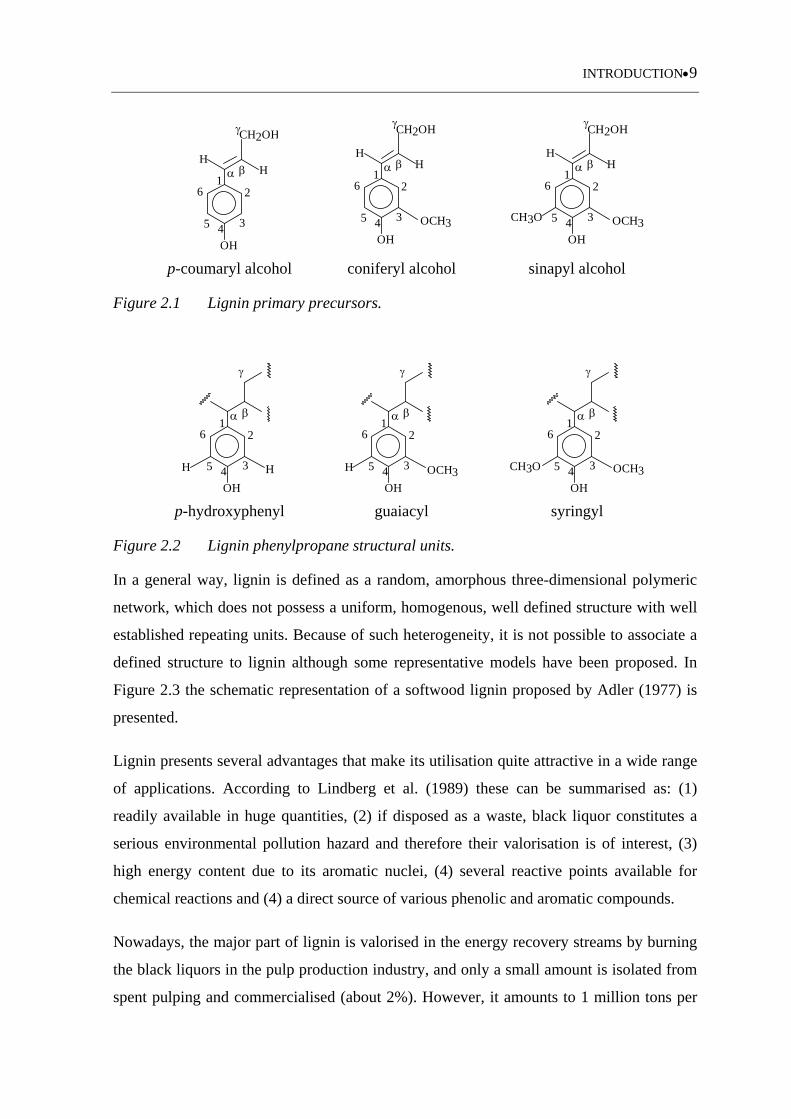
INTRODUCTION9
12
345
6
OH
CH2OH
HH
12
345
6
OH
OCH3
HH
CH2OH
CH2OH
HH
OCH3
12
345
6
OH
CH3O
p-coumaryl alcohol coniferyl alcohol sinapyl alcohol
Figure 2.1 Lignin primary precursors.
OH
12
345
6
H H
OH
12
345
6
H OCH3OH
12
345
6
OCH3CH3O
p-hydroxyphenyl guaiacyl syringyl
Figure 2.2 Lignin phenylpropane structural units.
In a general way, lignin is defined as a random, amorphous three-dimensional polymeric
network, which does not possess a uniform, homogenous, well defined structure with well
established repeating units. Because of such heterogeneity, it is not possible to associate a
defined structure to lignin although some representative models have been proposed. In
Figure 2.3 the schematic representation of a softwood lignin proposed by Adler (1977) is
presented.
Lignin presents several advantages that make its utilisation quite attractive in a wide range
of applications. According to Lindberg et al. (1989) these can be summarised as: (1)
readily available in huge quantities, (2) if disposed as a waste, black liquor constitutes a
serious environmental pollution hazard and therefore their valorisation is of interest, (3)
high energy content due to its aromatic nuclei, (4) several reactive points available for
chemical reactions and (4) a direct source of various phenolic and aromatic compounds.
Nowadays, the major part of lignin is valorised in the energy recovery streams by burning
the black liquors in the pulp production industry, and only a small amount is isolated from
spent pulping and commercialised (about 2%). However, it amounts to 1 million tons per
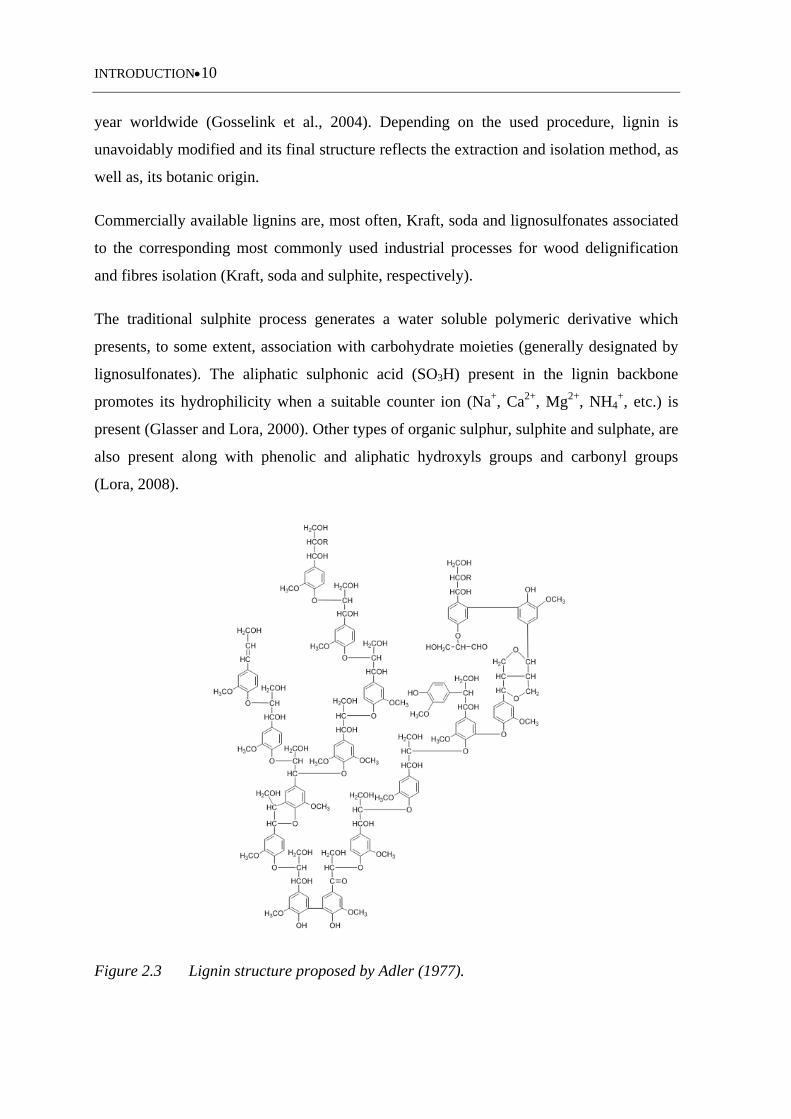
INTRODUCTION10
year worldwide (Gosselink et al., 2004). Depending on the used procedure, lignin is
unavoidably modified and its final structure reflects the extraction and isolation method, as
well as, its botanic origin.
Commercially available lignins are, most often, Kraft, soda and lignosulfonates associated
to the corresponding most commonly used industrial processes for wood delignification
and fibres isolation (Kraft, soda and sulphite, respectively).
The traditional sulphite process generates a water soluble polymeric derivative which
presents, to some extent, association with carbohydrate moieties (generally designated by
lignosulfonates). The aliphatic sulphonic acid (SO3H) present in the lignin backbone
promotes its hydrophilicity when a suitable counter ion (Na+, Ca2+, Mg2+, NH4+, etc.) is
present (Glasser and Lora, 2000). Other types of organic sulphur, sulphite and sulphate, are
also present along with phenolic and aliphatic hydroxyls groups and carbonyl groups
(Lora, 2008).
Figure 2.3 Lignin structure proposed by Adler (1977).
INTRODUCTION11
Lignosulfonates are largely used in dispersing and binding applications (pesticides, inks
and dyes, water treatment formulations, etc.) being a small part employed in the production
of specialty chemicals of high added value like vanillin (Gosselink et al., 2005; Lora, 2008;
Wool, 2005). BorregaardLignotech is the main producer of lignosulfonates worldwide
presenting a wide range of products (more than 200) mainly based on calcium and sodium
lignosulphonates. Such products are obtained in some of its industrial units of bioethanol
and/or vanillin production (Lora, 2008; http://www.borregaard.com/). Tembec (Europe and
North America) is the second larger lignosulphonate producer offering sodium, ammonium
and magnesium lignosulphonates from hardwood and softwood in liquid or powder forms
(Lora, 2008; http://www.tembec.com). Other companies such as Rochette Venizel
(France), Nippon Paper chemicals (http://www.npchem.co.jp/english/index.html, Japan),
Cartiere Burgo (http://www.burgo.com/, Italy) and Domsjö Fabriker AB
(http://www.domsjoe.com/, Sweden) are also producing lignosulphonates.
The Kraft process is the most widely used by the pulping industry. This process uses an
aqueous solution of sodium hydroxide and sodium sulphide to dissolve the lignin bonded
to cellulose. The kraft lignin effectively recovered (since most of it is used as a fuel to
recover energy) present low sulphur contents (1.5-3%), some of it organically bound
(created during the kraft pulping process) and some as elemental sulphur. These lignins
present a relatively high degree of purity in what concerns the presence of ashes and
sugars. The main application of Kraft lignins involves the utilisation of its chemical
derivatives rather than lignin as such. The most widely used kraft lignin derivatives are
water soluble sulphonated derivatives with a purity superior to that of lignosulphonates and
therefore used in applications of greater added value (Lora, 2008). The kraft lignin
derivatives are normally used as dispersants and emulsifiers in a wide range of applications
(dye dispersants, agrochemical dispersants, battery expanders, and conductive polymers).
Non-modified kraft lignins are used to a less extent, mainly as asphalt emulsifiers, anti-
oxidants, carriers, adsorbents and UV screens (http://www.meadwestvaco.com).
Meadwestvaco is the largest producer of kraft lignin derivatives worldwide and non-
modified kraft lignins (e.g., Indulin AT). Recently they reinforced their position in the
market by acquiring the kraft lignin bussiness of BorregaardLignotech that produced kraft
lignins such as Curan 100 and Curan 27-11P. These lignins have been reported as being of
high purity and recommended for polymeric applications. Within this framework, a series
INTRODUCTION12
of scientific reports have been published aiming to elucidate the potential application of
lignin, as macromonomer in the production of polymeric materials such as composite
materials, epoxy resins, polymer blends (Hofmann and Glasser, 1993; Kubo and Kadla,
2006; Feldman et al., 2003; Thielemans et al., 2000). The kraft black liquor is also used by
a U.S. company (Gaylor Chemical) to produce dimethylsulphoxide (DMSO) (Lora, 2008).
Soda pulp process is mainly used for non-wood fibres such as straw and sugarcane
bagasse. It is of significant importance in countries like China, India and other Asiatic and
South American countries. The properties of soda lignins are closer to those obtained by
the kraft process mainly concerning the molecular weight and hydrophobic character.
Comparatively to kraft lignin, one of the major differences is the fact that they are sulphur-
free and with a quite distinct structure since they are obtained from non-wood raw
materials. These non-wood lignins present guaiacyl and syringyl moieties, as well as,
significant amounts of p-hydroxyl groups. Additionally, they contain higher amounts of
sugar, nitrogen (associated to protein residues), carboxylic acids and silica compared to
those of wood lignins.
Nowadays, sulphur-free lignins are becoming an emerging class of lignin products, partly
motivated by environmental policies, but also, by less capital intensive associated
technologies. Besides the soda pulping of alternative biomass resources, they can also be
obtained from (i) biomass conversion technologies-biorefineries and (ii) solvent pulping-
organosolv processes (Lora and Glasser, 2002). Organosolv pulping processes are mostly
under development, or if already use, only in small-scale productions. These processes
include ASAM (alkali-sulfite-anthraquinone-methanol), Organocell (sodium hydroxide,
methanol and anthraquinone), Alcell (water and ethanol), Formacell (acetic acid, formic
acid) and Milox (multistage peroxyacid treatment).
Some examples of sulphur-free lignins are already commercially available as can be
demonstrated by the example of Granit SA, a Swiss company, that started to
commercialise sulphur-free lignins derived from non-wood fibres based on a patented
precipitation method (LPS®) for lignin isolation (Doppenberg and Abächerli, 1998).
Within biomass conversion technologies, Lignol Innovations company is producing, at
pilot scale, lignin with similar characteristics of Alcell from Repap, using eastern
hardwoods and fuel grade ethanol (www.lignol.ca). Other examples are Chempolis
(http://www.chempolis.com/), Pure Lignin (http://www.purelignin.com), Pure Power
INTRODUCTION13
(http://www.purepowerglobal.com/index.html) and ALM India
(http://www.asianlignin.com/). The lignins available through the processes implemented in
those companies are claimed to be of high purity and suitable for the synthesis of
polymeric materials.
It is worth mention the establishing of collaborations between biorefineries and some
chemistry companies, which aim in a cooperative effort, to valorise lignin mainly through
its incorporation in polymeric materials. Some examples include the previously mentioned
Lignol Company that have recently established collaboration with Huntsman International
LLC (http://www.huntsman.com/) and Weyerhaeuser (http://www.weyerhaeuser.com/).
The objectives aim to develop several applications involving the utilisation of the lignin
produced by Lignol (lignin HP-L™) (http://www.lignol.ca/news.html).
Presently, biorefineries are seen as the big opportunity for lignin since its economical
feasibility is intimately related to the valorisation of all generated products (cellulose,
hemicelluloses, lignin and waxes, proteins, terpenes, etc.). Moreover, biorefineries will
generate high quantities of lignin. Recent projections indicate that the use of ethanol as fuel
in the U.S. is going to increase by about 9.6 billion litres per year, which means that if 25%
of the alcohol comes from non-wood biomass, at least 1.1 millions of tonnes of lignin
could be potentially available per year in a near future. The same trends are expected for
Europe and other parts of the world, which reveals the need to properly exploit lignin
through more noble applications than as a fuel (Lora, 2008). The utilisation of
lignocellulosic biomass as a raw material for biorefineries has gain an increasing interest
due to food concerns and a limited surface area in Europe to produce agricultural products
in sufficient quantities. In such a context, lignin impact is even more significant. The use
of lignocellulosic biomass as a raw material for ethanol production will generate a lignin
rich stream amounting to more than 60% by weight of the produced ethanol (Lora, 2008).
According to a report prepared for the U.S. Department of Energy (Holladay et al., 2007),
the generated lignin has the potential to be used in three main areas of applications,
namely: (i) power, fuel and syngas, (ii) macromolecules and (iii) aromatics and
miscellaneous monomers. These applications were considered as being respectively, near-
term, medium-term and long-term applications. This report aimed to clarify the current
economic potential of lignin-based products obtained from lignin or lignin-rich resources
using chemical, biochemical or thermochemical processes. The report identifies which
INTRODUCTION14
product classes are currently more favourable and which might have the major impact on
petroleum replacement and economic viability of biorefineries. Figure 2.4 illustrates some
new product opportunities from lignin.
It is also to worth to mention the existence of two institutions, namely, the International
Lignin Institute (ILI, http://www.ili-lignin.com/) and the Lignin Institute (LI,
http://www.lignin.org/about.html) dedicated to promote lignin utilisation mainly in high
added value applications. ILI is at the moment the most visible and dynamic one being
involved in the proposal of several projects, organisation of scientific meetings, and in the
promotion of cooperation among academic and research institutions, industry (lignin
producers and users) and society in general. Its activities, as well as, the promoted
interlaboratory cooperation have suffer an increasing expansion over the last few years
thus denoting the increasing interest in lignin and on its possible utilisation. This institute
focuses mainly in the following thematics: (1) methods and standards for lignin
characterisation, (2) production of primary (non-derivatised) and secondary (chemically
modified or otherwise improved) lignins, (3) lignin bioactivity, (4) smart polymers and (5)
lignin composites. LI has the main objective of supporting producers and end-users of
lignosulphonates. Its purpose is to establish an efficient exchange of information
specifications, applications, safety and regulatory control of lignosulphonates.
The increasing interest on lignin is also revealed by the appearing of a considerable
number of patented works during the last few years, covering a wide range of application
fields (see, for example, Lora et al., 1993; Naae et al., 2000; Matzinger, 2000; Kurple,
2000; Shabtai et al., 2001; Navarrete et al., 2002; Schneider, 2004; Funaoka, 2008;
Avignon and Delmas, 2008).
The valorisation of lignin is therefore a pertinent topic within the scientific society, in
particular, and society in general. It is motivated by environmental concerns and constant
fluctuations in petroleum prices. These actual tendencies, together with policies more
directed towards sustainability and development of novel technological solutions that
liberate society from petroleum-based products dependency will definitively change the
place occupied by lignin.
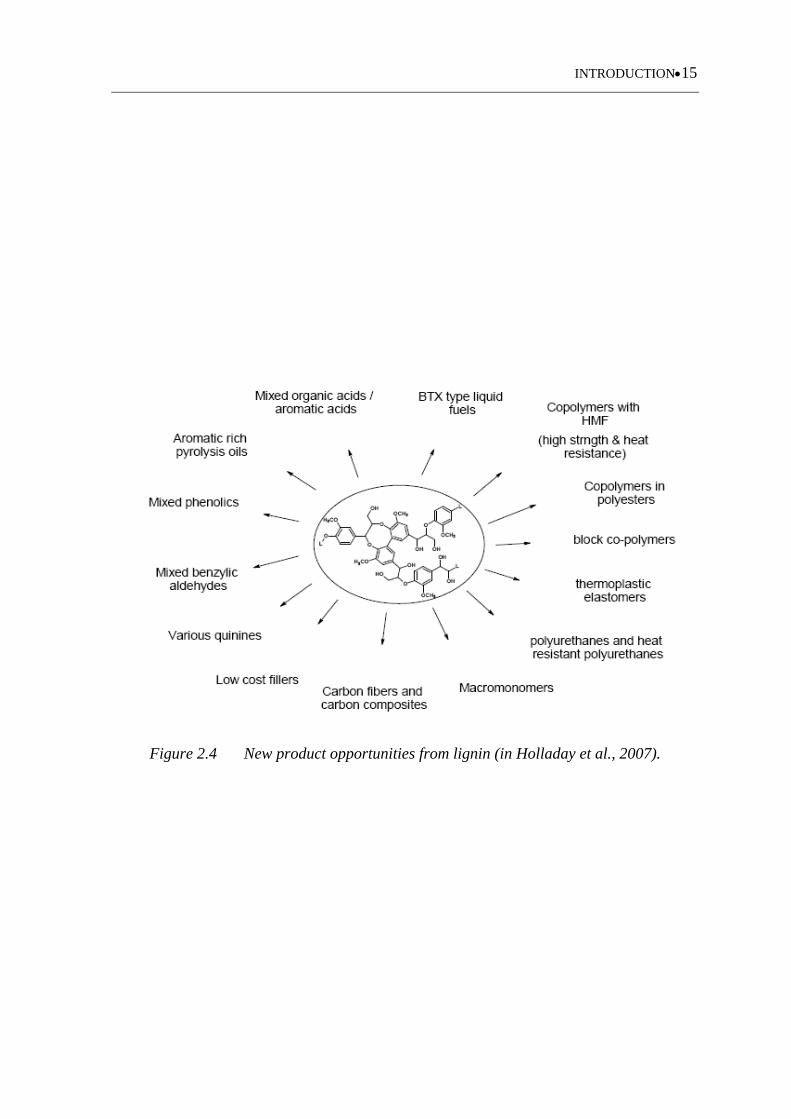
INTRODUCTION15
Figure 2.4 New product opportunities from lignin (in Holladay et al., 2007).
INTRODUCTION16
2.1 References
Adler, E., 1977. Lignin chemistry-past, present and future. Wood Sci. Technol. 11, 169-
218.
ALM India Pvt (http://www.asianlignin.com/, consulted on October 2008)
Avignon, G., Delmas, M., 2008. Method for producing paper pulp, lignins, sugars and
acetic acid by frantionation of lignocellulosic vegetable material in formic/acetic acid
medium. United States Patent 7,402,224.
BorregardLignotec (http://www.borregaard.com/, consulted on October 2008)
Burgo Group (http://www.burgo.com/, consulted on October 2008)
Chempolis (http://www.chempolis.com/, consulted on October 2008)
Domsjö (http://www.domsjoe.com/, consulted on October 2008)
Feldman,D., Banu, D., Khoury, M., 2003. Epoxy-lignin polyblends. III.Thermal properties
and infrared analysis. J. Appl. Polym. Sci. 37, 877-887.
Funaoka, M., 2008. Lignin derivatives, molded products using the same and processes for
making the same. U.S. Patent 7,323,501.
Holladay, J.E., Bozell, J.J., White, J.F., Johnson, D., 2007. Top value-added chemicals
from biomass. Volume II-Results of screening for potential candidates from biorefinery
lignin. Pacific Northwest National Laboratory.
Huntsman (http://www.huntsman.com/, consulted on October 2008)
International Lignin Institute (http://www.ili-lignin.com/, consulted on October 2008)
Kubo, S., Kadla, J.F., 2006. Effect of poly(ethylene oxide) molecular mass on miscibility
and hydrogen bonding with lignin. Holzforschung 60, 245-252.
Kurple, K.R., 2000. Lignin-based polyols. United States Patent 6,025,452.
Lignin Institute (http://www.lignin.org/about.html, consulted on October 2008)
INTRODUCTION17
Lignol (http://www.lignol.ca/news.html, consulted on October 2008)
Lignol (www.lignol.ca, consulted on October 2008)
Lindberg, J.J., Kuusela, T.A., Levon, K., 1989. Specialty polymers from lignin. In: ACS
Symp. Series 397. Glasser, W. and Sarkanen, S. (Eds), American Chemical Society
publications, 190-204.
Lora, J., 2008. Industrial commercial lignins: Sources, properties and applications. In:
Monomers, polymers and composites from renewable resources. Belgacem, N.M. Gandini,
A., (Eds). Elsevier publications, 225-241.
Lora, J.H., Trojan, M.J., Klingensmith, W.H., 1993. Rubber compositions containing high
purity lignin derivatives. United States Patent 5,196,460.
Matzinger, M.D., 2000. Water-based ink jet ink compositions containing carboxylated
lignins. United States Patent 6,045,606.
Meadwestvaco (http://www.meadwestvaco.com, consulted on October 2008)
Naae, G.D., Whittington, L.E., Kieke, D.E., 2000. Catalytic method for the preparation of
lignin phenol surfactants in organic solvents. United States Patent 6,100,385.
Navarrete, J., Chapman, A.J., Parikh,C.J., Toomey, R.T., 2002. Use of lignin in
thermoplastics. United States Patent 6,485,867 B1.
Nippon Paper Chemicals (http://www.npchem.co.jp/english/index.html, consulted on
October 2008)
Payen, A., 1838. Comptes Rendus De L´ Académie Des Sciences Serie III-Sciences De La
Vie-Life Sciences 7, 1052-1054.
Pure Lignin (http://www.purelignin.com, consulted on October 2008)
Pure Power (http://www.purepowerglobal.com/index.html, consulted on October 2008)
Schneider, M.H., Phillips, J.G., 2004. Furfuryl alcohol and lignin adhesive composition.
United States Patent 6,747,076 B2.
INTRODUCTION18
Shabtai, J.S., Zmierczak, W.W., Chornet, E., 2001. Process for conversion of lignin to
reformulated, partially oxygenated gasoline. United States Patent 6,172,272.
Tembec (http://www.tembec.com, consulted on October 2008)
Thielemans, E., Can, E., Morye, S.S., Wool, R.P., 2002. Novel applications of lignin in
composite materials. J. Appl. Polym. Sci. 83, 323-331.
Weyerhaeuser (http://www.weyerhaeuser.com/, consulted on October 2008)
Wool, R.P., 2005. Lignin polymers and composites. In: Bio-based polymers and
composites. Wool, R.P., Sun, X.S., (Eds). Academic Press, 552-598.
3. Lignin characterisation
Despite all the research efforts, lignin is still facing some problems to be accepted as a
viable and competitive monomer to substitute conventional raw-materials for polyurethane
and other polymeric materials synthesis. One of the major difficulties related to this
situation concerns the absence of normalised standard characterisation protocols.
This chapter is devoted to the characterisation of the technical lignin samples (Alcell,
Sarkanda, Indulin AT and Curan 27-11P) chosen to be used as macromonomers in
polyurethanes synthesis. They represent hardwood, softwood and non-wood lignin types
and were obtained from three pulp processes: Kraft, soda and organosolv. A systematic
study was performed regarding its structural characterisation and quantification of its
functional groups, as well as its thermal properties. Moreover, a comparative study
regarding the determination of lignin hydroxyl groups was performed using several
techniques and methods including titration, 1H-, 13C- and 31P-NMR spectroscopy. The
obtained results were compared and their reliability evaluated. The advantages and
limitations associated to each technique were also discussed. Finally, the properties of
each lignin were analysed regarding its future application in polyurethane synthesis, as
such or after chemical modification.
LIGNIN CHARACTERISATION20
3.1 Literature review
Over the past decades, extensive research has been devoted to the development of suitable
methods for lignin characterisation (Sarkanen and Ludwig, 1971; Lin and Dence, 1992;
Zakis 1994; Gellerstedt and Henriksson, 2008). The knowledge of structural changes
affecting lignin macromolecules during the delignification processes was, initially, the
main driving force of this research field. Actually, the utilisation of renewable resources
has gained an extreme relevance and lignin characterisation become essential in order to
evaluate its potential application in several technical domains. New methods have been
developed and old ones improved, trying to solve some analytical problems associated
with the complex macromolecular lignin structure. In addition, new types of delignification
processes calling upon the use of soft conditions and generating new technical lignins have
been investigated (Lora and Glasser, 2002). Thus, the development and establishment of
reproducible standard methods is an actual subject within lignin research field and an effort
towards normalisation was recently done by the Eurolignin project (G1RT-CT-2002-
0508), where some standards have been developed and tested (http://www.ili-lignin.com).
The knowledge of lignin properties such as reactivity, thermal stability and
macromolecular properties is therefore essential for its valorisation in a more rational way
than its present use as a fuel in pulp production industry. For that purpose, several methods
and techniques are available in the literature being worth to mention two fundamental texts
edited by Lin and Dence (1992) and Zakis (1994). All the reported methods present
advantages and drawbacks, and the determination of lignin properties often requires the
combination of different techniques giving partial but complementary information.
The physical and chemical properties of lignin are highly affected by its structure and the
type of functional groups it bears. These include hydroxyl, methoxyl, carbonyl and
carboxyl moieties in various amounts and positions whose contents depend on the botanic
origin and the applied extraction process (Sarkanen and Ludwig, 1971). The structural
characterisation and quantification of lignin functional groups is therefore crucial. Thus,
wet chemical methods (acetylation, permanganate oxidation, aminolysis, etc.),
spectroscopic and chromatographic (NMR, UV, FTIR, GC), or a combination of both are
the techniques typically used to ascertain the chemical structure of lignin.
LIGNIN CHARACTERISATION21
3.1.1 Wet chemical methods for structural analysis
Chemical degradation methods have greatly contributed to the actual knowledge of lignin
structure. Basically, these methods involve lignin degradation to low molecular weight
fragments followed by their identification. The most used methods are acidolysis,
thioacidolysis, nitrobenzene oxidation and permanganate oxidation. More recently, a
method based on derivatisation followed by reductive cleavage (DFRC) has been reported
(Lu and Ralph, 1997).
Acidolysis was widely applied to lignin characterisation being worth to mention the work
performed by Lundquist and Lapierre research groups’ (Lundquist and Hedlund, 1967;
Lundquist and Kirk, 1971; Li et al., 1997; Lapierre et al., 1983). During acidolysis the
arylglycerol-β-aryl ether (β-O-4) structures of lignin are mainly cleaved leading to the
formation of arylpropanones and other minor fragments (Lapierre et al., 1983). Softwood
lignins generate guaiacylpropane monomers whereas hardwood lignins yield the
syringylpropane homologues (Baeza and Freer, 2000). Usually, these low molecular
weight compounds are first submitted to a chemical derivatisation by trimethylsilyl, in
order to increase their volatile character, and then identified by gas chromatography (GC-
FID or GC-MS). High performance liquid chromatography (HPLC) was also used in this
context (Lundquist and Kirk, 1971; Lapierre et al., 1983). Nevertheless, the occurrence of
some secondary reactions together with a low yield of degradation products, introduces
serious inaccuracies in the obtained results (Lapierre et al., 1985; Rolando et al., 1992).
More recently, Yokoyama and Matsumoto (2008) published a work aiming to contribute to
a better understanding of the mechanisms involved in the cleavage of β-O-4 during lignin
acidolysis by studying the kinetics of formation of enol ether from non-phenolic C6-C2
model compounds.
The limitations associated to acidolysis conducted to the development of thioacidolysis by
Lapierre’s research group (Lapierre et al., 1985). Similarly, to acidolysis, this method
involves the cleavage of arylglycerol-β-aryl ether structures by using an anhydrous media.
The ether cleaving reagent combines a strong Lewis acid, boron trifluoride etherate, and a
weak nucleophile like ethanethiol. The resulting mixture of monomers is less complex than
that obtained by acidolysis and is mainly constituted by thioethyl-phenylpropane
compounds (Lapierre et al., 1985). Some modifications of the original method were
LIGNIN CHARACTERISATION22
proposed involving a pre-metylation of lignin with diazomethane, followed by the
desulfurisation of the resulting trithioethyl ethers using the Raney Nickel reaction
(Lapierre et al., 1988; Lapierre et al., 1991).
More recently, Önnerud and Gellerstedt (2003) proposed a modification to the
thioacidolysis method by performing a pre-swelling stage of the lignocellulosic sample,
thus incrementing reaction yields. Önnerud (2003) studied the chemical structure of lignin
in normal and compression spruce wood by thioacidolysis using methanethiol and
ethanethiol, as nucleophiles. It was found that both nucleophiles work well, nevertheless
methanethiol showed to give a somewhat higher yield than ethanethiol.
Two new techniques have been proposed to analyse the degradation products arising from
thioacidolysis and acidolysis operations. The first was presented by Fournand et al. (2002)
and deals with the development of a capillary zone electrophoretic method to quantify the
syringyl and guaiacyl monomers. The second one evaluates the utilisation of electrospray
ionisation mass spectrometry (ESI-MS) (Önnerud et al., 2003).
Nitrobenzene oxidation was developed by Freudenberg in 1939 aiming evidencing the
aromatic nature of lignins (Freudenberg, 1939). This method was latter modified based in a
set of works performed with model compounds (Leopold, 1950; Leopold and Malmström,
1951). In nitrobenzene oxidation the lignin side chains are degraded into uncondensed
structures to yield vanillin, syringaldehyde, p-hydroxybenzaldehyde, respectively from
guaiacyl, syringyl, and p-hydroxyphenyl units. However, the mechanism involving
nitrobenzene oxidation is not well clarified, and attempts to explain it have been made by
Chang and Allan (1971) and more recently by Schutz et al. (1986). Chang and Allan
(1971) proposed a two-electron transfer process with a quinone methide intermediate while
Schutz et al. (1986) defended that oxidation involves a one-electron transfer through a
free-radical process.
The resulting products are normally analysed by GC and HPLC, although other techniques
like 13C-NMR and 1H-NMR can also be used (Chen, 1992; Katahira and Nakatsubo, 2001).
Galetti et al. (1989) evaluated the use of HPLC with electrochemical detection for direct
quantitative analysis of phenolic components obtained by nitrobenzene oxidation and
compared the obtained results with those obtained using conventional UV detectors.
Katahira and Nakatsubo (2001) proposed the introduction of 5-iodovanillin as internal
LIGNIN CHARACTERISATION23
standard and the simultaneous characterisation by 1H-NMR spectroscopy and conventional
gas chromatography. The use of 5-iodovanillin enabled the quantification of p-
hydroxybenzaldehyde, vanillin, and syringaldehyde present in the oxidation products.
Furthermore, additional information about the condensed structure of lignin was also
derived by comparing 1H-NMR and GC analyses. The introduced modifications allowed
increasing data reproducibility and obtaining further lignin structural information.
Permanganate oxidation was initially developed by Freudenberg research group that
greatly contributed to the knowledge of lignin structure in wood and pulp (Freudenberg et
al., 1936). The original method proposed was further incremented, and nowadays it
comprises four stages. Firstly, the alkylation (metylation or ethylation) of all free phenolic
hydroxyl groups is carried out in order to protect the phenolic structure from oxidation.
Thereafter two oxidation steps are performed: the first one involves potassium
permanganate whereas the second uses alkaline hydrogen peroxide in which all
intermediate degradation products are converted into aromatic acids. The final stage
comprises the methylation of the resulting carboxylic acids with diazomethane and the
subsequent analysis by GC.
During permanganate oxidation only the monomeric fragments from lignin moieties
containing free phenolic hydroxyl groups (condensed or not), and previously protected by
alkylation, can be identified. Thus, the obtained information covers only a fraction of its
complete structure. Nevertheless, this method provides information about lignin
substitution pattern and the frequency of individual linkages between phenylpropane units;
that is often enough to infer lignin structural details. Permanganate oxidation can also be
used to estimate the total number of free phenolic hydroxyl groups, thus giving an
indication about reactivity and degree of polymerisation of the investigated lignin sample
(Gellerstedt, 1992).
Some alternatives and improvements to the established permanganate oxidation method
have been studied. In order to enhance the yield of degradation products, Yukiko et al.
(1999) proposed the introduction of a catalyst, cetyltrimethylammonium bromide. Javor et
al. (2003) presented capillary zone electrophoresis as an alternative method to separate
aromatic acids.
LIGNIN CHARACTERISATION24
DFCR is a relatively recent method developed by Lu and Ralph (Lu and Ralph, 1997)
which includes the derivatisation of the α-position with acetyl bromide followed by
reductive zinc cleavage of the β-aryl ether. This method presents the advantage of
originating a simpler mixture of monomers with higher yields, comparatively to the other
described procedures. Moreover, it allows quantitative analysis of structural units in
etherified lignin and gives information about carbon-carbon linked lignin by analysing the
released dimeric structures (Lu and Ralph, 1997).
Some adjustments to the initially established method have been proposed aiming to
improve the obtained structural information (Ralph and Lu, 1998), namely gaining further
evidence about the occurrence of naturally acetylated lignin moieties. In fact, the authors
have modified the derivatisation step. They used propionyl bromide in propionic acid
instead of acetyl bromide in acetic acid and they have included zinc in the propionic acid
(instead of acetic acid) to proceed with reductive cleavage. In the final step, acetic
anhydride was replaced by propionic anhydride. Recently, Río et al. (2007) have used this
modified method to examine the occurrence of native acetylated lignin in several vascular
plants.
Tohmura and Argyropoulos (2001) performed some minor modifications to the procedure
developed by Lu and Ralph (1997). More concretely, they combined the DFRC method
with 31P-NMR spectroscopy, in order to complement the information given by the two
methods. Ikeda et al. (2002) also presented a modified DFRC procedure where initially the
methylation of the free-phenolic hydroxyl groups is performed. In the final step acetic
anhydride was also replaced by propionic anhydride.
The performance of the DFRC method was however questioned by Fournand et al. (2000)
and Holtman et al. (2003). In these two works, DFRC method was compared with
thioacidolysis and both found higher yields for the degradation monomer products.
Fournand et al. (2000) suggested that further optimisation of the method is required and
Holtman et al. (2003) attributed these results to the DFRC associated chemistry
inefficiency, probably due to the steric hindrance associated with lignin polymeric nature.
LIGNIN CHARACTERISATION25
3.1.2 Wet chemical methods for functional group analysis
Periodate oxidation, aminolysis, methylation, oximation, non-aqueous potenciometric
method, Zeisel modified method and acetylation, are some of the most used wet chemical
methods for determining lignin functional groups. Periodate oxidation and aminolysis are
classical methods used for phenolic hydroxyl groups determination.
Periodate oxidation was developed by Adler’s research group (Adler and Hernestam, 1955;
Adler et al., 1959) that performed the oxidation of model phenolic guaiacyl compounds
with aqueous sodium periodate solution leading to the formation of ortho-quinone
structures and methanol. The amount of methanol is determined by GC and can be related
to the amount of adjacent phenolic hydroxyl groups (Adler and Hernestam, 1955).
Periodate oxidation does not allow the determination of phenolic units without adjacent
methoxyl group and consequently, methoxyl free phenolic units like catechols and p-
hydroxyphenyl units, present in large quantities in non-wood lignins, cannot be determined
(Lai, 1992).
Aminolysis was developed by Månsson (1983) and comprises the determination of
phenolic hydroxyl content in lignin using an acetylation step followed by selective
aminolysis with pyrrolidine. This method is based on the fact that phenolic acetyl groups
are deacetylated considerably faster than aliphatic counterparts, if pyrrolidine is used as a
de-acetylating reagent (Månsson, 1983). Lai et al. (1990) compared the phenolic hydroxyl
content using periodate oxidation and aminolysis and found that the two methods gave
similar results. Faix et al. (1992) performed a comparative study regarding the
determination of lignin phenolic hydroxyl groups using selective aminolysis, FTIR, 1H-
NMR and UV spectroscopy. They found that UV-spectroscopy gives the less reliable
values, and that aminolysis although rather time consuming, produces the most accurate
and reproducible data. A relatively good data correlation was also observed between
aminolysis and 1H-NMR results, and to a less extent, with FTIR spectroscopy data. In a
review made by Lai (1992) periodate oxidation and aminolysis were considered as the
most accurate methods for lignin phenolic hydroxyl groups determination.
Methylation can also be used to determine lignin phenolic hydroxyl contents. Frequently,
this reaction is performed by using diazomethane as methylation agent, although other
reactive mixtures like methanol in the presence of HCl or dimethyl sulphate in the
LIGNIN CHARACTERISATION26
presence of alkali compounds have been reported (Zakis, 1994). The content of phenolic
hydroxyl groups is calculated based on the increase amount of methoxyl groups after
methylation. Diazomethane is however highly toxic and competitive reactions can occur
(Zakis, 1994). In a comparative study performed by Faix et al. (1994) regarding the
determination of lignin hydroxyl groups, methylation yielded phenolic hydroxyl contents
higher than those obtained by NMR techniques (13C-, 1H- and 31P-NMR). These
overestimated values were attributed by the author to the reaction of diazomethane with
carboxyl groups and certain reactive aldehydes and ketones present in lignin samples.
Oximation can be used to estimate the content of carbonyl groups in lignin, as presented by
Chen (1992), who concluded that this method could be considered as one of the most
reliable to use. In his work he proposed modifications to the original work of Gierer and
Söderberg (1959) and Gierer and Lenz (1965), namely treating lignin with a
hydroxylamine hydrochloride solution conducting to the formation of an oxime and
hydrochloric acid. The quantity of liberated acid is determined by titration and is
equivalent to that of carbonyl groups present in lignin. Zakis (1994) proposed some
modifications that include the utilisation of DMSO as solvent instead of EtOH, a reaction
temperature of 80 ºC instead of 25 ºC and the use of an excess of triethanolamine in the
oximation mixture. In this modified method, the reaction occurs more readily (2 hours
instead of 30 hours) and upon finished, the remaining triethanolamine is titrated instead of
the generated hydrochloric acid. Nevertheless, the results obtained with highly oxidized
lignins need to be corrected in order to account with carboxylic and other strong acidic
groups interference. In the study performed by Faix et al. (1998), involving carbonyl group
content determination of six round robin lignins, a good correlation was observed between
the data from modified oximation method and FTIR spectroscopy. However, a modest
correlation was found between modified and unmodified oximation method.
The non-aqueous potentiometric method allows the determination of carboxylic and
weakly acidic phenolic hydroxyl groups in lignin. The strong acidic sulfonic acid in
lignosulfonates can also be determined if an ion exchange treatment is performed (Dence,
1992). Frequently, the used procedure is based on that developed by Pobiner (1983) and
reviewed by Dence (1992). This method consists on lignin non-aqueous potenciometric
titration with tetra-n-butylammonium hydroxide (TnBAH) in the presence of p-
hydroxybenzoic acid, as internal standard. The main limitation of this method is related to
LIGNIN CHARACTERISATION27
difficulties in accurately assign the inflection points. Gosselink et al. (2004) have reported
that reliable results could be achieved by this method. Mansouri and Salvadó (2007)
reported that aminolysis and non-aqueous titration with TnBAH are more reliable methods
than UV-, 1H- and 13C-NMR spectroscopy based methods.
The modified Zeisel method is the most used in the determination of lignin methoxyl
groups. The original method was proposed in 1885 by Zeisel for quantitative determination
of alkoxy groups (Zeisel, 1885). Nevertheless, this method presented some limitations
regarding the determination of methoxyl groups in sulphur-containing compounds. Over
the years, several modifications were performed improving this method and making it
applicable to sulphur-containing compounds which include technical lignins such as Kraft
lignins and lignosulfonates (Chen, 1992). Nowadays, the most acceptable method is that
based in the original method presented by Zeisel with the modifications introduced by
Vieböck and co-workers (see Chen, 1992; Zakis, 1994). The modified Zeisel method is
based on the formation of methyl iodide when the sample is treated with hydroiodic acid at
reflux temperature. The formed methyl iodide is then treated with bromine which liberates
the iodide and converts it to iodic acid. The remaining bromine is then reduced by formic
acid to hydrogen bromide, which is neutralised by the sodium acetate solution. Finally, the
iodide thus produced is titrated with a standard thiosulfate solution (Chen, 1992). The
utilisation of chromatographic techniques instead of traditional titration has also been
performed (Sporek and Danyi, 1962 and Baker, 1996). This method is rather complicated
and tedious requiring special equipment. Nevertheless, it is still quite used for lignin
methoxyl group determination.
Among wet chemical methods, acetylation is one of the most used for the determination of
lignin hydroxyl group contents and several procedures can be found in the literature (Chen,
1992; Zakis, 1994; Gosselink et al., 2004; Månsson, 1993; Thielemans and Wool, 2005).
This reaction can be used with potentiometric titration, enabling total hydroxyl content
determination, or as a derivatisation reaction to support analysis by spectroscopic
techniques, such as FTIR and 1H and 13C-NMR. In this case, aliphatic, phenolic and thus
total hydroxyl content can be determined. In the potentiometric method, samples are
acetylated by a standard esterification process using an acetic anhydride-pyridine mixture,
followed by titration of the formed acetic acid with a sodium hydroxide solution (Chen,
1992). When used as a derivatisation reaction, lignin samples are acetylated, recovered and
LIGNIN CHARACTERISATION28
then analysed by spectroscopic techniques. Moreover, acetylated lignin samples are
frequently used to determine lignin molecular weight by size exclusion chromatography
(SEC) in order to enhance sample solubility and avoid association effects among lignin
macromolecules (Johnson et al., 1989). The major drawback of this technique is related to
the completion of the esterification reaction, which is very often reported as incomplete.
This behaviour was detected in some works conducting to underestimate hydroxyl contents
(Gosselink et al., 2004; Mansouri and Salvadó, 2007). Månsson’s method modified by
Thielemans and Wool (2005) seems, however, to give satisfactory results, as was
confirmed by the complete disappearing of the band corresponding to OH stretching
around 3600 cm-1.
3.1.3 Spectroscopic techniques applied to lignin characterisation
Although the presented wet chemical methods are still used for lignin characterisation,
most of them have lost popularity in the last years, mainly because of the laborious
chemical manipulations to be handled and the widespread accessibility of spectroscopic
techniques, particularly nuclear magnetic resonance (NMR) (Argyropoulos and
Menachem, 1998).
Spectroscopic techniques are used for both qualitative and quantitative lignin
characterisation. Qualitative information is often related with the discrimination of
guaiacyl (G), guaiacyl-syringyl (GS) and p-hydroxyphenyl-guaiacyl-syringyl (HGS)
lignins moieties by identifying their particular features or by inspecting structural changes
after chemical modification. Quantitative characterisation is related to the quantification of
lignin functional groups, often after lignin derivatisation (Sarkanen and Ludwig, 1971 and
Lin and Dence, 1992). Among the used spectroscopic techniques, nuclear magnetic
resonance spectroscopy has attained a widespread application in the field of lignin
characterisation. This technique presents a high resolution, allowing the knowledge of
lignin chemical structures, functionalities and the nature of chemical bonding with high
accuracy.
The application of UV-spectroscopy to lignin characterisation is based on lignin aromatic
nature that makes it a strong absorber of ultraviolet light. The position and intensity of the
maxima in UV spectra will depend on lignin type (softwood, hardwood and non-wood
LIGNIN CHARACTERISATION29
lignin), type of chemical derivatisation applied and used solvent (Lin, 1992). Differential
UV spectroscopy is widely used to identify and quantify phenolic hydroxyl groups by
measuring the difference between spectra before and after ionisation in alkaline solution
(Aulin-Erdtman, 1954; Goldschmid, 1954; Lin, 1992; Zakis, 1994; Gärtner and
Gellerstedt, 1999; Tiainen et al., 1999). The content of α-carbonyl groups can also be
determined using NaBH4 reduction (see Lin, 1992 and Zakis, 1994).
In the original methodologies proposed by Aulin-Erdtman (1954) and Goldschmidt (1954),
the phenolic content was determined using the maximum at 300 nm. However, phenol
groups conjugated with carbonyl groups originate strong absorption in the region
comprised between 280 and 300-310 nm thus leading to erroneous phenolic hydroxyl
content determination. Later, Wexler (1964) used the absorption at 250 nm to minimise
this interference. Nevertheless, this correction was insufficient and some authors reported
that this method presented poor reliability (Milne et al., 1992; Faix et al., 1992). Zakis
(1994) proposed an alternative method that uses two maxima (300 and 350 nm) allowing
determining, both total phenolic hydroxyl groups and α-conjugated aromatic structures.
Gärtner et al. (1999) proposed the utilisation of a solution of 0.2 M NaOH in combination
with dioxane, instead of dioxane alone, in order to improve lignin solubility. They also
found a good correlation between this modified method and aminolysis. Tiainen et al.
(1999) observed that this method correlates well with 1H-NMR spectroscopy results.
Nevertheless, special care should be taken since the calibration is made using lignin model
compounds and its utilisation is not recommended for highly modified lignins (Zakis
1994).
Infrared spectroscopy, in the near-IR region (4000-600 cm-1), is widely used for lignin
characterisation. The potassium bromide (KBr) transmission technique is the most used for
lignin FTIR spectra acquisition although reflection techniques like attenuated total
reflectance (ATR) or diffuse reflectance (DRIFT) can also be used. This technique is
mainly used for qualitative characterisation although quantitative information can also be
obtained as reported by Faix et al. (1992), Faix and Böttcher (1993), Hortling et al. (1997)
and Gilarranz et al. (2001). Quantitative FTIR analysis is normally based on acetylated
lignins samples. It allows determining the ratio phenolic to aliphatic hydroxyl groups based
on the appearance of the acetoxy bands at 1765-1772 cm-1 (aromatic) and 1743 cm-1
(aliphatic) after lignin acetylation. Nevertheless, the overlapping of bands can induce some
LIGNIN CHARACTERISATION30
inaccuracies in the obtained results thus representing the major drawback in quantitative
FTIR analysis (Faix, 1992).
Schultz and Glasser (1986) used DRIFT spectroscopy to quantify various lignin functional
groups (phenolic hydroxyl groups, methoxyl groups, carbonyl groups, aliphatic hydroxyl
groups) using both acetylated and non acetylated lignin samples. They found a good
correlation between the data obtained by DRIFT spectroscopy and other conventional
methods. Exceptions were observed in the determination of carbonyl, total hydroxyl (with
acetylated lignins) and aliphatic hydroxyl (with acetylated and non-acetylated lignins).
Moreover, they have also concluded that DRIFT technique presents an easier sample
preparation, a relatively constant baseline and minor moisture-related interference.
The most studied nuclei in NMR spectroscopy are 1H, 13C, 31P and 19F. The 2D-NMR
spectroscopy is also used to elucidate lignin structure, particularly when detailed structural
characterisation is required. Some studies using solid state NMR spectroscopy have also
been performed (Liitä et al., 2002; Mao et al., 2006).
The natural abundance of proton nucleus (around 100%) and its high sensitivity greatly
contributed to the widespread application of 1H-NMR spectroscopy in the field of lignin
characterisation. It is worth to mention the pioneering work carried out by Lunquist’s
research group (Lunquist, 1977; Lundquist, 1980; Marcelle et al., 1986). 1H-NMR
spectroscopy presents however some limitations associated to the limited range of
chemical shifts (12 ppm), extensive signal overlapping and proton coupling effects
(Argyropoulos and Menachem, 1998).
1H-NMR studies are normally carried out using acetylated lignin samples since better
signal resolution is achieved. Nevertheless, 1H-NMR spectra of underivatised lignin
samples has also been recorded in order to avoid unwanted chemical modifications
resulting from lignin derivatisation (Lundquist, 1981). The analysis of lignin acetylated
derivatives by 1H-NMR allows the quantification of total hydroxyl group contents and the
ratio between aromatic and aliphatic substituent. More recently, Tiainen et al. (1999) have
proposed a method based on D2O exchange of the phenolic proton that enables the
determination of phenolic hydroxyl content without the need of acetylation. This procedure
was also successfully applied to set-up the reaction kinetics of lignin esterification with
butyric anhydride (Thielemans and Wool, 2005).
LIGNIN CHARACTERISATION31
13C-NMR spectroscopy is one of the most powerful techniques available for lignin analysis
providing comprehensive structural data about lignin carbon skeleton. Compared to proton
NMR, 13C-NMR spectroscopy offers a better resolution over a much wider chemical shift
range (240 ppm) and with almost no coupling effects (Robert, 1992; Argyropoulos and
Menachem, 1998; Chen, 1998; Baeza and Freer, 2000). Furthermore, several pulse
sequences techniques were applied to lignin and found to greatly contribute to a better
understanding of its 13C-NMR spectra. These techniques include J-modulated spin-echo
(JMOD), attached proton test (APT), quaternary carbon only (QUAT), distortionless
enhancement by polarisation transfer (DEPT) and insensitive nuclei enhancement by
polarisation transfer (INEPT). A comparative study reporting the sensitivity and the quality
of editing and differentiation has been performed by Landucci (1991). The utilisation of
these techniques as complement to common 13C-NMR spectroscopy allows a better
discrimination of carbon types in lignin spectra (Landucci, 1991).
Despite all the numerous advantages, 13C-NMR spectroscopy presents some drawbacks
associated to the weak sensitivity and low natural abundance of 13C nuclei (only 1.1%). As
a consequence, long acquisition times and relatively large sample sizes are often required
for 13C-NMR lignin analysis (Argyropoulos and Menachem, 1998). In the obtaining of
quantitative 13C-NMR spectra special care should be taken in order to allow complete
relaxation of the magnetisation, which often results in long acquisition times
(Argyropoulos and Menachem, 1998). The quantitative data thus obtaining are normally
reported on the basis of a structural element, generally the phenylpropane unit (C9 (C6-
C3)) although methoxyl unit could also be used (Robert, 1992; Robert and Brunow, 1984).
When values are reported on a C9 basis, integrations are conducted assuming that the
aromatic region (100-160 ppm) contains six carbon atoms and all other signals are
integrated with respect to this value. Additionally, a correction can be made for the minor
amounts of vinyl carbons (Robert, 1992). For technical lignins the data thus obtained are
supposed to present some inaccuracies since they often contain degraded side chains. More
recently, Xia et al. (2001) proposed a method that uses 1,3,5-trioxane and
pentafluorobenzene, as internal standard. This method allows an accurate determination of
the various carbon atoms present in all type of lignins even in those heavily modified.
Additionally, quantification is made in absolute units of millimoles per gram of sample.
LIGNIN CHARACTERISATION32
The determination of aliphatic (primary and secondary), total phenolic hydroxyls and
consequently total hydroxyl content by 13C-NMR spectroscopy, after lignin acetylation, is
also a current practice for lignin hydroxyl groups determination (Robert and Brunow,
1984).
For 13C- and 1H-NMR spectroscopy a database comprising a large number of lignin model
compounds and respective chemical shifts has been created by Ralph and Landucci from
U.S. Dairy Forage Research Center. This database is of public access and constitutes a
useful tool to analyse NMR spectra (http://www.dfrc.ars.usda.gov).
31P-NMR spectroscopy technique has been mainly developed by Argyropoulos’s research
group (Argyropoulos et al., 1993; Granata and Argyropoulos 1995; Argyropoulos and
Zhang, 1998). Lignin samples are derivatised with 2-chloro-4,4,5,5-tetramethyl-1,3,2-
dioxaphospholane, and from a single experiment it is possible to discriminate the three
forms of phenolic hydroxyl groups (p-hydroxyphenyl, guaiacyl, and syringyl structures), as
well as aliphatic hydroxyl functions, condensed phenol units, and carboxylic acid
(Argyropoulos and Menachem, 1998). In addition, this method offers a relatively rapid
acquisition time (1 to 2 hours) and the possibility to obtain further details about lignin
stereochemistry (Baeza and Freer, 2000). The advantages associated to this method have
clearly contributed to the widespread of its application to lignin chemistry (Crestini and
Argyropoulos, 1997; Argyropoulos and Zhang, 1998; Malkavaara et al., 1999; Hoareau et
al., 2004).
The 19F nucleus presents a 100% natural abundance and its sensitivity is close to that of the
proton nucleus. The chemical shifts extend over a wide range which provides an adequate
signal dispersion thus contributing to a reduction of signal overlap. The 19F-NMR
spectroscopy was applied to the qualitative determination of lignin hydroxyl groups being
worth to mention the work developed by Barrelle (Barrelle, 1993; Barrelle, 1995). The
method proposed by Barrelle includes the derivatisation of lignin with 2-or 4-fluorobenzyl
chlorides or respective anhydrides thus allowing to: (i) distinguish guaiacyl from guaiacyl-
syringyl lignins, (ii) determine syringyl/guaiacyl ratio, and (iii) approximately determine
the α-C=O content. More recently, 19F-NMR spectroscopy is being applied to quantify and
discriminate other functional groups in lignin macromolecules, particularly carbonyl
groups. Ahvazi and Argyropoulos (1996) and Ahvazi et al. (1999) proposed the
LIGNIN CHARACTERISATION33
quantification of lignin carbonyl groups after quantitative trifluoromethylation reaction.
Sevillano et al. (2001) presented a method in which the quantification of lignin carbonyl
groups is achieved after trifluoromethylphenylhydrazine derivatisation reaction. Both
methods presented reproducible results and good correlations with other conventional
methods, thus constituting viable alternatives for identification and quantification of lignin
carbonyl groups.
Two-dimensional NMR (2D-NMR) correlation techniques, such as heteronuclear multiple
quantum correlation (HMQC) and heteronuclear single quantum correlation (HSQC)
provide better resolution, sensitivity enhancement, and reliability of the signals
comparatively to 1D-NMR techniques (Liitiä et al., 2003; Balakshin et al., 2003).
Although 2D-NMR techniques are mostly used for lignin qualitative characterisation, some
studies reporting quantitative analysis can already be found in the literature (Heikkinen et
al., 2003). The 3D-NMR technique has also been applied to lignin structural
characterisation (Liitiä et al., 2003). A good review of 2D-NMR techniques was reported
by Ralph et al. (1999).
3.1.4 Molecular weight determination
The understanding of macromolecular properties of lignin requires information on lignin
molecular weight and lignin molecular weight distribution (MWD). Several techniques are
available such as light scattering (LS), vapour pressure osmometry (VPO) and size
exclusion chromatography (SEC), if one wants to mention the most frequently used. In the
last decades, some sophisticated methods such as MALDI-TOF-MS and electrospray
ionisation mass spectrometry (ESI-MS) have also been applied to lignin molecular weight
determination (Evtuguin et al., 1999; Bayerbach et al., 2006).
Light scattering (LS) has become one of the most relevant techniques for macromolecules
molecular weight characterisation, including lignin. Low angle laser light scattering
(LALLS) and multi angle laser light scattering (MALLS) have been used to determine
lignin absolute weight-average molecular weight ( WM ) and the second virial coefficient
(A2). MALLS also allow determining the radius of gyration (Rg). However, the specific
optical properties of lignins (absorbance, fluorescence and anisotropy) may interfere with
LS analysis and thus it is necessary to perform some corrections (Pla, 1992). With
LIGNIN CHARACTERISATION34
instrumentation developments some of these interferences are being solved or minimised,
for example, for fluorescence correction the use of appropriate filters is recommended. LS
experiments have been performed with several lignins, including acetylated samples, with
various types of solvents. Some of the performed studies aimed to understand and clarify
the typical association behaviour of lignins in solution (Woerner and MacCarthy, 1988;
Merkle et al., 1992; Schmidl et al., 1990; Gidh et al., 2006). Light scattering can also be
used as SEC detector enabling MWD determination (Cathala et al., 2003).
Vapour pressure osmometry (VPO) is a classic method used for determining lignin
absolute number-average molecular weight ( nM ). VPO analysis is however limited to
analyse lignins of low molecular weight (between 100 to 10000 g/mol). Tetrahydrofuran
(THF), dioxane, N-N-dimethylformamide (DMF) and 2-methoxyethanol are the most
recommended solvents for lignin analysis. The presence of low molecular weight
impurities can also interfere, thus imposing a special care when using this technique (Pla,
1992).
In order to obtain information about the molecular weight distribution (MWD) and
consequently to infer the averages (number-average molecular weight ( nM ) and weight-
average molecular weight ( WM )) and dispersion (polydispersity index, PI), lignins are
routinely characterised by size exclusion chromatography. Typical SEC analysis uses
ultraviolet-visible (UV-VIS) and refractive index (RI) concentration detectors. Depending
on the lignin source, applied isolation method, type of functional groups and their counter
ions present in the structure, different chromatographic behaviours can be expected. In fact
some problems related to SEC analysis of lignin are reported in the literature namely,
adsorption on chromatographic support, ionic interactions due to the polyelectrolyte nature
of lignin and intermolecular association effects (Majcherczyk and Hüttermann, 1997).
Various SEC systems have been applied to lignin analysis (Connors et al., 1980; Pellinen
and Salkinoja-Salonen, 1985; Johnson et al., 1989; Baumberger et al., 2007). Among the
used stationary phases are worth to mention, PS-DVB (Waters, Polymer Laboratories and
Varian), hydroxypropylated dextran (Amersham Pharmacia Biotech), various silicas
(Nacalai Tesque, Tessek and Polymer Standard Service) and copolymers of acrylate-
metacrylate (Polymer Standard Service). The used mobile phases include THF (usually
LIGNIN CHARACTERISATION35
used with acetylated lignins), DMF/LiCl, DMF/LiBr, DMAc, DMSO/Water/LiBr and
mixtures of THF/DMF among others.
Calibration is usually performed with polystyrene (PS), polymethylmethacrylate (PMMA),
igepal, pullulan, polyethylene (PE), and poly(ethylene oxide) depending on the SEC
system used. The use of these calibrations leads to the obtaining of apparent molecular
weights. In spite of this limitation, the obtained information is quite useful for comparison
purposes. To overcome this restriction, absolute molecular weight detectors, such as
MALLS, should be used. Moreover, lignin model compounds and well defined lignin
fractions have also been tried (Pellinen and Salkinoja-Salonen, 1985; Johnson et al., 1988;
Gellersted, 1992).
Size exclusion chromatography using DMF/LiBr as the eluent and PS-DVB gels as the
stationary phase is a widely used system. DMF is a high-polarity and strong solvent for
many organic polymers including lignin itself, thus enabling SEC analysis without needs
of derivatisation. Nevertheless, lignin association effects have been found to occur in such
solvents. To overcome this restriction, lithium halide salts, such as LiBr, must be added in
order to increase the ionic strength, which yield enhanced solvatation of the solute
(Schmidl et al., 1990; Gellersted, 1992).
3.1.5 Determination of thermal properties
Thermogravimetric analysis (TGA), differential scanning calorimetry (DSC), and
differential thermal analysis (DTA) are the most widely used techniques to evaluate
thermal properties (glass transition temperature, thermal stability, heat capacity).
TGA is used to determine lignin thermal stability by monitoring sample weight lost as a
function of temperature or as a function of time for a fixed temperature. The sample could
be under inert or oxidative atmosphere. TGA can also be used in combination with mass
spectrometry. The monitoring of the gaseous degradation products can be used to establish
a correlation between thermal degradation yield and the amount of functional groups. The
application of this procedure to lignin can be found in the work of Jakab et al. (1997).
DTA and DSC are used to determine heat capacity (Cp) and glass transition temperature
(Tg). For Tg measurements, DSC is more used than DTA and the recent appearing of new
LIGNIN CHARACTERISATION36
DSC techniques, such as the modulated variant, has even more contributed to the wide
spreading of this technique. DSC measures the energy necessary to maintain a sample and
a reference at the same temperature, when they are both submitted to a temperature rise.
On the contrary, DTA measures the difference between the temperature of the sample and
that of an inert reference.
The glass transition temperature of lignin can be of difficult access mainly due to the
associated high molecular weight heterogeneity, i.e., a broad molecular weight
distribution; and due to the presence of low molecular weight impurities (resulting from
the used pulping and recovering procedures). Moreover, sample history and crosslinking
degree also influence the experimental determination (Hatakeyama, 1992). Typical lignin
Tg’s are around 80 ºC for organosolv lignins, 140 ºC for kraft lignins and in the range of
158-185 ºC for soda lignins (Lora, 2008). Information concerning lignin thermal properties
and techniques involved can be found in the reviews performed by Hatakeyama (1992) and
Hatakeyama and Hatakeyama (2004).
3.2 Materials and Methods
3.2.1 Lignin samples
The technical lignins used in this work represent three different pulping processes (Kraft,
Soda and Organosolv) and different botanic origins, i.e., softwood, hardwood and non-
wood lignin types. Indulin AT and Curan 27-11P (commercialised in the alkali form) are
softwood lignins obtained by the Kraft pulping process and were supplied by
MeadWestvaco (Glen Allen, VA) and BorregaardLignoTech (Sarpsborg, Norway),
respectively. Actually, lignin Curan 27-11P is no longer produced by
BorregaardLignoTech as a result of the acquisition of Borregaard LignoTech kraft business
by MeadWestvaco Corporation. Sarkanda lignin was supplied by Granit SA (Lausanne,
Switzerland) and it is a non-wood lignin (wheat and hemp) obtained from a soda pulping-
precipitation process, patented by Granit SA. Alcell lignin of Repap Enterprises Inc.
(Stamford, CT), was offered by Dr. Jairo Lora. This lignin was extracted from mixed
hardwoods (maple, birch and poplar) by an organosolv process using aqueous ethanol. The
lignins were used as received and without further purification.
LIGNIN CHARACTERISATION37
3.2.2 Ash content
The ash content was determined according to Tappi 211 om-93 method. Initially, porcelain
crucibles were placed in a muffle furnace during 1 hour at 525 ºC and then left to cool in a
desiccator until room temperature. The weight of the crucibles was recorded and then 1.0 g
of lignin was weighed. The crucibles containing lignin sample were placed in the muffle
furnace during 5 hours at 525 ºC and thereafter left to cool in a desiccator until room
temperature. The crucibles containing lignin ashes were then weighed until constant weigh
was reached. All the determinations were done at least in duplicate. The ash content (Ash
(%, w/w)) was determined using equation 3.1.
Ash (%, w/w) 1002
1 W
W (3.1)
where:
1W - is the ash weight, in g
2W - is the initial lignin sample weight, in g
3.2.3 External acidity/alkalinity determination
Lignin samples were weighted (1 g) into an Erlenmeyer and then 100 mL of an aqueous
neutral solution was added. The suspension was left under stirring during 1 hour and the
pH measured. If pH was higher than 7, the suspension was titrated with an acid solution
until a neutral pH was reached. If pH was lower than 7, the suspension was titrated with an
alkaline solution until neutrality. The external acidity/alkalinity was determined using
equation 3.2.
1000
/ 1
W
CValkalinityAcidity (3.2)
where:
Acidity/Alkalinity- is the external acidity or alkalinity, in mmol/g
1V - is the volume of acid/alkaline solution required for neutralisation, in mL
C - is the concentration of acid/alkaline solution, in mol/L
W - is the lignin sample weight, in g
LIGNIN CHARACTERISATION38
3.2.4 Elemental analysis
Elemental analysis was carried out by the Laboratoire Centrale d’Analyse, CNRS
(Vernaison, France). The carbon, hydrogen, nitrogen, sulphur and sodium contents were
determined for all samples. Oxygen content was obtained by difference after ash correction
for the samples of Sarkanda, Indulin AT and Curan 27-11P. For Alcell lignin, a high purity
lignin, the oxygen content was determined directly. All the determinations were done in
duplicate.
3.2.5 Sugar content determination
Sugar content was determined after a two-step hydrolysis procedure of lignin samples
based in the method documented by Lepifre et al. (2004). The lignin samples (between 6
and 15 mg) were weighed directly into a screw cap tube to which 125 µL of a 13 M H2SO4
solution, were added. The reaction mixture was left during 1 hour at 25 ºC and regularly
crushed with a glass stick placed in the tube. A known volume (50 µL for Alcell, 150 µL
for Sarkanda and 80 µL for Indulin AT and Curan 27-11P lignins) of internal standard
fucose solution (1 mg/mL) was added followed by the addition of 1.5 mL of deionised
water, in order to reach a 1 M H2SO4 solution. The tube was closed and the reaction was
left to occur at 100 °C for 2 hours. Finally, the solutions were cooled down to reach room
temperature and then filtered with a Whatman membrane filter (0.45µm), before HPLC
analysis. Sugars contents of the ensuing hydrolysates were determined by high
performance anion exchange chromatography with pulsed amperometric detection
(HPAEC/PAD). The chromatographic system consisted of a GP40 quaternary gradient
high pressure pump, and an ED40 pulsed amperometric detector (Dionex Corporation,
Sunnyvale, CA). Sugar separation was achieved with two Carbo-Pac PA1 columns (4x250
mm analytical column) and a guard column (4x50 mm) connected in series.
Sugars were analysed in gradient mode at a flow rate of 1 mL/min and at a temperature of
30 ºC. The analysis started with a concentration of 4 mM NaOH (time zero) and thereafter
decreased until reaching 1 mM NaOH (13 minutes). The concentration of NaOH was then
increased until reaching the initial value (4 mM NaOH) at the analysis time of 25 minutes
(column regeneration). Pure sugar samples (glucose, mannose, xylose, galactose and
LIGNIN CHARACTERISATION39
arabinose) were used in order to build calibration curves whose concentration range varied
between 1.25 mg/L and 10 mg/L.
3.2.6 Fourier transform infrared spectroscopy (FTIR) analysis
FTIR spectra were collected on a FTIR BOMEN (model MB 104) by preparing KBr
pellets using a lignin concentration of 1% (w/w). Spectra were recorded between 650 and
4000 cm-1 at a resolution of 4 cm-1 and co-adding forty eight scans. To avoid pellet
moisture contamination the following procedure was followed: (i) lignin (acetylated and
non-acetylated samples) and KBr were left during 24 hours at 40 ºC under reduced
pressure before pellet preparation; (ii) pellets were subjected to the same conditions during
12 hours prior to FTIR analysis.
3.2.7 Hydroxyl determination by titration
Hydroxyl determination by titration was based on the standard ISO 14900:2001(E). This
method was developed for determining hydroxyl number of polyether polyols that might
present steric hindrance. Briefly, the lignin and the blank samples were refluxed at 115 ºC
in 25 mL of an acetylation reagent solution. This solution was prepared freshly (daily) by
mixing 127 mL of acetic anhydride with 1000 mL of dry pyridine and 16 g of imidazole
(catalyst). Additionally, lignin samples were degassed overnight under vacuum at 40 ºC
before being acetylated. After the reflux period (1 hour), the flasks were left to cool at
room temperature, and thereafter the excess of acetic anhydride was hydrolysed with
distilled water. The resulting acetic acid was subsequently titrated with sodium hydroxide
(0.5 M) and the difference between the acetic acid concentration of the blank and of that of
the lignin samples allowed the determination of the total hydroxyl content. The titrations
were carried out using an automatic titrator (Methrom 736 GP Titrino) equipped with a
glass electrode. Sample size was adjusted such a way that the volume of sodium hydroxide
solution used for the titration of the lignin sample was less than 80% of that required for
the blank counterpart.
The reaction time necessary to reach a constant hydroxyl number value was determinated
after subjecting the four lignin samples to the acetylation process for one and two hours.
Results were analysed by FTIR and 13C-NMR further allowing evaluating the reliability of
this procedure when applied to lignin. The obtained data indicated that the maximum
LIGNIN CHARACTERISATION40
reaction yield was reached for reaction time of 1 hour. A detailed description of this study
can be found in Annexe A.
Hydroxyl number, in mgKOH/g, was determined using equation 3.3.
Hydroxyl number
W
CVV 1.5621 (3.3)
where:
1V - is the volume of NaOH solution required for the blank titration, in mL
2V - is the volume of NaOH solution required for sample titration, in mL
C - is the concentration of NaOH solution, in mol/L
W - is the lignin sample weight, in g
3.2.8 Sample preparation for NMR analysis
3.2.8.1 13C-NMR analysis
13C-NMR samples were prepared by dissolving 300 mg of lignin (acetylated or non-
acetylated) in 3.5 mL of DMSO-d6. For hydroxyl determination purposes the samples
were previously acetylated using two different acetylation procedures.
The first one corresponds to the procedure described in section 3.2.7. After acetylation the
sample was recovered by precipitation using a procedure adapted from Glasser et al.
(1993). Briefly, the reaction mixture was precipitated in a 0.1 N HCl solution
(approximately ten times the volume of the reaction mixture, 250 mL). Then, the
acetylated lignins were filtered and washed several times with 0.1 N HCl to remove
pyridine, followed by washing with distilled water to remove HCl. The recovered
acetylated lignins were collected and freeze dried. The final samples were stored in a
desiccator at room temperature.
The second procedure was based on the method proposed by Månsson (1983) and
modified by Thielemans and Wool (2005). The acetylation reaction was performed without
solvent using a weight ratio of acetic anhydride to lignin of 2:1 and 1-methyl imidazole, as
a catalyst (0.05 mL per g de lignin). The reaction was conducted at 50 ºC, under a stream
of nitrogen and vigorous stirring during one night. The reaction was then quenched with
LIGNIN CHARACTERISATION41
ethyl ether (100 mL) and the ensuing mixture was washed five times with deionised water
(50 mL of each time). Cyclohexane (100 mL) was finally added to the ether phase to
precipitate the derivatised lignin. The lignin samples were recovered by filtration and then
freeze dried. The final samples were stored in a desiccator at room temperature.
3.2.8.2 1H-NMR analysis
Lignin samples were prepared according to the procedure described by Tiainen et al.
(1999). Lignins were previously washed with a 0.004 M HCl solution and then freeze
dried. The solutions were prepared by dissolving 10 mg of the resulting lignin in 0.8 mL
DMSO-d6 (99.8%, SDS) followed by the addition of 1µL of DMF-d1 (reference
compound). The solutions were left overnight over molecular sieves of 4 Å and then
transferred to an NMR tube to record the corresponding 1H-NMR spectrum. Then, 20%
D2O (by volume) was added and a second spectrum recorded, in order to quantify the
phenolic OH groups.
3.2.8.3 31P-NMR analysis
The phosphitylation of lignin samples was performed using the method described by
Hoareau et al. (2004). A solvent solution of pyridine and CDCl3 (1.6/1, v/v) was prepared
and dried over molecular sieves. This solution was used for the preparation of the
relaxation reagent (Chromium (III) acetylacetonate, 5 mg/mL) and the internal standard
solutions (Cholesterol, 5mg/mL). Lignins were phosphitylated with 2-chloro-4,4,5,5-
tetramethyl-1,3,2-dioxaphospholane. Thirty milligrams of lignin were dissolved in 0.5 mL
of DMF in a vial sealed with a Teflon-faced septum. Then, 0.3 mL of the solvent solution
was added, followed by the addition of 0.1 mL of the internal standard and relaxation
solution. The phosphitylation reagent (0.1 mL) was added, and the flask shaken to ensure a
homogeneous mixture. After derivatisation, the resulting solution was transferred to a 5
mm tube and the corresponding 31P-NMR spectrum recorded.
3.2.9 NMR instrumentation and procedures
3.2.9.1 13C-NMR analysis
13C-NMR experiments were carried out on a MERCURY Varian spectrometer equipped
with a 10 mm BB probe operating at 100.624 MHz. Experiments were conducted at 50 ºC
LIGNIN CHARACTERISATION42
in DMSO-d6 (99.8%, SDS). 13C-NMR chemical shifts are given relatively to
tetramethylsilane (TMS). The positions of the peaks were referenced to the residual solvent
peak DMSO-d6 (δ=39.5 ppm). Spectra were quantitative (proton broad band decoupling
only during the acquisition time). 13C-NMR spectra were obtained using a 23 kHz (228
ppm) spectral width, 32 K data points, 11 s relaxation delay, and 12 µs for a 75° pulse,
zero-filling and 10 Hz line broadening.
The quantification of C atoms from the spectra of original lignin samples was performed
by using the following approximate integration limits: C atoms from COOH and CO
aldehydes between 160-200 ppm, C atoms from methoxyl between 54-58 ppm, C from ß-
O-4 between 81-88 ppm and C from aliphatic CH between 48-100 ppm.
For the determination of the hydroxyl contents by 13C-NMR the following approximate
integration limits were used: primary alcohols from 169.4 to 170.4ppm, secondary
hydroxyls from 168.5 to 169.4 ppm and phenolic hydroxyls from 165.8 to 168.5 ppm.
The values obtained by quantitative 13C-NMR spectroscopy will be presented using the
following terminology: integral value/C9 unit.
3.2.9.2 1H-NMR analysis
The 1H-NMR spectra of lignins were recorded on a MERCURY Varian spectrometer
equipped with a 5 mm QNP probe. Experiments were performed at 25 ºC. The one-pulse
sequence was used with a 30 ºC pulse (2 µs), a relaxation delay of 4.6 s spectral width of
10000 Hz and 40 K data points.
The phenolic protons were obtained as the difference between the spectra of the samples
before and after the addition of D2O (integrals within 8-11 ppm). The integral of methyl
protons in dimethylformamide-d1 (2.6-2.9 ppm) was taken as reference.
3.2.9.3 31P-NMR analysis
31P-NMR spectra were recorded on a UNITY Varian spectrometer, equipped with a 5 mm
id-pfg probe operating at 161.929 MHz. Experiments were recorded at 25 ºC in CDCl3.
Chemical shifts were calibrated from the sharp 31P-NMR signal at 132.2 ppm arising from
the reaction product between residual water and 2-chloro-4,4,5,5-tetramethyl-1,3,2-
LIGNIN CHARACTERISATION43
dioxaphospholane. Spectra were quantitative (proton broad band decoupling only during
acquisition time). Cholesterol was used as internal standard for quantitative evaluations of
lignin structural elements. Relaxation times T1 (all T1<2.5s) were controlled with the
inversion recovery sequence before any quantitative measurements. 31P-NMR spectra were
obtained using a 8.7 kHz spectral width, 32 K data points, 10 s relaxation delay, 1.8 s
acquisition time, and 30 µs for a 75º pulse, zero-filling and 1 Hz line broadening.
The different hydroxyl groups were obtained by integrating the following spectral regions:
aliphatic hydroxyls from 146-149 ppm, guaiacyl phenolic hydroxyls from 139-140 ppm, p-
hydroxyphenyl phenolic hydroxyls from 137.5-138.5 ppm, syringyl phenolic hydroxyls
from 142-143 ppm, and carboxylic acid units from 134.0-135.5 ppm. The quantification of
condensed phenol units results from the difference between the integrals of peaks at 140-
144 ppm and those at 142-143 ppm, regions (syringyl phenolic hydroxyls).
3.2.9.4 DEPT, APT and 2D-NMR analysis
13C-NMR spectra (DEPT 135°) were carried out with a delay d2=1/(2J) optimised for a
coupling constant 1J(C,H) = 150Hz, 0.25s acquisition time, 3s relaxation delay, and 14.5s
for a 90° pulse. The APT (Attach proton transfer) was used with a d2 delay = 1/(2J)
optimised for a coupling constant 1J(C,H) = 150Hz, 0.25s acquisition time, 5s relaxation
delay.
HMQC and HMBC experiments spectra were recorded respectively with and without
proton decoupling, on the spectral windows used for 1D acquisition, using a 2048 x 128
matrix. Delay was optimised for nJ(H,C) = 5Hz and 1J(H,C) = 150Hz. Zero-filling in both
dimensions 4096 x 1024 and sine multiplication were performed prior to Fourier
transformation. A forward linear prediction on 512K in the 13C dimension enhanced
resolution.
3.2.10 Molecular weight determination
3.2.10.1 Size exclusion chromatography (SEC) analysis
Molecular weight distribution (MWD), average-molecular weights ( nM and WM ) and
polydispersity index (PI) were determined by SEC using a system consisting of two
LIGNIN CHARACTERISATION44
columns PLgel 5µm Mixed-D (300×7.5 mm) and a pre-column (Polymer Laboratories)
connected in series. Analyses were carried out at 80 ºC using DMF with 0.1% LiBr (w/v)
as eluent at flow rate of 1mL/min and UV detection (=280 nm). Lignin samples were
prepared at a concentration of 4 mg/mL, 24 hours previously to analysis. The calibration of
the system was performed with polystyrene standards (7500000, 2560000, 841700,
320000, 148000, 59500, 28500, 9920, 2930, 580 g/mol) and toluene (92.14 g/mol).
Calculations were performed using the Cirrus GPC/SEC software from Polymer
Laboratories. GPC Software
3.2.10.2 Vapour pressure osmometry (VPO) analysis
VPO experiments were performed on a Knauer instrument calibrated with solutions of
pure benzyl in 2-methoxyethanol (solvent) at 60 ºC. Calibration was performed using four
solutions of benzyl in 2-methoxyethanol within a concentration range of 0.005-0.02 mol/L.
For each lignin sample four solutions, in a concentration range of 2.00-6.00 g/kg, were
prepared with 2-methoxyethanol.
3.2.11 Thermal analysis
3.2.11.1 Thermogravimetric analysis (TGA)
TGA analyses were carried out in a NETZSCH STA 409 apparatus. The lignin samples
(15-25 mg) were placed in appropriate pans and heated at a flow rate of 10 ºC/min from
ambient temperature to 700 ºC. Both nitrogen and air atmospheres have been used.
3.2.11.2 Differential scanning calorimetric (DSC) analysis
DSC experiments were conducted on a Q100 DSC from TA Instruments at a heating rate
of 10 ºC/min under nitrogen atmosphere (50 mL/min). Before analysis, lignin samples
were dried under vacuum at 40 ºC during 24 hours. Then, approximately 5 mg were
weighed and encapsulated into an aluminium pan. Two DSC consecutive runs were
performed. In the first heating scan, lignin samples were heated from -100 to 200 ºC and
then rapidly quenched in liquid nitrogen in order to eliminate the sample thermal history.
Thereafter, the second heating run was performed from -100 to 200 ºC/min and the
obtained thermogram used to determine Tg (midpoint of the temperature range at which
the change in heat capacity occurs). For each lignin sample at least three experiments were
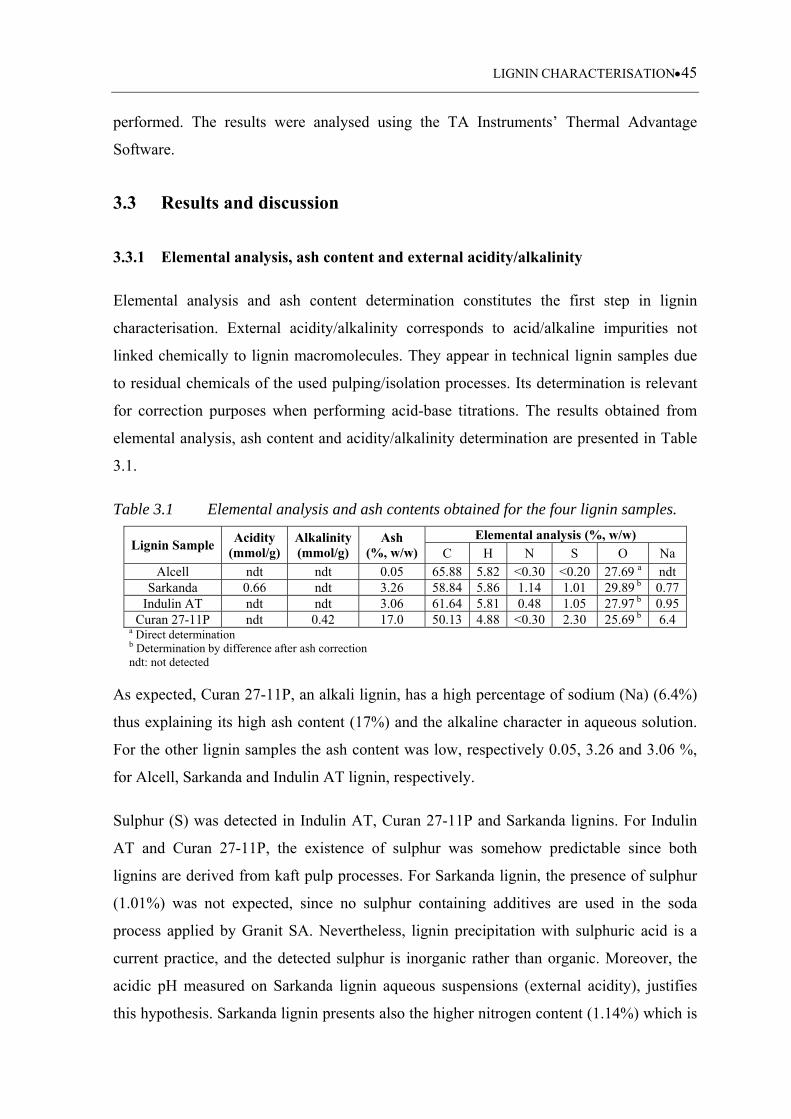
LIGNIN CHARACTERISATION45
performed. The results were analysed using the TA Instruments’ Thermal Advantage
Software.
3.3 Results and discussion
3.3.1 Elemental analysis, ash content and external acidity/alkalinity
Elemental analysis and ash content determination constitutes the first step in lignin
characterisation. External acidity/alkalinity corresponds to acid/alkaline impurities not
linked chemically to lignin macromolecules. They appear in technical lignin samples due
to residual chemicals of the used pulping/isolation processes. Its determination is relevant
for correction purposes when performing acid-base titrations. The results obtained from
elemental analysis, ash content and acidity/alkalinity determination are presented in Table
3.1.
Table 3.1 Elemental analysis and ash contents obtained for the four lignin samples.
Lignin Sample Acidity
(mmol/g) Alkalinity(mmol/g)
Ash (%, w/w)
Elemental analysis (%, w/w) C H N S O Na
Alcell ndt ndt 0.05 65.88 5.82 <0.30 <0.20 27.69 a ndt Sarkanda 0.66 ndt 3.26 58.84 5.86 1.14 1.01 29.89 b 0.77
Indulin AT ndt ndt 3.06 61.64 5.81 0.48 1.05 27.97 b 0.95 Curan 27-11P ndt 0.42 17.0 50.13 4.88 <0.30 2.30 25.69 b 6.4
a Direct determination b Determination by difference after ash correction ndt: not detected
As expected, Curan 27-11P, an alkali lignin, has a high percentage of sodium (Na) (6.4%)
thus explaining its high ash content (17%) and the alkaline character in aqueous solution.
For the other lignin samples the ash content was low, respectively 0.05, 3.26 and 3.06 %,
for Alcell, Sarkanda and Indulin AT lignin, respectively.
Sulphur (S) was detected in Indulin AT, Curan 27-11P and Sarkanda lignins. For Indulin
AT and Curan 27-11P, the existence of sulphur was somehow predictable since both
lignins are derived from kaft pulp processes. For Sarkanda lignin, the presence of sulphur
(1.01%) was not expected, since no sulphur containing additives are used in the soda
process applied by Granit SA. Nevertheless, lignin precipitation with sulphuric acid is a
current practice, and the detected sulphur is inorganic rather than organic. Moreover, the
acidic pH measured on Sarkanda lignin aqueous suspensions (external acidity), justifies
this hypothesis. Sarkanda lignin presents also the higher nitrogen content (1.14%) which is
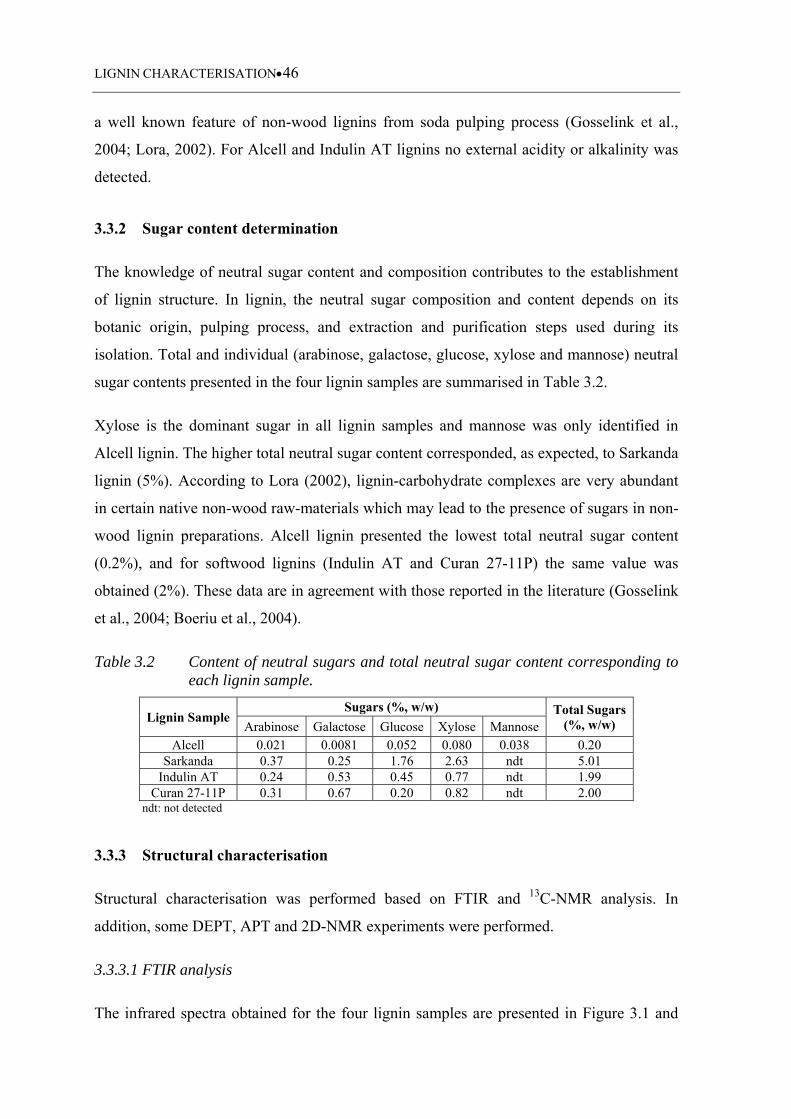
LIGNIN CHARACTERISATION46
a well known feature of non-wood lignins from soda pulping process (Gosselink et al.,
2004; Lora, 2002). For Alcell and Indulin AT lignins no external acidity or alkalinity was
detected.
3.3.2 Sugar content determination
The knowledge of neutral sugar content and composition contributes to the establishment
of lignin structure. In lignin, the neutral sugar composition and content depends on its
botanic origin, pulping process, and extraction and purification steps used during its
isolation. Total and individual (arabinose, galactose, glucose, xylose and mannose) neutral
sugar contents presented in the four lignin samples are summarised in Table 3.2.
Xylose is the dominant sugar in all lignin samples and mannose was only identified in
Alcell lignin. The higher total neutral sugar content corresponded, as expected, to Sarkanda
lignin (5%). According to Lora (2002), lignin-carbohydrate complexes are very abundant
in certain native non-wood raw-materials which may lead to the presence of sugars in non-
wood lignin preparations. Alcell lignin presented the lowest total neutral sugar content
(0.2%), and for softwood lignins (Indulin AT and Curan 27-11P) the same value was
obtained (2%). These data are in agreement with those reported in the literature (Gosselink
et al., 2004; Boeriu et al., 2004).
Table 3.2 Content of neutral sugars and total neutral sugar content corresponding to each lignin sample.
Lignin Sample Sugars (%, w/w) Total Sugars
(%, w/w) Arabinose Galactose Glucose Xylose Mannose Alcell 0.021 0.0081 0.052 0.080 0.038 0.20
Sarkanda 0.37 0.25 1.76 2.63 ndt 5.01 Indulin AT 0.24 0.53 0.45 0.77 ndt 1.99
Curan 27-11P 0.31 0.67 0.20 0.82 ndt 2.00 ndt: not detected
3.3.3 Structural characterisation
Structural characterisation was performed based on FTIR and 13C-NMR analysis. In
addition, some DEPT, APT and 2D-NMR experiments were performed.
3.3.3.1 FTIR analysis
The infrared spectra obtained for the four lignin samples are presented in Figure 3.1 and
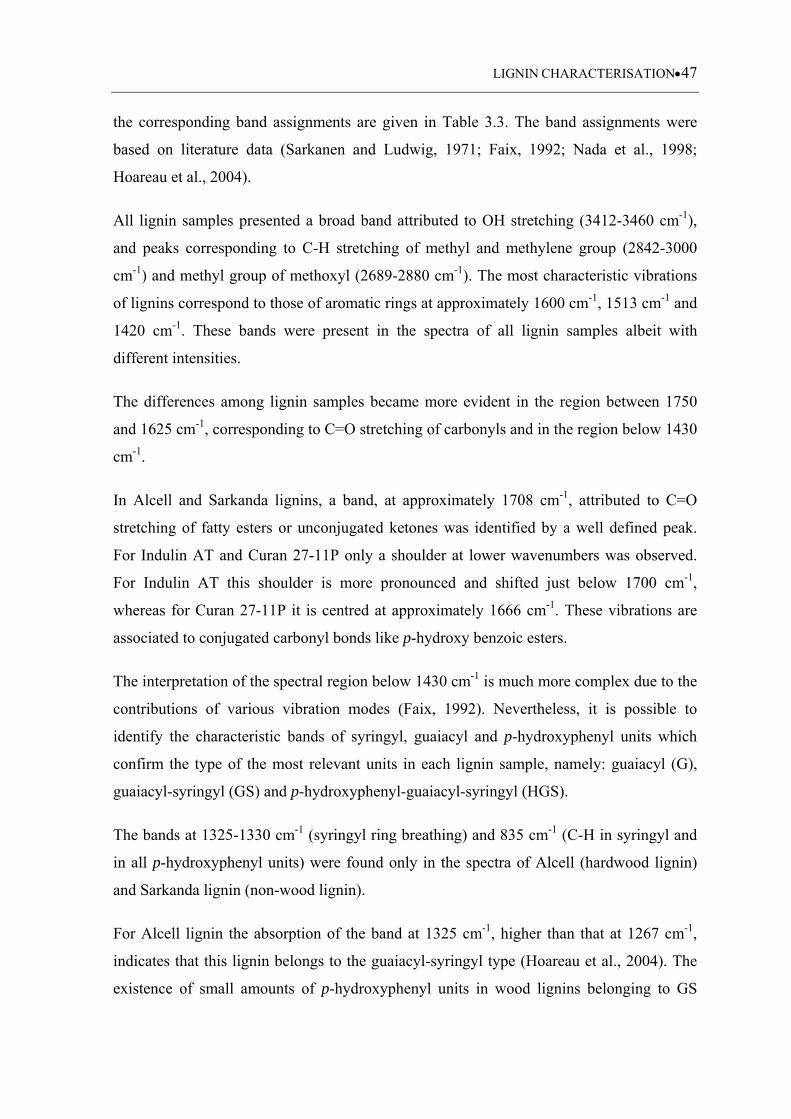
LIGNIN CHARACTERISATION47
the corresponding band assignments are given in Table 3.3. The band assignments were
based on literature data (Sarkanen and Ludwig, 1971; Faix, 1992; Nada et al., 1998;
Hoareau et al., 2004).
All lignin samples presented a broad band attributed to OH stretching (3412-3460 cm-1),
and peaks corresponding to C-H stretching of methyl and methylene group (2842-3000
cm-1) and methyl group of methoxyl (2689-2880 cm-1). The most characteristic vibrations
of lignins correspond to those of aromatic rings at approximately 1600 cm-1, 1513 cm-1 and
1420 cm-1. These bands were present in the spectra of all lignin samples albeit with
different intensities.
The differences among lignin samples became more evident in the region between 1750
and 1625 cm-1, corresponding to C=O stretching of carbonyls and in the region below 1430
cm-1.
In Alcell and Sarkanda lignins, a band, at approximately 1708 cm-1, attributed to C=O
stretching of fatty esters or unconjugated ketones was identified by a well defined peak.
For Indulin AT and Curan 27-11P only a shoulder at lower wavenumbers was observed.
For Indulin AT this shoulder is more pronounced and shifted just below 1700 cm-1,
whereas for Curan 27-11P it is centred at approximately 1666 cm-1. These vibrations are
associated to conjugated carbonyl bonds like p-hydroxy benzoic esters.
The interpretation of the spectral region below 1430 cm-1 is much more complex due to the
contributions of various vibration modes (Faix, 1992). Nevertheless, it is possible to
identify the characteristic bands of syringyl, guaiacyl and p-hydroxyphenyl units which
confirm the type of the most relevant units in each lignin sample, namely: guaiacyl (G),
guaiacyl-syringyl (GS) and p-hydroxyphenyl-guaiacyl-syringyl (HGS).
The bands at 1325-1330 cm-1 (syringyl ring breathing) and 835 cm-1 (C-H in syringyl and
in all p-hydroxyphenyl units) were found only in the spectra of Alcell (hardwood lignin)
and Sarkanda lignin (non-wood lignin).
For Alcell lignin the absorption of the band at 1325 cm-1, higher than that at 1267 cm-1,
indicates that this lignin belongs to the guaiacyl-syringyl type (Hoareau et al., 2004). The
existence of small amounts of p-hydroxyphenyl units in wood lignins belonging to GS
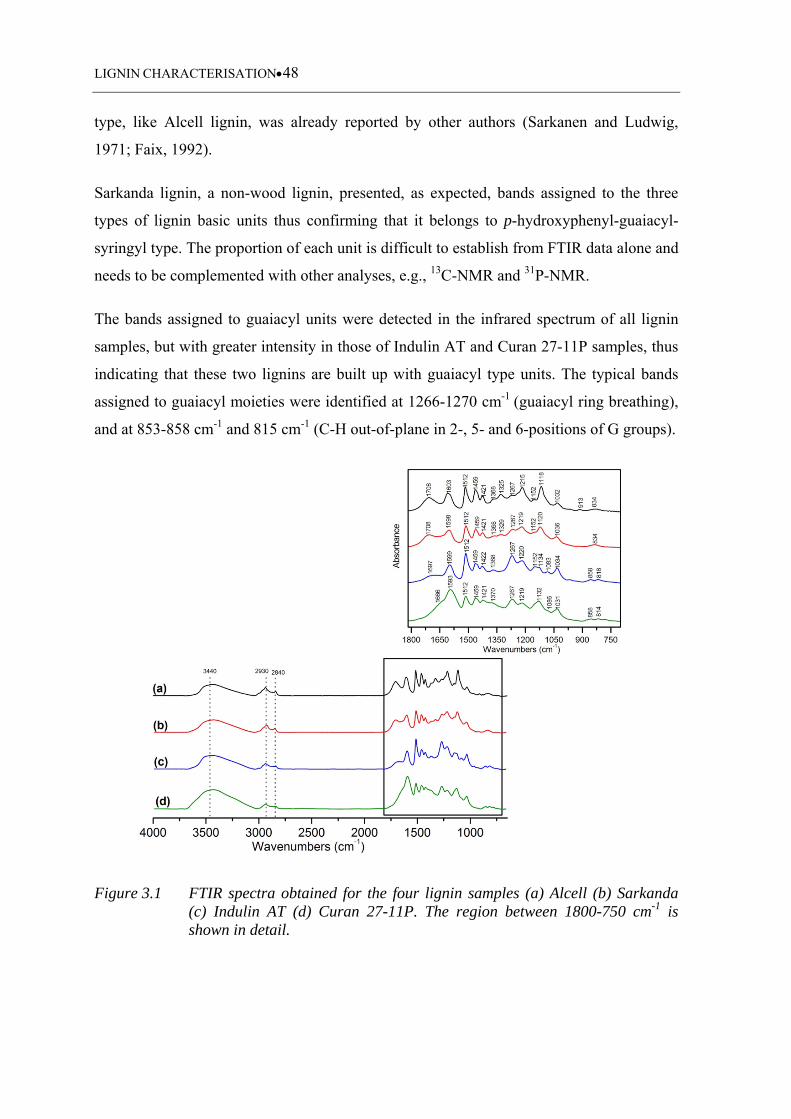
LIGNIN CHARACTERISATION48
type, like Alcell lignin, was already reported by other authors (Sarkanen and Ludwig,
1971; Faix, 1992).
Sarkanda lignin, a non-wood lignin, presented, as expected, bands assigned to the three
types of lignin basic units thus confirming that it belongs to p-hydroxyphenyl-guaiacyl-
syringyl type. The proportion of each unit is difficult to establish from FTIR data alone and
needs to be complemented with other analyses, e.g., 13C-NMR and 31P-NMR.
The bands assigned to guaiacyl units were detected in the infrared spectrum of all lignin
samples, but with greater intensity in those of Indulin AT and Curan 27-11P samples, thus
indicating that these two lignins are built up with guaiacyl type units. The typical bands
assigned to guaiacyl moieties were identified at 1266-1270 cm-1 (guaiacyl ring breathing),
and at 853-858 cm-1 and 815 cm-1 (C-H out-of-plane in 2-, 5- and 6-positions of G groups).
Figure 3.1 FTIR spectra obtained for the four lignin samples (a) Alcell (b) Sarkanda (c) Indulin AT (d) Curan 27-11P. The region between 1800-750 cm-1 is shown in detail.
LIGNIN CHARACTERISATION49
In the Indulin AT and Curan 27-11P spectra, some particular features associated with
lignins from guaiacyl type, as reported by Sarkanen and Ludwig (1971), were assigned.
For Indulin AT and Curan 27-11P, it was observed that the intensity of the band at 1267
cm-1 is greater than that at 1223 cm-1. Also, Indulin AT spectra showed the presence of the
band at 1512 cm-1 with higher intensity comparatively to that at 1599 cm-1. For Curan 27-
11P this feature was not observed, probably due to the interference of the shoulder
assigned to C=O stretch in conjugation with the aromatic ring at approximately 1666 cm-1.
Moreover, for Indulin AT it was also observed that the bands assigned to aromatic C-H
deformations (1140 cm-1 and 1125-1128 cm-1) are concentrated in a single cluster.
Other bands were also common to all lignin samples spectra, like the bands centred at 1459
cm-1 and comprised between 1030-1035 cm-1. These bands are assigned to C-H
deformations and were more intense in softwood lignins. Moreover, the bands assigned at
1221-1230 cm-1 and 1125-1128 cm-1, corresponding to various vibration modes of C-O, C-
H, and C=O bonds, were also detected.
3.3.3.2 NMR analysis
13C-NMR integrations were conducted assuming that the aromatic region (100-160 ppm)
contains six carbon atoms and all other signals were integrated with respect to this value.
The 13C-NMR chemical shifts for each lignin sample are summarised in Table 3.4. The
values from quantitative 13C-NMR spectrum and those from DEPT and APT experiments
(quantification of aromatic carbons) are presented in Table 3.5. The signals were assigned
in accordance with data published by Robert and Chen (1989), Robert (1992), and Xu
(2005).
The signals in the 13C-NMR spectrum of lignin can be divided into three main types: (1)
those corresponding to carbonyl and carboxyl carbons (160 to 200 ppm); (2) those
associated to aromatic carbons, which can be divided further into quaternary (125-160
ppm) and protonated carbons (100-125 ppm); (3) and those assigned to aliphatic carbon
atoms which allow the observation of the main linkages between phenylpropane units (10-
100 ppm). Exception to this classification is the strong signal at 56-57 ppm due to
methoxyl groups in syringyl and guaiacyl units (Robert, 1992; Landucci et al., 1998).
Some of the main linkages between phenylpropane moieties are represented in Figure 3.2.
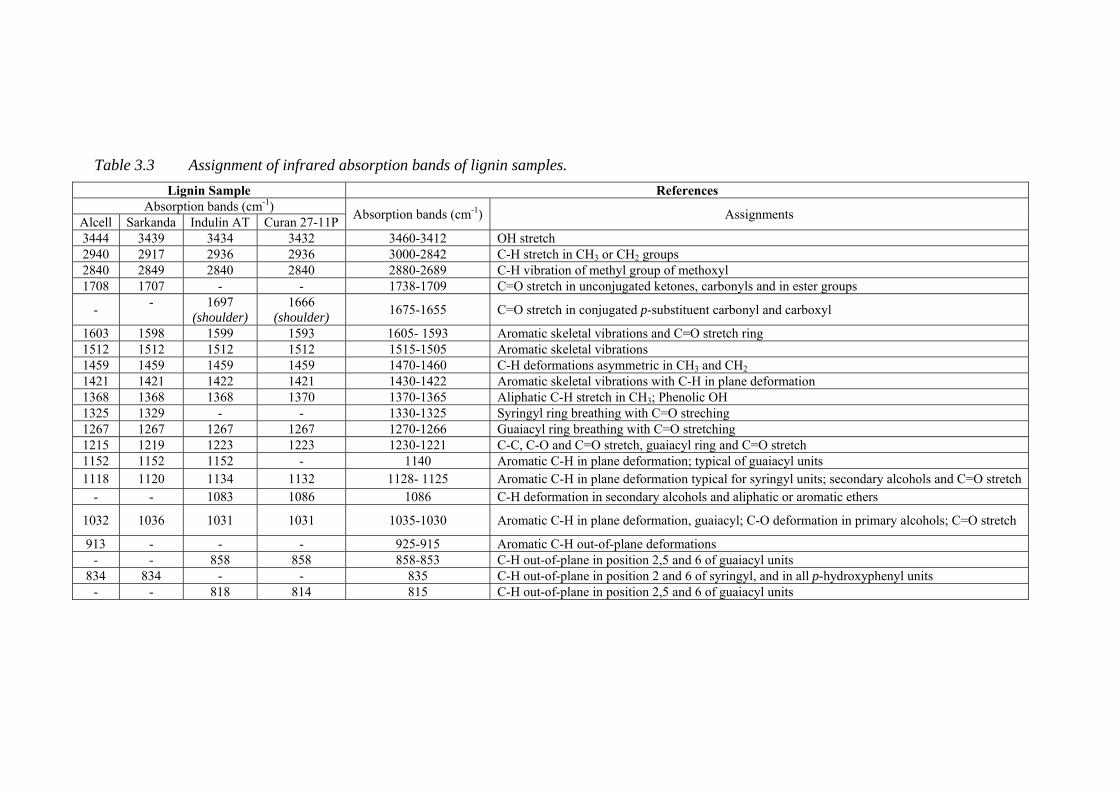
Table 3.3 Assignment of infrared absorption bands of lignin samples.
Lignin Sample References Absorption bands (cm-1)
Absorption bands (cm-1) Assignments Alcell Sarkanda Indulin AT Curan 27-11P 3444 3439 3434 3432 3460-3412 OH stretch 2940 2917 2936 2936 3000-2842 C-H stretch in CH3 or CH2 groups 2840 2849 2840 2840 2880-2689 C-H vibration of methyl group of methoxyl 1708 1707 - - 1738-1709 C=O stretch in unconjugated ketones, carbonyls and in ester groups
- -
1697 (shoulder)
1666 (shoulder)
1675-1655 C=O stretch in conjugated p-substituent carbonyl and carboxyl
1603 1598 1599 1593 1605- 1593 Aromatic skeletal vibrations and C=O stretch ring 1512 1512 1512 1512 1515-1505 Aromatic skeletal vibrations 1459 1459 1459 1459 1470-1460 C-H deformations asymmetric in CH3 and CH2 1421 1421 1422 1421 1430-1422 Aromatic skeletal vibrations with C-H in plane deformation 1368 1368 1368 1370 1370-1365 Aliphatic C-H stretch in CH3; Phenolic OH 1325 1329 - - 1330-1325 Syringyl ring breathing with C=O streching 1267 1267 1267 1267 1270-1266 Guaiacyl ring breathing with C=O stretching 1215 1219 1223 1223 1230-1221 C-C, C-O and C=O stretch, guaiacyl ring and C=O stretch 1152 1152 1152 - 1140 Aromatic C-H in plane deformation; typical of guaiacyl units 1118 1120 1134 1132 1128- 1125 Aromatic C-H in plane deformation typical for syringyl units; secondary alcohols and C=O stretch
- - 1083 1086 1086 C-H deformation in secondary alcohols and aliphatic or aromatic ethers
1032 1036 1031 1031 1035-1030 Aromatic C-H in plane deformation, guaiacyl; C-O deformation in primary alcohols; C=O stretch
913 - - - 925-915 Aromatic C-H out-of-plane deformations - - 858 858 858-853 C-H out-of-plane in position 2,5 and 6 of guaiacyl units
834 834 - - 835 C-H out-of-plane in position 2 and 6 of syringyl, and in all p-hydroxyphenyl units - - 818 814 815 C-H out-of-plane in position 2,5 and 6 of guaiacyl units
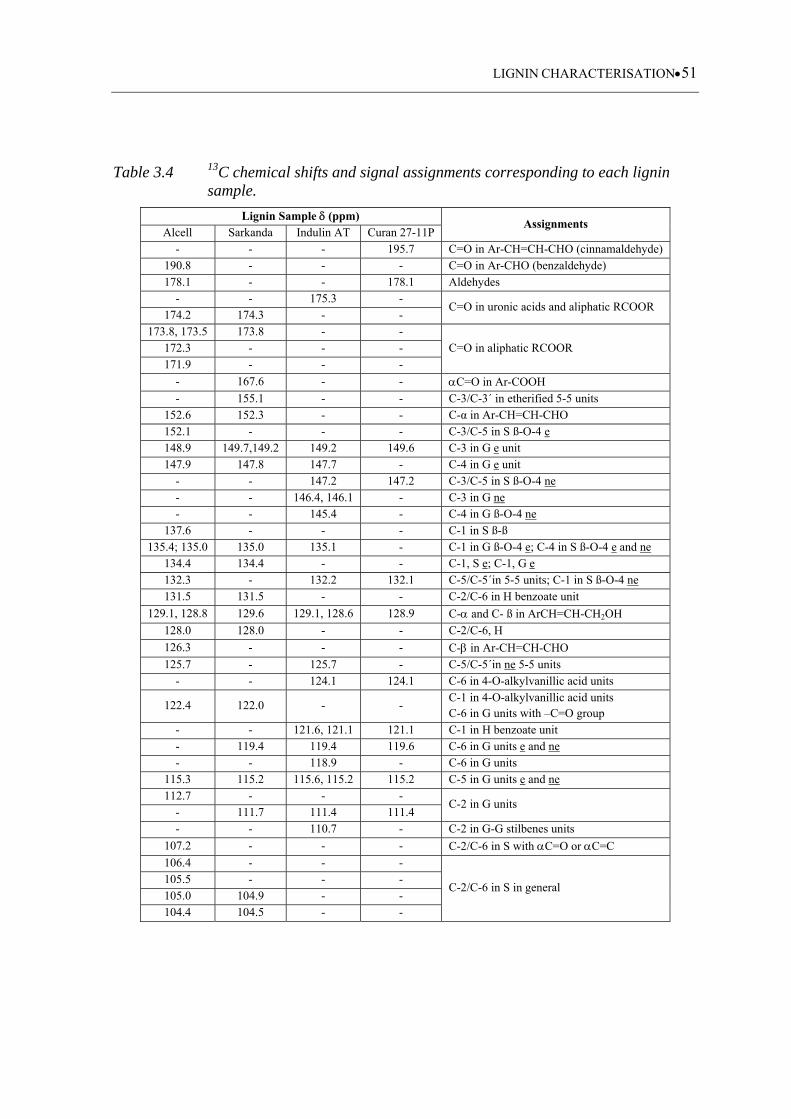
LIGNIN CHARACTERISATION51
Table 3.4 13C chemical shifts and signal assignments corresponding to each lignin sample.
Lignin Sample (ppm) Assignments
Alcell Sarkanda Indulin AT Curan 27-11P - - - 195.7 C=O in Ar-CH=CH-CHO (cinnamaldehyde)
190.8 - - - C=O in Ar-CHO (benzaldehyde) 178.1 - - 178.1 Aldehydes
- - 175.3 - C=O in uronic acids and aliphatic RCOOR
174.2 174.3 - - 173.8, 173.5 173.8 - -
C=O in aliphatic RCOOR 172.3 - - - 171.9 - - -
- 167.6 - - C=O in Ar-COOH
- 155.1 - - C-3/C-3´ in etherified 5-5 units 152.6 152.3 - - C-α in Ar-CH=CH-CHO 152.1 - - - C-3/C-5 in S ß-O-4 e 148.9 149.7,149.2 149.2 149.6 C-3 in G e unit 147.9 147.8 147.7 - C-4 in G e unit
- - 147.2 147.2 C-3/C-5 in S ß-O-4 ne - - 146.4, 146.1 - C-3 in G ne - - 145.4 - C-4 in G ß-O-4 ne
137.6 - - - C-1 in S ß-ß 135.4; 135.0 135.0 135.1 - C-1 in G ß-O-4 e; C-4 in S ß-O-4 e and ne
134.4 134.4 - - C-1, S e; C-1, G e 132.3 - 132.2 132.1 C-5/C-5´in 5-5 units; C-1 in S ß-O-4 ne 131.5 131.5 - - C-2/C-6 in H benzoate unit
129.1, 128.8 129.6 129.1, 128.6 128.9 C- and C- ß in ArCH=CH-CH2OH
128.0 128.0 - - C-2/C-6, H
126.3 - - - C- in Ar-CH=CH-CHO
125.7 - 125.7 - C-5/C-5´in ne 5-5 units - - 124.1 124.1 C-6 in 4-O-alkylvanillic acid units
122.4 122.0 - - C-1 in 4-O-alkylvanillic acid units C-6 in G units with –C=O group
- - 121.6, 121.1 121.1 C-1 in H benzoate unit - 119.4 119.4 119.6 C-6 in G units e and ne - - 118.9 - C-6 in G units
115.3 115.2 115.6, 115.2 115.2 C-5 in G units e and ne 112.7 - - -
C-2 in G units - 111.7 111.4 111.4 - - 110.7 - C-2 in G-G stilbenes units
107.2 - - - C-2/C-6 in S with C=O or C=C
106.4 - - -
C-2/C-6 in S in general 105.5 - - - 105.0 104.9 - - 104.4 104.5 - -
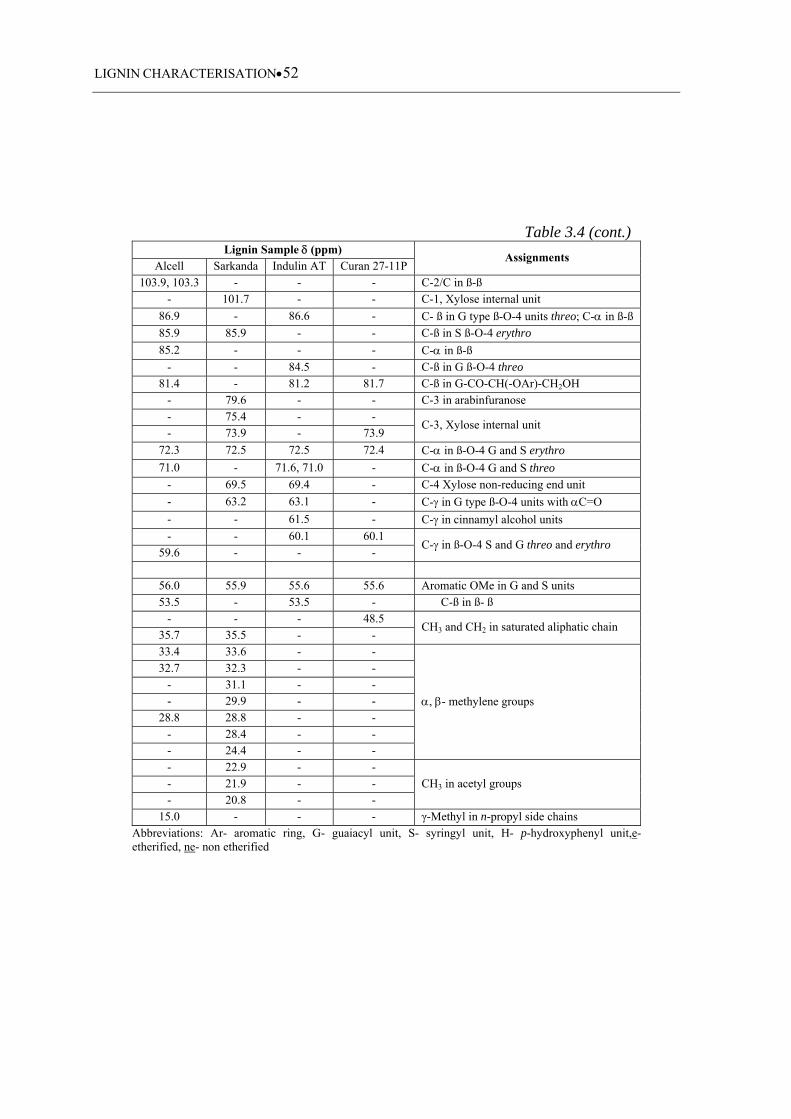
LIGNIN CHARACTERISATION52
Table 3.4 (cont.) Lignin Sample (ppm)
Assignments Alcell Sarkanda Indulin AT Curan 27-11P
103.9, 103.3 - - - C-2/C in ß-ß - 101.7 - - C-1, Xylose internal unit
86.9 - 86.6 - C- ß in G type ß-O-4 units threo; C- in ß-ß
85.9 85.9 - - C-ß in S ß-O-4 erythro
85.2 - - - C- in ß-ß
- - 84.5 - C-ß in G ß-O-4 threo 81.4 - 81.2 81.7 C-ß in G-CO-CH(-OAr)-CH2OH
- 79.6 - - C-3 in arabinfuranose - 75.4 - -
C-3, Xylose internal unit - 73.9 - 73.9
72.3 72.5 72.5 72.4 C- in ß-O-4 G and S erythro
71.0 - 71.6, 71.0 - C- in ß-O-4 G and S threo
- 69.5 69.4 - C-4 Xylose non-reducing end unit
- 63.2 63.1 - C- in G type ß-O-4 units with C=O
- - 61.5 - C- in cinnamyl alcohol units
- - 60.1 60.1 C- in ß-O-4 S and G threo and erythro
59.6 - - -
56.0 55.9 55.6 55.6 Aromatic OMe in G and S units 53.5 - 53.5 - C-ß in ß- ß
- - - 48.5 CH3 and CH2 in saturated aliphatic chain
35.7 35.5 - - 33.4 33.6 - -
, - methylene groups
32.7 32.3 - - - 31.1 - - - 29.9 - -
28.8 28.8 - - - 28.4 - - - 24.4 - - - 22.9 - -
CH3 in acetyl groups - 21.9 - - - 20.8 - -
15.0 - - - γ-Methyl in n-propyl side chains Abbreviations: Ar- aromatic ring, G- guaiacyl unit, S- syringyl unit, H- p-hydroxyphenyl unit,e- etherified, ne- non etherified
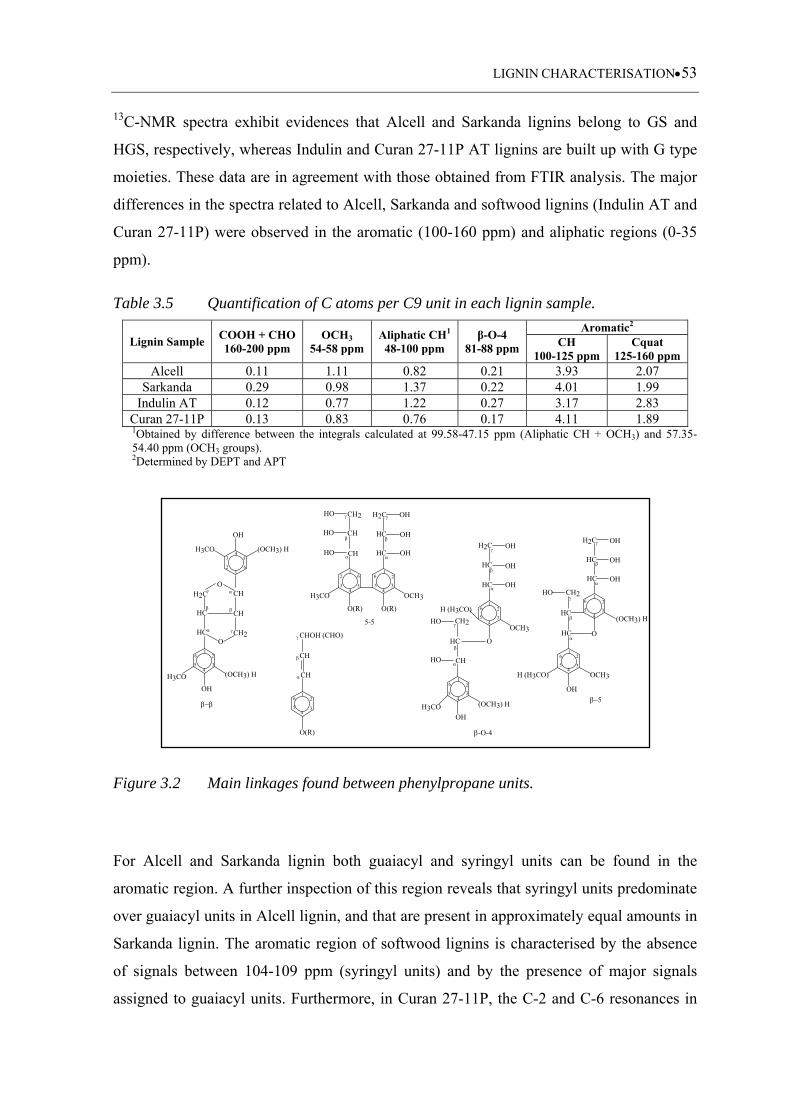
LIGNIN CHARACTERISATION53
13C-NMR spectra exhibit evidences that Alcell and Sarkanda lignins belong to GS and
HGS, respectively, whereas Indulin and Curan 27-11P AT lignins are built up with G type
moieties. These data are in agreement with those obtained from FTIR analysis. The major
differences in the spectra related to Alcell, Sarkanda and softwood lignins (Indulin AT and
Curan 27-11P) were observed in the aromatic (100-160 ppm) and aliphatic regions (0-35
ppm).
Table 3.5 Quantification of C atoms per C9 unit in each lignin sample.
Lignin Sample COOH + CHO 160-200 ppm
OCH3
54-58 ppm Aliphatic CH1 48-100 ppm
β-O-4 81-88 ppm
Aromatic2 CH
100-125 ppm Cquat
125-160 ppm Alcell 0.11 1.11 0.82 0.21 3.93 2.07
Sarkanda 0.29 0.98 1.37 0.22 4.01 1.99 Indulin AT 0.12 0.77 1.22 0.27 3.17 2.83
Curan 27-11P 0.13 0.83 0.76 0.17 4.11 1.89 1Obtained by difference between the integrals calculated at 99.58-47.15 ppm (Aliphatic CH + OCH3) and 57.35-54.40 ppm (OCH3 groups). 2Determined by DEPT and APT
Figure 3.2 Main linkages found between phenylpropane units.
For Alcell and Sarkanda lignin both guaiacyl and syringyl units can be found in the
aromatic region. A further inspection of this region reveals that syringyl units predominate
over guaiacyl units in Alcell lignin, and that are present in approximately equal amounts in
Sarkanda lignin. The aromatic region of softwood lignins is characterised by the absence
of signals between 104-109 ppm (syringyl units) and by the presence of major signals
assigned to guaiacyl units. Furthermore, in Curan 27-11P, the C-2 and C-6 resonances in
H3CO
OH
O(R)
OH
OH
O(R)
OCH3
CH
CH
HO
HO
HO
CH2
HC
HC
H2C
12
34
5
6
5
6
3
2
4
1
5-5HC
H2CO
CH
CH
CH2HCO
OH
(OCH3) HH3CO
OH
(OCH3) H
1
12
2
3
3
4
45
5
6
6
H3CO
HC OH
HC
H2C OH
(OCH3) H
OH
O
HO CH2
HO CH
OCH3
HC OH
12
34
5
6
-O-4
12
34
5
6
H (H3CO)
H3CO
OH
OCH3
HC O
HC
CH2HO
(OCH3) H
HC
HC
H2C OH
OH
OH
12
34
5
6
12
34
5
6
H (H3CO)CH
CH
O(R)
CHOH (CHO)
12
34
5
6
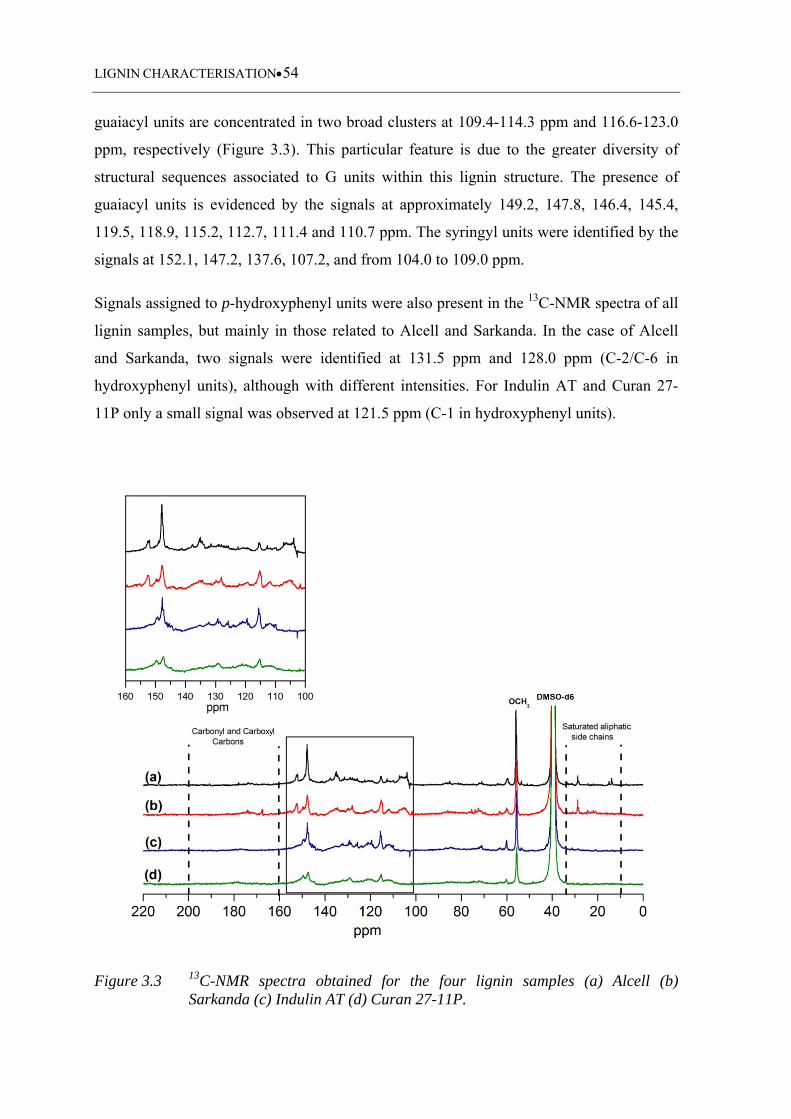
LIGNIN CHARACTERISATION54
guaiacyl units are concentrated in two broad clusters at 109.4-114.3 ppm and 116.6-123.0
ppm, respectively (Figure 3.3). This particular feature is due to the greater diversity of
structural sequences associated to G units within this lignin structure. The presence of
guaiacyl units is evidenced by the signals at approximately 149.2, 147.8, 146.4, 145.4,
119.5, 118.9, 115.2, 112.7, 111.4 and 110.7 ppm. The syringyl units were identified by the
signals at 152.1, 147.2, 137.6, 107.2, and from 104.0 to 109.0 ppm.
Signals assigned to p-hydroxyphenyl units were also present in the 13C-NMR spectra of all
lignin samples, but mainly in those related to Alcell and Sarkanda. In the case of Alcell
and Sarkanda, two signals were identified at 131.5 ppm and 128.0 ppm (C-2/C-6 in
hydroxyphenyl units), although with different intensities. For Indulin AT and Curan 27-
11P only a small signal was observed at 121.5 ppm (C-1 in hydroxyphenyl units).
Figure 3.3 13C-NMR spectra obtained for the four lignin samples (a) Alcell (b) Sarkanda (c) Indulin AT (d) Curan 27-11P.
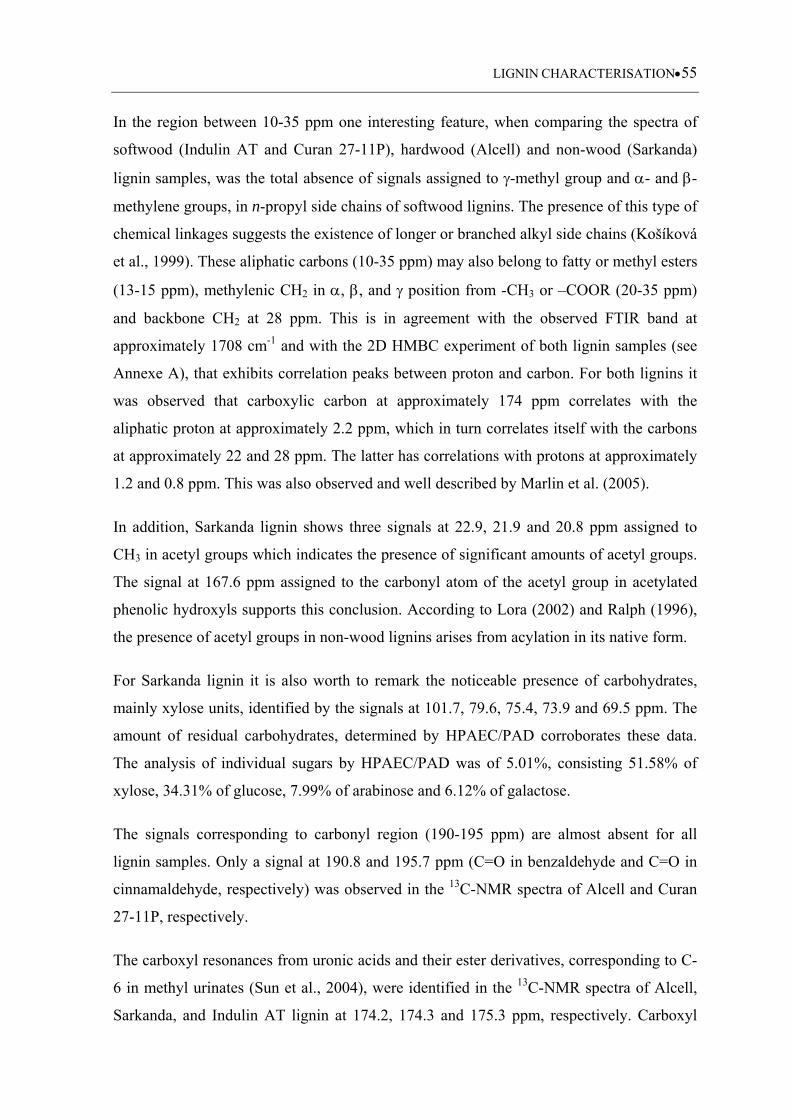
LIGNIN CHARACTERISATION55
In the region between 10-35 ppm one interesting feature, when comparing the spectra of
softwood (Indulin AT and Curan 27-11P), hardwood (Alcell) and non-wood (Sarkanda)
lignin samples, was the total absence of signals assigned to -methyl group and - and -
methylene groups, in n-propyl side chains of softwood lignins. The presence of this type of
chemical linkages suggests the existence of longer or branched alkyl side chains (Košíková
et al., 1999). These aliphatic carbons (10-35 ppm) may also belong to fatty or methyl esters
(13-15 ppm), methylenic CH2 in , , and position from -CH3 or –COOR (20-35 ppm)
and backbone CH2 at 28 ppm. This is in agreement with the observed FTIR band at
approximately 1708 cm-1 and with the 2D HMBC experiment of both lignin samples (see
Annexe A), that exhibits correlation peaks between proton and carbon. For both lignins it
was observed that carboxylic carbon at approximately 174 ppm correlates with the
aliphatic proton at approximately 2.2 ppm, which in turn correlates itself with the carbons
at approximately 22 and 28 ppm. The latter has correlations with protons at approximately
1.2 and 0.8 ppm. This was also observed and well described by Marlin et al. (2005).
In addition, Sarkanda lignin shows three signals at 22.9, 21.9 and 20.8 ppm assigned to
CH3 in acetyl groups which indicates the presence of significant amounts of acetyl groups.
The signal at 167.6 ppm assigned to the carbonyl atom of the acetyl group in acetylated
phenolic hydroxyls supports this conclusion. According to Lora (2002) and Ralph (1996),
the presence of acetyl groups in non-wood lignins arises from acylation in its native form.
For Sarkanda lignin it is also worth to remark the noticeable presence of carbohydrates,
mainly xylose units, identified by the signals at 101.7, 79.6, 75.4, 73.9 and 69.5 ppm. The
amount of residual carbohydrates, determined by HPAEC/PAD corroborates these data.
The analysis of individual sugars by HPAEC/PAD was of 5.01%, consisting 51.58% of
xylose, 34.31% of glucose, 7.99% of arabinose and 6.12% of galactose.
The signals corresponding to carbonyl region (190-195 ppm) are almost absent for all
lignin samples. Only a signal at 190.8 and 195.7 ppm (C=O in benzaldehyde and C=O in
cinnamaldehyde, respectively) was observed in the 13C-NMR spectra of Alcell and Curan
27-11P, respectively.
The carboxyl resonances from uronic acids and their ester derivatives, corresponding to C-
6 in methyl urinates (Sun et al., 2004), were identified in the 13C-NMR spectra of Alcell,
Sarkanda, and Indulin AT lignin at 174.2, 174.3 and 175.3 ppm, respectively. Carboxyl
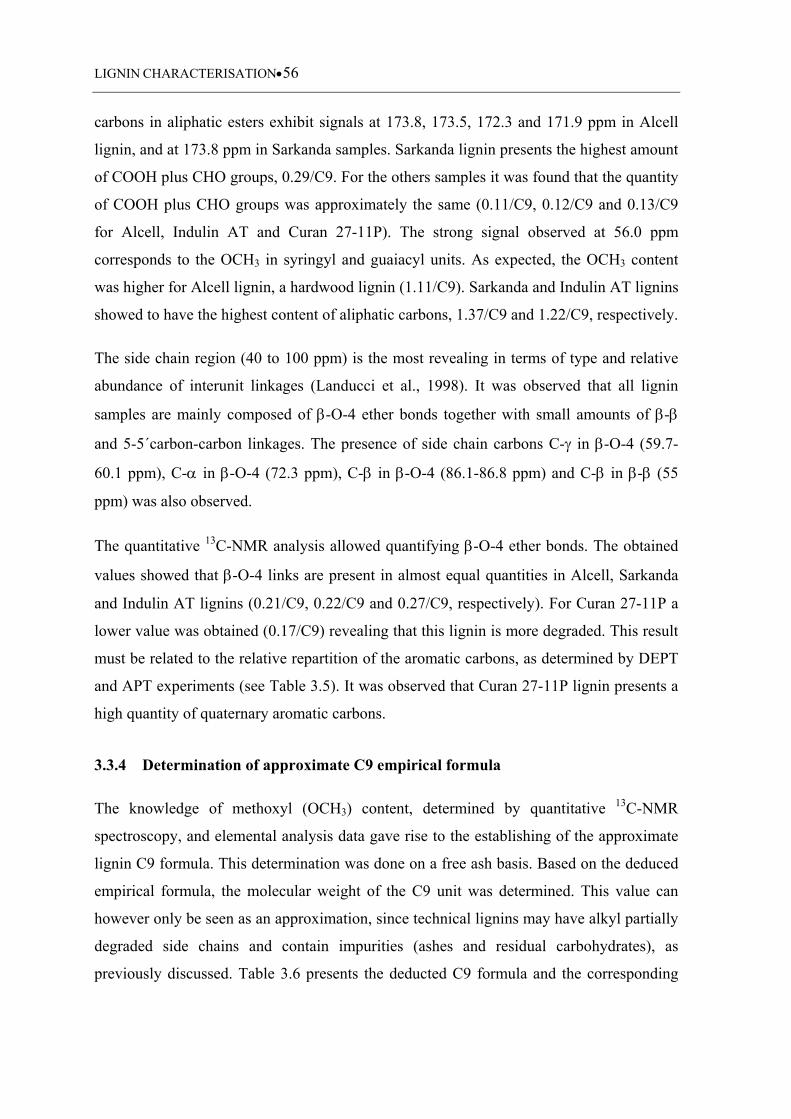
LIGNIN CHARACTERISATION56
carbons in aliphatic esters exhibit signals at 173.8, 173.5, 172.3 and 171.9 ppm in Alcell
lignin, and at 173.8 ppm in Sarkanda samples. Sarkanda lignin presents the highest amount
of COOH plus CHO groups, 0.29/C9. For the others samples it was found that the quantity
of COOH plus CHO groups was approximately the same (0.11/C9, 0.12/C9 and 0.13/C9
for Alcell, Indulin AT and Curan 27-11P). The strong signal observed at 56.0 ppm
corresponds to the OCH3 in syringyl and guaiacyl units. As expected, the OCH3 content
was higher for Alcell lignin, a hardwood lignin (1.11/C9). Sarkanda and Indulin AT lignins
showed to have the highest content of aliphatic carbons, 1.37/C9 and 1.22/C9, respectively.
The side chain region (40 to 100 ppm) is the most revealing in terms of type and relative
abundance of interunit linkages (Landucci et al., 1998). It was observed that all lignin
samples are mainly composed of -O-4 ether bonds together with small amounts of -
and 5-5´carbon-carbon linkages. The presence of side chain carbons C- in -O-4 (59.7-
60.1 ppm), C- in -O-4 (72.3 ppm), C- in -O-4 (86.1-86.8 ppm) and C- in - (55
ppm) was also observed.
The quantitative 13C-NMR analysis allowed quantifying -O-4 ether bonds. The obtained
values showed that -O-4 links are present in almost equal quantities in Alcell, Sarkanda
and Indulin AT lignins (0.21/C9, 0.22/C9 and 0.27/C9, respectively). For Curan 27-11P a
lower value was obtained (0.17/C9) revealing that this lignin is more degraded. This result
must be related to the relative repartition of the aromatic carbons, as determined by DEPT
and APT experiments (see Table 3.5). It was observed that Curan 27-11P lignin presents a
high quantity of quaternary aromatic carbons.
3.3.4 Determination of approximate C9 empirical formula
The knowledge of methoxyl (OCH3) content, determined by quantitative 13C-NMR
spectroscopy, and elemental analysis data gave rise to the establishing of the approximate
lignin C9 formula. This determination was done on a free ash basis. Based on the deduced
empirical formula, the molecular weight of the C9 unit was determined. This value can
however only be seen as an approximation, since technical lignins may have alkyl partially
degraded side chains and contain impurities (ashes and residual carbohydrates), as
previously discussed. Table 3.6 presents the deducted C9 formula and the corresponding
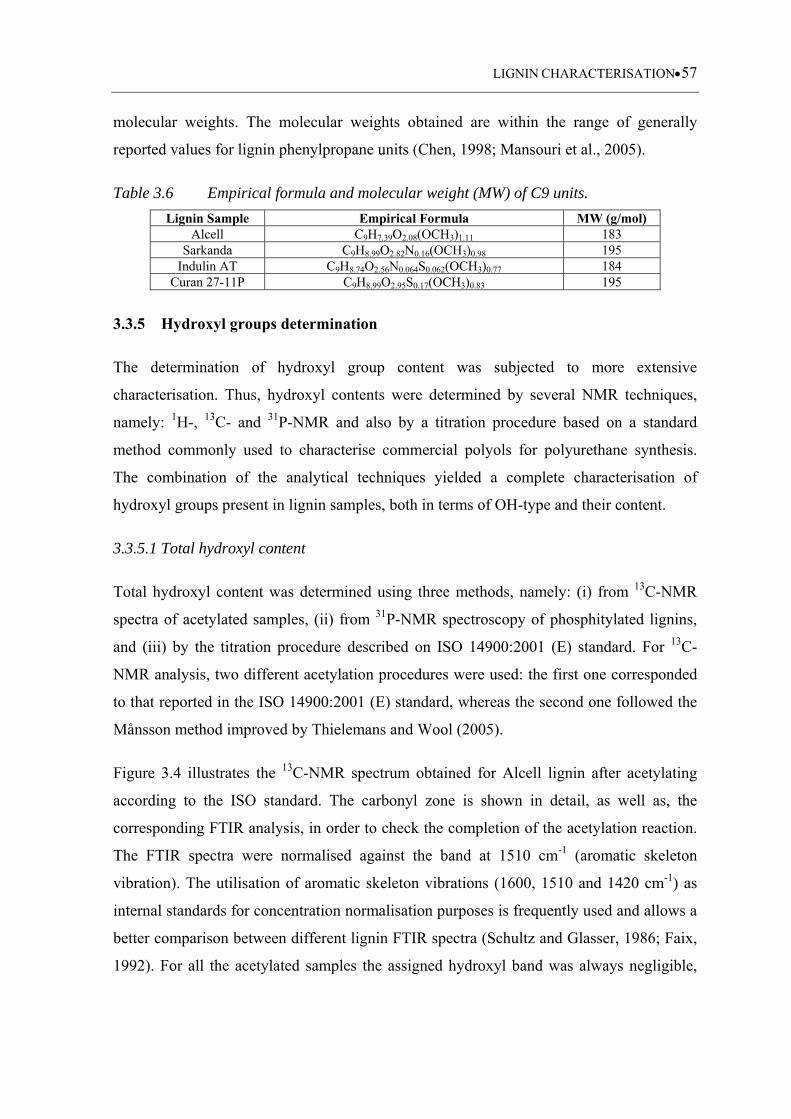
LIGNIN CHARACTERISATION57
molecular weights. The molecular weights obtained are within the range of generally
reported values for lignin phenylpropane units (Chen, 1998; Mansouri et al., 2005).
Table 3.6 Empirical formula and molecular weight (MW) of C9 units.
Lignin Sample Empirical Formula MW (g/mol) Alcell C9H7.39O2.08(OCH3)1.11 183
Sarkanda C9H8.99O2.82N0.16(OCH3)0.98 195 Indulin AT C9H8.74O2.56N0.064S0.062(OCH3)0.77 184
Curan 27-11P C9H8.99O2.95S0.17(OCH3)0.83 195
3.3.5 Hydroxyl groups determination
The determination of hydroxyl group content was subjected to more extensive
characterisation. Thus, hydroxyl contents were determined by several NMR techniques,
namely: 1H-, 13C- and 31P-NMR and also by a titration procedure based on a standard
method commonly used to characterise commercial polyols for polyurethane synthesis.
The combination of the analytical techniques yielded a complete characterisation of
hydroxyl groups present in lignin samples, both in terms of OH-type and their content.
3.3.5.1 Total hydroxyl content
Total hydroxyl content was determined using three methods, namely: (i) from 13C-NMR
spectra of acetylated samples, (ii) from 31P-NMR spectroscopy of phosphitylated lignins,
and (iii) by the titration procedure described on ISO 14900:2001 (E) standard. For 13C-
NMR analysis, two different acetylation procedures were used: the first one corresponded
to that reported in the ISO 14900:2001 (E) standard, whereas the second one followed the
Månsson method improved by Thielemans and Wool (2005).
Figure 3.4 illustrates the 13C-NMR spectrum obtained for Alcell lignin after acetylating
according to the ISO standard. The carbonyl zone is shown in detail, as well as, the
corresponding FTIR analysis, in order to check the completion of the acetylation reaction.
The FTIR spectra were normalised against the band at 1510 cm-1 (aromatic skeleton
vibration). The utilisation of aromatic skeleton vibrations (1600, 1510 and 1420 cm-1) as
internal standards for concentration normalisation purposes is frequently used and allows a
better comparison between different lignin FTIR spectra (Schultz and Glasser, 1986; Faix,
1992). For all the acetylated samples the assigned hydroxyl band was always negligible,
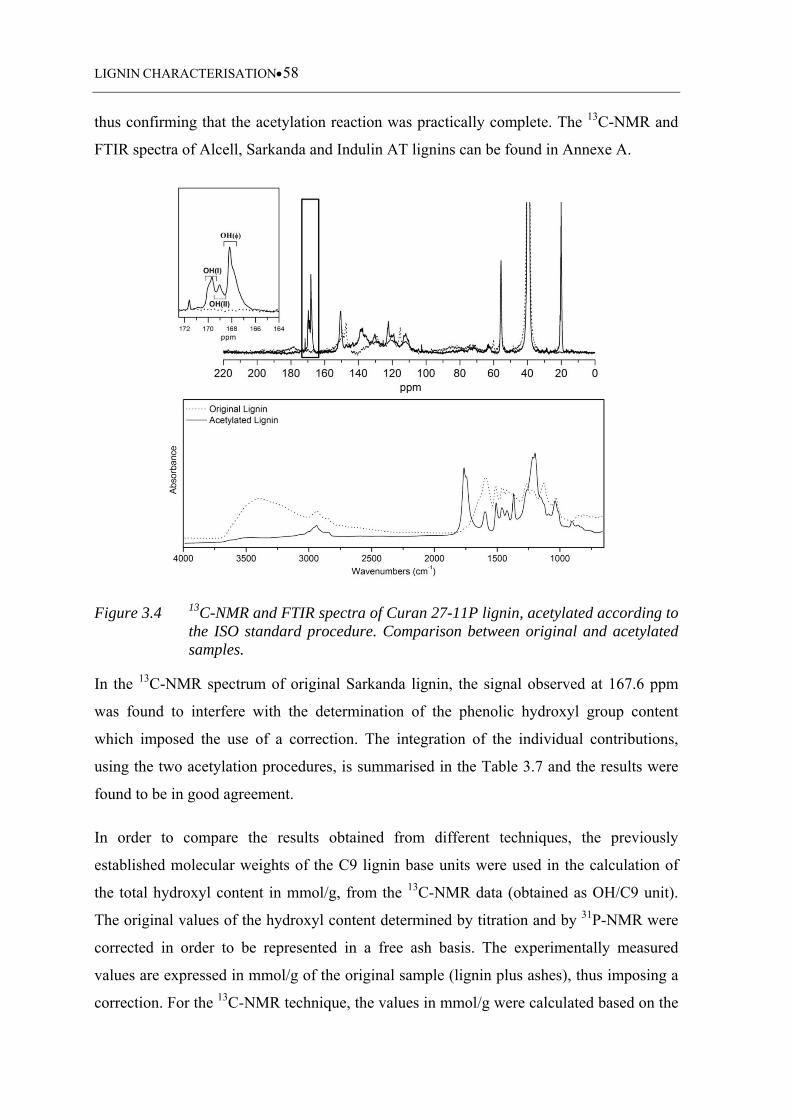
LIGNIN CHARACTERISATION58
thus confirming that the acetylation reaction was practically complete. The 13C-NMR and
FTIR spectra of Alcell, Sarkanda and Indulin AT lignins can be found in Annexe A.
Figure 3.4 13C-NMR and FTIR spectra of Curan 27-11P lignin, acetylated according to the ISO standard procedure. Comparison between original and acetylated samples.
In the 13C-NMR spectrum of original Sarkanda lignin, the signal observed at 167.6 ppm
was found to interfere with the determination of the phenolic hydroxyl group content
which imposed the use of a correction. The integration of the individual contributions,
using the two acetylation procedures, is summarised in the Table 3.7 and the results were
found to be in good agreement.
In order to compare the results obtained from different techniques, the previously
established molecular weights of the C9 lignin base units were used in the calculation of
the total hydroxyl content in mmol/g, from the 13C-NMR data (obtained as OH/C9 unit).
The original values of the hydroxyl content determined by titration and by 31P-NMR were
corrected in order to be represented in a free ash basis. The experimentally measured
values are expressed in mmol/g of the original sample (lignin plus ashes), thus imposing a
correction. For the 13C-NMR technique, the values in mmol/g were calculated based on the
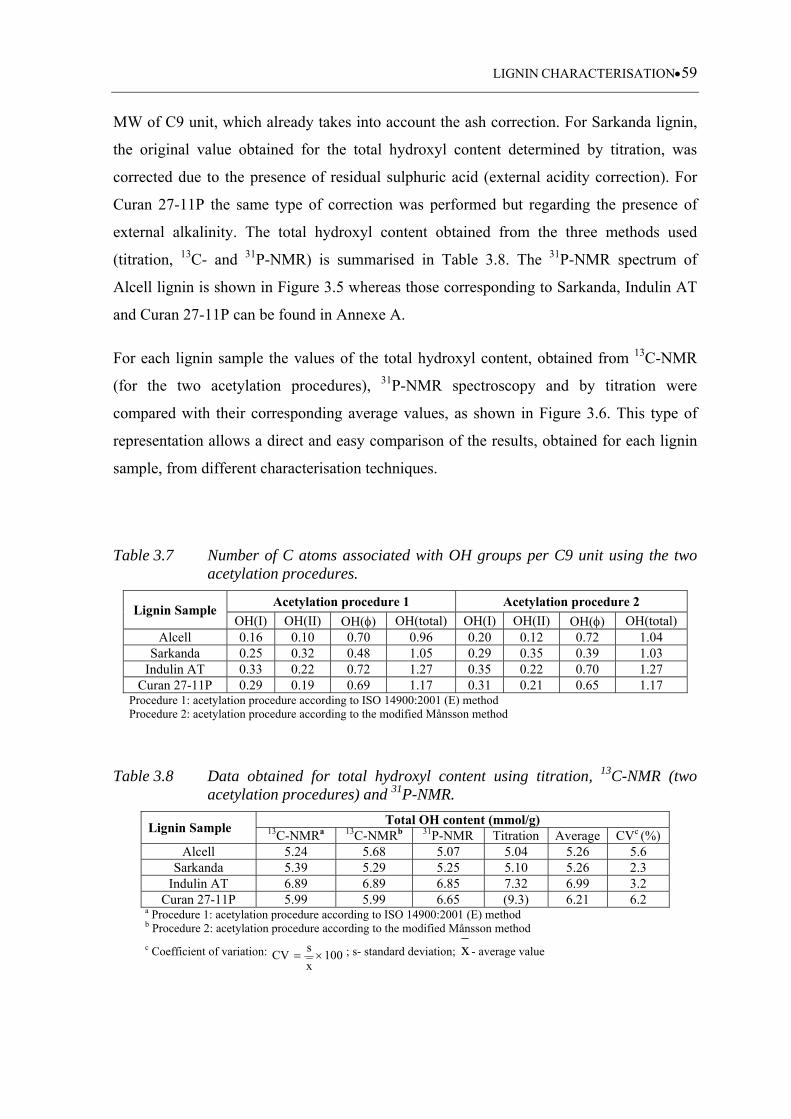
LIGNIN CHARACTERISATION59
MW of C9 unit, which already takes into account the ash correction. For Sarkanda lignin,
the original value obtained for the total hydroxyl content determined by titration, was
corrected due to the presence of residual sulphuric acid (external acidity correction). For
Curan 27-11P the same type of correction was performed but regarding the presence of
external alkalinity. The total hydroxyl content obtained from the three methods used
(titration, 13C- and 31P-NMR) is summarised in Table 3.8. The 31P-NMR spectrum of
Alcell lignin is shown in Figure 3.5 whereas those corresponding to Sarkanda, Indulin AT
and Curan 27-11P can be found in Annexe A.
For each lignin sample the values of the total hydroxyl content, obtained from 13C-NMR
(for the two acetylation procedures), 31P-NMR spectroscopy and by titration were
compared with their corresponding average values, as shown in Figure 3.6. This type of
representation allows a direct and easy comparison of the results, obtained for each lignin
sample, from different characterisation techniques.
Table 3.7 Number of C atoms associated with OH groups per C9 unit using the two acetylation procedures.
Lignin Sample Acetylation procedure 1 Acetylation procedure 2
OH(I) OH(II) OH() OH(total) OH(I) OH(II) OH() OH(total) Alcell 0.16 0.10 0.70 0.96 0.20 0.12 0.72 1.04
Sarkanda 0.25 0.32 0.48 1.05 0.29 0.35 0.39 1.03 Indulin AT 0.33 0.22 0.72 1.27 0.35 0.22 0.70 1.27
Curan 27-11P 0.29 0.19 0.69 1.17 0.31 0.21 0.65 1.17 Procedure 1: acetylation procedure according to ISO 14900:2001 (E) method Procedure 2: acetylation procedure according to the modified Månsson method
Table 3.8 Data obtained for total hydroxyl content using titration, 13C-NMR (two acetylation procedures) and 31P-NMR.
Lignin Sample Total OH content (mmol/g)
13C-NMRa 13C-NMRb 31P-NMR Titration Average CVc (%)Alcell 5.24 5.68 5.07 5.04 5.26 5.6
Sarkanda 5.39 5.29 5.25 5.10 5.26 2.3 Indulin AT 6.89 6.89 6.85 7.32 6.99 3.2
Curan 27-11P 5.99 5.99 6.65 (9.3) 6.21 6.2 a Procedure 1: acetylation procedure according to ISO 14900:2001 (E) method b Procedure 2: acetylation procedure according to the modified Månsson method
c Coefficient of variation: 100x
sCV ; s- standard deviation; x - average value
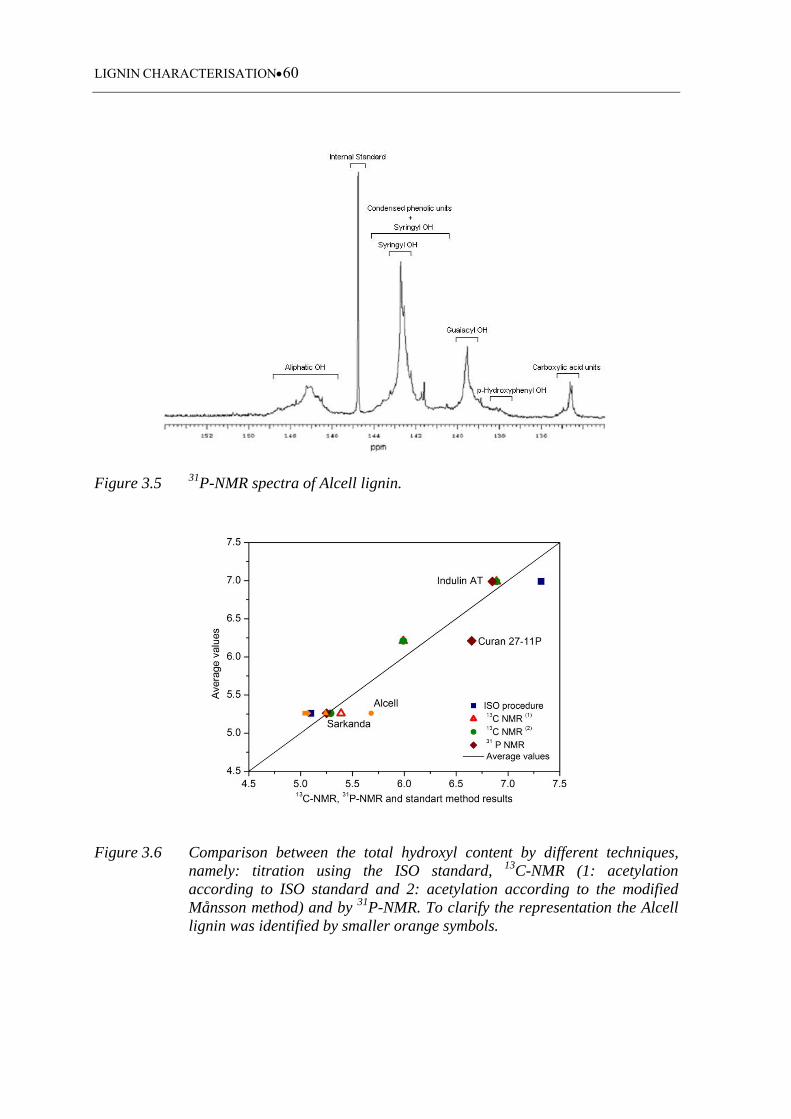
LIGNIN CHARACTERISATION60
Figure 3.5 31P-NMR spectra of Alcell lignin.
Figure 3.6 Comparison between the total hydroxyl content by different techniques, namely: titration using the ISO standard, 13C-NMR (1: acetylation according to ISO standard and 2: acetylation according to the modified Månsson method) and by 31P-NMR. To clarify the representation the Alcell lignin was identified by smaller orange symbols.
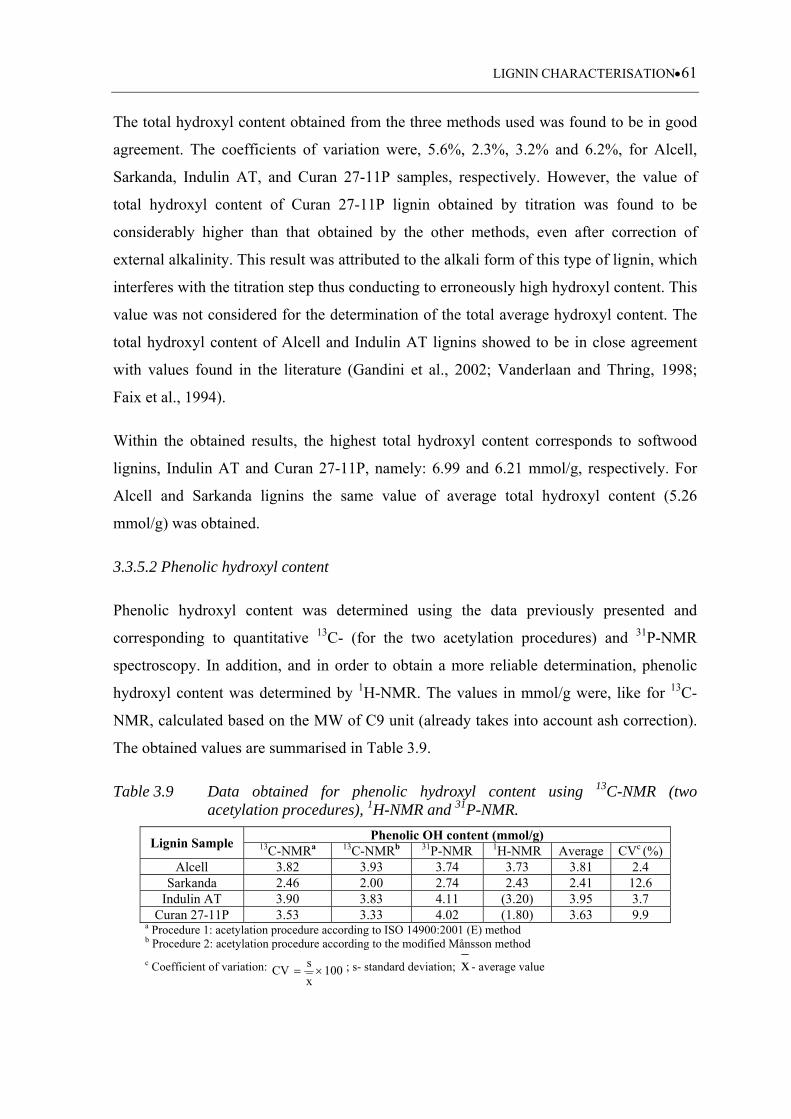
LIGNIN CHARACTERISATION61
The total hydroxyl content obtained from the three methods used was found to be in good
agreement. The coefficients of variation were, 5.6%, 2.3%, 3.2% and 6.2%, for Alcell,
Sarkanda, Indulin AT, and Curan 27-11P samples, respectively. However, the value of
total hydroxyl content of Curan 27-11P lignin obtained by titration was found to be
considerably higher than that obtained by the other methods, even after correction of
external alkalinity. This result was attributed to the alkali form of this type of lignin, which
interferes with the titration step thus conducting to erroneously high hydroxyl content. This
value was not considered for the determination of the total average hydroxyl content. The
total hydroxyl content of Alcell and Indulin AT lignins showed to be in close agreement
with values found in the literature (Gandini et al., 2002; Vanderlaan and Thring, 1998;
Faix et al., 1994).
Within the obtained results, the highest total hydroxyl content corresponds to softwood
lignins, Indulin AT and Curan 27-11P, namely: 6.99 and 6.21 mmol/g, respectively. For
Alcell and Sarkanda lignins the same value of average total hydroxyl content (5.26
mmol/g) was obtained.
3.3.5.2 Phenolic hydroxyl content
Phenolic hydroxyl content was determined using the data previously presented and
corresponding to quantitative 13C- (for the two acetylation procedures) and 31P-NMR
spectroscopy. In addition, and in order to obtain a more reliable determination, phenolic
hydroxyl content was determined by 1H-NMR. The values in mmol/g were, like for 13C-
NMR, calculated based on the MW of C9 unit (already takes into account ash correction).
The obtained values are summarised in Table 3.9.
Table 3.9 Data obtained for phenolic hydroxyl content using 13C-NMR (two acetylation procedures), 1H-NMR and 31P-NMR.
Lignin Sample Phenolic OH content (mmol/g)
13C-NMRa 13C-NMRb 31P-NMR 1H-NMR Average CVc (%)Alcell 3.82 3.93 3.74 3.73 3.81 2.4
Sarkanda 2.46 2.00 2.74 2.43 2.41 12.6 Indulin AT 3.90 3.83 4.11 (3.20) 3.95 3.7
Curan 27-11P 3.53 3.33 4.02 (1.80) 3.63 9.9 a Procedure 1: acetylation procedure according to ISO 14900:2001 (E) method b Procedure 2: acetylation procedure according to the modified Månsson method
c Coefficient of variation: 100x
sCV ; s- standard deviation; x - average value
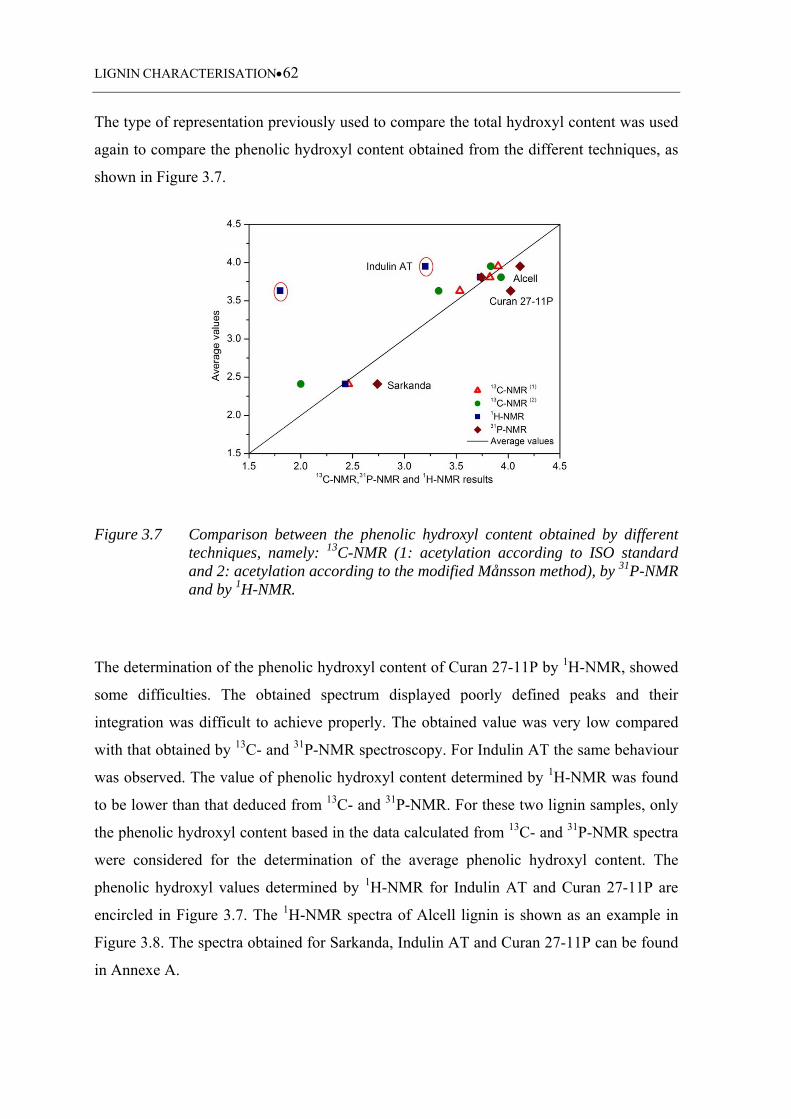
LIGNIN CHARACTERISATION62
The type of representation previously used to compare the total hydroxyl content was used
again to compare the phenolic hydroxyl content obtained from the different techniques, as
shown in Figure 3.7.
Figure 3.7 Comparison between the phenolic hydroxyl content obtained by different techniques, namely: 13C-NMR (1: acetylation according to ISO standard and 2: acetylation according to the modified Månsson method), by 31P-NMR and by 1H-NMR.
The determination of the phenolic hydroxyl content of Curan 27-11P by 1H-NMR, showed
some difficulties. The obtained spectrum displayed poorly defined peaks and their
integration was difficult to achieve properly. The obtained value was very low compared
with that obtained by 13C- and 31P-NMR spectroscopy. For Indulin AT the same behaviour
was observed. The value of phenolic hydroxyl content determined by 1H-NMR was found
to be lower than that deduced from 13C- and 31P-NMR. For these two lignin samples, only
the phenolic hydroxyl content based in the data calculated from 13C- and 31P-NMR spectra
were considered for the determination of the average phenolic hydroxyl content. The
phenolic hydroxyl values determined by 1H-NMR for Indulin AT and Curan 27-11P are
encircled in Figure 3.7. The 1H-NMR spectra of Alcell lignin is shown as an example in
Figure 3.8. The spectra obtained for Sarkanda, Indulin AT and Curan 27-11P can be found
in Annexe A.
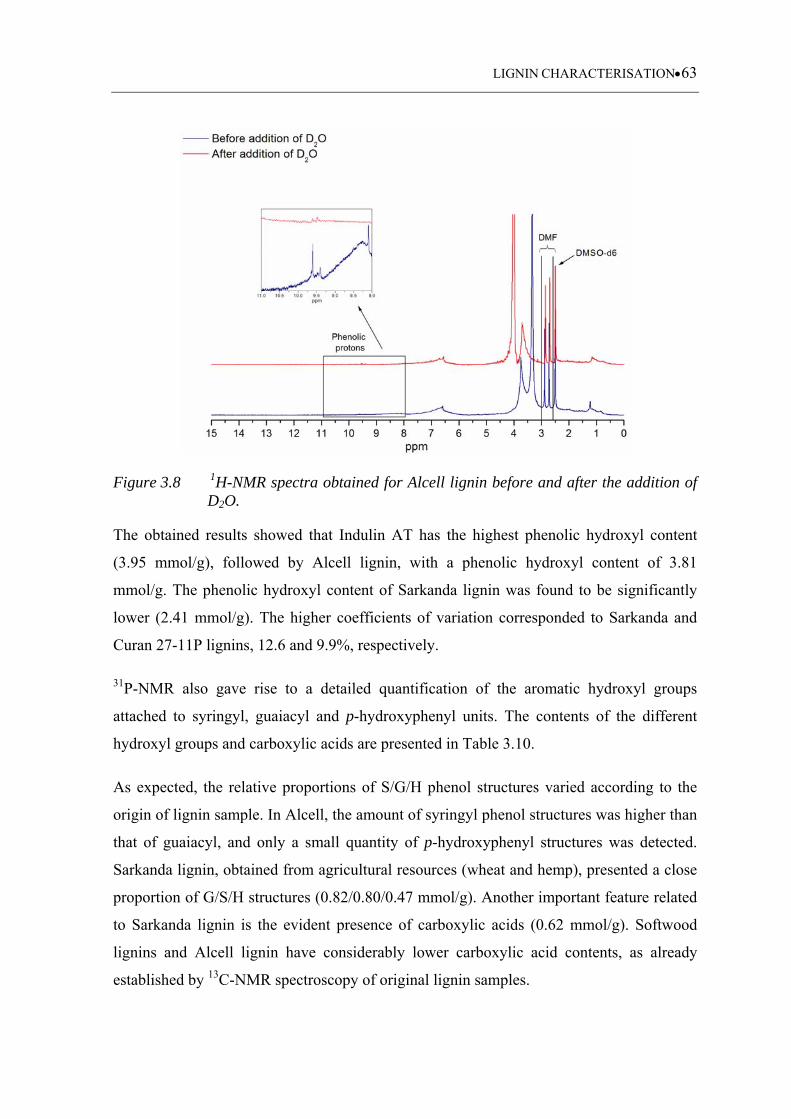
LIGNIN CHARACTERISATION63
Figure 3.8 1H-NMR spectra obtained for Alcell lignin before and after the addition of D2O.
The obtained results showed that Indulin AT has the highest phenolic hydroxyl content
(3.95 mmol/g), followed by Alcell lignin, with a phenolic hydroxyl content of 3.81
mmol/g. The phenolic hydroxyl content of Sarkanda lignin was found to be significantly
lower (2.41 mmol/g). The higher coefficients of variation corresponded to Sarkanda and
Curan 27-11P lignins, 12.6 and 9.9%, respectively.
31P-NMR also gave rise to a detailed quantification of the aromatic hydroxyl groups
attached to syringyl, guaiacyl and p-hydroxyphenyl units. The contents of the different
hydroxyl groups and carboxylic acids are presented in Table 3.10.
As expected, the relative proportions of S/G/H phenol structures varied according to the
origin of lignin sample. In Alcell, the amount of syringyl phenol structures was higher than
that of guaiacyl, and only a small quantity of p-hydroxyphenyl structures was detected.
Sarkanda lignin, obtained from agricultural resources (wheat and hemp), presented a close
proportion of G/S/H structures (0.82/0.80/0.47 mmol/g). Another important feature related
to Sarkanda lignin is the evident presence of carboxylic acids (0.62 mmol/g). Softwood
lignins and Alcell lignin have considerably lower carboxylic acid contents, as already
established by 13C-NMR spectroscopy of original lignin samples.
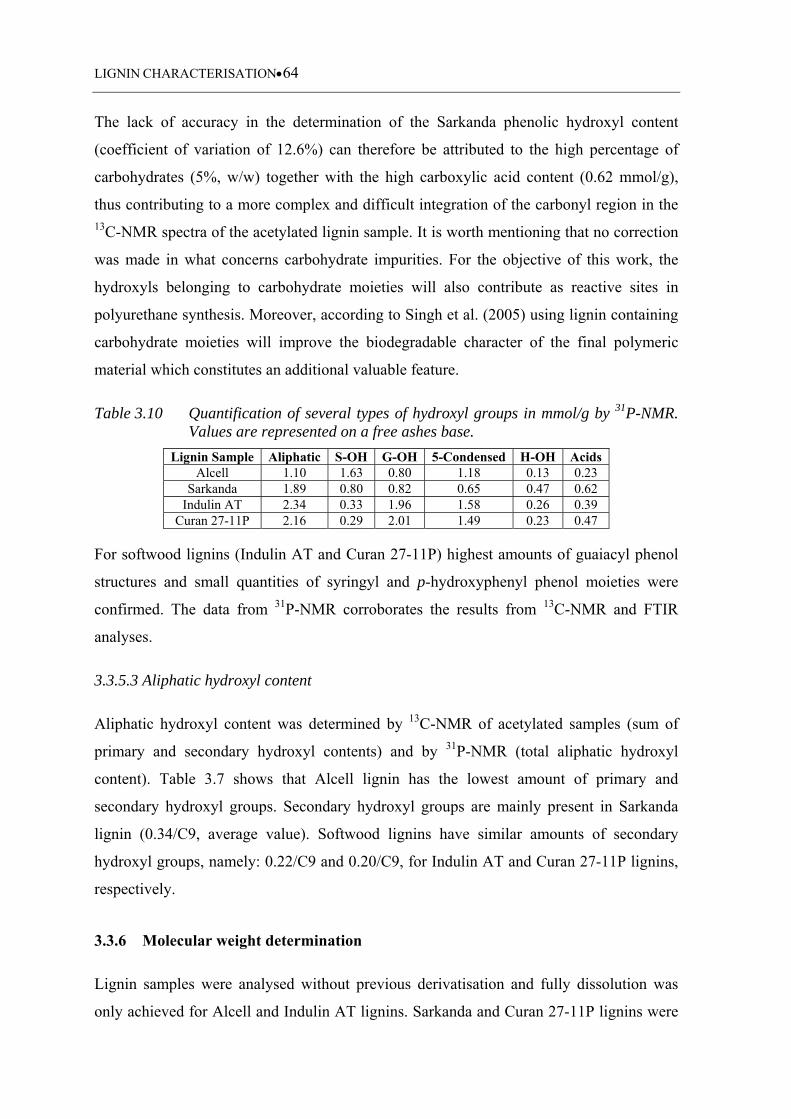
LIGNIN CHARACTERISATION64
The lack of accuracy in the determination of the Sarkanda phenolic hydroxyl content
(coefficient of variation of 12.6%) can therefore be attributed to the high percentage of
carbohydrates (5%, w/w) together with the high carboxylic acid content (0.62 mmol/g),
thus contributing to a more complex and difficult integration of the carbonyl region in the 13C-NMR spectra of the acetylated lignin sample. It is worth mentioning that no correction
was made in what concerns carbohydrate impurities. For the objective of this work, the
hydroxyls belonging to carbohydrate moieties will also contribute as reactive sites in
polyurethane synthesis. Moreover, according to Singh et al. (2005) using lignin containing
carbohydrate moieties will improve the biodegradable character of the final polymeric
material which constitutes an additional valuable feature.
Table 3.10 Quantification of several types of hydroxyl groups in mmol/g by 31P-NMR. Values are represented on a free ashes base.
Lignin Sample Aliphatic S-OH G-OH 5-Condensed H-OH Acids Alcell 1.10 1.63 0.80 1.18 0.13 0.23
Sarkanda 1.89 0.80 0.82 0.65 0.47 0.62 Indulin AT 2.34 0.33 1.96 1.58 0.26 0.39
Curan 27-11P 2.16 0.29 2.01 1.49 0.23 0.47
For softwood lignins (Indulin AT and Curan 27-11P) highest amounts of guaiacyl phenol
structures and small quantities of syringyl and p-hydroxyphenyl phenol moieties were
confirmed. The data from 31P-NMR corroborates the results from 13C-NMR and FTIR
analyses.
3.3.5.3 Aliphatic hydroxyl content
Aliphatic hydroxyl content was determined by 13C-NMR of acetylated samples (sum of
primary and secondary hydroxyl contents) and by 31P-NMR (total aliphatic hydroxyl
content). Table 3.7 shows that Alcell lignin has the lowest amount of primary and
secondary hydroxyl groups. Secondary hydroxyl groups are mainly present in Sarkanda
lignin (0.34/C9, average value). Softwood lignins have similar amounts of secondary
hydroxyl groups, namely: 0.22/C9 and 0.20/C9, for Indulin AT and Curan 27-11P lignins,
respectively.
3.3.6 Molecular weight determination
Lignin samples were analysed without previous derivatisation and fully dissolution was
only achieved for Alcell and Indulin AT lignins. Sarkanda and Curan 27-11P lignins were
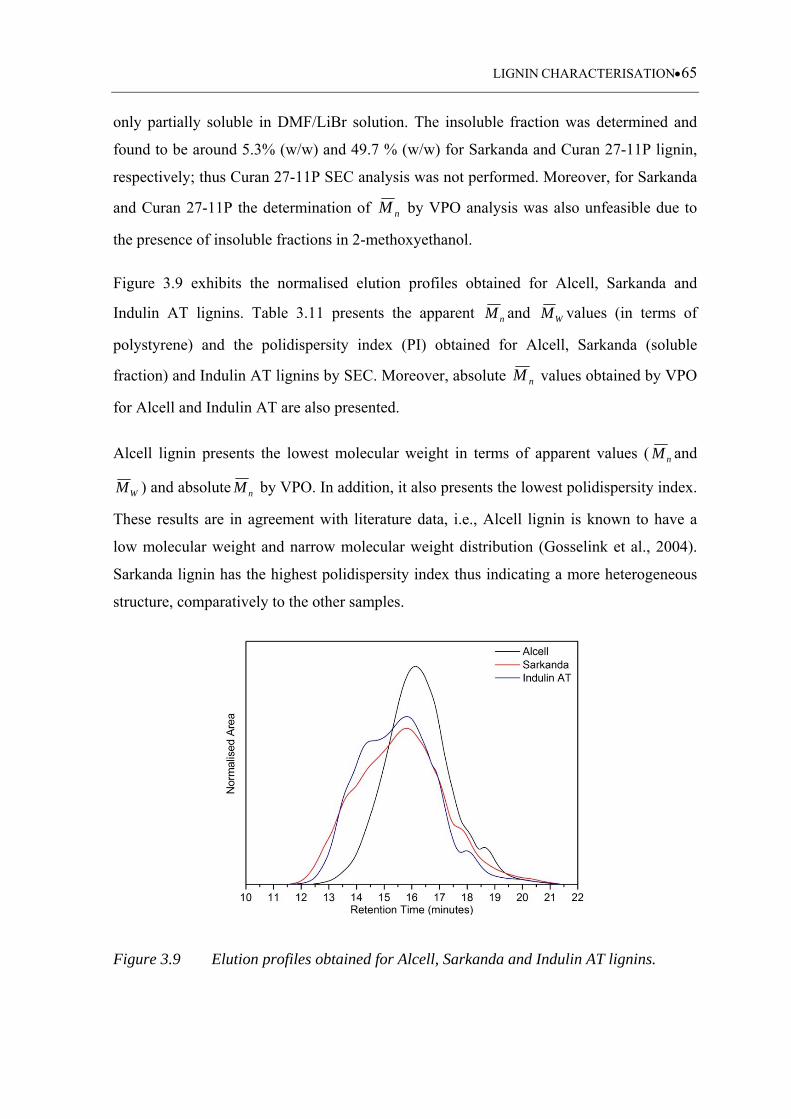
LIGNIN CHARACTERISATION65
only partially soluble in DMF/LiBr solution. The insoluble fraction was determined and
found to be around 5.3% (w/w) and 49.7 % (w/w) for Sarkanda and Curan 27-11P lignin,
respectively; thus Curan 27-11P SEC analysis was not performed. Moreover, for Sarkanda
and Curan 27-11P the determination of nM by VPO analysis was also unfeasible due to
the presence of insoluble fractions in 2-methoxyethanol.
Figure 3.9 exhibits the normalised elution profiles obtained for Alcell, Sarkanda and
Indulin AT lignins. Table 3.11 presents the apparent nM and WM values (in terms of
polystyrene) and the polidispersity index (PI) obtained for Alcell, Sarkanda (soluble
fraction) and Indulin AT lignins by SEC. Moreover, absolute nM values obtained by VPO
for Alcell and Indulin AT are also presented.
Alcell lignin presents the lowest molecular weight in terms of apparent values ( nM and
WM ) and absolute nM by VPO. In addition, it also presents the lowest polidispersity index.
These results are in agreement with literature data, i.e., Alcell lignin is known to have a
low molecular weight and narrow molecular weight distribution (Gosselink et al., 2004).
Sarkanda lignin has the highest polidispersity index thus indicating a more heterogeneous
structure, comparatively to the other samples.
Figure 3.9 Elution profiles obtained for Alcell, Sarkanda and Indulin AT lignins.
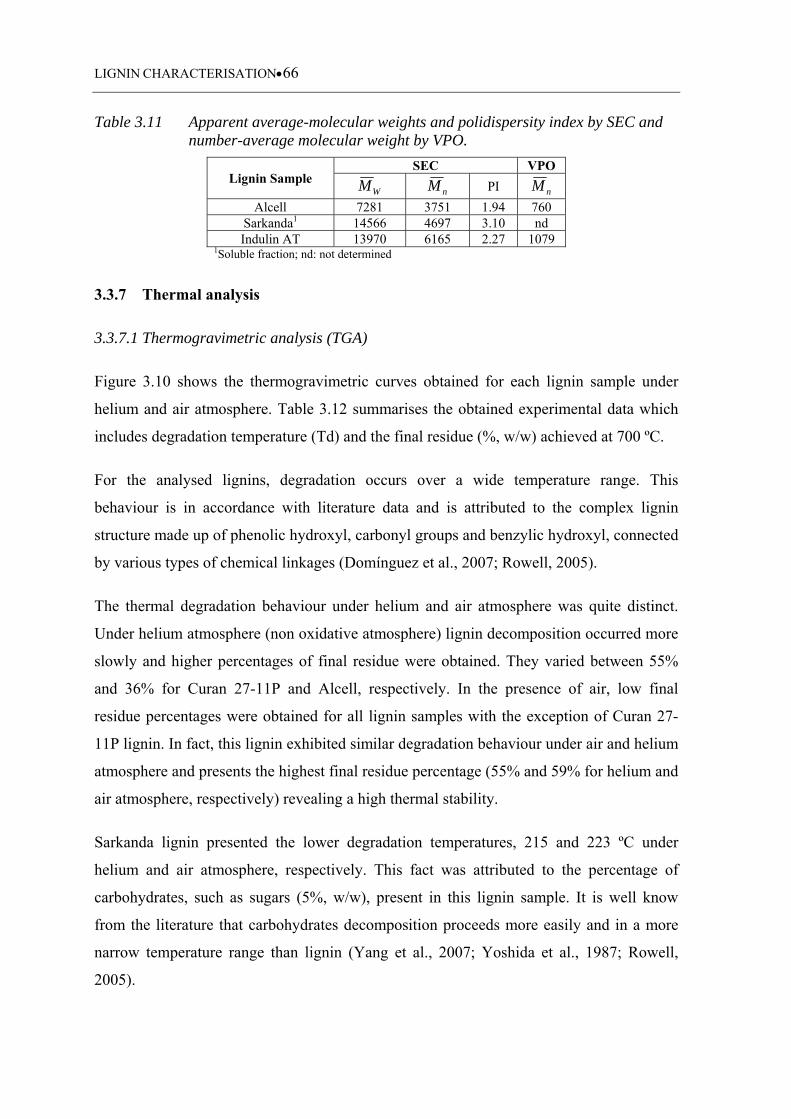
LIGNIN CHARACTERISATION66
Table 3.11 Apparent average-molecular weights and polidispersity index by SEC and number-average molecular weight by VPO.
Lignin Sample SEC VPO
WM nM PI nM
Alcell 7281 3751 1.94 760 Sarkanda1 14566 4697 3.10 nd Indulin AT 13970 6165 2.27 1079
1Soluble fraction; nd: not determined
3.3.7 Thermal analysis
3.3.7.1 Thermogravimetric analysis (TGA)
Figure 3.10 shows the thermogravimetric curves obtained for each lignin sample under
helium and air atmosphere. Table 3.12 summarises the obtained experimental data which
includes degradation temperature (Td) and the final residue (%, w/w) achieved at 700 ºC.
For the analysed lignins, degradation occurs over a wide temperature range. This
behaviour is in accordance with literature data and is attributed to the complex lignin
structure made up of phenolic hydroxyl, carbonyl groups and benzylic hydroxyl, connected
by various types of chemical linkages (Domínguez et al., 2007; Rowell, 2005).
The thermal degradation behaviour under helium and air atmosphere was quite distinct.
Under helium atmosphere (non oxidative atmosphere) lignin decomposition occurred more
slowly and higher percentages of final residue were obtained. They varied between 55%
and 36% for Curan 27-11P and Alcell, respectively. In the presence of air, low final
residue percentages were obtained for all lignin samples with the exception of Curan 27-
11P lignin. In fact, this lignin exhibited similar degradation behaviour under air and helium
atmosphere and presents the highest final residue percentage (55% and 59% for helium and
air atmosphere, respectively) revealing a high thermal stability.
Sarkanda lignin presented the lower degradation temperatures, 215 and 223 ºC under
helium and air atmosphere, respectively. This fact was attributed to the percentage of
carbohydrates, such as sugars (5%, w/w), present in this lignin sample. It is well know
from the literature that carbohydrates decomposition proceeds more easily and in a more
narrow temperature range than lignin (Yang et al., 2007; Yoshida et al., 1987; Rowell,
2005).
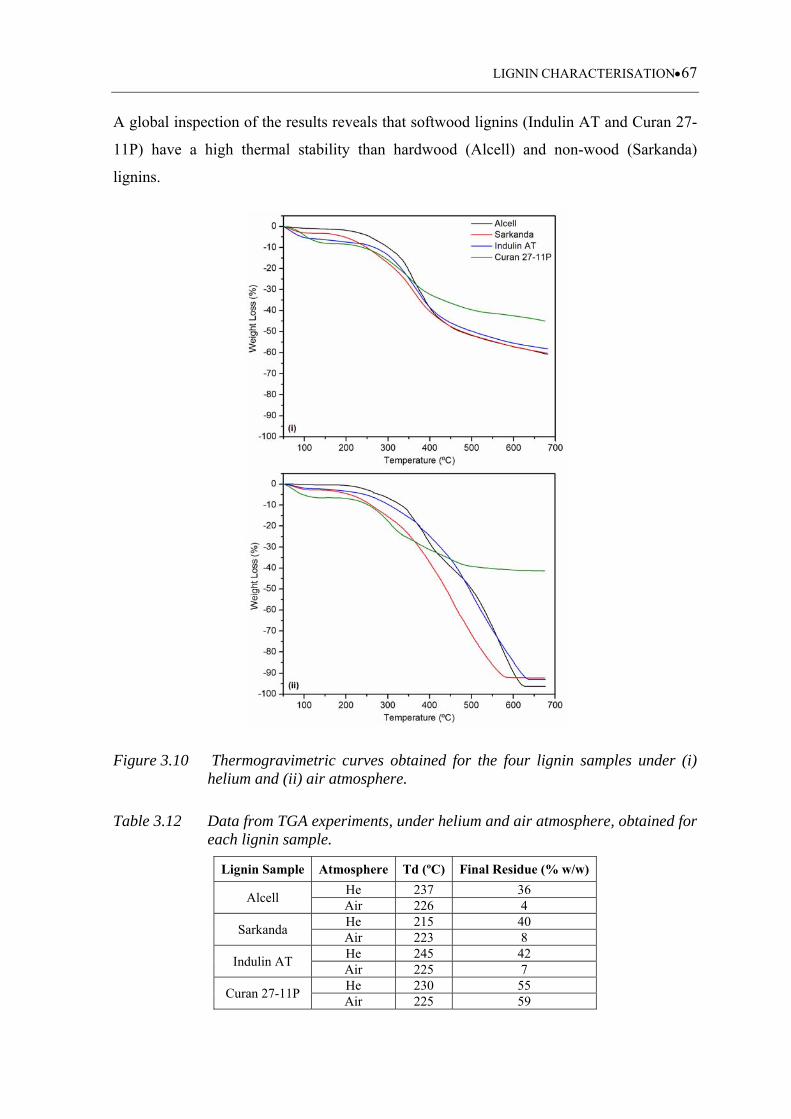
LIGNIN CHARACTERISATION67
A global inspection of the results reveals that softwood lignins (Indulin AT and Curan 27-
11P) have a high thermal stability than hardwood (Alcell) and non-wood (Sarkanda)
lignins.
Figure 3.10 Thermogravimetric curves obtained for the four lignin samples under (i) helium and (ii) air atmosphere.
Table 3.12 Data from TGA experiments, under helium and air atmosphere, obtained for each lignin sample.
Lignin Sample Atmosphere Td (ºC) Final Residue (% w/w)
Alcell He 237 36 Air 226 4
Sarkanda He 215 40 Air 223 8
Indulin AT He 245 42 Air 225 7
Curan 27-11P He 230 55 Air 225 59
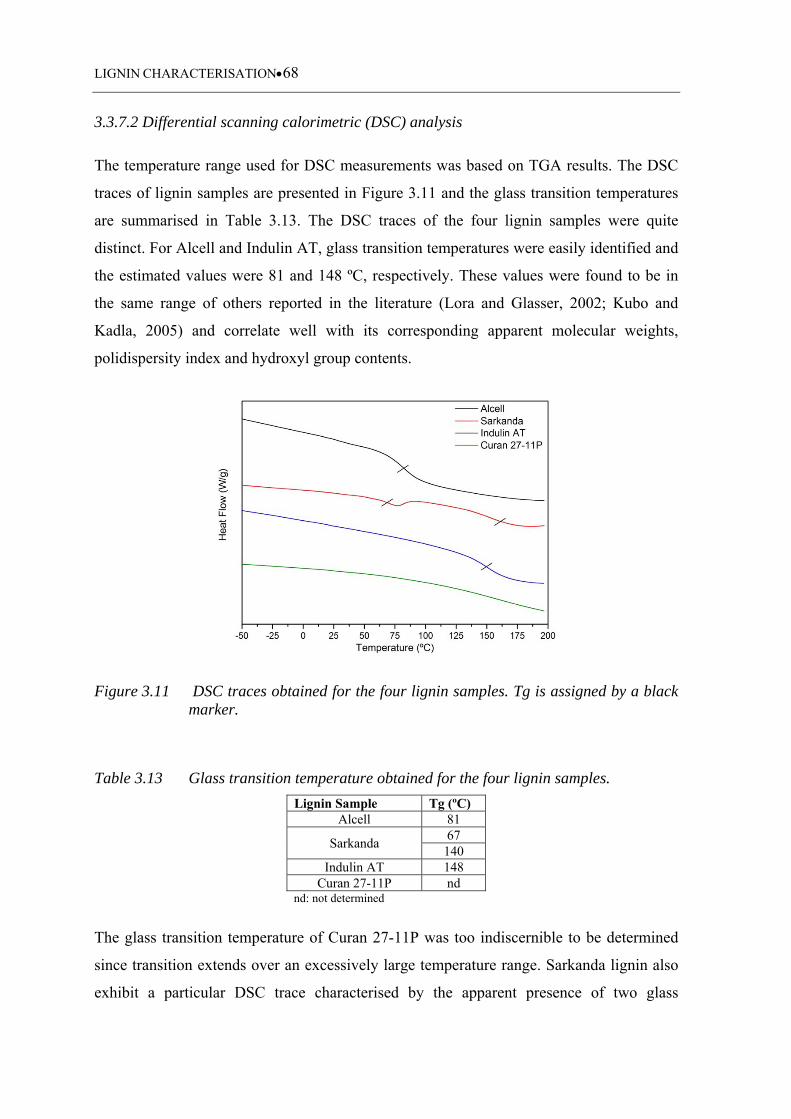
LIGNIN CHARACTERISATION68
3.3.7.2 Differential scanning calorimetric (DSC) analysis
The temperature range used for DSC measurements was based on TGA results. The DSC
traces of lignin samples are presented in Figure 3.11 and the glass transition temperatures
are summarised in Table 3.13. The DSC traces of the four lignin samples were quite
distinct. For Alcell and Indulin AT, glass transition temperatures were easily identified and
the estimated values were 81 and 148 ºC, respectively. These values were found to be in
the same range of others reported in the literature (Lora and Glasser, 2002; Kubo and
Kadla, 2005) and correlate well with its corresponding apparent molecular weights,
polidispersity index and hydroxyl group contents.
Figure 3.11 DSC traces obtained for the four lignin samples. Tg is assigned by a black marker.
Table 3.13 Glass transition temperature obtained for the four lignin samples.
Lignin Sample Tg (ºC) Alcell 81
Sarkanda 67 140
Indulin AT 148 Curan 27-11P nd
nd: not determined
The glass transition temperature of Curan 27-11P was too indiscernible to be determined
since transition extends over an excessively large temperature range. Sarkanda lignin also
exhibit a particular DSC trace characterised by the apparent presence of two glass
LIGNIN CHARACTERISATION69
transition temperatures, the first one at 67 ºC and the second one at 140 ºC. Based on these
data is difficult to establish the real Tg of this lignin sample.
The difficulties encountered in the determination of the glass transition temperature of
Curan 27-11P and Sarkanda lignin motivated us to perform further analysis using
Modulated DSC. The obtained results were however quite similar to those previously
reported and no additional information was achieved using this more advanced technique.
3.4 Conclusions
Lignin samples were characterised using several analytical techniques and methods having
in view their valorisation as polyols in polyurethane synthesis. The lignin samples
presented properties inherent to its origin (softwood, hardwood and non-wood fibers), and
corresponding extraction and precipitation recovery processes.
Sarkanda and Curan 27-11P lignin exhibited the more particular features. Sarkanda is a p-
hydroxyphenyl-guaiacyl-syringyl (HGS) lignin characterised by a high sugar and acid
contents, 5.01% and 0.62 mmol/g, respectively. Moreover, it presents external acidity
arising from its precipitation recovery process. DSC trace was quite peculiar, i.e., it
showed evidence of the existence of two distinct Tg’s (67 ºC and 140 ºC). The apparent
molecular weight (soluble fraction) and polidispersity index were also found to be
relatively high. Curan 27-11P is a guaiacyl (G) lignin that presents high ash content (17%),
mainly Na salts, arising from the precipitation recovery process (this lignin is
commercialised in its alkali form). The determination of apparent molecular weight was
not possible due to solubility problems and its Tg was too indiscernible to be determined.
Its thermal stability was found to be quite high comparatively with the other analysed
lignins.
The data obtained for Alcell and Indulin AT were found to be in close agreement with
published data. Alcell is a guaiacyl-syringyl (GS) lignin whereas Indulin AT, such as
Curan 27-11P, is a guaiacyl (G) lignin type. Alcell lignin presented high purity (only
0.05% of ashes), low molecular weight ( nM = 760 g/mol determined by VPO) and low
polidispersity index. Moreover, among the analysed samples it presented the lowest Tg (81
ºC). Comparatively, Indulin AT presented both higher molecular weight ( nM = 1079 g/mol
LIGNIN CHARACTERISATION70
determined by VPO) and polidispersity index. Moreover, it presents a Tg of 148 ºC and
higher thermal stability. The ash content was 3.06%.
Hydroxyl group determination revealed that Indulin AT and Curan 27-11P (softwood
lignins) have the highest total hydroxyl content, 6.99 and 6.21 mmol/g, respectively. Alcell
and Sarkanda lignins have approximately the same total hydroxyl content (5.26 mmol/g).
The amounts of phenolic hydroxyl groups were similar for Alcell, Indulin AT and Curan
27-11P lignins. Sarkanda lignin has the lowest amount of phenolic hydroxyl groups,
whereas Alcell has the lowest amount of aliphatic counterparts (both primary and
secondary hydroxyls). Similar amounts of secondary hydroxyl groups were found for
Sarkanda, Indulin AT and Curan 27-11P lignins.
The acetylation procedure according to the ISO 14900:2001(E) standard followed by
titration seemed to be an attractive procedure for total hydroxyl content determination.
Limitations were only observed for Curan 27-11P lignin, which can be associated to the
used isolation procedure (lignin commercially available in alkali form). This procedure
was found to be simple and reliable. Moreover, it didn’t require neither expensive
equipment nor specialised technicians.
For phenolic hydroxyl content, both 31P-NMR and 13C-NMR gave comparable results.
Nevertheless, the former had the advantage of allowing quantification by discrimination of
the aromatic hydroxyl groups attached to syringyl, guaiacyl, and p-hydroxyphenyl units.
Alcell and Indulin AT seem to be the most attractive and viable lignins to be used directly
as macromonomers in polyurethane synthesis. Alcell lignin presents a high purity coupled
with low molecular weight and low polidispersity index. Its low Tg also favours
homogenisation of reactive mixtures. Indulin AT has the highest total hydroxyl and
presents low impurity content.
Curan 27-11P due to its commercial form (alkali form - sodium salt lignin), which means
that part of its hydroxyls are already in the hydroxylate form (alcoholates and phenolates)
is, in principle, suitable to be used as a substrate for oxypropylation reaction.
LIGNIN CHARACTERISATION71
3.5 References
Adler, E., Hernestam, S., 1955. Estimation of phenolic hydroxyl groups in lignin. I.
Periodate oxidation of guaiacol compounds. Analytica Chimica Acta 9, 319-334.
Adler, E., Magnusson, R., 1959. Periodate oxidation of phenols.I. Monoethers of
pyrocatechol and hydroquinone. Analytica Chimica Acta 13, 505-519.
Ahvazi, B.C., Argyropoulos, D.S., 1996. 19F Nuclear Magnetic Resonance Spectroscopy
for the elucidation of carbonyl groups in lignins.1. Model compounds. J. Agric. and Food
Chem. 44, 2167–2175.
Ahvazi, B.C., Crestini, C., Argyropoulos, D. S., 1999. 19F Nuclear Magnetic Resonance
Spectroscopy for the quantitative detection and classification of carbonyl groups in lignins.
J. Agric. Food Chem. 47, 190-201.
Argyropoulos, D. S., Zhang, L., 1998. Semiquantitative determination of quinonoid
structures in isolated lignins by 31P Nuclear Magnetic Resonance. J. Agric. Food. Chem.
46, 4628-4634.
Argyropoulos, D. S., Bolker, H. I., Heitner, C., Archipov, Y., 1993. 31P-NMR
spectroscopy in wood chemisty Part V. Qualitative analysis of lignin functional groups. J.
Wood Chem. Techno. 13, 187-212.
Argyropoulos, D. S., Menachem, S. B., 1998. Lignin. In: Biopolymers from renewable
resources. Kaplan, D. L. (Ed), Springer, 292-314.
Aulin-Erdtman, G., 1954. Spectrographic contributions to lignin chemistry.V. Phenolic
groups in Spruce lignin. Svensk Papperstidning 57, 745-760.
Baeza, J., Freer, J., 2000. Chemical characterisation of wood and its components. In: Wood
and cellulosic chemistry. Hon, D. N.-S., Shiraishi, N. (Eds), Marcel Dekker Inc., New
York, Basel, 275-385.
Baker, S. M., 1996. Rapid methoxyl analysis of lignins using gas chromatography.
Holzforschung 50, 573-574.
LIGNIN CHARACTERISATION72
Balakshin, M. Y., Capanema, E. A., Chen, C.-L., Gracz, H. S., 2003. Elucidation of the
structures of residual and dissolved pine kraft lignins using HMQC NMR technique. J.
Agric. Food Chem. 51, 6116-6127.
Balakshin, M.Y., Capanema, E.A., Chen, C-L., Gracz, H. S., 2003. Elucidation of the
structures of residual and dissolved pine kraft lignins using an HMQC NMR technique. J.
Agric. Food Chem. 51, 6116-6127.
Barrelle, M. 1993. A new method for the quantitative 19F NMR spectroscopic analysis of
hydroxyl groups in lignins. Holzforschung 47, 261–267.
Barrelle, M., 1995. Improvements in the structural investigation of lignins by 19F NMR
spectroscopy. J. Wood Chem. and Technol. 15, 179–188.
Baumberger, S., Abaercherli, A., Fasching, M., Gellersted, G., Gosselink, R., Li, J., Saake,
B., Jong, E., 2007. Molar mass determination of lignins by size- exclusion
chromatography: towards standardisation of the method. Holzforschung 61, 459-468.
Bayerbach, R., Nguyen, V.D., Schurr, U., Meier, D., 2006. Characterisation of the water-
insoluble fraction from fast pyrolysis liquids (pyrolytic lignin) Part III. Molar mass
characteristics by SEC, MALDI-TOF-MS, LDI-TOF-MS and Py-FIMS. J. Anal. Appl.
Pyrolysis 77, 95–101.
Boeriu, C. G., Bravo, D., Gosselink, R. J. A., Van Dam, J. E. G., 2004. Characterisation of
structure-dependent functional properties of lignin with infrared spectroscopy. Ind. Crops.
Prod. 20, 205-218.
Cathala, B., Saake, B., Faix, O., Monties, B., 2003. Association behaviour of lignins and
lignins model compounds studied by multidetector size exclusion chromatography. Journal
of Chromatography 1020, 229-239.
Chang, H. M., Allan, G. G., 1971. Oxidation. In: Lignins: Occurrence, Formation,
Structure and Reactions, Sarkanen, K.V., Ludwig, C.H., Wiley (Eds), New York, 433-485.
Chen, C.- L., 1992. Determination of carbonyl groups. In: Methods in Lignin Chemistry.
Dence, C.W., Lin, S.Y.(Eds), Springer-Verlag Heidelberg, 446-457.
LIGNIN CHARACTERISATION73
Chen, C.-L., 1992. Determination of methoxyl groups. In: Methods in Lignin Chemistry.
Dence, C.W., Lin, S.Y.(Eds), Springer-Verlag, Heidelberg, 465-472.
Chen, C.-L., 1992. Determination of total and aliphatic hydroxyl groups. In: Methods in
Lignin Chemistry. Dence, C.W., Lin, S.Y.(Eds), Springer-Verlag, Heidelberg, 410-422.
Chen, C.-L., 1992. Nitrobenzene and cupric oxide oxidations. In: Methods in Lignin
Chemistry. Dence, C.W., Lin, S.Y. (Eds), Springer-Verlag, Heidelberg, 301-321.
Chen, L.C., 1998. Characterisation of milled wood lignins and dehydrogenative
polymerisates from monoligniols by Carbon-13 NMR spectroscopy. In: Lignin and lignan
biosynthesis. Lewis, N.G. and Sarkanen, S. (Eds), ACS Symp, Series 697, 255-275.
Connors, W. J., Sarkanen, S., McCarthy, J. L., 1980. Gel chromatography and association
complexes of lignin. Holzforschung 34, 80-85.
Crestini, C., Argyropoulos, D. S., 1997. Structural analysis of wheat straw lignin by
quantitative 31P and 2D NMR spectroscopy. The occurrence of ester bonds and α-O-4
substructures. J. Agric. Food Chem. 45, 1212-1219.
Dence C.W., Lin, S.Y. (Eds), 1992. Methods in Lignin Chemistry. Springer-Verlag,
Heidelberg.
Dence, C. W., 1992. Determination of carboxyl groups. In: Methods in Lignin Chemistry.
Dence, C.W., Lin, S.Y.(Eds), Springer-Verlag, Heidelberg, 458-464.
Domínguez, J.C., Oliet, M., Alonso, M.V., Gilarranz, M.A., Rodríguez, F., 2007. Thermal
Stability and pyrolysis kinetics of organosolv lignins obtained from Eucalyptus globules.
Ind. Crops and Prod. 27, 150-156.
Evtuguin, D. V., Domingues, P., Amado, F. L., Pascoal Neto, C., Ferrer Correia, A. J.,
1999. Electrospray ionization mass spectrometry as a tool for lignins molecular weight
determination and structural characterisation. Holzforschung 53, 525-528.
Faix, O., 1992. Fourier Transform Infrared Spectroscopy. In: Methods in Lignin
Chemistry. Dence, C.W., Lin, S.Y. (Eds), Springer-Verlag Heidelberg, 233-241.
LIGNIN CHARACTERISATION74
Faix, O., Andersons, B. and Zakis, G., 1998. Determination of Carbonyl groups of six
round robin lignins by modified oximation and FTIR spectroscopy. Holzforschung 52,
268-274.
Faix, O., Argyropoulos, D.S., Robert, D., Neirinck, V., 1994. Determination of hydroxyl
groups in lignins. Evaluation of 1H, 13C, 31P NMR, FTIR and wet chemical methods.
Holzforschung 48, 387-394.
Faix, O., Böttcher, J. H., 1993. Determination of phenolic hydroxyl groups contents in
milled wood lignins by FTIR spectroscopy applying Partial Least-Squares (PLS) and
Principal Component Regression (PCR). Holzforschung 47, 45-49.
Faix, O., Grünwald, C., Beinhoff, O., 1992. Determination of phenolic hydroxyl content of
milled wood lignins (MWL´s) from different botanical origins using selective aminolysis,
FTIR, 1H-NMR and UV spectroscopy. Holzforschung 46, 425-432.
Fournand, D., Mila, I., Lapierre, C., 2002. Capillary zone electrophoresis of syringyl and
guaiacyl monomers resulting from lignin thioacidolysis. Phytochemical Analysis 13, 338-
342.
Fournand, D., Pollet, B., Lapierre, C., 2000. Lignin evaluation by chemical degradative
methods: Relative performances of the DFRC and thioacidolysis techniques. In:
Proceedings of Sixth European Workshop on Lignocellulosics and Pulp, 313-316.
Freudenberg, K., 1939. Über lignin. Angew Chem. 52, 362-363.
Freudenberg, K., Janson, A., Knopf, E., Haag, A., 1936. Zur Kenntnis des Lignins. Chem
Ber 69, 1415-1425.
Galleti, G. C., Piccaglia, R., Chiavari, G., Concialini, V., 1989. HPLC/Electrochemical
detection of lignin phenolics from wheat straw by direct injection of nitrobenzene
hydrolysates. J. Agric. Food Chem. 37, 985-987.
Gandini, A., Belgacem, M.N., Guo, Z.-X., Montanari, S., 2002. Lignin as macromonomers
for polyesther and polyurethanes. In: Chemical modification, properties, and usage of
lignin. Hu, T. Q. (Ed). Kluwer Academic Plenum Publishers, New York, 57-80.

LIGNIN CHARACTERISATION75
Gärtner, A., Göran, G., Tamminen, T., 1999. Determination of phenolic hydroxyl groups
in residual lignin using a modified UV-method. Nordic Pulp and Paper Research Journal
14, 163-170.
Gellersted, G., Henriksson, G, 2008. In: Monomers, polymers and composite from
renewable resources. Belgacem, M.N., Gandini, A. (Eds), Elsevier, 201-225.
Gellerstedt, G., 1992. In: Methods in Lignin Chemistry. Dence, C.W., Lin, S.Y.(Eds),
Springer-Verlag, Heidelberg, 487-497.
Gellerstedt, G., 1992. Permanganate oxidation. In: Methods in Lignin Chemistry. Dence,
C.W., Lin, S.Y.(Eds), Springer-Verlag Heidelberg, 322-333.
Gidh, A.V., Decker, S.R., Vinzant, T.B., Himmel, M.E., Williford, C., 2006.
Determination of lignin by size exclusion chromatography using multi angle laser light
scattering. J. Chomatogr. A., 1114, 102-110.
Gierer, J., Lenz, B., 1965. Reaction of lignin during sulphate cooking. Svensk Papperstidn.
68, 334-338.
Gierer, J., Söderberg, S., 1959. Über die carbonylgruppen des lignins. Acta Chemica
Scandinavica 13, 127-137.
Gilarranz, M. A., Rodríguez, F., Oliet, M., García, J., Alonso, V., 2001. Phenolic OH
groups estimation by FTIR and UV spectroscopy. Application to Organosolv lignins. J.
Wood Chem. Technol. 21, 387-395.
Glasser, W. G., Dave, V., Frazier, C. E., 1993. Molecular weight distribution of (semi-)
commercial lignin derivatives. Journal of wood chemistry and technology 13, 545-559.
Goldschmid, O., 1954. Determination of phenolic hydroxyl content of lignin preparations
by ultraviolet spectrophotometry. Anal. Chem., 1421-1423.
Gosselink, R.J.A., Abächerli, A., Semke, H., Malherbe, R., Käuper, P., Nadif, A., Van
Dam, J.E.G., 2004. Analytical protocols for characterisation of sulphur-free lignin. Ind.
Crops and Prod. 19, 271–281.
LIGNIN CHARACTERISATION76
Granata, A., Argyropoulos, D., 1995. 2-Chloro-4,4,5,5-tetramethyl-1,3,2-
dioxaphospholane, a reagent for the accurate determination of the uncondensed and
condensed phenolic moieties in lignins. J. Agric. Food. Chem. 43, 1538-1544.
Hatakeyama, H., 1992. In: Methods in Lignin Chemistry. Dence, C.W., Lin, S.Y.(Eds),
Springer-Verlag, Heidelberg, 200-214.
Hatakeyama, T., Hatakeyama, H., 2004. Lignin. In: Thermal properties of green polymers
and biocomposites. Kluwer academic publishers, Chapter 5.
Hauteville, M., Lundquist, K., Von Unge, S. , 1986. NMR studies of lignins.7. 1H-NMR
spectroscopic investigation of the distribution of erythro and threo forms of β-O-4
structures in lignins. Acta Chemica Scandinavica 40, 31-35
Heikkinen, S.; Toikka, M. M.; Karhunen, T.; Kilpelainen, I. A., 2003 Quantitative 2D
HSQC (Q-HSQC) via suppression of J-dependence of polarization transfer in NMR
spectroscopy: Application to wood lignin. J. Am. Chem. Soc. 125, 4362-4367.
Hoareau, W., Trindade, W., Siegmund, B., Castellan, A., Frollini, E., 2004. Sugar cane
bagasse and curaua lignins oxidized by chlorine dioxide and reacted with furfuryl alcohol:
characterisation and stability. Polym. Degrad. Stab. 86, 567-576.
Holtman, K., Chang, H. M., Jameel, H., Kadla, J. F., 2003. Elucidation of lignin structure
through degradative methods: Comparison of modified DFRC and thioacidolysis. J. Agric.
Food Chem. 51, 3535–3540.
Hortling, B., Tamminen, T., Kenttä, E., 1997. Determination of carboxyl and non-
conjugated carbonyl groups in dissolved and residual lignins by IR spectroscopy.
Holzforschung 51, 405-410.
http://www.dfrc.ars.usda.gov
http://www.ili-lignin.com
Ikeda, T., Holtman, K., Kadla, J. F., Chang, H. M., Jameel, H., 2002. Studies on the effect
of ball milling on lignin structure using a modified DFRC method. J. Agric. Food Chem.
50, 129-135.
LIGNIN CHARACTERISATION77
Jakab, E., Faix, O., Till, F. 1997. Thermal decomposition of milled wood lignin studied by
thermogravimetry/mass spectrometry. Journal of Analytical and Applied Pyrolysis 40-41,
171-186.
Javor, T., Buchberger, W., Faix, O., 2003. Capillary electrophoretic determination of lignin
degradation products obtained by permanganate oxidation. Analytica Chimica Acta 484,
181-187.
Johnson, D. K., Chum, H. L., Hyatt, J. A., 1989. Molecular weight distribution studies
using lignin model compounds. In: Lignin: Properties and materials. Glasser, W. G.,
Sarkanen, S. (Eds), ACS, Washington DC, 109-123.
Katahira, R., Nakatsubo, F., 2001. Determination of nitrobenzene oxidation products by
GC and 1H-NMR spectroscopy using 5-iodovanillin as a new internal standard. J. Wood
Sci. 47, 378-382.
Košíková, B., Ebringerová, A., Naran, R., 1999. Characterisation of lignin-carbohydrate
fraction isolated from the wood parasite Cistanche Deserticola Y.C.Ma. Holzforschung 53,
33-38.
Kubo, S., Kadla, J.F., 2005. Effect of polymer blending on the properties of lignin-based
carbon fibers. J. Polym. Environ. 13, 97-105
Lai, Y.-Z., 1992. Determination of phenolic hydroxyl groups. In: Methods in Lignin
Chemistry. Dence, C.W., Lin, S.Y.(Eds), Springer-Verlag, Heidelberg, 423-434.
Lai, Y.-Z., Guo, X.-P., Situ, W., 1990. Estimation of phenolic hydroxyl groups in wood by
a periodate oxidation method. J. Wood Chem. and Techn. 10, 365-377.
Landucci, L. L., 1991. Application of modern liquid-state NMR to lignin characterisation.
I. One-dimensional spectral techniques. Holzforschung 45, 55-60.
Landucci, L.L., Ralph, S.A., Hammel, K.E., 1998. 13C NMR characterisation of guaiacyl,
guaiacyl/syringyl and syringyl dehydrogenation polymers. Holzforschung 52, 160-170.
Landucci, L.L., Ralph, S.A., Hammel, K.E., 1998. 13C NMR characterisation of guaiacyl,
guaiacyl/syringyl and syringyl dehydrogenation polymers. Holzforschung 52, 160-170.
LIGNIN CHARACTERISATION78
Lapierre, C., Monties, B., Rolando, C., 1985. Thioacidolysis of lignin: Comparison with
acidolysis. J. Wood Chem. Technol. 5, 277–292.
Lapierre, C., Pollet, B., Monties, B., Rolando, C., 1991. Thioacidolysis of Spruce Lignin:
GC-MS Analysis of the Main Dimers Recovered After Raney-Nickel Desulfuration.
Holzforschung 45, 61-68.
Lapierre, C., Rolando, C., 1988. Thioacidolyses of Pre-Methylated Lignin Samples from
Pine Compression and Poplar Woods. Holzforschung, 4, 1-4.
Lapierre, C., Rolando, C., Monties, B., 1983. Characterisation of poplar lignins acidolysis
products: capillary gas-liquid and liquid-liquid chromatography of monomeric compounds.
Holzforschung 37, 189-198.
Leopold, B., 1950. Aromatic Keto- and Hydroxy-polyethers as lignin models. III. Acta
Chemica Scandinavica 4, 1523-1537.
Leopold, B., Malmström, I.-L. 1951. Nitrobenzene oxidation of compounds of the lignan
type. Acta Chemica Scandinavica 5, 936-940.
Lepifre, S., Baumberger, S., Pollet, B., Cazaux, F., Coqueret, X., Lapierre, C., 2004.
Reactivity of sulphur-free alkali lignins within starch films. Ind. Crops and Prod. 20, 219-
230.
Li, S., Karlsson, O., Lundquist, K., Stomberg, R., 1997. Acid reactions of lignin model
1,2- bis (3,4- dimethoxyphenyl)-1,3-propanediol. Acta Chemica Scandinavica 51, 431-437.
Liitä, T. M., Maunu, S. L., Hortling, B., Toikka, M., Kilpeläinen, I., 2003. Analysis of
technical lignins by two-and-three-dimensional NMR spectroscopy. J. Agric. Food Chem.
51, 2136-2143.
Liitä, T., Maunu, S. L., Sipilä, J., Hortling, B., 2002. Application of solid-state 13C NMR
spectroscopy and dipolar dephasing technique to determine the extend of condensation in
technical lignins. Solid State Nuclear Magnetic Resonance 21, 171-186.
Lin, S. Y., 1992. Ultraviolet spectrophotometry. In: Methods in Lignin Chemistry. Dence,
C.W., Lin, S.Y. (Eds), Springer-Verlag, Heidelberg, 218-232.
LIGNIN CHARACTERISATION79
Lora, J., 2008. Industrial commercial lignins: Sources, properties and applications. In:
Monomers, polymers and composites from renewable resources. Belgacem, N.M. Gandini,
A., (Eds). Elsevier publications, 225-241.
Lora, J.H. and Glasser, W.G., 2002. Recent Industrial Applications of Lignin: A
Sustainable Alternative to Non-renewable Materials. Journal of Polymers and the
Environment 10, 39-48.
Lu, F. and Ralph, J., 1997. DFRC method for lignin analysis.1.New method for β-aryl
ether cleavage: lignin model studies. J. Agric. Food Chem. 45, 4655-4660.
Lundquist, K., 1980. NMR studies of lignins.4. Investigation of Spruce lignin by 1H-NMR
spectroscopy. Acta Chemica Scandinavica 34, 21-26.
Lundquist, K., 1981. NMR studies of lignins. 5. Investigation of the Non-derivatized
Spruce and Birch lignin by 1H-NMR spectroscopy. Acta Chemica Scandinavica 35, 497-
501.
Lundquist, K., Hedlund, K., 1967. Acid degradation of lignin.I. The formation of ketones
of the guaiacylpropane series. Acta Chemica Scandinavica 21, 1750-1754.
Lundquist, K., Kirk, T. K., 1971. Acid degradation of lignin.IV. Analysis of lignin
acidolysis products by gas chromatography, using trimethylsilyl derivatives. Acta Chemica
Scandinavica 25, 889-894.
Lundquist, K., Olsson, T., 1977. NMR studies of lignins. 1. Signals due to protons in
formyl groups. Acta Chemica Scandinavica 31, 788-792.
Majcherczyk, A., Hüttermann, A., 1997. Size-exclusion chromatography of lignin as ion-
pair complex. Journal of Chromatography A 764, 183-191.
Malkavaara, P., Alén, R., Kolehmainen, E., 1999. Multivariate correlation between 13C
and 31P NMR spectral data on dissolved lignin and the combustion of kraft black liquor.
Magnetic Resonance in Chemistry 37, 407-412.
Mansouri, N.-E. E., Salvadó, J., 2007. Analytical methods for determining functional
groups in various technical lignins. Ind. Crops and Prod. 26, 116-124.
LIGNIN CHARACTERISATION80
Mansson, P., 1983. Quantitative determination of phenolic and total hydroxyl groups in
lignins. Holzforschung 37, 143-146.
Mao, J., Holtman, K. M., Scott, J. T., Kadla, J. F., Schmidt-Rohr, K., 2006. Differences
between lignin in umprocesses Wood, milled wood, mutant wood, and extracted lignin
detected by 13C solid-state NMR. J. Agric. Food Chem. 54, 9677-9686.
Marlin, N., Lachenal, D., Magnin, L., Brochier-Salon, M.C., 2005. Study of the oxygen
effect on mechanical pulp lignin using improved lignin isolation method. Holzforschung
59, 116-123.
Merkle, G., Auerbach, S., Burchard, W., Lindner, A., Wegener, G., 1992. Light scattering
of acetylated lignin. J. Appl. Polym. Sci. 45, 407-415.
Milne, T. A., Chum, H. L., Agblevor, F., Johnson, D. K., 1992. Standardized analytical
methods. Biomass Bioenery 2, 341-366.
Nada, Abd-Alla M.A., Yousef, M.A., Shaffei, K.A. and Salah, A.M., 1998. Infra-red
spectroscopy study of lignins. Polym. Degrad. Stab. 60, 247-251.
Önnerud, H., 2003. Lignin structures in normal and compression wood. Evaluation by
thioacidolysis using ethanethiol and methanethiol. Holzforschung 57, 377-384.
Önnerud, H., Gellestedt, G., 2003. Inhomogeneities in the chemical structure of Spruce
lignin. Holzforschung 57, 165-170.
Önnerud, H., Palmblad, M., Gellerstedt, G., 2003. Investigation of lignin oligomers using
electrospray ionisation mass spectrometry. Holzforschung 57, 37-43.
Pellinen, J., Salkinoja-Salonen, M., 1985. High-performance size-exclusion
chromatography of lignin and its derivatives. Journal of Chromatography 328, 299-308.
Pla, F., 1992. Light Scattering. In: Methods in Lignin Chemistry. Dence, C.W., Lin,
S.Y.(Eds), Springer-Verlag, Heidelberg, 499-508.
Pla, F., 1992. Vapour Pressure osmometry. Methods in Lignin Chemistry. Dence, C.W.,
Lin, S.Y.(Eds), Springer-Verlag, Heidelberg, 509-517.
LIGNIN CHARACTERISATION81
Pobiner, H., 1983. Improved inflection points in the non-aqueous potentiometric titration
of acid functionalities in lignin chemicals by using internal standardization and ion
exchange. Anal. Chim. Acta 155, 57-65.
Ralph, J., 1996. An unusual lignin from kenaf. J. Nat. Prod. 59, 341-342.
Ralph, J., Lu, F., 1998. The DFRC method for lignin analysis.6. A simple modification for
identifying natural acetates on lignins. J. Agric. Food Chem. 46, 4616-4619.
Ralph, J., Marita, J.M., Ralph, S. A., Hatfield, R. D., Lu, F., Ede, R. M., Peng, J., Quideau,
S., Helm, Grabber, J. H., Kim, H., Jimenez-Monteon, Gerardo, Zhang, Y., Jung, H.- J. G.,
Landucci, L. L., Mackay, J. J., Sederoff, R. R., Chapple, C. and Boudet, A. M., 1999.
Solution- State NMR of lignins. In: Advances in lignocellulosics characterisation.
Argyropoulos, D. S. (Ed), Tappi Press Chapter 13, 55-108.
Río, J. C. D., Marques, G., Rencoret, J., Martínez, Á. T., Gutiérrez, A., 2007. Occurrence
of naturally acetylated lignin units. J. Agric. Food Chem. 55, 5461-5468.
Robert, D. R., Brunow, G., 1984. Quantitative Estimation of hydroxyl groups in milled
wood lignin from Spruce and in a dehydrogenation polymer from coniferyl alcohol using
13C NMR spectroscopy. Holzforschung 38, 85-90.
Robert, D., 1992. Carbon- 13 Nuclear Magnetic Resonance Spectrometry. In: Methods in
Lignin Chemistry. Dence, C.W., Lin, S.Y. (Eds), Springer-Verlag, Heidelberg, 250-286.
Robert, D., Chen, C.-L., 1989. Biodegradation of Lignin in Spruce Wood by
Phanerochaete chrysosporium: Quantitative Analysis of Biodegraded Spruce Lignins by 13C NMR Spectroscopy. Holzforschung, 43, 323-332.
Rolando, C.; Monties, B., Lapierre, C., 1992. Thioacidolysis. In: Methods in Lignin
Chemistry. Dence, C.W., Lin, S.Y.(Eds), Springer-Verlag, Heidelberg, 334-349.
Rowell, R.M., LeVan-Green, S.L., 2005. Thermal Properties. In: Handbook of Wood
Chemistry, and Wood Composites. Rowell, R.M. (Ed), CRC Press, Washington D.C., 121-
138.
LIGNIN CHARACTERISATION82
Sarkanen, K.V., Ludwig, C.H., 1971. Lignins: Occurrence, Formation, Structure and
Reactions, Wiley, New York.
Schmidl, W., Dong, D., Fricke, A.L., 1990. Molecular weight and molecular weight
distribution of kraft lignins. In: Materials Research Society Symposia Proceedings, volume
197.
Schultz, T. P., Glasser, W. G., 1986. Quantitative structural analysis of lignin by diffuse
reflectance Fourier Transform Infrared Spectrometry. Holzforschung Suppl. 40, 37-44.
Schultz, T.P., Templeton, M.C., 1986. Proposed mechanism for the nitrobenzene oxidation
of lignin. Holzforschung 40, 93-97.
Sevillano, R. M., Mortha, G., Barrelle, M., Lachenal, D., 2001. 19F NMR spectroscopy for
the quantitative analysis of carbonyl groups in lignins. Holzforschung 55, 286-295.
Singh, R., Singh, S., Trimukhe, K.D., Pandare, Bastawade, K.B., Gokhale, D.V., Varme,
A.J., 2005. Lignin-carbohydrate complexes from sugarcane bagasse: Preparation,
purification, and characterisation. Carbohydrate Polymers 62, 57-66.
Sporek, K., Danyi, M., 1962. Detection and identification of alcohols, alkoxy groups,
lignin and wood by gas liquid chromatography. Anal. Chem. 34, 1527-1529.
Sun, X.F., Xu, F., Sun, R.C., Wang, Y.X., Fowler, P., Baird, M.S., 2004. Characteristics of
degraded lignins obtained from steam exploded wheat straw. Polym. Degrad. Stab. 86,
245-256.
Technical association of pulp and paper industry. Ash in wood, pulp, paper and
paperboard: combustion at 525 ºC. Atlanta, 1998/1999 (T211 om-93).
Technical British Standard BS ISO 14900, 2001. Plastics– Polyols for use in the
production of polyurethane– Determination of hydroxyl number.
Thielemans, W., Wool, R.P., 2005. Lignin Esters for Use in Unsaturated Thermosets:
Lignin Modification and Solubility Modelling. Biomacromolecules 6, 1895-1905.
LIGNIN CHARACTERISATION83
Tiainen, E., Drakenberg, T., Tamminen, T., Katajal, K. and Hase, A., 1999. Determination
of phenolic hydroxyl groups in lignin by combined use of 1H NMR and UV spectroscopy.
Holzforschung 53, 529–583.
Tohmura, S., Argyropoulos, D. S., 2001. Determination of Arylglycerol-β-aryl Ethers and
Other Linkages in Lignins Using DFRC/31P- NMR. J. Agric. Food Chem. 49, 536-542.
Vanderlaan, M.N., Thring, R.W., 1998. Polyurethanes from Alcell® Lignin Fractions
Obtained by Sequential Solvent Extraction. Biomass and Bionergy 14, 525-531.
Wexler, A. S., 1964. Characterisation of lignosulfonates by ultraviolet spectrometry. Direct
and difference spectrograms. Anal. Chem. 36, 213-221.
Woerner, D.L., MacCarthy, J. L., 1988. Ultrafiltration and light-scattering evidence for
association of kraft lignins in aqueous solutions. Macromolecules 21, 2160-2166.
Xia, Z., Akim, L. G., Argyropoulos, D. S., 2001. Quantitative 13C-NMR analysis of
lignins with internal standards. J. Agric. Food Chem. 49, 3573-3578.
Xu, F., Sun, J.-X., Sun, R., Fowler, P., Baird, M. S., 2005. Comparative study of
organosolv lignins from wheat straw. Ind. Crops and Prod. 23, 180-193.
Yang, H., Yan, R., Chen, H., Lee, D. H., Zheng, C., 2007. Characteristics of hemicellulose,
cellulose and lignin pyrolysis. Fuel 86, 1781-1788.
Yokoyama, T., Matsumoto, Y., 2008. Revisiting the mechanism of β-O-4 bond cleavage
during acidolysis of lignin. Part 1. Kinetics of the formation of enol ether from non-
phenolic C6-C2 type model compounds. Holzforschung 62, 164-168.
Yoshida, H., Mörck, R., Kringstad, K.P., Hatakeyama, H., 1987. Fractionation of Kraft
lignin by successive extraction with organic solvents II. Thermal properties of kraft lignin
fractions. Holzforschung 41, 171-175.
Yukiko, T., Noriyuki, M.S., 1999. A potassium permanganate oxidation method modified
with new catalysis. In: Proceedings of the lignin symposium 44, 29-32.
Zakis, G.F., 1994. Functional Analysis of Lignins and Their Derivatives. Tappi Press,
Atlanta.
LIGNIN CHARACTERISATION84
Zeisel, S, 1885. Über ein Verfahren zum quantitative Nachweis von methoxyl. Monatsh
Chem 6, 989-996.
Zeisel, S., 1885. Über ein verfahren zum quantitativen nachweis von methoxyl. Monatsh
Chem. 6, 989-996.
.
4. Utilisation of modified lignin by oxypropylation
This chapter is dedicated to the utilisation of lignin as a macromonomer in rigid
polyurethane foam synthesis after chemical modification. For such purpose the four
technical lignins (Alcell, Sarkanda, Indulin AT and Curan 27-11P) were converted into
liquid polyols by chain extension reaction with propylene oxide (oxypropylation).
The polyol formulation was first optimised with Alcell lignin by modifying the
lignin/propylene oxide ratio, and the catalyst content. The influence of the studied
variables was inspected following the evolution of the homopolymer content, molecular
weight distribution and average-molecular weight, hydroxyl number, viscosity and glass
transition temperature. The optimal oxypropylation conditions were fixed on the basis of
the requirements which a given polyol should fill when used in rigid polyurethane foam
formulations.
Three formulations were chosen and applied to the other lignin samples. The produced
polyols were characterised and their hydroxyl number and viscosity were found to be in
the range of those typical of commercial polyols employed in rigid polyurethane foam
preparation. Two formulations were produced at a large scale and used to produce rigid
polyurethane foams in which the content of lignin-based polyols varied from 25 to 100%
(w/w). The produced lignin-based rigid polyurethane foams were characterised in terms of
their density, morphology, and mechanical and insulating properties.
UTILISATION OF MODIFIED LIGNIN BY OXYPROPYLATION86
4.1 Literature review
Preparation of low-cost polyols from abundant and renewable biomass resources has been
an important subject in polyurethane industry. In this context, simple sugars and other
polyols such as glycerol are commonly oxypropylated. Nevertheless, the scientific interest
to apply oxypropylation to other biomass components appears more lately. Following this
trend, several types of polymeric substrates arising from renewable resources have been
subjected to oxypropylation. Chitin and chitosan (Velasquez-Morales et al., 1998;
Fernandes et al., 2008), lignin (Wu and Glasser, 1984; Gandini et al., 2002; Nadji et al.,
2005), cork (Evtouguina et al., 2000) and sugar beet pulp (Pavier and Gandini, 2000) are
among the examples cited in the literature. The viscous polyols thus obtained showed to be
interesting macromonomers for the synthesis of polyurethanes and polyesters. The
exhibited properties of the corresponding materials were found promising and, in some
cases, similar to those of conventional polymeric materials thus corroborating the interest
to pursue investigations on the exploitation of these alternative biomass resources (Gandini
et al., 2002; Nadji et al., 2005; Fernandes et al., 2008).
More recently, cellulose fibres and starch granulates were subjected to a partial
oxypropylation reaction. In this case, the objective was not to obtain liquid polyols to be
exploited as a reactive component in polymer synthesis but, instead to produce self-
reinforced composites after hot pressing. This approach showed to be a promising
alternative to other procedures that often require several steps and include the use of
solvents (Gandini et al., 2005 and 2007).
4.1.1 Lignin oxypropylation
In which regards lignin, oxypropylation has been recognised as the most viable and
promising approach to overcome the technical limitations and constrains imposed by lignin
polymeric nature when directly used as a macromonomer for synthesis purposes. By means
of oxypropylation, the hydroxyl groups, in particular the phenolic ones entrapped inside
the molecule and of difficult access, are liberated from steric and/or electronic constrains
and, at the same time, the solid lignin becomes a liquid polyol, thanks to the introduction
of multiple ether moieties.
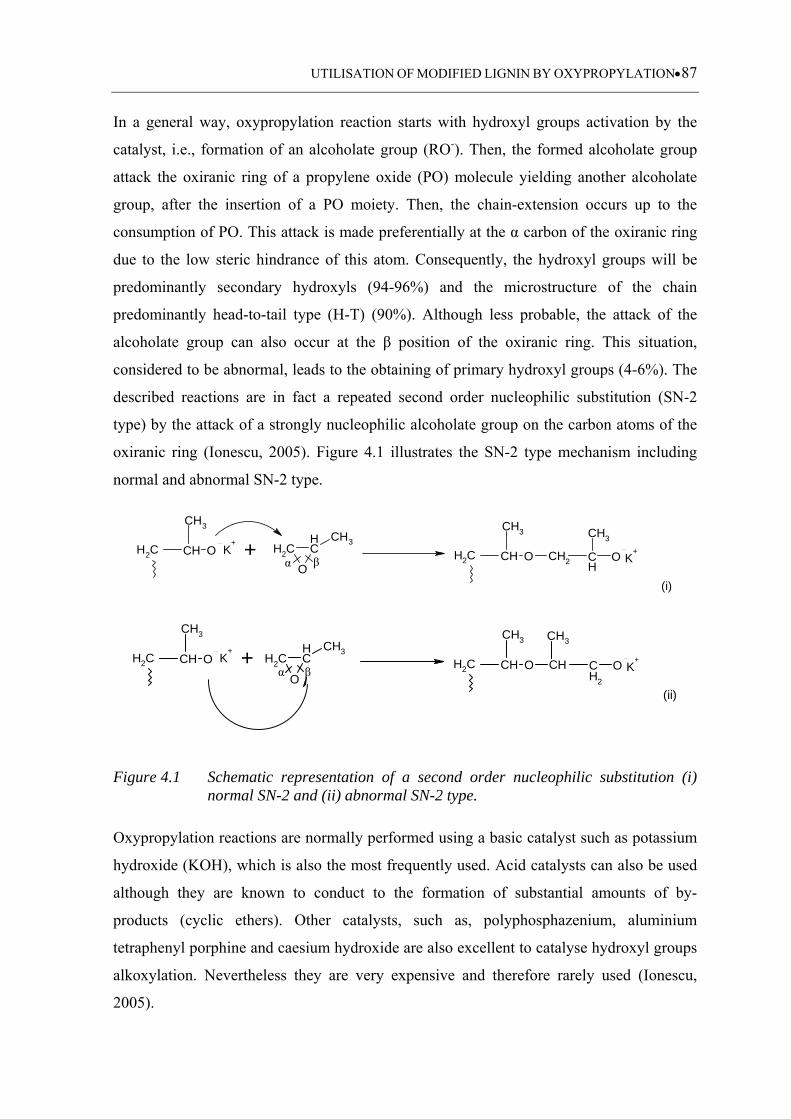
UTILISATION OF MODIFIED LIGNIN BY OXYPROPYLATION87
In a general way, oxypropylation reaction starts with hydroxyl groups activation by the
catalyst, i.e., formation of an alcoholate group (RO-). Then, the formed alcoholate group
attack the oxiranic ring of a propylene oxide (PO) molecule yielding another alcoholate
group, after the insertion of a PO moiety. Then, the chain-extension occurs up to the
consumption of PO. This attack is made preferentially at the α carbon of the oxiranic ring
due to the low steric hindrance of this atom. Consequently, the hydroxyl groups will be
predominantly secondary hydroxyls (94-96%) and the microstructure of the chain
predominantly head-to-tail type (H-T) (90%). Although less probable, the attack of the
alcoholate group can also occur at the β position of the oxiranic ring. This situation,
considered to be abnormal, leads to the obtaining of primary hydroxyl groups (4-6%). The
described reactions are in fact a repeated second order nucleophilic substitution (SN-2
type) by the attack of a strongly nucleophilic alcoholate group on the carbon atoms of the
oxiranic ring (Ionescu, 2005). Figure 4.1 illustrates the SN-2 type mechanism including
normal and abnormal SN-2 type.
H2C CH O
CH3
K+
CH2
O
CH CH3
H2C CH O CH2
CH3
CH
CH3
O K++
(i)
α β
H2C CH O
CH3
K+
H2C CH O CH
CH3
CH2
O K+
CH3
CH2
O
CH CH3+
(ii)
α β
Figure 4.1 Schematic representation of a second order nucleophilic substitution (i) normal SN-2 and (ii) abnormal SN-2 type.
Oxypropylation reactions are normally performed using a basic catalyst such as potassium
hydroxide (KOH), which is also the most frequently used. Acid catalysts can also be used
although they are known to conduct to the formation of substantial amounts of by-
products (cyclic ethers). Other catalysts, such as, polyphosphazenium, aluminium
tetraphenyl porphine and caesium hydroxide are also excellent to catalyse hydroxyl groups
alkoxylation. Nevertheless they are very expensive and therefore rarely used (Ionescu,
2005).
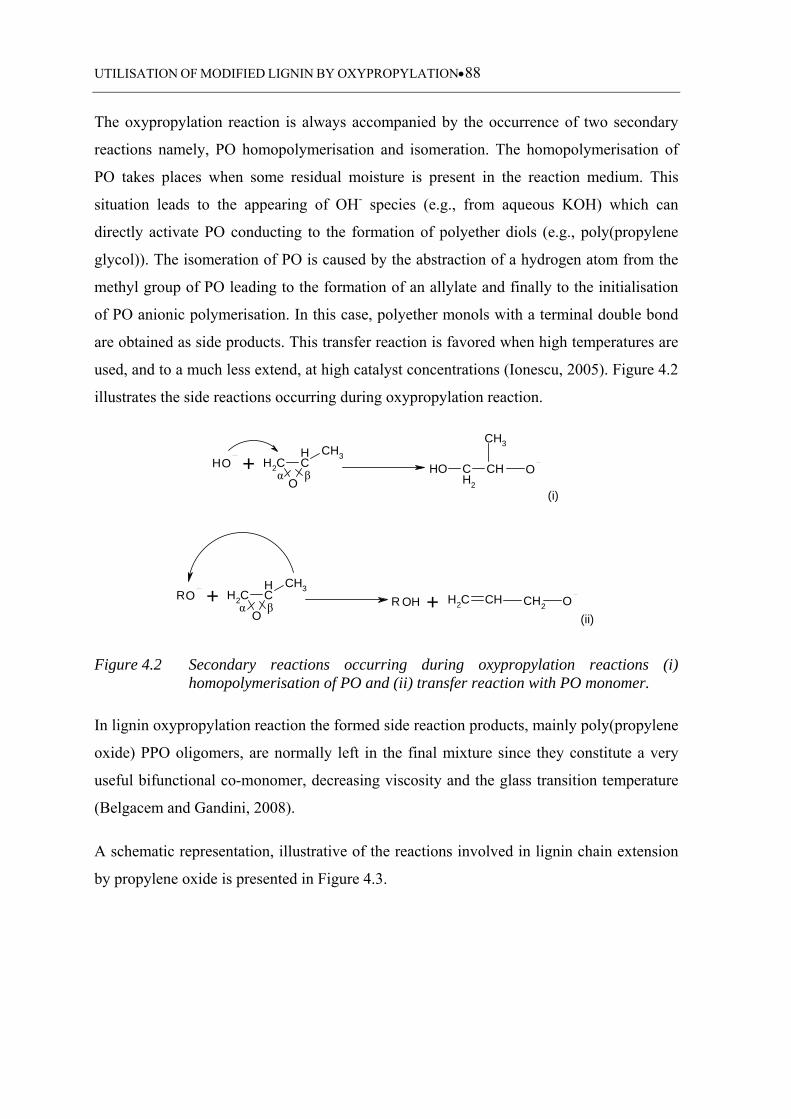
UTILISATION OF MODIFIED LIGNIN BY OXYPROPYLATION88
The oxypropylation reaction is always accompanied by the occurrence of two secondary
reactions namely, PO homopolymerisation and isomeration. The homopolymerisation of
PO takes places when some residual moisture is present in the reaction medium. This
situation leads to the appearing of OH- species (e.g., from aqueous KOH) which can
directly activate PO conducting to the formation of polyether diols (e.g., poly(propylene
glycol)). The isomeration of PO is caused by the abstraction of a hydrogen atom from the
methyl group of PO leading to the formation of an allylate and finally to the initialisation
of PO anionic polymerisation. In this case, polyether monols with a terminal double bond
are obtained as side products. This transfer reaction is favored when high temperatures are
used, and to a much less extend, at high catalyst concentrations (Ionescu, 2005). Figure 4.2
illustrates the side reactions occurring during oxypropylation reaction.
H CH2
O
CH CH3
OH CH2
CHO
CH3
O+(i)
α β
R CH2
O
CH CH3
CH2 CHO OH CH2 O+(ii)
R +α β
Figure 4.2 Secondary reactions occurring during oxypropylation reactions (i) homopolymerisation of PO and (ii) transfer reaction with PO monomer.
In lignin oxypropylation reaction the formed side reaction products, mainly poly(propylene
oxide) PPO oligomers, are normally left in the final mixture since they constitute a very
useful bifunctional co-monomer, decreasing viscosity and the glass transition temperature
(Belgacem and Gandini, 2008).
A schematic representation, illustrative of the reactions involved in lignin chain extension
by propylene oxide is presented in Figure 4.3.
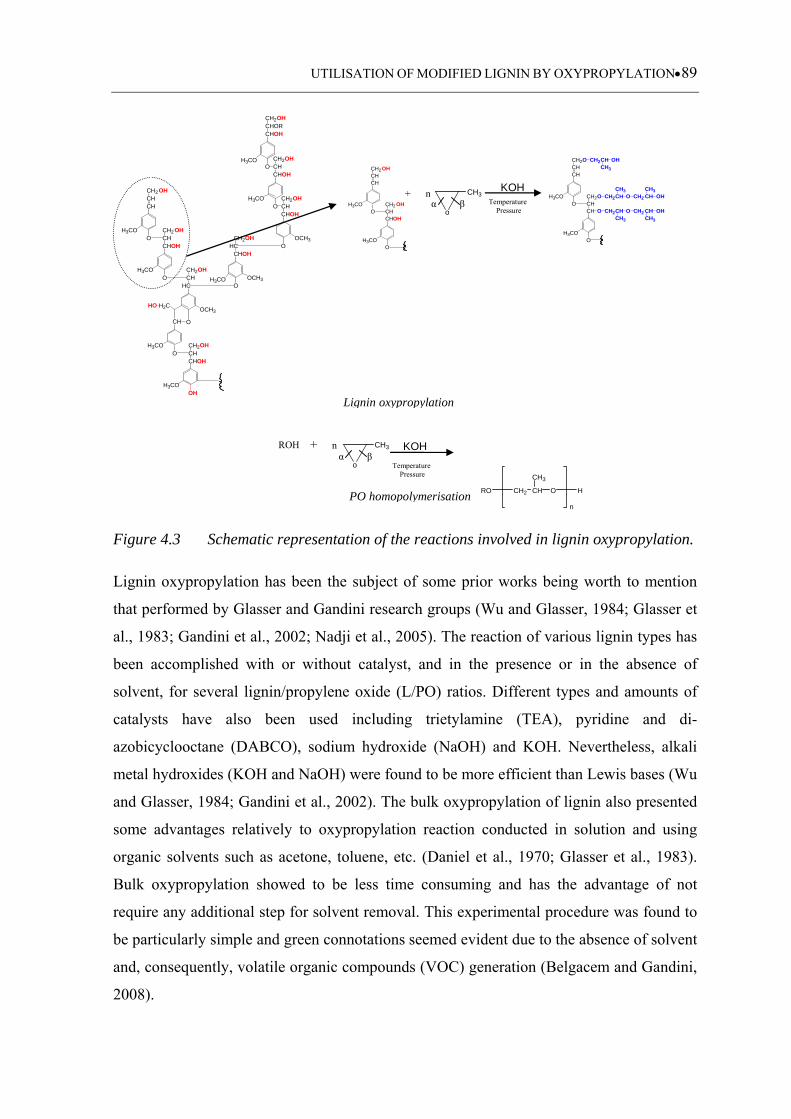
UTILISATION OF MODIFIED LIGNIN BY OXYPROPYLATION89
CHOHCHORCH2OH
H3COO CH
CH2OH
CHOH
H3COO CH
CH2OH
CHOH
OCH3
OHCCH2OH
CHOH
OCH3H3COOHC
CHCH2OH
OH3CO
CHOHCHCH2
OH3CO
CHCHCH2
OCH3H2C
CH O
H3COO CH
CH2OH
CHOH
H3COOH
OH
OH
HO
OH3CO
CHOHCHCH2
OH3CO
CHCHCH2 OH
OH
OH3CO
CH O CH2CHCH3
OCHCH2O CH2CH
CH3O
OH3CO
CHCHCH2O CH2CH
CH3
OH
CH2 CHCH3
OH
CH2 CHCH3
OH
KOHTemperature
Pressure
+ n
Lignin oxypropylation
o
CH3
α β
PO homopolymerisation
o
CH3
α β + n KOH
Temperature Pressure
ROH
Figure 4.3 Schematic representation of the reactions involved in lignin oxypropylation.
Lignin oxypropylation has been the subject of some prior works being worth to mention
that performed by Glasser and Gandini research groups (Wu and Glasser, 1984; Glasser et
al., 1983; Gandini et al., 2002; Nadji et al., 2005). The reaction of various lignin types has
been accomplished with or without catalyst, and in the presence or in the absence of
solvent, for several lignin/propylene oxide (L/PO) ratios. Different types and amounts of
catalysts have also been used including trietylamine (TEA), pyridine and di-
azobicyclooctane (DABCO), sodium hydroxide (NaOH) and KOH. Nevertheless, alkali
metal hydroxides (KOH and NaOH) were found to be more efficient than Lewis bases (Wu
and Glasser, 1984; Gandini et al., 2002). The bulk oxypropylation of lignin also presented
some advantages relatively to oxypropylation reaction conducted in solution and using
organic solvents such as acetone, toluene, etc. (Daniel et al., 1970; Glasser et al., 1983).
Bulk oxypropylation showed to be less time consuming and has the advantage of not
require any additional step for solvent removal. This experimental procedure was found to
be particularly simple and green connotations seemed evident due to the absence of solvent
and, consequently, volatile organic compounds (VOC) generation (Belgacem and Gandini,
2008).
RO CH2 CH
CH3
O
n
H
UTILISATION OF MODIFIED LIGNIN BY OXYPROPYLATION90
A common pattern among the documented experiments is related to the presence of
insoluble fractions that can arise either from the chosen operating conditions or from the
complex nature of lignin itself. According to the work performed by Glasser’s research
group, the utilisation of very high temperatures and pressures can cause self-condensation
of lignin leading to the appearing of insoluble fractions. The utilisation of low
temperatures, more particularly temperatures inferiors to the glass transition temperature
(Tg) of the original lignin, conducted to an inefficient chain extension reaction (Wu and
Glasser, 1984).
The completion of lignin chain extension reaction is also influenced by lignin botanic
origin and the applied extraction processes, as demonstrated by the work of Gandini’s
research group who subjected a variety of lignin types including, hardwood organosolv
lignin, non-wood lignin from soda pulping, oxygen organosolv softwood lignin and
softwood kraft lignin, to an oxypropylation procedure (Gandini et al., 2002; Nadji et al.,
2005). This systematic study indicated that lignins with a low molecular weight and high
purity (hardwood organosolv lignins and non-wood lignins from soda pulping) reacted
more readily towards PO than lignins presenting a high molecular weight and considerable
amounts of carbonyl and carboxyl groups (oxygen organosolv softwood lignin and
softwood kraft lignin).
Although the research made in this field and the generated knowledge no industrial
processes to produce lignin-based polyols were implemented until now. This situation is
greatly caused by lignin heterogeneity, the possible obtaining of insoluble fraction and the
operating conditions that often require high temperatures and pressures rendering the
process, from the energetic point of view, less attractive. Furthermore, a lack of
information concerning a systematic study of lignin oxypropylation reaction still remains.
Optimizing the formulation, having in view the desired polyol properties, will provide a
valuable tool to tailor-made polyols suitable to prepare polymeric materials, in general, and
polyurethane products, in particular.
The studies devoted to the incorporation of lignin-based polyols in polymeric materials are
mainly focused on the synthesis of rigid polyurethane (RPU) foams. This tendency is a
result of the high functionality normally associated to lignin-based polyols making them
ideal for that purpose (Gandini et al., 2002; Nadji et al., 2005). Nevertheless, Glasser’s
UTILISATION OF MODIFIED LIGNIN BY OXYPROPYLATION91
research group performed a series of studies related to the use of lignin-based polyols in
the production of a wide range of materials, others than polyurethane foams. These
included polyurethane films, coatings and epoxy resins, as well as, the designed multiphase
materials which comprised polymer blends (lignin-based polyols with poly(methyl
methacrylate), poly(vinyl alcohol) and hydroxypropyl cellulose) and composite materials.
The performed study resulted in a series of scientific articles and some patented works and,
remains until date, as one of the most relevant contributions to the application of lignin in
the synthesis of polymeric materials (Glasser et al., 1984; Saraf et al., 1985; Ciemniecki
and Glasser, 1988; Glasser et al., 1990; Glasser et al., 1991; Hofmann and Glasser, 1993;
Oliveira and Glasser, 1994a; 1994b). It was in fact quite thorough since, besides the direct
utilisation of lignin-based polyols, several other approaches were attempted, namely (i) the
combination of lignin-based polyols with poly(ethylene glycol) (PEG) of different
molecular weights and polybutadiene diols, (ii) the capping of hydroxyl groups with
ethylene oxide to convert secondary hydroxyl groups into primary ones and (iii) the
utilisation of lignin-based polyols after further chemical modification. In the latter case,
oxypropylated lignins were subjected to additional chemical modification including: (i)
chain extension reaction with PO directly or after partial blockage of hydroxyl groups by
ethylation and (ii) chain extension by anionic polymerisation with ε-caprolactone. The
main objective was either to make polyols more suitable for the synthesis of certain
polymeric materials or to improve the properties of the lignin-based materials when using
exclusively oxypropylated lignin. In all cases, a thorough structural characterisation and
evaluation of physical and technological properties of modified lignins and the ensuing
materials was performed. The properties of these materials were thereafter evaluated and
possible applications were proposed based on its specific performances.
More recently, kurple (2000) presented a patent describing a process of obtaining lignin-
based polyols through alkylation reaction with both propylene oxide and ethylene oxide to
produce polyols suitable for the synthesis of RPU foams, as well as for other polyurethane
materials.
4.1.2 Rigid polyurethane foams
Rigid polyurethane foams represent a highly versatile and commercially important class of
expanded materials. This is greatly owned to their outstanding thermal insulating
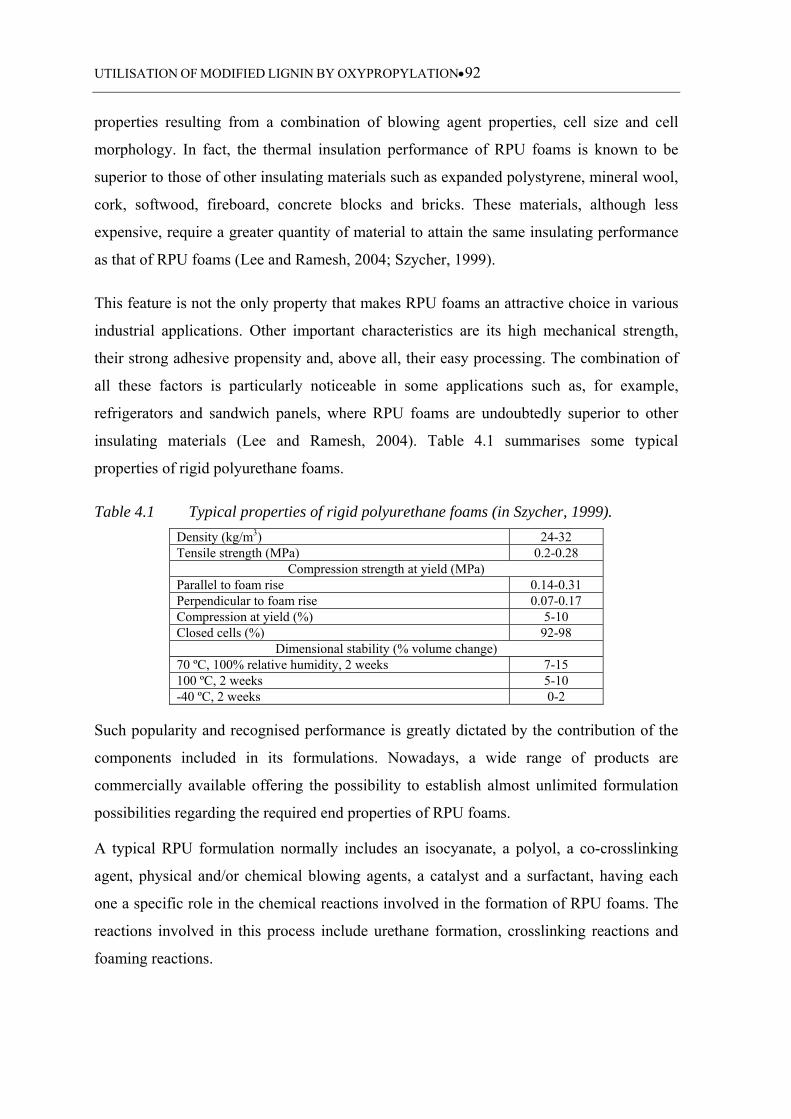
UTILISATION OF MODIFIED LIGNIN BY OXYPROPYLATION92
properties resulting from a combination of blowing agent properties, cell size and cell
morphology. In fact, the thermal insulation performance of RPU foams is known to be
superior to those of other insulating materials such as expanded polystyrene, mineral wool,
cork, softwood, fireboard, concrete blocks and bricks. These materials, although less
expensive, require a greater quantity of material to attain the same insulating performance
as that of RPU foams (Lee and Ramesh, 2004; Szycher, 1999).
This feature is not the only property that makes RPU foams an attractive choice in various
industrial applications. Other important characteristics are its high mechanical strength,
their strong adhesive propensity and, above all, their easy processing. The combination of
all these factors is particularly noticeable in some applications such as, for example,
refrigerators and sandwich panels, where RPU foams are undoubtedly superior to other
insulating materials (Lee and Ramesh, 2004). Table 4.1 summarises some typical
properties of rigid polyurethane foams.
Table 4.1 Typical properties of rigid polyurethane foams (in Szycher, 1999).
Density (kg/m3) 24-32 Tensile strength (MPa) 0.2-0.28
Compression strength at yield (MPa) Parallel to foam rise 0.14-0.31 Perpendicular to foam rise 0.07-0.17 Compression at yield (%) 5-10 Closed cells (%) 92-98
Dimensional stability (% volume change) 70 ºC, 100% relative humidity, 2 weeks 7-15 100 ºC, 2 weeks 5-10 -40 ºC, 2 weeks 0-2
Such popularity and recognised performance is greatly dictated by the contribution of the
components included in its formulations. Nowadays, a wide range of products are
commercially available offering the possibility to establish almost unlimited formulation
possibilities regarding the required end properties of RPU foams.
A typical RPU formulation normally includes an isocyanate, a polyol, a co-crosslinking
agent, physical and/or chemical blowing agents, a catalyst and a surfactant, having each
one a specific role in the chemical reactions involved in the formation of RPU foams. The
reactions involved in this process include urethane formation, crosslinking reactions and
foaming reactions.
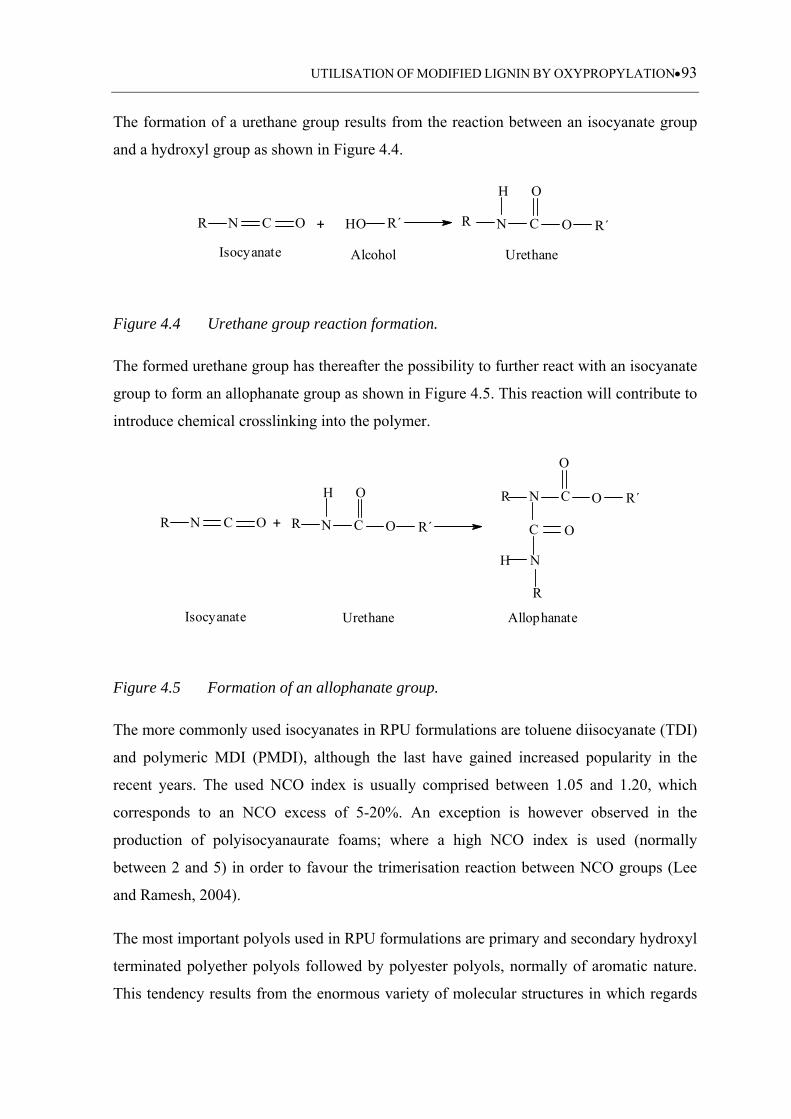
UTILISATION OF MODIFIED LIGNIN BY OXYPROPYLATION93
The formation of a urethane group results from the reaction between an isocyanate group
and a hydroxyl group as shown in Figure 4.4.
Urethane Alcohol
O
C
H
NRR´HO+ O R´
Isocyanate
R N C O
Figure 4.4 Urethane group reaction formation.
The formed urethane group has thereafter the possibility to further react with an isocyanate
group to form an allophanate group as shown in Figure 4.5. This reaction will contribute to
introduce chemical crosslinking into the polymer.
Allophanate
O
O
R´OCR
R
H N
N
C
Urethane
O
C
H
NR O R´+
Isocyanate
R N C O
Figure 4.5 Formation of an allophanate group.
The more commonly used isocyanates in RPU formulations are toluene diisocyanate (TDI)
and polymeric MDI (PMDI), although the last have gained increased popularity in the
recent years. The used NCO index is usually comprised between 1.05 and 1.20, which
corresponds to an NCO excess of 5-20%. An exception is however observed in the
production of polyisocyanaurate foams; where a high NCO index is used (normally
between 2 and 5) in order to favour the trimerisation reaction between NCO groups (Lee
and Ramesh, 2004).
The most important polyols used in RPU formulations are primary and secondary hydroxyl
terminated polyether polyols followed by polyester polyols, normally of aromatic nature.
This tendency results from the enormous variety of molecular structures in which regards
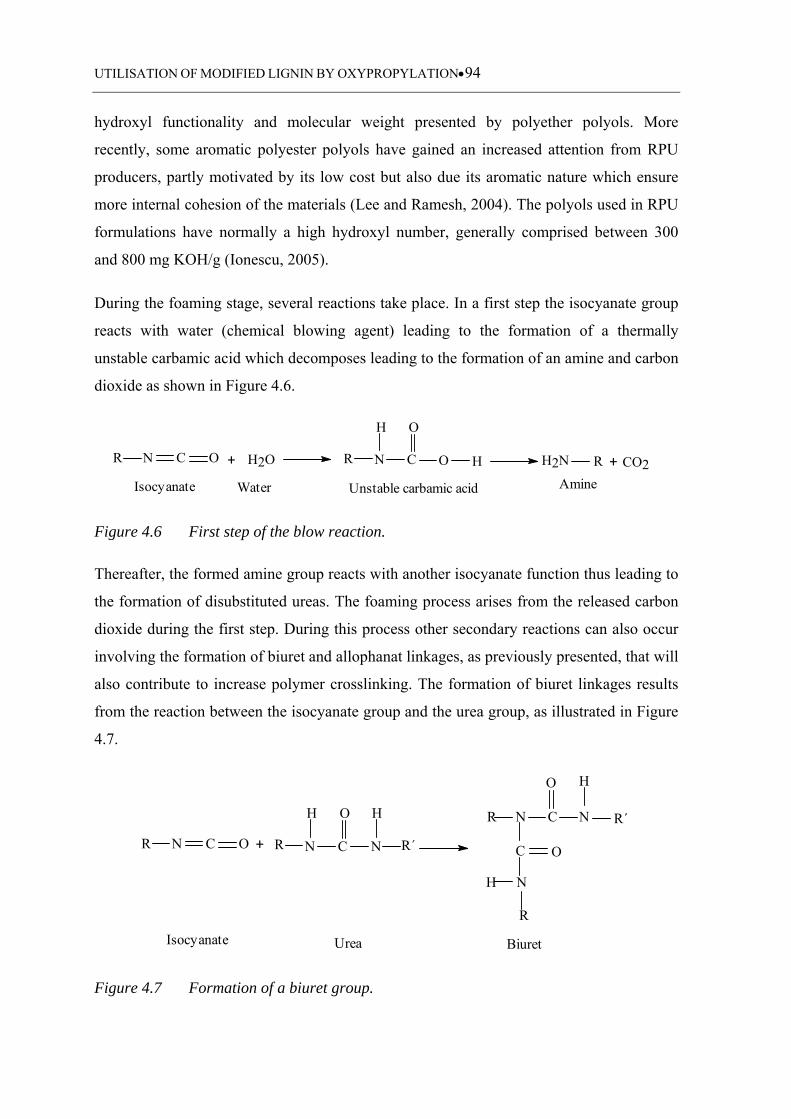
UTILISATION OF MODIFIED LIGNIN BY OXYPROPYLATION94
hydroxyl functionality and molecular weight presented by polyether polyols. More
recently, some aromatic polyester polyols have gained an increased attention from RPU
producers, partly motivated by its low cost but also due its aromatic nature which ensure
more internal cohesion of the materials (Lee and Ramesh, 2004). The polyols used in RPU
formulations have normally a high hydroxyl number, generally comprised between 300
and 800 mg KOH/g (Ionescu, 2005).
During the foaming stage, several reactions take place. In a first step the isocyanate group
reacts with water (chemical blowing agent) leading to the formation of a thermally
unstable carbamic acid which decomposes leading to the formation of an amine and carbon
dioxide as shown in Figure 4.6.
Water
R N
H
C
O
+ H2O O H
Unstable carbamic acid
R + CO2AmineIsocyanate
R N C O H2N
Figure 4.6 First step of the blow reaction.
Thereafter, the formed amine group reacts with another isocyanate function thus leading to
the formation of disubstituted ureas. The foaming process arises from the released carbon
dioxide during the first step. During this process other secondary reactions can also occur
involving the formation of biuret and allophanat linkages, as previously presented, that will
also contribute to increase polymer crosslinking. The formation of biuret linkages results
from the reaction between the isocyanate group and the urea group, as illustrated in Figure
4.7.
O
O
R´CR
R
H N
N
C
O
C
H
NR R´+
Isocyanate
R N C O N
H N
H
BiuretUrea
Figure 4.7 Formation of a biuret group.
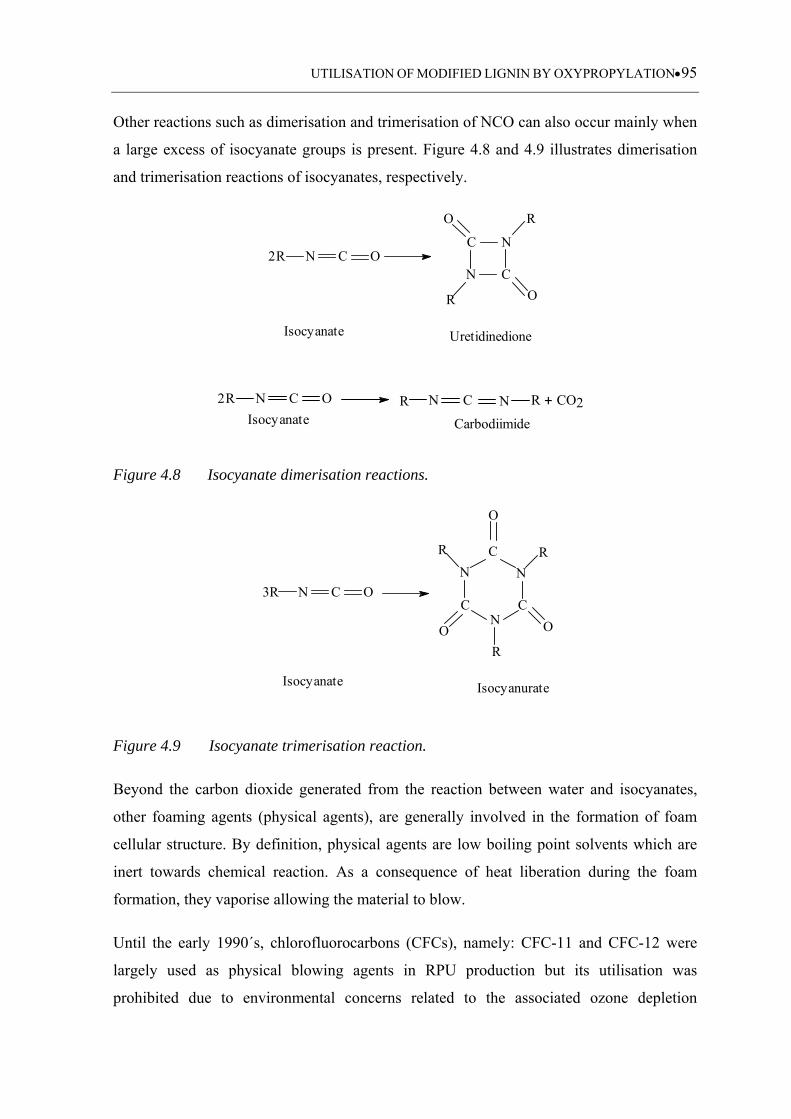
UTILISATION OF MODIFIED LIGNIN BY OXYPROPYLATION95
Other reactions such as dimerisation and trimerisation of NCO can also occur mainly when
a large excess of isocyanate groups is present. Figure 4.8 and 4.9 illustrates dimerisation
and trimerisation reactions of isocyanates, respectively.
Isocyanate
OCNRC N
N C
RO
OR
2
Uretidinedione
OCNR2 R N C N R + CO2Isocyanate Carbodiimide
Figure 4.8 Isocyanate dimerisation reactions.
Isocyanate
3R N C O
C
N N
RR
C C
O
ON
R
O
Isocyanurate
Figure 4.9 Isocyanate trimerisation reaction.
Beyond the carbon dioxide generated from the reaction between water and isocyanates,
other foaming agents (physical agents), are generally involved in the formation of foam
cellular structure. By definition, physical agents are low boiling point solvents which are
inert towards chemical reaction. As a consequence of heat liberation during the foam
formation, they vaporise allowing the material to blow.
Until the early 1990´s, chlorofluorocarbons (CFCs), namely: CFC-11 and CFC-12 were
largely used as physical blowing agents in RPU production but its utilisation was
prohibited due to environmental concerns related to the associated ozone depletion
UTILISATION OF MODIFIED LIGNIN BY OXYPROPYLATION96
potential. Later, hydrochlorofluorcarbons (HCFCs), namely HCFC-141b, HCFC-22,
HCFC-142b and HCFC-124 were chosen to replace CFCs because they possess similar
performance and processing characteristics, and offer lower impact on ozone depletion
(approximately between 2-10% of that of CFCs). Nevertheless, this is still a transitory
option and, from 2003 till 2020, starting with HCFC-141b and finishing with HCFC-124,
the utilisation of HCFC should be completely banned (Lee and Ramesh, 2004). Thus, the
utilisation of several hydrofluorocarbons (HFCs) and hydrocarbons such as pentane are
being evaluated and considered as suitable alternatives to the use of CFCs (Fleurent and
Thijs, 1995; Lee and Ramesh, 2004; Kim et al., 2007). The studies of alternative physical
blowing agents constitute one of the most relevant subjects for RPU foams researchers and
industrial sector.
The choice of an adequate catalyst or combination of catalysts, as well as the amount to be
used is of crucial importance in order to control chemical reaction and thus originating
foams with a stable cellular structure and good physical properties. Two major classes of
catalysts are normally used, namely tertiary amines such as dimethylcyclohexylamine
(DMCHA) and di-azobicyclooctane (DABCO); and organometallic catalysts such as
dibutyltin dilaurate (DBTDL) or bismuth octanoate although the latter ones are less used
(Lee and Ramesh, 2004). Organometallic catalysts are known to favour urethane formation
while amine catalysts can catalyse crosslinking and foaming reactions (Szycher, 1999).
The catalytic activity of tertiary amines depends on its structure and basicity. In a general
way, its catalytic activity increases with increasing basicity but is reduced by the steric
hindrance of the aminic nitrogen (Woods, 1990).
Surfactants present several functions along the process of foam formation, namely: (i)
reduction of surface tension, (ii) emulsification of reactive mixture components, (iii)
promotion of bubble nucleation during mixing and (iv) stabilisation of cell walls during
foam expansion. Currently, the most commonly used surfactants in RPU foams synthesis
are polydimethyl siloxane-polyether copolymers (Szycher, 1999; Lee and Ramesh, 2004).
The crosslinking of RPU foams can also be adjusted by introducing co-crosslinking agents
into the formulation. These are usually low molecular weight compounds and can be
classified either as hydroxyl-terminated or amine-terminated. Some of the most employed
are glycerol, trimethanol propane, glycols, and diamine compounds (Szycher, 1999).
UTILISATION OF MODIFIED LIGNIN BY OXYPROPYLATION97
Additives can be added to improve foam properties. For such purpose a wide range of
compounds could be used including, air, inert gases, dyes and pigments, plasticizers, flame
retardants, synthetic fibres, organic and inert fillers among others (Szycher, 1999). Lignin
has also been used for such purpose, more concretely as filler or, from a more realistic
point of view, as reactive filler. Lignin participation in the polymerisation reaction has
been detected through the reaction of some surface hydroxyl groups (Gandini et al., 2002;
Nakamura et al., 1989).
Most of the work dedicated to the incorporation of oxypropylated lignins into RPU foams
has been performed by Gandini’s research group. The produced RPU foams were found to
have insulating properties, dimensional stability and an accelerated ageing behaviour very
similar to those prepared with commercial counterparts (Gandini et al., 2002; Nadji et al.,
2005). Glasser’s research group have also conducted some studies devoted to the use of
lignin-based polyols in the synthesis of RPU foams. Among others, their studies were
mainly concerned with the study of flame resistance properties of the resulting cellular
materials (Glasser and Leitheiser, 1984).
4.2 Materials and Methods
4.2.1 Lignin oxypropylation reaction
4.2.1.1 Starting materials
Oxypropylation reaction was carried out using the four technical lignins (Alcell, Sarkanda,
Indulin AT and Curan 27-11P) presented and characterised in chapter 3. The used
chemicals, propylene oxide and potassium hydroxide, were commercial products of
standard purity.
4.2.1.2 Oxypropylation reaction conditions
The oxypropylation reaction was carried out in bulk using a 450 mL Parr reactor equipped
with a heating mantle, mechanical stirrer, thermocouple and manometer. The desired
amount of the chosen lignin, propylene oxide and the catalyst (KOH in the form of
commercial pellets) were placed into the reactor that was thereafter closed and heated
under stirring till 160 ºC. From this initial state, pressure and temperature started to
UTILISATION OF MODIFIED LIGNIN BY OXYPROPYLATION98
increase progressively until a maximum value which depended on the amount of catalyst
and L/PO ratio. After reaching a maximum (Pmax), the pressure decreased rapidly (within 1
to 3 minutes) reflecting the propylene oxide consumption. When the relative pressure
(Prelative) reached zero, the reactor was cooled under stirring and the ensuing polyols
recovered. At this point (Prelative=0) the maximum temperature was reached (Tmax). Before
oxypropylation, lignins were left overnight in a dessicator. Experiments were made at a
scale of approximately 100 g. The traces of PO were removed by placing the obtained
lignin-based polyols in an oven under vacuum at 40 ºC.
The following terminology will be used to identify samples: L/PO/C (ratio between
lignin, PO and catalyst content). For example, 10/90/3 means a sample with a L/PO
ratio of 10/90 (w/v) and a catalyst content of 3% (w/w).
4.2.1.3 Characterisation of oxypropylated lignins
Oxypropylated lignins have been characterised by FTIR, 13C- and 1H-NMR and SEC.
Moreover, homopolymer content, hydroxyl number, viscosity, and glass transition
temperature have been determined.
Fourier transform infrared spectroscopy (FTIR) analysis
FTIR spectra were collected on a FTIR BOMEN (model MB 104) in transmittance
mode using NaCl crystals. Spectra were recorded between 650 and 4000 cm-1 at a
resolution of 4 cm-1 and co-adding forty eight scans.
NMR measurements
The acquisition of 13C-NMR and 1H-NMR spectra was performed according to the
procedures presented in Chapter 3 section 3.2.11.
Homopolymer content determination
Homopolymer content was determined by extracting twice the polyol mixture with hexane
under reflux, according to the procedure described by Pavier and Gandini (2000). The
recovered fractions (oxypropylated lignin and homopolymer) were subsequently vacuum-
dried and placed in an oven until a constant weight was achieved.
Size exclusion chromatography (SEC) measurements
Molecular weight distribution (MWD) and average-molecular weights ( nM and WM )
UTILISATION OF MODIFIED LIGNIN BY OXYPROPYLATION99
were determined by size exclusion chromatography on a system consisting of three PLgel
10µm MIXED-BLS columns (300×7.5 mm) and a pre-column connected in series.
Stabilised tetrahydrofuran (THF with BHT) was used as the mobile phase and samples
were prepared at a concentration of 4 mg/mL. Analyses were carried out at 30 ºC at a flow
rate of 1mL/min. Calibration was performed based on polystyrene standards (7500000,
2560000, 841700, 320000, 148000, 59500, 28500, 9920, 2930, 580 g/mol) plus toluene
(92.14 g/mol). Calculations were made using the Cirrus GPC/SEC software from Polymer
Laboratory (PL). The determined average-molecular weights must be regarded as apparent
and not as absolute values.
Hydroxyl number (IOH) determination
Hydroxyl number was determined according to the ASTM D1638 standard. The polyol
sample and the blank were refluxed during 1 hour at 115 ºC in 25 mL of a phthalation
reagent solution. The phthalation reagent was routinely prepared in the day before
analysis by mixing 140 g of phthalic anhydride and 2 L of pyridine. After the reflux
period, the flasks were left to cool at room temperature before adding 50 mL of
pyrydine. Then, the mixture was back titrated with a solution of sodium hydroxide (0.5
N). The difference between the NaOH volume required for the titration of the blank
and that required for the polyol sample allowed the determination of the hydroxyl
number. The titrations were carried out in an automatic titrator (Methrom 736 GP
Titrino) equipped with a glass electrode. Sample size was adjusted in such a way that
the difference between the volume used for polyol and blank titrations was 13 ± 2 mL.
Hydroxyl number, in mg of KOH/g, was determined according to equation 4.1.
Hydroxyl number
W
CVV 1.5621 (4.1)
where:
1V - is the NaOH volume required for blank titration, in mL
2V - is the NaOH volume required for polyol sample titration, in mL
C - is the NaOH concentration, in mol/L
W - is the polyol weight, in g
UTILISATION OF MODIFIED LIGNIN BY OXYPROPYLATION100
If samples present acidity or alkalinity the hydroxyl number needs to be corrected. For that
purpose, the polyol sample was weighted (10 g) into an erlemeyer and 50 mL of a
ethanol:water solution ((1:1 (v/v)) added. The mixture was stirred until the polyol sample
was completely dissolved and the pH measured. If a basic pH was registered, the solution
was titrated with a 0.1 N HCl solution. On the contrary, if an acidic pH was detected the
solution was titrated with a 0.1 N NaOH solution. Acidity or alkalinity in mg of KOH/g
was determined according to equation 4.2.
W
CVAlkalinityAcidity
1.56/ 1
(4.2)
where:
1V - is the HCl or NaOH volume required for sample titration, in mL
C - is the HCl or NaOH concentration, in mol/L
W - is the polyol weight, in g
The corrected hydroxyl number was calculated using the expressions 4.3 and 4.4 if
alkalinity or acidity was, respectively, detected.
Corrected hydroxyl number = Determined hydroxyl number + acidity (4.3)
Corrected hydroxyl number = Determined hydroxyl number - alkalinity (4.4)
Viscosity (µ) measurements
Viscosity was measured at 20 ºC with a cone-plate Carri-Med Rheometer CSL2 from TA
Instruments in a stress-controlled mode, using a 2 cm diameter and 4º top-angle cone. For
high viscous polyols, like the ones corresponding to the series with L/PO ratios of 40/60
(w/v) the Eyring equation (Equation 4.5) was applied to determine the viscosity value.
Viscosity was measured at various temperatures and a linear fit (linearisation of the Eyring
equation) enabled the determination of viscosity values at 20 ºC.
RT
EA Aexp (4.5)
UTILISATION OF MODIFIED LIGNIN BY OXYPROPYLATION101
where:
- is the viscosity, in Pa.s
A - is a constant
AE - is the activation energy, in KJ/mol
R - is the molar gas constant, in J.K-1.mol-1
T - is the temperature, in K
Differential scanning calorimetry (DSC) analysis
The DSC experiments were conducted on a Q100 DSC from TA Instruments at a scanning
rate of 10 ºC/min and under nitrogen atmosphere (50 mL/min). A sample of approximately
5 mg of polyol was weighted and encapsulated into an aluminium pan. An empty
aluminium pan was used as a reference. Analyses were carried out from -140 to 200 ºC and
the data were analysed using the TA Instruments’ Thermal Advantage Software. The glass
transition temperature was determined as described in Chapter 3 section 3.2.11.2.
4.2.2 Rigid polyurethane foams preparation
4.2.2.1 Starting materials
The lignin-based polyols used in the synthesis of RPU foams were obtained from the
oxypropylation of the four technical lignins as previously described in section 4.2.1.2. The
commercial polyether polyol (Lupranol® 3323), polymeric 4,4’-methylene-diphenylene
diisocyanate (PMDI), silicone surfactant (SR-321 NIAX) and the catalysts
bis(dimethylaminoethyl)ether (NIAX) and dimethylcyclohexylamine (DMCHA) were
kindly supplied by Elastogran-BASF (France). Glycerol and n-pentane were commercial
products. Glycerol was introduced in the formulation to act as a co-crosslinking agent and
a mixture of the two catalysts was used. It is expected that DMCHA favours the reaction
between water and isocyanate and NIAX the reaction between isocyanate and polyols.
Some representative properties of the products used in RPU foams formulations are
summarised in Table 4.2.
4.2.2.2 Formulation details and preparation
Polyurethane foams were prepared by initially mixing, during 1 minute, the polyol or
polyol mixture in combination with glycerol (10%, w/w), the surfactant (2%, w/w), water
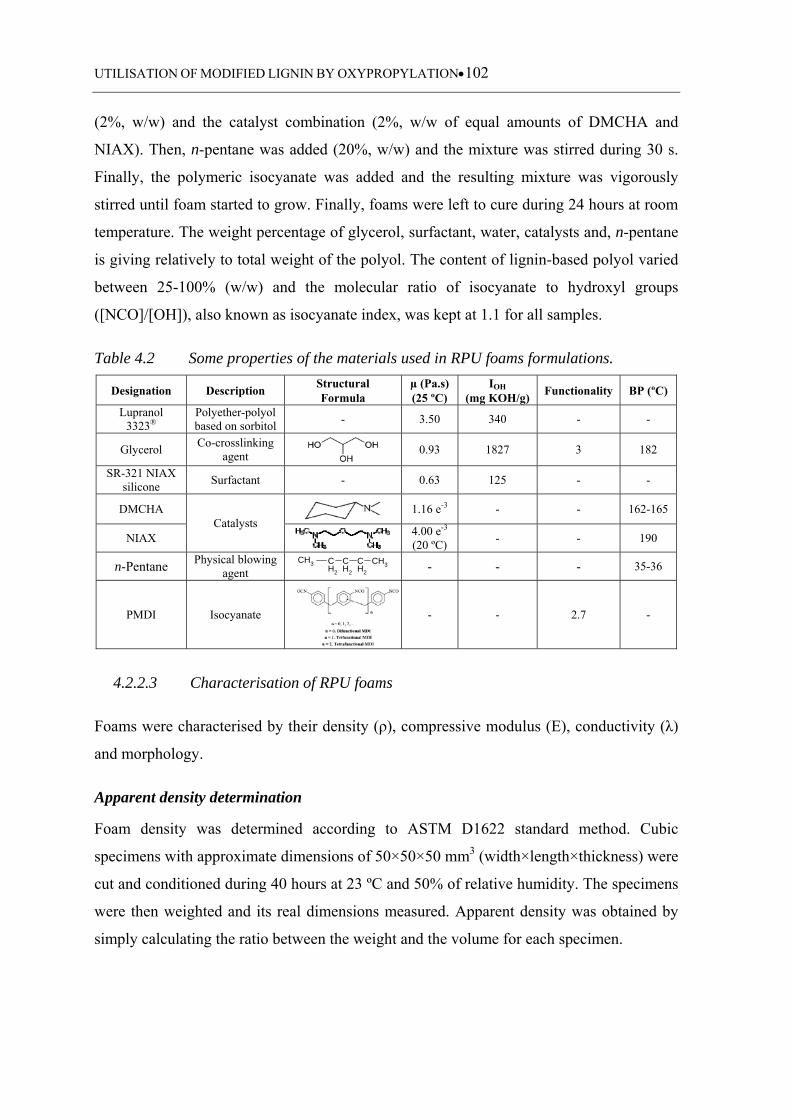
UTILISATION OF MODIFIED LIGNIN BY OXYPROPYLATION102
(2%, w/w) and the catalyst combination (2%, w/w of equal amounts of DMCHA and
NIAX). Then, n-pentane was added (20%, w/w) and the mixture was stirred during 30 s.
Finally, the polymeric isocyanate was added and the resulting mixture was vigorously
stirred until foam started to grow. Finally, foams were left to cure during 24 hours at room
temperature. The weight percentage of glycerol, surfactant, water, catalysts and, n-pentane
is giving relatively to total weight of the polyol. The content of lignin-based polyol varied
between 25-100% (w/w) and the molecular ratio of isocyanate to hydroxyl groups
([NCO]/[OH]), also known as isocyanate index, was kept at 1.1 for all samples.
Table 4.2 Some properties of the materials used in RPU foams formulations.
Designation Description Structural Formula
µ (Pa.s) (25 ºC)
IOH (mg KOH/g)
Functionality BP (ºC)
Lupranol 3323®
Polyether-polyol based on sorbitol
- 3.50 340 - -
Glycerol Co-crosslinking
agent 0.93 1827 3 182
SR-321 NIAX silicone
Surfactant - 0.63 125 - -
DMCHA Catalysts
1.16 e-3 - - 162-165
NIAX 4.00 e-3 (20 ºC)
- - 190
n-Pentane Physical blowing
agent CH3 C
H2
CH2
CH2
CH3 - - - 35-36
PMDI Isocyanate - - 2.7 -
4.2.2.3 Characterisation of RPU foams
Foams were characterised by their density (ρ), compressive modulus (E), conductivity (λ)
and morphology.
Apparent density determination
Foam density was determined according to ASTM D1622 standard method. Cubic
specimens with approximate dimensions of 50×50×50 mm3 (width×length×thickness) were
cut and conditioned during 40 hours at 23 ºC and 50% of relative humidity. The specimens
were then weighted and its real dimensions measured. Apparent density was obtained by
simply calculating the ratio between the weight and the volume for each specimen.
UTILISATION OF MODIFIED LIGNIN BY OXYPROPYLATION103
Compression measurements
Compression tests were conducted according to ASTM D1621 standard method. As for
density determination, RPU foams were cut in cubic specimens with dimensions of
50×50×50 mm3 and then conditioned during 40 hours at 23 ºC and 50% of humidity.
Measurements were performed using an Instron instrument (model 4501) in the direction
perpendicular to foam growth. The load was applied at crosshead speed of 5 mm/min until
the specimen was compressed to approximately 15% of its original thickness.
Conductivity measurements
Conductivity measurements were performed according to the described in the ASTM C177
standard method. Specimens with a diameter of 90 mm and thickness of 4 mm were cut
and placed in a prototype developed at LGP2 to measure the thermal conductivity of
insulating materials. This apparatus consists of two plates maintained at different
temperatures. The thermal conductivity of the samples was determined, according to
equation 4.6 (Fourier law) after reaching thermal equilibrium, thus a uniform temperature
gradient thought the sample.
A
lq
2 (4.6)
where:
- is the thermal conductivity, in W/mK
q - is the power, in W
l - is the thickness, in m
A - is the sample area, in m2
- is the temperature differential between the apparatus plates, in K
Morphologic analysis
Morphological studies were performed on a Quanta 200 FEI field emission scanning
electron microscope (SEM). The samples were cut and gold coated before scanning. The
used accelerating voltage was of 12.5 kV. Samples were analysed both in the free-rise
direction and in the perpendicular free-rise direction. Calculations of cell size were
performed using the ImageJ software from Broken Symmetry software.
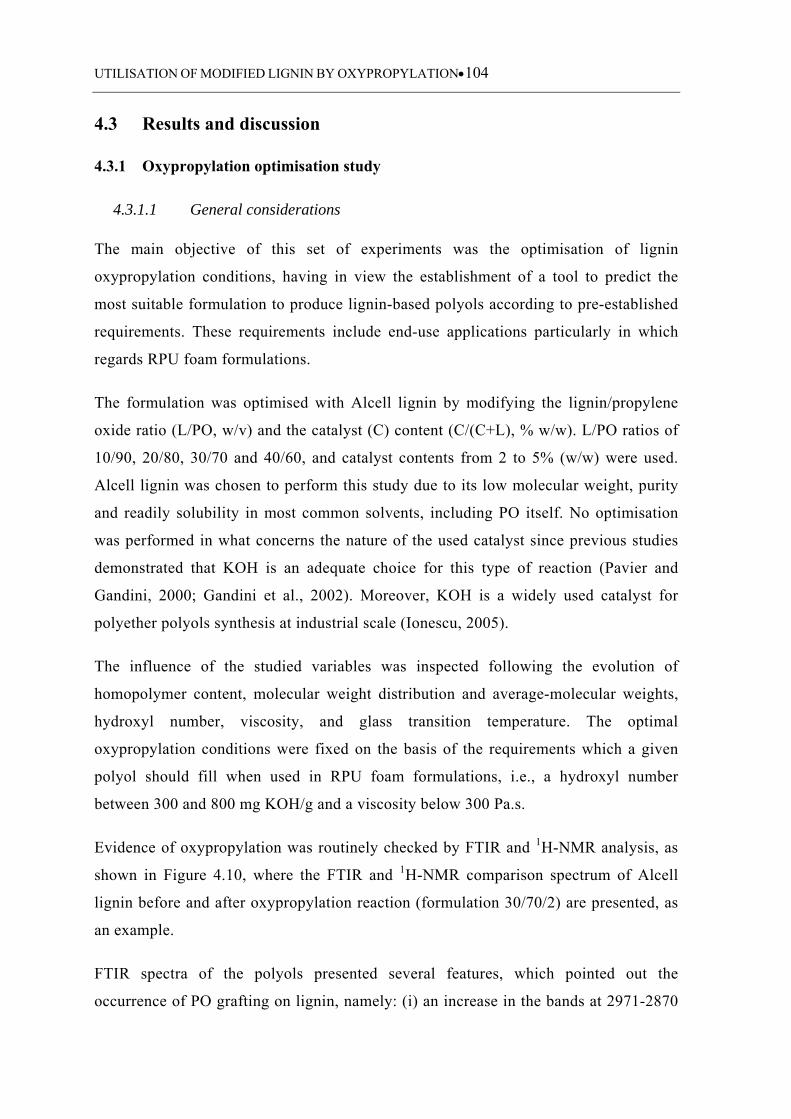
UTILISATION OF MODIFIED LIGNIN BY OXYPROPYLATION104
4.3 Results and discussion
4.3.1 Oxypropylation optimisation study
4.3.1.1 General considerations
The main objective of this set of experiments was the optimisation of lignin
oxypropylation conditions, having in view the establishment of a tool to predict the
most suitable formulation to produce lignin-based polyols according to pre-established
requirements. These requirements include end-use applications particularly in which
regards RPU foam formulations.
The formulation was optimised with Alcell lignin by modifying the lignin/propylene
oxide ratio (L/PO, w/v) and the catalyst (C) content (C/(C+L), % w/w). L/PO ratios of
10/90, 20/80, 30/70 and 40/60, and catalyst contents from 2 to 5% (w/w) were used.
Alcell lignin was chosen to perform this study due to its low molecular weight, purity
and readily solubility in most common solvents, including PO itself. No optimisation
was performed in what concerns the nature of the used catalyst since previous studies
demonstrated that KOH is an adequate choice for this type of reaction (Pavier and
Gandini, 2000; Gandini et al., 2002). Moreover, KOH is a widely used catalyst for
polyether polyols synthesis at industrial scale (Ionescu, 2005).
The influence of the studied variables was inspected following the evolution of
homopolymer content, molecular weight distribution and average-molecular weights,
hydroxyl number, viscosity, and glass transition temperature. The optimal
oxypropylation conditions were fixed on the basis of the requirements which a given
polyol should fill when used in RPU foam formulations, i.e., a hydroxyl number
between 300 and 800 mg KOH/g and a viscosity below 300 Pa.s.
Evidence of oxypropylation was routinely checked by FTIR and 1H-NMR analysis, as
shown in Figure 4.10, where the FTIR and 1H-NMR comparison spectrum of Alcell
lignin before and after oxypropylation reaction (formulation 30/70/2) are presented, as
an example.
FTIR spectra of the polyols presented several features, which pointed out the
occurrence of PO grafting on lignin, namely: (i) an increase in the bands at 2971-2870
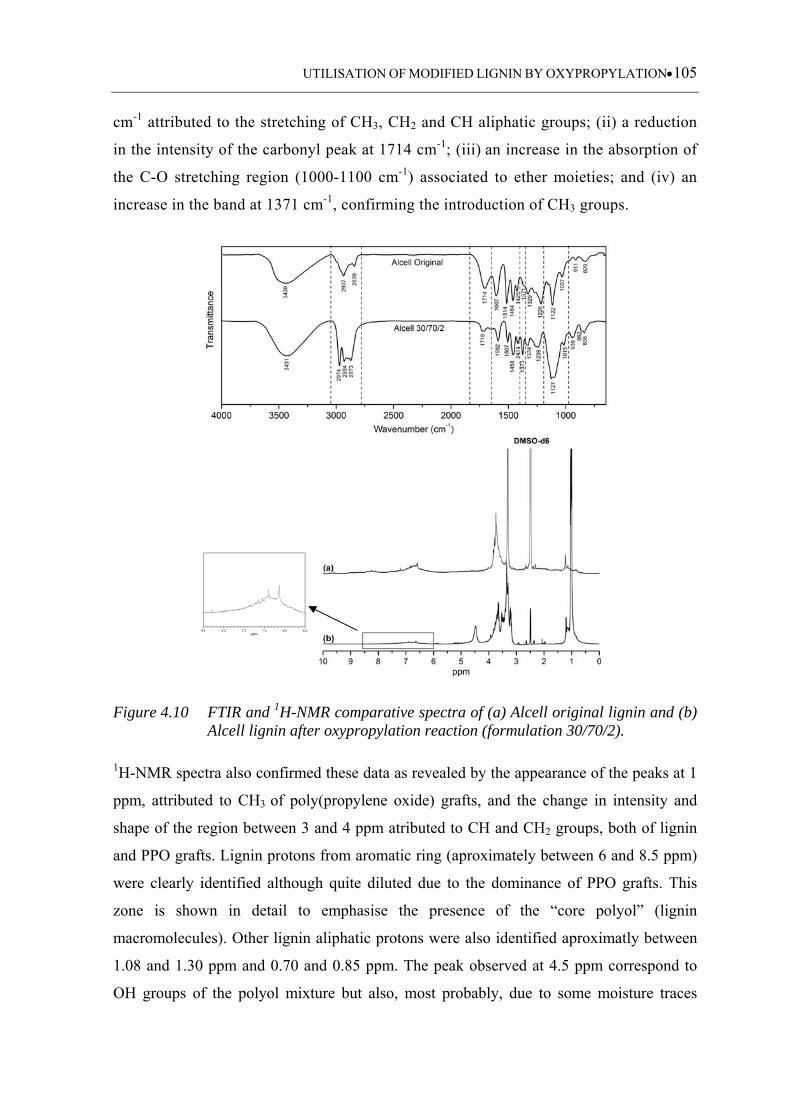
UTILISATION OF MODIFIED LIGNIN BY OXYPROPYLATION105
cm-1 attributed to the stretching of CH3, CH2 and CH aliphatic groups; (ii) a reduction
in the intensity of the carbonyl peak at 1714 cm-1; (iii) an increase in the absorption of
the C-O stretching region (1000-1100 cm-1) associated to ether moieties; and (iv) an
increase in the band at 1371 cm-1, confirming the introduction of CH3 groups.
Figure 4.10 FTIR and 1H-NMR comparative spectra of (a) Alcell original lignin and (b) Alcell lignin after oxypropylation reaction (formulation 30/70/2).
1H-NMR spectra also confirmed these data as revealed by the appearance of the peaks at 1
ppm, attributed to CH3 of poly(propylene oxide) grafts, and the change in intensity and
shape of the region between 3 and 4 ppm atributed to CH and CH2 groups, both of lignin
and PPO grafts. Lignin protons from aromatic ring (aproximately between 6 and 8.5 ppm)
were clearly identified although quite diluted due to the dominance of PPO grafts. This
zone is shown in detail to emphasise the presence of the “core polyol” (lignin
macromolecules). Other lignin aliphatic protons were also identified aproximatly between
1.08 and 1.30 ppm and 0.70 and 0.85 ppm. The peak observed at 4.5 ppm correspond to
OH groups of the polyol mixture but also, most probably, due to some moisture traces
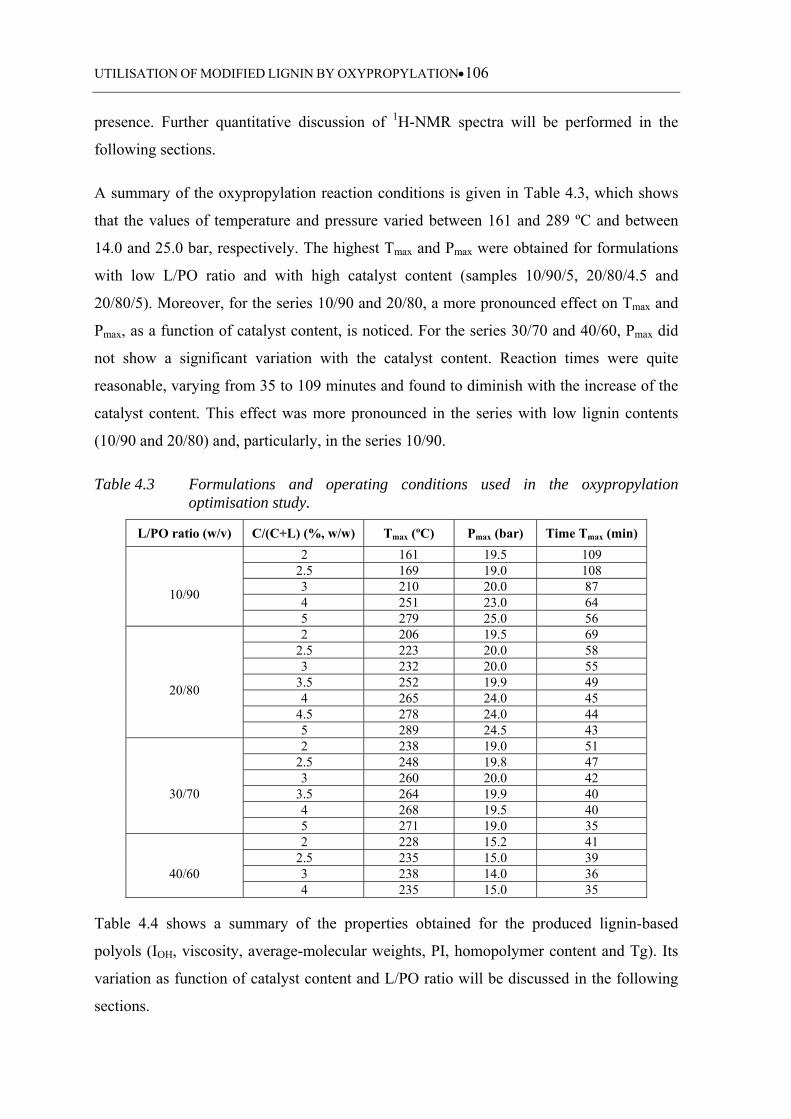
UTILISATION OF MODIFIED LIGNIN BY OXYPROPYLATION106
presence. Further quantitative discussion of 1H-NMR spectra will be performed in the
following sections.
A summary of the oxypropylation reaction conditions is given in Table 4.3, which shows
that the values of temperature and pressure varied between 161 and 289 ºC and between
14.0 and 25.0 bar, respectively. The highest Tmax and Pmax were obtained for formulations
with low L/PO ratio and with high catalyst content (samples 10/90/5, 20/80/4.5 and
20/80/5). Moreover, for the series 10/90 and 20/80, a more pronounced effect on Tmax and
Pmax, as a function of catalyst content, is noticed. For the series 30/70 and 40/60, Pmax did
not show a significant variation with the catalyst content. Reaction times were quite
reasonable, varying from 35 to 109 minutes and found to diminish with the increase of the
catalyst content. This effect was more pronounced in the series with low lignin contents
(10/90 and 20/80) and, particularly, in the series 10/90.
Table 4.3 Formulations and operating conditions used in the oxypropylation optimisation study.
L/PO ratio (w/v) C/(C+L) (%, w/w) Tmax (ºC) Pmax (bar) Time Tmax (min)
10/90
2 161 19.5 109 2.5 169 19.0 108 3 210 20.0 87 4 251 23.0 64 5 279 25.0 56
20/80
2 206 19.5 69 2.5 223 20.0 58 3 232 20.0 55
3.5 252 19.9 49 4 265 24.0 45
4.5 278 24.0 44 5 289 24.5 43
30/70
2 238 19.0 51 2.5 248 19.8 47 3 260 20.0 42
3.5 264 19.9 40 4 268 19.5 40 5 271 19.0 35
40/60
2 228 15.2 41 2.5 235 15.0 39 3 238 14.0 36 4 235 15.0 35
Table 4.4 shows a summary of the properties obtained for the produced lignin-based
polyols (IOH, viscosity, average-molecular weights, PI, homopolymer content and Tg). Its
variation as function of catalyst content and L/PO ratio will be discussed in the following
sections.
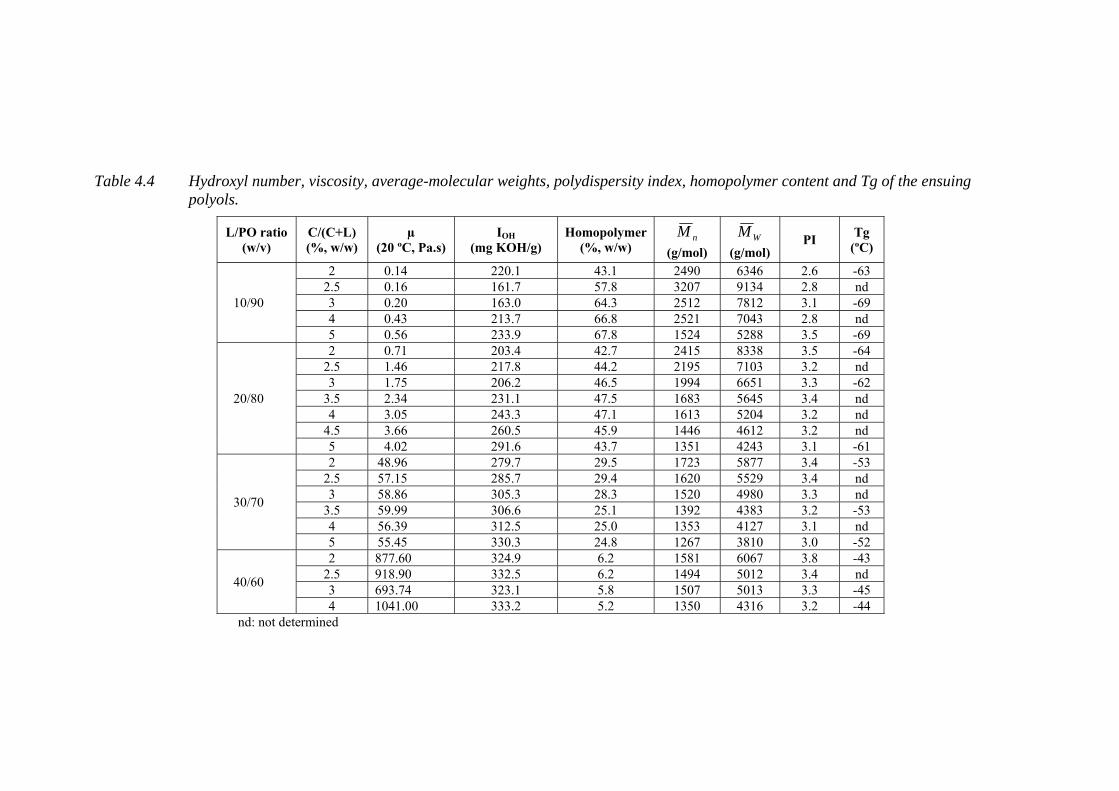
Table 4.4 Hydroxyl number, viscosity, average-molecular weights, polydispersity index, homopolymer content and Tg of the ensuing polyols.
L/PO ratio (w/v)
C/(C+L) (%, w/w)
µ (20 ºC, Pa.s)
IOH (mg KOH/g)
Homopolymer (%, w/w)
nM
(g/mol) WM
(g/mol) PI
Tg (ºC)
10/90
2 0.14 220.1 43.1 2490 6346 2.6 -63 2.5 0.16 161.7 57.8 3207 9134 2.8 nd 3 0.20 163.0 64.3 2512 7812 3.1 -69 4 0.43 213.7 66.8 2521 7043 2.8 nd 5 0.56 233.9 67.8 1524 5288 3.5 -69
20/80
2 0.71 203.4 42.7 2415 8338 3.5 -64 2.5 1.46 217.8 44.2 2195 7103 3.2 nd 3 1.75 206.2 46.5 1994 6651 3.3 -62
3.5 2.34 231.1 47.5 1683 5645 3.4 nd 4 3.05 243.3 47.1 1613 5204 3.2 nd
4.5 3.66 260.5 45.9 1446 4612 3.2 nd 5 4.02 291.6 43.7 1351 4243 3.1 -61
30/70
2 48.96 279.7 29.5 1723 5877 3.4 -53 2.5 57.15 285.7 29.4 1620 5529 3.4 nd 3 58.86 305.3 28.3 1520 4980 3.3 nd
3.5 59.99 306.6 25.1 1392 4383 3.2 -53 4 56.39 312.5 25.0 1353 4127 3.1 nd 5 55.45 330.3 24.8 1267 3810 3.0 -52
40/60
2 877.60 324.9 6.2 1581 6067 3.8 -43 2.5 918.90 332.5 6.2 1494 5012 3.4 nd 3 693.74 323.1 5.8 1507 5013 3.3 -45 4 1041.00 333.2 5.2 1350 4316 3.2 -44
nd: not determined
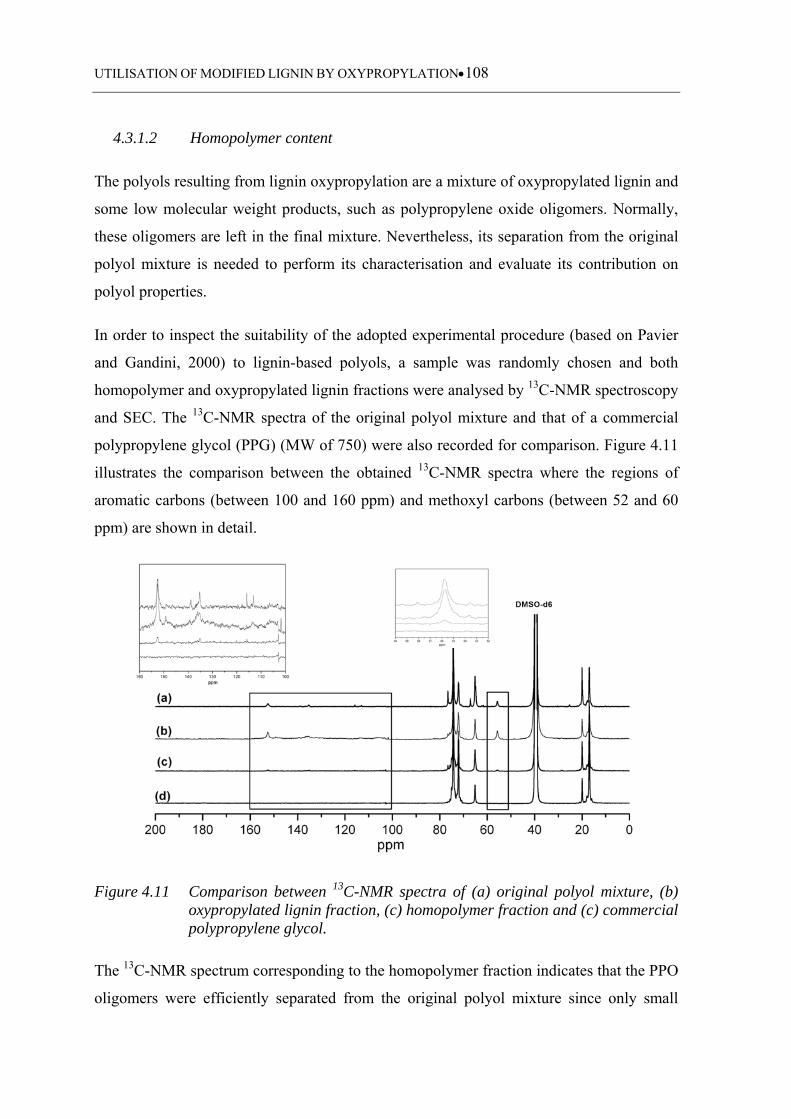
UTILISATION OF MODIFIED LIGNIN BY OXYPROPYLATION108
4.3.1.2 Homopolymer content
The polyols resulting from lignin oxypropylation are a mixture of oxypropylated lignin and
some low molecular weight products, such as polypropylene oxide oligomers. Normally,
these oligomers are left in the final mixture. Nevertheless, its separation from the original
polyol mixture is needed to perform its characterisation and evaluate its contribution on
polyol properties.
In order to inspect the suitability of the adopted experimental procedure (based on Pavier
and Gandini, 2000) to lignin-based polyols, a sample was randomly chosen and both
homopolymer and oxypropylated lignin fractions were analysed by 13C-NMR spectroscopy
and SEC. The 13C-NMR spectra of the original polyol mixture and that of a commercial
polypropylene glycol (PPG) (MW of 750) were also recorded for comparison. Figure 4.11
illustrates the comparison between the obtained 13C-NMR spectra where the regions of
aromatic carbons (between 100 and 160 ppm) and methoxyl carbons (between 52 and 60
ppm) are shown in detail.
Figure 4.11 Comparison between 13C-NMR spectra of (a) original polyol mixture, (b) oxypropylated lignin fraction, (c) homopolymer fraction and (c) commercial polypropylene glycol.
The 13C-NMR spectrum corresponding to the homopolymer fraction indicates that the PPO
oligomers were efficiently separated from the original polyol mixture since only small
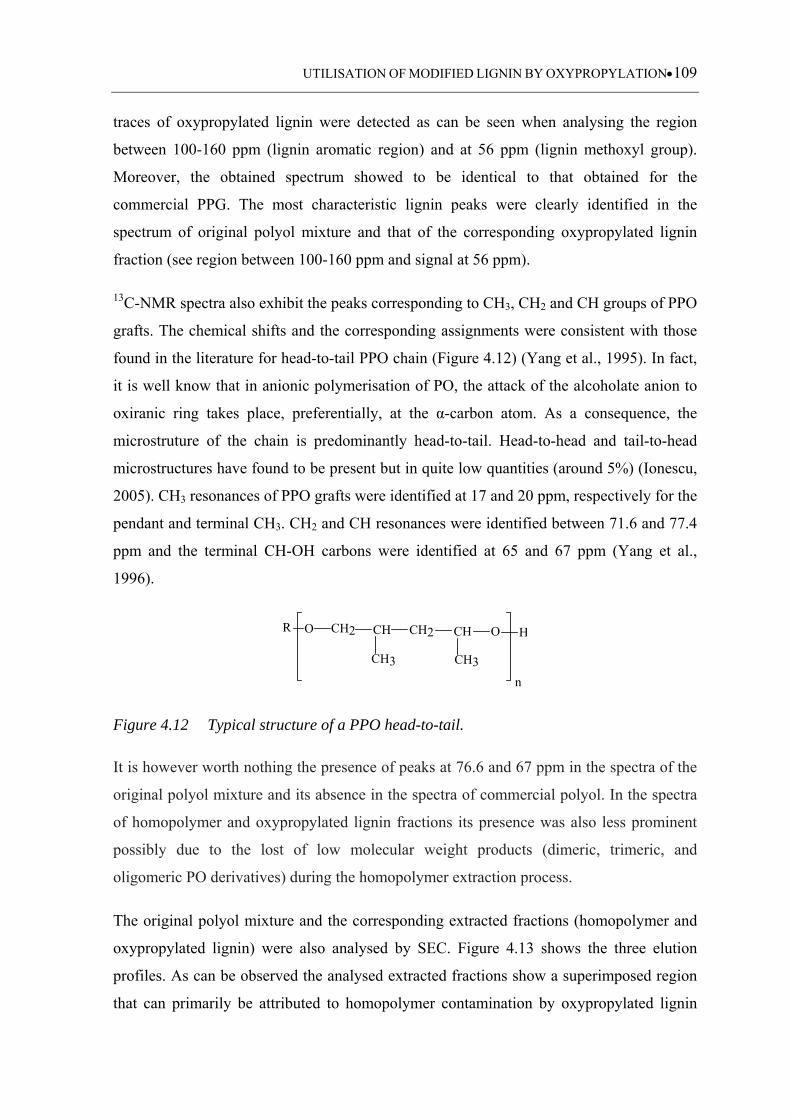
UTILISATION OF MODIFIED LIGNIN BY OXYPROPYLATION109
traces of oxypropylated lignin were detected as can be seen when analysing the region
between 100-160 ppm (lignin aromatic region) and at 56 ppm (lignin methoxyl group).
Moreover, the obtained spectrum showed to be identical to that obtained for the
commercial PPG. The most characteristic lignin peaks were clearly identified in the
spectrum of original polyol mixture and that of the corresponding oxypropylated lignin
fraction (see region between 100-160 ppm and signal at 56 ppm).
13C-NMR spectra also exhibit the peaks corresponding to CH3, CH2 and CH groups of PPO
grafts. The chemical shifts and the corresponding assignments were consistent with those
found in the literature for head-to-tail PPO chain (Figure 4.12) (Yang et al., 1995). In fact,
it is well know that in anionic polymerisation of PO, the attack of the alcoholate anion to
oxiranic ring takes place, preferentially, at the α-carbon atom. As a consequence, the
microstruture of the chain is predominantly head-to-tail. Head-to-head and tail-to-head
microstructures have found to be present but in quite low quantities (around 5%) (Ionescu,
2005). CH3 resonances of PPO grafts were identified at 17 and 20 ppm, respectively for the
pendant and terminal CH3. CH2 and CH resonances were identified between 71.6 and 77.4
ppm and the terminal CH-OH carbons were identified at 65 and 67 ppm (Yang et al.,
1996).
R O CH2 CH
CH3
CH2 CH
CH3
O H
n
Figure 4.12 Typical structure of a PPO head-to-tail.
It is however worth nothing the presence of peaks at 76.6 and 67 ppm in the spectra of the
original polyol mixture and its absence in the spectra of commercial polyol. In the spectra
of homopolymer and oxypropylated lignin fractions its presence was also less prominent
possibly due to the lost of low molecular weight products (dimeric, trimeric, and
oligomeric PO derivatives) during the homopolymer extraction process.
The original polyol mixture and the corresponding extracted fractions (homopolymer and
oxypropylated lignin) were also analysed by SEC. Figure 4.13 shows the three elution
profiles. As can be observed the analysed extracted fractions show a superimposed region
that can primarily be attributed to homopolymer contamination by oxypropylated lignin
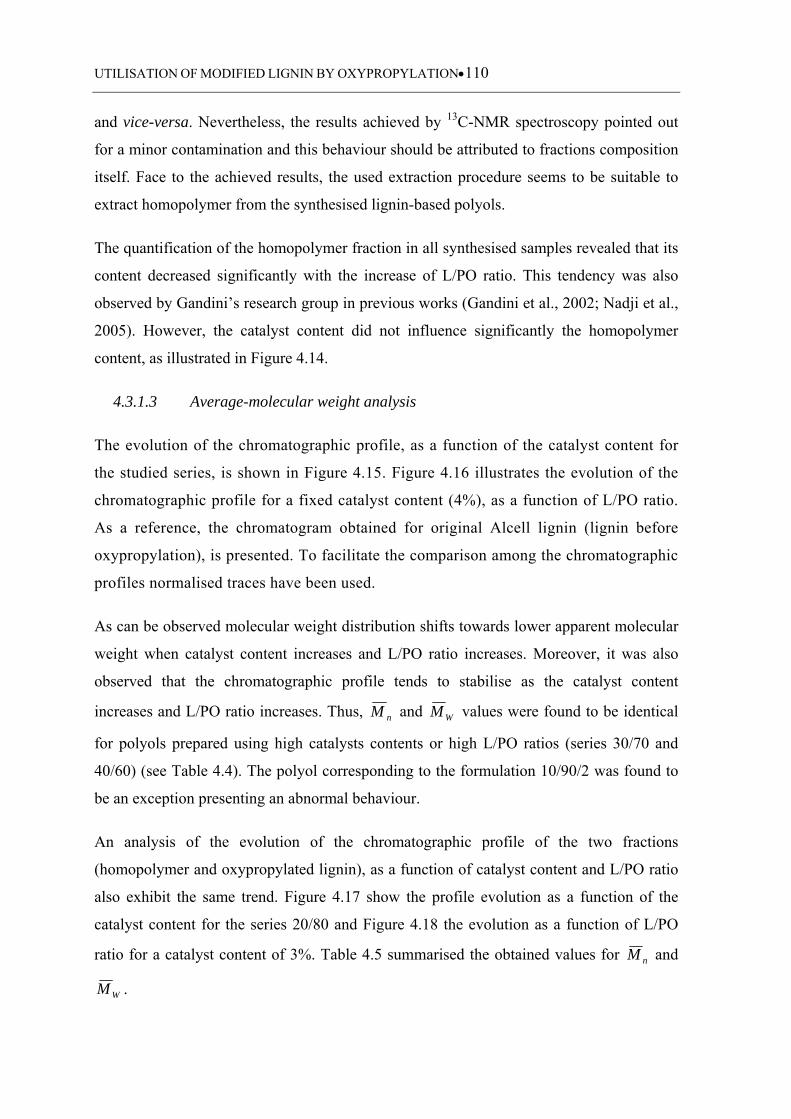
UTILISATION OF MODIFIED LIGNIN BY OXYPROPYLATION110
and vice-versa. Nevertheless, the results achieved by 13C-NMR spectroscopy pointed out
for a minor contamination and this behaviour should be attributed to fractions composition
itself. Face to the achieved results, the used extraction procedure seems to be suitable to
extract homopolymer from the synthesised lignin-based polyols.
The quantification of the homopolymer fraction in all synthesised samples revealed that its
content decreased significantly with the increase of L/PO ratio. This tendency was also
observed by Gandini’s research group in previous works (Gandini et al., 2002; Nadji et al.,
2005). However, the catalyst content did not influence significantly the homopolymer
content, as illustrated in Figure 4.14.
4.3.1.3 Average-molecular weight analysis
The evolution of the chromatographic profile, as a function of the catalyst content for
the studied series, is shown in Figure 4.15. Figure 4.16 illustrates the evolution of the
chromatographic profile for a fixed catalyst content (4%), as a function of L/PO ratio.
As a reference, the chromatogram obtained for original Alcell lignin (lignin before
oxypropylation), is presented. To facilitate the comparison among the chromatographic
profiles normalised traces have been used.
As can be observed molecular weight distribution shifts towards lower apparent molecular
weight when catalyst content increases and L/PO ratio increases. Moreover, it was also
observed that the chromatographic profile tends to stabilise as the catalyst content
increases and L/PO ratio increases. Thus, nM and WM values were found to be identical
for polyols prepared using high catalysts contents or high L/PO ratios (series 30/70 and
40/60) (see Table 4.4). The polyol corresponding to the formulation 10/90/2 was found to
be an exception presenting an abnormal behaviour.
An analysis of the evolution of the chromatographic profile of the two fractions
(homopolymer and oxypropylated lignin), as a function of catalyst content and L/PO ratio
also exhibit the same trend. Figure 4.17 show the profile evolution as a function of the
catalyst content for the series 20/80 and Figure 4.18 the evolution as a function of L/PO
ratio for a catalyst content of 3%. Table 4.5 summarised the obtained values for nM and
WM .
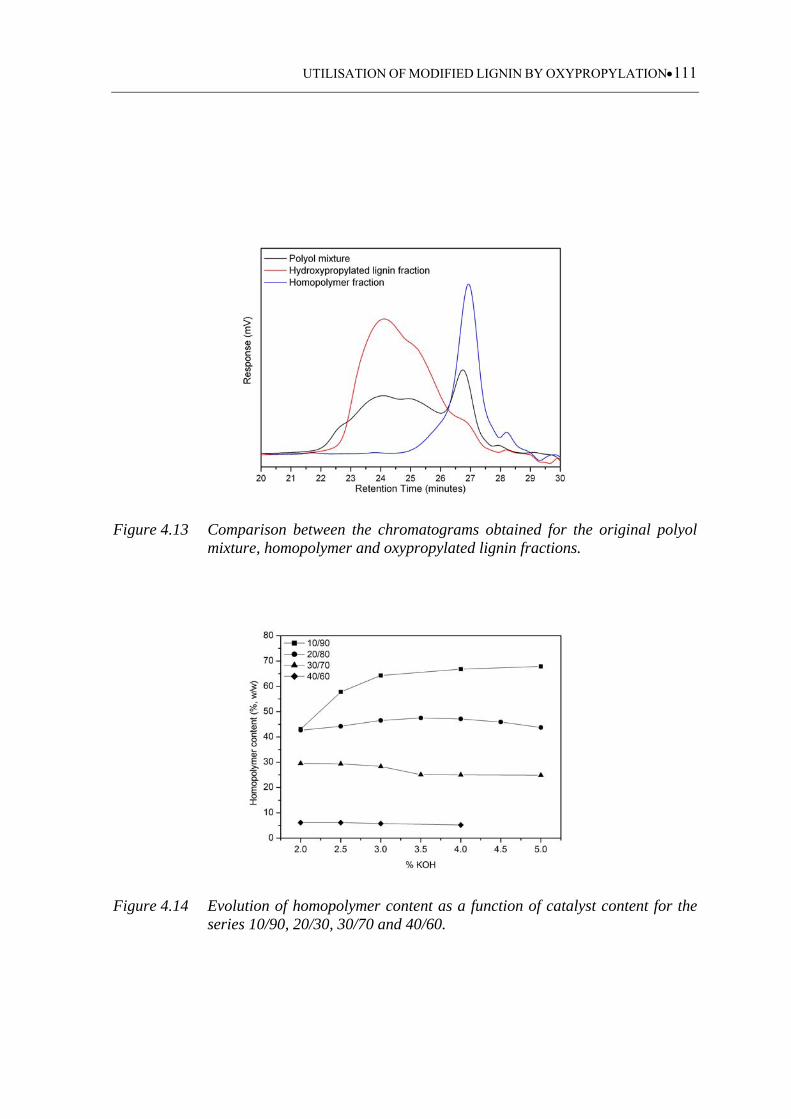
UTILISATION OF MODIFIED LIGNIN BY OXYPROPYLATION111
Figure 4.13 Comparison between the chromatograms obtained for the original polyol mixture, homopolymer and oxypropylated lignin fractions.
Figure 4.14 Evolution of homopolymer content as a function of catalyst content for the series 10/90, 20/30, 30/70 and 40/60.
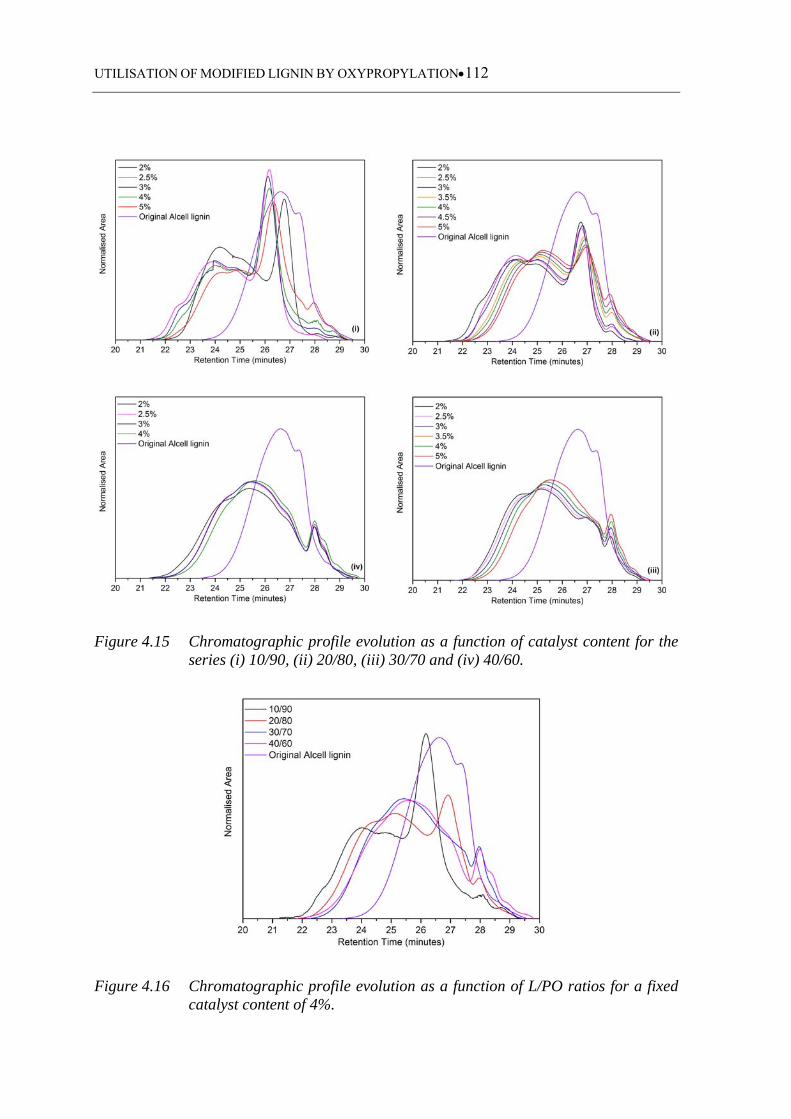
UTILISATION OF MODIFIED LIGNIN BY OXYPROPYLATION112
Figure 4.15 Chromatographic profile evolution as a function of catalyst content for the series (i) 10/90, (ii) 20/80, (iii) 30/70 and (iv) 40/60.
Figure 4.16 Chromatographic profile evolution as a function of L/PO ratios for a fixed catalyst content of 4%.
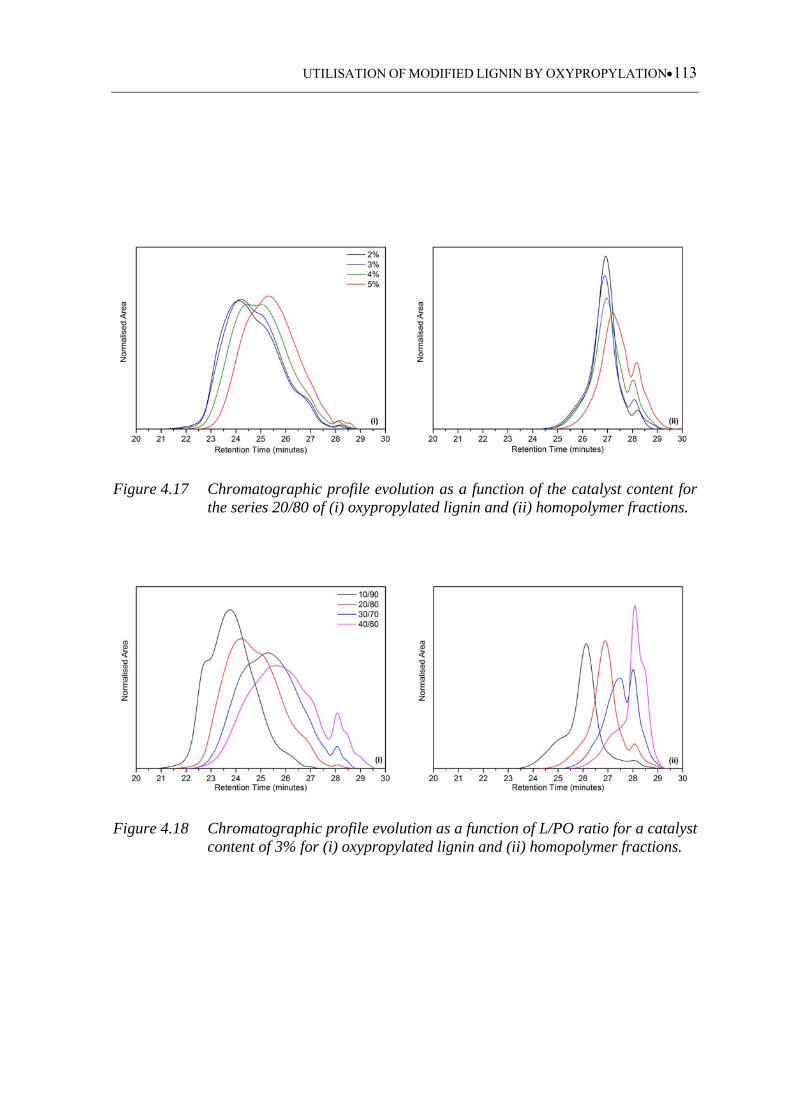
UTILISATION OF MODIFIED LIGNIN BY OXYPROPYLATION113
Figure 4.17 Chromatographic profile evolution as a function of the catalyst content for the series 20/80 of (i) oxypropylated lignin and (ii) homopolymer fractions.
Figure 4.18 Chromatographic profile evolution as a function of L/PO ratio for a catalyst content of 3% for (i) oxypropylated lignin and (ii) homopolymer fractions.
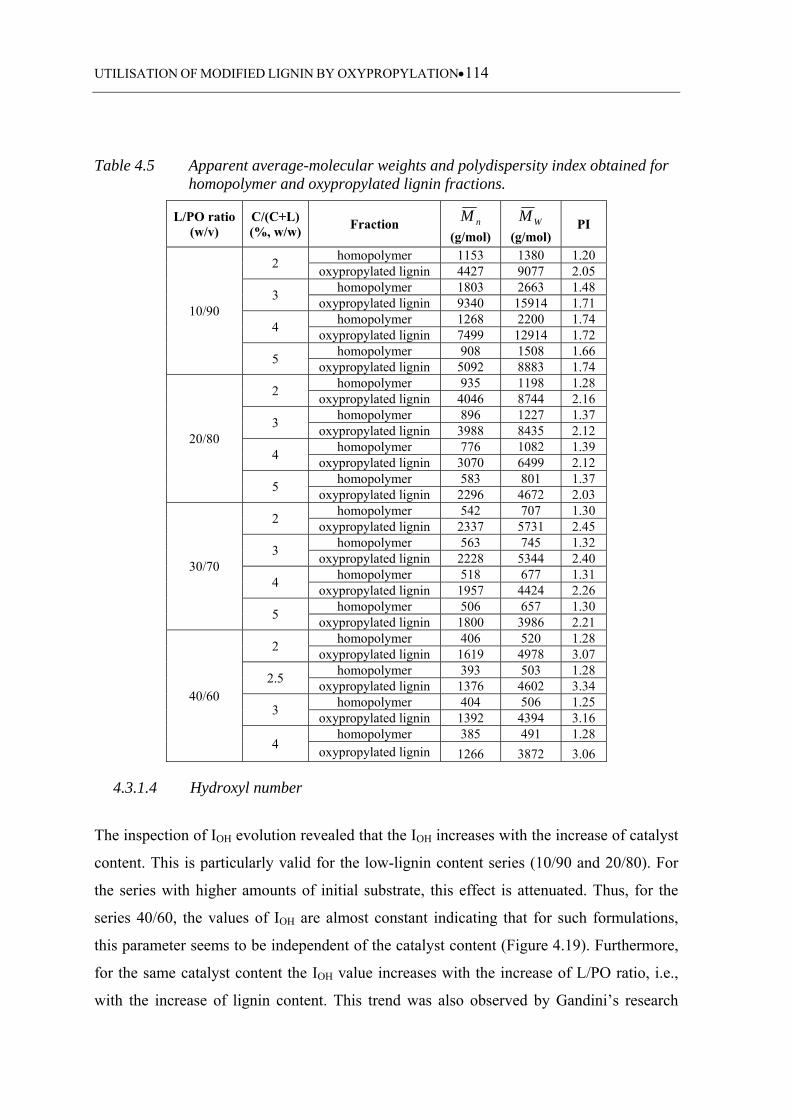
UTILISATION OF MODIFIED LIGNIN BY OXYPROPYLATION114
Table 4.5 Apparent average-molecular weights and polydispersity index obtained for homopolymer and oxypropylated lignin fractions.
L/PO ratio(w/v)
C/(C+L) (%, w/w)
Fraction nM
(g/mol) WM
(g/mol) PI
10/90
2 homopolymer 1153 1380 1.20
oxypropylated lignin 4427 9077 2.05
3 homopolymer 1803 2663 1.48
oxypropylated lignin 9340 15914 1.71
4 homopolymer 1268 2200 1.74
oxypropylated lignin 7499 12914 1.72
5 homopolymer 908 1508 1.66
oxypropylated lignin 5092 8883 1.74
20/80
2 homopolymer 935 1198 1.28
oxypropylated lignin 4046 8744 2.16
3 homopolymer 896 1227 1.37
oxypropylated lignin 3988 8435 2.12
4 homopolymer 776 1082 1.39
oxypropylated lignin 3070 6499 2.12
5 homopolymer 583 801 1.37
oxypropylated lignin 2296 4672 2.03
30/70
2 homopolymer 542 707 1.30
oxypropylated lignin 2337 5731 2.45
3 homopolymer 563 745 1.32
oxypropylated lignin 2228 5344 2.40
4 homopolymer 518 677 1.31
oxypropylated lignin 1957 4424 2.26
5 homopolymer 506 657 1.30
oxypropylated lignin 1800 3986 2.21
40/60
2 homopolymer 406 520 1.28
oxypropylated lignin 1619 4978 3.07
2.5 homopolymer 393 503 1.28
oxypropylated lignin 1376 4602 3.34
3 homopolymer 404 506 1.25
oxypropylated lignin 1392 4394 3.16
4 homopolymer 385 491 1.28
oxypropylated lignin 1266 3872 3.06
4.3.1.4 Hydroxyl number
The inspection of IOH evolution revealed that the IOH increases with the increase of catalyst
content. This is particularly valid for the low-lignin content series (10/90 and 20/80). For
the series with higher amounts of initial substrate, this effect is attenuated. Thus, for the
series 40/60, the values of IOH are almost constant indicating that for such formulations,
this parameter seems to be independent of the catalyst content (Figure 4.19). Furthermore,
for the same catalyst content the IOH value increases with the increase of L/PO ratio, i.e.,
with the increase of lignin content. This trend was also observed by Gandini’s research
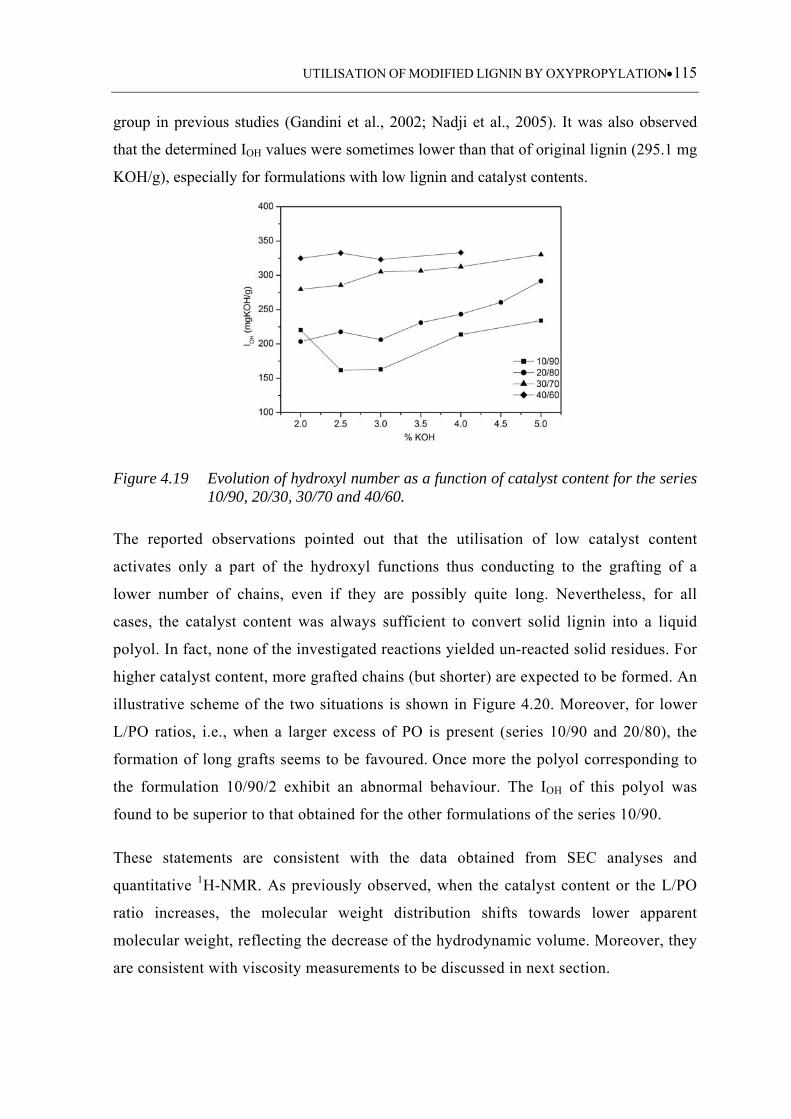
UTILISATION OF MODIFIED LIGNIN BY OXYPROPYLATION115
group in previous studies (Gandini et al., 2002; Nadji et al., 2005). It was also observed
that the determined IOH values were sometimes lower than that of original lignin (295.1 mg
KOH/g), especially for formulations with low lignin and catalyst contents.
Figure 4.19 Evolution of hydroxyl number as a function of catalyst content for the series 10/90, 20/30, 30/70 and 40/60.
The reported observations pointed out that the utilisation of low catalyst content
activates only a part of the hydroxyl functions thus conducting to the grafting of a
lower number of chains, even if they are possibly quite long. Nevertheless, for all
cases, the catalyst content was always sufficient to convert solid lignin into a liquid
polyol. In fact, none of the investigated reactions yielded un-reacted solid residues. For
higher catalyst content, more grafted chains (but shorter) are expected to be formed. An
illustrative scheme of the two situations is shown in Figure 4.20. Moreover, for lower
L/PO ratios, i.e., when a larger excess of PO is present (series 10/90 and 20/80), the
formation of long grafts seems to be favoured. Once more the polyol corresponding to
the formulation 10/90/2 exhibit an abnormal behaviour. The IOH of this polyol was
found to be superior to that obtained for the other formulations of the series 10/90.
These statements are consistent with the data obtained from SEC analyses and
quantitative 1H-NMR. As previously observed, when the catalyst content or the L/PO
ratio increases, the molecular weight distribution shifts towards lower apparent
molecular weight, reflecting the decrease of the hydrodynamic volume. Moreover, they
are consistent with viscosity measurements to be discussed in next section.
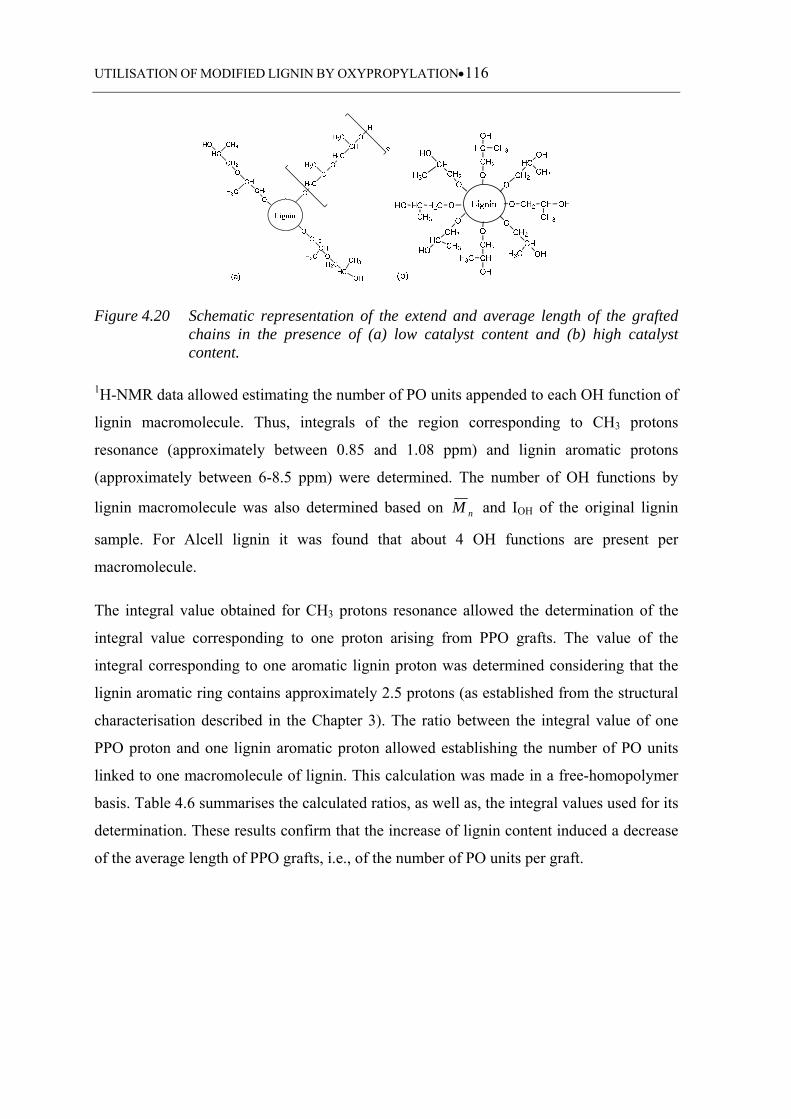
UTILISATION OF MODIFIED LIGNIN BY OXYPROPYLATION116
Figure 4.20 Schematic representation of the extend and average length of the grafted chains in the presence of (a) low catalyst content and (b) high catalyst content.
1H-NMR data allowed estimating the number of PO units appended to each OH function of
lignin macromolecule. Thus, integrals of the region corresponding to CH3 protons
resonance (approximately between 0.85 and 1.08 ppm) and lignin aromatic protons
(approximately between 6-8.5 ppm) were determined. The number of OH functions by
lignin macromolecule was also determined based on nM and IOH of the original lignin
sample. For Alcell lignin it was found that about 4 OH functions are present per
macromolecule.
The integral value obtained for CH3 protons resonance allowed the determination of the
integral value corresponding to one proton arising from PPO grafts. The value of the
integral corresponding to one aromatic lignin proton was determined considering that the
lignin aromatic ring contains approximately 2.5 protons (as established from the structural
characterisation described in the Chapter 3). The ratio between the integral value of one
PPO proton and one lignin aromatic proton allowed establishing the number of PO units
linked to one macromolecule of lignin. This calculation was made in a free-homopolymer
basis. Table 4.6 summarises the calculated ratios, as well as, the integral values used for its
determination. These results confirm that the increase of lignin content induced a decrease
of the average length of PPO grafts, i.e., of the number of PO units per graft.
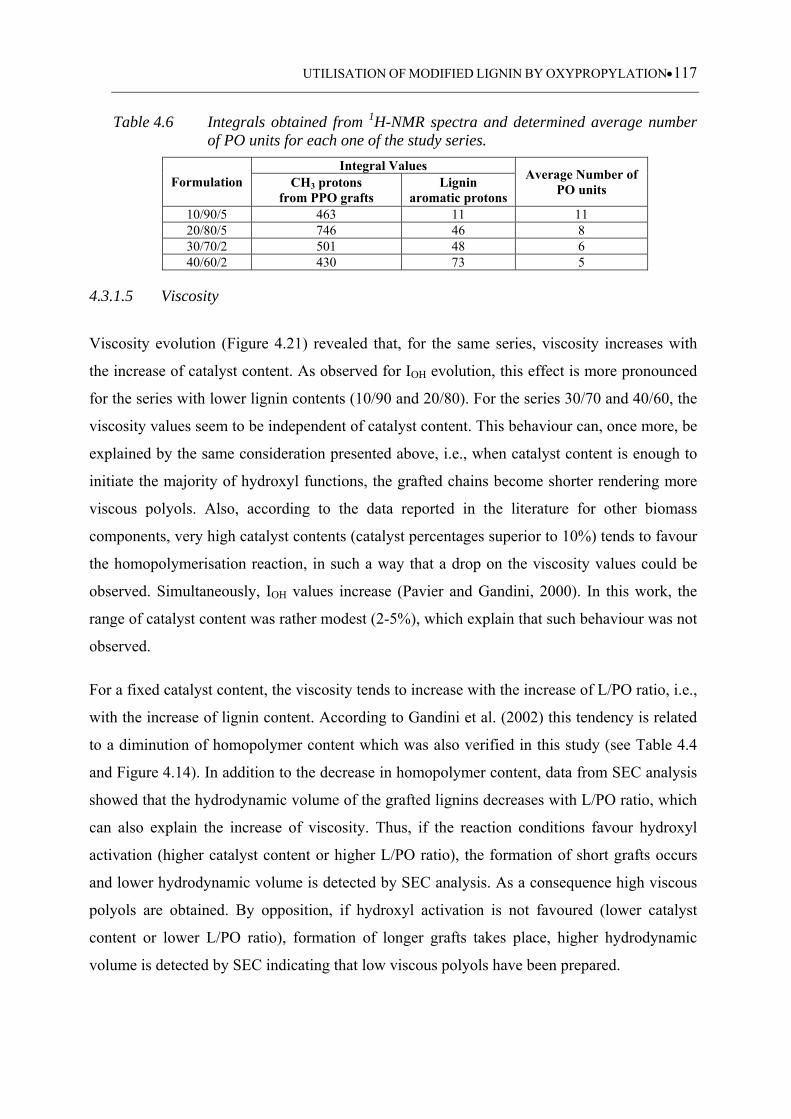
UTILISATION OF MODIFIED LIGNIN BY OXYPROPYLATION117
Table 4.6 Integrals obtained from 1H-NMR spectra and determined average number of PO units for each one of the study series.
Formulation Integral Values
Average Number of PO units CH3 protons
from PPO grafts Lignin
aromatic protons 10/90/5 463 11 11 20/80/5 746 46 8 30/70/2 501 48 6 40/60/2 430 73 5
4.3.1.5 Viscosity
Viscosity evolution (Figure 4.21) revealed that, for the same series, viscosity increases with
the increase of catalyst content. As observed for IOH evolution, this effect is more pronounced
for the series with lower lignin contents (10/90 and 20/80). For the series 30/70 and 40/60, the
viscosity values seem to be independent of catalyst content. This behaviour can, once more, be
explained by the same consideration presented above, i.e., when catalyst content is enough to
initiate the majority of hydroxyl functions, the grafted chains become shorter rendering more
viscous polyols. Also, according to the data reported in the literature for other biomass
components, very high catalyst contents (catalyst percentages superior to 10%) tends to favour
the homopolymerisation reaction, in such a way that a drop on the viscosity values could be
observed. Simultaneously, IOH values increase (Pavier and Gandini, 2000). In this work, the
range of catalyst content was rather modest (2-5%), which explain that such behaviour was not
observed.
For a fixed catalyst content, the viscosity tends to increase with the increase of L/PO ratio, i.e.,
with the increase of lignin content. According to Gandini et al. (2002) this tendency is related
to a diminution of homopolymer content which was also verified in this study (see Table 4.4
and Figure 4.14). In addition to the decrease in homopolymer content, data from SEC analysis
showed that the hydrodynamic volume of the grafted lignins decreases with L/PO ratio, which
can also explain the increase of viscosity. Thus, if the reaction conditions favour hydroxyl
activation (higher catalyst content or higher L/PO ratio), the formation of short grafts occurs
and lower hydrodynamic volume is detected by SEC analysis. As a consequence high viscous
polyols are obtained. By opposition, if hydroxyl activation is not favoured (lower catalyst
content or lower L/PO ratio), formation of longer grafts takes place, higher hydrodynamic
volume is detected by SEC indicating that low viscous polyols have been prepared.
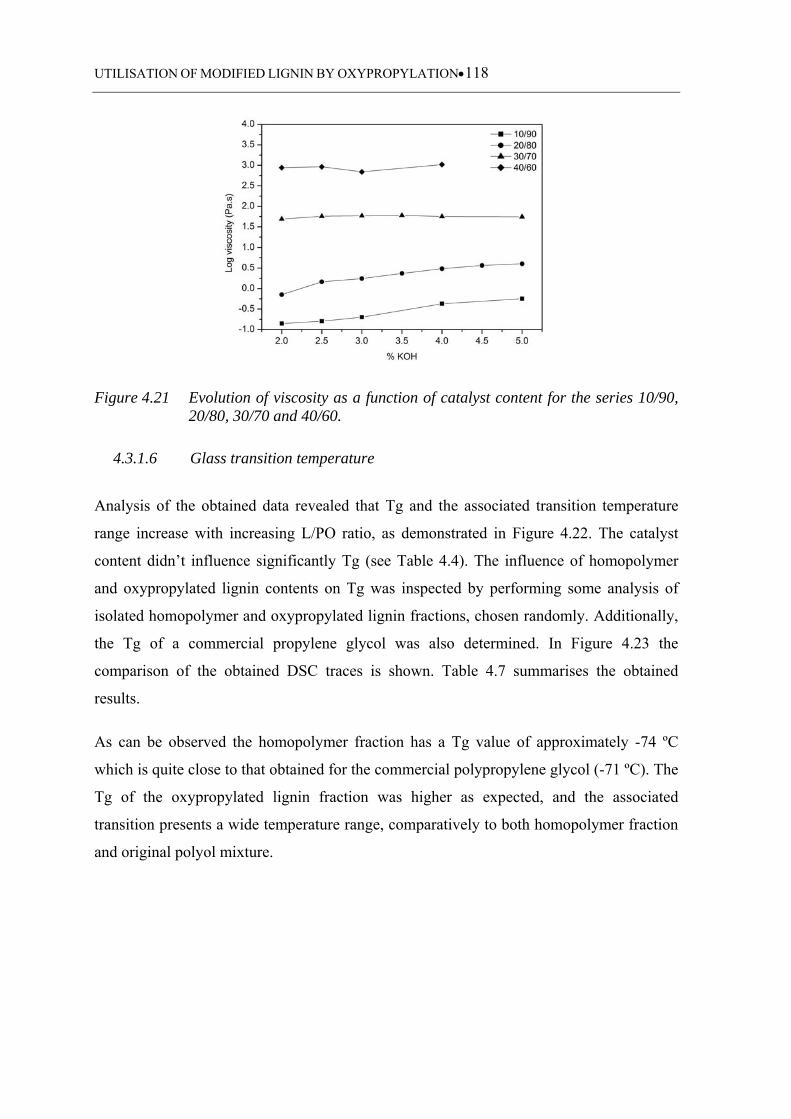
UTILISATION OF MODIFIED LIGNIN BY OXYPROPYLATION118
Figure 4.21 Evolution of viscosity as a function of catalyst content for the series 10/90, 20/80, 30/70 and 40/60.
4.3.1.6 Glass transition temperature
Analysis of the obtained data revealed that Tg and the associated transition temperature
range increase with increasing L/PO ratio, as demonstrated in Figure 4.22. The catalyst
content didn’t influence significantly Tg (see Table 4.4). The influence of homopolymer
and oxypropylated lignin contents on Tg was inspected by performing some analysis of
isolated homopolymer and oxypropylated lignin fractions, chosen randomly. Additionally,
the Tg of a commercial propylene glycol was also determined. In Figure 4.23 the
comparison of the obtained DSC traces is shown. Table 4.7 summarises the obtained
results.
As can be observed the homopolymer fraction has a Tg value of approximately -74 ºC
which is quite close to that obtained for the commercial polypropylene glycol (-71 ºC). The
Tg of the oxypropylated lignin fraction was higher as expected, and the associated
transition presents a wide temperature range, comparatively to both homopolymer fraction
and original polyol mixture.
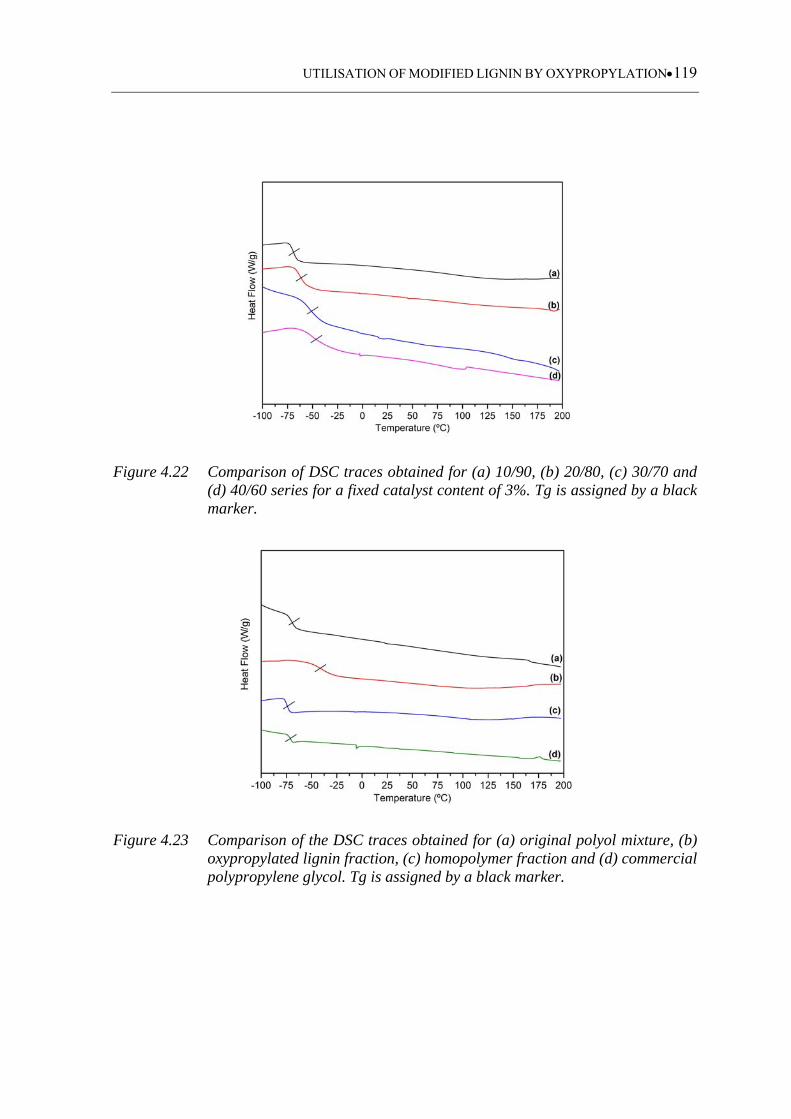
UTILISATION OF MODIFIED LIGNIN BY OXYPROPYLATION119
Figure 4.22 Comparison of DSC traces obtained for (a) 10/90, (b) 20/80, (c) 30/70 and (d) 40/60 series for a fixed catalyst content of 3%. Tg is assigned by a black marker.
Figure 4.23 Comparison of the DSC traces obtained for (a) original polyol mixture, (b) oxypropylated lignin fraction, (c) homopolymer fraction and (d) commercial polypropylene glycol. Tg is assigned by a black marker.

UTILISATION OF MODIFIED LIGNIN BY OXYPROPYLATION120
According to the obtained data the observed tendency seems to be related not only with the
homopolymer content but also with the length of the grafted chains. With increasing L/PO
ratio, the homopolymer content decreases and the grafted chains become shorter thus
contributing for the achievement of higher Tg values. For the series with low lignin
contents (10/90 and 20/80), the presence of higher homopolymer content together with
long grafted chains, contributes to achieve lower Tg values closer to that of the
homopolymer fraction. It is worth noting that a unique Tg was detected proving that we are
in the presence of a homogeneous mixture. Moreover, it also corroborates the absence of
un-reacted lignin fractions.
The behaviour of original polyol mixture Tg was inspected according to Fox’s law
(Equation 4.7). With the experimental values obtained for homopolymer and
oxypropylated lignin factions it was possible to determine the theoretical Tg values of the
corresponding polyol mixtures. As can be observed from the data presented in Table 4.7 a
quite good agreement was found between the experimental and theoretical Tg values. In
conclusion, the polyol mixture can be described as a homogeneous mixture of
homopolymer and oxypropylated lignin and its behaviour fits reasonably to the Fox law.
2
2
1
11
Tg
w
Tg
w
Tg (4.7)
where:
Tg - is the glass transition temperature of polyol mixture, in K
1Tg - is the glass transition temperature of homopolymer fraction, in K
2Tg - is the glass transition temperature of oxypropylated lignin fraction, in K
1w - is the weight fraction of homopolymer fraction
2w - is the weight fraction of oxypropylated lignin fraction
Table 4.7 Tg obtained for some homopolymer and oxypropylated lignin samples and theoretical Tg values obtained for polyols mixtures according to Fox law.
Formulation L/PO/C
(w/v/%(w/w))
Experimental Tg (ºC) Theoretical Tg (ºC) Homopolymer
fraction Oxypropylated lignin
fraction Polyol
mixture Polyol mixture
10/90/5 -74 -41 -69 -64 20/80/3 -74 -31 -62 -53
30/70/3.5 -74 -32 -53 -43
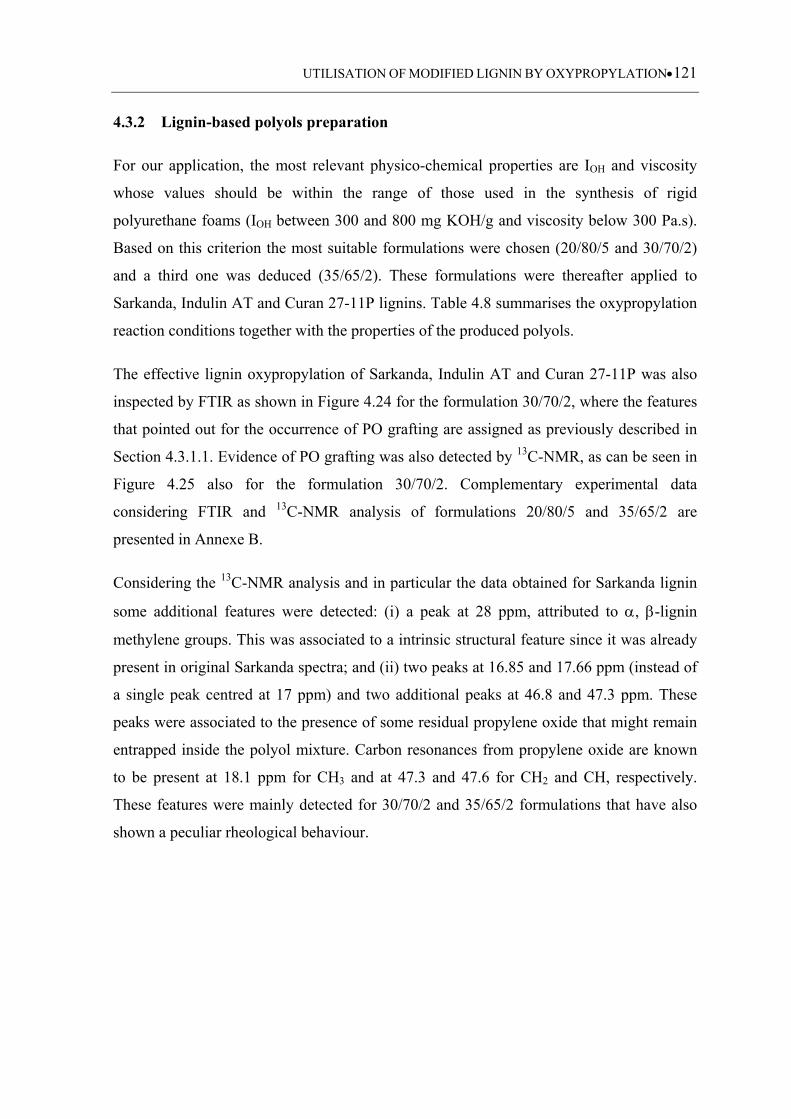
UTILISATION OF MODIFIED LIGNIN BY OXYPROPYLATION121
4.3.2 Lignin-based polyols preparation
For our application, the most relevant physico-chemical properties are IOH and viscosity
whose values should be within the range of those used in the synthesis of rigid
polyurethane foams (IOH between 300 and 800 mg KOH/g and viscosity below 300 Pa.s).
Based on this criterion the most suitable formulations were chosen (20/80/5 and 30/70/2)
and a third one was deduced (35/65/2). These formulations were thereafter applied to
Sarkanda, Indulin AT and Curan 27-11P lignins. Table 4.8 summarises the oxypropylation
reaction conditions together with the properties of the produced polyols.
The effective lignin oxypropylation of Sarkanda, Indulin AT and Curan 27-11P was also
inspected by FTIR as shown in Figure 4.24 for the formulation 30/70/2, where the features
that pointed out for the occurrence of PO grafting are assigned as previously described in
Section 4.3.1.1. Evidence of PO grafting was also detected by 13C-NMR, as can be seen in
Figure 4.25 also for the formulation 30/70/2. Complementary experimental data
considering FTIR and 13C-NMR analysis of formulations 20/80/5 and 35/65/2 are
presented in Annexe B.
Considering the 13C-NMR analysis and in particular the data obtained for Sarkanda lignin
some additional features were detected: (i) a peak at 28 ppm, attributed to , -lignin
methylene groups. This was associated to a intrinsic structural feature since it was already
present in original Sarkanda spectra; and (ii) two peaks at 16.85 and 17.66 ppm (instead of
a single peak centred at 17 ppm) and two additional peaks at 46.8 and 47.3 ppm. These
peaks were associated to the presence of some residual propylene oxide that might remain
entrapped inside the polyol mixture. Carbon resonances from propylene oxide are known
to be present at 18.1 ppm for CH3 and at 47.3 and 47.6 for CH2 and CH, respectively.
These features were mainly detected for 30/70/2 and 35/65/2 formulations that have also
shown a peculiar rheological behaviour.
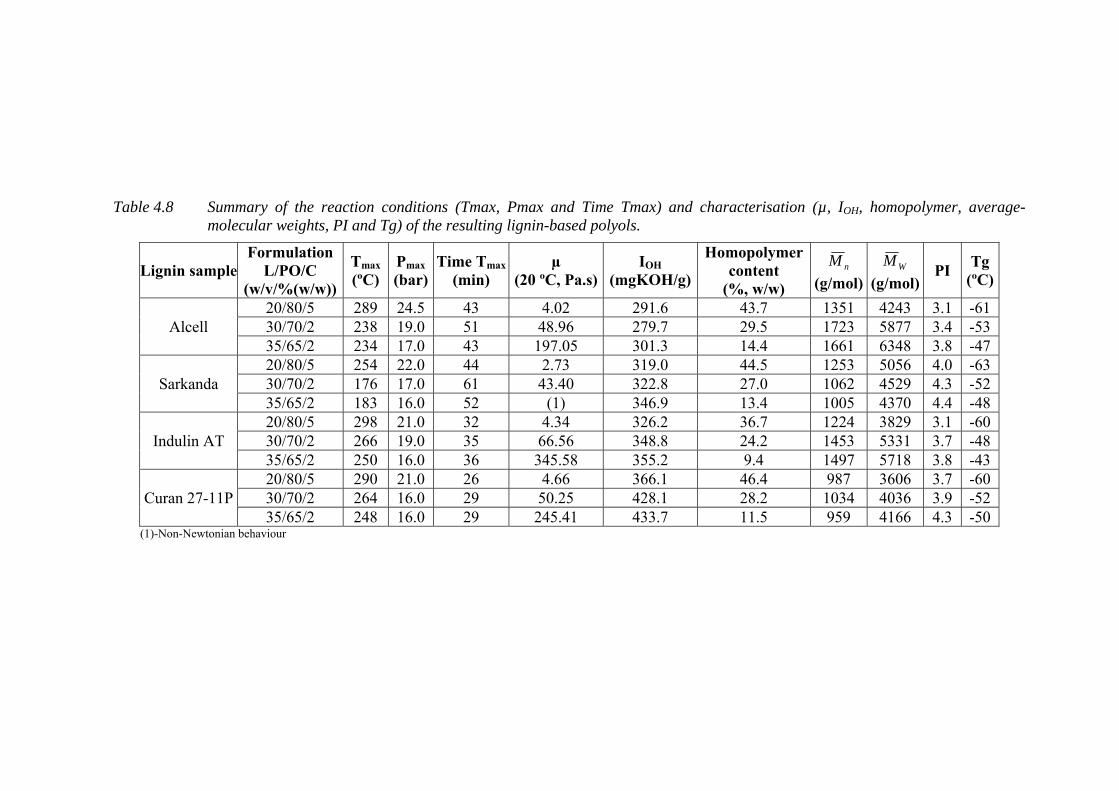
Table 4.8 Summary of the reaction conditions (Tmax, Pmax and Time Tmax) and characterisation (µ, IOH, homopolymer, average-molecular weights, PI and Tg) of the resulting lignin-based polyols.
Lignin sample Formulation
L/PO/C (w/v/%(w/w))
Tmax
(ºC) Pmax
(bar)Time Tmax
(min) µ
(20 ºC, Pa.s)IOH
(mgKOH/g)
Homopolymer content
(%, w/w)
nM
(g/mol)WM
(g/mol)PI
Tg (ºC)
Alcell 20/80/5 289 24.5 43 4.02 291.6 43.7 1351 4243 3.1 -61 30/70/2 238 19.0 51 48.96 279.7 29.5 1723 5877 3.4 -53 35/65/2 234 17.0 43 197.05 301.3 14.4 1661 6348 3.8 -47
Sarkanda 20/80/5 254 22.0 44 2.73 319.0 44.5 1253 5056 4.0 -63 30/70/2 176 17.0 61 43.40 322.8 27.0 1062 4529 4.3 -52 35/65/2 183 16.0 52 (1) 346.9 13.4 1005 4370 4.4 -48
Indulin AT 20/80/5 298 21.0 32 4.34 326.2 36.7 1224 3829 3.1 -60 30/70/2 266 19.0 35 66.56 348.8 24.2 1453 5331 3.7 -48 35/65/2 250 16.0 36 345.58 355.2 9.4 1497 5718 3.8 -43
Curan 27-11P 20/80/5 290 21.0 26 4.66 366.1 46.4 987 3606 3.7 -60 30/70/2 264 16.0 29 50.25 428.1 28.2 1034 4036 3.9 -52 35/65/2 248 16.0 29 245.41 433.7 11.5 959 4166 4.3 -50
(1)-Non-Newtonian behaviour
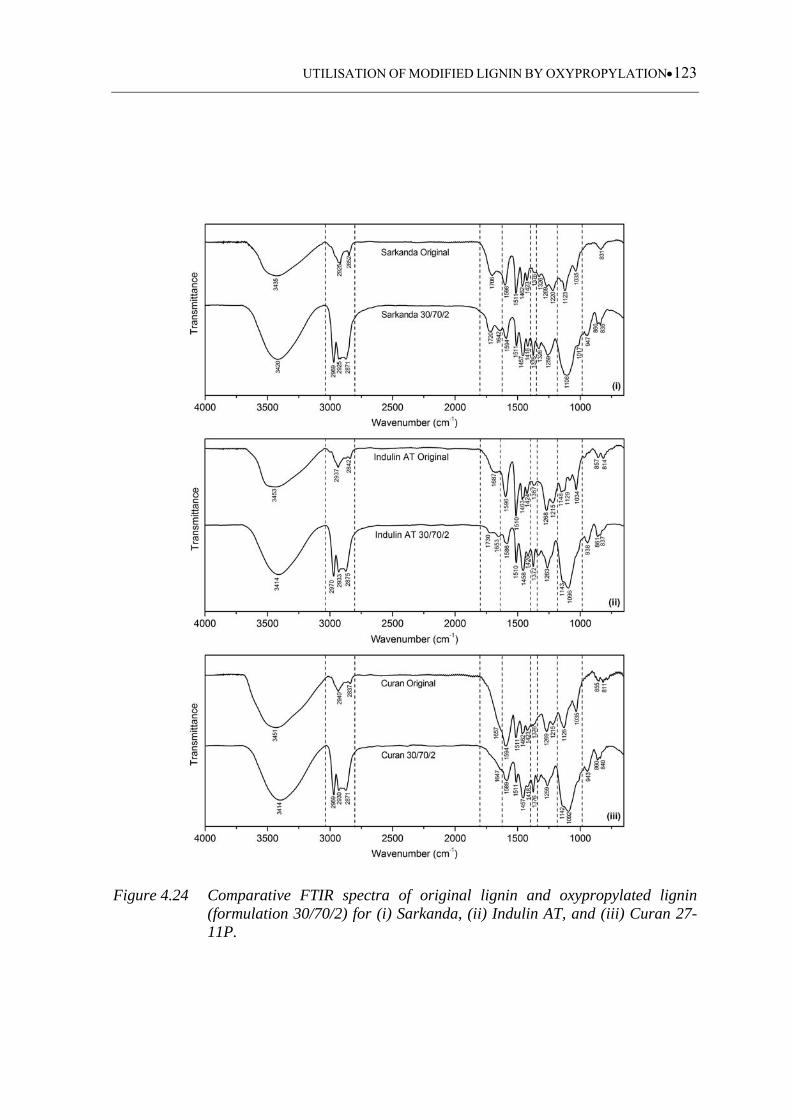
UTILISATION OF MODIFIED LIGNIN BY OXYPROPYLATION123
Figure 4.24 Comparative FTIR spectra of original lignin and oxypropylated lignin (formulation 30/70/2) for (i) Sarkanda, (ii) Indulin AT, and (iii) Curan 27-11P.
UTILISATION OF MODIFIED LIGNIN BY OXYPROPYLATION124
Figure 4.25 Comparative 13C-NMR spectra of original lignin and oxypropylated lignin (formulation 30/70/2) for (i) Sarkanda, (ii) Indulin AT, and (iii) Curan 27-11P.
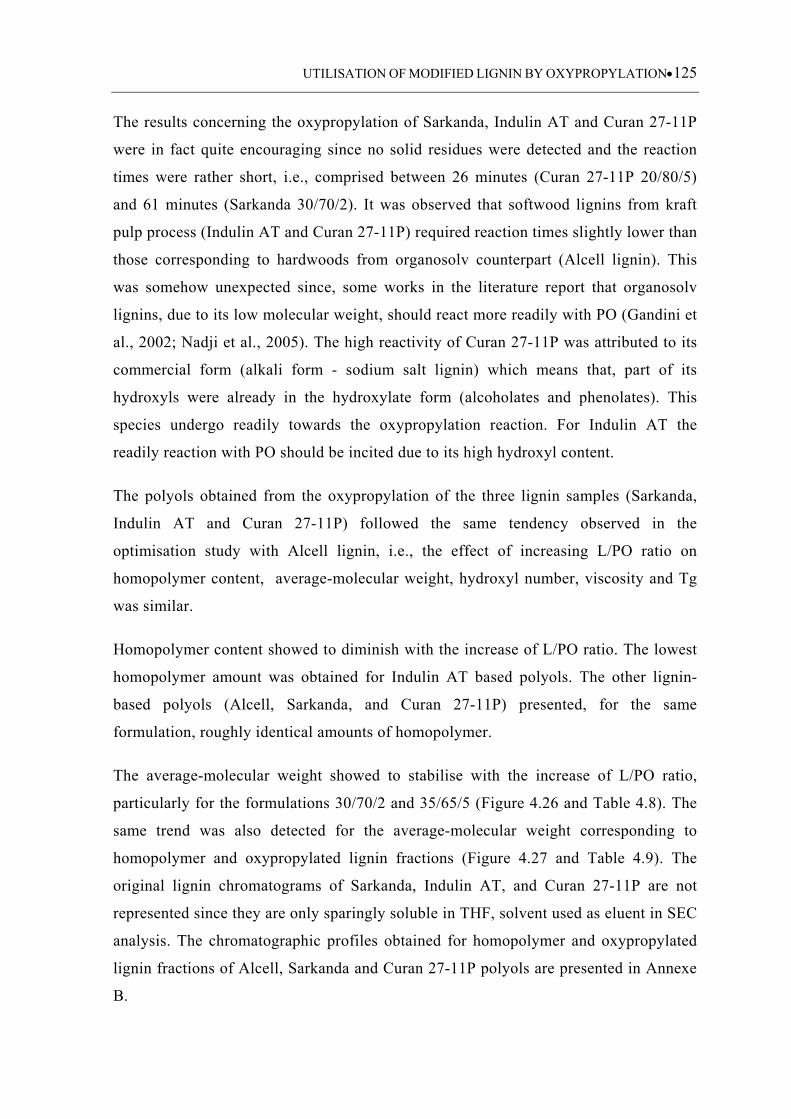
UTILISATION OF MODIFIED LIGNIN BY OXYPROPYLATION125
The results concerning the oxypropylation of Sarkanda, Indulin AT and Curan 27-11P
were in fact quite encouraging since no solid residues were detected and the reaction
times were rather short, i.e., comprised between 26 minutes (Curan 27-11P 20/80/5)
and 61 minutes (Sarkanda 30/70/2). It was observed that softwood lignins from kraft
pulp process (Indulin AT and Curan 27-11P) required reaction times slightly lower than
those corresponding to hardwoods from organosolv counterpart (Alcell lignin). This
was somehow unexpected since, some works in the literature report that organosolv
lignins, due to its low molecular weight, should react more readily with PO (Gandini et
al., 2002; Nadji et al., 2005). The high reactivity of Curan 27-11P was attributed to its
commercial form (alkali form - sodium salt lignin) which means that, part of its
hydroxyls were already in the hydroxylate form (alcoholates and phenolates). This
species undergo readily towards the oxypropylation reaction. For Indulin AT the
readily reaction with PO should be incited due to its high hydroxyl content.
The polyols obtained from the oxypropylation of the three lignin samples (Sarkanda,
Indulin AT and Curan 27-11P) followed the same tendency observed in the
optimisation study with Alcell lignin, i.e., the effect of increasing L/PO ratio on
homopolymer content, average-molecular weight, hydroxyl number, viscosity and Tg
was similar.
Homopolymer content showed to diminish with the increase of L/PO ratio. The lowest
homopolymer amount was obtained for Indulin AT based polyols. The other lignin-
based polyols (Alcell, Sarkanda, and Curan 27-11P) presented, for the same
formulation, roughly identical amounts of homopolymer.
The average-molecular weight showed to stabilise with the increase of L/PO ratio,
particularly for the formulations 30/70/2 and 35/65/5 (Figure 4.26 and Table 4.8). The
same trend was also detected for the average-molecular weight corresponding to
homopolymer and oxypropylated lignin fractions (Figure 4.27 and Table 4.9). The
original lignin chromatograms of Sarkanda, Indulin AT, and Curan 27-11P are not
represented since they are only sparingly soluble in THF, solvent used as eluent in SEC
analysis. The chromatographic profiles obtained for homopolymer and oxypropylated
lignin fractions of Alcell, Sarkanda and Curan 27-11P polyols are presented in Annexe
B.
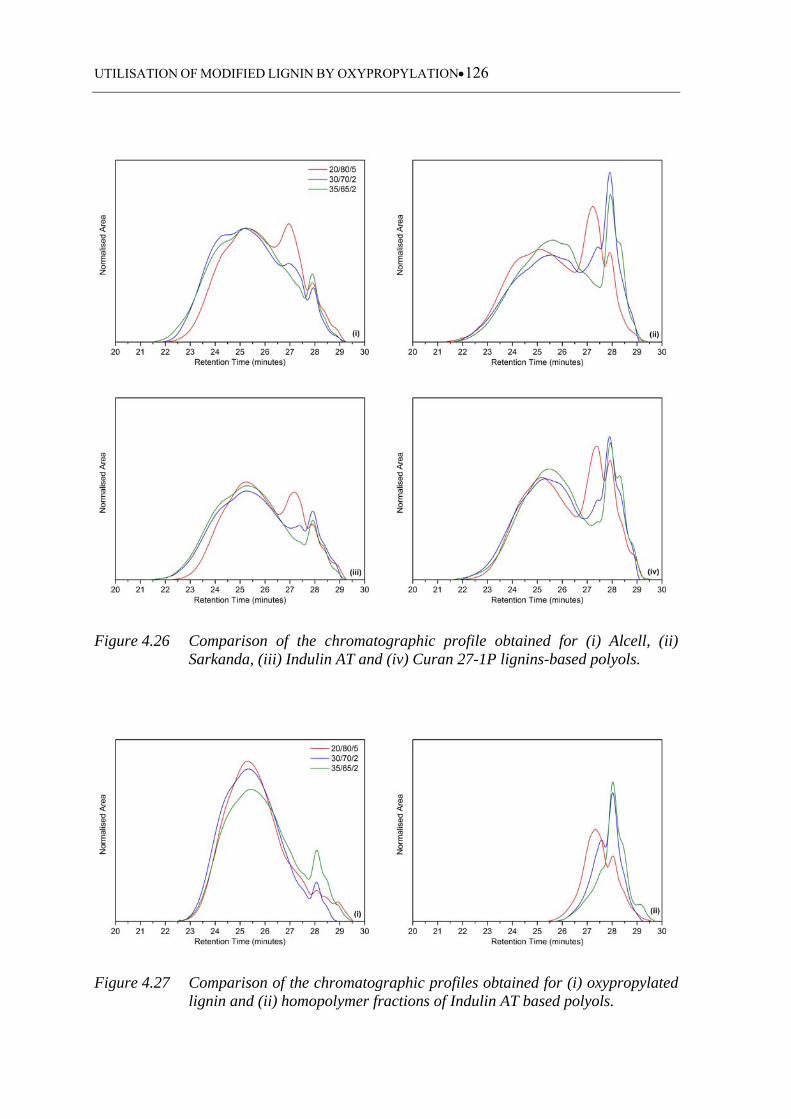
UTILISATION OF MODIFIED LIGNIN BY OXYPROPYLATION126
Figure 4.26 Comparison of the chromatographic profile obtained for (i) Alcell, (ii) Sarkanda, (iii) Indulin AT and (iv) Curan 27-1P lignins-based polyols.
Figure 4.27 Comparison of the chromatographic profiles obtained for (i) oxypropylated lignin and (ii) homopolymer fractions of Indulin AT based polyols.
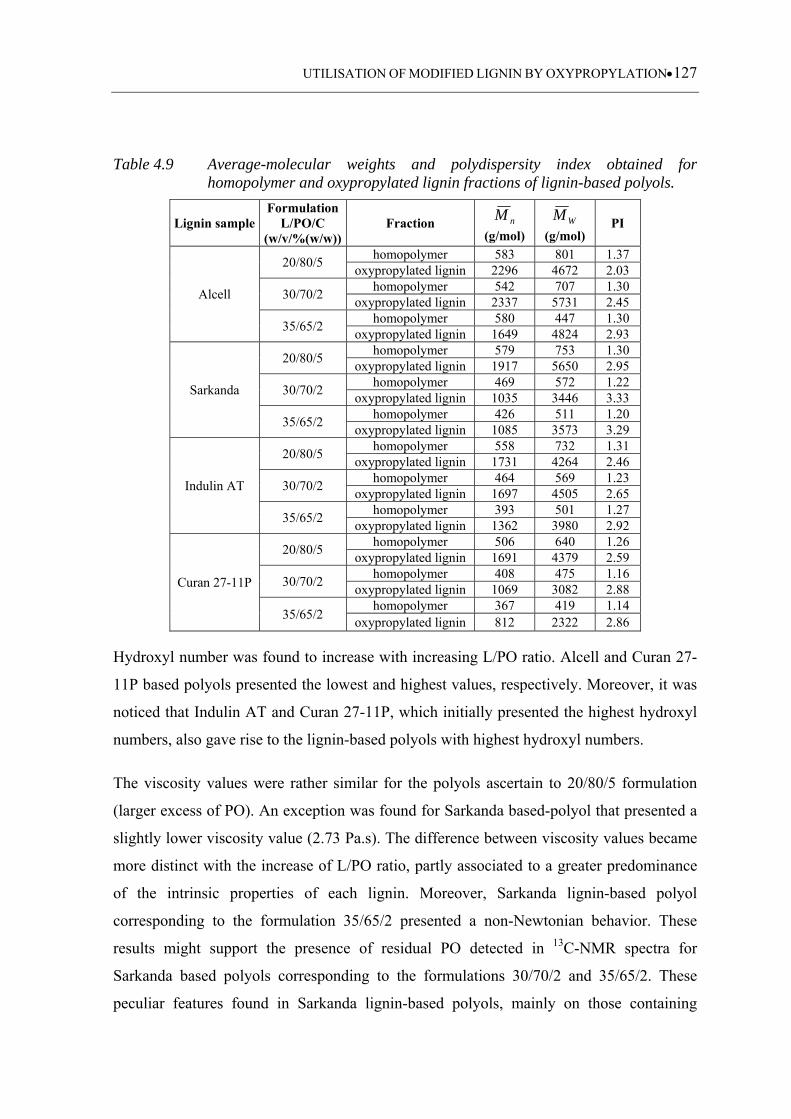
UTILISATION OF MODIFIED LIGNIN BY OXYPROPYLATION127
Table 4.9 Average-molecular weights and polydispersity index obtained for homopolymer and oxypropylated lignin fractions of lignin-based polyols.
Lignin sample Formulation
L/PO/C (w/v/%(w/w))
Fraction nM
(g/mol) WM
(g/mol) PI
Alcell
20/80/5 homopolymer 583 801 1.37
oxypropylated lignin 2296 4672 2.03
30/70/2 homopolymer 542 707 1.30
oxypropylated lignin 2337 5731 2.45
35/65/2 homopolymer 580 447 1.30
oxypropylated lignin 1649 4824 2.93
Sarkanda
20/80/5 homopolymer 579 753 1.30
oxypropylated lignin 1917 5650 2.95
30/70/2 homopolymer 469 572 1.22
oxypropylated lignin 1035 3446 3.33
35/65/2 homopolymer 426 511 1.20
oxypropylated lignin 1085 3573 3.29
Indulin AT
20/80/5 homopolymer 558 732 1.31
oxypropylated lignin 1731 4264 2.46
30/70/2 homopolymer 464 569 1.23
oxypropylated lignin 1697 4505 2.65
35/65/2 homopolymer 393 501 1.27
oxypropylated lignin 1362 3980 2.92
Curan 27-11P
20/80/5 homopolymer 506 640 1.26
oxypropylated lignin 1691 4379 2.59
30/70/2 homopolymer 408 475 1.16
oxypropylated lignin 1069 3082 2.88
35/65/2 homopolymer 367 419 1.14
oxypropylated lignin 812 2322 2.86
Hydroxyl number was found to increase with increasing L/PO ratio. Alcell and Curan 27-
11P based polyols presented the lowest and highest values, respectively. Moreover, it was
noticed that Indulin AT and Curan 27-11P, which initially presented the highest hydroxyl
numbers, also gave rise to the lignin-based polyols with highest hydroxyl numbers.
The viscosity values were rather similar for the polyols ascertain to 20/80/5 formulation
(larger excess of PO). An exception was found for Sarkanda based-polyol that presented a
slightly lower viscosity value (2.73 Pa.s). The difference between viscosity values became
more distinct with the increase of L/PO ratio, partly associated to a greater predominance
of the intrinsic properties of each lignin. Moreover, Sarkanda lignin-based polyol
corresponding to the formulation 35/65/2 presented a non-Newtonian behavior. These
results might support the presence of residual PO detected in 13C-NMR spectra for
Sarkanda based polyols corresponding to the formulations 30/70/2 and 35/65/2. These
peculiar features found in Sarkanda lignin-based polyols, mainly on those containing
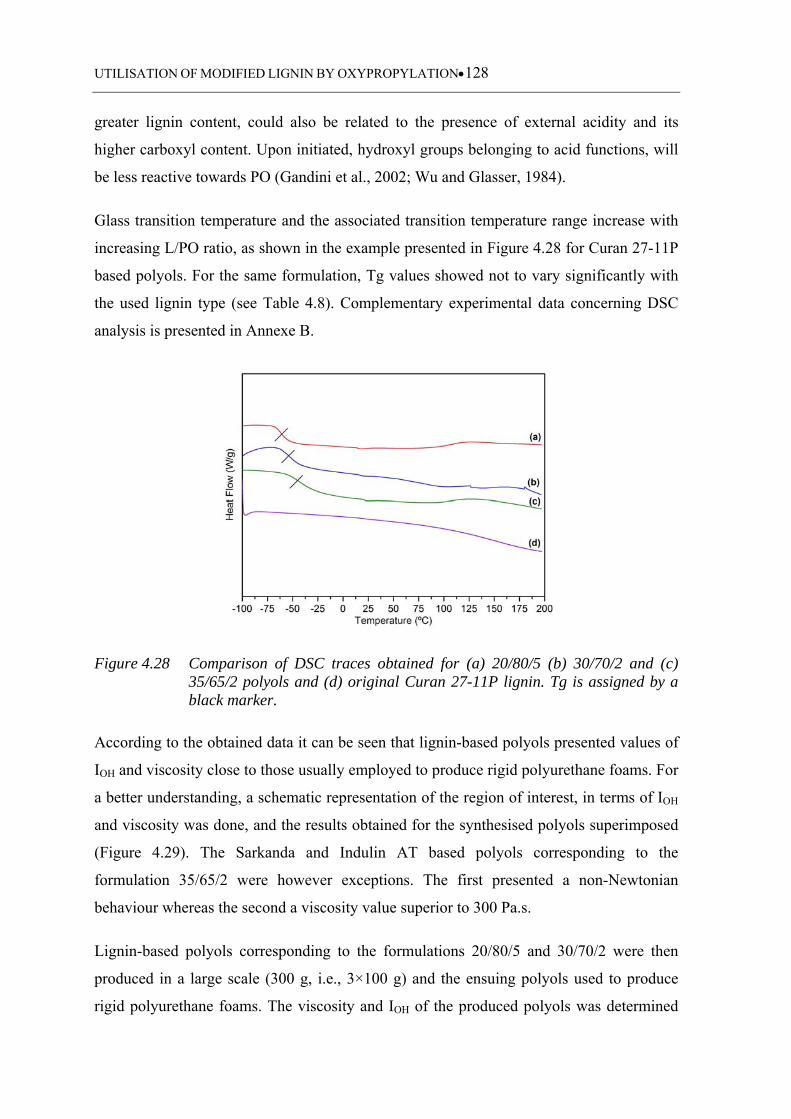
UTILISATION OF MODIFIED LIGNIN BY OXYPROPYLATION128
greater lignin content, could also be related to the presence of external acidity and its
higher carboxyl content. Upon initiated, hydroxyl groups belonging to acid functions, will
be less reactive towards PO (Gandini et al., 2002; Wu and Glasser, 1984).
Glass transition temperature and the associated transition temperature range increase with
increasing L/PO ratio, as shown in the example presented in Figure 4.28 for Curan 27-11P
based polyols. For the same formulation, Tg values showed not to vary significantly with
the used lignin type (see Table 4.8). Complementary experimental data concerning DSC
analysis is presented in Annexe B.
Figure 4.28 Comparison of DSC traces obtained for (a) 20/80/5 (b) 30/70/2 and (c) 35/65/2 polyols and (d) original Curan 27-11P lignin. Tg is assigned by a black marker.
According to the obtained data it can be seen that lignin-based polyols presented values of
IOH and viscosity close to those usually employed to produce rigid polyurethane foams. For
a better understanding, a schematic representation of the region of interest, in terms of IOH
and viscosity was done, and the results obtained for the synthesised polyols superimposed
(Figure 4.29). The Sarkanda and Indulin AT based polyols corresponding to the
formulation 35/65/2 were however exceptions. The first presented a non-Newtonian
behaviour whereas the second a viscosity value superior to 300 Pa.s.
Lignin-based polyols corresponding to the formulations 20/80/5 and 30/70/2 were then
produced in a large scale (300 g, i.e., 3×100 g) and the ensuing polyols used to produce
rigid polyurethane foams. The viscosity and IOH of the produced polyols was determined
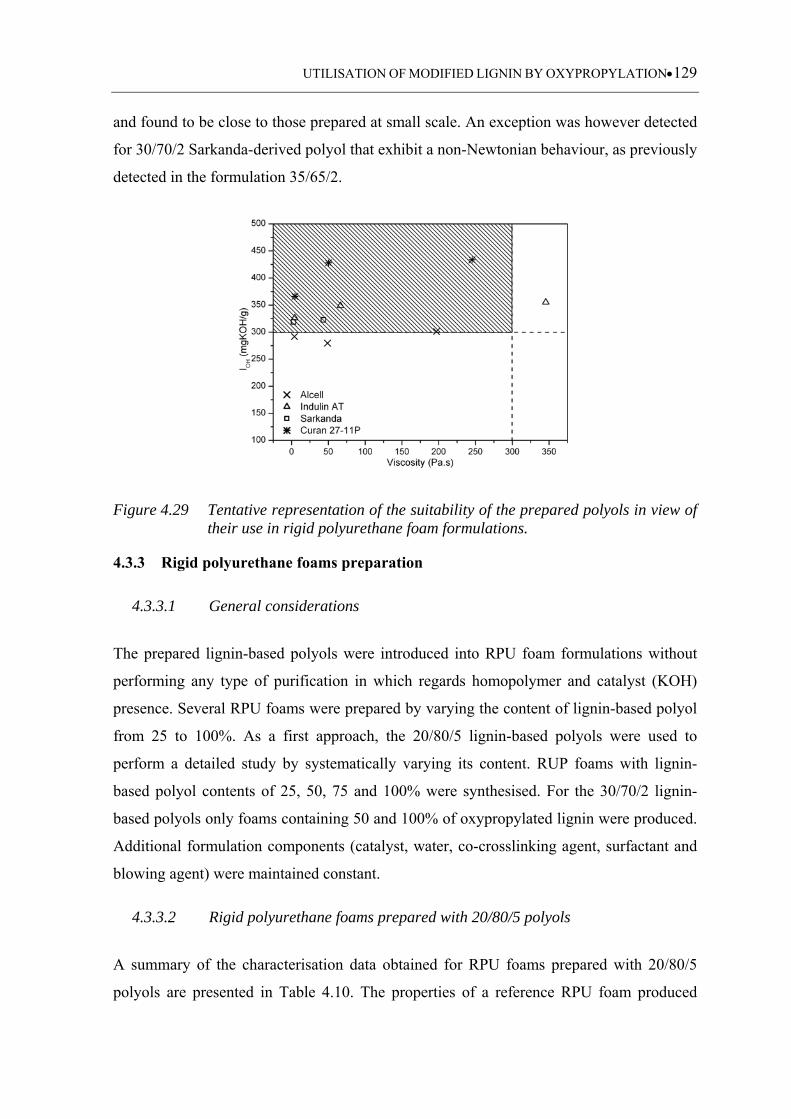
UTILISATION OF MODIFIED LIGNIN BY OXYPROPYLATION129
and found to be close to those prepared at small scale. An exception was however detected
for 30/70/2 Sarkanda-derived polyol that exhibit a non-Newtonian behaviour, as previously
detected in the formulation 35/65/2.
Figure 4.29 Tentative representation of the suitability of the prepared polyols in view of their use in rigid polyurethane foam formulations.
4.3.3 Rigid polyurethane foams preparation
4.3.3.1 General considerations
The prepared lignin-based polyols were introduced into RPU foam formulations without
performing any type of purification in which regards homopolymer and catalyst (KOH)
presence. Several RPU foams were prepared by varying the content of lignin-based polyol
from 25 to 100%. As a first approach, the 20/80/5 lignin-based polyols were used to
perform a detailed study by systematically varying its content. RUP foams with lignin-
based polyol contents of 25, 50, 75 and 100% were synthesised. For the 30/70/2 lignin-
based polyols only foams containing 50 and 100% of oxypropylated lignin were produced.
Additional formulation components (catalyst, water, co-crosslinking agent, surfactant and
blowing agent) were maintained constant.
4.3.3.2 Rigid polyurethane foams prepared with 20/80/5 polyols
A summary of the characterisation data obtained for RPU foams prepared with 20/80/5
polyols are presented in Table 4.10. The properties of a reference RPU foam produced
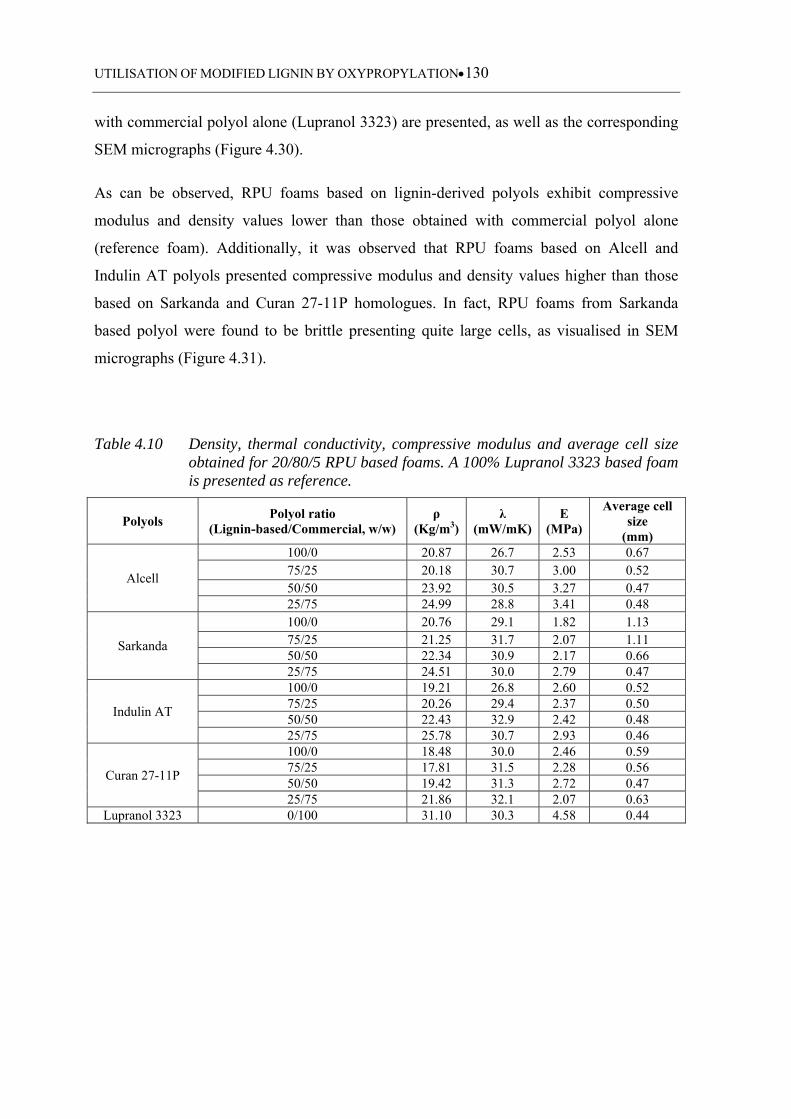
UTILISATION OF MODIFIED LIGNIN BY OXYPROPYLATION130
with commercial polyol alone (Lupranol 3323) are presented, as well as the corresponding
SEM micrographs (Figure 4.30).
As can be observed, RPU foams based on lignin-derived polyols exhibit compressive
modulus and density values lower than those obtained with commercial polyol alone
(reference foam). Additionally, it was observed that RPU foams based on Alcell and
Indulin AT polyols presented compressive modulus and density values higher than those
based on Sarkanda and Curan 27-11P homologues. In fact, RPU foams from Sarkanda
based polyol were found to be brittle presenting quite large cells, as visualised in SEM
micrographs (Figure 4.31).
Table 4.10 Density, thermal conductivity, compressive modulus and average cell size obtained for 20/80/5 RPU based foams. A 100% Lupranol 3323 based foam is presented as reference.
Polyols Polyol ratio
(Lignin-based/Commercial, w/w) ρ
(Kg/m3) λ
(mW/mK) E
(MPa)
Average cell size
(mm)
Alcell
100/0 20.87 26.7 2.53 0.67 75/25 20.18 30.7 3.00 0.52 50/50 23.92 30.5 3.27 0.47 25/75 24.99 28.8 3.41 0.48
Sarkanda
100/0 20.76 29.1 1.82 1.13 75/25 21.25 31.7 2.07 1.11 50/50 22.34 30.9 2.17 0.66 25/75 24.51 30.0 2.79 0.47
Indulin AT
100/0 19.21 26.8 2.60 0.52 75/25 20.26 29.4 2.37 0.50 50/50 22.43 32.9 2.42 0.48 25/75 25.78 30.7 2.93 0.46
Curan 27-11P
100/0 18.48 30.0 2.46 0.59 75/25 17.81 31.5 2.28 0.56 50/50 19.42 31.3 2.72 0.47 25/75 21.86 32.1 2.07 0.63
Lupranol 3323 0/100 31.10 30.3 4.58 0.44
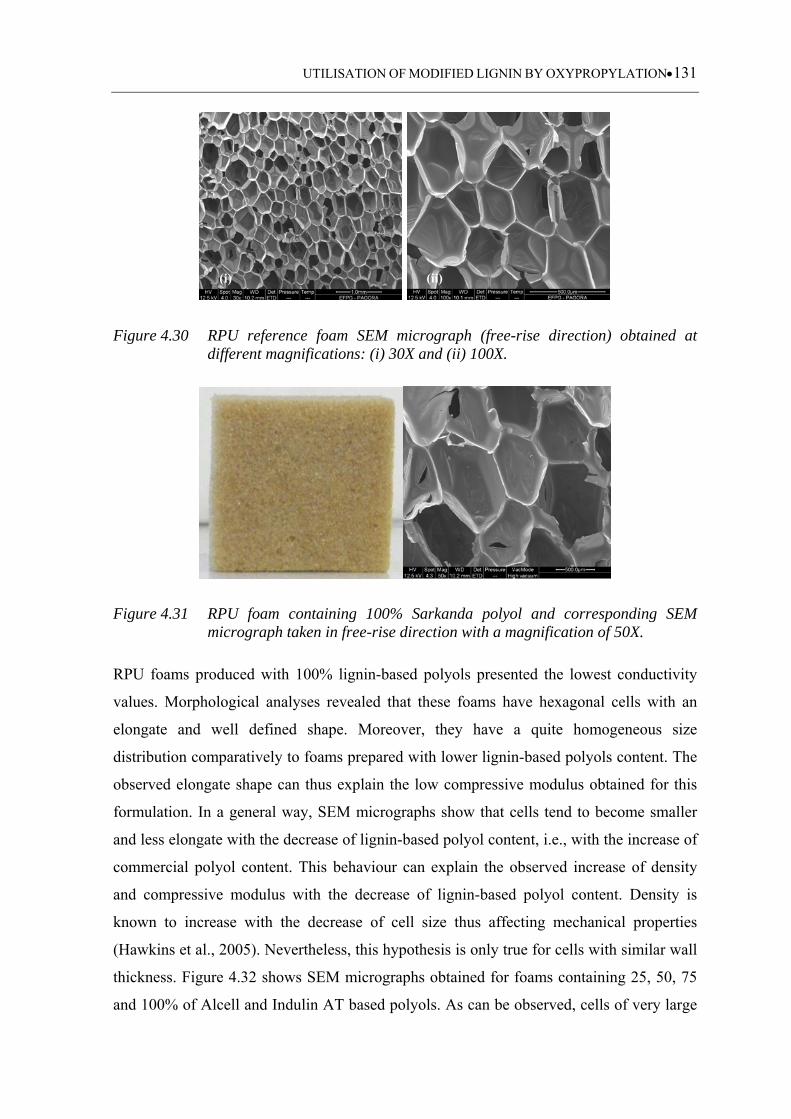
UTILISATION OF MODIFIED LIGNIN BY OXYPROPYLATION131
(i)
(ii)
Figure 4.30 RPU reference foam SEM micrograph (free-rise direction) obtained at different magnifications: (i) 30X and (ii) 100X.
Figure 4.31 RPU foam containing 100% Sarkanda polyol and corresponding SEM micrograph taken in free-rise direction with a magnification of 50X.
RPU foams produced with 100% lignin-based polyols presented the lowest conductivity
values. Morphological analyses revealed that these foams have hexagonal cells with an
elongate and well defined shape. Moreover, they have a quite homogeneous size
distribution comparatively to foams prepared with lower lignin-based polyols content. The
observed elongate shape can thus explain the low compressive modulus obtained for this
formulation. In a general way, SEM micrographs show that cells tend to become smaller
and less elongate with the decrease of lignin-based polyol content, i.e., with the increase of
commercial polyol content. This behaviour can explain the observed increase of density
and compressive modulus with the decrease of lignin-based polyol content. Density is
known to increase with the decrease of cell size thus affecting mechanical properties
(Hawkins et al., 2005). Nevertheless, this hypothesis is only true for cells with similar wall
thickness. Figure 4.32 shows SEM micrographs obtained for foams containing 25, 50, 75
and 100% of Alcell and Indulin AT based polyols. As can be observed, cells of very large
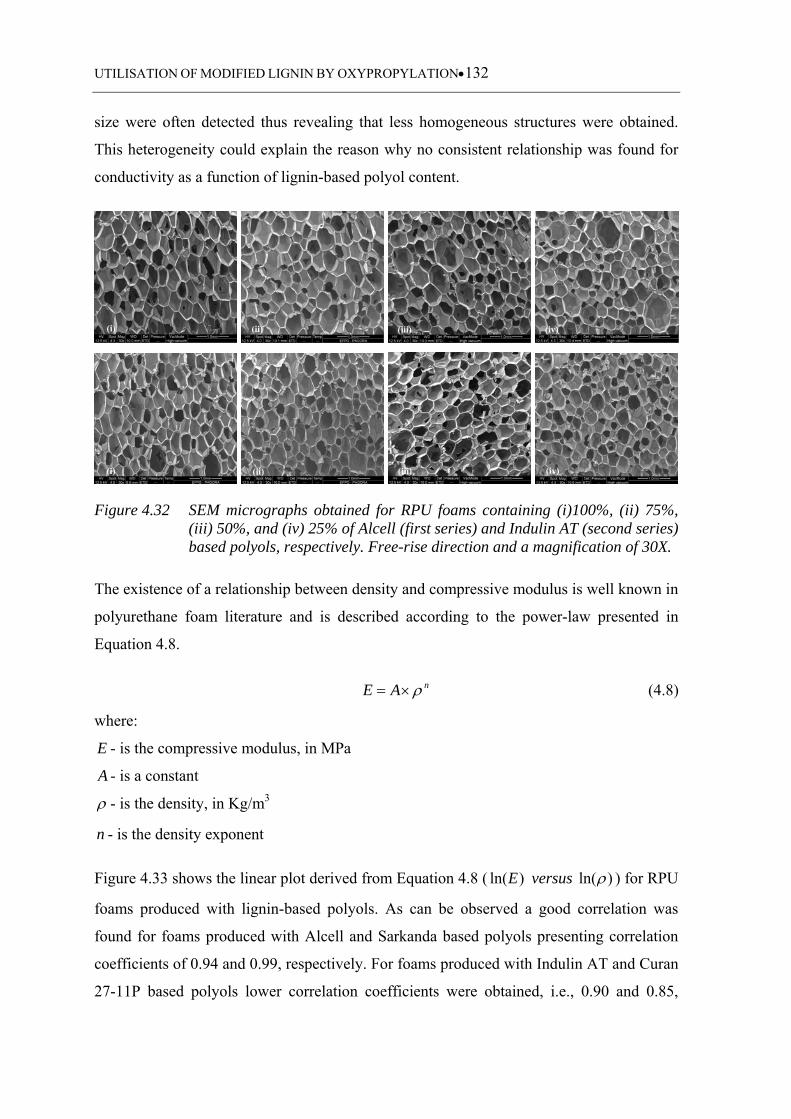
UTILISATION OF MODIFIED LIGNIN BY OXYPROPYLATION132
size were often detected thus revealing that less homogeneous structures were obtained.
This heterogeneity could explain the reason why no consistent relationship was found for
conductivity as a function of lignin-based polyol content.
(i)
(ii)
(iii)
(iv)
(i)
(ii)
(iii)
(iv)
Figure 4.32 SEM micrographs obtained for RPU foams containing (i)100%, (ii) 75%, (iii) 50%, and (iv) 25% of Alcell (first series) and Indulin AT (second series) based polyols, respectively. Free-rise direction and a magnification of 30X.
The existence of a relationship between density and compressive modulus is well known in
polyurethane foam literature and is described according to the power-law presented in
Equation 4.8.
nAE (4.8)
where:
E - is the compressive modulus, in MPa
A - is a constant
- is the density, in Kg/m3
n - is the density exponent
Figure 4.33 shows the linear plot derived from Equation 4.8 ( )ln(E versus )ln( ) for RPU
foams produced with lignin-based polyols. As can be observed a good correlation was
found for foams produced with Alcell and Sarkanda based polyols presenting correlation
coefficients of 0.94 and 0.99, respectively. For foams produced with Indulin AT and Curan
27-11P based polyols lower correlation coefficients were obtained, i.e., 0.90 and 0.85,
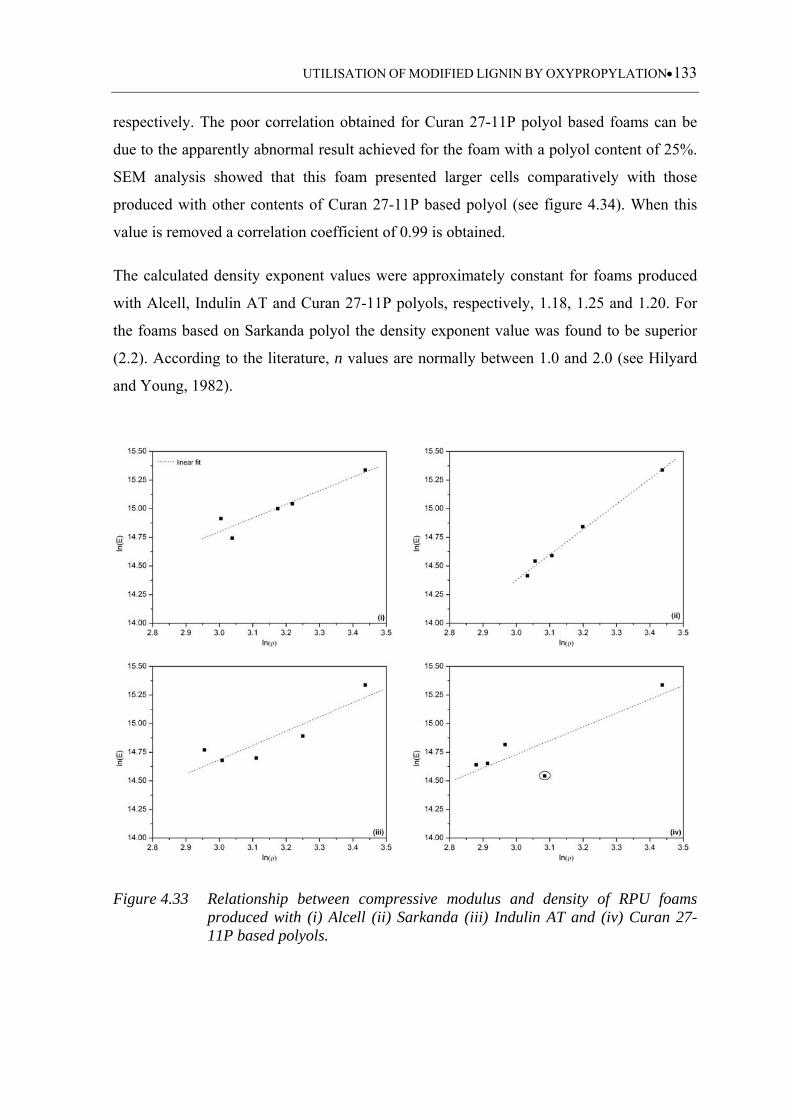
UTILISATION OF MODIFIED LIGNIN BY OXYPROPYLATION133
respectively. The poor correlation obtained for Curan 27-11P polyol based foams can be
due to the apparently abnormal result achieved for the foam with a polyol content of 25%.
SEM analysis showed that this foam presented larger cells comparatively with those
produced with other contents of Curan 27-11P based polyol (see figure 4.34). When this
value is removed a correlation coefficient of 0.99 is obtained.
The calculated density exponent values were approximately constant for foams produced
with Alcell, Indulin AT and Curan 27-11P polyols, respectively, 1.18, 1.25 and 1.20. For
the foams based on Sarkanda polyol the density exponent value was found to be superior
(2.2). According to the literature, n values are normally between 1.0 and 2.0 (see Hilyard
and Young, 1982).
Figure 4.33 Relationship between compressive modulus and density of RPU foams produced with (i) Alcell (ii) Sarkanda (iii) Indulin AT and (iv) Curan 27-11P based polyols.
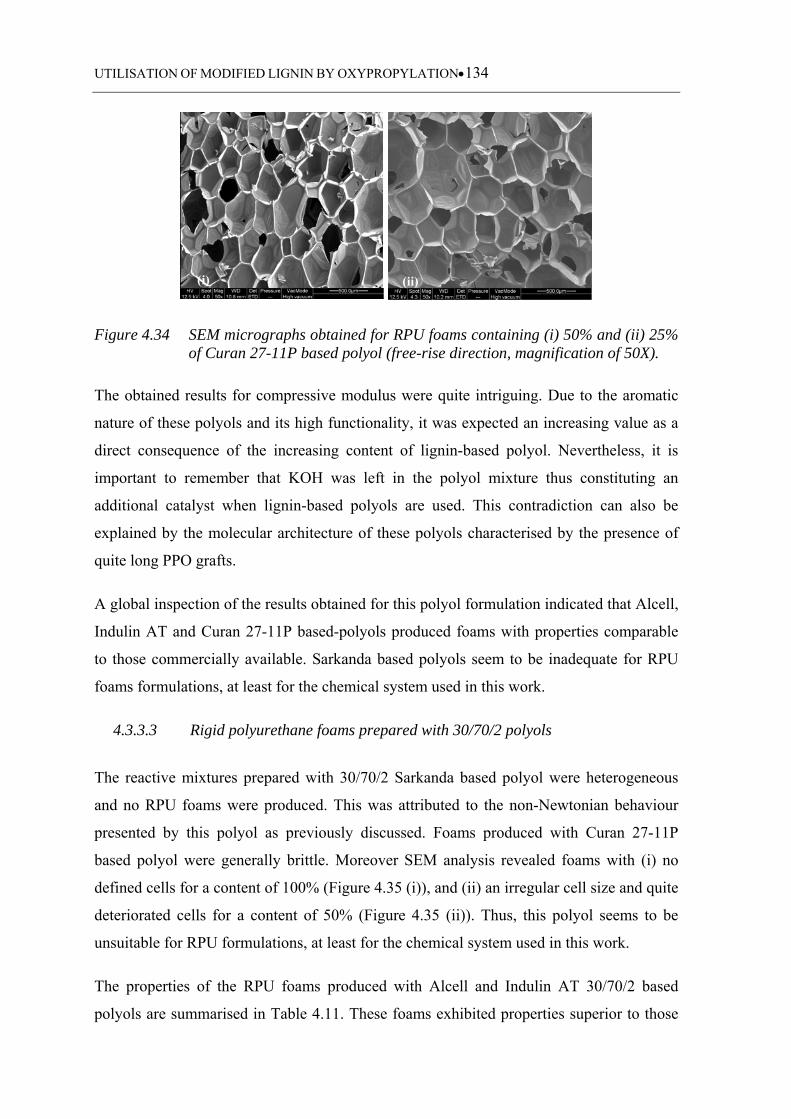
UTILISATION OF MODIFIED LIGNIN BY OXYPROPYLATION134
(i)
(ii)
Figure 4.34 SEM micrographs obtained for RPU foams containing (i) 50% and (ii) 25% of Curan 27-11P based polyol (free-rise direction, magnification of 50X).
The obtained results for compressive modulus were quite intriguing. Due to the aromatic
nature of these polyols and its high functionality, it was expected an increasing value as a
direct consequence of the increasing content of lignin-based polyol. Nevertheless, it is
important to remember that KOH was left in the polyol mixture thus constituting an
additional catalyst when lignin-based polyols are used. This contradiction can also be
explained by the molecular architecture of these polyols characterised by the presence of
quite long PPO grafts.
A global inspection of the results obtained for this polyol formulation indicated that Alcell,
Indulin AT and Curan 27-11P based-polyols produced foams with properties comparable
to those commercially available. Sarkanda based polyols seem to be inadequate for RPU
foams formulations, at least for the chemical system used in this work.
4.3.3.3 Rigid polyurethane foams prepared with 30/70/2 polyols
The reactive mixtures prepared with 30/70/2 Sarkanda based polyol were heterogeneous
and no RPU foams were produced. This was attributed to the non-Newtonian behaviour
presented by this polyol as previously discussed. Foams produced with Curan 27-11P
based polyol were generally brittle. Moreover SEM analysis revealed foams with (i) no
defined cells for a content of 100% (Figure 4.35 (i)), and (ii) an irregular cell size and quite
deteriorated cells for a content of 50% (Figure 4.35 (ii)). Thus, this polyol seems to be
unsuitable for RPU formulations, at least for the chemical system used in this work.
The properties of the RPU foams produced with Alcell and Indulin AT 30/70/2 based
polyols are summarised in Table 4.11. These foams exhibited properties superior to those
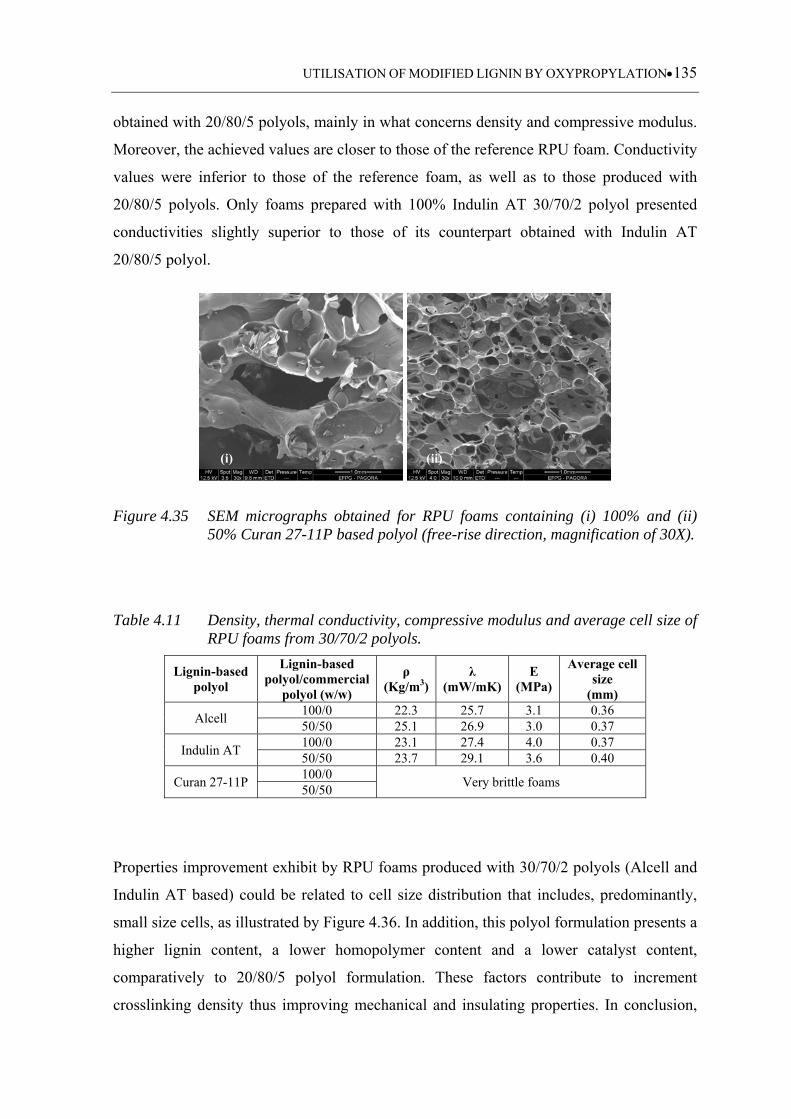
UTILISATION OF MODIFIED LIGNIN BY OXYPROPYLATION135
obtained with 20/80/5 polyols, mainly in what concerns density and compressive modulus.
Moreover, the achieved values are closer to those of the reference RPU foam. Conductivity
values were inferior to those of the reference foam, as well as to those produced with
20/80/5 polyols. Only foams prepared with 100% Indulin AT 30/70/2 polyol presented
conductivities slightly superior to those of its counterpart obtained with Indulin AT
20/80/5 polyol.
(i)
(ii)
Figure 4.35 SEM micrographs obtained for RPU foams containing (i) 100% and (ii) 50% Curan 27-11P based polyol (free-rise direction, magnification of 30X).
Table 4.11 Density, thermal conductivity, compressive modulus and average cell size of RPU foams from 30/70/2 polyols.
Lignin-based polyol
Lignin-based polyol/commercial
polyol (w/w)
ρ (Kg/m3)
λ (mW/mK)
E (MPa)
Average cell size
(mm)
Alcell 100/0 22.3 25.7 3.1 0.36 50/50 25.1 26.9 3.0 0.37
Indulin AT 100/0 23.1 27.4 4.0 0.37 50/50 23.7 29.1 3.6 0.40
Curan 27-11P 100/0
Very brittle foams 50/50
Properties improvement exhibit by RPU foams produced with 30/70/2 polyols (Alcell and
Indulin AT based) could be related to cell size distribution that includes, predominantly,
small size cells, as illustrated by Figure 4.36. In addition, this polyol formulation presents a
higher lignin content, a lower homopolymer content and a lower catalyst content,
comparatively to 20/80/5 polyol formulation. These factors contribute to increment
crosslinking density thus improving mechanical and insulating properties. In conclusion,
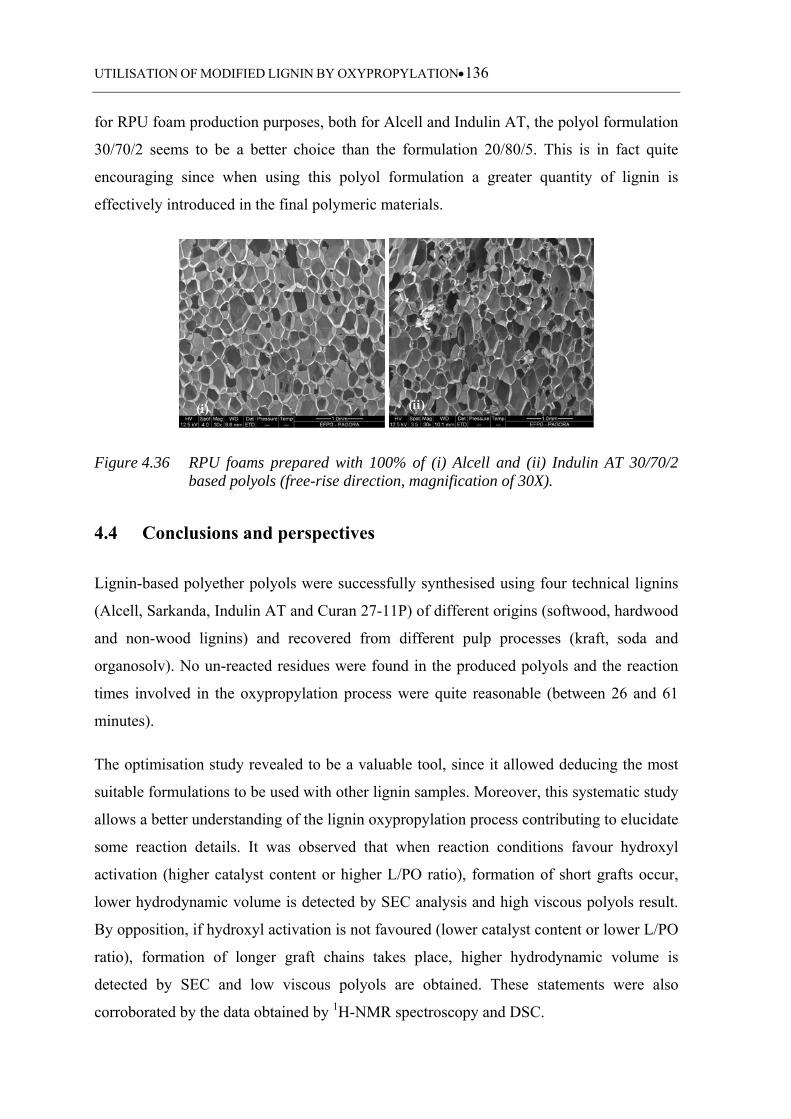
UTILISATION OF MODIFIED LIGNIN BY OXYPROPYLATION136
for RPU foam production purposes, both for Alcell and Indulin AT, the polyol formulation
30/70/2 seems to be a better choice than the formulation 20/80/5. This is in fact quite
encouraging since when using this polyol formulation a greater quantity of lignin is
effectively introduced in the final polymeric materials.
(i)
(ii)
Figure 4.36 RPU foams prepared with 100% of (i) Alcell and (ii) Indulin AT 30/70/2 based polyols (free-rise direction, magnification of 30X).
4.4 Conclusions and perspectives
Lignin-based polyether polyols were successfully synthesised using four technical lignins
(Alcell, Sarkanda, Indulin AT and Curan 27-11P) of different origins (softwood, hardwood
and non-wood lignins) and recovered from different pulp processes (kraft, soda and
organosolv). No un-reacted residues were found in the produced polyols and the reaction
times involved in the oxypropylation process were quite reasonable (between 26 and 61
minutes).
The optimisation study revealed to be a valuable tool, since it allowed deducing the most
suitable formulations to be used with other lignin samples. Moreover, this systematic study
allows a better understanding of the lignin oxypropylation process contributing to elucidate
some reaction details. It was observed that when reaction conditions favour hydroxyl
activation (higher catalyst content or higher L/PO ratio), formation of short grafts occur,
lower hydrodynamic volume is detected by SEC analysis and high viscous polyols result.
By opposition, if hydroxyl activation is not favoured (lower catalyst content or lower L/PO
ratio), formation of longer graft chains takes place, higher hydrodynamic volume is
detected by SEC and low viscous polyols are obtained. These statements were also
corroborated by the data obtained by 1H-NMR spectroscopy and DSC.
UTILISATION OF MODIFIED LIGNIN BY OXYPROPYLATION137
Quantitative 1H-NMR showed that grafts become shorter with the increase of lignin
content and Tg was found to increase with the increase of lignin content. Moreover, in this
context and to the best of our knowledge, the size exclusion chromatography and the
interpretation of the resulting chromatograms were never performed before this study.
Polyols produced using the formulations deduced from the optimisation study presented
IOH and viscosity values close to those of commercial polyols typically employed in rigid
polyurethane synthesis. Nevertheless quite peculiar features were detected in Sarkanda
lignin-based polyols as evidenced by 13C-NMR spectroscopy and viscosity measurements.
This behaviour was attributed to some intrinsic properties presented by this lignin sample
such as its content in carboxylic and carbonyl groups, as well as, the presence of external
acidity.
RPU foams produced using the polyol formulations 20/80/5 and 30/70/2 exhibit properties
similar to those of RPU foams commercially available. Nevertheless, some exceptions
were detected mainly in which regards foams produced with both Sarkanda based polyols
and 30/70/2 Curan 27-11P based polyol, which were found to be inappropriate for RPU
formulations. Foams produced with these polyols were found to be quite brittle and, in the
case of 30/70/2 Sarkanda polyol, its complex rheological properties conducted to the
elaboration of very heterogeneous reactive mixtures hindering foam formation.
RPU foams produced with Alcell and Indulin AT 30/70/2 polyols exhibited properties
superior to those obtained with the corresponding 20/80/5 based polyols. This behaviour
can be associated with: (i) a more prominent presence of lignin and (iii) a less pronounced
contribution of KOH catalyst in foam formation. These results were in fact quite
encouraging since when using 30/70/2 polyol formulation a greater quantity of lignin is
effectively introduced in the final polymeric materials.
In this study, the used characterisation methods together with the chosen reaction
conditions allowed identifying and interpreting some phenomena related to lignin
oxypropylation process. When using high L/PO ratio and/or the catalyst content, properties
evolution are not so notorious, as was observed in this work and most often detected in the
published works. Compared to other studies, the chosen formulations provide a huge
amount of information concerning cause-effects evaluation and it is therefore an ideal
approach to understand the oxypropylation process.

UTILISATION OF MODIFIED LIGNIN BY OXYPROPYLATION138
The information acquired from the optimisation study can also contribute to design lignin
based polyols for materials other than rigid polyurethane foams. For example, we can
envisage the interest of producing polyols with lower hydroxyl index and longer polyether
grafted chains that can be used, possibly, to produce urethane products with higher
flexibility.
UTILISATION OF MODIFIED LIGNIN BY OXYPROPYLATION139
4.5 References
Belgacem, N.M., Gandini, A., 2008. Partial or total oxypropylation of natural polymers
and the use of the ensuing materials as composites or polyol macromonomers. In:
Monomers, polymers and composites from renewable resources. Belgacem, N.M. Gandini,
A., (Eds). Elsevier publications, 273-288.
Ciemniecki, S.L., Glasser, W.G., 1988. Multiphase materials with lignin: 2. Blends of
hydroxypropyl lignin with poly(vinyl alcohol). Polymer 29, 1030-1036.
Daniel, T.C., Leandro, S., Look, M., Cerito, E., Nobell, A., Armstrong, T.S., 1970. United
States Patent 3,546,199.
Evtouguina, M., Gandini, A., Barros, A.M., Cruz-Pinto, J.J., Pascoal-Neto, C., Belgacem,
M.N., 2000. The oxypropylation of cork residues: Preliminary results. Bioresource
Technology 73, 187-189.
Fernandes, S., Freire, C.S.R., Pascoal-Neto, C., Gandini, A., 2008. The bulk
oxypropylation of chitin and chitosan and the characterisation of the ensuing polyols.
Green Chem. 10, 93-97.
Fleurent, H., Thijs, S., 1995. The use of pentanes as blowing agent in rigid polyurethane
foam. Journal of cellular plastics 31, 580-599.
Gandini, A., Belgacem, M.N., Guo, Z.-X., Montanari, S., 2002. Lignin as macromonomers
for polyesther and polyurethanes. In: Chemical modification, properties, and usage of
lignin. Hu, T. Q. (Ed). Kluwer Academic Plenum Publishers, New York, 57-80.
Gandini, A., Curvelo, A.A.S., Pasquini, D., de Menezes, A.J., 2005. Direct transformation
of cellulose fibres into self-reinforced composites by partial oxypropylation. Polymer, 46,
10611-10613.
Gandini, A., Curvelo, A.A.S., Pasquini, D., de Menezes, A.J., 2007. Novel thermoplastic
materials based on the Outer-Shell oxypropylation of Corn Starch granules.
Biomacromolecules, 8, 2047-2050.
UTILISATION OF MODIFIED LIGNIN BY OXYPROPYLATION140
Glasser, W.G., Barnett, C. A., Rials, T.G., Saraf, V.P., 1984. Engineering plastics from
lignin. II. Characterisation of hydroxyalkyl lignin derivatives. J. Appl. Polym. Sci. 29,
1815-1830.
Glasser, W.G., Leitheiser, R.H., 1984. Engineering plastics from lignin.11. Hydroxypropyl
lignins as components of fire resistant foams. Polymer Bulletin 12, 1-5.
Glasser, W.G., Oliveira, W., Kelley, S.S., 1990. Method of producing prepolymers from
hydroxyalkyl lignin derivatives. United States Patent 4,918,167.
Glasser, W.G., Oliveira, W., Kelley, S.S., Nieh, L.S., 1991. Method of producing start-like
polymers from lignin. United States Patent 5,066,790.
Glasser, W.G., Wu, L.C.F., Selin, J.F., 1983. Synthesis, structure and some properties of
hydroxylpropyl lignins. In: Wood and Agricultural residues-Research on the use for feed,
fuels and chemicals. Soltes, E.J. (Ed). Academic Press, New York, 149-166.
Hawkins, M.C., O´Toole, B., Jackovich, D., 2005. Cell morphology and mechanical
properties of rigid polyurethane foam, Journal of Cellular Plastic 41, 267-285.
Hilyard, N.C., Young, J., 1982. Introduction. In: Mechanics of celular plastics. Hilyard,
N.C., (Eds). Applied science publishers.
Hofmann, K., Glasser, W.G., 1993. Engineering plastics from lignin. 21. Synthesis and
properties of epoxidized lignin-poly(propylene oxide) copolymers. J. Wood Chem.Techn.
13, 73-95.
Ionescu, M., 2005. Chemistry and technology of polyols for polyurethanes. Rapra
Technology.
Kim, Y.H., Lee, J.W., Choi, S.J., Han, M.S., Kim, J.M., Kim, S.B., Kim, W.N., 2007.
Properties ofrigid polyurethane foams blown by HFC-365mfc and distilled water. J. Ind.
Eng. Chem. 13, 1076-1082.
Kurple, K.R., 2000. Lignin based polyols. United States Patent 6,025,452.
Lee, S.-T., Ramesh, N.S., 2004. Polymeric foams: Mechanisms and materials. CRC press.
UTILISATION OF MODIFIED LIGNIN BY OXYPROPYLATION141
Lucas, A., Rodríguez, Pérez-Collado, M., Sánchez, P., Rodríguez, J.F., 2002. Synthesis of
polyols by anionic polymerization: determination of kinetic parameters of propylene oxide
polymerization using caesium and potassium alcoholates. Polym. Int. 51, 1066-1071.
Nadji, H., Bruzzèse, C., Belgacem, M.N., Benaboura, A., Gandini, A., 2005.
Oxypropylation of lignins and preparation of rigid polyurethane foams from the ensuing
polyols. Macromol. Mater. Eng. 209, 1009-1016.
Nakamura, K., Morck, R., Reimann, A., Kringstad, K., 1989. Compression properties of
polyurethane foam derived from kraft lignin. In: Wood processing andutilisation. Kennedy,
J.F., Phillips, G.O., Williams, P.A. (Eds). Ellis Horwood Limited, Chichester, 175-180.
Oliveira, W., Glasser, W.G., 1994. Multiphase materials with lignin. 11. Startlike
copolymers caprolactone. Macromolecules 27, 5-11 (a).
Oliveira, W., Glasser, W.G., 1994. Multiphase materials with lignin. 13. Block copolymers
with cellulose propionate. Polymer 35, 1977-1985 (b).
Pavier C, Gandini A. Oxypropylation of sugar beet pulp. 2. Separation of the grafted pulp
from the propylene oxide homopolymer. Carbohydrate Polymers 2000; 42: 13-17.
Pavier, C., Gandini, A., 2000. Oxyproylation of sugar beet pulp. 1. Optimisation of the
reaction. Ind. Crops and Prod. 12, 1-8.
Saraf, V.P., Glasser, W.G., Wilkes, G.L., 1985. Engineering plastics from lignin. VII.
Structure property relationships of poly(butadiene glycol)-containing polyurethane
networks. J. Appl. Polym. Sci. 30, 3809-3823.
Szychers, M., 1999. Szycher`s Handbook of Polyurethanes. CRC press, Boca Raton.
Velazquez-Morales, P., Gandini, A., Le Nest, J.P., 1998. Polymer electrolytes derived
from chitosan/polyether networks. Electrochim. Acta 43, 1275-1279.
Woods, G., 1990. The ICI polyurethanes book. Wiley, New York.
Wu, L.C.F., Glasser, W.G., 1984. Engineering plastics from lignin. I. Synthesis of
hydroxypropyl lignin. J. Appl. Polym. Sci. 9, 1111-1123.

UTILISATION OF MODIFIED LIGNIN BY OXYPROPYLATION142
Yang, L., Heatley, F., Blease, T.G., Thompson, R.I.G., 1996. A study of the mechanism of
the oxidative thermal degradation of poly(ethylene oxide) and poly(propylene oxide) using 1H- and 13C-NMR. Eur. Polym. J. 32, 535-547.
5. Utilisation of lignin without chemical modification
The present chapter refers to the utilisation of lignin as a macromonomer in polyurethane
synthesis as such and without any previous purification or chemical modification. The
kinetics involved in the formation of lignin-based polyurethanes was inspected as well as
the thermo-mechanical properties of the resulting lignin-based polyurethanes.
The used chemical system consisted on lignin (only Alcell and Indulin AT were used in this
study), 4,4’-methylene-diphenylene diisocyanate (MDI) and polycaprolactone (PCL) of
three different average-molecular weights (400, 750 and 1000). The polymerisation
reaction was carried in bulk and without the presence of catalyst which clearly evidences
the green connotations of this work. Additionally, PCL is biodegradable. The following
variables were studied: kraft and organosolv lignins with different contents (10, 15, 20 and
25% (w/w)), PCL with molecular weights of 400, 750 and 1000 and [NCO]/[OH] ratios of
0.8, 1.0 and 1.25.
Formation of lignin-based polyurethanes was monitored by Fourier transform infrared
spectroscopy working in attenuated total reflectance mode (FTIR-ATR). Kinetics were
analysed according to a global second order model. The thermo-mechanical properties
were examined by differential scanning calorimetry and dynamic mechanical analysis
(DMA). Swelling tests were performed in dimethylformamide. The structure-properties
relationships were tentatively established.
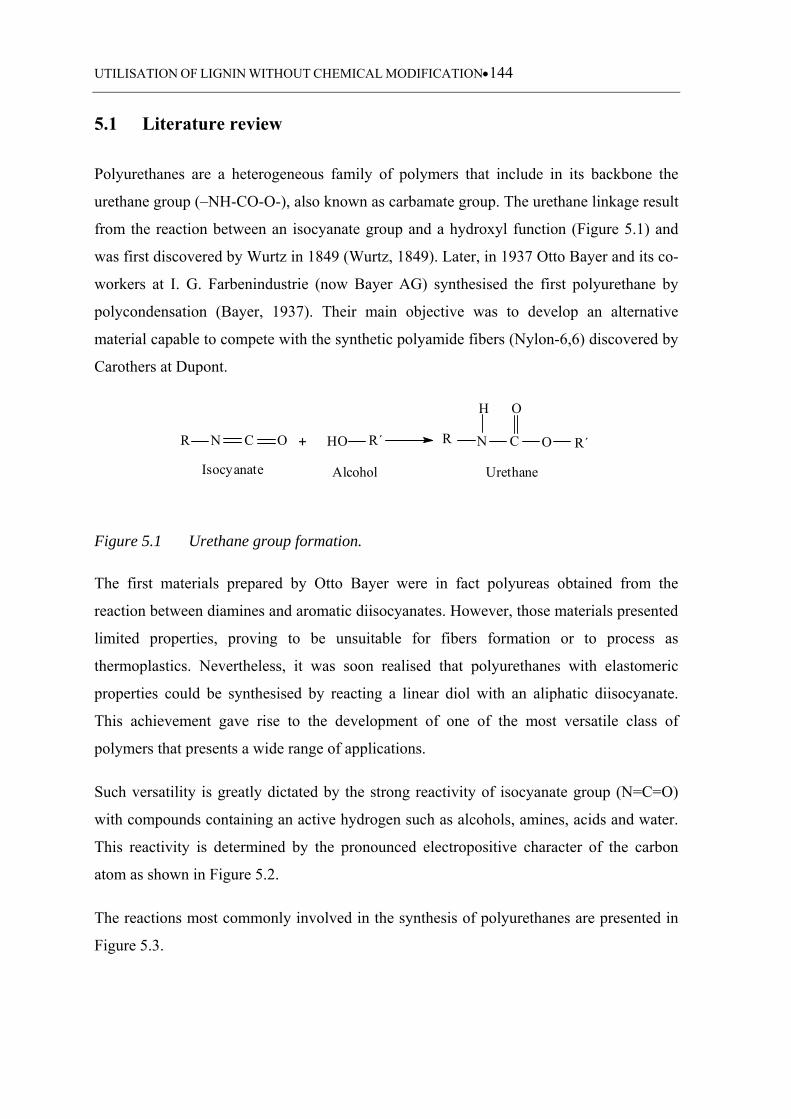
UTILISATION OF LIGNIN WITHOUT CHEMICAL MODIFICATION144
5.1 Literature review
Polyurethanes are a heterogeneous family of polymers that include in its backbone the
urethane group (–NH-CO-O-), also known as carbamate group. The urethane linkage result
from the reaction between an isocyanate group and a hydroxyl function (Figure 5.1) and
was first discovered by Wurtz in 1849 (Wurtz, 1849). Later, in 1937 Otto Bayer and its co-
workers at I. G. Farbenindustrie (now Bayer AG) synthesised the first polyurethane by
polycondensation (Bayer, 1937). Their main objective was to develop an alternative
material capable to compete with the synthetic polyamide fibers (Nylon-6,6) discovered by
Carothers at Dupont.
Urethane Alcohol
O
C
H
NRR´HO+ O R´
Isocyanate
R N C O
Figure 5.1 Urethane group formation.
The first materials prepared by Otto Bayer were in fact polyureas obtained from the
reaction between diamines and aromatic diisocyanates. However, those materials presented
limited properties, proving to be unsuitable for fibers formation or to process as
thermoplastics. Nevertheless, it was soon realised that polyurethanes with elastomeric
properties could be synthesised by reacting a linear diol with an aliphatic diisocyanate.
This achievement gave rise to the development of one of the most versatile class of
polymers that presents a wide range of applications.
Such versatility is greatly dictated by the strong reactivity of isocyanate group (N=C=O)
with compounds containing an active hydrogen such as alcohols, amines, acids and water.
This reactivity is determined by the pronounced electropositive character of the carbon
atom as shown in Figure 5.2.
The reactions most commonly involved in the synthesis of polyurethanes are presented in
Figure 5.3.
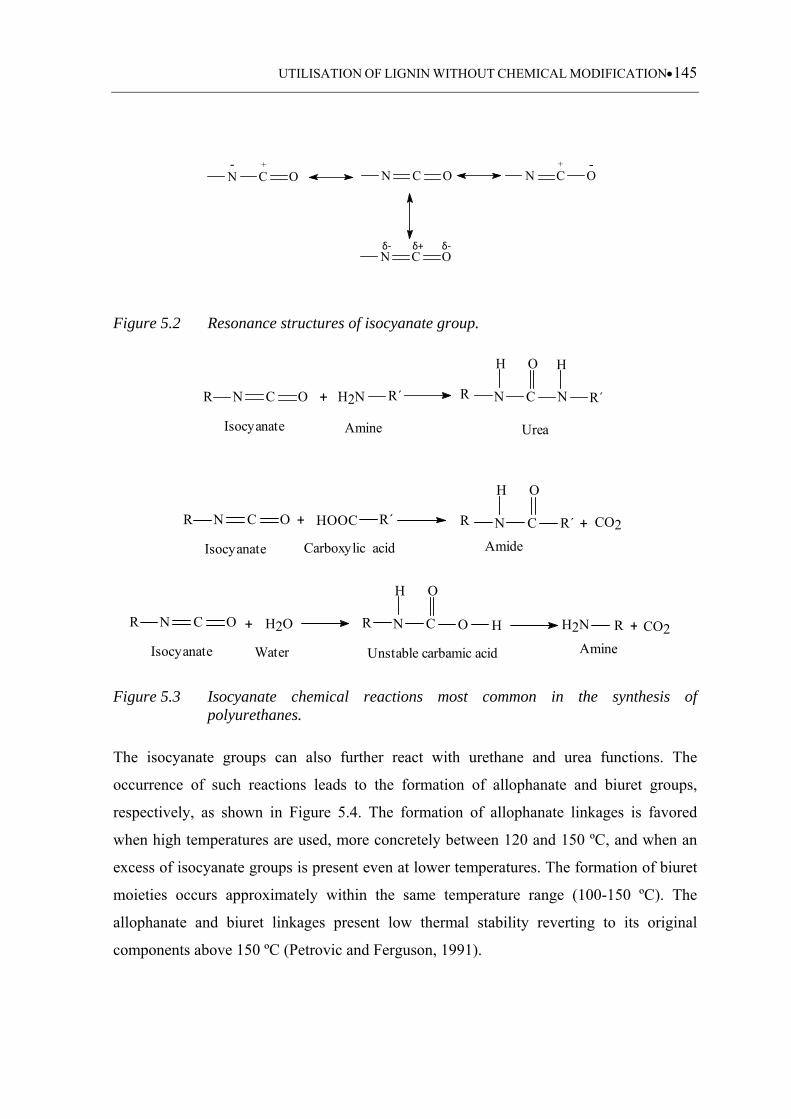
UTILISATION OF LIGNIN WITHOUT CHEMICAL MODIFICATION145
N C O N C O OCN
OCN
+- - +
δ‐δ‐ δ+
Figure 5.2 Resonance structures of isocyanate group.
OCNR + H2N R´ R N
H
C
O
N
H
R´
Isocyanate Amine Urea
+ R´ R´
O
C
H
NR + CO2
Carboxylic acid AmideIsocyanate
R N C O HOOC
Water
R N
H
C
O
+ H2O O H
Unstable carbamic acid
R + CO2AmineIsocyanate
R N C O H2N
Figure 5.3 Isocyanate chemical reactions most common in the synthesis of polyurethanes.
The isocyanate groups can also further react with urethane and urea functions. The
occurrence of such reactions leads to the formation of allophanate and biuret groups,
respectively, as shown in Figure 5.4. The formation of allophanate linkages is favored
when high temperatures are used, more concretely between 120 and 150 ºC, and when an
excess of isocyanate groups is present even at lower temperatures. The formation of biuret
moieties occurs approximately within the same temperature range (100-150 ºC). The
allophanate and biuret linkages present low thermal stability reverting to its original
components above 150 ºC (Petrovic and Ferguson, 1991).
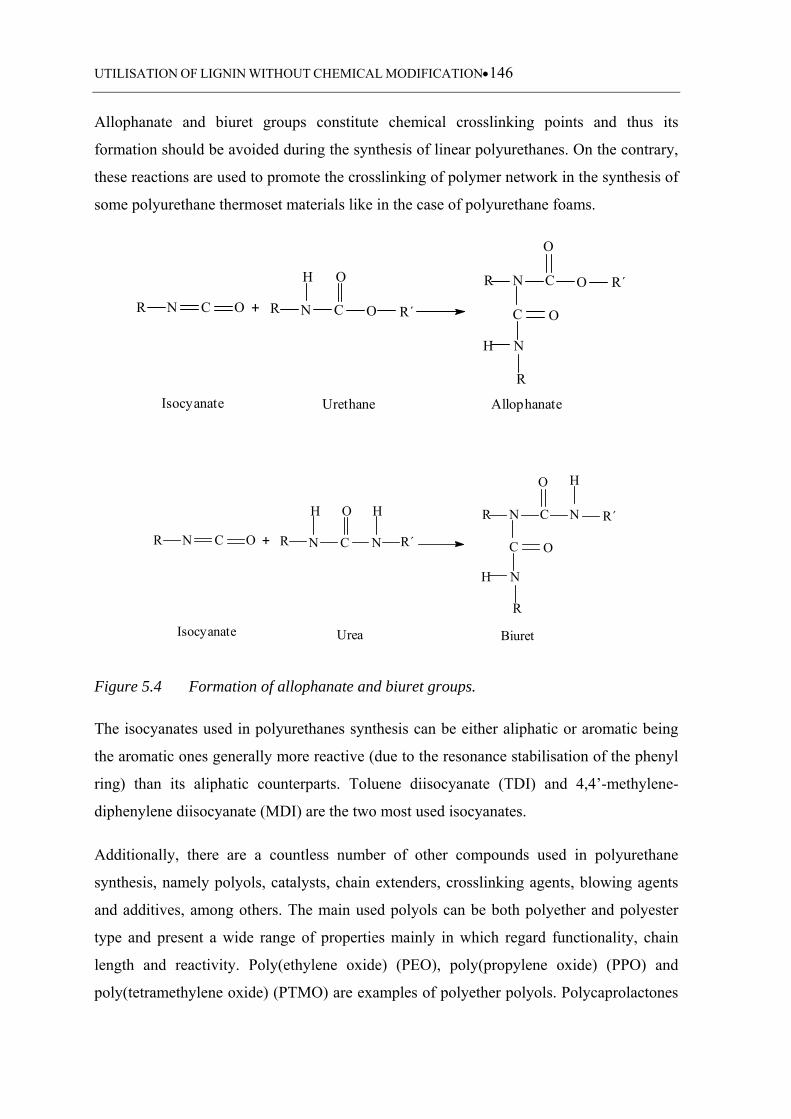
UTILISATION OF LIGNIN WITHOUT CHEMICAL MODIFICATION146
Allophanate and biuret groups constitute chemical crosslinking points and thus its
formation should be avoided during the synthesis of linear polyurethanes. On the contrary,
these reactions are used to promote the crosslinking of polymer network in the synthesis of
some polyurethane thermoset materials like in the case of polyurethane foams.
Allophanate
O
O
R´OCR
R
H N
N
C
Urethane
O
C
H
NR O R´+
Isocyanate
R N C O
O
O
R´CR
R
H N
N
C
O
C
H
NR R´+
Isocyanate
R N C O N
H N
H
BiuretUrea
Figure 5.4 Formation of allophanate and biuret groups.
The isocyanates used in polyurethanes synthesis can be either aliphatic or aromatic being
the aromatic ones generally more reactive (due to the resonance stabilisation of the phenyl
ring) than its aliphatic counterparts. Toluene diisocyanate (TDI) and 4,4’-methylene-
diphenylene diisocyanate (MDI) are the two most used isocyanates.
Additionally, there are a countless number of other compounds used in polyurethane
synthesis, namely polyols, catalysts, chain extenders, crosslinking agents, blowing agents
and additives, among others. The main used polyols can be both polyether and polyester
type and present a wide range of properties mainly in which regard functionality, chain
length and reactivity. Poly(ethylene oxide) (PEO), poly(propylene oxide) (PPO) and
poly(tetramethylene oxide) (PTMO) are examples of polyether polyols. Polycaprolactones
UTILISATION OF LIGNIN WITHOUT CHEMICAL MODIFICATION147
(PCL), polyadipates (PA) and polyethylene terephthalate (PET) belong to polyester type.
Comparatively to polyether-polyurethanes, polyester-polyurethanes generally exhibit better
mechanical strength and weak hydrolytic stability (Szycher, 1999).
For polyurethane synthesis purposes, lignin can act as a polyol; it contains within its
structure, both aliphatic and aromatic hydroxyl groups that can potentially act as reactive
sites for isocyanate groups (formation of urethane linkages). The utilisation of lignin as a
macromonomer in polyurethane synthesis often follows two global approaches: (i) the
direct utilisation of lignin without any preliminary chemical modification, alone or in
combination with other polyols (Vanderlaan and Thring, 1998; Yoshida et al., 1990;
Evtuguin et al., 1998; Gandini et al., 2002) or, (ii) by making hydroxyl functions more
readily available by chemical modification, such as esterification and etherification
reactions (Wu and Glasser, 1984; Gandini et al., 2002; Hatakeyama et al., 2002; Nadji et
al., 2005).
The last approach is generally recognised as the most obvious strategy to incorporate lignin
into polyurethane materials. Nevertheless, the high cost associated to the implementation
of such processes, makes difficult to attribute a high added value to lignin thus delaying
the industrial exploitation of this renewable polymer thought this approach (Evtuguin et
al., 1998). According to Belgacem and Gandini (2008) the economical feasibility of these
procedures should be previously evaluated and only those capable of fulfilling a
technological requirement of high priority, whether because there is no known alternative
or because the improvements associated with the novel product are particularly
noteworthy, will justify such an added cost. In this context, several works have been
carried out aiming to incorporate lignin as such and without performing any kind of
preliminary chemical modification (Yoshida et al., 1990; Evtuguin et al., 1998; Thring et
al., 2004). In these cases, both aliphatic and aromatic hydroxyl groups of lignin, act
directly as reactive sites for isocyanate groups (formation of urethane linkages).
The resulting materials were often reported as being rigid and sometimes brittle. Lignin
molecules are relatively stiff polyhydroxy macromolecules thus generating highly
reticulated three-dimensional polyurethanes, in which the lignin residues act as
crosslinking agents. To overcome this restriction and generate more attractive materials, it
is a current practice to incorporate a linear polyol in the original formulation. The most
UTILISATION OF LIGNIN WITHOUT CHEMICAL MODIFICATION148
commonly used are poly(ethylene glycol) (PEG) and poly(propylene glycol) (PPG) of
various molecular weights (Yoshida et al., 1990; Thring et al., 2004). The utilisation of
oligoether isocyanates was also reported (Evtuguin et al., 1998; Montanari et al., 1996).
The use of such co-monomers contributes to reduce the glass transition temperature and
the crosslinking density, thus allowing obtaining more flexible materials. Additionally,
they can assume the role of solvent enabling polymerisation in bulk and avoiding the use
of low molecular weight organic solvents, which makes these systems quite
environmentally friendly. Yoshida et al. (1990) and Vanderlaan and Thring (1998)
proposed the utilisation of low molecular weight lignin fractions. They observed that these
fractions yielded more flexible and less crosslinked materials than medium and high
molecular weight lignin fractions.
The research groups of Hatakeyama, Gandini and Thring performed several works aiming
to elucidate the performance of non-modified lignin as the polyol component in
polyurethane systems. Additionally, they intended to found the most suitable formulation
that allows incorporating the maximum amount of lignin and obtain materials with suitable
properties.
Hatakeyama’s research group performed a series of works using a three component
chemical system based on a kraft lignin, a polyether polyol and polymeric MDI to produce
polyurethane films (Yoshida et al., 1987; Yoshida et al., 1990; Reimann et al., 1990). In
the first work (Yoshida et al., 1987), the effect of lignin content on crosslinking density
and mechanical properties of lignin-based polyurethanes was evaluated at different
[NCO]/[OH] ratios. Lignin was found to act as a crosslinking agent and its contribution to
the formation of the polymer network was particularly noticed at low [NCO]/[OH] ratios.
This work also showed that it was possible to produce polyurethanes with a wide range of
mechanical properties, using low to intermediate [NCO]/[OH] ratios, simply by varying
the lignin content.
The effect of lignin molecular weight in the final properties of the resulting polyurethane
materials was studied in Yoshida et al. (1990). For such purpose, first the fractionating of
kraft lignin was performed by successive extraction with organic solvents. Results have
indicated that low molecular weight fractions produced less crosslinked and more flexible
UTILISATION OF LIGNIN WITHOUT CHEMICAL MODIFICATION149
polyurethanes than lignin fractions of medium and high molecular weight. This was
assigned to the increasing functionality of lignin with increasing molecular weight.
In the work of Reimann et al. (1990), the effect of lignin content, polyether polyol content
and molecular weight on final properties of the produced materials was inspected. This
investigation have showed that the maximum amount of lignin that can be incorporated
into the polymer network, before obtaining rigid and brittle materials, is highly dependent
of the molecular weight (chain length) of the linear polyol. Polyurethanes produced with a
linear polyol of high molecular weight (long chain length) are able to incorporate more
lignin than those produced with lower molecular weight (shorter chain length). The final
properties of the materials showed to be more influenced by the content of the linear polyol
rather than by its molecular weight (chain length).
The importance of the results achieved in the previously presented works lead to the
appearing of a patent by the Hatakeyama research group (Yoshida et al., 1986).
Hatakeyama research group have extended their studies to other lignin types (solvolysis
lignin) and lignosulfonates as well as to the synthesis of other polyurethane materials such
as polyurethane sheets and polyurethane foams (Hirose et al., 1989; Hatakeyama, 2002;
Hatakeyama and Hatakeyama, 2005; Hatakeyama et al., 2008). In these works, the
contribution of lignin to the thermal properties of the resulting materials was also reported
and found to retard thermal degradation of the resulting materials.
The contribution of Gandini’s research group (Cheradame et al., 1989; Montanari et al.,
1996; Evtuguin et al., 1998; Gandini et al., 2002) to this kind of approach started with the
utilisation of a kraft lignin alone or in combination with poly(ethylene oxide) (PEO) and
hexamethylene diisocyanate (Cheradame et al., 1989). This work aimed to evaluate the
participation of lignin hydroxyl groups in the formation of polyurethane networks and,
additionally, to determine the properties of the ensuing lignin-based polyurethane foams.
The participation of lignin hydroxyl groups, essentially aliphatic ones, was confirmed
mainly for [NCO]/[OH] ratios equal or superior to 1. The properties of rigid polyurethanes
foams were found to be close to those of conventional materials.
Other works (Gandini et al., 2002; Montanari et al., 1996) were performed with an
organosolv lignin (Alcell from Repap) and oligoether isocyanates having very low glass
UTILISATION OF LIGNIN WITHOUT CHEMICAL MODIFICATION150
transition temperatures. Alcell lignin showed to be more reactive towards isocyanates
groups than its kraft counterparts due to a reduction of steric hindrance effects. The
resulting materials were thermoplastic or pastes and partly or fully crosslinked elastomers
when mono- and diisocyanates were used, respectively.
The work was further extended to the utilisation of oxygen-organosolv lignins isolated
from spent liquors after delignification of aspen and spruce in different acidic/organic
solvent media together with an oligoether isocyanate (Evtuguin et al., 1998). The nature of
the organosolv solvent used in the delignification process was found to influence the
reactivity of lignin towards isocynates. It was noticed that the amount of alcoholic groups
varied due to reactions with solvent molecules during the delignification process. The use
of a catalyst also showed to be required in order to facilitate the polycondensation
reactions. The resulting polyurethanes have presented properties similar to those prepared
with Alcell lignin (Montanari et al., 1996).
The series of works performed by Thring research group (Thring et al., 1997; Vanderlaan
and Thring, 1998; Thring et al., 2004) were quite similar to those presented by
Hatakeyama in which regards the studied variables, namely: (i) lignin content and
[NCO]/[OH] ratio, (ii) lignin molecular weight and (iii) linear polyol molecular weight.
Additionally, Ni and Thring (2003) also studied the effect of adding a catalyst on the final
material properties. The major difference relatively to Hatakeyama studies lies on the used
lignin type. The work performed by Thring and its co-workers used an organosolv lignin
(Alcell from Repap). The chemical system was also a three component one (lignin, a
polyether polyol (PEG) and pure or polymeric MDI). The obtained results showed that the
utilisation of high lignin contents (greater than 30%) and high [NCO]/[OH] ratios
conducted to the obtaining of hard and brittle materials. The crosslinking density of these
materials was found to increase with the increase of lignin molecular weight (Thring et al.,
1997; Vanderlaan and Thring, 1998). The inclusion of a catalyst (DBTDL) into the
reaction medium allowed the utilisation of higher [NCO]/[OH] ratios (3.2) as well as
higher lignin contents (50%) without leading to the formation of brittle materials. These
results were explained in terms of catalyst ability to efficiently promote the reaction
between the hydroxyl groups of the used linear polyol and isocyanates (Ni and Thring,
2003).
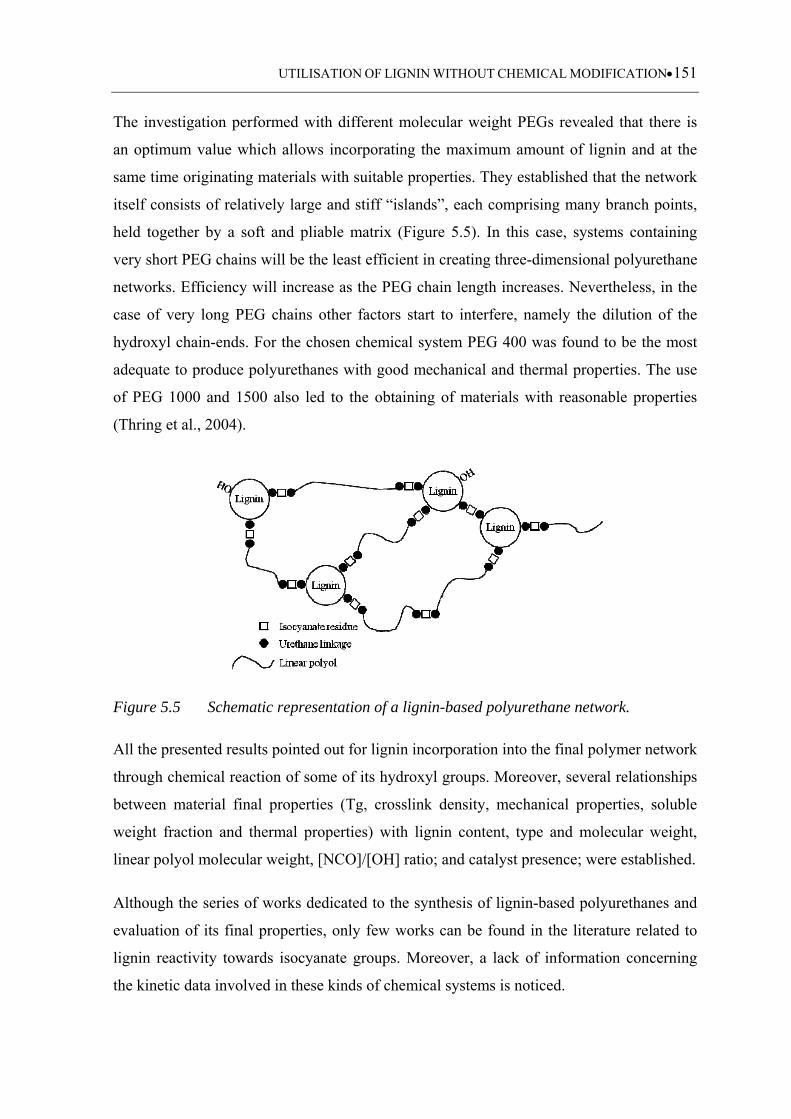
UTILISATION OF LIGNIN WITHOUT CHEMICAL MODIFICATION151
The investigation performed with different molecular weight PEGs revealed that there is
an optimum value which allows incorporating the maximum amount of lignin and at the
same time originating materials with suitable properties. They established that the network
itself consists of relatively large and stiff “islands”, each comprising many branch points,
held together by a soft and pliable matrix (Figure 5.5). In this case, systems containing
very short PEG chains will be the least efficient in creating three-dimensional polyurethane
networks. Efficiency will increase as the PEG chain length increases. Nevertheless, in the
case of very long PEG chains other factors start to interfere, namely the dilution of the
hydroxyl chain-ends. For the chosen chemical system PEG 400 was found to be the most
adequate to produce polyurethanes with good mechanical and thermal properties. The use
of PEG 1000 and 1500 also led to the obtaining of materials with reasonable properties
(Thring et al., 2004).
Figure 5.5 Schematic representation of a lignin-based polyurethane network.
All the presented results pointed out for lignin incorporation into the final polymer network
through chemical reaction of some of its hydroxyl groups. Moreover, several relationships
between material final properties (Tg, crosslink density, mechanical properties, soluble
weight fraction and thermal properties) with lignin content, type and molecular weight,
linear polyol molecular weight, [NCO]/[OH] ratio; and catalyst presence; were established.
Although the series of works dedicated to the synthesis of lignin-based polyurethanes and
evaluation of its final properties, only few works can be found in the literature related to
lignin reactivity towards isocyanate groups. Moreover, a lack of information concerning
the kinetic data involved in these kinds of chemical systems is noticed.
UTILISATION OF LIGNIN WITHOUT CHEMICAL MODIFICATION152
The work performed about the subject was mainly carried out by Gandini’s research group
whose experience in this field is well recognised. Besides lignin, this research group
performed several works aiming to determine the reactivity of biomass derived polyols
such as suberin (Cordeiro et al., 1997), oxypropylated cork (Evtiouguina et al., 2001), and
oxypropylated sugar beet pulps (Pavier and Gandini, 2000).
The reactivity of these polyols was assessed following the chemical reaction between its
hydroxyl groups with mono- and diisocyanates by FTIR. The experiments were done in
transmittance mode using a diluted medium with various solvents (pyridine, 1,4-dioxane,
1,1,2,2-tetracloroethane, tetrahydrofuran, etc.). The kinetic data were inspected according
to a global second order model. The competitive consecutive second order model
(developed by Frost and Schwemer (1952) to the saponification of di-ester and later
adapted by Burkus and Eckert (1958)) was also used to describe the reaction kinetics of
hydroxyl groups with asymmetric diisocyanates.
According to literature, the reaction of an isocyanate with an alcohol is well described by a
global second order model until isocyanate conversions that varies between 70 and 80%,
after which a positive or negative deviation is observed. Positive effects were mostly
assigned to: (i) catalytic effect of hydroxyl groups, (ii) autocatalysis of the formed urethane
groups, and (iii) formation of allophanate groups. These aspects are favoured at high
temperatures (Sato, 1960; Sato, 1962; Saunders and Frisch, 1962; Belgacem, 1991; Boufi
et al., 1993; D´Arlas et al., 2007). Negative deviations are mainly justified by the increase
of viscosity during polymerisation course if reaction is carried out in bulk (Boufi et al.,
1993; Han et al., 2008). These effects can alternatively be assigned to differences of
reactivity among functional groups (Pavier and Gandini, 2000).
In the performed studies (Cordeiro et al., 1997; Evtiouguina et al., 2001; Pavier and
Gandini, 2000), the linearity of the second-order plots was always good until isocyanate
conversions comprised between 55 and 95%. Nevertheless, in the work performed with
oxypropylated sugar beet pulp for the uncatalysed reaction (only residual KOH from the
oxypropylation reaction was present), the experiments with aliphatic isocyanates fitted
quite poorly the global second order model due to the sluggishness of the reaction (Pavier
and Gandini, 2000). The experiments performed with asymmetric diisocyanates were well
described by the global second order model until isocyanate conversions of 50%, after
UTILISATION OF LIGNIN WITHOUT CHEMICAL MODIFICATION153
what a negative deviation was identified. This was attributed to the greater reactivity of the
first isocyanate group with respect to the second one (10 times less reactive than the first
one). This putts in evidence the differences in reactivity between NCO aromatic groups
free of steric hindrance and those limited by these effects. The treatment of the data
according to the competitive consecutive second order model further confirmed the
existing differences of reactivity between the two isocynate groups. Positive deviations
were often observed and attributed either to autocatalysis of the formed urethane groups or
to the formation of allophanate groups.
In which regards lignin, some studies of reactivity using lignin model compounds
(guaiacol, vanillyl alcohol), and then lignin itself with model monoisocyanates and
macroisocyanates have been performed (Montanari et al., 1996; Gandini et al., 2002). The
monitoring and completion of the reaction between the different hydroxyl groups and
isocynates was evaluated using FTIR and NMR techniques. Results indicated that all
reactions were carried out to completion although the differences existing between the
different hydroxyl groups. More particularly, it was found that aliphatic hydroxyl groups
react more readily than phenolic ones and that when both types of hydroxyl groups are
present (case of vanillyl alcohol), the condensation reaction first took place with the more
reactive aliphatic hydroxyl function. The differences existing between the two types of
hydroxyl groups were assigned to the pronounced acidic character of the phenolic
hydroxyl groups compared to that of aliphatic counterparts, as well as, to the steric
hindrance effects. The reactivity of hydroxyl groups towards isocyanates is well
established in the literature and known to be highly dependent on its basic character and
steric hindrance (see, for example, Belgacem, 1991; Caraculacu and Coseri, 2001).
5.2 Materials and Methods
5.2.1 Synthesis of lignin-based polyurethanes
5.2.1.1 Starting materials
The study presented in this chapter was performed with Indulin AT (kraft lignin) and
Alcell (organosolv lignin). Comparatively to Sarkanda and Curan 27-11P, these lignins
exhibit superior properties, namely in which regards purity. Pure 4,4’-methylene-
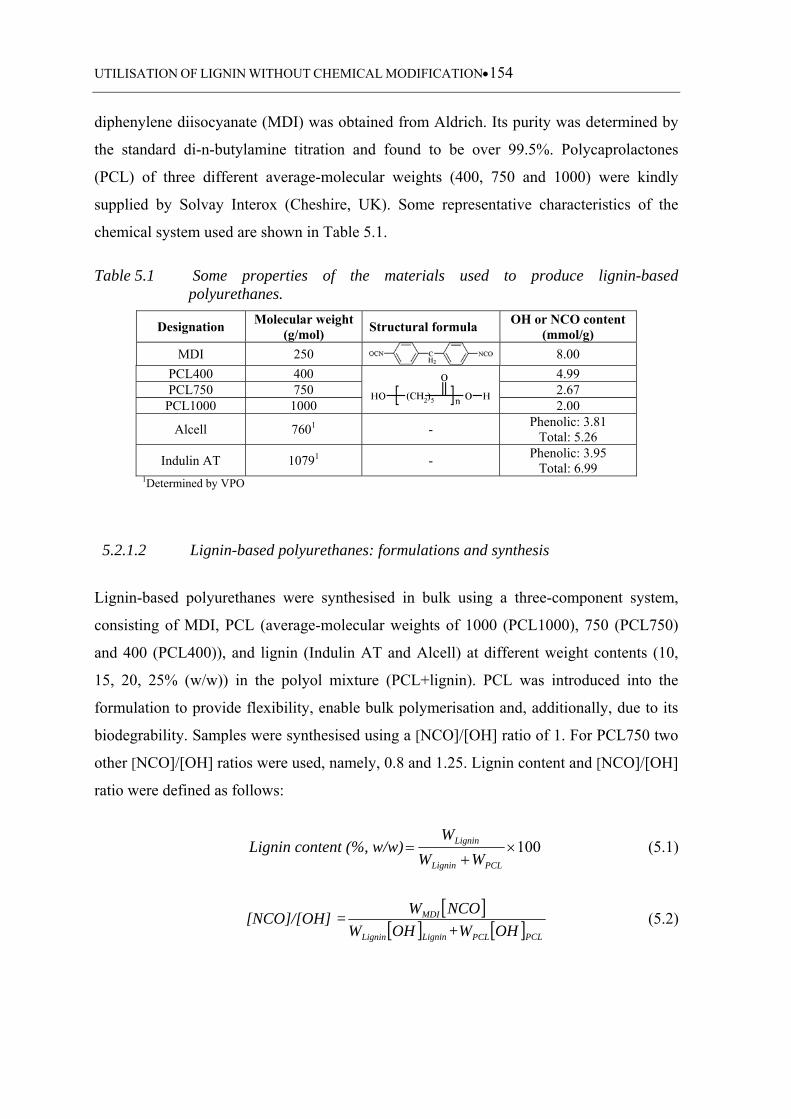
UTILISATION OF LIGNIN WITHOUT CHEMICAL MODIFICATION154
diphenylene diisocyanate (MDI) was obtained from Aldrich. Its purity was determined by
the standard di-n-butylamine titration and found to be over 99.5%. Polycaprolactones
(PCL) of three different average-molecular weights (400, 750 and 1000) were kindly
supplied by Solvay Interox (Cheshire, UK). Some representative characteristics of the
chemical system used are shown in Table 5.1.
Table 5.1 Some properties of the materials used to produce lignin-based polyurethanes.
Designation Molecular weight
(g/mol) Structural formula
OH or NCO content (mmol/g)
MDI 250 8.00
PCL400 400
4.99 PCL750 750 2.67
PCL1000 1000 2.00
Alcell 7601 - Phenolic: 3.81
Total: 5.26
Indulin AT 10791 - Phenolic: 3.95
Total: 6.99 1Determined by VPO
5.2.1.2 Lignin-based polyurethanes: formulations and synthesis
Lignin-based polyurethanes were synthesised in bulk using a three-component system,
consisting of MDI, PCL (average-molecular weights of 1000 (PCL1000), 750 (PCL750)
and 400 (PCL400)), and lignin (Indulin AT and Alcell) at different weight contents (10,
15, 20, 25% (w/w)) in the polyol mixture (PCL+lignin). PCL was introduced into the
formulation to provide flexibility, enable bulk polymerisation and, additionally, due to its
biodegrability. Samples were synthesised using a [NCO]/[OH] ratio of 1. For PCL750 two
other [NCO]/[OH] ratios were used, namely, 0.8 and 1.25. Lignin content and [NCO]/[OH]
ratio were defined as follows:
Lignin content (%, w/w) 100
PCLLignin
Lignin
WW
W (5.1)
PCLPCLLigninLignin
MDI
OH+WOHW
NCOW =[NCO]/[OH] (5.2)
UTILISATION OF LIGNIN WITHOUT CHEMICAL MODIFICATION155
where:
MDIW - is the MDI weight, in g
LigninW - is the lignin weight, in g
PCLW - is the PCL weight, in g
NCO - is the MDI isocyanate content, in mmol/g
LigninOH - is the lignin hydroxyl content, in mmol/g
PCLOH - is the PCL hydroxyl content, in mmol/g
The following experimental procedure was used to prepare the lignin-based polyurethanes:
1. Lignin and PCL were degassed overnight under vacuum at 60 ºC;
2. Lignin and PCL were weighted in an analytical balance in the desired proportions and
the mixture homogenised by stirring during 1 hour at 80 ºC;
3. Then, molten MDI (purified by heating at 60 ºC and filtered through a heated filter just
prior to use) was added and the reaction mixture thoroughly stirred during 30 s at a
temperature of 80 ºC;
4. Finally, the reaction mixture was rapidly transferred into: (i) an ATR cell with
controlled temperature (80 ºC) to monitor the reaction kinetics, and (ii) a round teflon
mould to produce samples for thermo-mechanical and swelling tests. In the second
case, lignin-based polyurethane samples were left to cure at 80 ºC during 24 hours.
The following terminology will be used to identify samples: Lignin type
(PCLMW/[NCO]/[OH] ratio/ lignin content). For example, A(PCL750/1/25) corresponds
to a sample synthesised with Alcell lignin, a 750 average-molecular weight PCL at a
[NCO]/[OH] ratio of 1 and a lignin content (%, w/w) of 25%. To simplify, Alcell lignin
will be designed by A and Indulin AT by IAT.
5.2.2 FTIR-ATR monitoring
Fourier transform infrared spectroscopy working in attenuated total reflectance mode
(FTIR-ATR) was used to monitor the formation of lignin-based polyurethanes. The
experiments were conducted on a FTIR Bomen Model MB104. The ATR accessory, from
Graseby Specac, was equipped with a heater controller and a silicon crystal (material
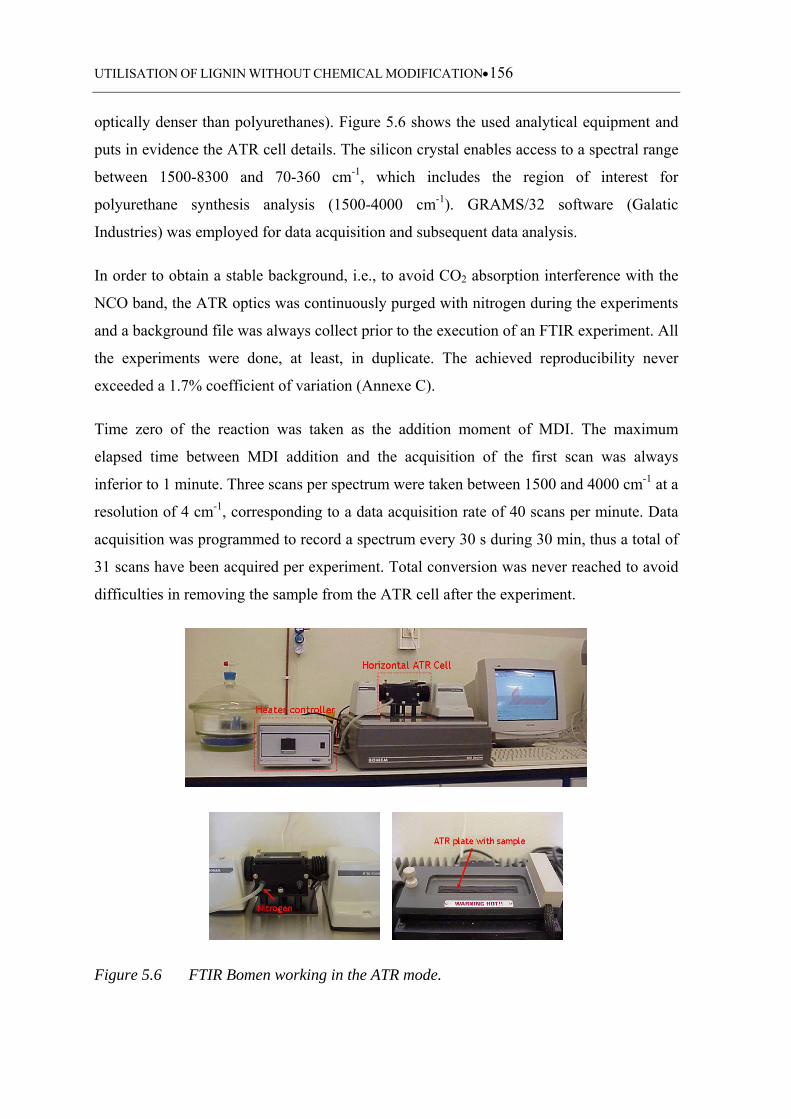
UTILISATION OF LIGNIN WITHOUT CHEMICAL MODIFICATION156
optically denser than polyurethanes). Figure 5.6 shows the used analytical equipment and
puts in evidence the ATR cell details. The silicon crystal enables access to a spectral range
between 1500-8300 and 70-360 cm-1, which includes the region of interest for
polyurethane synthesis analysis (1500-4000 cm-1). GRAMS/32 software (Galatic
Industries) was employed for data acquisition and subsequent data analysis.
In order to obtain a stable background, i.e., to avoid CO2 absorption interference with the
NCO band, the ATR optics was continuously purged with nitrogen during the experiments
and a background file was always collect prior to the execution of an FTIR experiment. All
the experiments were done, at least, in duplicate. The achieved reproducibility never
exceeded a 1.7% coefficient of variation (Annexe C).
Time zero of the reaction was taken as the addition moment of MDI. The maximum
elapsed time between MDI addition and the acquisition of the first scan was always
inferior to 1 minute. Three scans per spectrum were taken between 1500 and 4000 cm-1 at a
resolution of 4 cm-1, corresponding to a data acquisition rate of 40 scans per minute. Data
acquisition was programmed to record a spectrum every 30 s during 30 min, thus a total of
31 scans have been acquired per experiment. Total conversion was never reached to avoid
difficulties in removing the sample from the ATR cell after the experiment.
Figure 5.6 FTIR Bomen working in the ATR mode.
UTILISATION OF LIGNIN WITHOUT CHEMICAL MODIFICATION157
5.2.3 Thermo-mechanical characterisation of lignin-based polyurethanes
5.2.3.1 Differential scanning calorimetric (DSC) analysis
Lignin-based polyurethane materials were cut into small pieces and then approximately 10
mg were weighted and encapsulated into an aluminium pan. DSC analysis was performed
using a DSC Q100 differential calorimeter from TA Instruments working in modulated
mode under nitrogen atmosphere (50 mL/min). Analyses were carried out in a temperature
range comprised between -60 and 200 ºC using a heating rate of 5 ºC/min. The oscillation
period and the amplitude were 60 s and ±1 ºC, respectively. The results were analysed
using the TA Instruments Thermal Advantage Software and Tg was determined as
described in Chapter 3 section 3.2.11.2.
5.2.3.2 Dynamical mechanical analysis (DMA)
DMA analysis was carried out using a DMA RSA3 from TA Instruments operating in
tensile mode. The measurements were performed using constant frequency of 1 Hz, strain
amplitude of 0.03% and a distance between jaws of 10 mm. The heating rate was 5 °C/min
and the temperature ranged from -100 to 200 ºC. The thickness of the samples varied from
1.5 to 2.0 mm and the width between 4 and 5 mm.
In a typical DMA analysis the relaxation process of a polymer corresponds to the
maximum of tanδ (loss tangent) or E´´ (loss modulus) in conjugation with a relative
pronounced drop in E´ (storage modulus). In this work, Tg values were determined based
on the maximum of tanδ (ratio between E´´/E´).
Analysis of DMA data can provide information about the viscoelastic behaviour and
crosslinking density. The crosslinking density of a polymer network can be described by
Equation 5.3 according to the theory of rubber elasticity (Flory, 1953).
RTE
e3
´ (5.3)
where:
´E - is the storage modulus, in Pa
e - is the crosslinking density, in mol/cm3
UTILISATION OF LIGNIN WITHOUT CHEMICAL MODIFICATION158
R - is the molar gas constant, in J/K.mol
T - is the temperature, in K
The crosslink density was estimated using the rubbery plateau.
5.2.4 Swelling tests
Swelling tests were performed according to the procedure described by Kelley et al.
(1988). Round specimens with a diameter of 1 cm and thickness between 1-2 mm were cut
and immersed in glass vials containing dimethylformamide. The specimens were allowed
to stand in a conditioned room kept at a constant temperature of 23 ºC and relative
humidity of 50%. After reaching the equilibrium (5 days were found to be enough), the
samples were removed from the solvent and, the DMF excess present on the surface,
carefully absorbed with a paper filter. Finally, the dimensions of the swollen samples were
measured. For each formulation at least two specimens were used.
Swelling tests allow estimating the crosslinking density, as well as, the soluble weight
fraction (sol fraction). The crosslinking density values can be determined according to the
Flory-Rehner theory described by Equations 5.4 and 5.5 in which 0VC corresponds to the
crosslinking density, in mol/cm3.
)2(
))1ln((23/1
1
2
0
VV
C (5.4)
V
V0 (5.5)
where:
C - is the effective number of moles of crosslinked chains
0V - is the volume of dry polymer, in cm3
V - is the volume of the swollen gel at equilibrium, in cm3
- is the polymer-solvent interaction parameter
1V - is the molar volume of the solvent, in cm3/mol
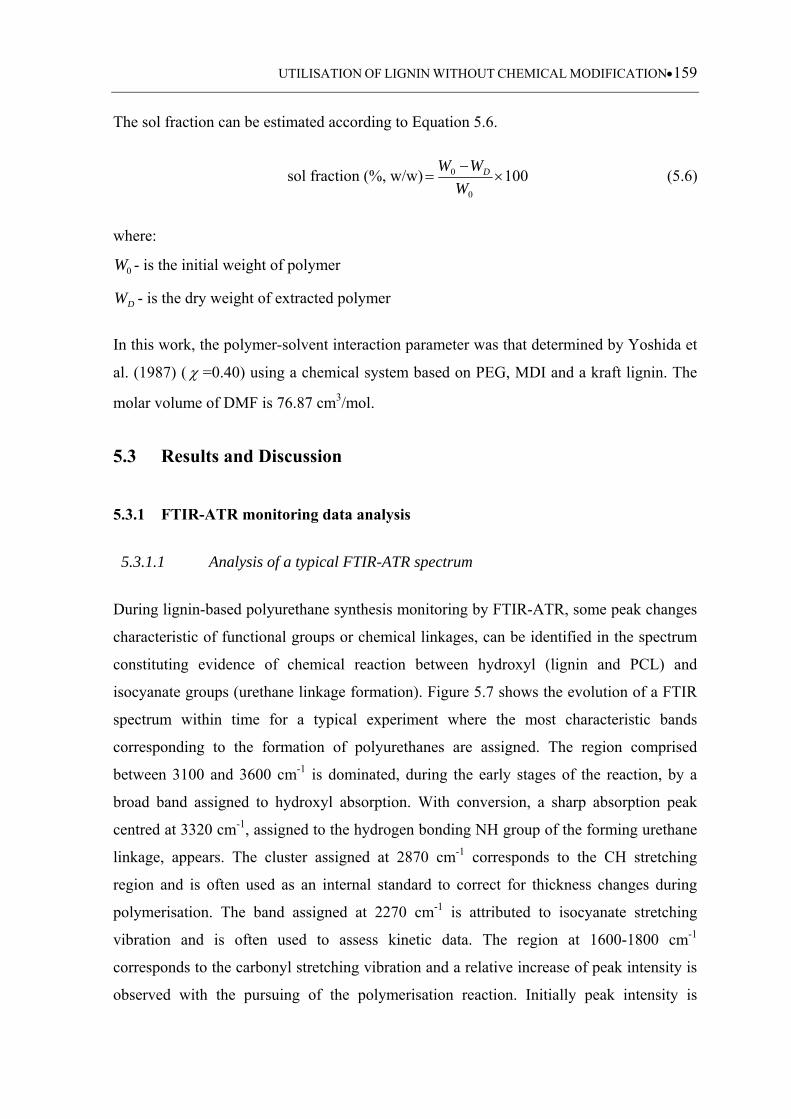
UTILISATION OF LIGNIN WITHOUT CHEMICAL MODIFICATION159
The sol fraction can be estimated according to Equation 5.6.
sol fraction (%, w/w) 1000
0
W
WW D (5.6)
where:
0W - is the initial weight of polymer
DW - is the dry weight of extracted polymer
In this work, the polymer-solvent interaction parameter was that determined by Yoshida et
al. (1987) ( =0.40) using a chemical system based on PEG, MDI and a kraft lignin. The
molar volume of DMF is 76.87 cm3/mol.
5.3 Results and Discussion
5.3.1 FTIR-ATR monitoring data analysis
5.3.1.1 Analysis of a typical FTIR-ATR spectrum
During lignin-based polyurethane synthesis monitoring by FTIR-ATR, some peak changes
characteristic of functional groups or chemical linkages, can be identified in the spectrum
constituting evidence of chemical reaction between hydroxyl (lignin and PCL) and
isocyanate groups (urethane linkage formation). Figure 5.7 shows the evolution of a FTIR
spectrum within time for a typical experiment where the most characteristic bands
corresponding to the formation of polyurethanes are assigned. The region comprised
between 3100 and 3600 cm-1 is dominated, during the early stages of the reaction, by a
broad band assigned to hydroxyl absorption. With conversion, a sharp absorption peak
centred at 3320 cm-1, assigned to the hydrogen bonding NH group of the forming urethane
linkage, appears. The cluster assigned at 2870 cm-1 corresponds to the CH stretching
region and is often used as an internal standard to correct for thickness changes during
polymerisation. The band assigned at 2270 cm-1 is attributed to isocyanate stretching
vibration and is often used to assess kinetic data. The region at 1600-1800 cm-1
corresponds to the carbonyl stretching vibration and a relative increase of peak intensity is
observed with the pursuing of the polymerisation reaction. Initially peak intensity is
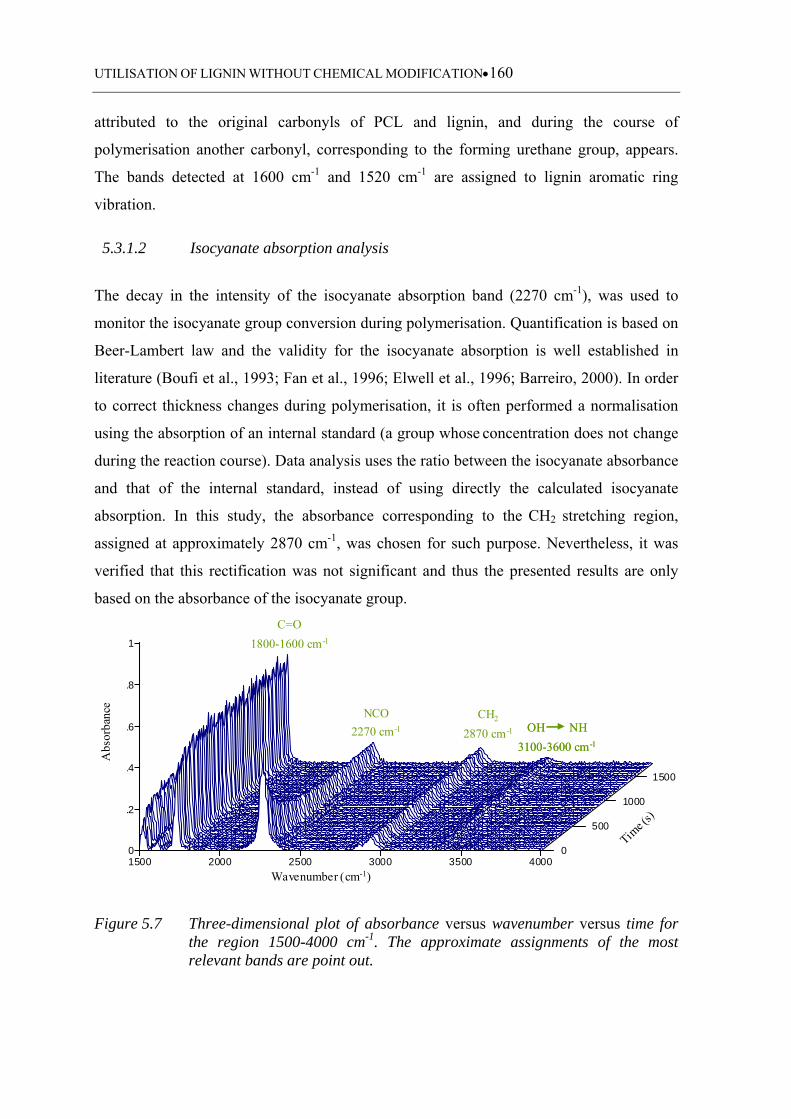
UTILISATION OF LIGNIN WITHOUT CHEMICAL MODIFICATION160
attributed to the original carbonyls of PCL and lignin, and during the course of
polymerisation another carbonyl, corresponding to the forming urethane group, appears.
The bands detected at 1600 cm-1 and 1520 cm-1 are assigned to lignin aromatic ring
vibration.
5.3.1.2 Isocyanate absorption analysis
The decay in the intensity of the isocyanate absorption band (2270 cm-1), was used to
monitor the isocyanate group conversion during polymerisation. Quantification is based on
Beer-Lambert law and the validity for the isocyanate absorption is well established in
literature (Boufi et al., 1993; Fan et al., 1996; Elwell et al., 1996; Barreiro, 2000). In order
to correct thickness changes during polymerisation, it is often performed a normalisation
using the absorption of an internal standard (a group whose concentration does not change
during the reaction course). Data analysis uses the ratio between the isocyanate absorbance
and that of the internal standard, instead of using directly the calculated isocyanate
absorption. In this study, the absorbance corresponding to the CH2 stretching region,
assigned at approximately 2870 cm-1, was chosen for such purpose. Nevertheless, it was
verified that this rectification was not significant and thus the presented results are only
based on the absorbance of the isocyanate group.
0
500
1000
1500
0
.2
.4
.6
.8
1
1500 2000 2500 3000 3500 4000
Wavenumber (cm-1)
Abs
orba
nce
Time (s)
C=O
1800-1600 cm-1
NCO
2270 cm-1
CH2
2870 cm-1 OH NH
3100-3600 cm-1
0
500
1000
1500
0
.2
.4
.6
.8
1
1500 2000 2500 3000 3500 4000
Wavenumber (cm-1)
Abs
orba
nce
Time (s)
C=O
1800-1600 cm-1
NCO
2270 cm-1
CH2
2870 cm-1 OH NH
3100-3600 cm-1
OH NH
3100-3600 cm-1
Figure 5.7 Three-dimensional plot of absorbance versus wavenumber versus time for the region 1500-4000 cm-1. The approximate assignments of the most relevant bands are point out.
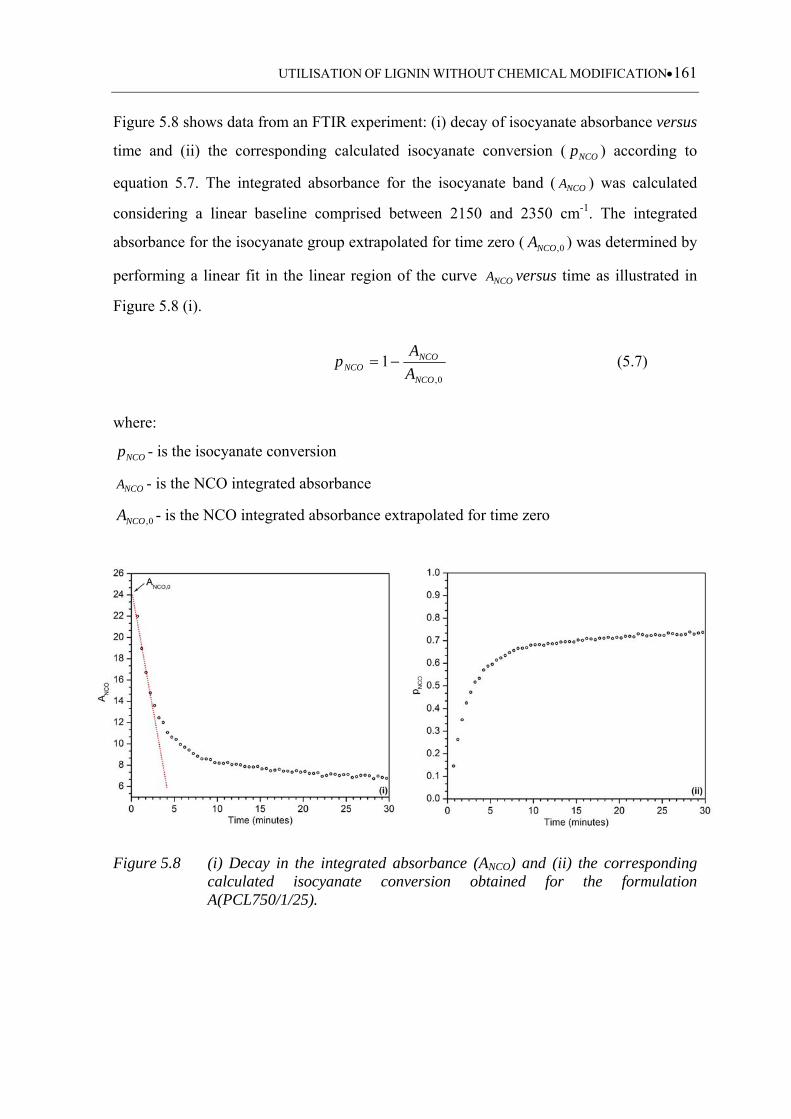
UTILISATION OF LIGNIN WITHOUT CHEMICAL MODIFICATION161
Figure 5.8 shows data from an FTIR experiment: (i) decay of isocyanate absorbance versus
time and (ii) the corresponding calculated isocyanate conversion ( NCOp ) according to
equation 5.7. The integrated absorbance for the isocyanate band ( NCOA ) was calculated
considering a linear baseline comprised between 2150 and 2350 cm-1. The integrated
absorbance for the isocyanate group extrapolated for time zero ( 0,NCOA ) was determined by
performing a linear fit in the linear region of the curve NCOA versus time as illustrated in
Figure 5.8 (i).
0,
1NCO
NCONCO A
Ap (5.7)
where:
NCOp - is the isocyanate conversion
NCOA - is the NCO integrated absorbance
0,NCOA - is the NCO integrated absorbance extrapolated for time zero
Figure 5.8 (i) Decay in the integrated absorbance (ANCO) and (ii) the corresponding calculated isocyanate conversion obtained for the formulation A(PCL750/1/25).
UTILISATION OF LIGNIN WITHOUT CHEMICAL MODIFICATION162
5.3.2 Isocyanate conversion analysis
5.3.2.1 Alcell based polyurethanes
Formulation details, and isocyanate conversion achieved for a reaction time of 30 minutes,
i.e., the duration of a FTIR experiment (designated by p(30 minutes)), are presented in
Table 5.2 for the series of experiments performed using Alcell lignin. Experiments using
PCL alone as the polyol component and a [NCO]/[OH] ratio of 1, are also presented, as a
reference. Following the proposed nomenclature, these series are entitled, (PCL400/1/0),
(PCL750/1/0) and (PCL1000/1/0), for PCL400, PCL750 and PCL1000, respectively.
Table 5.2 Formulation details and final isocyanate conversion obtained for the series based on Alcell lignin, as well as, for the reference experiments.
Sample PCL [NCO]/[OH]
ratio
Lignin (%, w/w) Isocyanate conversion
p(30 minutes) (PCL+lignin)1 (PCL+MDI+lignin)2
(PCL400/1/0)
PCL400 1.0
0 0 0.93 A(PCL400/1/10) 10 6 0.91 A(PCL400/1/15) 15 9 0.87 A(PCL400/1/20) 20 12 0.84 A(PCL400/1/25) 25 15 0.77
(PCL750/1/0)
PCL750 1.0
0 0 0.86 A(PCL750/1/10) 10 7 0.86 A(PCL750/1/15) 15 11 0.84 A(PCL750/1/20) 20 14 0.79 A(PCL750/1/25) 25 18 0.74 (PCL1000/1/0)
PCL1000 1.0
0 0 0.79 A(PCL1000/1/10) 10 8 0.82 A(PCL1000/1/15) 15 11 0.78 A(PCL1000/1/20) 20 15 0.75 A(PCL1000/1/25) 25 19 0.70
A(PCL750/1.25/10)
PCL750 1.25
10 7 0.72 A(PCL750/1.25/15) 15 10 0.67 A(PCL750/1.25/20) 20 13 0.63 A(PCL750/1.25/25) 25 17 0.56 A(PCL750/0.8/10)
PCL750 0.8
10 8 0.91 A(PCL750/0.8/15) 15 11 0.92 A(PCL750/0.8/20) 20 15 0.90 A(PCL750/0.8/25) 25 19 0.85
1 lignin content considering total weight of the polyol 2 lignin content considering total weight of polymer formulation
For formulations using a [NCO]/[OH] ratio of 1, the achieved p(30 minutes) decreases,
both with the increase of lignin content and the increase of PCL molecular weight. For the
reference experiments, p(30 minutes) decreases with PCL molecular weight increasing.
Thus, hydroxyls belonging to higher molecular weight PCLs are less reactive, possibly due
UTILISATION OF LIGNIN WITHOUT CHEMICAL MODIFICATION163
to a lack of mobility associated with longer polymeric chains (more viscous medium), or
simply, because of an increasing dilution of hydroxyl groups.
Isocyanate conversion obtained for the reference experiments was very similar to those of
its counterparts containing low lignin content, i.e., 10%. This gives the indication that, in
this case, isocyanate conversion is not greatly affected by lignin presence and that the
obtained data is mainly a result of the predominant presence of PCL.
For the experiments performed with PCL750 at different [NCO]/[OH] ratios it was noticed
that, when the [NCO]/[OH] ratio increases from 0.8 to 1.25, p(30 minutes) tends to
decrease. The increase of lignin content also conducted to lower p(30 minutes), for the
experiments performed at a [NCO]/[OH] ratio of 1.25. When a [NCO]/[OH] ratio of 0.8
was used, similar values for p(30 minutes) were obtained for lignin contents of 10, 15 and
20% (0.91, 0.92 and 0.90, respectively). For a lignin content of 25% a lower p(30 minutes)
was detected, i.e., 0.85.
5.3.2.2 Indulin AT based polyurethanes
Formulation details, and p(30 minutes) obtained for the series based on Indulin AT lignin,
are presented in Table 5.3. As a reference, the experiments performed using PCL alone as
the polyol component and a [NCO]/[OH] ratio of 1, are also presented (PCL400/1/0),
(PCL750/1/0) and (PCL1000/1/0).
For the set of experiments performed with PCL400 and lignin contents superior to 10% it
was not possible to monitor the polymerisation reaction by FTIR-ATR. A prompt
“solidification” of the reactive mixture occurred right after MDI addition, thus hindering
its transference to the ATR cell. This phenomenon corresponds to a rapid gelification
associated to the used chemical system and it corroborates effective lignin incorporation
into the final three-dimensional polyurethane network. This effect was not observed, at the
beginning of the reaction, for the corresponding formulations using Alcell lignin and
PCL400. Comparatively to Indulin AT, Alcell, an organosolv lignin, has lower molecular
weight and lower hydroxyl content. The probability to create effective bridges between
two lignin “islands” is lower, thus originating less crosslinked materials. In principle, this
kind of systems will favour the formation of isolated sequences (with or without lignin).
Figure 5.9 presents a schematic representation putting in evidence the type of structures
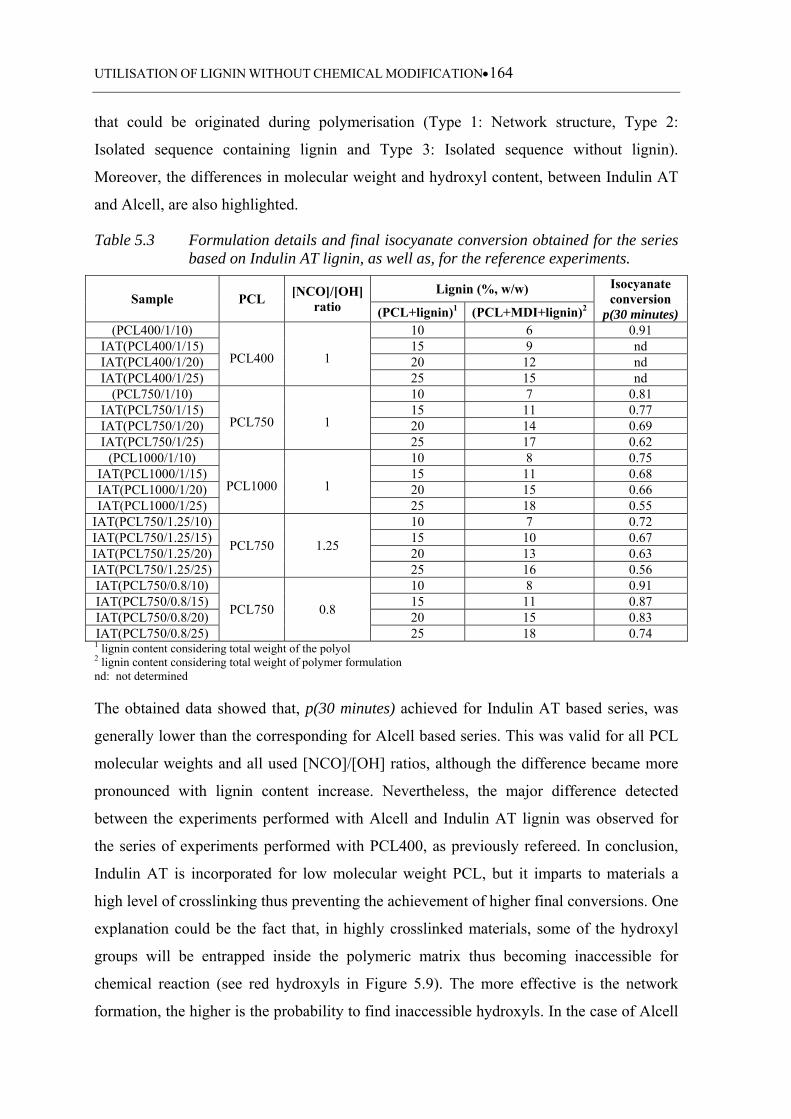
UTILISATION OF LIGNIN WITHOUT CHEMICAL MODIFICATION164
that could be originated during polymerisation (Type 1: Network structure, Type 2:
Isolated sequence containing lignin and Type 3: Isolated sequence without lignin).
Moreover, the differences in molecular weight and hydroxyl content, between Indulin AT
and Alcell, are also highlighted.
Table 5.3 Formulation details and final isocyanate conversion obtained for the series based on Indulin AT lignin, as well as, for the reference experiments.
Sample PCL [NCO]/[OH]
ratio Lignin (%, w/w) Isocyanate
conversion p(30 minutes) (PCL+lignin)1 (PCL+MDI+lignin)2
(PCL400/1/10)
PCL400 1
10 6 0.91 IAT(PCL400/1/15) 15 9 nd IAT(PCL400/1/20) 20 12 nd IAT(PCL400/1/25) 25 15 nd
(PCL750/1/10)
PCL750 1
10 7 0.81 IAT(PCL750/1/15) 15 11 0.77 IAT(PCL750/1/20) 20 14 0.69 IAT(PCL750/1/25) 25 17 0.62
(PCL1000/1/10)
PCL1000 1
10 8 0.75 IAT(PCL1000/1/15) 15 11 0.68 IAT(PCL1000/1/20) 20 15 0.66 IAT(PCL1000/1/25) 25 18 0.55
IAT(PCL750/1.25/10)
PCL750 1.25
10 7 0.72 IAT(PCL750/1.25/15) 15 10 0.67 IAT(PCL750/1.25/20) 20 13 0.63 IAT(PCL750/1.25/25) 25 16 0.56 IAT(PCL750/0.8/10)
PCL750 0.8
10 8 0.91 IAT(PCL750/0.8/15) 15 11 0.87 IAT(PCL750/0.8/20) 20 15 0.83 IAT(PCL750/0.8/25) 25 18 0.74 1 lignin content considering total weight of the polyol 2 lignin content considering total weight of polymer formulation nd: not determined
The obtained data showed that, p(30 minutes) achieved for Indulin AT based series, was
generally lower than the corresponding for Alcell based series. This was valid for all PCL
molecular weights and all used [NCO]/[OH] ratios, although the difference became more
pronounced with lignin content increase. Nevertheless, the major difference detected
between the experiments performed with Alcell and Indulin AT lignin was observed for
the series of experiments performed with PCL400, as previously refereed. In conclusion,
Indulin AT is incorporated for low molecular weight PCL, but it imparts to materials a
high level of crosslinking thus preventing the achievement of higher final conversions. One
explanation could be the fact that, in highly crosslinked materials, some of the hydroxyl
groups will be entrapped inside the polymeric matrix thus becoming inaccessible for
chemical reaction (see red hydroxyls in Figure 5.9). The more effective is the network
formation, the higher is the probability to find inaccessible hydroxyls. In the case of Alcell
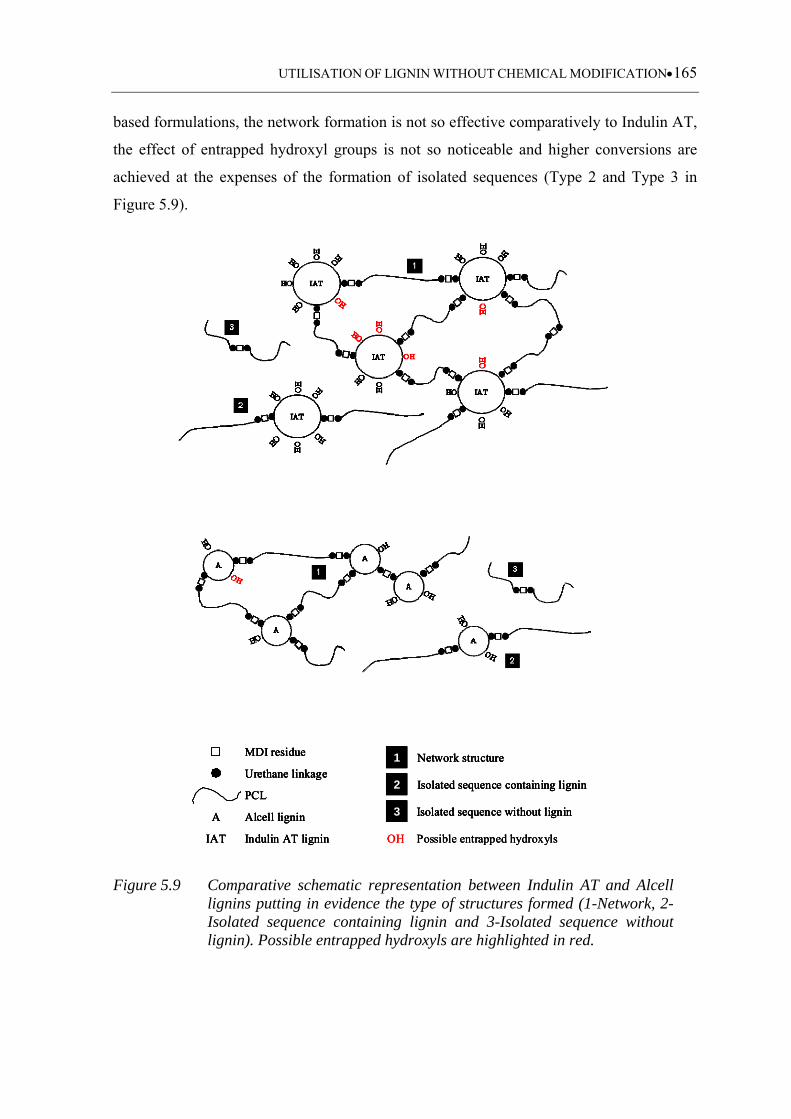
UTILISATION OF LIGNIN WITHOUT CHEMICAL MODIFICATION165
based formulations, the network formation is not so effective comparatively to Indulin AT,
the effect of entrapped hydroxyl groups is not so noticeable and higher conversions are
achieved at the expenses of the formation of isolated sequences (Type 2 and Type 3 in
Figure 5.9).
MDI residue
PCL
Urethane linkage
A Alcell lignin
Indulin AT ligninIAT
1 Network structure
2 Isolated sequence containing lignin
3 Isolated sequence without lignin
Possible entrapped hydroxylsOH
MDI residue
PCL
Urethane linkage
A Alcell lignin
Indulin AT ligninIAT
MDI residueMDI residue
PCLPCL
Urethane linkageUrethane linkage
A Alcell ligninA Alcell lignin
Indulin AT ligninIAT Indulin AT ligninIAT
1 Network structure
2 Isolated sequence containing lignin
3 Isolated sequence without lignin
Possible entrapped hydroxylsOH
1 Network structure1 Network structure
2 Isolated sequence containing lignin2 Isolated sequence containing lignin
3 Isolated sequence without lignin3 Isolated sequence without lignin
Possible entrapped hydroxylsOH
Figure 5.9 Comparative schematic representation between Indulin AT and Alcell lignins putting in evidence the type of structures formed (1-Network, 2-Isolated sequence containing lignin and 3-Isolated sequence without lignin). Possible entrapped hydroxyls are highlighted in red.
UTILISATION OF LIGNIN WITHOUT CHEMICAL MODIFICATION166
Despite the differences found between the series performed with Alcell and Indulin AT,
some common trends were identified, namely: (i) a decrease in the achieved p(30 minutes)
with the increase of lignin content for the series performed with PCL750 and PCL1000
using a [NCO]/[OH] ratio of 1.0, and PCL750 using [NCO]/[OH] ratio of 1.25. This
decrease was more pronounced in Indulin AT based series; and (ii) the obtaining of similar
p(30 minutes) for both formulations using PCL400 with lignin content of 10% at a
[NCO]/[OH] ratio of 1.0. Moreover, the obtained values were also very similar to those
achieved for the reference series (lignin content of 0%). This observation further confirms,
that for low lignin contents, polymerisation reaction is not significantly affected by lignin
presence.
5.3.3 Kinetic data analysis
5.3.3.1 Considerations about the used kinetic model
The obtained experimental data were treated according to a global second order model.
The global second order model is widely used to model complex polyurethane systems, for
example, the synthesis of polyurethanes from suberin (Cordeiro et al., 1997), from
oxypropylated cork (Evtiouguina et al., 2001), and from oxypropylated sugar beet pulp
(Pavier and Gandini, 2000). This approach was also used to model the synthesis of
segmented polyurethane systems where more than one type of hydroxyl groups is
presented (Barreiro, 2000).
The conversion rate of isocyanate groups during polymerisation can be expressed
according to equation 5.8. A simplification was considered assuming equal reactivity for
hydroxyls presented in the reaction mixture. Thus:
OHNCOk
dt
NCOd (5.8)
where: [NCO] and [OH] are the isocyanate and hydroxyl concentration at time t,
respectively; and k is the second order kinetic constant.
Under stoichiometric conditions, i.e., [OH]0=[NCO]0 the following expression is obtained:
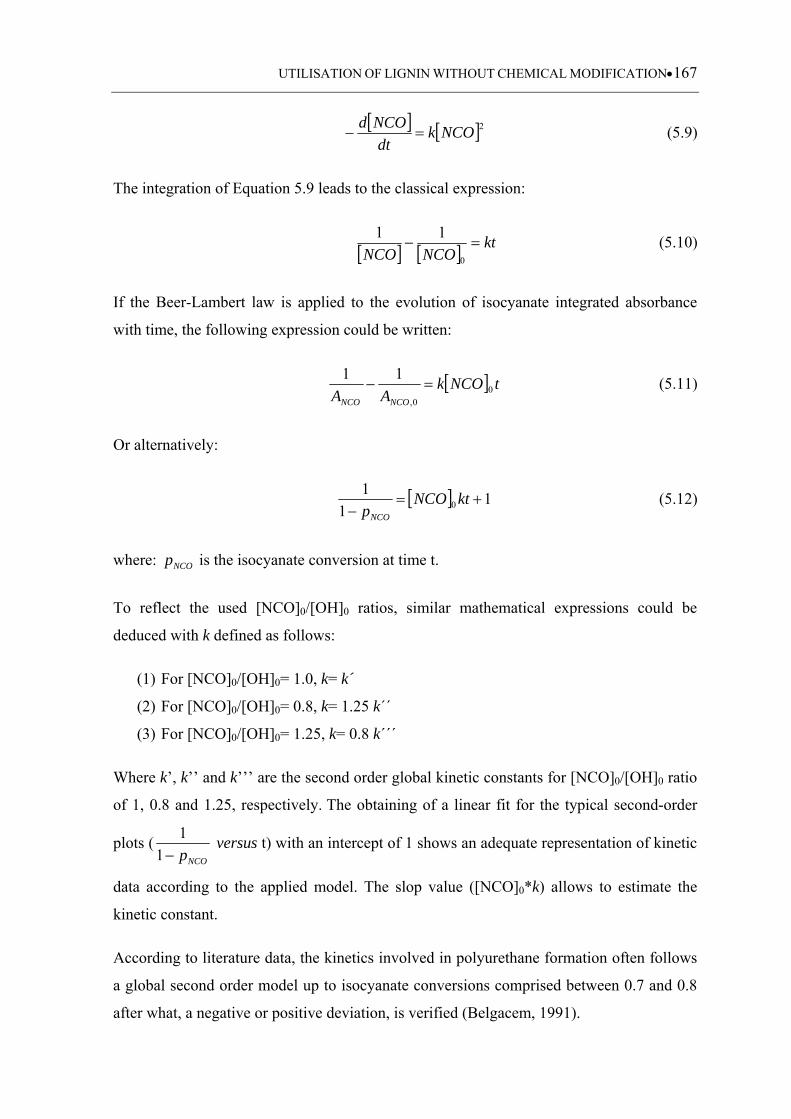
UTILISATION OF LIGNIN WITHOUT CHEMICAL MODIFICATION167
2NCOk
dt
NCOd (5.9)
The integration of Equation 5.9 leads to the classical expression:
ktNCONCO
0
11 (5.10)
If the Beer-Lambert law is applied to the evolution of isocyanate integrated absorbance
with time, the following expression could be written:
tNCOkAA NCONCO
00,
11 (5.11)
Or alternatively:
11
10
ktNCO
pNCO
(5.12)
where: NCOp is the isocyanate conversion at time t.
To reflect the used [NCO]0/[OH]0 ratios, similar mathematical expressions could be
deduced with k defined as follows:
(1) For [NCO]0/[OH]0= 1.0, k= k´
(2) For [NCO]0/[OH]0= 0.8, k= 1.25 k´´
(3) For [NCO]0/[OH]0= 1.25, k= 0.8 k´´´
Where k’, k’’ and k’’’ are the second order global kinetic constants for [NCO]0/[OH]0 ratio
of 1, 0.8 and 1.25, respectively. The obtaining of a linear fit for the typical second-order
plots (NCOp1
1 versus t) with an intercept of 1 shows an adequate representation of kinetic
data according to the applied model. The slop value ([NCO]0*k) allows to estimate the
kinetic constant.
According to literature data, the kinetics involved in polyurethane formation often follows
a global second order model up to isocyanate conversions comprised between 0.7 and 0.8
after what, a negative or positive deviation, is verified (Belgacem, 1991).
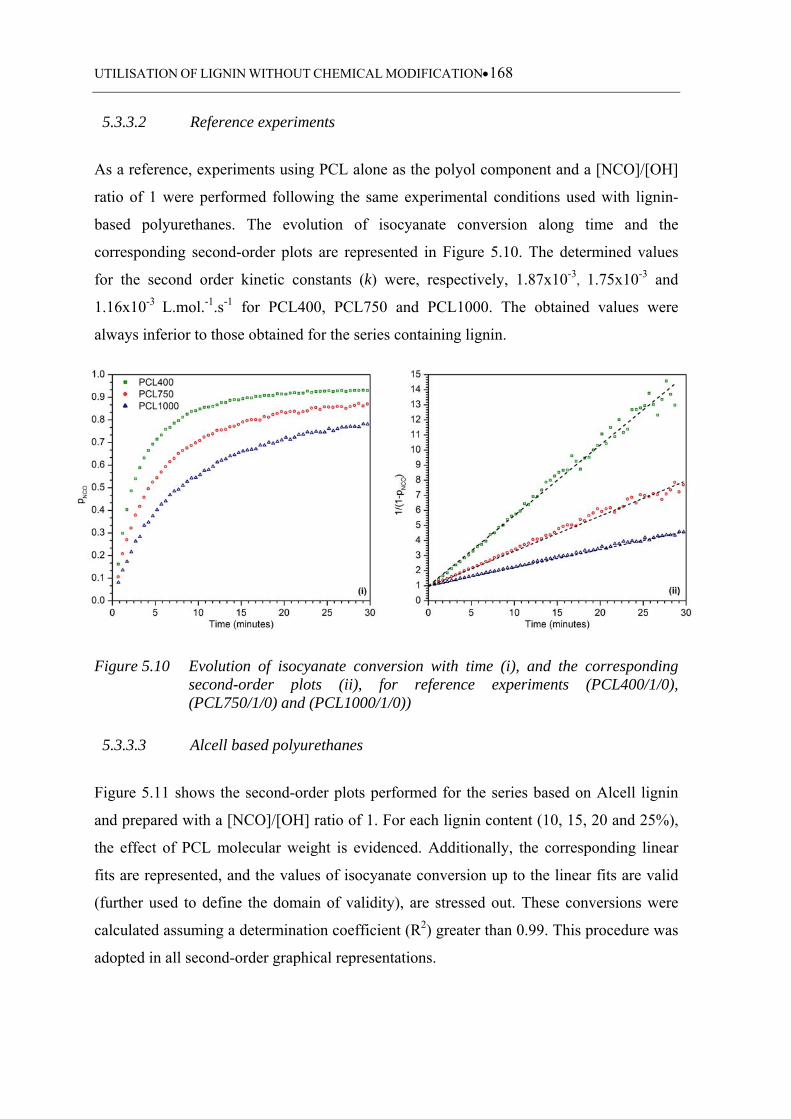
UTILISATION OF LIGNIN WITHOUT CHEMICAL MODIFICATION168
5.3.3.2 Reference experiments
As a reference, experiments using PCL alone as the polyol component and a [NCO]/[OH]
ratio of 1 were performed following the same experimental conditions used with lignin-
based polyurethanes. The evolution of isocyanate conversion along time and the
corresponding second-order plots are represented in Figure 5.10. The determined values
for the second order kinetic constants (k) were, respectively, 1.87x10⁻³, 1.75x10⁻³ and
1.16x10⁻³ L.mol.-1.s-1 for PCL400, PCL750 and PCL1000. The obtained values were
always inferior to those obtained for the series containing lignin.
Figure 5.10 Evolution of isocyanate conversion with time (i), and the corresponding second-order plots (ii), for reference experiments (PCL400/1/0), (PCL750/1/0) and (PCL1000/1/0))
5.3.3.3 Alcell based polyurethanes
Figure 5.11 shows the second-order plots performed for the series based on Alcell lignin
and prepared with a [NCO]/[OH] ratio of 1. For each lignin content (10, 15, 20 and 25%),
the effect of PCL molecular weight is evidenced. Additionally, the corresponding linear
fits are represented, and the values of isocyanate conversion up to the linear fits are valid
(further used to define the domain of validity), are stressed out. These conversions were
calculated assuming a determination coefficient (R2) greater than 0.99. This procedure was
adopted in all second-order graphical representations.
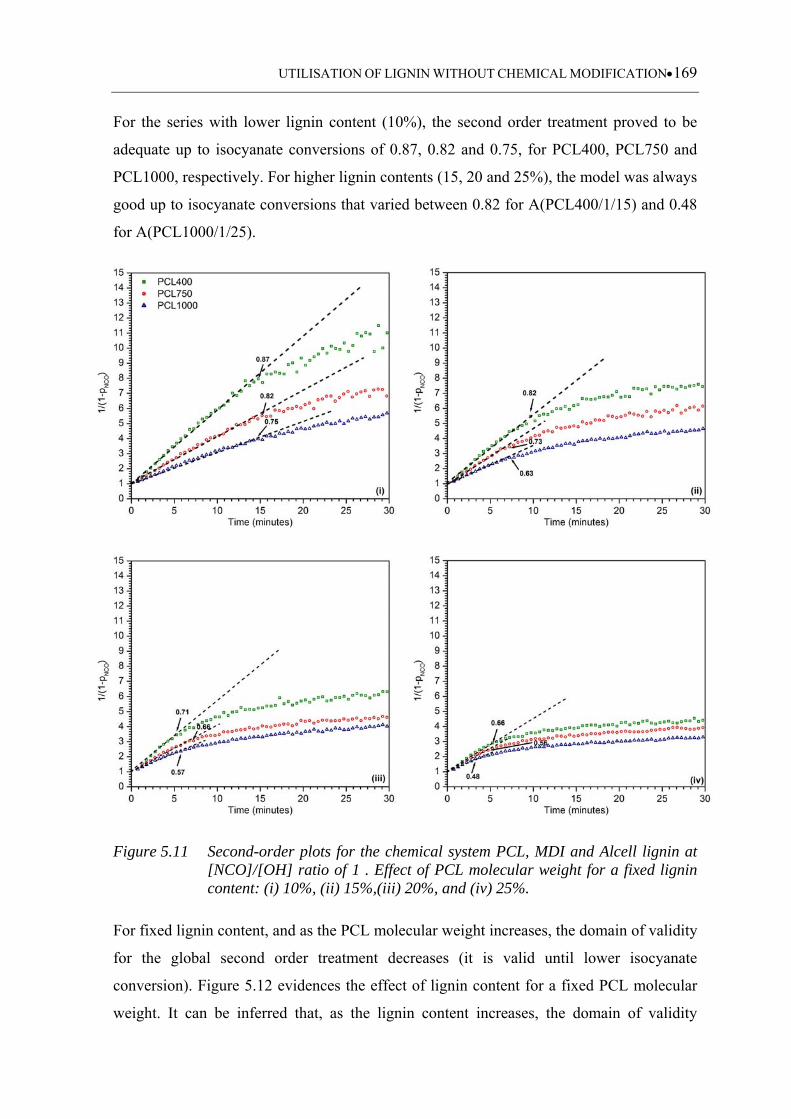
UTILISATION OF LIGNIN WITHOUT CHEMICAL MODIFICATION169
For the series with lower lignin content (10%), the second order treatment proved to be
adequate up to isocyanate conversions of 0.87, 0.82 and 0.75, for PCL400, PCL750 and
PCL1000, respectively. For higher lignin contents (15, 20 and 25%), the model was always
good up to isocyanate conversions that varied between 0.82 for A(PCL400/1/15) and 0.48
for A(PCL1000/1/25).
Figure 5.11 Second-order plots for the chemical system PCL, MDI and Alcell lignin at [NCO]/[OH] ratio of 1 . Effect of PCL molecular weight for a fixed lignin content: (i) 10%, (ii) 15%,(iii) 20%, and (iv) 25%.
For fixed lignin content, and as the PCL molecular weight increases, the domain of validity
for the global second order treatment decreases (it is valid until lower isocyanate
conversion). Figure 5.12 evidences the effect of lignin content for a fixed PCL molecular
weight. It can be inferred that, as the lignin content increases, the domain of validity
UTILISATION OF LIGNIN WITHOUT CHEMICAL MODIFICATION170
decreases. After this point, a negative deviation, which became more pronounced with the
increasing of lignin content, occurs. A common pattern was observed in the early stages of
the polymerisation reaction, i.e., the second-order traces are coincident to the beginning of
the negative deviation.
Figure 5.12 Second-order plots for the chemical system PCL, MDI and Alcell lignin at [NCO]/[OH] ratio of 1. Effect of lignin content (10, 15, 20 and 25%) for a fixed PCL molecular weight: (i) PCL400, (ii) PCL750, and (iii) PCL1000.
In Figure 5.13, the effect of using different [NCO]/[OH] ratios (0.8, 1.0 and 1.25), are
shown for the study performed with PCL750. As can be seen a negative deviation have
also occurred. Moreover, this deviation is intensified with the increase of [NCO]/[OH]
ratio. The fit to the global second order model was found to be superior for samples with
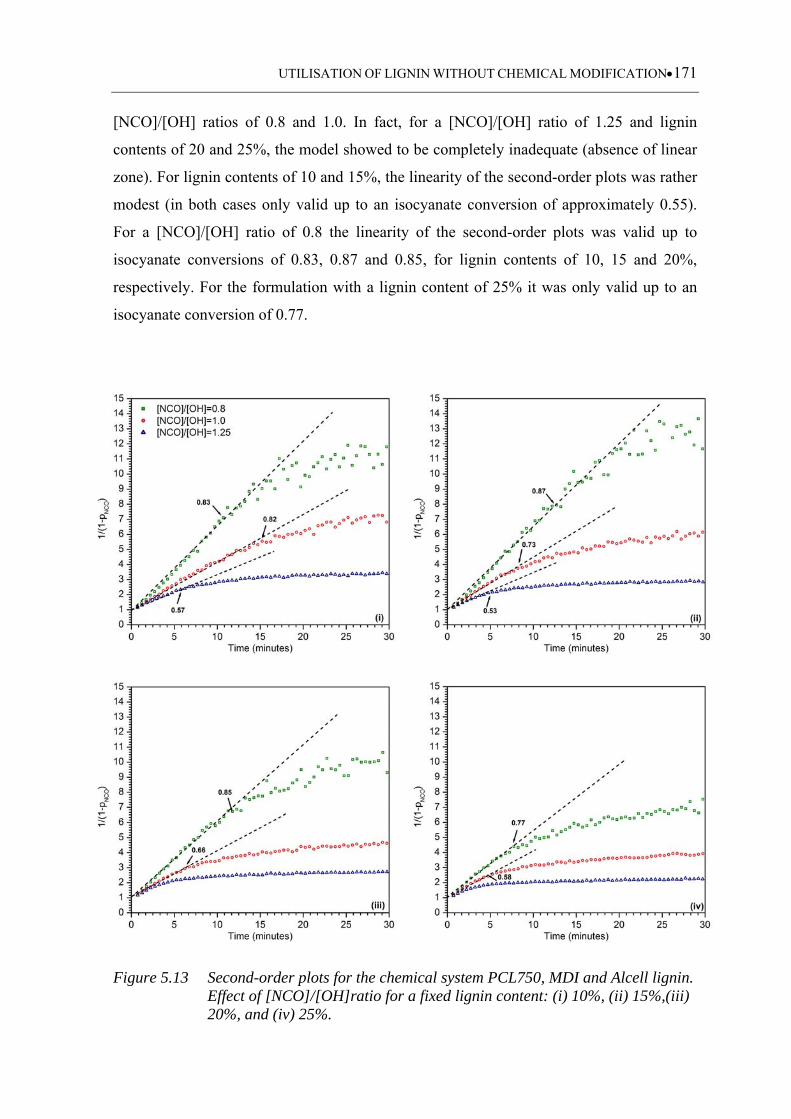
UTILISATION OF LIGNIN WITHOUT CHEMICAL MODIFICATION171
[NCO]/[OH] ratios of 0.8 and 1.0. In fact, for a [NCO]/[OH] ratio of 1.25 and lignin
contents of 20 and 25%, the model showed to be completely inadequate (absence of linear
zone). For lignin contents of 10 and 15%, the linearity of the second-order plots was rather
modest (in both cases only valid up to an isocyanate conversion of approximately 0.55).
For a [NCO]/[OH] ratio of 0.8 the linearity of the second-order plots was valid up to
isocyanate conversions of 0.83, 0.87 and 0.85, for lignin contents of 10, 15 and 20%,
respectively. For the formulation with a lignin content of 25% it was only valid up to an
isocyanate conversion of 0.77.
Figure 5.13 Second-order plots for the chemical system PCL750, MDI and Alcell lignin. Effect of [NCO]/[OH]ratio for a fixed lignin content: (i) 10%, (ii) 15%,(iii) 20%, and (iv) 25%.
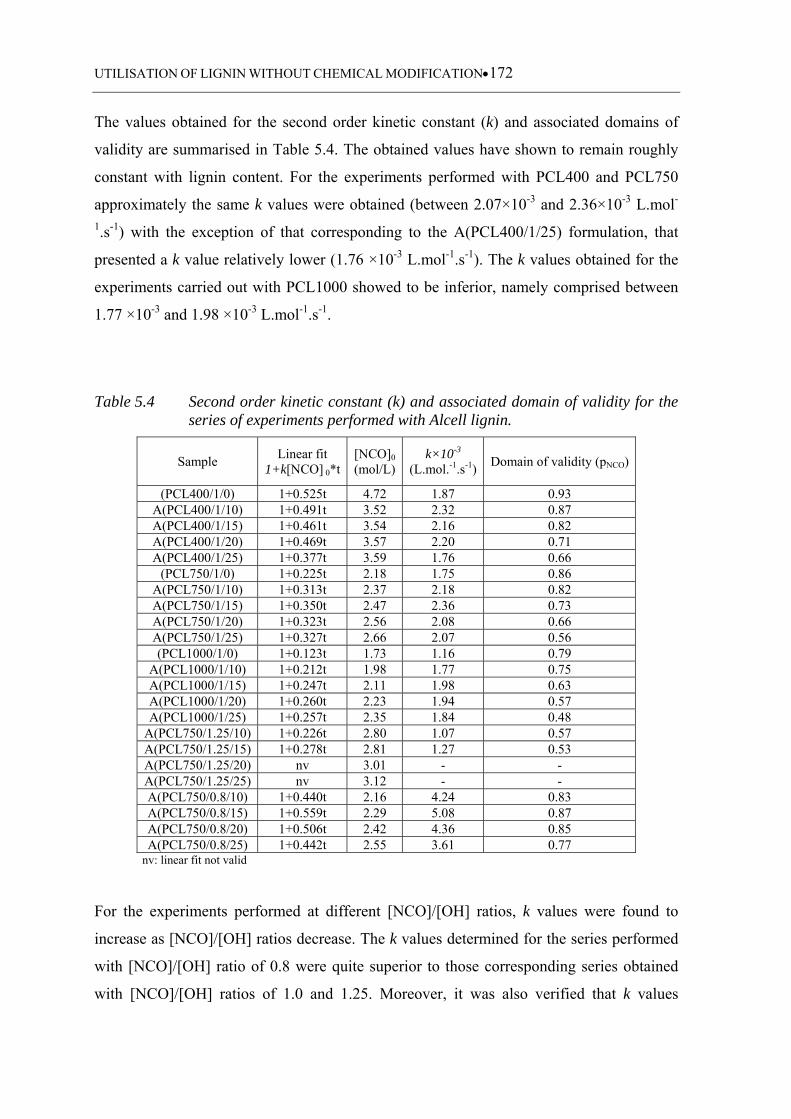
UTILISATION OF LIGNIN WITHOUT CHEMICAL MODIFICATION172
The values obtained for the second order kinetic constant (k) and associated domains of
validity are summarised in Table 5.4. The obtained values have shown to remain roughly
constant with lignin content. For the experiments performed with PCL400 and PCL750
approximately the same k values were obtained (between 2.07×10⁻³ and 2.36×10⁻³ L.mol-
1.s-1) with the exception of that corresponding to the A(PCL400/1/25) formulation, that
presented a k value relatively lower (1.76 ×10⁻³ L.mol-1.s-1). The k values obtained for the
experiments carried out with PCL1000 showed to be inferior, namely comprised between
1.77 ×10⁻³ and 1.98 ×10⁻³ L.mol-1.s-1.
Table 5.4 Second order kinetic constant (k) and associated domain of validity for the series of experiments performed with Alcell lignin.
Sample Linear fit
1+k[NCO] 0*t[NCO]0 (mol/L)
k×10-3 (L.mol.-1.s-1)
Domain of validity (pNCO)
(PCL400/1/0) 1+0.525t 4.72 1.87 0.93 A(PCL400/1/10) 1+0.491t 3.52 2.32 0.87 A(PCL400/1/15) 1+0.461t 3.54 2.16 0.82 A(PCL400/1/20) 1+0.469t 3.57 2.20 0.71 A(PCL400/1/25) 1+0.377t 3.59 1.76 0.66
(PCL750/1/0) 1+0.225t 2.18 1.75 0.86 A(PCL750/1/10) 1+0.313t 2.37 2.18 0.82 A(PCL750/1/15) 1+0.350t 2.47 2.36 0.73 A(PCL750/1/20) 1+0.323t 2.56 2.08 0.66 A(PCL750/1/25) 1+0.327t 2.66 2.07 0.56 (PCL1000/1/0) 1+0.123t 1.73 1.16 0.79
A(PCL1000/1/10) 1+0.212t 1.98 1.77 0.75 A(PCL1000/1/15) 1+0.247t 2.11 1.98 0.63 A(PCL1000/1/20) 1+0.260t 2.23 1.94 0.57 A(PCL1000/1/25) 1+0.257t 2.35 1.84 0.48
A(PCL750/1.25/10) 1+0.226t 2.80 1.07 0.57 A(PCL750/1.25/15) 1+0.278t 2.81 1.27 0.53 A(PCL750/1.25/20) nv 3.01 - - A(PCL750/1.25/25) nv 3.12 - - A(PCL750/0.8/10) 1+0.440t 2.16 4.24 0.83 A(PCL750/0.8/15) 1+0.559t 2.29 5.08 0.87 A(PCL750/0.8/20) 1+0.506t 2.42 4.36 0.85 A(PCL750/0.8/25) 1+0.442t 2.55 3.61 0.77
nv: linear fit not valid
For the experiments performed at different [NCO]/[OH] ratios, k values were found to
increase as [NCO]/[OH] ratios decrease. The k values determined for the series performed
with [NCO]/[OH] ratio of 0.8 were quite superior to those corresponding series obtained
with [NCO]/[OH] ratios of 1.0 and 1.25. Moreover, it was also verified that k values
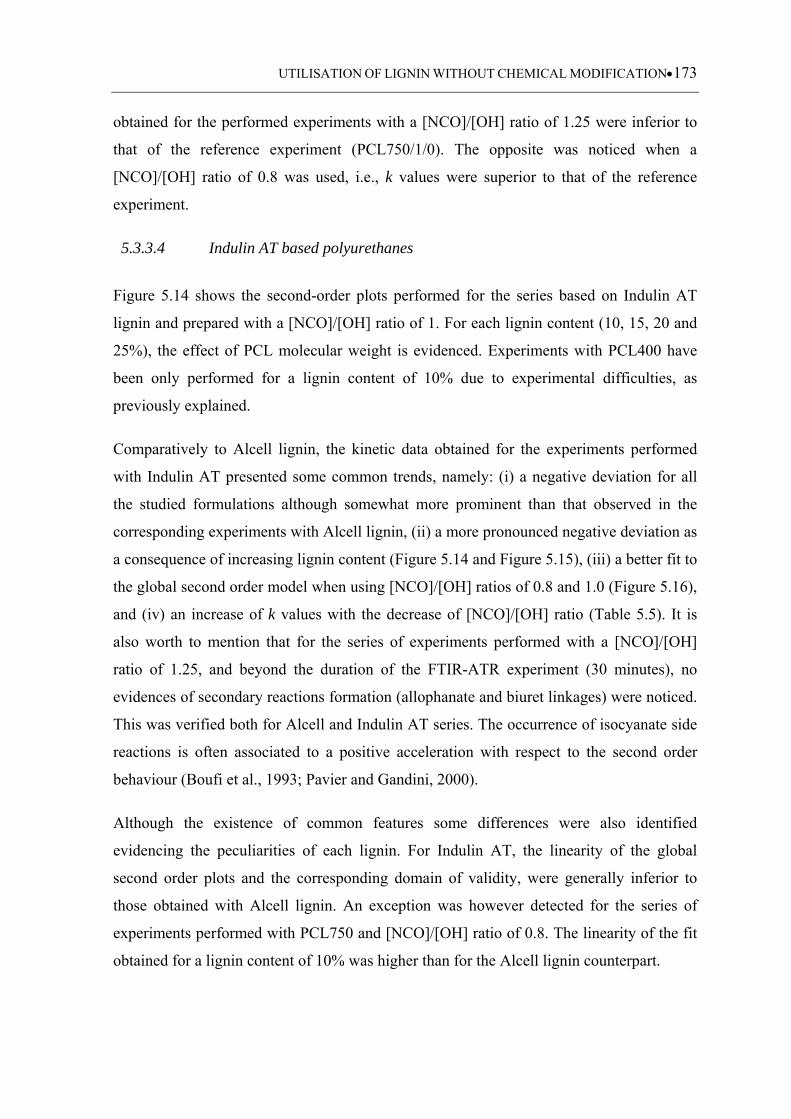
UTILISATION OF LIGNIN WITHOUT CHEMICAL MODIFICATION173
obtained for the performed experiments with a [NCO]/[OH] ratio of 1.25 were inferior to
that of the reference experiment (PCL750/1/0). The opposite was noticed when a
[NCO]/[OH] ratio of 0.8 was used, i.e., k values were superior to that of the reference
experiment.
5.3.3.4 Indulin AT based polyurethanes
Figure 5.14 shows the second-order plots performed for the series based on Indulin AT
lignin and prepared with a [NCO]/[OH] ratio of 1. For each lignin content (10, 15, 20 and
25%), the effect of PCL molecular weight is evidenced. Experiments with PCL400 have
been only performed for a lignin content of 10% due to experimental difficulties, as
previously explained.
Comparatively to Alcell lignin, the kinetic data obtained for the experiments performed
with Indulin AT presented some common trends, namely: (i) a negative deviation for all
the studied formulations although somewhat more prominent than that observed in the
corresponding experiments with Alcell lignin, (ii) a more pronounced negative deviation as
a consequence of increasing lignin content (Figure 5.14 and Figure 5.15), (iii) a better fit to
the global second order model when using [NCO]/[OH] ratios of 0.8 and 1.0 (Figure 5.16),
and (iv) an increase of k values with the decrease of [NCO]/[OH] ratio (Table 5.5). It is
also worth to mention that for the series of experiments performed with a [NCO]/[OH]
ratio of 1.25, and beyond the duration of the FTIR-ATR experiment (30 minutes), no
evidences of secondary reactions formation (allophanate and biuret linkages) were noticed.
This was verified both for Alcell and Indulin AT series. The occurrence of isocyanate side
reactions is often associated to a positive acceleration with respect to the second order
behaviour (Boufi et al., 1993; Pavier and Gandini, 2000).
Although the existence of common features some differences were also identified
evidencing the peculiarities of each lignin. For Indulin AT, the linearity of the global
second order plots and the corresponding domain of validity, were generally inferior to
those obtained with Alcell lignin. An exception was however detected for the series of
experiments performed with PCL750 and [NCO]/[OH] ratio of 0.8. The linearity of the fit
obtained for a lignin content of 10% was higher than for the Alcell lignin counterpart.
UTILISATION OF LIGNIN WITHOUT CHEMICAL MODIFICATION174
Figure 5.14 Second-order plots for the chemical system PCL, MDI and Indulin AT lignin at [NCO]/[OH] ratio of 1. Effect of PCL molecular weight for a fixed lignin content: (i) 10%, (ii) 15%,(iii) 20%, and (iv) 25%.
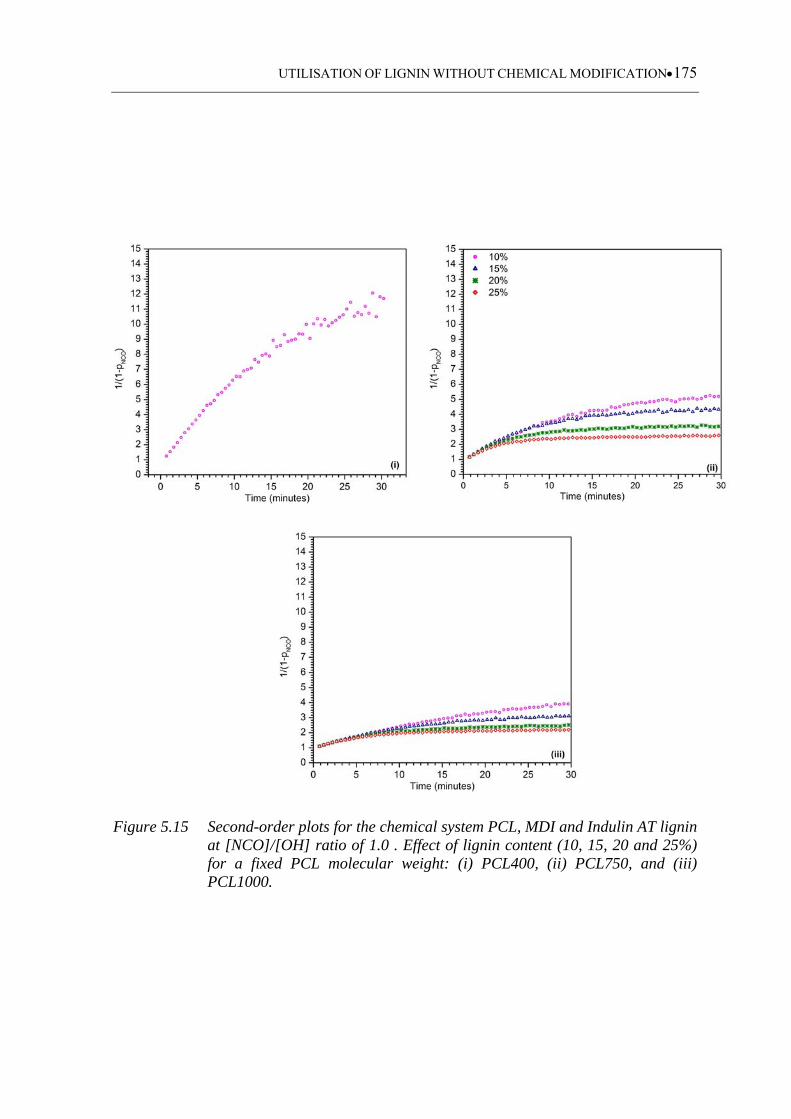
UTILISATION OF LIGNIN WITHOUT CHEMICAL MODIFICATION175
Figure 5.15 Second-order plots for the chemical system PCL, MDI and Indulin AT lignin at [NCO]/[OH] ratio of 1.0 . Effect of lignin content (10, 15, 20 and 25%) for a fixed PCL molecular weight: (i) PCL400, (ii) PCL750, and (iii) PCL1000.
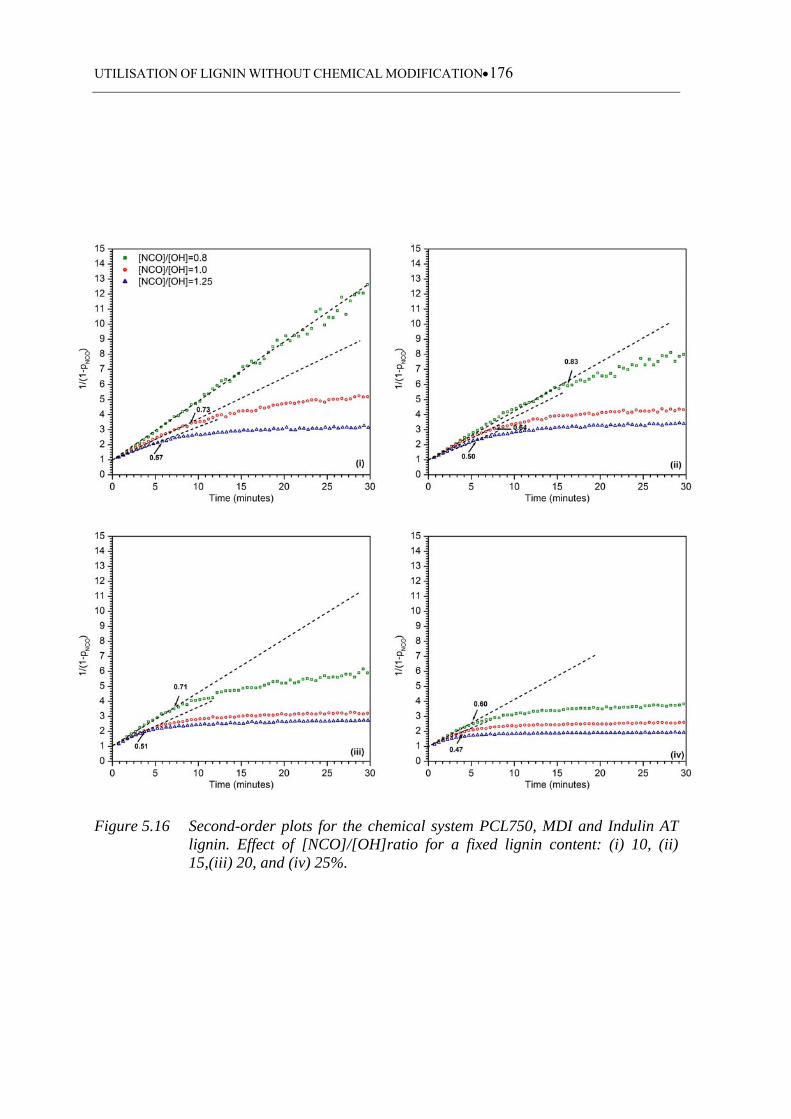
UTILISATION OF LIGNIN WITHOUT CHEMICAL MODIFICATION176
Figure 5.16 Second-order plots for the chemical system PCL750, MDI and Indulin AT lignin. Effect of [NCO]/[OH]ratio for a fixed lignin content: (i) 10, (ii) 15,(iii) 20, and (iv) 25%.
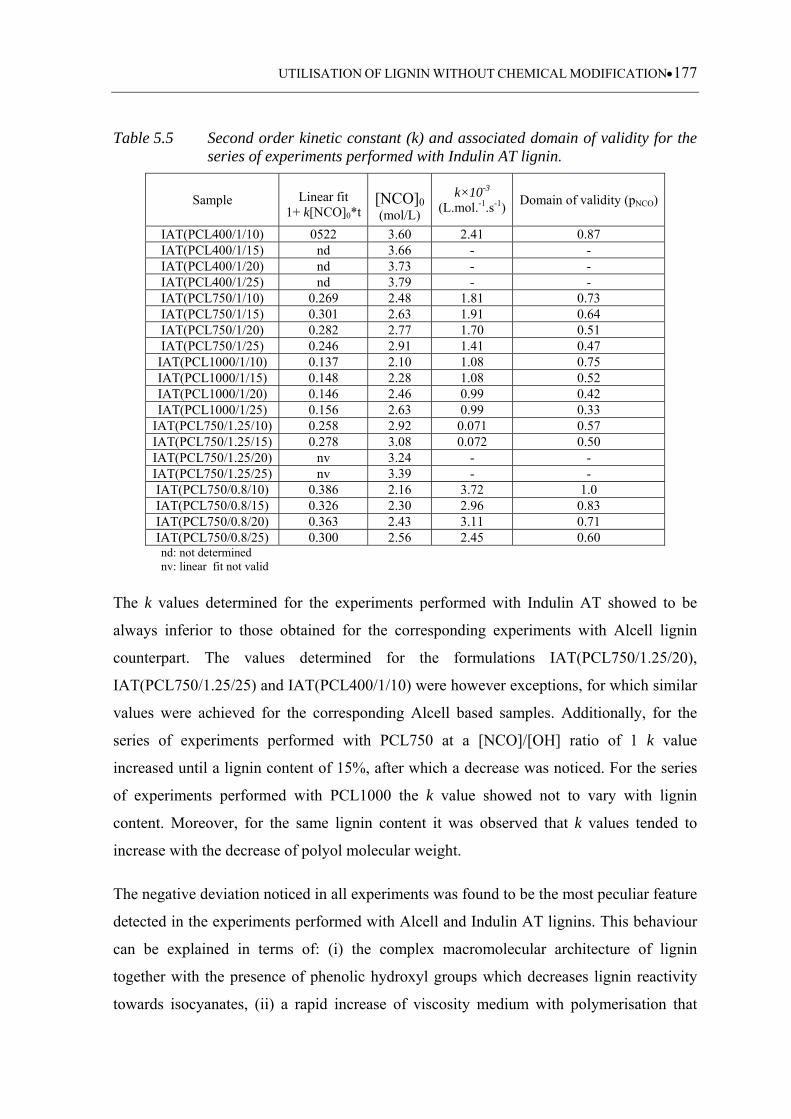
UTILISATION OF LIGNIN WITHOUT CHEMICAL MODIFICATION177
Table 5.5 Second order kinetic constant (k) and associated domain of validity for the series of experiments performed with Indulin AT lignin.
Sample
Linear fit 1+ k[NCO]0*t
[NCO]0(mol/L)
k×10-3 (L.mol.-1.s-1)
Domain of validity (pNCO)
IAT(PCL400/1/10) 0522 3.60 2.41 0.87 IAT(PCL400/1/15) nd 3.66 - - IAT(PCL400/1/20) nd 3.73 - - IAT(PCL400/1/25) nd 3.79 - - IAT(PCL750/1/10) 0.269 2.48 1.81 0.73 IAT(PCL750/1/15) 0.301 2.63 1.91 0.64 IAT(PCL750/1/20) 0.282 2.77 1.70 0.51 IAT(PCL750/1/25) 0.246 2.91 1.41 0.47
IAT(PCL1000/1/10) 0.137 2.10 1.08 0.75 IAT(PCL1000/1/15) 0.148 2.28 1.08 0.52 IAT(PCL1000/1/20) 0.146 2.46 0.99 0.42 IAT(PCL1000/1/25) 0.156 2.63 0.99 0.33
IAT(PCL750/1.25/10) 0.258 2.92 0.071 0.57 IAT(PCL750/1.25/15) 0.278 3.08 0.072 0.50 IAT(PCL750/1.25/20) nv 3.24 - - IAT(PCL750/1.25/25) nv 3.39 - - IAT(PCL750/0.8/10) 0.386 2.16 3.72 1.0 IAT(PCL750/0.8/15) 0.326 2.30 2.96 0.83 IAT(PCL750/0.8/20) 0.363 2.43 3.11 0.71 IAT(PCL750/0.8/25) 0.300 2.56 2.45 0.60 nd: not determined nv: linear fit not valid
The k values determined for the experiments performed with Indulin AT showed to be
always inferior to those obtained for the corresponding experiments with Alcell lignin
counterpart. The values determined for the formulations IAT(PCL750/1.25/20),
IAT(PCL750/1.25/25) and IAT(PCL400/1/10) were however exceptions, for which similar
values were achieved for the corresponding Alcell based samples. Additionally, for the
series of experiments performed with PCL750 at a [NCO]/[OH] ratio of 1 k value
increased until a lignin content of 15%, after which a decrease was noticed. For the series
of experiments performed with PCL1000 the k value showed not to vary with lignin
content. Moreover, for the same lignin content it was observed that k values tended to
increase with the decrease of polyol molecular weight.
The negative deviation noticed in all experiments was found to be the most peculiar feature
detected in the experiments performed with Alcell and Indulin AT lignins. This behaviour
can be explained in terms of: (i) the complex macromolecular architecture of lignin
together with the presence of phenolic hydroxyl groups which decreases lignin reactivity
towards isocyanates, (ii) a rapid increase of viscosity medium with polymerisation that
UTILISATION OF LIGNIN WITHOUT CHEMICAL MODIFICATION178
hinders macromolecular mobility causing diffusion constraints (accessibility of reactive
groups). This situation is documented in some works related to bulk polymerisation of
polyurethanes (see, for example, Boufi et al., 1993).
The negative deviation was however more notorious in the experiments performed with
Indulin AT lignin. This pointed out for a greater incorporation of this lignin in the
formation of the polymer network trough chemical reaction with isocyanate groups. In
fact, Indulin AT lignin presents both total and aliphatic hydroxyl contents superior to that
of Alcell lignin. Also, according to the work published by Yoshida et al. (1990) and
Vanderlaan and Thring (1998) medium and high molecular lignin fractions act as crosslink
points whereas low molecular weight fractions act more like a chain extenders. These are
the cases of Indulin AT and Alcell lignin, respectively.
The global second order treatment showed to be dependent of lignin type and content as
well as of the [NCO]/[OH] ratio and PCL molecular weight. In fact, for the studied system
this model was found to be more adequate for both low lignin contents and [NCO]/[OH]
ratios.
5.3.4 Characterisation of lignin-based polyurethane samples
5.3.4.1 Samples planning and general observations
In order to inspect the effect of PCL molecular weight, [NCO]/[OH] ratio, lignin content
and type, on lignin-based polyurethane properties, several samples were synthesised and
thereafter analysed by modulated DSC and by DMA. Moreover, swelling tests in DMF
were performed. The structure-properties relationships were tentatively established.
The formulations were chosen in order to inspect the variables as follows:
(i) the effect of PCL molecular weight was determined by synthesising samples
with PCL400, PCL750 and PCL1000 for a lignin content of 25%;
(ii) the effect of [NCO]/[OH] ratio was inspected by synthesising samples with
[NCO]/[OH] ratios of 0.8, 1.0 and 1.25 for a lignin content of 25% and using
PCL750;
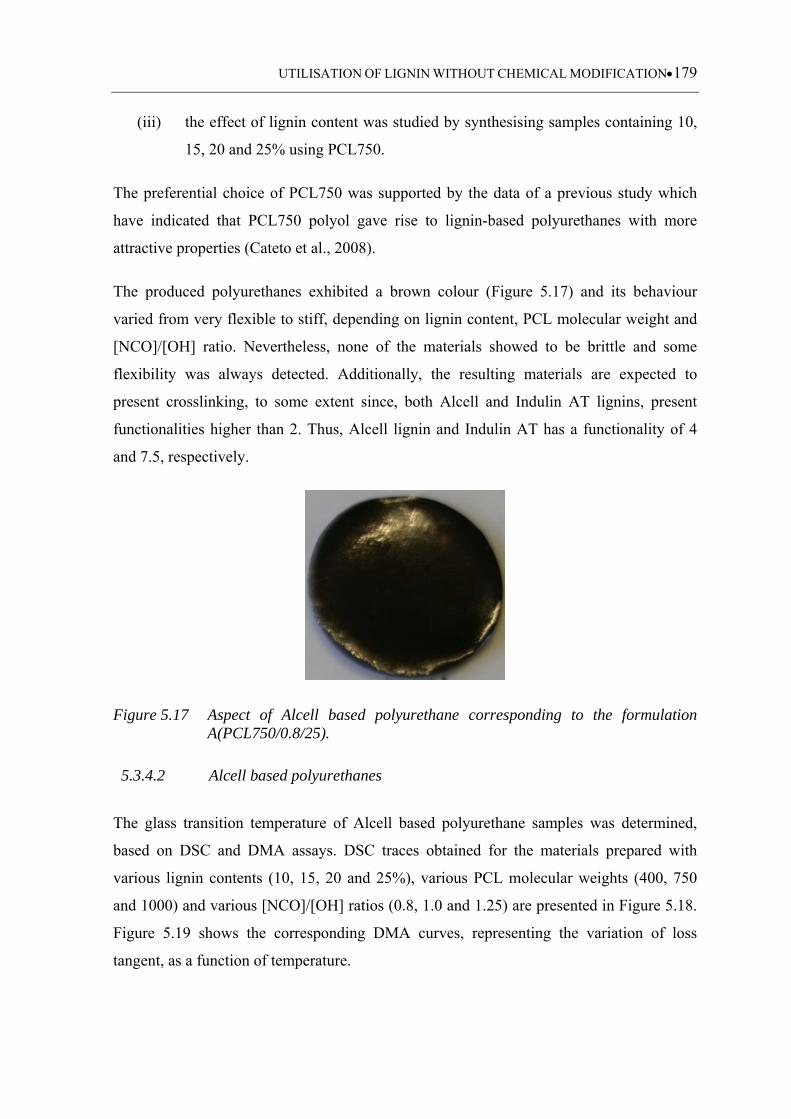
UTILISATION OF LIGNIN WITHOUT CHEMICAL MODIFICATION179
(iii) the effect of lignin content was studied by synthesising samples containing 10,
15, 20 and 25% using PCL750.
The preferential choice of PCL750 was supported by the data of a previous study which
have indicated that PCL750 polyol gave rise to lignin-based polyurethanes with more
attractive properties (Cateto et al., 2008).
The produced polyurethanes exhibited a brown colour (Figure 5.17) and its behaviour
varied from very flexible to stiff, depending on lignin content, PCL molecular weight and
[NCO]/[OH] ratio. Nevertheless, none of the materials showed to be brittle and some
flexibility was always detected. Additionally, the resulting materials are expected to
present crosslinking, to some extent since, both Alcell and Indulin AT lignins, present
functionalities higher than 2. Thus, Alcell lignin and Indulin AT has a functionality of 4
and 7.5, respectively.
Figure 5.17 Aspect of Alcell based polyurethane corresponding to the formulation A(PCL750/0.8/25).
5.3.4.2 Alcell based polyurethanes
The glass transition temperature of Alcell based polyurethane samples was determined,
based on DSC and DMA assays. DSC traces obtained for the materials prepared with
various lignin contents (10, 15, 20 and 25%), various PCL molecular weights (400, 750
and 1000) and various [NCO]/[OH] ratios (0.8, 1.0 and 1.25) are presented in Figure 5.18.
Figure 5.19 shows the corresponding DMA curves, representing the variation of loss
tangent, as a function of temperature.
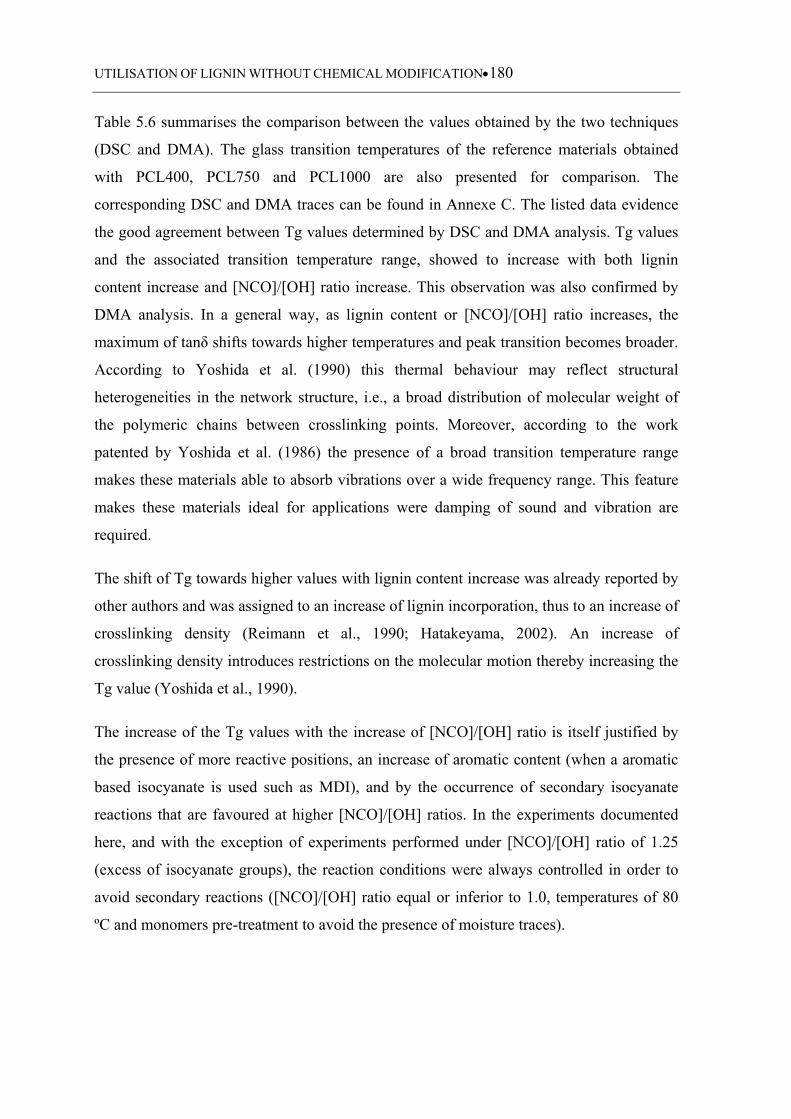
UTILISATION OF LIGNIN WITHOUT CHEMICAL MODIFICATION180
Table 5.6 summarises the comparison between the values obtained by the two techniques
(DSC and DMA). The glass transition temperatures of the reference materials obtained
with PCL400, PCL750 and PCL1000 are also presented for comparison. The
corresponding DSC and DMA traces can be found in Annexe C. The listed data evidence
the good agreement between Tg values determined by DSC and DMA analysis. Tg values
and the associated transition temperature range, showed to increase with both lignin
content increase and [NCO]/[OH] ratio increase. This observation was also confirmed by
DMA analysis. In a general way, as lignin content or [NCO]/[OH] ratio increases, the
maximum of tanδ shifts towards higher temperatures and peak transition becomes broader.
According to Yoshida et al. (1990) this thermal behaviour may reflect structural
heterogeneities in the network structure, i.e., a broad distribution of molecular weight of
the polymeric chains between crosslinking points. Moreover, according to the work
patented by Yoshida et al. (1986) the presence of a broad transition temperature range
makes these materials able to absorb vibrations over a wide frequency range. This feature
makes these materials ideal for applications were damping of sound and vibration are
required.
The shift of Tg towards higher values with lignin content increase was already reported by
other authors and was assigned to an increase of lignin incorporation, thus to an increase of
crosslinking density (Reimann et al., 1990; Hatakeyama, 2002). An increase of
crosslinking density introduces restrictions on the molecular motion thereby increasing the
Tg value (Yoshida et al., 1990).
The increase of the Tg values with the increase of [NCO]/[OH] ratio is itself justified by
the presence of more reactive positions, an increase of aromatic content (when a aromatic
based isocyanate is used such as MDI), and by the occurrence of secondary isocyanate
reactions that are favoured at higher [NCO]/[OH] ratios. In the experiments documented
here, and with the exception of experiments performed under [NCO]/[OH] ratio of 1.25
(excess of isocyanate groups), the reaction conditions were always controlled in order to
avoid secondary reactions ([NCO]/[OH] ratio equal or inferior to 1.0, temperatures of 80
ºC and monomers pre-treatment to avoid the presence of moisture traces).
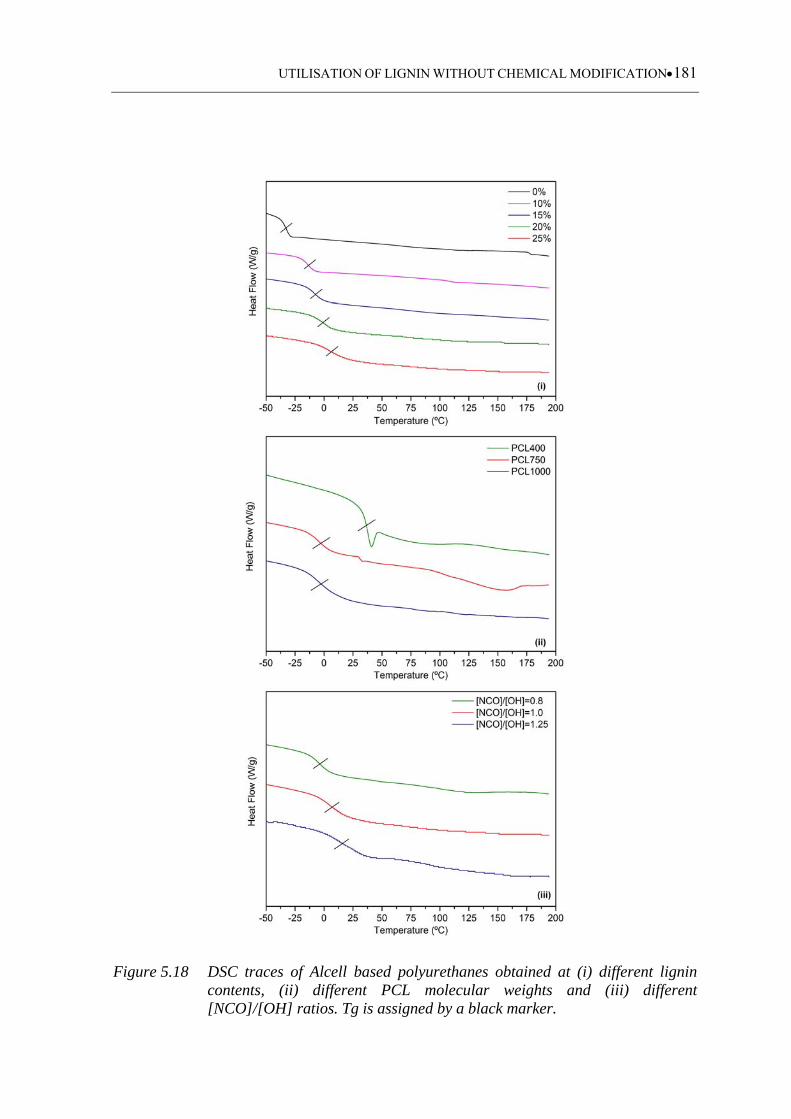
UTILISATION OF LIGNIN WITHOUT CHEMICAL MODIFICATION181
Figure 5.18 DSC traces of Alcell based polyurethanes obtained at (i) different lignin contents, (ii) different PCL molecular weights and (iii) different [NCO]/[OH] ratios. Tg is assigned by a black marker.
UTILISATION OF LIGNIN WITHOUT CHEMICAL MODIFICATION182
Figure 5.19 Loss tangent as a function of temperature for Alcell based polyurethanes obtained at (i) different lignin contents, (ii) different PCL molecular weights and (iii) different [NCO]/[OH] ratios.
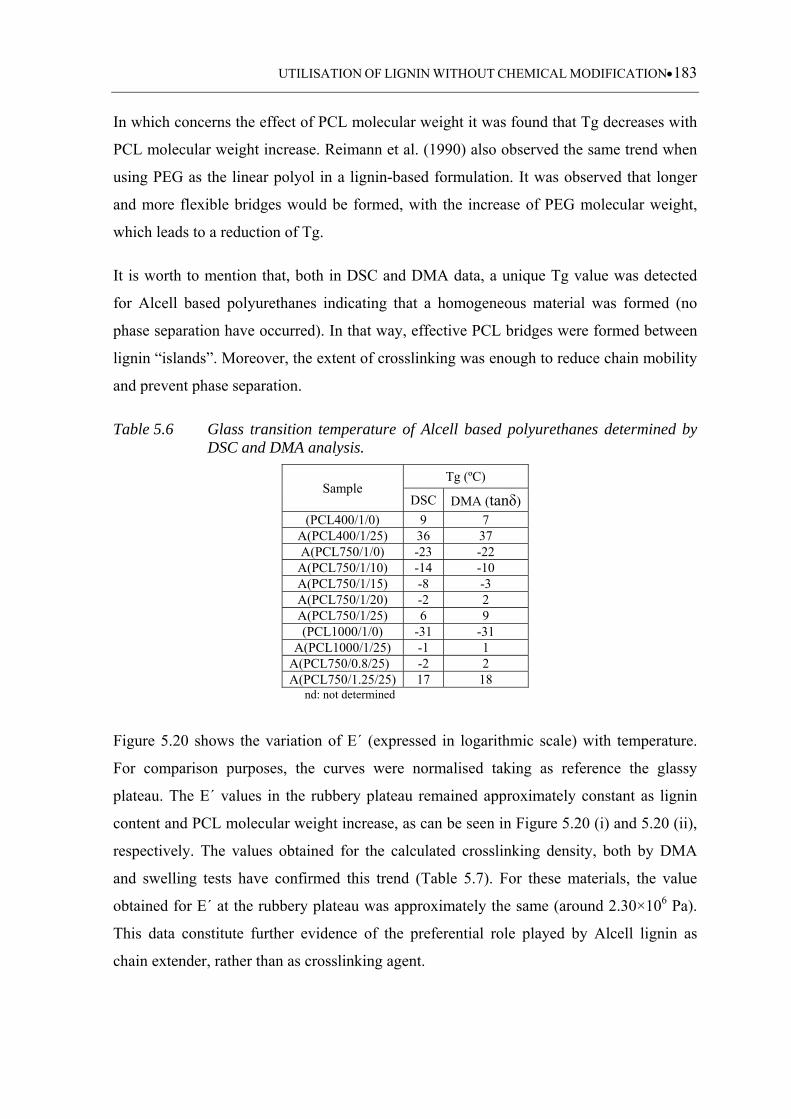
UTILISATION OF LIGNIN WITHOUT CHEMICAL MODIFICATION183
In which concerns the effect of PCL molecular weight it was found that Tg decreases with
PCL molecular weight increase. Reimann et al. (1990) also observed the same trend when
using PEG as the linear polyol in a lignin-based formulation. It was observed that longer
and more flexible bridges would be formed, with the increase of PEG molecular weight,
which leads to a reduction of Tg.
It is worth to mention that, both in DSC and DMA data, a unique Tg value was detected
for Alcell based polyurethanes indicating that a homogeneous material was formed (no
phase separation have occurred). In that way, effective PCL bridges were formed between
lignin “islands”. Moreover, the extent of crosslinking was enough to reduce chain mobility
and prevent phase separation.
Table 5.6 Glass transition temperature of Alcell based polyurethanes determined by DSC and DMA analysis.
Sample Tg (ºC)
DSC DMA (tanδ)
(PCL400/1/0) 9 7 A(PCL400/1/25) 36 37 A(PCL750/1/0) -23 -22
A(PCL750/1/10) -14 -10 A(PCL750/1/15) -8 -3 A(PCL750/1/20) -2 2 A(PCL750/1/25) 6 9 (PCL1000/1/0) -31 -31
A(PCL1000/1/25) -1 1 A(PCL750/0.8/25) -2 2 A(PCL750/1.25/25) 17 18
nd: not determined
Figure 5.20 shows the variation of E´ (expressed in logarithmic scale) with temperature.
For comparison purposes, the curves were normalised taking as reference the glassy
plateau. The E´ values in the rubbery plateau remained approximately constant as lignin
content and PCL molecular weight increase, as can be seen in Figure 5.20 (i) and 5.20 (ii),
respectively. The values obtained for the calculated crosslinking density, both by DMA
and swelling tests have confirmed this trend (Table 5.7). For these materials, the value
obtained for E´ at the rubbery plateau was approximately the same (around 2.30×10⁶ Pa).
This data constitute further evidence of the preferential role played by Alcell lignin as
chain extender, rather than as crosslinking agent.
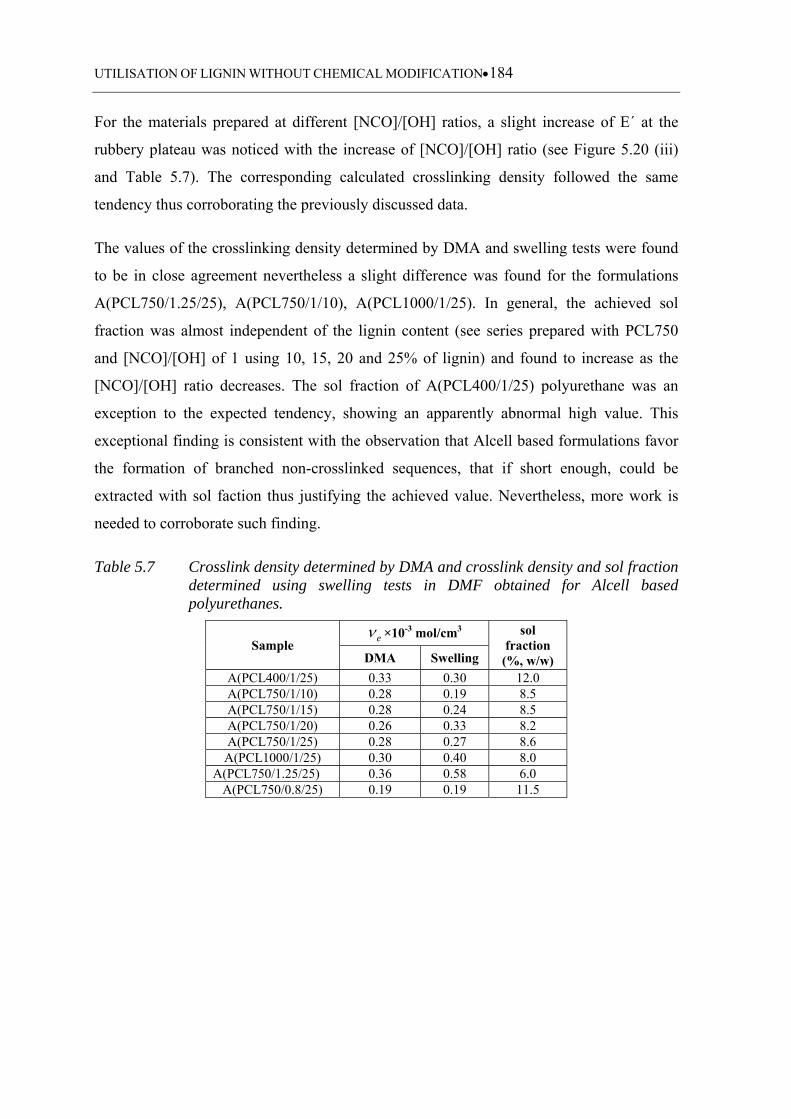
UTILISATION OF LIGNIN WITHOUT CHEMICAL MODIFICATION184
For the materials prepared at different [NCO]/[OH] ratios, a slight increase of E´ at the
rubbery plateau was noticed with the increase of [NCO]/[OH] ratio (see Figure 5.20 (iii)
and Table 5.7). The corresponding calculated crosslinking density followed the same
tendency thus corroborating the previously discussed data.
The values of the crosslinking density determined by DMA and swelling tests were found
to be in close agreement nevertheless a slight difference was found for the formulations
A(PCL750/1.25/25), A(PCL750/1/10), A(PCL1000/1/25). In general, the achieved sol
fraction was almost independent of the lignin content (see series prepared with PCL750
and [NCO]/[OH] of 1 using 10, 15, 20 and 25% of lignin) and found to increase as the
[NCO]/[OH] ratio decreases. The sol fraction of A(PCL400/1/25) polyurethane was an
exception to the expected tendency, showing an apparently abnormal high value. This
exceptional finding is consistent with the observation that Alcell based formulations favor
the formation of branched non-crosslinked sequences, that if short enough, could be
extracted with sol faction thus justifying the achieved value. Nevertheless, more work is
needed to corroborate such finding.
Table 5.7 Crosslink density determined by DMA and crosslink density and sol fraction determined using swelling tests in DMF obtained for Alcell based polyurethanes.
Sample e ×10-3 mol/cm3 sol
fraction (%, w/w) DMA Swelling
A(PCL400/1/25) 0.33 0.30 12.0 A(PCL750/1/10) 0.28 0.19 8.5 A(PCL750/1/15) 0.28 0.24 8.5 A(PCL750/1/20) 0.26 0.33 8.2 A(PCL750/1/25) 0.28 0.27 8.6 A(PCL1000/1/25) 0.30 0.40 8.0
A(PCL750/1.25/25) 0.36 0.58 6.0 A(PCL750/0.8/25) 0.19 0.19 11.5
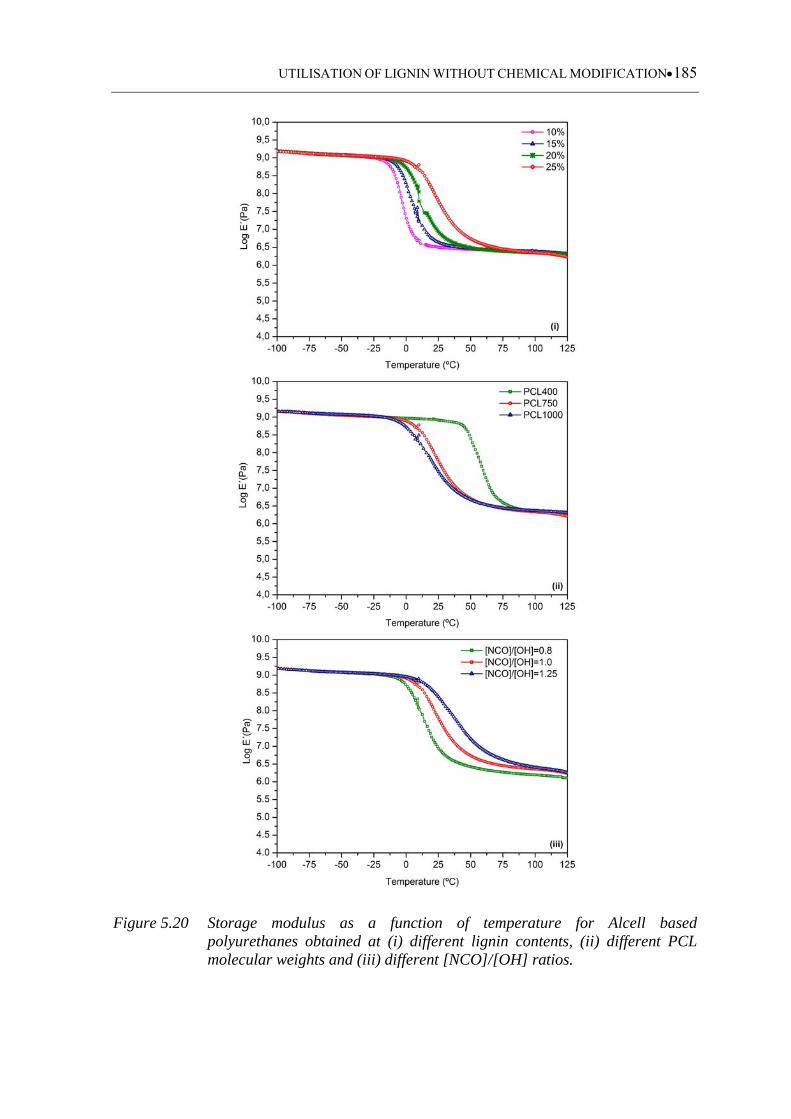
UTILISATION OF LIGNIN WITHOUT CHEMICAL MODIFICATION185
Figure 5.20 Storage modulus as a function of temperature for Alcell based polyurethanes obtained at (i) different lignin contents, (ii) different PCL molecular weights and (iii) different [NCO]/[OH] ratios.
UTILISATION OF LIGNIN WITHOUT CHEMICAL MODIFICATION186
5.3.4.3 Indulin AT based polyurethanes
The glass transition temperature and associated temperature range obtained for the
materials prepared with Indulin AT lignin followed the same tendency of those prepared
with Alcell lignin in which regards lignin content and PCL molecular weight as can be
seen in Table 5.8 and Figures 5.21 ((i) and (ii)) and 5.22 ((i) and (ii)).
For the materials prepared with different [NCO]/[OH] ratios the same Tg value was
obtained by DMA while for DSC analysis Tg revealed a slight increase with the increase
of [NCO]/[OH] ratio (Table 5.8 and Figures 5.21 (iii) and 5.22 (iii)). According to the
literature, DSC is more accurate for detecting glass transition temperature than DMA and
therefore the data from DSC analysis will be here considered as the most reliable.
The E´ values obtained for Indulin AT based polyurethanes increased with lignin content
increase up to a content of 20%. Among the prepared materials with 20 and 25% no
significant difference was noticed (Figure 5.23 (i)). The same general trend was observed
for crosslinking density determined by DMA and swelling tests with the exception of the
value achieved for the sample IAT(PCL750/1/25) (Table 5.9). Contrary to Alcell, the
calculated values for this parameter were quite different for the two used techniques. The
values determined by DMA were always superior to those obtained based on swelling
tests. Nevertheless, the same general trend was identified using the two methods.
For the materials prepared at different [NCO]/[OH] ratios, the E´ (rubbery plateau)
increased considerably with the increase of [NCO]/[OH] ratio (Figure 5.23 (iii)). The
crosslinking density data also followed the same tendency. The sol fraction decreases with
the increasing of [NCO]/[OH] ratio. This observation, similarity to Alcell, can be justified
by (i) the presence of more reactive sites, (ii) an increase of aromatic content, (iii) and the
occurrence of secondary isocyanate reactions that are favoured at higher [NCO]/[OH]
ratios.
For the samples synthesised with fixed Indulin AT content and PCL with different
molecular weight PCL (IAT(PCL750/1/25) and IAT(PCL1000/1/25)), nevertheless the low
Tg value measure for PCL1000-based sample, the E´value was found to be higher than that
achieved for PCL750-based sample. In general, Tg values of the resulting materials have a
significant contribution from used polyol (PCL content in the used polyol mixture varied
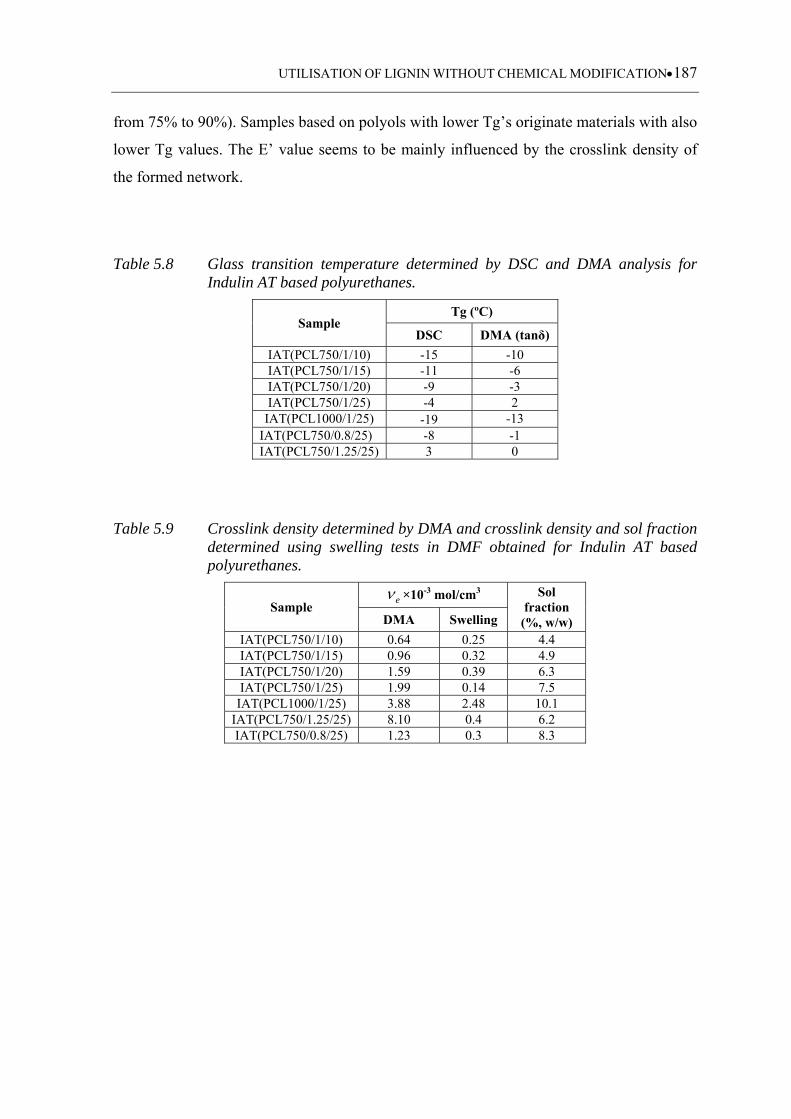
UTILISATION OF LIGNIN WITHOUT CHEMICAL MODIFICATION187
from 75% to 90%). Samples based on polyols with lower Tg’s originate materials with also
lower Tg values. The E’ value seems to be mainly influenced by the crosslink density of
the formed network.
Table 5.8 Glass transition temperature determined by DSC and DMA analysis for Indulin AT based polyurethanes.
Sample Tg (ºC)
DSC DMA (tanδ)
IAT(PCL750/1/10) -15 -10 IAT(PCL750/1/15) -11 -6 IAT(PCL750/1/20) -9 -3 IAT(PCL750/1/25) -4 2
IAT(PCL1000/1/25) -19 -13 IAT(PCL750/0.8/25) -8 -1 IAT(PCL750/1.25/25) 3 0
Table 5.9 Crosslink density determined by DMA and crosslink density and sol fraction determined using swelling tests in DMF obtained for Indulin AT based polyurethanes.
Sample e ×10-3 mol/cm3 Sol
fraction (%, w/w) DMA Swelling
IAT(PCL750/1/10) 0.64 0.25 4.4 IAT(PCL750/1/15) 0.96 0.32 4.9 IAT(PCL750/1/20) 1.59 0.39 6.3 IAT(PCL750/1/25) 1.99 0.14 7.5
IAT(PCL1000/1/25) 3.88 2.48 10.1 IAT(PCL750/1.25/25) 8.10 0.4 6.2 IAT(PCL750/0.8/25) 1.23 0.3 8.3
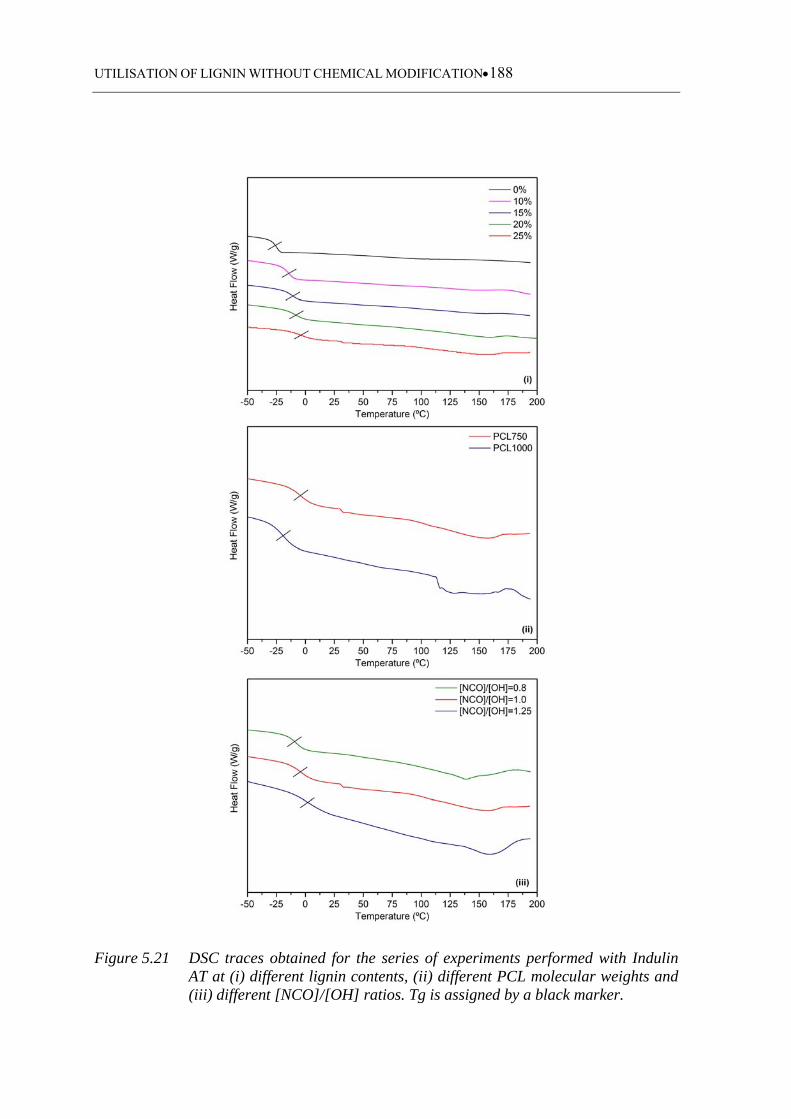
UTILISATION OF LIGNIN WITHOUT CHEMICAL MODIFICATION188
Figure 5.21 DSC traces obtained for the series of experiments performed with Indulin AT at (i) different lignin contents, (ii) different PCL molecular weights and (iii) different [NCO]/[OH] ratios. Tg is assigned by a black marker.
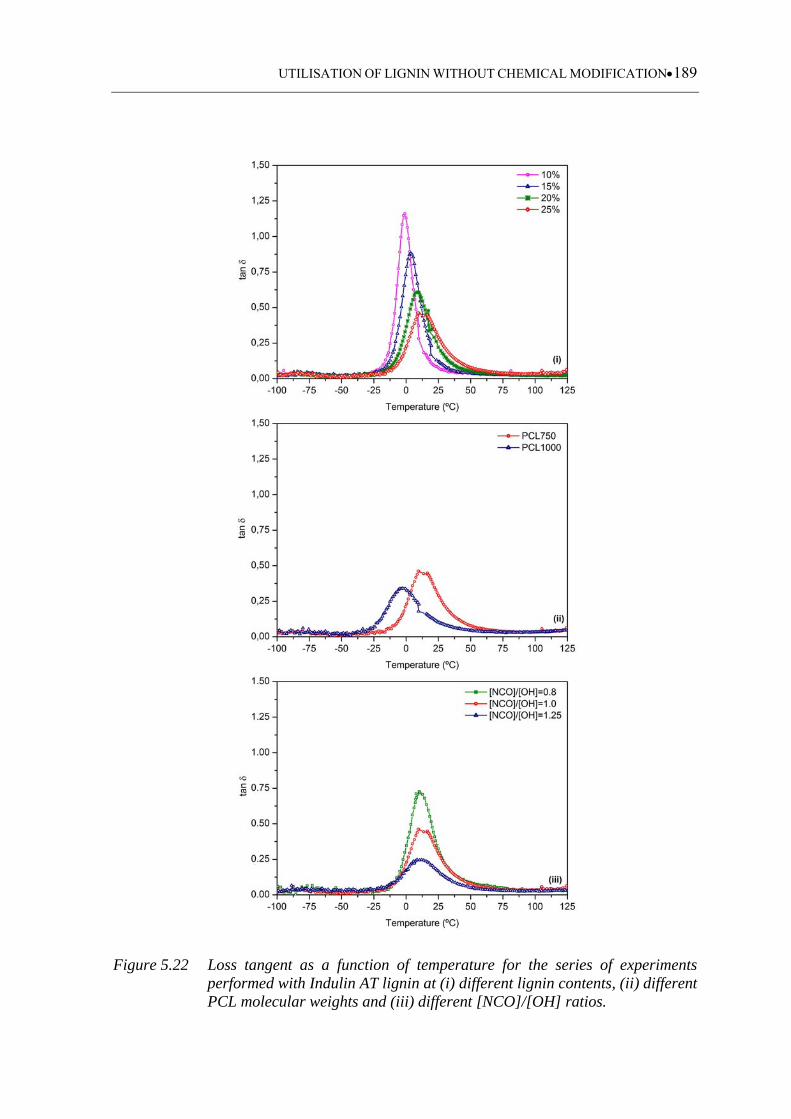
UTILISATION OF LIGNIN WITHOUT CHEMICAL MODIFICATION189
Figure 5.22 Loss tangent as a function of temperature for the series of experiments performed with Indulin AT lignin at (i) different lignin contents, (ii) different PCL molecular weights and (iii) different [NCO]/[OH] ratios.
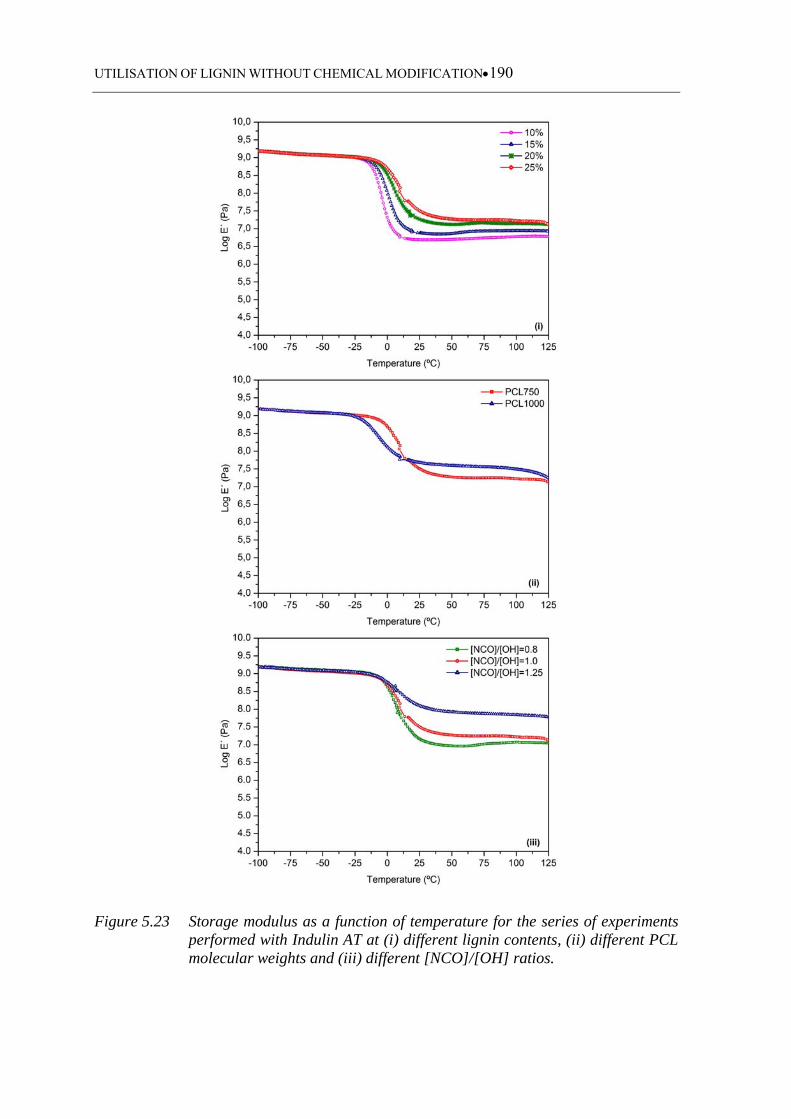
UTILISATION OF LIGNIN WITHOUT CHEMICAL MODIFICATION190
Figure 5.23 Storage modulus as a function of temperature for the series of experiments performed with Indulin AT at (i) different lignin contents, (ii) different PCL molecular weights and (iii) different [NCO]/[OH] ratios.
UTILISATION OF LIGNIN WITHOUT CHEMICAL MODIFICATION191
5.4 Conclusions and perspectives
In this chapter lignin-based polyurethanes with elastomeric properties have been
successfully synthesised using a three component system (lignin, PCL and MDI). Lignins
have been used without any previous purification and polymerisation proceeded in bulk
without adding organic solvents neither catalysts. Polymerisation reaction was monitored
by FTIR-ATR and thermo-mechanical properties of the ensuing lignin-based
polyurethanes were evaluated. The following variables were studied: kraft and organosolv
lignins with different contents (10, 15, 20 and 25% (w/w)), PCL with molecular weights of
400, 750 and 1000 and [NCO]/[OH] ratios of 0.8, 1.0 and 1.25.
FTIR-ATR monitoring allowed studying the formation of lignin-based polyurethanes
following isocyanate conversion and inspecting reaction kinetics. Results showed that
isocyanate conversion decreases with the increase of lignin content, increase of PCL
molecular weight and increase of [NCO]/[OH] ratio. Moreover, Indulin AT-based series
leaded to lower isocyanate conversions comparatively to the Alcell-based counterparts. For
low lignin contents (10% and 15%) and [NCO]/[OH] ratios of 0.8 and 1.0, the
experimental data fitted well to the global second order model in accordance with literature
data. After the region of linearity (1/(1-p) versus t) a negative deviation was always noticed
and found to be more pronounced with the increase of lignin content and increase of
[NCO]/[OH] ratio. The negative deviation can be assigned to an effective network
formation that hinders reaction between hydroxyl and isocyanate groups. Moreover, the (i)
complex lignin architecture (ii) lack of reactivity of its phenolic hydroxyl groups and (iii) a
rapid increase of medium viscosity also contributes to this effect.
Thermo-mechanical and swelling tests results corroborated lignin incorporation into the
final three component polyurethane samples by means of urethane linkages formation.
Moreover, it was observed that Alcell has a predominant role of chain extender whereas
Indulin AT lignin acts more as a crosslinking agent although they both possess more that 2
functions and therefore they both should play the role of crosslinking agents. This
observation is consistent with the quite distinct thermo-mechanical behavior exhibited by
Indulin AT and Alcell based polyurethanes. For a fixed PCL molecular weight, Alcell-
based polyurethanes showed an almost constant E’ value for all used lignin contents. On
contrary, Indulin-based polyurethanes showed an E’ value that increased with lignin
UTILISATION OF LIGNIN WITHOUT CHEMICAL MODIFICATION192
content increase. For both cases, Tg reflects the effect of crosslinking density due to lignin
incorporation. It is worth to mention that, though the predominant role of Alcell as chain
extender, crosslinking is also effective for this lignin-base materials thus reducing chain
mobility and leading to the appearance of a rubbery plateau. This evidence was confirmed
by the independent crosslinking density measurements based on swelling tests.
For the samples synthesised with fixed lignin content and different PCL molecular
weights, it was observed that the Tg values of the resulting materials have a significant
contribution from the used polyol (PCL content in the used polyol mixture varied from
75% to 90%). Samples based on polyols with lower Tg’s yielded materials with also lower
Tg values. The E’ value seems to be mainly influenced by the crosslinking density of the
formed network.
Generally speaking, higher crosslinking densities should give rise to lower sol fractions,
which was not always observed in this study. This statement is based on a model where
lignin-based materials are described as being constituted by a crosslinked network plus
unreacted lignin. The sol fraction is thus considering as being majority formed by
unreacted lignin. According to the model established in this work, the formed
polyurethanes should be described as mixtures of three types of structures (crosslinked
network and isolated sequences with or without lignin). Most of the isolated sequences,
which include lignin itself, if short enough are extracted with the sol faction particularly
when using strong solvents like DMF.
The achieved structure-properties relationships are generally in agreement with published
data, nevertheless some change clear cut of tendency was noticed for the samples
A(PCL400/1/25) and IAT(PCL1000/1/25). Comparatively to Alcell, Indulin AT has a
higher molecular weight and higher hydroxyl content. Moreover, in the network structure
Indulin-AT generates larger and stiffer lignin “islands” comparatively to Alcell. In
conclusion low molecular weight PCL are, in principle, less efficient in creating three-
dimensional polyurethane networks. This effect is highlighted for Alcell lignin that
contains lower hydroxyl content. This seems to be the case of A(PCL400/1/25), for which
an apparently abnormal high sol fraction was achieved. On the opposite side, high
molecular weight polyols increase network formation efficiency. Nevertheless, for very
long PCL chains this efficiency decreases mainly due to a dilution effect of the hydroxyl
UTILISATION OF LIGNIN WITHOUT CHEMICAL MODIFICATION193
chain-ends. This effect is highlighted for Indulin-AT where the volume of the stiff lignin
islands hinders an effective network formation. This seems to be the case of
IAT(PCL1000/1/25), for which a apparently abnormal high sol fraction was achieved.
These apparently contradictory results to the established structure-properties relationships
are somehow hard to rationalise and additional experiments should be carried out in order
to have clear cut evidence about this finding, namely by extending the studied polyol range
to lower/higher molecular weights and by using higher lignin contents. Moreover, sol
fraction characterisation should contribute to a better understanding of the involved
phenomena.
UTILISATION OF LIGNIN WITHOUT CHEMICAL MODIFICATION194
5.5 References
Barreiro, M.F., 2000. Formação e Estrutura dos Poliuretanos Segmentados. PhD Thesis.
FEUP, Porto, Portugal.
Bayer, O., Rinke, H., Siefken,W., Othner, L., Schild, H.,1937. DRP 728, 981.
Belgacem, M.N., 1991. Urethanes et polyurethanes furaniques: Syntheses,
characterisations et cinetiques comparatives. PhD Thesis. EFPG, Grenoble, France.
Belgacem, N.M., Gandini, A., 2008. Lignin as components of macromolecular materials.
In: Monomers, polymers and composites from renewable resources. Belgacem, N.M.,
Gandini, A., (Eds). Elsevier publications, 243-271.
Boufi, S., Belgacem, M.N., Quillerou, J., Gandini, A., 1993. Urethanes and polyurethanes
bearing furan moieties. 4. Synthesis, kinetics and characterization of linear polymers.
Macromolecules 26, 6706-6717.
Burkus, J., Eckert, C.F., 1958. The kinetics of the triethylamine-catalyzed reaction of
diisocyanates with 1-butanol in toluene. J. Am. Chem. Soc. 80, 5948-5950.
Caraculacu, A.A., Coseri, S., 2001. Isocyanates in polyaddition processes. Structure and
reaction mechanisms. Prog. Polym. Sci. 26, 799-851.
Cateto, C.A., Barreiro, M.F., Rodrigues, A.E., 2008. Monitoring of lignin-based
polyurethane synthesis by FTIR-ATR. Ind. Crops Prod. 27, 168-174.
Cheradame, H., Detoisien, M., Gandini, A., Pla, F., Roux, G., 1989. Polyurethane from
kraft lignin. British Polym. J. 21, 269-275.
Cordeiro, N., Belgacem, M.N., Gandini, A., Neto, C.P., 1997. Urethanes and
polyurethanes from suberin.1. kinetic study. Ind. Crops Prod. 6, 163-167.
D´Arlas, B.F., Rueda, L., Stefani, P.M., Caba, K., Mondragon, I., Eceiza, A., 2007. Kinetic
and thermodynamic studies of the formation of a polyurethane based on 1,6-
hexamethylene diisocyanate and poly(carbonate-co-ester)diol. Therm. Acta 459, 94-103.
UTILISATION OF LIGNIN WITHOUT CHEMICAL MODIFICATION195
Elwell, M.J., Ryan, A.J., Gronbauer, H.J.M., Lieshout, H.C.V., 1996.An FT i.r. study of
reaction kinetics and structure development in model flexible polyurethane foam systems.
Polymer 37, 1353-1361.
Evtiouguina, M.,Gandini, A., Neto, C.P., Belgacem, N.M., 2001. Urethanes and
polyurethanes based on oxypropylated cork: 1. Appraisal and reactivity of products.
Polym. Int. 50, 1150-1155.
Evtuguin, D.V., Andreolety, J.P. and Gandini, A., 1998. Polyurethanes Based on Oxygen-
Organosolv Lignin. Eur. Polym. J. 34, 1163-1169.
Fan, L.H., Hu, C.P., Zhang, Z.P., Ying, S.K., 1996. Polymerization kinetics of
polyurethane and vinyl ester resun interpenetrating polymer networks by using Fourier
transform infrared. J. Appl. Polym. Sci. 59, 1417-1426.
Frost, A.A., Schewemer, W., 1952. The kinetics of competitive consecutive second-order
reactions: the saponification of ethyl adipate and of ethyl succinate. J. Am. Chem. Soc. 74,
1268-1273.
Gandini, A., Belgacem, M.N., Guo, Z.X., Montanari, S., 2002. Lignins as macromonomers
for polyesters and polyurethanes. In: Chemical modification, properties and usage of
lignin. Hu, T.Q. (Ed), Kluwer Academic/ Plenum Publishers, New-York, 57-80.
Han, J.L., Yu, C.H., Lin, Y.H., Hsieh, K.H., (2008). Kinetic study of the urethane and urea
reactions of isophorone diisocyanate. J. Appl. Polym. Sci. 107, 3891-3902.
Hatakeyama, H, 2002. Polyurethanes containing lignin. In: Chemical modification,
properties and usage of lignin. Hu, T.Q. (Ed), Kluwer Academic/ Plenum Publishers, New-
York, 41-55.
Hatakeyama, H., Hatakeyama, T., 2005. Environmentally compatible hybrid-type
polyurethane foams containing saccharide and lignin components. Macromol.Symp. 224,
219-226.
Hatakeyama, H., Kosugi, R., Hatakeyama, T.,2008. Thermal properties of lignin- and
molasses-based polyurethane foams. J. Therm. Anal. Cal. 92, 419-424.
UTILISATION OF LIGNIN WITHOUT CHEMICAL MODIFICATION196
Hirose, S., Yano, S., Hatakeyama, T., Hatakeyama, H., 1989. Heat-resistant polyurethanes
from solvolysis lignin. In: Lignin Properties and Materials. Glasser, W.G., Sarkanen, S.
(Eds.). ACS Symposium Series No. 397, American Chemical Society, Washington, DC,
383-389.
Kelley, S.S., Glasser, W.G., Ward, C.T., 1988. Engineering plastics from lignin. XV.
Polyurethane films from chain-extended hydroxypropyl lignin. J. Appl.Polym. Sci. 36,
759-772.
Montanari, S., Baradie, B., Andreolety, J. P., Gandini, A., 1996. Star-shaped and
crosslinked polyurethanes derived from lignins and oligoether isocyanates. In: The
Chemistry and Processing of Wood and Plant Fibrous Materials. Kennedy, J. F., Phillips,
G. O., Williams, P. A. (Eds). Woodhead Publishing, Cambridge, 351-358.
Nadji, H., Bruzzèse, C., Belgacem, M.N., Benaboura, A., Gandini, A., 2005.
Oxypropylation of Lignins and Preparation of Rigid Polyurethane Foams from the Ensuing
Polyols. Macromol. Mater. Eng. 290, 1016-1023.
Ni, P., Thring, R.W., 2003. Synthesis of polyurethanes from solvolysis lignin using a
polymerization catalyst: Mechanical and thermal properties. Int. J. Polym. Mat. 52, 685-
707.
Pavier, C., Gandini, A., 2000. Urethanes and polyurethanes from oxypropylated sugar beet
pulp I. Kinetic study in solution. Eur. Polym. J. 36, 1653-1658.
Petrovic, Z., Ferguson, J., 1991. Polyurethanes elastomers. Prog. Polym. Sci., 16, 695-836.
Reimann, A., Mörck, R., Yoshida, H., Hatakeyama, 1990. Kraft lignin in
polyurethanes.III. Effects of the molecular weigth of PEG on the properties of
polyurethanes from kraft lignin-PEG-MDI system. J. Appl. Polym. Sci. 41, 39-50.
Sato, M., 1960. The rates of reaction of 1- Alkenyl isocyanates with methanol. J. Am.
Chem. Soc. 82, 3893-3897.
Sato, M., 1962. The rate of the reaction of isocyanates with alcohols. II. J. Org. Chem. 27,
819-825.
UTILISATION OF LIGNIN WITHOUT CHEMICAL MODIFICATION197
Saunders, J.H., Frisch, K.C., 1962. Polyurethane chemistry and technology. Interscience,
New York.
Szycher, M., 1999. Polyols. In: Szycher´s Handbook of Polyurethanes. CRC Press, Boca
Raton.
Thring, R.W., Ni, P., Aharoni, S.M., 2004. Molecular weight effects of the soft segment on
the ultimate properties of lignin-derived polyurethanes. Int. J. Polym. Mat. 53, 507-524.
Thring, R.W., Vanderlaan, M.N., Griffin, S.L., 1997. Polyurethanes from Alcell® lignin.
Biomass and Bioenergy 13, 125-132.
Vanderlaan, M.N. and Thring, R.W., 1998. Polyurethanes from Alcell® Lignin Fractions
Obtained by Sequential Solvent Extraction. Biomass and Bionergy 14, 525-531.
Wu, L.C.F, Glasser, W.G., 1984. Engineering plastics from lignin. I. Synthesis of
hydroxypropyl lignin. J. Appl.Polym .Sci. 9, 1111-1123.
Wurtz, A., 1849. Justus Liebigs. Ann. Chem. 71, 326.
Yoshida, H., Kringstad, K., Mörck, R., 1986. Using lignin as a reaction component for
producing polyurethanes. International Patent WO 86/07070.
Yoshida, H., Mörck, R., Kringstad, K.P., Hatakeyama, H., 1987. Kraft lignin in
polyurethanes. I. Mechanical properties of polyurethanes from a kraft lignin- polyether
triol- polymeric MDI system. J. Appl. Polym. Sci., 34, 1187- 1198.
Yoshida, H., Mörck, R., Kringstad, K.P., Hatakeyama, H., 1990. Kraft lignin in
polyurethanes. II. Effects of the molecular weight of kraft lignin on the properties of
polyurethanes from a kraft lignin-polyether triol-polymeric MDI system. J. Appl. Polym.
Sci. 40, 1819-1832.
6. Final conclusions and perspectives of future work
In this work the suitability of using lignin as a macromonomer in polyurethane synthesis
was evaluated aiming to promote its valorisation and exploit its intrinsic properties. For
that purpose, four lignin samples have been selected; three of them were available
commercial lignins: Sarkanda (Granit SA), Indulin AT (MeadWestvaco) and Curan 27-11P
(BorregaardLignoTech), whereas the fourth one was Alcell from Repap Enterprises Inc.
They represent three different botanical origins (hardwood, softwood and non-wood) as
well as three different pulp processes (kraft, soda and organosolv). The work involved
lignin characterisation, giving particular emphasis to hydroxyl groups determination and
evaluation of lignins role as a macromonomer in polyurethane synthesis following two
different approaches: (i) utilisation after chemical modification and (ii) direct incorporation
without any purification or modification procedure. The properties of the resulting
materials (rigid polyurethane foams and elastomers) were evaluated and some potential
applications envisaged. Both mentioned approaches used lignin samples without any
previous purification coupled with bulk processes. Moreover, chemical modified lignin
(oxypropylated lignin) was directly used to prepare polyurethane foams (no
purification/separation processes were applied). These statements clearly evidence the
environmental friendly connotations of this work.
FINAL CONCLUSIONS AND PERSPECTIVES OF FUTURE WORK200
In this work the four lignin samples were characterised using several analytical techniques
and methods. Some characterisation data of Alcell and Indulin AT can be found in
literature, nevertheless data on Sarkanda and Curan 27-11P are scarce. Summarising,
Alcell is a guaiacyl-syringyl (GS) lignin, Indulin AT and Curan 27-11P are guaiacyl (G)
lignins, and Sarkanda is a p-hydroxyphenyl-guaiacyl-syringyl (HGS) lignin. They present
quite distinct properties, namely impurities (ash, sugar residues and external
acidity/alkalinity), hydroxyl content (total, phenolic and aliphatic), molecular weight and
polydispersity index, and thermal properties (Tg and thermal stability). Alcell lignin is a
high purity lignin presenting a total hydroxyl content of 5.26 mmol/g with a remarkable
predominance of phenolic hydroxyl groups. Comparatively to the other analysed lignin
samples it presents the lowest molecular weight, polydispersity index and Tg (81 ºC).
Indulin AT is a relatively pure lignin (it presents only 3.06% of ashes and 1.99% of
residual sugars) with the highest total hydroxyl content (6.99 mmol/g). Sarkanda lignin has
the highest sugar content (5.01%) and presents external acidity. DSC traces showed
evidence of the existence of two distinct Tgs (67 ºC and 141 ºC). Curan 27-11P has the
highest ash content (17%) and Tg was too indiscernible to be determined. Its thermal
stability was found to be quite high comparatively to the other analysed lignins.
The advantage of using a combination of different methods and techniques applied to
lignin hydroxyl groups determination was demonstrated. As a result, a reliable and
complete characterisation (type and content) was achieved. Development and
establishment of reproducible standard methods is an actual subject within lignin research
field and efforts towards normalisation are still needed. Further studies considering other
lignin properties could be envisaged and performed.
Lignin-based polyether polyols were successfully synthesised using the four technical
lignins (Alcell, Indulin AT, Curan 27-11P and Sarkanda). To the best of our knowledge,
among the studied lignins, three have never been investigated in this context (Indulin AT,
Curan 27-11P and Sarkanda). Moreover, an optimisation study of lignin oxypropylation
reaction was also performed. The used characterisation methods together with the chosen
reaction conditions allowed identifying and interpreting some phenomena related to lignin
oxypropylation process. In this context SEC analysis and the interpretation of the resulting
chromatograms (homopolymer and oxypropylated lignin fractions) was never reported in
the literature, before our own data.
FINAL CONCLUSIONS AND PERSPECTIVES OF FUTURE WORK201
In general, polyols produced using the formulations deduced from the optimisation study
presented a hydroxy index (IOH) and viscosity values close to those of commercial polyols,
typically employed in RPU foams synthesis. No unreacted residues were found in the
produced polyols and the reaction times involved in the oxypropylation process were quite
reasonable. The information acquired from the optimisation study can also contribute to
design lignin-based polyols for materials other than rigid polyurethane foams. For
example, the interest of producing polyols with lower hydroxyl index and longer polyether
grafted chains can be useful to produce urethane products with higher flexibility.
RPU foams produced using some optimised polyol formulations exhibit properties similar
to those of RPU foams commercially available. Nevertheless, some exceptions were
detected mainly in which regards some Sarkanda- or Curan 27-11P- based polyols, which
were found to be inappropriate for RPU formulations. Foams produced with these polyols
were found to be quite brittle or displayed very heterogeneous reactive mixtures hindering
foam formation. In general, RPU foams with high-containing Alcell and Indulin AT-based
polyols exhibited properties superior to those with less-containing lignin-based polyols.
This behaviour can be associated with: (i) a more prominent presence of lignin and (iii) a
less pronounced contribution of KOH catalyst in foam formation. These results were in
fact quite encouraging since when using a high-lignin content polyol formulation a greater
quantity of lignin is effectively introduced in the final polymeric materials.
Lignin-based polyurethanes with elastomeric properties have been successfully synthesised
using a chemical system consisted on lignin (only Alcell and Indulin AT were used in this
study), 4,4’-methylene-diphenylene diisocyanate (MDI) and polycaprolactone (PCL) of
three different average-molecular weights (400, 750 and 1000). FTIR-ATR monitoring
allowed studying the formation of lignin-based polyurethanes following isocyanate
conversion and inspecting reaction kinetics. For low lignin contents (10% and 15%) and
[NCO]/[OH] ratios of 0.8 and 1.0, the experimental data fitted well to the global second
order model. After the region of linearity (1/(1-p) versus t) a negative deviation was always
noticed and found to be more pronounced with the increase of lignin content and increase
of [NCO]/[OH] ratio. The negative deviation can be assigned to an effective network
formation that hinders reaction of hydroxyl towards isocyanate groups. Thermo-
mechanical and swelling tests results corroborated lignin incorporation into the final three
component polyurethane samples by means of urethane linkages formation. Moreover, it
FINAL CONCLUSIONS AND PERSPECTIVES OF FUTURE WORK202
was observed that Alcell has a predominant role of chain extender whereas Indulin AT
lignin acts more as a crosslinking agent.
The achieved structure-properties relationships are generally in accordance with published
data, nevertheless some changes clear cut of tendency were noticed in this work (samples
A(PCL400/1/25) and IAT(PCL1000/1/25)). These apparently contradictory results to the
established structure-properties relationships are somehow hard to rationalise and
additional experiments should be carried out in order to have clear-cut evidence about this
finding, namely by extending the studied polyol range to lower/higher molecular weights
and by using higher lignin contents. Moreover, sol fraction characterisation should
contribute to a better understanding of the involved phenomena.
The statements presented in this work provide irrefutable evidence about the possibility to
produce lignin-based polyurethane materials. A wide range of polyurethane materials were
prepared presenting properties which depended on the lignin type and content introduced.
Moreover, for polyurethane synthesis purposes Alcell and Indulin AT were found to be the
most suitable to be used as macromonomers. Alcell lignin presents high purity coupled
with low molecular weight, while Indulin AT has the highest total hydroxyl content
together with modest impurity content. Sarkanda and Curan 27-11P impurities and
structural features constitute the main drawback for its application.
The approach of using lignin as such, i.e., without chemical modification (oxypropylation)
seems to be the most attractive in terms of lignin content incorporation. In this work, by
using non-modified lignin a greater lignin content was introduced into the final
polyurethane materials; a maximum of 19% (w/w) versus 11% (w/w) when using
oxypropylated lignin. In a general way, these materials could become more attractive by
means of incorporating other bio-based components. In this context, polyurethane foams
can offer a greater impact due to the current availability of bio-based raw-materials
alternatives for this brand of products.
Annexes
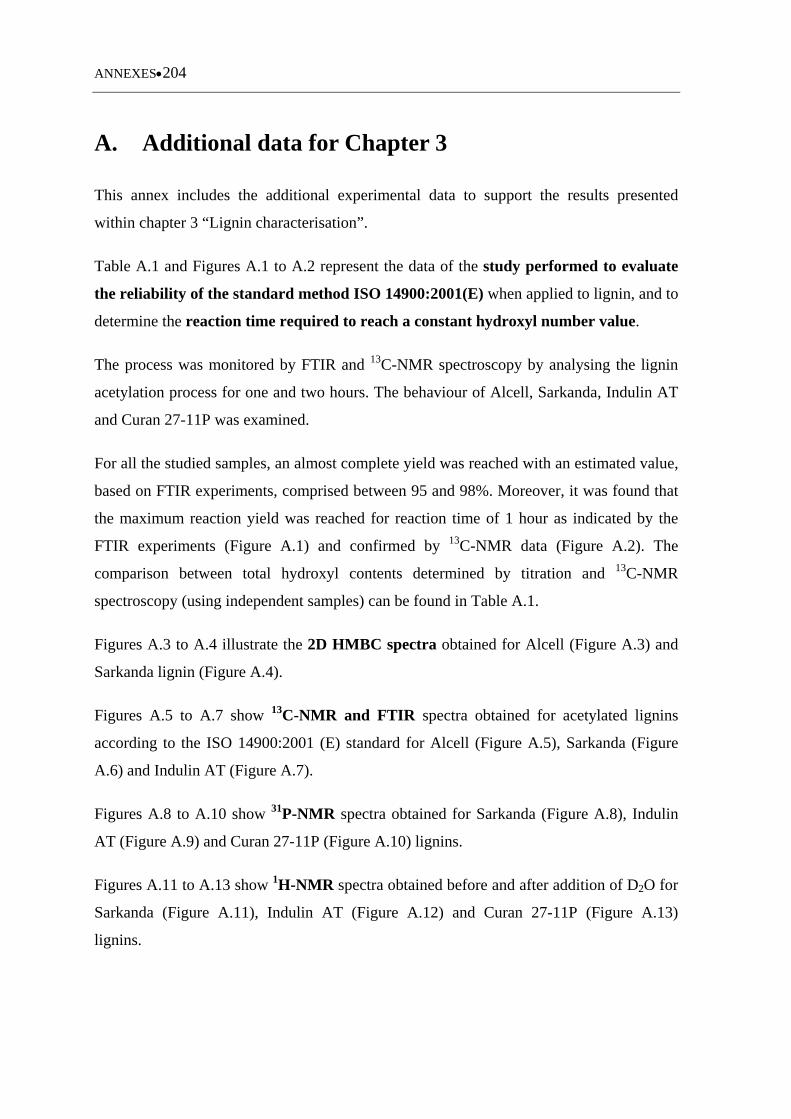
ANNEXES204
A. Additional data for Chapter 3
This annex includes the additional experimental data to support the results presented
within chapter 3 “Lignin characterisation”.
Table A.1 and Figures A.1 to A.2 represent the data of the study performed to evaluate
the reliability of the standard method ISO 14900:2001(E) when applied to lignin, and to
determine the reaction time required to reach a constant hydroxyl number value.
The process was monitored by FTIR and 13C-NMR spectroscopy by analysing the lignin
acetylation process for one and two hours. The behaviour of Alcell, Sarkanda, Indulin AT
and Curan 27-11P was examined.
For all the studied samples, an almost complete yield was reached with an estimated value,
based on FTIR experiments, comprised between 95 and 98%. Moreover, it was found that
the maximum reaction yield was reached for reaction time of 1 hour as indicated by the
FTIR experiments (Figure A.1) and confirmed by 13C-NMR data (Figure A.2). The
comparison between total hydroxyl contents determined by titration and 13C-NMR
spectroscopy (using independent samples) can be found in Table A.1.
Figures A.3 to A.4 illustrate the 2D HMBC spectra obtained for Alcell (Figure A.3) and
Sarkanda lignin (Figure A.4).
Figures A.5 to A.7 show 13C-NMR and FTIR spectra obtained for acetylated lignins
according to the ISO 14900:2001 (E) standard for Alcell (Figure A.5), Sarkanda (Figure
A.6) and Indulin AT (Figure A.7).
Figures A.8 to A.10 show 31P-NMR spectra obtained for Sarkanda (Figure A.8), Indulin
AT (Figure A.9) and Curan 27-11P (Figure A.10) lignins.
Figures A.11 to A.13 show 1H-NMR spectra obtained before and after addition of D2O for
Sarkanda (Figure A.11), Indulin AT (Figure A.12) and Curan 27-11P (Figure A.13)
lignins.
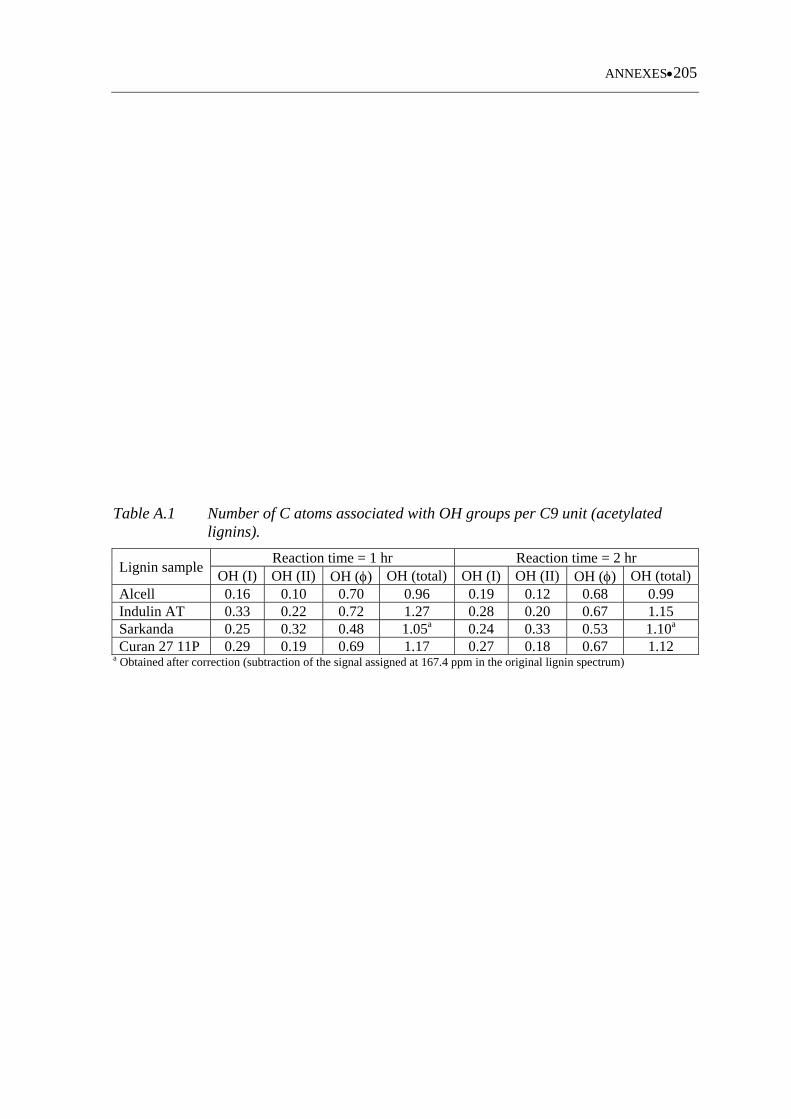
ANNEXES205
Table A.1 Number of C atoms associated with OH groups per C9 unit (acetylated lignins).
Lignin sample Reaction time = 1 hr Reaction time = 2 hr
OH (I) OH (II) OH () OH (total) OH (I) OH (II) OH () OH (total)Alcell 0.16 0.10 0.70 0.96 0.19 0.12 0.68 0.99 Indulin AT 0.33 0.22 0.72 1.27 0.28 0.20 0.67 1.15 Sarkanda 0.25 0.32 0.48 1.05a 0.24 0.33 0.53 1.10a
Curan 27 11P 0.29 0.19 0.69 1.17 0.27 0.18 0.67 1.12 a Obtained after correction (subtraction of the signal assigned at 167.4 ppm in the original lignin spectrum)
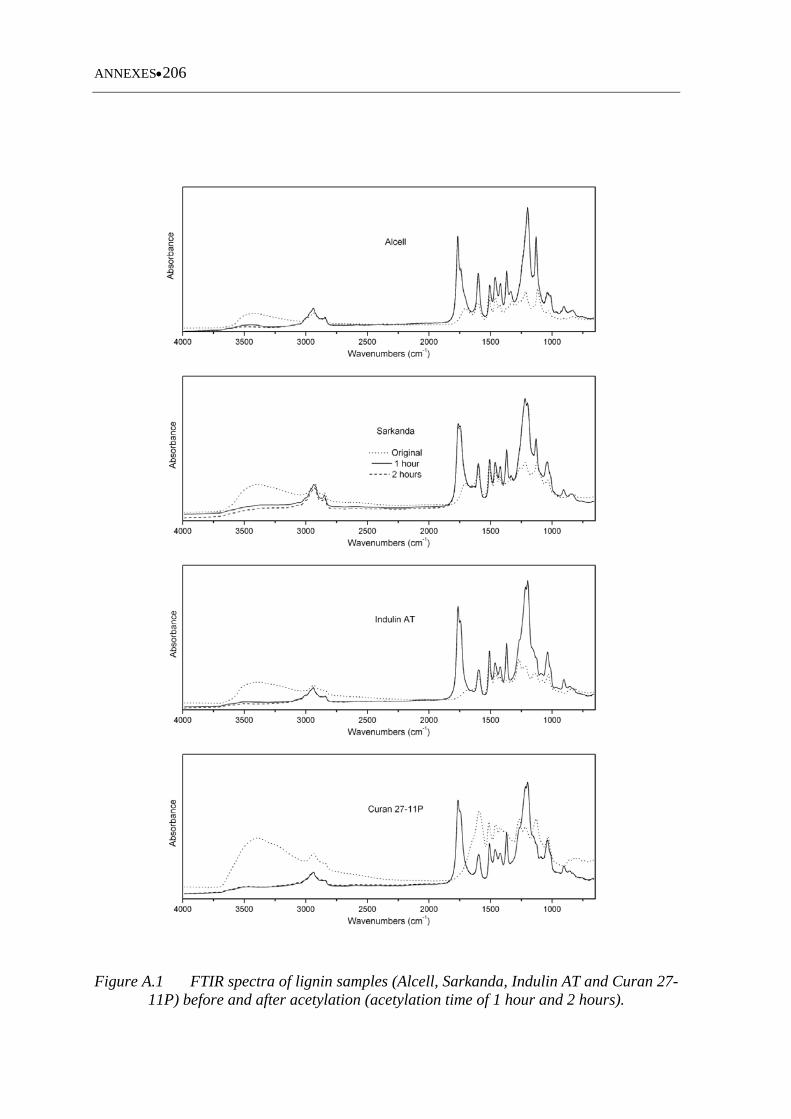
ANNEXES206
Figure A.1 FTIR spectra of lignin samples (Alcell, Sarkanda, Indulin AT and Curan 27-11P) before and after acetylation (acetylation time of 1 hour and 2 hours).
ANNEXES207
Figure A.2 13C-NMR spectra of lignin samples (Alcell, Indulin AT, Sarkanda and Curan 27 11P) before and after acetylation (acetylation time of 1 hour and 2 hours).
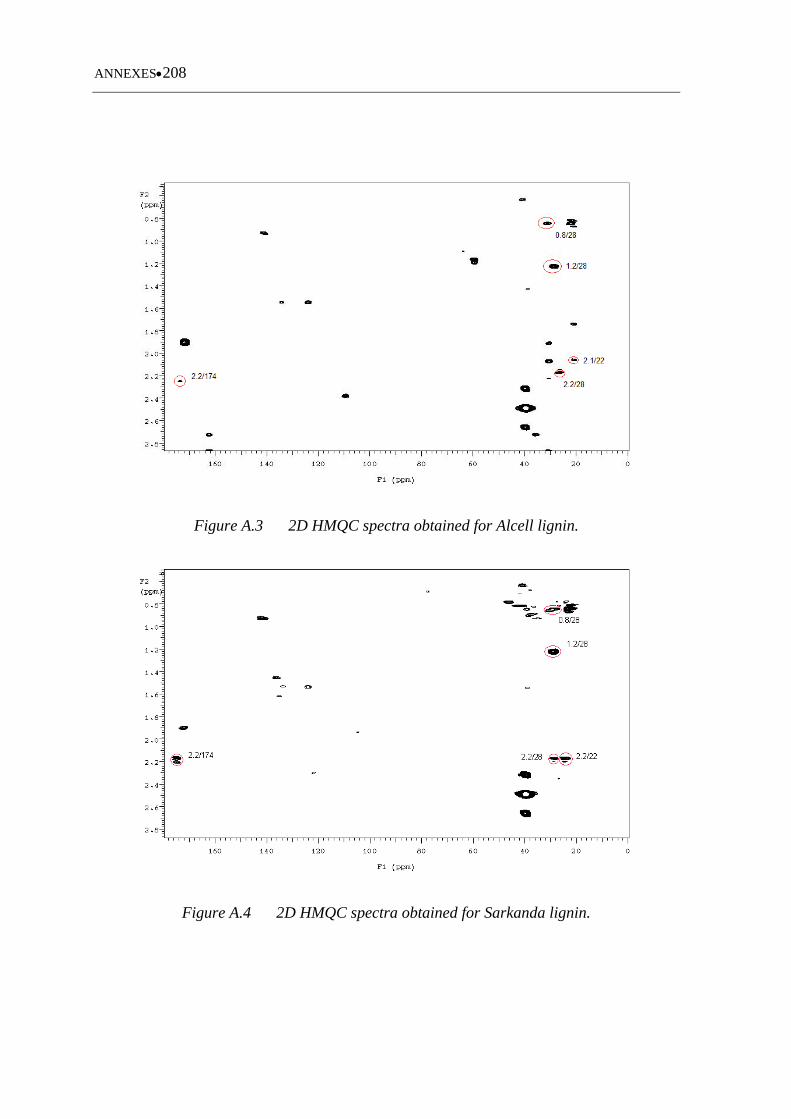
ANNEXES208
Figure A.3 2D HMQC spectra obtained for Alcell lignin.
Figure A.4 2D HMQC spectra obtained for Sarkanda lignin.
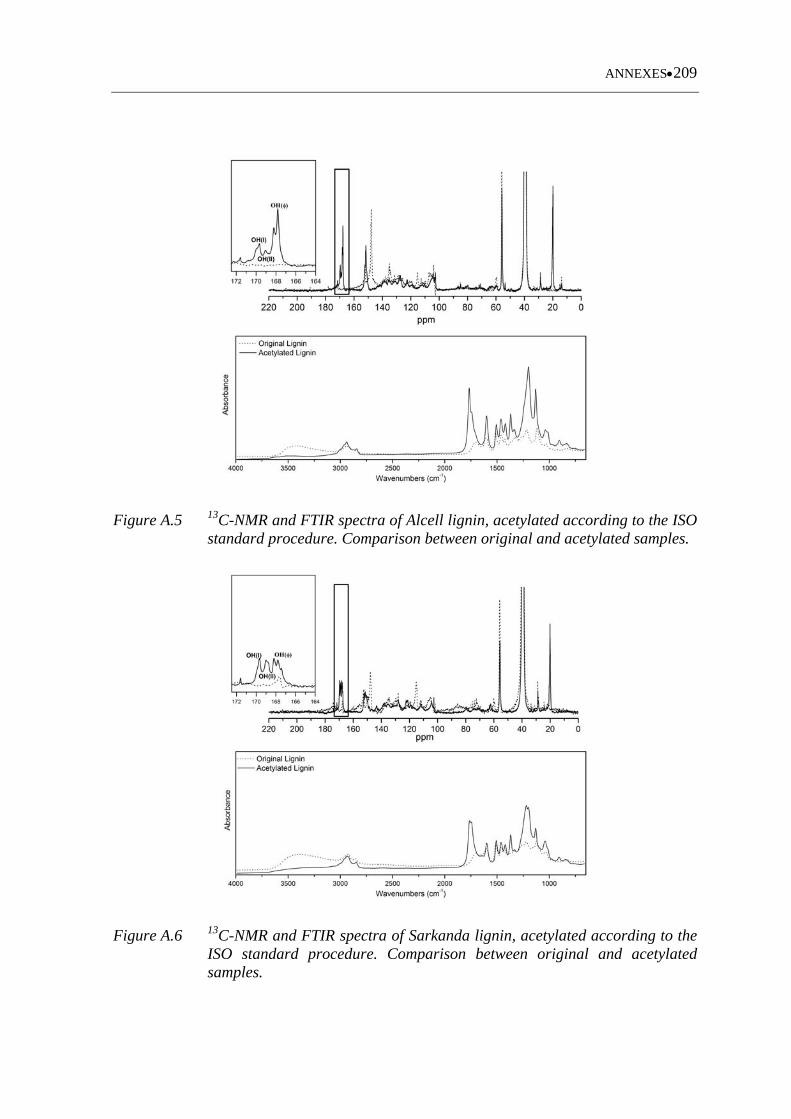
ANNEXES209
Figure A.5 13C-NMR and FTIR spectra of Alcell lignin, acetylated according to the ISO standard procedure. Comparison between original and acetylated samples.
Figure A.6 13C-NMR and FTIR spectra of Sarkanda lignin, acetylated according to the ISO standard procedure. Comparison between original and acetylated samples.
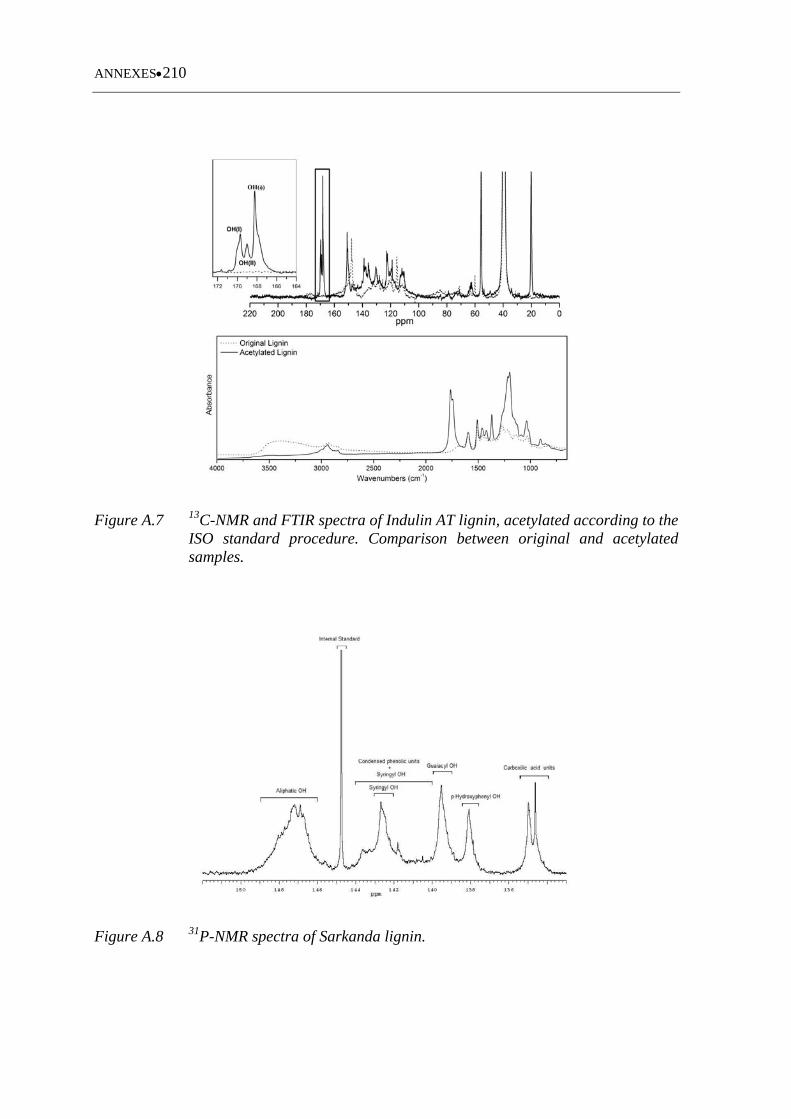
ANNEXES210
Figure A.7 13C-NMR and FTIR spectra of Indulin AT lignin, acetylated according to the ISO standard procedure. Comparison between original and acetylated samples.
Figure A.8 31P-NMR spectra of Sarkanda lignin.
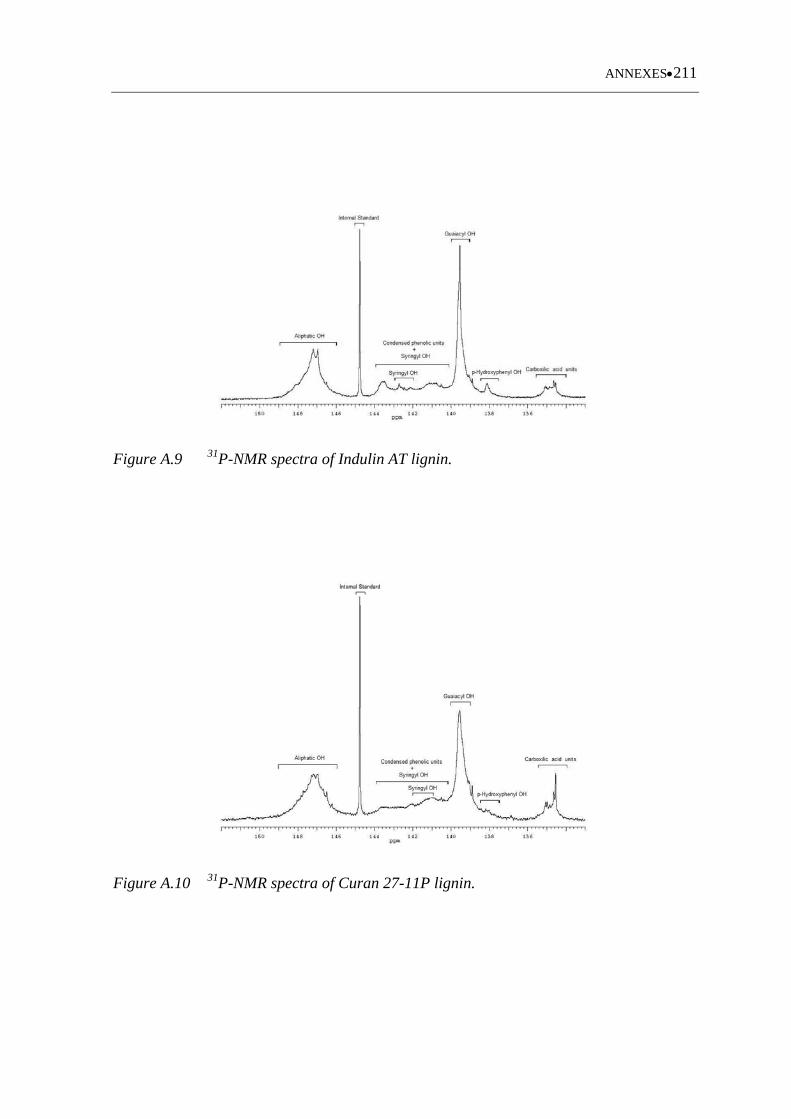
ANNEXES211
Figure A.9 31P-NMR spectra of Indulin AT lignin.
Figure A.10 31P-NMR spectra of Curan 27-11P lignin.
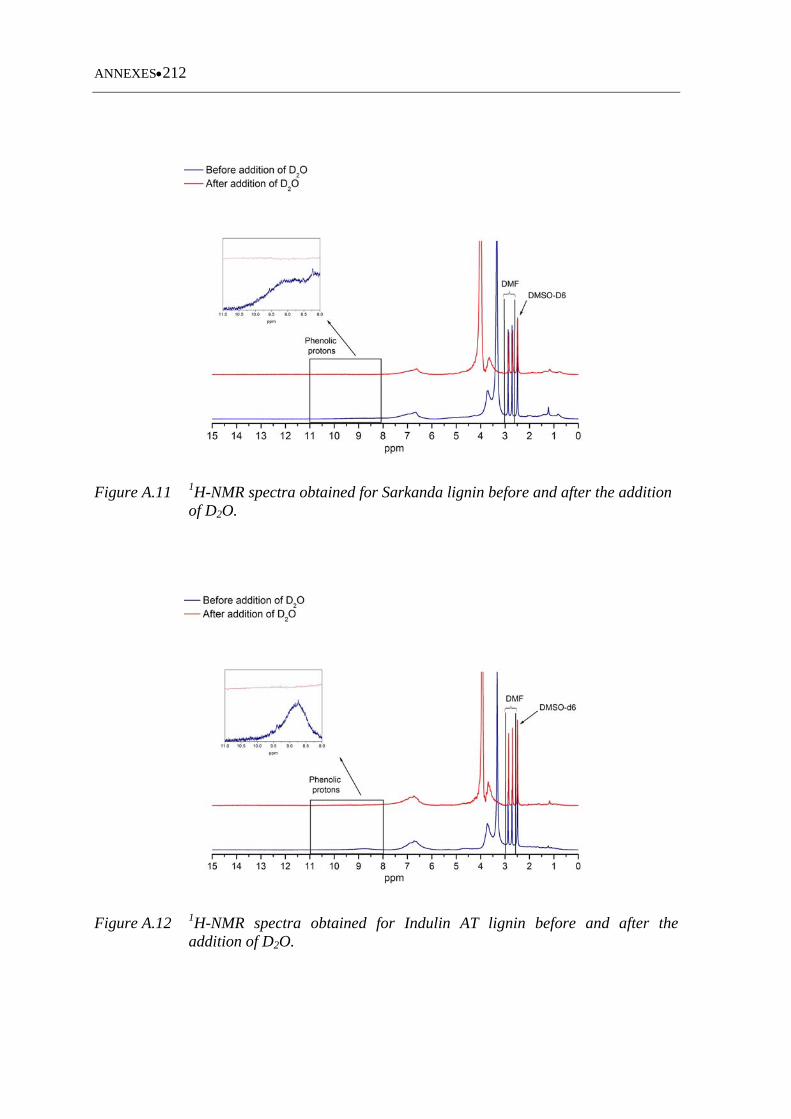
ANNEXES212
Figure A.11 1H-NMR spectra obtained for Sarkanda lignin before and after the addition of D2O.
Figure A.12 1H-NMR spectra obtained for Indulin AT lignin before and after the addition of D2O.
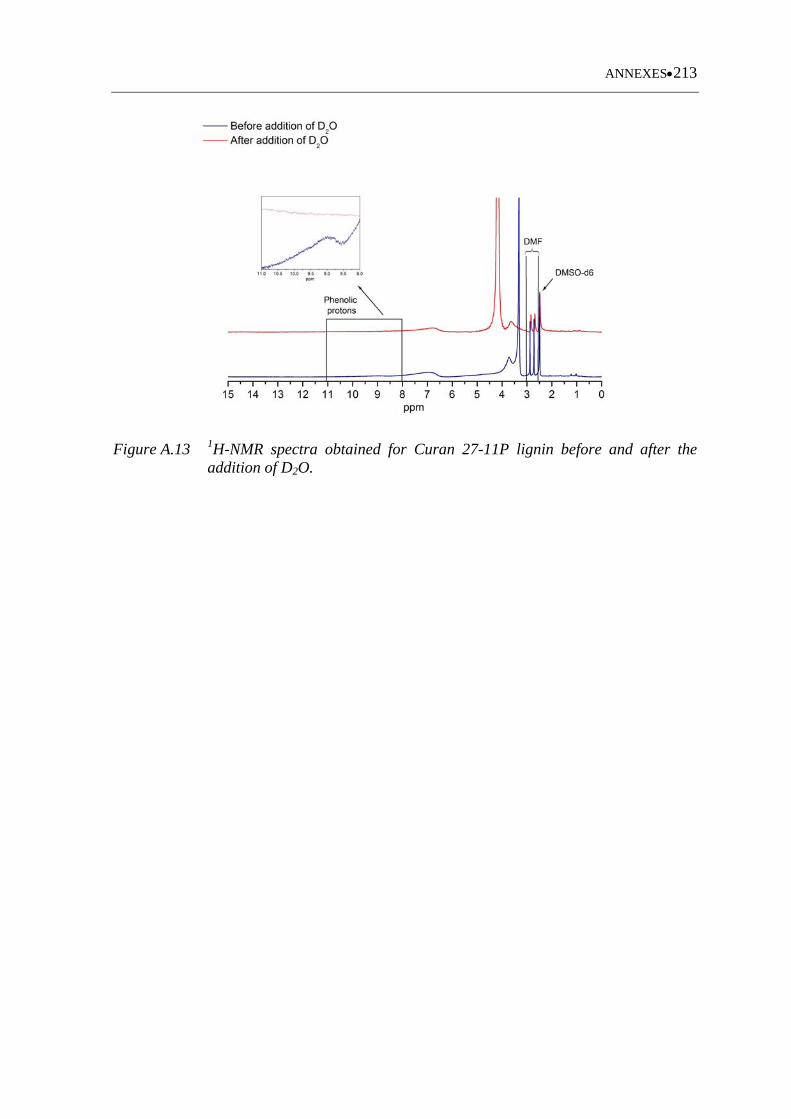
ANNEXES213
Figure A.13 1H-NMR spectra obtained for Curan 27-11P lignin before and after the addition of D2O.
ANNEXES214
B. Additional data for Chapter 4
This annex includes the additional experimental data to support the results presented
within chapter 4 “Utilisation of modified lignin by oxypropylation”.
Figures B.1 to B.4 show the FTIR spectra obtained for 20/80/5 and 35/65/2 polyols
based on Alcell (Figure B.1), Sarkanda (Figure B.2), Indulin AT (Figure B.3) and Curan
27-11P (Figure B.4) lignins.
Figures B.5 to B.8 show the 13C-NMR spectra obtained for 20/80/5 and 35/65/2 polyols
based on Alcell (Figure B.5), Sarkanda (Figure B.6), Indulin AT (Figure B.7) and Curan
27-11P (Figure B.8) lignins.
Figures B.9 to B.11 show the chromatographic profile evolution as function of the
catalyst content of oxypropylated lignin and homopolymer fractions for the series
10/90 (Figure B.9), 30/70 (Figure B.10) and 40/60 (Figure B.11).
Figures B.12 to B.14 show the chromatographic profiles obtained for oxypropylated
lignin and homopolymer fractions of Alcell (Figure B.12), Sarkanda (Figure B.13) and
Curan 27-11P (Figure B.14) based polyols.
Figures B.15 to B.17 show the DSC traces obtained for Alcell (Figure B.15), Sarkanda
(Figure B.16) and Indulin AT (Figure B.17) based polyols.
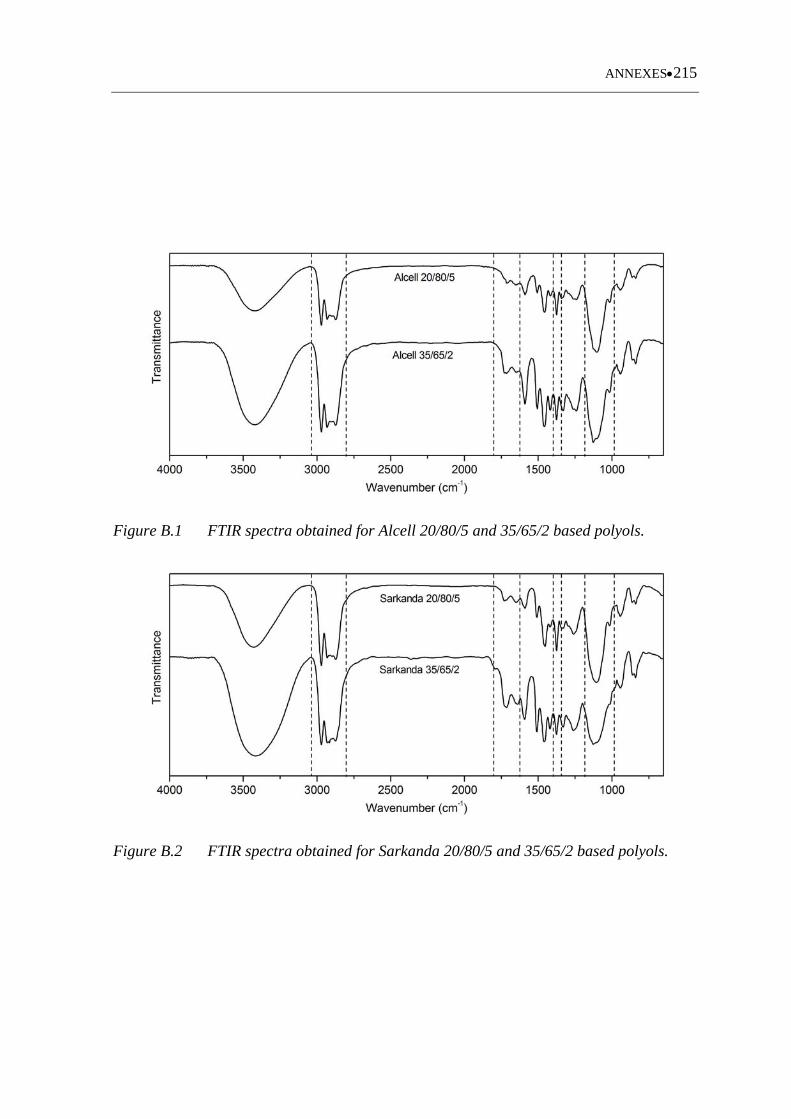
ANNEXES215
Figure B.1 FTIR spectra obtained for Alcell 20/80/5 and 35/65/2 based polyols.
Figure B.2 FTIR spectra obtained for Sarkanda 20/80/5 and 35/65/2 based polyols.
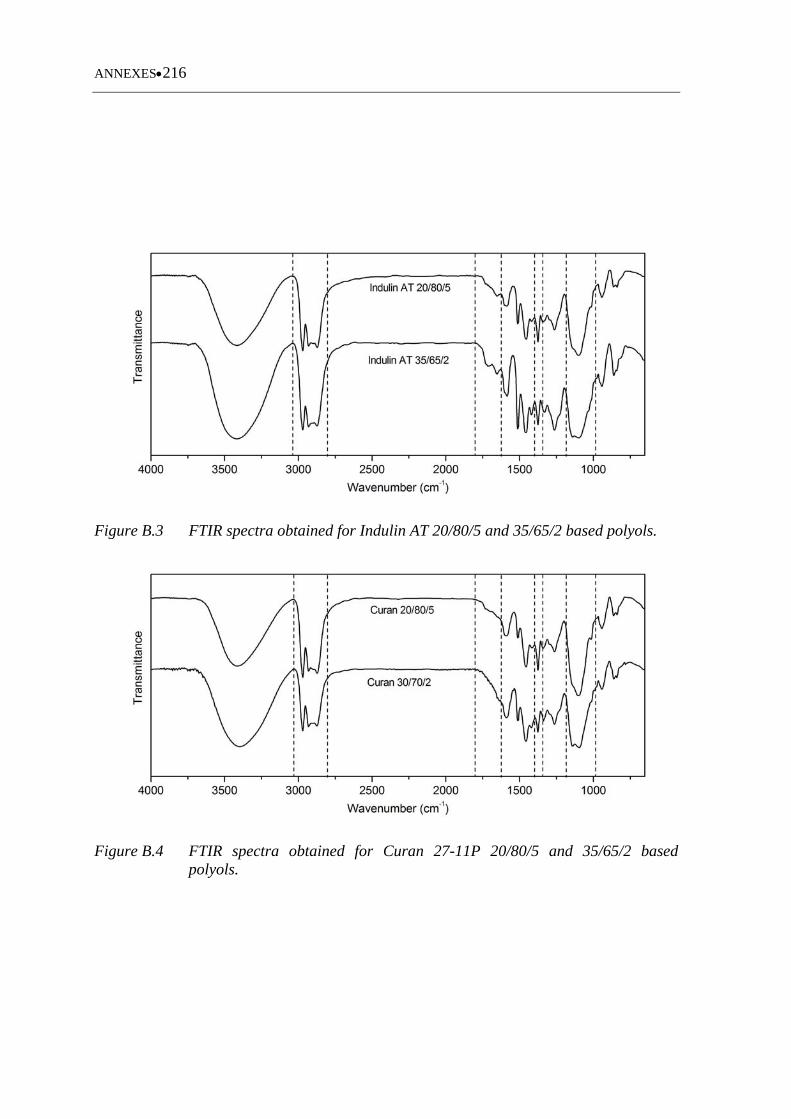
ANNEXES216
Figure B.3 FTIR spectra obtained for Indulin AT 20/80/5 and 35/65/2 based polyols.
Figure B.4 FTIR spectra obtained for Curan 27-11P 20/80/5 and 35/65/2 based polyols.
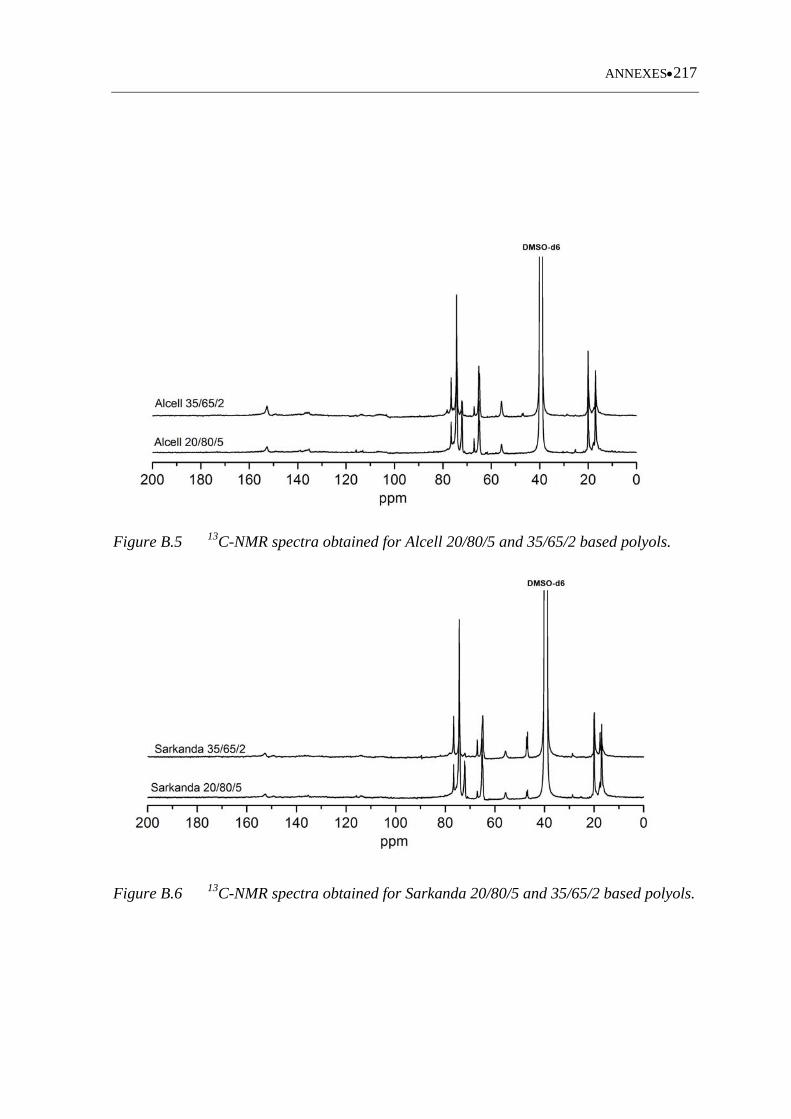
ANNEXES217
Figure B.5 13C-NMR spectra obtained for Alcell 20/80/5 and 35/65/2 based polyols.
Figure B.6 13C-NMR spectra obtained for Sarkanda 20/80/5 and 35/65/2 based polyols.
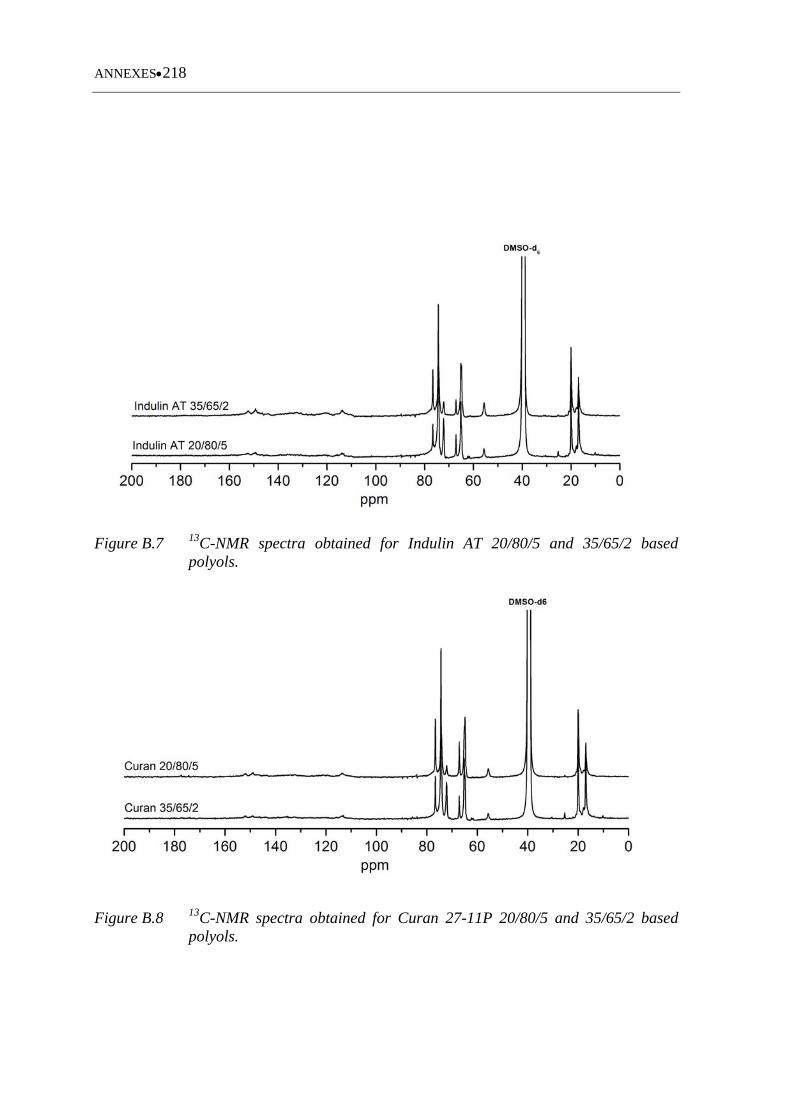
ANNEXES218
Figure B.7 13C-NMR spectra obtained for Indulin AT 20/80/5 and 35/65/2 based polyols.
Figure B.8 13C-NMR spectra obtained for Curan 27-11P 20/80/5 and 35/65/2 based polyols.
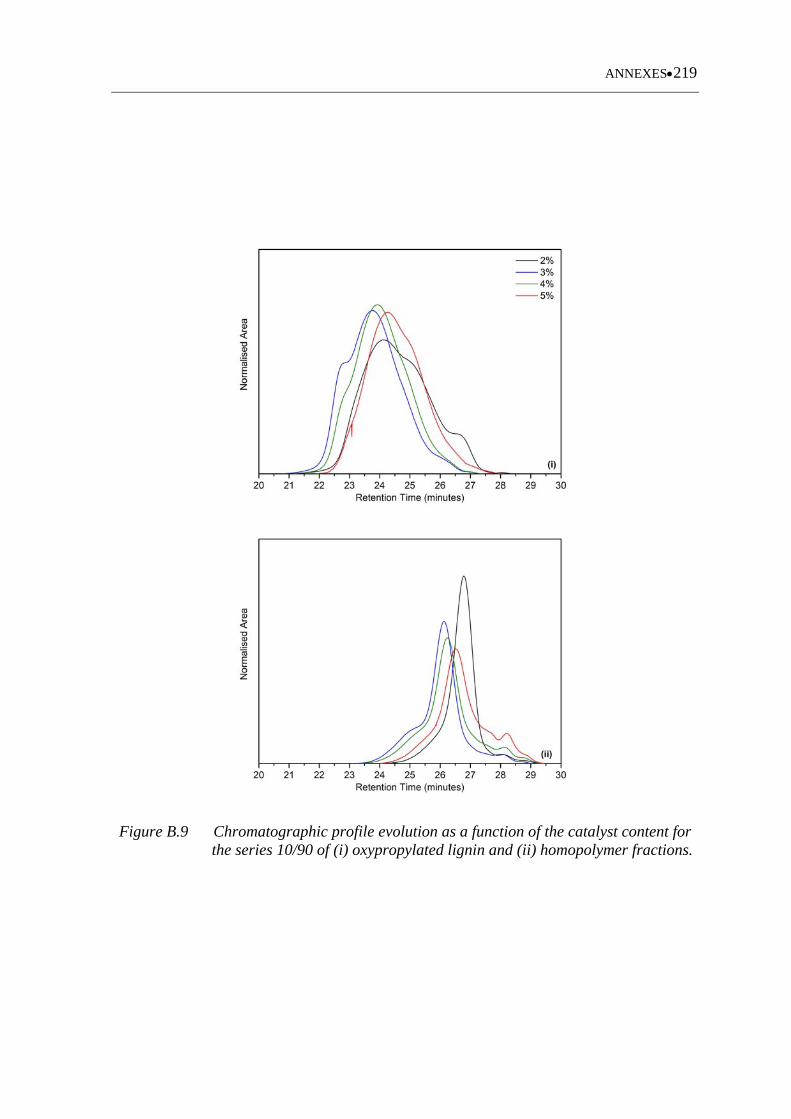
ANNEXES219
Figure B.9 Chromatographic profile evolution as a function of the catalyst content for the series 10/90 of (i) oxypropylated lignin and (ii) homopolymer fractions.

ANNEXES220
Figure B.10 Chromatographic profile evolution as a function of the catalyst content for the series 30/70 of (i) oxypropylated lignin and (ii) homopolymer fractions.
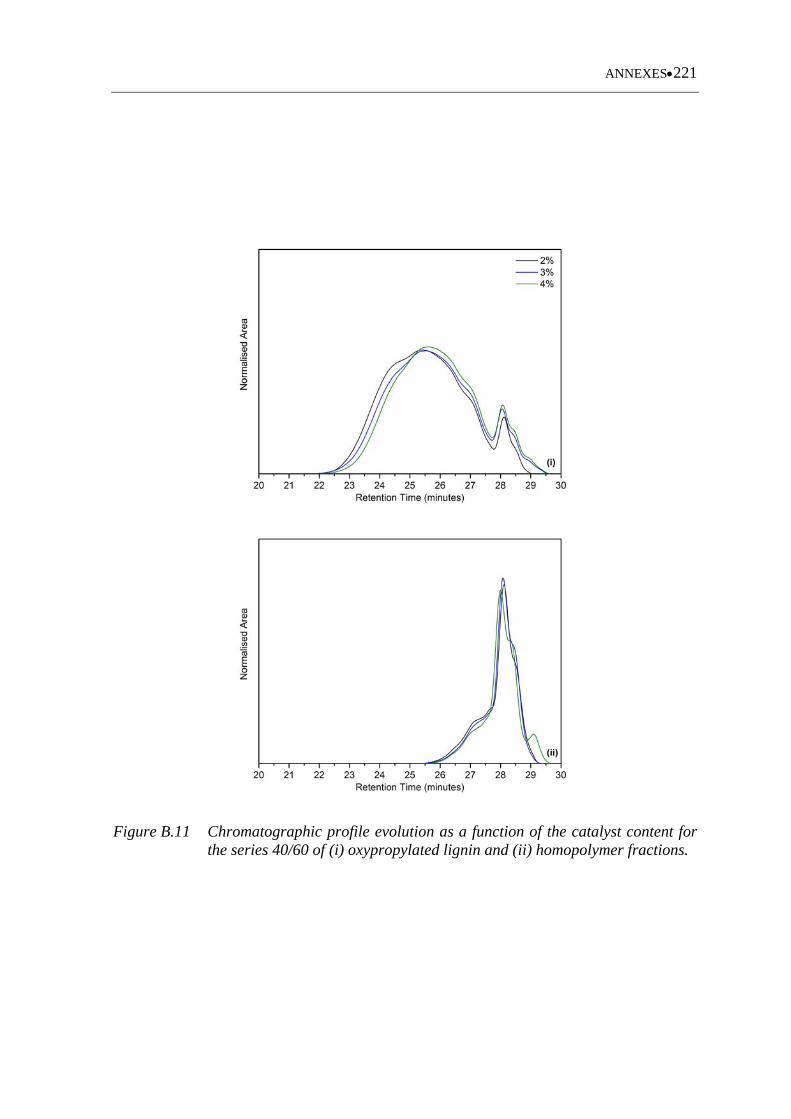
ANNEXES221
Figure B.11 Chromatographic profile evolution as a function of the catalyst content for the series 40/60 of (i) oxypropylated lignin and (ii) homopolymer fractions.
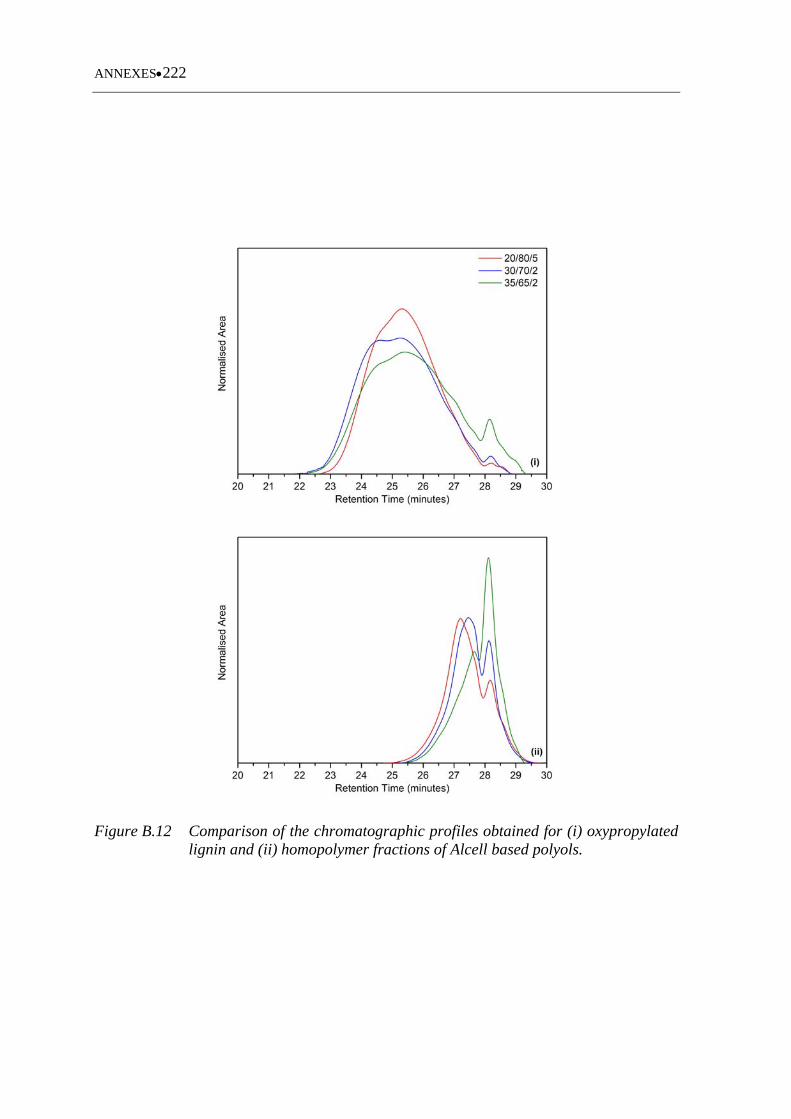
ANNEXES222
Figure B.12 Comparison of the chromatographic profiles obtained for (i) oxypropylated lignin and (ii) homopolymer fractions of Alcell based polyols.
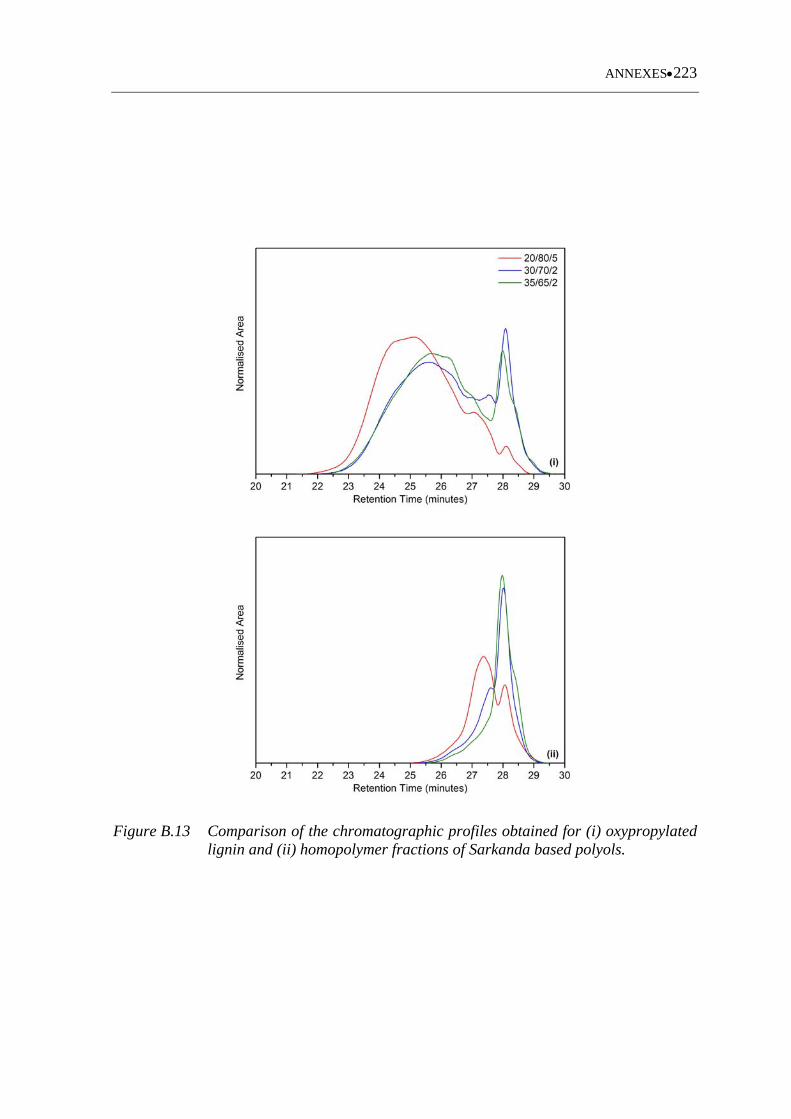
ANNEXES223
Figure B.13 Comparison of the chromatographic profiles obtained for (i) oxypropylated lignin and (ii) homopolymer fractions of Sarkanda based polyols.
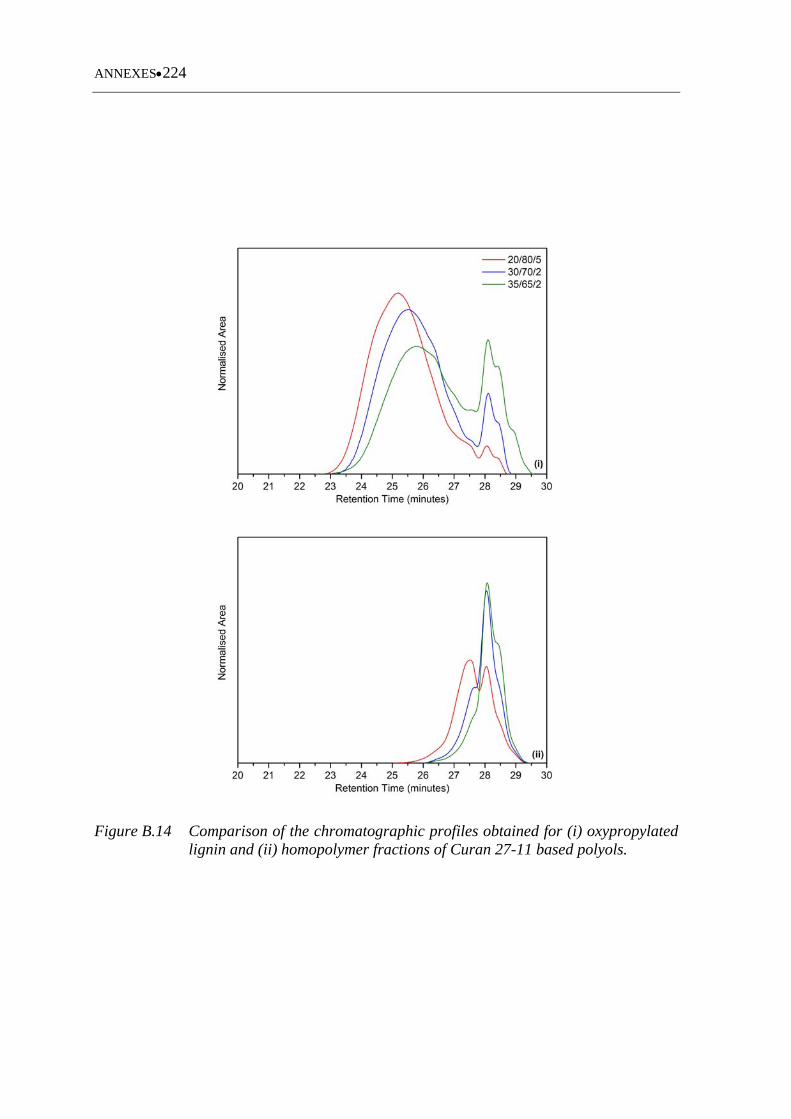
ANNEXES224
Figure B.14 Comparison of the chromatographic profiles obtained for (i) oxypropylated lignin and (ii) homopolymer fractions of Curan 27-11 based polyols.
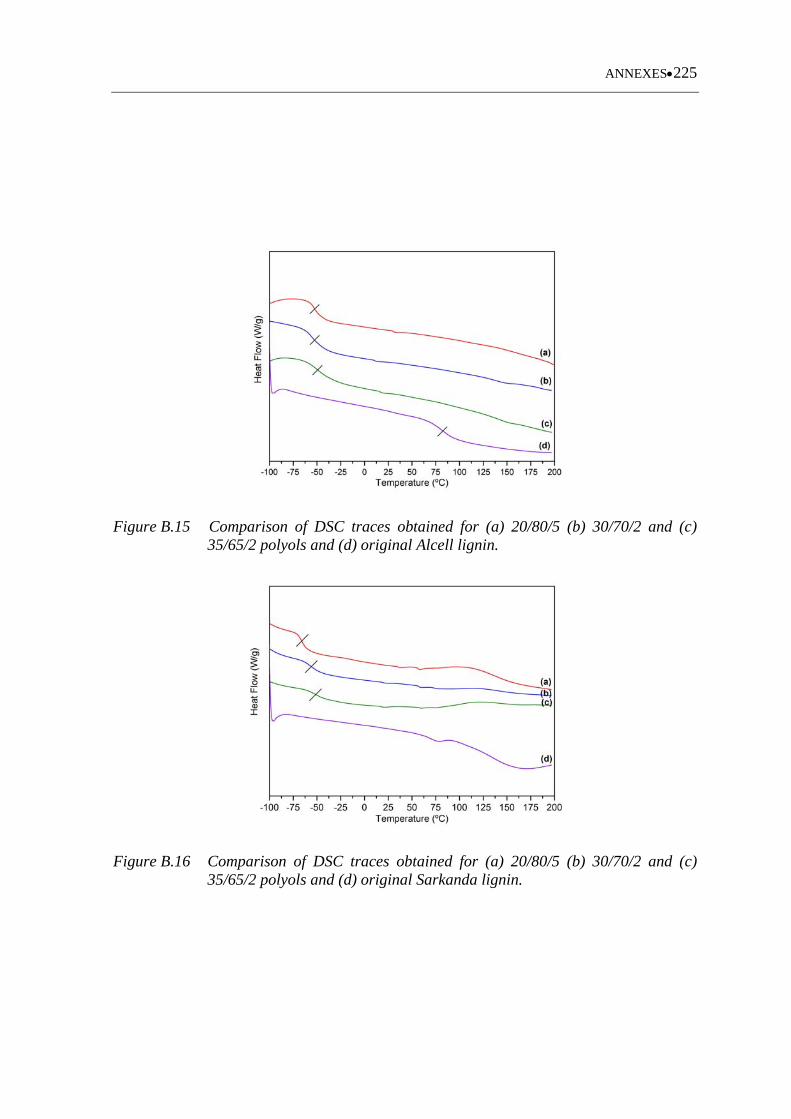
ANNEXES225
Figure B.15 Comparison of DSC traces obtained for (a) 20/80/5 (b) 30/70/2 and (c) 35/65/2 polyols and (d) original Alcell lignin.
Figure B.16 Comparison of DSC traces obtained for (a) 20/80/5 (b) 30/70/2 and (c) 35/65/2 polyols and (d) original Sarkanda lignin.
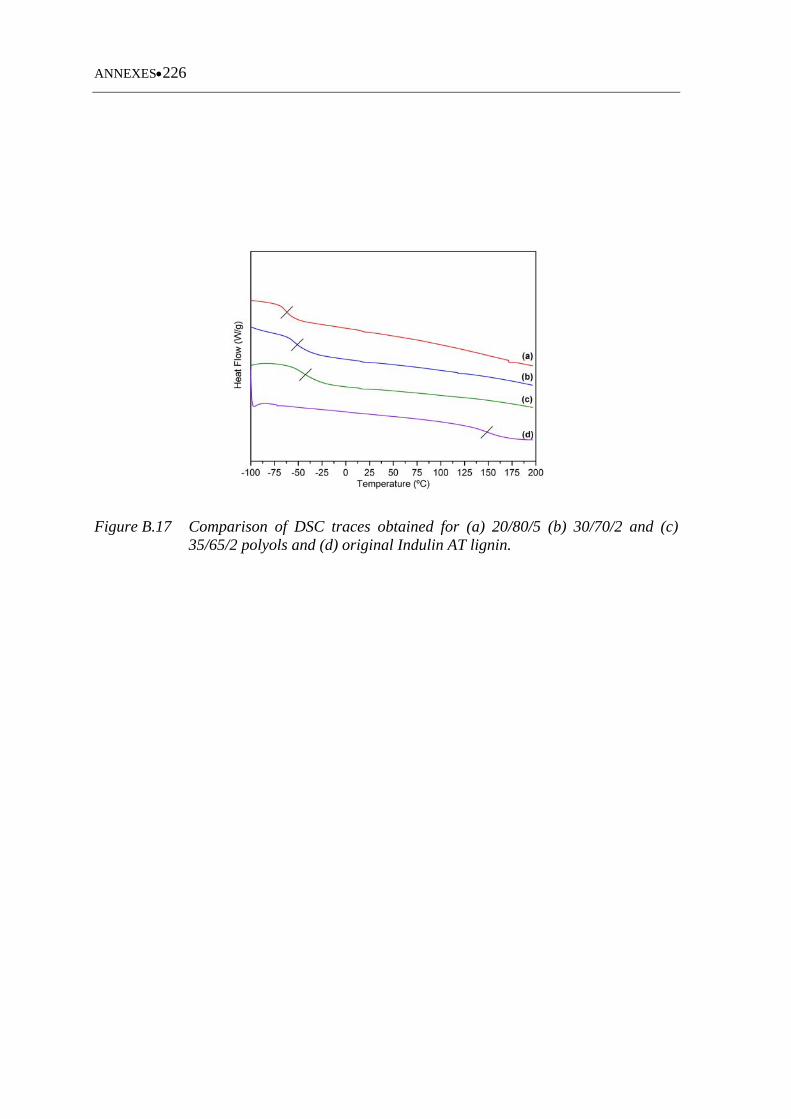
ANNEXES226
Figure B.17 Comparison of DSC traces obtained for (a) 20/80/5 (b) 30/70/2 and (c) 35/65/2 polyols and (d) original Indulin AT lignin.
ANNEXES227
C. Additional data for Chapter 5
This annex includes the additional experimental data to support the results presented
within chapter 5 “Utilisation of lignin without chemical modification”.
Figure C.1 shows the three replicas obtained for the experiment formulation
A(PCL750/1/25) in terms of relative absorbance and corresponding calculated isocyanate
conversion. Table C.1 to Table C.2 summarises the obtained results, regarding isocyanate
conversion (p(30 minutes)) and corresponding coefficient of variation, for the series of
experiments performed with Alcell and Indulin AT lignin, respectively .
Figures C.2 to C.3 show the DSC traces (Figure C.2) and DMA data (storage modulus
and loss tangent) (Figure C.3) as a function of temperature for reference materials:
(PCL400/1/0), (PCL750/1/0) and (PCL1000/1/0).
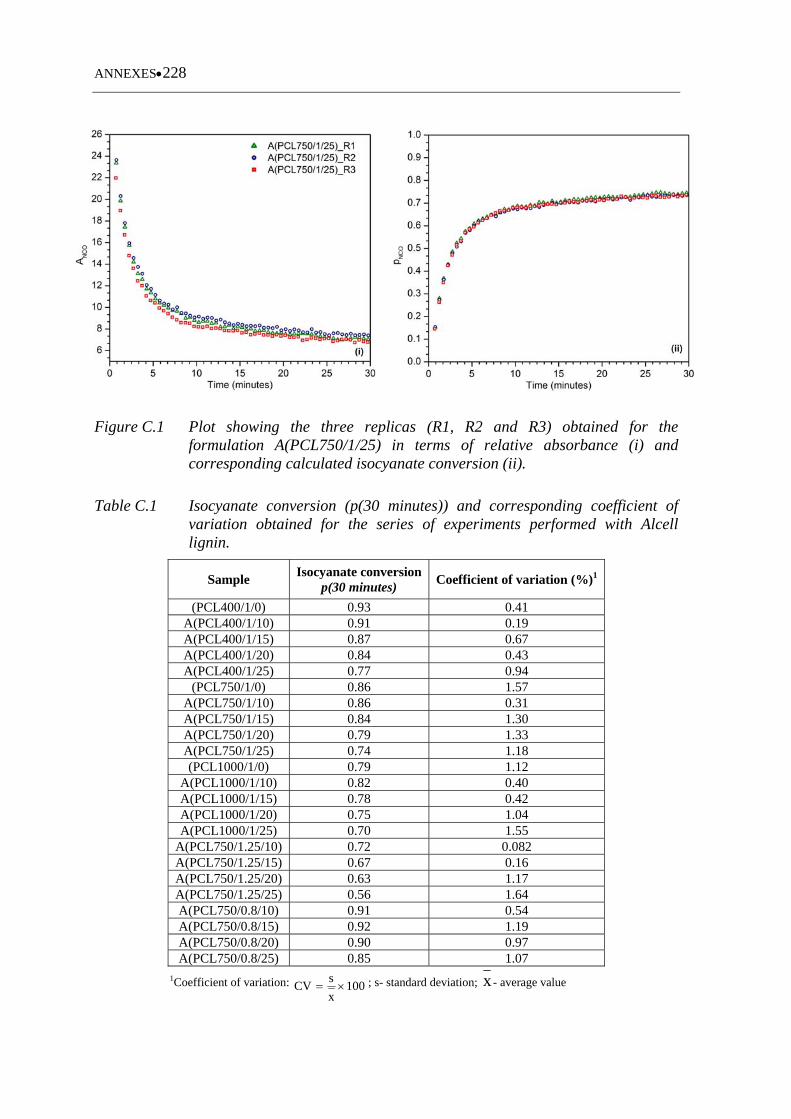
ANNEXES228
Figure C.1 Plot showing the three replicas (R1, R2 and R3) obtained for the formulation A(PCL750/1/25) in terms of relative absorbance (i) and corresponding calculated isocyanate conversion (ii).
Table C.1 Isocyanate conversion (p(30 minutes)) and corresponding coefficient of variation obtained for the series of experiments performed with Alcell lignin.
Sample Isocyanate conversion
p(30 minutes) Coefficient of variation (%)1
(PCL400/1/0) 0.93 0.41 A(PCL400/1/10) 0.91 0.19 A(PCL400/1/15) 0.87 0.67 A(PCL400/1/20) 0.84 0.43 A(PCL400/1/25) 0.77 0.94
(PCL750/1/0) 0.86 1.57 A(PCL750/1/10) 0.86 0.31 A(PCL750/1/15) 0.84 1.30 A(PCL750/1/20) 0.79 1.33 A(PCL750/1/25) 0.74 1.18 (PCL1000/1/0) 0.79 1.12
A(PCL1000/1/10) 0.82 0.40 A(PCL1000/1/15) 0.78 0.42 A(PCL1000/1/20) 0.75 1.04 A(PCL1000/1/25) 0.70 1.55
A(PCL750/1.25/10) 0.72 0.082 A(PCL750/1.25/15) 0.67 0.16 A(PCL750/1.25/20) 0.63 1.17 A(PCL750/1.25/25) 0.56 1.64 A(PCL750/0.8/10) 0.91 0.54 A(PCL750/0.8/15) 0.92 1.19 A(PCL750/0.8/20) 0.90 0.97 A(PCL750/0.8/25) 0.85 1.07
1Coefficient of variation: 100x
sCV ; s- standard deviation; x - average value
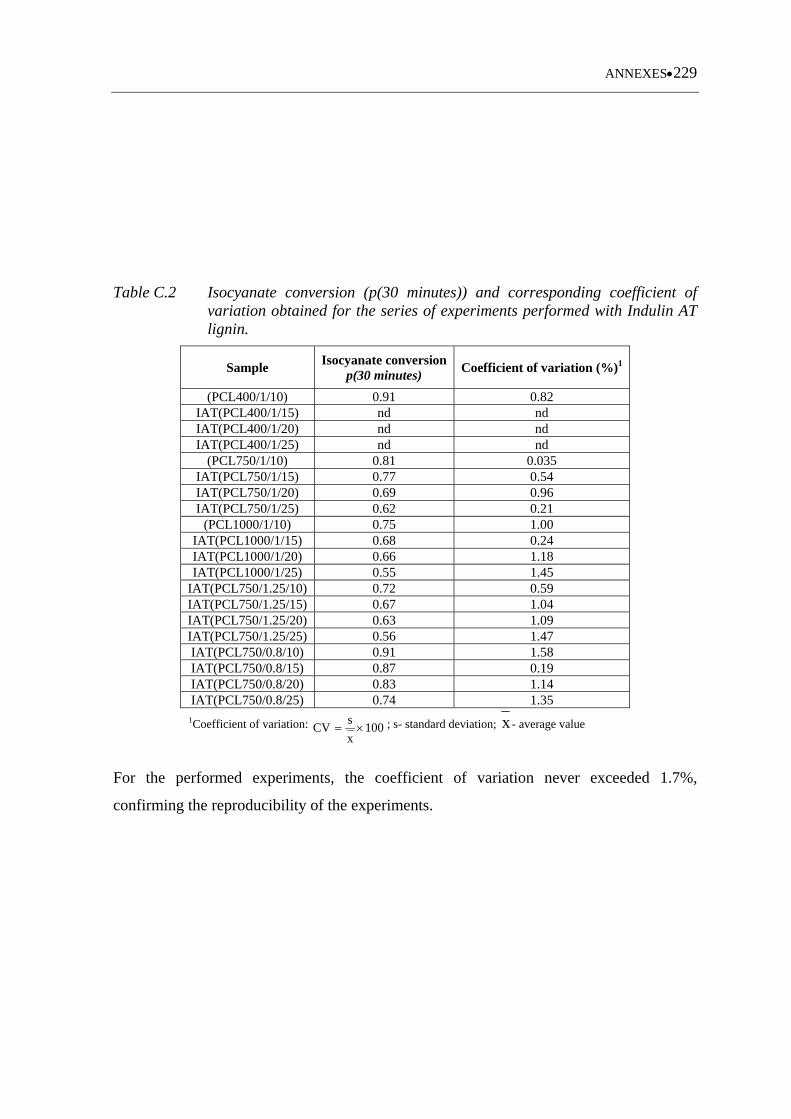
ANNEXES229
Table C.2 Isocyanate conversion (p(30 minutes)) and corresponding coefficient of variation obtained for the series of experiments performed with Indulin AT lignin.
Sample Isocyanate conversion
p(30 minutes) Coefficient of variation (%)1
(PCL400/1/10) 0.91 0.82 IAT(PCL400/1/15) nd nd IAT(PCL400/1/20) nd nd IAT(PCL400/1/25) nd nd
(PCL750/1/10) 0.81 0.035 IAT(PCL750/1/15) 0.77 0.54 IAT(PCL750/1/20) 0.69 0.96 IAT(PCL750/1/25) 0.62 0.21
(PCL1000/1/10) 0.75 1.00 IAT(PCL1000/1/15) 0.68 0.24 IAT(PCL1000/1/20) 0.66 1.18 IAT(PCL1000/1/25) 0.55 1.45
IAT(PCL750/1.25/10) 0.72 0.59 IAT(PCL750/1.25/15) 0.67 1.04 IAT(PCL750/1.25/20) 0.63 1.09 IAT(PCL750/1.25/25) 0.56 1.47 IAT(PCL750/0.8/10) 0.91 1.58 IAT(PCL750/0.8/15) 0.87 0.19 IAT(PCL750/0.8/20) 0.83 1.14 IAT(PCL750/0.8/25) 0.74 1.35
1Coefficient of variation: 100x
sCV ; s- standard deviation; x - average value
For the performed experiments, the coefficient of variation never exceeded 1.7%,
confirming the reproducibility of the experiments.
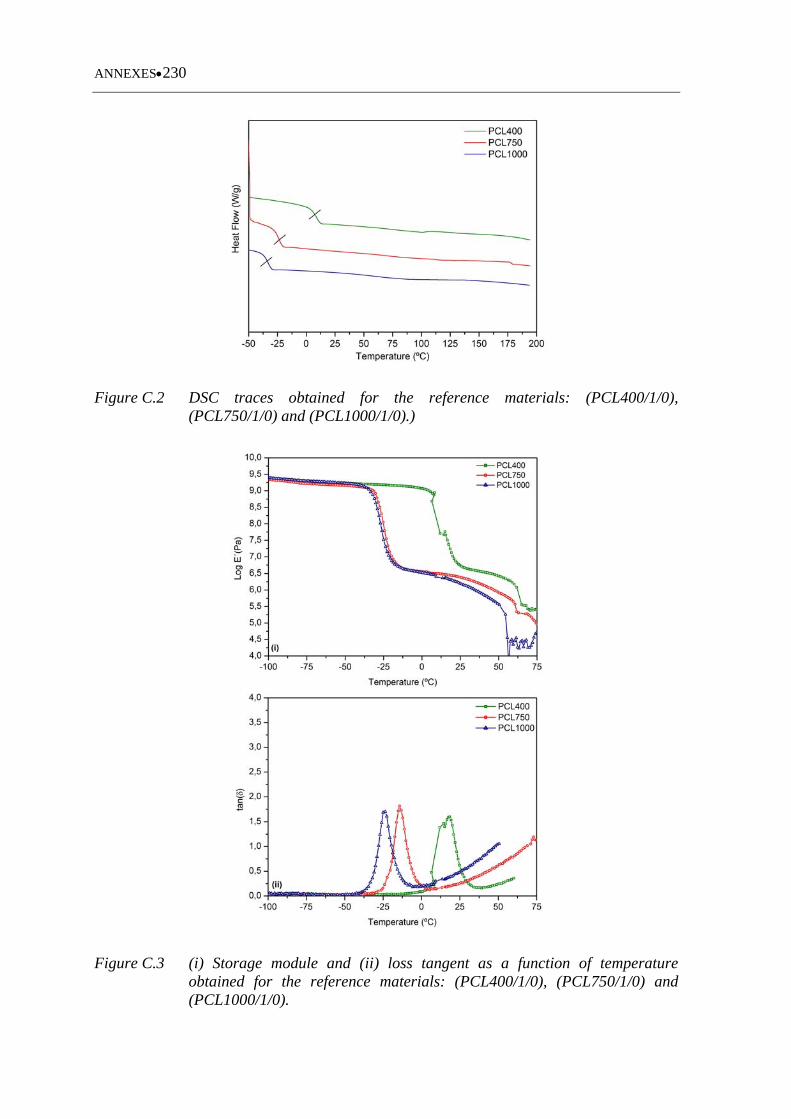
ANNEXES230
Figure C.2 DSC traces obtained for the reference materials: (PCL400/1/0), (PCL750/1/0) and (PCL1000/1/0).)
Figure C.3 (i) Storage module and (ii) loss tangent as a function of temperature obtained for the reference materials: (PCL400/1/0), (PCL750/1/0) and (PCL1000/1/0).