lightweight intersection-based traffic aware routing in...
TRANSCRIPT
Computer Communications 87 (2016) 60–75
Contents lists available at ScienceDirect
Computer Communications
journal homepage: www.elsevier.com/locate/comcom
Lightweight intersection-based traffic aware routing in Urban
vehicular networks
Tasneem Darwish
∗, Kamalrulnizam Abu Bakar
Pervasive Computing Research Group, Faculty of Computing, Universiti Teknologi Malaysia (UTM), 81310 Skudai, Johor D. T, Malaysia
a r t i c l e i n f o
Article history:
Received 8 October 2015
Revised 5 February 2016
Accepted 17 April 2016
Available online 23 April 2016
Keywords:
Geographic routing
Vehicular density
Traffic-aware
Multihop communication
V2V
a b s t r a c t
One of the important characteristics of VANETs is the multi-hop communications, which provides Vehicle-
to-Vehicle(V2V) communication for many applications. In order to adapt to mobility in high speeds and
limited-time communication links, traffic aware routing was proposed in many research works. As a type
of position based routing protocols, traffic aware routing utilizes vehicles’ positions and traffic status as
two main routing parameters. However, providing real-time measurements for traffic status on each road
generates high network overhead. In addition, to make such measurement always updated and available
for routing purposes, the measurement process has to be applied frequently. This paper introduces a
Lightweight Intersection-based Traffic Aware Routing (LITAR) protocol for V2V communication in urban
vehicular networks. LITAR introduces two new algorithms to reduce the network overhead generated by
the traffic status measurement process while preserving the accuracy of measurement. Moreover, LITAR
make routing decisions based on vehicular directional density, Road Network Connectivity (RNC) and dis-
tance towards destination. The evaluation of the proposed LITAR protocol shows significant performance
improvements in terms of packet delivery ratio, while reducing communication overhead as compared to
existing routing approaches.
© 2016 Elsevier B.V. All rights reserved.
t
V
c
h
i
i
p
p
v
[
g
G
a
e
o
s
s
i
c
1. Introduction
Vehicular Ad Hoc Networks (VANETs) provided the required en-
vironment for intelligent transportation systems development. Al-
though most of VANETs early applications were to improve traffic
safety, the number of third-party providers offering non-safety ap-
plications is increasing recently [1] . For instance, VANETs can be
utilized for real-time data collection in traffic control and roads
maintenance systems [2,3] , automated toll payment, enhanced
navigation, location-based services [4] , infotainment applications
and Internet access [5] . Thus, in the near future the demand for re-
liable and efficient communication, among vehicles (V2V) and be-
tween vehicles and infrastructure (V2I), will rise dramatically.
To enable geographically separated vehicles to communicate,
VANETs employ multi-hop communications by relying on interme-
diate vehicles for packets forwarding. However, the high speed mo-
bility of vehicles causes rapid changes in vehicles density and in-
termittent inter-vehicle communication. Therefore, delivering data
packets through multi-hop communications in VANETs environ-
ment requires reliable and efficient routing protocol. In general,
∗ Corresponding author. Tel.: +601127343967.
E-mail address: [email protected] , [email protected] (T.
Darwish).
r
t
a
t
http://dx.doi.org/10.1016/j.comcom.2016.04.008
0140-3664/© 2016 Elsevier B.V. All rights reserved.
here are two types of routing protocols designed purposely for
ANETs: topology based routing and position based routing, also
alled geographical routing [6] . Topology based protocols require
igh route maintenance, specially with frequent topology changes
n VANETs dynamic environment. In contrast, geographical rout-
ng protocols forward packets in a dynamic way based on vehicles
ositions. Accordingly, geographic routing was considered a more
romising routing approach for dynamic environments, as it pro-
ides scalability and robustness against frequent topology changes
7] .
Greedy Perimeter Stateless Routing (GSPR) is the basic geo-
raphical routing protocol proposed for ad hoc networks [8] . As
SPR forwards packets greedily based on vehicles positions only,
nd it has no consideration for network and traffic status, pack-
ts might be forwarded through roads with low vehicular density
r high level of network disconnections. In VANETs, vehicular den-
ity has a significant impact on inter-vehicle communication links
tability [9] . In order to eliminate conventional geographical rout-
ng protocols limitations, new metrics have been introduced by re-
ent routing protocols, which involve network and traffic status in
outing decisions. In particular, integrating geographic routing with
raffic awareness results in traffic aware routing protocols, which
dapt to variable traffic conditions. A comparison for the existing
raffic aware routing protocols and a discussion for their limitations
T. Darwish, K. Abu Bakar / Computer Communications 87 (2016) 60–75 61
h
l
1
r
d
A
t
r
m
o
t
f
i
w
w
t
b
c
u
e
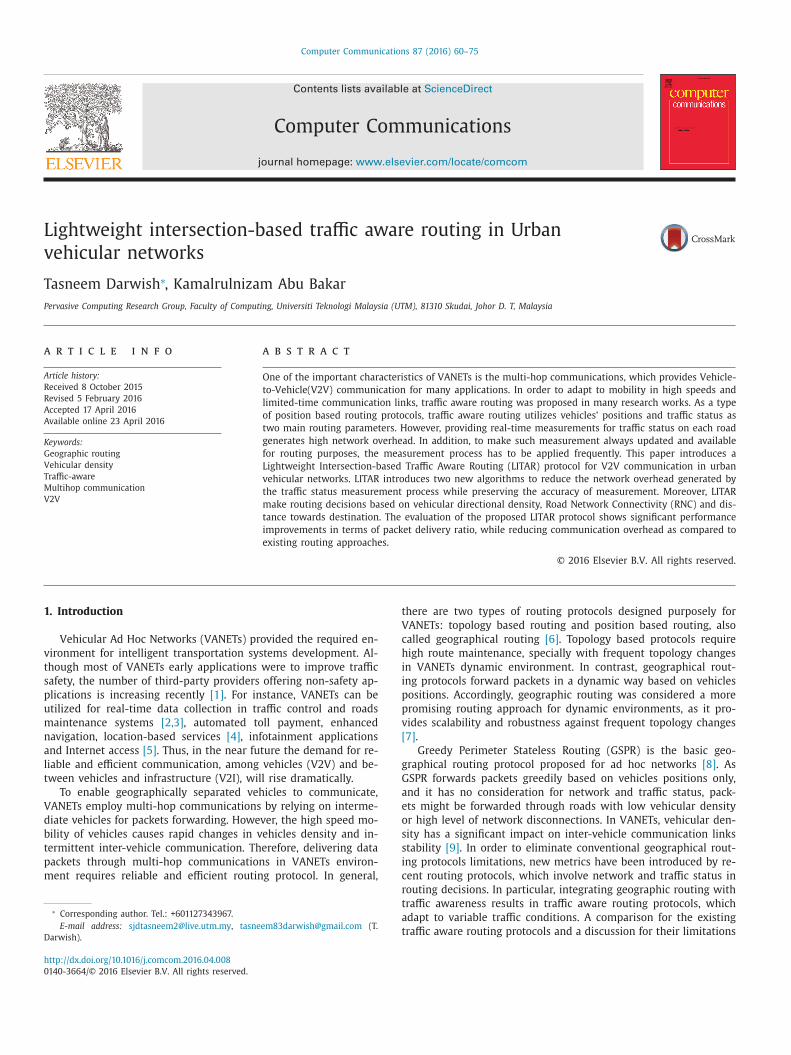
Fig. 1. Collecting and announcing road’s evaluation results utilizing CPs.
a
f
i
t
t
b
m
t
t
e
e
a
n
p
R
R
c
a
g
e
r
a
d
C
T
m
i
p
p
2
c
b
t
t
q
c
o
o
o
h
w
s
l
T
s
a
Annex
AP Access Point
APs Access Points
CBR Constant Bit Rate
CF Current Forwarder
CP Collector Packet
CPR Collector Packet Reply
CPRs Collector Packet Replies
CPs Collector Packets
EVPC Enhanced Validity Period Calculation
GeoSVR Geographic Stateless VANET Routing
GPSR Greedy Perimeter Stateless Routing
ICS Factor Inter-vehicle Communication Stability Factor
IVD Indirection Vehicular Density
LITAR Lightweight Intersection-based Traffic Aware
Routing
LLT Link Lifetime
MP Measurement Process
MVD Measured Vehicular Density
NF Next Forwarder
OVD Opposite direction Vehicular Density
PD Progressive Distance
PDD Packet Delivery Delay
PDR Packet Delivery Ratio
RCPR Restricted Collector Packet Reply
RNC Road Network Connectivity
RS Road Status
RSSI Received Signal Strength Indication
RTNSM Real-time Traffic and Network Status Measure-
ment
RVD Road Vehicular Density
TAR Traffic aware routing
V2I Vehicle-to-Infrastructure
V2V Vehicle-to-Vehicle
VANETs Vehicular Ad Hoc Networks
VDVR Vehicular Density Variation Rate
VP Validity Period
VPV Validity Period Value
as been published in [10] . Section 1.1 elaborates the concepts and
imitations of traffic aware routing in brief.
.1. Traffic aware routing: concepts and limitations
Traffic aware routing (TAR) protocols utilize new routing met-
ics, such as vehicular density and inter-vehicle connectivity, in or-
er to make routing decisions based on network and traffic status.
comprehensive review was published in [10] , which investigates
he shortcomings of different categories of TAR protocols based on:
outing process, routing metrics measurement process, forwarding
echanisms and recovery techniques. Although there is a variety
f TAR protocols, intersection-based TAR protocols are considered
he most adaptable to VANETs dynamic environment [10] . While
orwarding a packet, intersection-based TAR protocols make rout-
ng decisions at each intersection after giving each adjacent road a
eighted score, which is calculated based on road’s traffic and net-
ork status as well as distance towards destination. Subsequently,
he road with the highest score is chosen for packet forwarding.
Basically, to get information about traffic status for intersection-
ased Traffic aware routing routing purposes there exist many pro-
esses, which are discussed in [11] . However, real-time road eval-
ation processes are preferred, as they adapt more to the dynamic
nvironment of VANETs. The real-time road evaluation processes
re based on generating and forwarding Collector Packets (CPs)
rom one road end to another as shown in Fig. 1 . While forward-
ng a CP through road R , it collects traffic and network informa-
ion (e.g., vehicular density, inter-vehicle communication link life-
ime and transmission delay) from each forwarder vehicle. Thus,
y reaching intersection I j , the CP can provide real-time measure-
ents for traffic and network status of road R . In addition, a Collec-
or Packet Reply (CPR) might be sent to intersection I i to announce
he measurement results their. However, in order to keep the road
valuation results available and updated at intersection areas, the
valuation process has to be executed continuously. As a result,
high number of CPs and CPRs are generated which increases
etwork overhead and degrades intersection-based TAR protocols
erformance.
Accordingly, a Lightweight Intersection-based Traffic Aware
outing (LITAR) is proposed in this paper. LITAR introduces the
eal-time Traffic and Network Status Measurement (RTNSM) pro-
ess, which enhances the road evaluation process by proposing two
lgorithms to reduce the generated network overhead. The first al-
orithm is the Enhanced Validity Period Calculation (EVPC), which
liminates the unnecessary generation of CPs. The second algo-
ithm is the Restricted Collector Packet Reply (RCPR) which gener-
tes CPRs in certain cases only. In addition, LITAR improves routing
ecisions by introducing a new routing metric called Road Network
onnectivity (RNC).
This paper is structured as follows: Section 2 discusses several
AR approaches proposed in the context of VANETs and details the
otivations of this paper. Section 3 , introduces LITAR functional-
ty, design and components. Section 4 presents and discusses the
erformance evaluation of LITAR. Finally, Section 5 concludes the
aper.
. Motivations and related work
In urban VANETs environment, destination and source vehi-
les might be geographically separated. In addition, intersections,
uildings and vehicles may affect or obstruct signal propaga-
ion. Hence, multi-hop communication in urban areas is essen-
ial, in order to address the long transmission distance and fre-
uent obstacles problems, which makes vehicles direct communi-
ation impossible in many cases [12] . On the other hand, a study
f the impact of multi-hop communication on the performance
f a modelled vehicular content downloading system is carried
ut in [13] . The study revealed the significant role that multi-
op communications play in improving the network throughput
hile accessing infrastructure Access Points (APs). Precisely, the
tudy showed that 80% of the data was downloaded through re-
ay vehicles even when the considered area is fully covered by APs.
his is due to preferring the high-rate multi-hop paths to low-rate
ingle-hop direct V2I communications, even within AP coverage
rea. In addition, in case of spars deployment of APs, multi-hop

62 T. Darwish, K. Abu Bakar / Computer Communications 87 (2016) 60–75
c
o
p
t
c
i
T
t
a
p
a
h
i
i
f
d
t
G
e
e
t
a
l
t
h
i
r
a
i
w
p
p
a
o
d
t
v
u
t
M
w
h
c
s
t
s
r
c
c
t
m
d
c
o
i
s
p
p
t
communication is important to provide access to infrastructure
networks. Accordingly, providing efficient multi-hop communica-
tion via reliable routing protocols is vital in VANETs environment.
This section introduces our motivations for carrying out this re-
search study and highlights the novelty of our protocol. To this
end, the following review focuses on inspecting the most recent
and relevant VANETs routing protocols to our work. Our proposed
LITAR protocol has two main components: the RTNSM process that
provides routing metrics; and the intersection-based data packet
routing. Therefore, the existing solutions are studied in terms of
their routing mechanisms and utilized route or road evaluation
processes, which provide their TAR metrics. In particular, the ex-
isting road or route evaluation processes are reviewed from two
aspects: the way of representing or reflecting traffic and network
status; and their generated network overhead.
Full path traffic aware routing protocols:
In [14] , a multi-hop routing and gateway selection scheme was
proposed, which selects the routes with the best inter-vehicle link
lifetime. Routes lifetime was measured by gateway advertisement
messages, which are broadcasted by each gateway in a specified
geographical area. Vehicles motion parameters (e.g., speed, posi-
tion and direction) were used to estimate inter-vehicle Link Life-
time (LLT) between each consecutive vehicles along the routes,
then the lowest LLT is considered the route lifetime. However, ve-
hicular density was not consider as a routing metric even though
it has a huge impact on inter-vehicle LLT. In addition, this approach
might forward data through congested routes as network load on
routes was not considered as a routing metric.
Similarly, a connectivity-aware with minimum-delay geographic
routing protocol was introduced in [9] , whereas routes with good
connectivity are selected. The connectivity evaluation was com-
puted based on node local density, density changing rate and
transmission delay time. Route discovery messages are broadcasted
from a vehicle towards gateways, which measures the density and
delay parameters while being forwarded. Afterwards, the destina-
tion vehicle chooses the most stable route with the highest den-
sity and lowest network congestion, as transmission delay gives an
indication for network load. Although, the author utilized density
change rate as an indication for route stability, it does not give an
accurate estimation for route lifetime.
In [15] , a routing protocol based on QoS was proposed, which
utilizes route request broadcasting for route discovery and route
reply messages for collecting route status information. However,
upon receiving a route request message, the carried QoS informa-
tion is evaluated and if the current node satisfies the required QoS,
it forwards the route request message. Once a route request is re-
ceived by the destination vehicle, a route reply message is sent
back which collects links expiration time, expected transmission
time and local neighboring density. Afterwards, the source vehi-
cle chooses the best route based on the collected information. A
similar QoS-based routing protocol was introduced in [16] , whereas
routes are discovered by sending route requests. However, the au-
thor assumed that vehicles at intersection areas have information
about the QoS of adjacent roads, thereby route requests are prop-
agated through roads that fulfil QoS requirements. The evaluation
of routes was done based on LLT, degree of link failure and hop
count. Accordingly, as vehicular density and network load was not
considered in the evaluation process, the routing process may not
adapt smoothly to network and traffic changes.
Unlike LITAR, the measured vehicular density in [9,15] does not
consider vehicles direction, thus packets might be sent through
routes with high vehicular density moving in the opposite direc-
tion of packet forwarding, which reduces network throughput as
stated in [17] . Although, some of the aforementioned protocols
consider LLT as a routing metric [14–16] , such protocols have no
onsideration for alternative links which can be used when a link
f the constructed route is broken.
In terms of generated network overhead, the work in [14] de-
ends on broadcasting gateway advertismnet messages, which con-
ributes to high network overhead that is proportional to broad-
ast area. In addition, broadcasting gateway messages might result
n broadcast storms that degrades network performance. As the
AR protocols in [9,15,16] utilize route discovery/reply messages
o obtain the real-time values of routing parameters, a significant
mount of network overhead is generated, which is directly pro-
ortional to the number of communicating vehicles, route length
nd broadcast area. Therefore, such approach is not suitable for
igh vehicular density scenarios with high network load, due to
ts high network overhead that degrades routing performance.
Statistical vehicular density information is exploited as a rout-
ng metric in [18,19] . However, depending on statistical traffic in-
ormation for evaluating roads status is not efficient in the highly
ynamic and unpredictable VANETs environment [11] . In [20] ,
he Geographic Stateless VANET Routing (GeoSVR) was proposed.
eoSVR calculates the full path based on a digital map and consid-
rs roads width as an indication for high vehicular density. Nev-
rtheless, roads width is not accurate indication for the real-time
raffic status [10] . Moreover, high vehicular density does not guar-
ntee sufficient network connectivity, as link stability and network
oad are two main factors affecting transmission quality [21] .
In fact, full path TAR protocols construct a full path from source
o destination and insert the full path information in the packet
eader before forwarding. Thus, the selected path can not be mod-
fied or adjusted while forwarding a packet, which makes such
outing strategy less adaptable to network and traffic changes. In
ddition, as routes tend to be unstable due to vehicles high mobil-
ty, route maintenance and discovery has to be executed frequently,
hich results in extra network overhead [10] . Therefore, the full
ath routing strategy is not preferable for VANETs.
Intersection-based traffic aware routing protocols:
In general, intersection-based routing has less overhead com-
ared to full path routing, as no need for route discovery messages
nd packets carry the position of destination and next-intersection
nly. In addition, it adapts more efficiently to variable VANETs con-
itions, as routing decision is done sequentially at each intersec-
ion based on the evaluation of adjacent roads [10] . However, pro-
iding traffic aware routing metrics at intersections by road eval-
ation process generates high network overhead, which increases
ransmission interference and reduces data packet delivery ratio.
oreover, to keep routing metrics measurements updated and al-
ays available for routing decisions, the road evaluation process
as to be done so frequently, which worsen the problem and in-
reases the generated network overhead.
The intersection-based TAR protocols proposed in [22–24] , dis-
ect roads into fixed location cells, whereas the closest vehicle to
he cell center (i.e., cell leader) collects the cell’s vehicular den-
ity information. Afterwards, each former cell leader leaving the
oad, generates a CP and forwards it through the previous road to
ollect vehicular density information form cell leaders. Next, the
ollected density information is announced at the second intersec-
ion to be used for routing purposes. Although, allowing only for-
er leaders to generate CPs suppresses the generation process, it
oes not guarantee the generation of a new CP once road status
hanges. In addition, no reply packets are generated; thus, for a
ne way road no road evaluation results are provided at the first
ntersection ( I i in Fig. 1 ). Furthermore, depending on vehicular den-
ity and distance as routing metrics for selecting the best road for
acket forwarding, does not necessarily provide sufficient routing
erformance, since high vehicular density may increase signal in-
erference and network load [21] . Moreover, not considering link

T. Darwish, K. Abu Bakar / Computer Communications 87 (2016) 60–75 63
s
r
s
[
a
a
b
o
r
W
h
r
s
o
u
n
r
i
l
o
t
l
i
c
l
r
n
M
l
o
f
l
L
r
i
a
t
i
l
q
e
c
t
l
r
H
i
o
b
d
i
b
c
h
w
p
w
d
p
s
i
d
o
[
i
w
t
i
d
t
L
r
w
c
t
w
u
w
l
s
s
o
m
s
t
o
s
p
f
u
p
b
t
i
i
h
l
e
t
a
fi
t
w
fi
s
t
u
t
i
t
3
r
f
s
i
a
e
p
r
i
tability or lifetime metrics may result in forwarding data through
oads with high level of intermittent communications.
Unlike the three aforementioned protocols that has no con-
ideration for roads’ network status, the protocols proposed in
25,26] utilize Road Vehicular Density (RVD), transmission delay
nd progressive distance towards destination, in order to compute
rank for each adjacent road. The road evaluation is carried out
y sending CPs and CPRs between consecutive intersections with-
ut forming fixed cells. CPs are generated by vehicles entering the
oad and do not have valid evaluation results for the entered road.
hile forwarding a CP, each visited vehicle attaches its local ve-
icular density information, and the validity period of the carried
esults is updated. The validity period of the road evaluation re-
ults is the period after which the first network disconnection may
ccur. By reaching the second intersection the collected RVD, eval-
ation results validity period and CP transmission time are an-
ounced at the intersection area.
Unlike LITAR, the validity period in [25,26] was not used as a
outing metric for evaluating communication link stability, instead
t is used to avoid exploiting expired road evaluation results. Simi-
ar to LITAR, the validity period is used to suppress the generation
f CPs, as it prevents vehicles from generating new CPs as long as
hey have valid road evaluation results. However, the proposed va-
idity period calculation in [25,26] does not consider the availabil-
ty of alternative links among vehicles, which emerge due to vehi-
les movement and can replace broken links. As a result, the calcu-
ated validity period is short and does not adapt to changes in the
oad status in an accurate way, which may lead to generating high
umber of unnecessary CPs and increasing the network overhead.
oreover, the used link lifetime estimation for calculating the va-
idity period is based on neighbours motion information, which are
btained through beacon messages. Nevertheless, such mobility in-
ormation are instantaneous values that might lead to inaccurate
ink duration estimation. In contrast with other existing protocols,
ITAR calculates a more accurate validity period, which reflects the
eal state of the road and adapts CP generation based on changes
n road’s traffic or link stability status. Accordingly, LITAR gener-
tes new CPs only when it is necessary to detect and represent
he changes in roads status.
Similarly, in [27] , the roads’ vehicular density and network load
s measured using CPs and CPRs. For estimating road’s network
oad the number of packets stored in each CP forwarder’s buffer
ueue is considered. However, communication link stability is not
valuated, and the road evaluation process does not adopt the con-
ept of calculating a validity period for evaluation results. Likewise,
he author in [28] , employed CPs forwarding to get roads’ network
oad status by measuring CP forwarding delay. Thereafter, roads are
anked based on their progressive distance and transmission delay.
owever, relying on roads’ forwarding delay to select the best road
s not sufficient. This is because roads’ forwarding delay represents
nly the network load status of the evaluated road, and it can not
e an indication for the road’s communication stability and traffic
ensity status.
An important point distinguishing LITAR from the four protocols
n [25–28] , is that such protocols generate a CPR after each CP to
e sent back to the first intersection regardless of the replying ne-
essity, which increases the road evaluation process network over-
ead. In contrast, LITAR generates CPRs in certain necessary cases,
hich contributes to huge reductions in network overhead as ex-
lained in the following sections.
As a matter of fact, high vehicular density in the packet for-
arding direction (i.e., indirection density) contributes to higher
elivery ratio [17] . On the other hand, vehicles moving in the op-
osite direction of packet forwarding (i.e., opposite direction den-
ity) are not preferred for forwarding; however, such vehicles can
mprove the connectivity of the road network [10] . Although, in-
irection vehicular density was exploited in [23] , unlike LITAR the
pposite direction vehicular density was completely neglected. In
24] , the non-directional vehicular density is exploited when there
s no traffic moving in the packet forwarding direction. However,
hen indirection vehicular traffic is available, the opposite direc-
ion vehicular density is ignored, which results in underestimat-
ng the road traffic status. Despite of the importance of vehicles
irection in forwarding packets, the rest of the existing TAR pro-
ocols have no consideration for directional density. Distinctively,
ITAR utilizes both directions vehicular density as routing met-
ics, whereas opposite direction vehicular density is given a lower
eight compared to indirection density.
A different approach is introduced in [29] , whereas routing de-
isions are made in intersection zone. The proposed road evalua-
ion process considers only the parts of roads which are located
ithin 30 m from the center of the intersection center. The eval-
ation is carried out by counting the number of vehicles located
ithin the considered area and sent a beacon message within the
ast 100msec, while the average channel busy time to MAC queue
ize ratio of the counted vehicles is calculated as well. However,
uch approach may give unrealistic road evaluation as it considers
nly 30 m of the road for evaluation. For instance, data packets
ight be forwarded through a road that has high vehicular den-
ity near intersection area due to traffic lights, while the rest of
he road has no network connectivity.
Hybrid traffic aware routing protocols:
The hybrid TAR protocols attempt to enhance the performance
f full path TAR protocols by allowing route adjustments at inter-
ections. The protocols proposed in [30,31] , first construct a full
ath towards destination using Dijkstra algorithm. Afterwards, the
orwarding path is dynamically adjusted at intersections based on
pdated traffic information. At each intersection a vehicle is ap-
ointed to collect vehicular traffic information from adjacent roads
y utilizing CPs in a similar way to [22] , and then it disseminates
he collected information to adjacent intersections. However, elect-
ng the appointed vehicle and continuously maintaining this role at
ntersections is a critical issue, which generates extra routing over-
ead. In addition, [30,31] utilized vehicular density and network
oad as routing metrics for routing packets at intersections; how-
ver, not considering link stability my result in forwarding packets
hrough roads with intermittent connectivity.
A similar approach is introduced in [32,33] , where static nodes
re placed at each intersection, in order to collect real-time traf-
c information from adjacent roads by forwarding CPs. In [32] , a
ransmission delay estimation model is utilized to evaluate roads,
hile roads are evaluated based on vehicular density and traf-
c load in [33] . However, the applicability of such solution is re-
tricted to areas where the static nodes are fixed which reduces
he network scalability and increases deployment cost. Despite of
tilizing insufficient routing metrics that do not reflect the real
raffic and network state of roads, the authors in [30–33] did not
ntroduce a mechanism for controlling CP generation or adapting it
o changes in road conditions.
. Lightweight intersection-based traffic-aware
outing protocol
This section explains in details the proposed LITAR protocol
or V2V multi-hop communication. Delivering data packets from
ource to destination using LITAR comprises two processes working
n parallel. The first process is the RTNSM process for road evalu-
tions, which is applied continuously on each road to provide at
ach intersection the adjacent roads evaluation results. The second
rocess is the data packet routing, which utilizes RTNSM results as
outing metrics to make routing decisions at intersections. Accord-
ngly, data packets are forwarded through the best road in terms

64 T. Darwish, K. Abu Bakar / Computer Communications 87 (2016) 60–75
Current Forwarder Address Next Forwarder Address
In Direc�on Vehicular Density Opposite Direc�on Vehicular Density
Road ID Validity Period Value (VPV)
No. of Hops Originality flag Time Stamp
Fig. 2. Collector packet structure.
Fig. 3. Counting indirection (blue) and opposite direction (red) vehicles while for-
warding CP. (For interpretation of the references to colour in this figure legend, the
reader is referred to the web version of this article.)
3
b
b
t
i
3
a
t
fi
r
of vehicular density, network connectivity and progressive distance
towards destination. Unlike existing intersection-based TAR proto-
cols, LITAR considers the directional density for both directions as
a routing metric (i.e. indirection and opposite direction with re-
spect to packet forwarding direction). However, lower weight is
given to opposite direction vehicular density, in order to improve
the packet delivery performance. Moreover, the network connec-
tivity utilized in LITAR is calculated by considering communication
links stability (i.e., LLT) and network load.
LITAR aims at reducing the network overhead generated by
RTNSM process while preserving the measurement results accu-
racy. To this end, LITAR eliminates the unnecessary CPs generated
by the RTNSM process by introducing the Enhanced Validity Pe-
riod Calculation (EVPC) algorithm. Basically, EVPC considers calcu-
lating a Validity Period (VP) for the RTNSM results, to suppress
the generation of new CPs as long as the road traffic and net-
work status is not changing. Although, the concept of calculating
a VP for road evaluation results was in introduced in [25] . How-
ever, the existing VP calculation suffers of the following problems.
First, it was based on calculating the LLT with the furthest neigh-
bour, and the alternative links which can be utilized when such
a link is broken were ignored. As a result, the calculated VP is
short and results in generating many unnecessary CPs, even when
the road status is not changing. Second, the existing LLT calcula-
tion depends on the neighbours instantaneous mobility informa-
tion received by beacon messages, which might lead to inaccu-
rate LLT estimation. In order to address the previously mentioned
problems of VP calculation, LITAR’s EVPC anticipates when the next
change in road status is going to occur based on three factors: the
average LLT with all available neighbours, vehicular density and
vehicular density change rate. Thus, EVPC considers the alterna-
tive links that can be used instead of the furthest neighbour link.
In addition, to reduce the effect of instantaneous mobility infor-
mation, a higher level view for traffic status was considered by
utilizing vehicular density and its variation rate. Consequently, by
adapting the generation of CPs based on changes in road traffic or
network status, the obtained routing metrics (i.e. RTNSM results)
accurately reflect the real state of the road without generating
unnecessary CPs.
Basically, LITAR utilizes the calculated VP for three purposes.
First, VP value indicates when it is required to generate a new CP,
which eliminates unnecessary CP generation. Second, vehicles can
avoid using out of date RTNSM results for adjacent roads, while
routing data packets at intersections. Third, as higher VP value
indicates more stable road’s status, the calculated VP is used to
choose the most stable road for packet forwarding as explained in
Section 3.1.5 .
As generating CPRs highly contributes in increasing the network
overhead. Unlike the existing protocols which generates a CPR af-
ter each CP results announcement, LITAR introduces the RCPR al-
gorithm which generates CPRs in certain cases only. In fact, as CPs
are also generated by vehicles entering from the second road end
(i.e. I j in Fig. 1 ), generating a CPR after each CP becomes unneces-
sary in some cases as explained in Section 3.1.4 and Fig. 6 .
Similar to existing TAR protocols, LITAR considers that each ve-
hicle is required to maintain a neighbor table where the position,
speed, and direction of each neighbouring vehicle are recorded.
Such table is built and maintained based on the information re-
ceived through exchanging beacon messages between vehicles. In
addition, destination vehicle position can be obtained using loca-
tion services such as [34] . Finally, each vehicle needs to maintain
a roads table where it can record the received RTNSM results for
routing decisions at intersections.
Section 3.1 explains the phases of LITAR RTNSM process and in-
troduces the proposed algorithms. Afterwards, Section 3.2 elabo-
rates LITAR improved data packet routing.
.1. LITAR RTNSM process
The purpose of the measurement process is to provide feed-
ack data about the traffic and network status, which is utilized
y the routing process. The following section explains the struc-
ure of a CP. Afterwards, the RTNSM process phases are explained
n Section 3.1.2 .
.1.1. Collector packet structure
The Collector Packet (CP) is used to collect data about traffic
nd network status from the road it passes through. The CP struc-
ure consists of nine fields as shown in Fig. 2 . The content of each
eld and how it is updated, while forwarding the CP towards the
oad end, is explained in the following points:
• Current Forwarder (CF) Address : is the address of the vehicle
holding the CP currently.
• Next Forwarder (NF) Address : is the address of the next for-
warder, which is assigned by the CF in the forwarding phase.
• Indirection Vehicular Density (IVD) : is the accumulative number
of vehicles located in each CF vicinity and moving in the same
direction as the CP forwarding direction. However, in order to
avoid over counting neighbours, only neighbours located within
the area between the CF and NF are counted, as explained in
Section 3.1.2 and Fig. 3 .
• Opposite direction Vehicular Density (OVD) : is measured in the
same way as the ”In Direction Vehicular Density” field; how-
ever, it counts opposite direction vehicles.
• Road ID : is the ID of the road where the CP was generated. The
road ID can be obtained from the digital map based on vehicle’s
position as stated in [35] . The value of road ID field is assigned
by the vehicle that generated the CP. Afterwards, any vehicle
receives the CP can use the value of road ID to obtain road in-
formation from the digital map system such as road location,
driving direction, number of lanes and road structure.
• Validity Period Value (VPV) : is the estimated period of time af-
ter which a network disconnection is expected to happen in
T. Darwish, K. Abu Bakar / Computer Communications 87 (2016) 60–75 65
3
g
b
fi
r
m
e
r
o
i
r
T
o
R
n
t
m
d
A
a
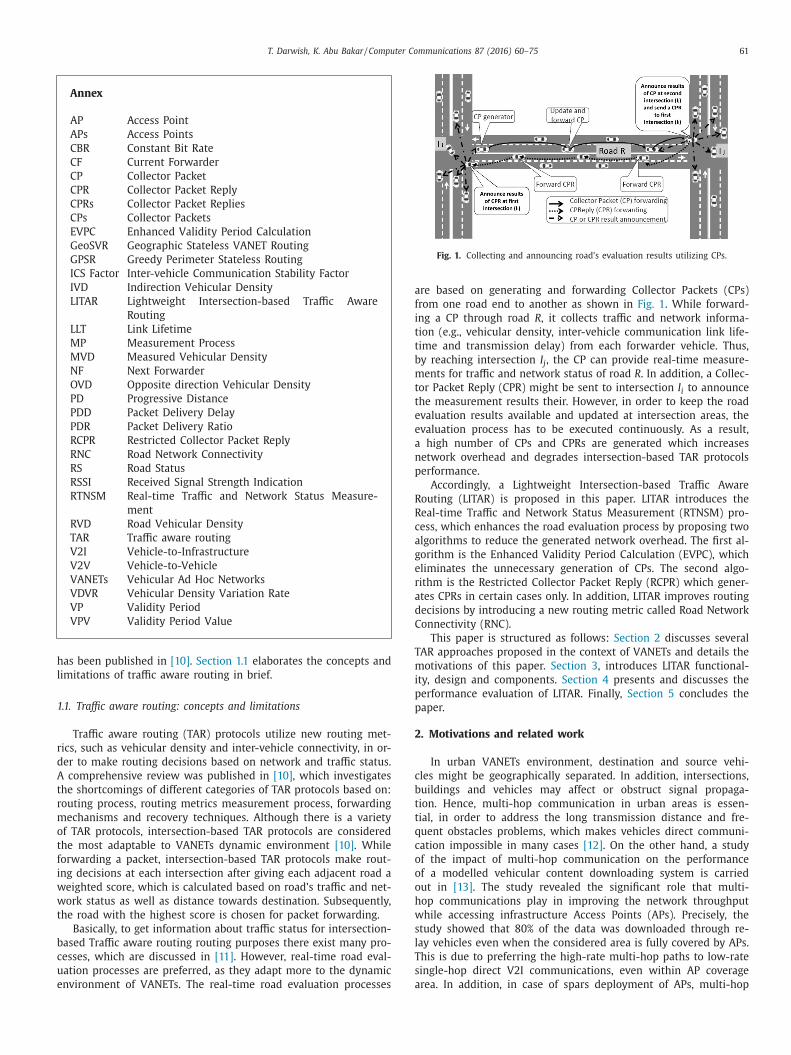
Algorithm 1 Enhanced Validity Period Calculation (EVPC)
Require: Current forwarder’s neighbour table and CP
Ensure: Validity period (VP) value
1: C F = C ur rentF or warder
2: T otalLLT = numberO f Neighbour = calculatedV P V = 0
3: for i = 1 ; i ≤ NeighbourT able.Length ; i + + do
4: n = NeighbourT able [ i ]
5: NeighbourPosition = P redictNeighbourPosition (n )
6: NeighbourRoadID = n.RoadID
7: d = distance (NeighbourPosition, CF .Position )
8: if d < T ransmissionRange then
9: if CF .RoadID = NeighbourRoadID then
10: calculatedLLT = calculateLLT (n )
11: T otalLLT = T otal LLT + cal cul atedLLT
12: numberO f Neighbour + +
13: Endif
14: Endif
15: Endfor
16: if numberO f Neighbour! = 0 then
17:
ICSF actor = exp[ −1 ∗ (V DV R )
( V ehic ularDensity ) ] (1)
18:
calculatedV P V = ICSF actor ∗ ( T otalLLT /numberO f Neighbour )
(2)
19: Endif
20: if (CP.V P V > calculatedV P V ) then
21: CP.V P V = calculated V P V //upd atetheCP ′ sV P V f ield
22: Endif
23:
24: calculateLLT(n)
25: { 26: if CF .direction == n.direction then
Return T ransmissionRange/n.Speed (3)
27: else
28: if CF isApproaching(n ) then
Return
T ransmissionRange + d
n.Speed + CF .Speed (4)
29: else
Return
T ransmissionRange − d
n.Speed + CF .Speed (5)
30: Endif
31: Endif
32: }
that road. The algorithm of calculating VPV is explained in
Section 3.1.3 .
• No. of Hops : is the number of participating nodes in forwarding
the CP so far.
• Originality flag : to differentiate between original CP and CPR.
• Time Stamp : to register the generation time of the CP or CPR.
.1.2. LITAR RTNSM process phases
In intersection-based TAR protocols, the road evaluation process
enerates high network overhead. This is due to forwarding CPs
etween each two consecutive intersections to measure the traf-
c or network status along the road. Afterwards, the measurement
esults are announced at intersection areas to be used as routing
etrics while making routing decisions. In addition, some of the
xisting routing protocols generate a CPR after announcing the CP
esults, which increases the network overhead. The RTNSM process
f LITAR aims at reducing the road evaluation network overhead by
ntroducing the EVPC and RCPR algorithms.
LITAR’s RTNSM process is initiated when a vehicle moving on
oad R generates a CP upon reaching the intersection area ( I i ).
he CP is forwarded from the first road intersection to the sec-
nd (i.e., from I i to I j ), as shown in Fig 1 . Each vehicle on road
receives the CP updates its fields, based on its local traffic and
etwork status information, then forwards the CP towards I j . Once
he CP reaches I j the collected traffic and network status measure-
ent is processed then announced at the intersection area. In ad-
ition, a CPR might be sent to the original intersection I i based on
lgorithm 2 . Basically, the RTNSM process consists of four phases
s explained in the following points:
• Collector packet generation phase : There are two conditions
the leaving vehicle has to satisfy, in order to generate a CP, un-
less it has no previous measurement for the current road. First,
the vehicle must have updated a previous CP while moving in
that road. Second, the measurement which was previously re-
ceived from the current road must be expired. Such conditions
are applied to reduce the number of generated CPs. The genera-
tor vehicle attaches a time stamp and its current road ID to the
generated CP. Afterwards, the rest of the generated CP’s fields
are updated as described in the updating and forwarding phase.
• Collector packet updating and forwarding phase : The number
of hops is incremented by one at each subsequent forwarder.
The vehicular density fields are incremented based on the num-
ber of neighbour vehicles located in the area between CF and
NF. Basically, each CF counts the number of vehicles between
itself and NF, while considering their directions as shown in
Fig. 3 . Afterwards, the number of indirection vehicles (i.e., blue
vehicles in Fig. 3 ) is added to IVD field, whereas the same pro-
cedure is applied to update the OVD field. In addition, the gen-
erator vehicle calculates and assigns the initial value of VPV
field based on Algorithm 1 . Subsequently, each forwarder cal-
culates its VP value, and then if the calculated value is less
than the received VPV, the calculated value is assigned to the
VPV field. Thereby, the lowest VP value will be delivered by the
forwarded CP to the road end. Moreover, by reaching the road
end, the CP’s vehicular density fields have the total number of
neighbours for all visited nodes, which represent the density of
vehicles along the evaluated road. In case the CF vehicle is not
at an intersection area a NF has to be selected. The NF is the
neighbour which has the highest Received Signal Strength In-
dication (RSSI), and shortest distance towards next intersection.
Next, the NF address is assigned to the CP’s “next forwarder ad-
dress” field, then updated CP is unicasted to NF. This phase is
applied repeatedly until the CP is delivered to next intersection
area, where the carried RTNSM results can be processed and
announced.
• Collector packet results announcement phase : When a ve-
hicle at intersection receives a CP, it will process the carried
RTNSM measurement. Afterwards, the processed results are at-
tached to the next beacon message, in order to be broadcasted
at the intersection area. In addition,the announcer vehicle gen-
erates a CPR based on Algorithm 2 .
• Collector packet reply phase : if the conditions of replying are
satisfied based on Algorithm 2 then, the announcer vehicle gen-
erates a CPR. Afterwards, the CPR is updated and forwarded to
the origin intersection of the received CP (i.e., I i ). In LITAR, a
CPR is not to carry the results of the announced CP. Instead,
new measurement is carried out while forwarding the CPR

66 T. Darwish, K. Abu Bakar / Computer Communications 87 (2016) 60–75
Algorithm 2 Restricted Collector Packet Reply (RCPR)
Require: Current forwarder’s roads table and received CP
Ensure: Restricted generation of CPReply
1: C F = C ur rentF or warder
2: C F Road = C F .roadID
3: if (CF announced(CP )) then
4: if (CF isLea v ingRoad(CF Road)&!(CF generatedCP (CF Road)))
then
5: if (!(CF hasP r e v iousMeasur ement(CF Road))) then
6: if (C P.V P V ≥ C P.tra v elT ime ) then
7: generat eC P Reply ()
8: else
9: if (CF hasP r e v iousMeasur ementF romC P (C F Road)) then
10: P re v iousC P = C F getP r e v iousMeasur ement(CF Road)
11: CP f requency = CP .timeStamp − P re v iousCP .timeStamp
12: if (C P.V P V ≥ C P f requency − CP.tra v elT ime ) then
13: generat eC P Reply ()
14: Endif
15: Endif
16: Endif
17: Endif
18: Endif
i
n
p
r
t
(
L
(
t
d
m
v
r
o
o
t
t
c
v
a
c
m
b
t
i
w
s
p
v
m
m
l
n
a
b
m
r
i
m
a
v
V
l
l
e
I
w
b
i
I
h
v
to origin intersection, which makes the carried results more
updated.
3.1.3. The Enhanced Validity Period Calculation (EVPC) Algorithm
In order to reduce the frequency of RTNSM process execution
and control CPs generation, a VP value can be calculated for each
CP. By applying such a mechanism, a vehicle can not generate a
new CP as long as the received CP’s VPV has not expired yet. The
VPV of a road’s CP is the estimated period of time after which the
road status has to be re-evaluated, by initiating a new cycle of the
RTNSM process. Accordingly, a road with high VPV has more stable
traffic and network status than roads with lower values.
Unlike the existing validity period calculation proposed in [25] ,
EVPC calculates more accurate validity period, which provides right
timing for CPs generation to detect changes in road status without
generating unnecessary CPs. The existing VP value calculation algo-
rithm [25] utilizes mobility information received through beacons,
in order to predict neighbours’ positions and estimate their LLT.
However, the received mobility information has instantaneous val-
ues, which might change rapidly in VANETs dynamic environment.
In particular, with the frequent and difficult to predict changes in
VANETs, utilizing instantaneous mobility values does not accurately
indicate the level of stability of such links. Therefore, considering
LLT values (calculated based on neighbourhood instantaneous mo-
bility information), as an estimation for the network connectiv-
ity (i.e., VP value) in the CF vicinity, is not accurate. In addition,
the existing algorithm [25] has no consideration for the alternative
links available with neighbours. Accordingly, EVPC introduced two
enhancements to improve the calculation of VP value:
• The first enhancement is that EVPC considers all alternative
links while calculating the average LLT. In fact, calculating the
VP value based on the LLT of the link that will break soon be-
tween CF and NF results in short VP; and it does not reflect
the real connectivity state as it ignores the alternative links be-
tween CF and alternative NF. Therefore, EVPC calculates the av-
erage LLT between the CF and all the potential NF as the first
step for calculating the VP value.
• The second enhancement that EVPC introduced is the utiliza-
tion of Vehicular Density Variation Rate (VDVR) and local ve-
hicular density, in order to alleviate the effect of using instanta-
neous mobility information in calculating LLT. Basically, as com-
munication link stability between vehicles is affected by vehic-
ular density and its changing rate, EVPC utilizes those two pa-
rameters to calculate the Inter-vehicle Communication Stability
Factor (ICS Factor). The ICS Factor is exploited in the second
step of VP calculation, whereas the link duration and stability
are combined to estimate the validity period of network con-
nectivity.
EVPC algorithm is applied by each vehicle in charge of updat-
ng a CP. Algorithm 1 , explains the details of EVPC. First, for each
eighbour registered in the neighbour table the current position is
redicted (line 5) based on its mobility information (i.e., speed, di-
ection and latest known position). Afterwards, for the neighbours
hat are still within transmission range and belong to same road
lines 6,7,8), the total LLT is calculated, which is the summation of
LTs between CF and the neighbours. For calculating LLT, Equations
3–5) of function “calculateLLT” are utilized (lines 24 to 32). Equa-
ion (3) is used if CF and its neighbour are moving in the same
irection. Equations. (4,5) are utilized if CF and its neighbour are
oving in opposite directions, whereas Equation (4) is used if both
ehicles are approaching each other and Eq. (5) when vehicles al-
eady passed each other. Second, the ICS Factor is calculated based
n Equation (1) (line 17). Next, the VP value is calculated based
n Equation (2) (line 18), which uses two parameters: the ICS Fac-
or and the average LLT (derived from the total llt). Subsequently,
he calculated VP value is compared to the carried value in the re-
eived CP’s VPV field, if the later is greater then the calculated VP
alue is assigned to the VPV field (lines 20 and 21). Thereby, when
CP reaches the evaluated road end, its VPV field has the lowest
alculated VP value among all forwarder vehicles on that road.
Calculating ICS factor
In order to mitigate the effect of instantaneous mobility infor-
ation on the VP value calculation, the average LLT is multiplied
y a stability factor (i.e., ICS Factor). In fact, ICS Factor is an indica-
ion for the stability level of communication links among vehicles
n the CF neighbourhood. Although, high local vehicular density
as considered as an indication for higher connectivity and more
table communications in a vehicles neighbourhood [25] , such ap-
roach does not take into account that vehicular density is highly
ariable and can change over time. According to Taleb [36] , com-
unication links among vehicles with relatively similar speeds are
ore stable as they move as a group. Obviously, each vehicle be-
ongs to such a group has a low local density variation rate in its
eighbourhood. Accordingly, vehicular density and VDVR are both
ffecting the stability of communication links in the CF’s neigh-
ourhood. For instance, a CF with high local vehicular density has
ore alternative communication links to forward a packet, which
esults in higher network connectivity in the CF vicinity. However,
n such a case, having a high VDVR will result in less stable com-
unication links.
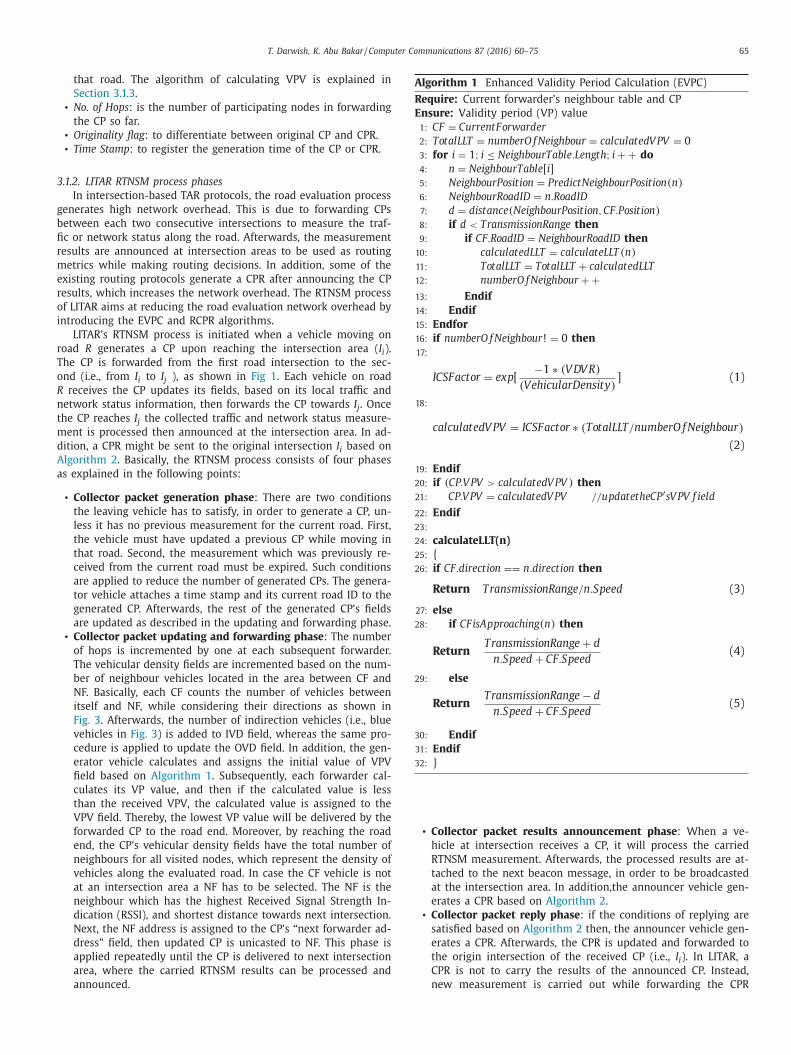
Fig. 4 summarizes in four different cases the vehicular density
nd VDVR effects on communication link stability. Obviously, inter-
ehicle communication links stability is inversely proportional to
DVR and directly proportional to vehicular density. Thus, the re-
ationship between ICS, vehicular density and VDVR can be formu-
ated by Eq. (6) , where C is a constant. To give a more specific
valuation for the communication link stability level, the values of
CS, which are in the range (0, ∞ ], are mapped to the range (0, 1]
hereas 1 indicates the highest stability and 0 is for totally unsta-
le links. For this purpose the exponential function in Equation (1)
s used, where the constant C is assigned the value of −1 .
CS =
C ∗ V ehicularDensity
V DV R
(6)
Fig. 5 , shows the graph of the ICS Factor as a function of ve-
icular density and VDVR based on Equation (1). Obviously, high
ehicular density with low VDVR represents the most stable
T. Darwish, K. Abu Bakar / Computer Communications 87 (2016) 60–75 67
Vehicular DensityVehicular Density Varia�on
Inter-vehicle link stability
High Low Highest
High High
Low Low
Low High Lowest
Fig. 4. Inter-vehicle communication stability in different traffic situation.
Fig. 5. Inter-vehicle communication stability function.
t
i
o
t
h
r
a
t
i
t
u
t
v
3
F
a
F
a
s
l
R
a
r
t
n
g
a
t
Intersec�on Ii Intersec�on Ij
Case 1:
Case 2:
Case 3:
No previous results received from Ii
if (CP.VPV ≥ CP.travelTime)Generate CPReply
Received previous results carried by a CPReply from Ii
No CPReply genera�on
Received previous results carried by a CP from Ii
if (CP.VPV ≥ CPfrequency −CP.travelTime)Generate CPReply
X
Announcer vehicle
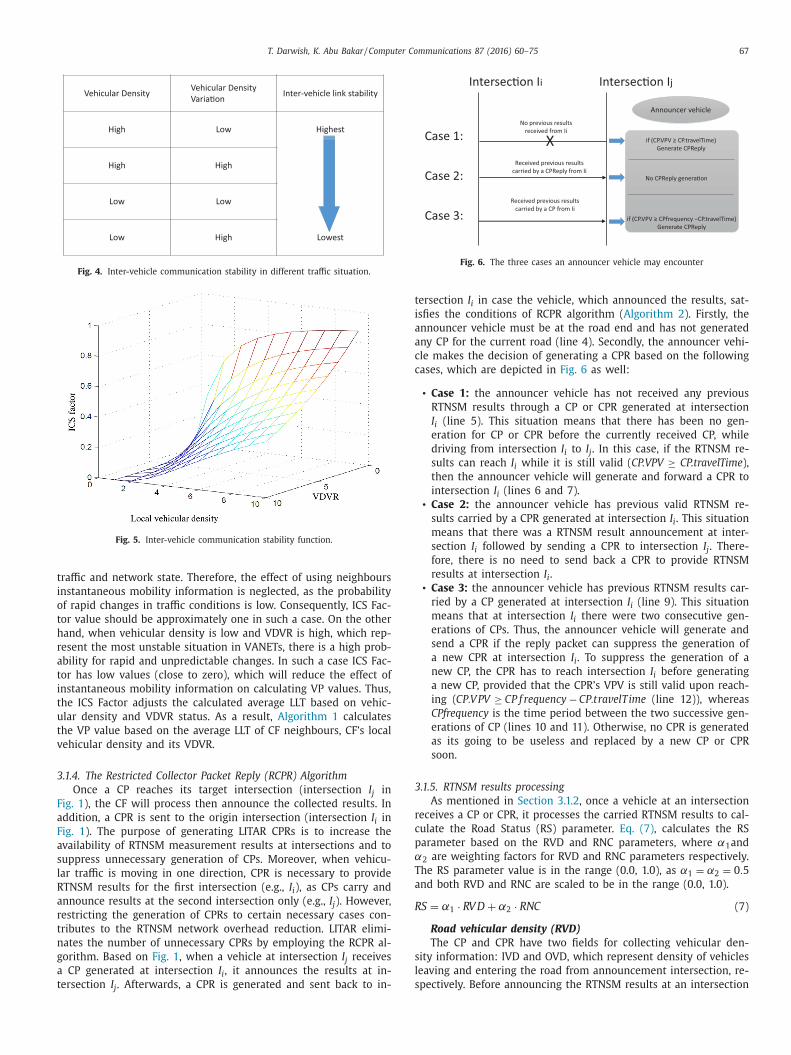
Fig. 6. The three cases an announcer vehicle may encounter
t
i
a
a
c
c
3
r
c
p
α
T
a
R
s
l
s
raffic and network state. Therefore, the effect of using neighbours
nstantaneous mobility information is neglected, as the probability
f rapid changes in traffic conditions is low. Consequently, ICS Fac-
or value should be approximately one in such a case. On the other
and, when vehicular density is low and VDVR is high, which rep-
esent the most unstable situation in VANETs, there is a high prob-
bility for rapid and unpredictable changes. In such a case ICS Fac-
or has low values (close to zero), which will reduce the effect of
nstantaneous mobility information on calculating VP values. Thus,
he ICS Factor adjusts the calculated average LLT based on vehic-
lar density and VDVR status. As a result, Algorithm 1 calculates
he VP value based on the average LLT of CF neighbours, CF’s local
ehicular density and its VDVR.
.1.4. The Restricted Collector Packet Reply (RCPR) Algorithm
Once a CP reaches its target intersection (intersection I j in
ig. 1 ), the CF will process then announce the collected results. In
ddition, a CPR is sent to the origin intersection (intersection I i in
ig. 1 ). The purpose of generating LITAR CPRs is to increase the
vailability of RTNSM measurement results at intersections and to
uppress unnecessary generation of CPs. Moreover, when vehicu-
ar traffic is moving in one direction, CPR is necessary to provide
TNSM results for the first intersection (e.g., I i ), as CPs carry and
nnounce results at the second intersection only (e.g., I j ). However,
estricting the generation of CPRs to certain necessary cases con-
ributes to the RTNSM network overhead reduction. LITAR elimi-
ates the number of unnecessary CPRs by employing the RCPR al-
orithm. Based on Fig. 1 , when a vehicle at intersection I j receives
CP generated at intersection I i , it announces the results at in-
ersection I j . Afterwards, a CPR is generated and sent back to in-
ersection I i in case the vehicle, which announced the results, sat-
sfies the conditions of RCPR algorithm ( Algorithm 2 ). Firstly, the
nnouncer vehicle must be at the road end and has not generated
ny CP for the current road (line 4). Secondly, the announcer vehi-
le makes the decision of generating a CPR based on the following
ases, which are depicted in Fig. 6 as well:
• Case 1: the announcer vehicle has not received any previous
RTNSM results through a CP or CPR generated at intersection
I i (line 5). This situation means that there has been no gen-
eration for CP or CPR before the currently received CP, while
driving from intersection I i to I j . In this case, if the RTNSM re-
sults can reach I i while it is still valid ( CP.VPV ≥ CP.travelTime ),
then the announcer vehicle will generate and forward a CPR to
intersection I i (lines 6 and 7).
• Case 2: the announcer vehicle has previous valid RTNSM re-
sults carried by a CPR generated at intersection I i . This situation
means that there was a RTNSM result announcement at inter-
section I i followed by sending a CPR to intersection I j . There-
fore, there is no need to send back a CPR to provide RTNSM
results at intersection I i .
• Case 3: the announcer vehicle has previous RTNSM results car-
ried by a CP generated at intersection I i (line 9). This situation
means that at intersection I i there were two consecutive gen-
erations of CPs. Thus, the announcer vehicle will generate and
send a CPR if the reply packet can suppress the generation of
a new CPR at intersection I i . To suppress the generation of a
new CP, the CPR has to reach intersection I i before generating
a new CP, provided that the CPR’s VPV is still valid upon reach-
ing ( C P.V P V ≥ C P f requency − CP.tra v elT ime (line 12)), whereas
CPfrequency is the time period between the two successive gen-
erations of CP (lines 10 and 11). Otherwise, no CPR is generated
as its going to be useless and replaced by a new CP or CPR
soon.
.1.5. RTNSM results processing
As mentioned in Section 3.1.2 , once a vehicle at an intersection
eceives a CP or CPR, it processes the carried RTNSM results to cal-
ulate the Road Status (RS) parameter. Eq. (7) , calculates the RS
arameter based on the RVD and RNC parameters, where α1 and
2 are weighting factors for RVD and RNC parameters respectively.
he RS parameter value is in the range (0.0, 1.0), as α1 = α2 = 0 . 5
nd both RVD and RNC are scaled to be in the range (0.0, 1.0).
S = α1 · RV D + α2 · RNC (7)
Road vehicular density (RVD)
The CP and CPR have two fields for collecting vehicular den-
ity information: IVD and OVD, which represent density of vehicles
eaving and entering the road from announcement intersection, re-
pectively. Before announcing the RTNSM results at an intersection

68 T. Darwish, K. Abu Bakar / Computer Communications 87 (2016) 60–75
e
c
p
i
p
e
t
l
p
[
a
d
c
i
P
n
w
R
W
p
o
(
t
p
t
r
t
r
4
a
D
t
i
a
s
s
u
i
T
t
w
o
S
s
a
t
i
t
e
b
o
1
i
area, the received values of density fields are utilized to calculate
the road’s RVD parameter using Eqs. (8), (9) .
Density score =
2 ∗ IV D + OV D
3 ∗ No. of Hops ∗ N con (8)
RV D =
{1 Density score > 1
Density score otherwise (9)
Forwarding packets through roads, which have higher vehicu-
lar density of vehicles moving in packet forwarding direction (i.e.
indirection vehicular density), results in higher delivery ratio and
lower packet delivery delay [23] . Therefore, higher weighting fac-
tor, equals to 2
3 is given to IVD , while OVD weighting factor is
1
3 .
Thus, Eq. (8) guarantees that roads with higher vehicular densities
in packet forwarding direction are given more density score than
roads with equal density but different direction. N con is a constant
that represents the ideal connectivity degree in a vehicle trans-
mission range [22] . In case the Density score is higher than required
density for full connectivity (i.e. 2 ∗ IV D + OV D ≥ 3 ∗ No. of Hops ∗N con ), the RVD parameter is scaled to 1, otherwise, RVD value is in
the range (0.0, 1.0) based on Eq. (9) .
Road network connectivity (RNC)
Road network connectivity is a metric which measures the sta-
tus of the communication between vehicles moving in the eval-
uated road. Vehicular density is an indication for the availability
of vehicles in a road. However, roads with high vehicular density
does not guarantee high packet delivery ratio. This is due to variant
vehicles distribution, limited communication LLT between vehicles
and high network load.
LITAR evaluates a road network connectivity by calculating how
many CP packets a vehicle can process and transmit ( Processed-
Packets ) before the traffic status in its neighbourhood changes. As
VPV is the time after which traffic status might change on the cor-
responding road, it is utilized in Eq. (11) , to calculate Processed-
Packets , where Delay hop is the processing and transmission delay
per hop. Afterwards, the number of ProcessedPackets is mapped
from the range (0, ∞ ) to the range (0, 1) based on Eq. (12) . Thus,
if RNC has a value close to one, then the evaluated road has high
connectivity. On the other hand, if RNC value is approaching zero,
then the road connectivity is poor.
Del ay hop =
tra v el T ime
No. of Hops (10)
P rocessedP ackets =
V P V
Delay hop
(11)
RNC = exp
( −1 . 0
P rocessedP ackets
)(12)
3.2. LITAR data packets routing
LITAR has two routing modes: road routing and intersection
routing. Road routing is for packet forwarding between intersec-
tions, whereas a next forwarder located in the same road as the
CF is selected. Although applying greedy-based forwarding reduces
the number of hops, it has higher packet loss ratio. In fact, the dis-
tance between the current and next forwarder is related inversely
to their communication link quality. In order to avoid losing data
packets due to low quality communication links, LITAR utilizes the
improved greedy forwarding [25] . The improved greedy forwarding
depends on two parameters to choose a next forwarder: progres-
sive distance to destination and RSSI.
Once a data packet reaches an intersection, LITAR switches to
intersection routing mode, in order to choose the best adjacent
road for data packets forwarding. First, a score is calculated for
ach adjacent road (except the previous road). A road’s score is cal-
ulated based on the announced road’s status ( RS parameter) and
rogressive distance towards destination ( PD ).
Progressive distance towards destination is an essential metric
n geographical routing. The PD metric measures how close a data
acket will be to destination, in case it is forwarded through the
valuated road. In other words, it measures the progress in dis-
ance that the evaluated road will contribute in the process of de-
ivering a data packet to destination. Thus, roads which make data
ackets closer to destination are given higher scores.
In LITAR, the PD parameter is calculated in the same way as in
24,25] using Eq. (13) , where Distance fromNext and Distance fromCurrent
re the distance from candidate intersection to destination, and
istance from current intersection to destination, respectively. The
andidate intersection is where the data packet will reach in case
t is forwarded through the evaluated road.
D = 1 . 0 − Distance f romNext
Distance f romCurrent
(13)
A road’s score is calculated, utilizing Eq. (14) , based on the an-
ounced road’s status ( RS parameter) and progressive distance to-
ards destination ( PD ).
oadScore = β1 · RS + β2 · P D (14)
here β1 and β2 are weighting factors for the two road evaluation
arameters. As the summation of all weighting factors must equal
ne, β1 = β2 = 0 . 5 . The calculated road score value is in the range
0.0, 1.0) as both PD and RS have values in the same range.
Based on the calculated score for each of the adjacent roads,
he road with the highest score is selected to forward the data
acket through. Afterwards, LITAR switches to road mode routing
o deliver the data packet to next intersection, where intersection
outing is executed again. Subsequently, LITAR continues routing
he data packet using road and intersection routing modes until it
eaches the destination vehicle.
. LITAR performance evaluation
In geographic routing each node can obtain its position by using
GPS device, which is available in most vehicles nowadays [37] .
estination vehicles’ position can be obtained by utilizing a loca-
ion service system such as HLS or GLS [38] . To provide mobility
nformation for direct neighbours (e.g. geographical position, speed
nd direction), vehicles exchange periodic beacon messages [4] .
To evaluate the performance of the proposed LITAR protocol,
imulation scenarios are created using OMNET++ [39] as a network
imulator and SUMO [40] for vehicular traffic simulation. The sim-
lation scenarios are applied on part of Manhattan city map (lat-
tude: 39.1912 to 39.1839 and longitude: −96 . 5737 to −96 . 5629 ).
he map data and structure is obtained from OpenStreetMap con-
ributions and used as an input for SUMO traffic simulation. After-
ards, map and traffic related information (e.g., road ID, number
f lanes, traffic direction and vehicles positions) is obtained from
UMO to be used in the network simulator OMNET++. The area of
imulation map is 20 0 0 m × 20 0 0 m with 84 bidirectional roads
nd 49 intersections. In addition, the real traffic regulations (e.g.,
raffic lights, speed limits and traffic priorities), which are applied
n that part of Manhattan city, are also considered in the vehicular
raffic simulation.
Table 1 demonstrates the simulation parameters utilized to
valuate LITAR performance. The parameters values are assigned
ased on the values used in [23,25] . The simulation was carried
ut in high density (40-50 vehicle/km/lane), average density (13–
6 vehicle/km/lane) and low density (6–8 vehicle/km/lane) scenar-
os. The maximum vehicle speed is 60 km/h, however, speed drops

T. Darwish, K. Abu Bakar / Computer Communications 87 (2016) 60–75 69
0.0%
2.0%
4.0%
6.0%
8.0%
10.0%
12.0%
14.0%
16.0%
18.0%
High density Averagedensity
Low density
MV
D a
vera
ge e
rror
ra�
o
Vehicular density
LITAR RTNSM-1
LITAR RTNSM-2
ICAR (MP)
EGyTAR (MP)
Fig. 7. MVD average error ratio for LITAR, ICAR and EGyTAR.
Table 1
Simulation parameters.
Parameters Value
Simulation time 400 s
Simulation area 20 0 0 m × 20 0 0 m
Mobility model car following model
Vehicular Density high density (40-50 vehicle/km/lane), average
density (13–16 vehicle/km/lane), low density
(6–8 vehicle/km/lane)
Maximum vehicle speed 60 km/h
Transmission range 300 m
Data packet size 512 bytes
Channel bandwidth 18 Mbps
MAC protocol IEEE 802 .11p
Beacon interval 1 s
Data packet sending rate 0.1 s
Data traffic model 1-16 CBR connections
N con 12
t
t
[
m
t
i
(
h
t
fi
t
l
4
t
s
a
i
H
C
f
o
o
4
e
s
i
p
t
I
i
T
a
c
a
1
M
b
r
l
C
d
L
i
R
o
m
t
m
r
L
c
g
u
c
t
m
i
4
t
t
l
w
o zero when vehicles are stopping for traffic lights regulations or
o give priority to other vehicles to cross intersections.
For the purpose of benchmarking iCAR [25] and EGyTAR
23] protocols are simulated in the same simulation environ-
ent as LITAR. The performance evaluation of LITAR is conducted
hrough two main stages. First, the RTNSM process performance
s evaluated based on two metrics: Measured Vehicular Density
MVD) average error ratio and the generated communication over-
ead. Second, the routing protocol performance is evaluated in
erms of packet delivery ratio and packet delivery delay. The con-
dence intervals are calculated based on the values of 10 simula-
ion repetitions and included in all graphs, whereas 95% confidence
evel is considered.
.1. LITAR’s RTNSM process performance evaluation
The impact of applying EVPC algorithm (i.e., LITAR RTNSM-1) on
he RTNSM process performance is discussed in the following sub-
ections. In addition, the effect of applying both EVPC and RCPR
lgorithms (i.e., LITAR RTNSM-2) is studied as well. The evaluation
s carried out in the simulation environment described previously.
owever, in this stage of evaluation, vehicles generate and forward
Ps and CPRs only, no data packets are sent between vehicles. The
ollowing two sub-sections evaluate the RTNSM process in terms
f the MVD average error ratio and the generated communication
verhead.
.1.1. Measured vehicular density average error ratio
The purpose of calculating the MVD average error ratio is to
valuate the accuracy of the RTNSM process. In other words, it
hows to which level the RTNSM process is reflecting and detect-
ng changes in vehicular traffic status. Therefore, the MVD is com-
ared to the real vehicular density, which is calculated by counting
he number of vehicles available in each road within the map area.
n the carried simulation, every time a vehicle is leaving or enter-
ng a road the real vehicular density and MVD values are recorded.
he MVD is the summation of the vehicular density measurement
nnounced at intersections. Afterwards, the average error ratio is
alculated based on the recorded results of real vehicular density
nd MVD.
Fig. 7 , presents the MVD average error ratio for LITAR RTNSM-
, LITAR RTNSM-2, iCAR Measurement Process (MP) and EGyTAR
P, in high, average and low vehicular density scenarios. It can
e observed that LITAR RTNSM-2 has the lowest MVD average er-
or ratio, which equals to 3.7%, 4.3% and 7.2% in high, average and
ow scenarios, respectively. This is because LITAR generates CPs and
PRs based on road status changes and its CPRs provide more up-
ated measurements at the origin intersection. On the other hand,
ITAR RTNSM-1 has higher average error ratios (3.9% in high, 4.7%
n average and 7.5% in low density scenarios) compared to LITAR
TNSM-2, this is due to the absence of CPRs and depending only
n original CPs to provide RTNSM results at intersections.
In general, MVD average error ratio of iCAR, EGyTAR and LITAR
easurement processes increases in sparse scenario, this is due
o the high variation rates in vehicular density and network inter-
ittent connectivity. However, LITAR has lower MVD average error
atio than iCAR and EGyTAR in all three scenarios. In particular,
ITAR has lower error ratio as CPs generation is more adapted to
hanges in vehicular traffic status through utilizing the EVPC al-
orithm. In addition, employing the RCPR reduces the number of
nnecessary CPRs, which results in lower network load and less
ommunication interference. In fact, as traffic aware routing pro-
ocols depend on beacon messages to collect neighbourhood infor-
ation, less interference results in more accurate neighbourhood
nformation collection.
.1.2. Communication overhead
As mentioned previously, the purpose of LITAR is to enhance
raffic aware routing by reducing the RTNSM process communica-
ion overhead. In fact, reduction in measurement process overhead
eads to reduction in network load and transmission interference,
hich results in higher data delivery ratio with less delivery delay.

70 T. Darwish, K. Abu Bakar / Computer Communications 87 (2016) 60–75
0
500
1000
1500
2000
2500
3000
3500
4000
Original Reply Original Reply Original Reply
High density Average density low density
Com
mun
icat
ion
over
head
(pa
cket
s)
Vehicular Density
LITAR RTNSM-1
LITAR RTNSM-2
ICAR (MP)
EGyTAR (MP)
Fig. 8. Communication overhead for LITAR, iCAR and EGyTAR
80
82
84
86
88
90
92
94
96
98
100
2 4 6 8 10 12 14 16
Pack
et d
eliv
ery
ra�
o (%
)
CBR Connec�ons
LITAR
ICAR
EGyTAR
Fig. 9. PDR for different number of CBR connections in average vehicular density.
o
t
a
c
4
i
t
m
c
c
p
i
s
s
a
4
c
n
c
c
t
E
H
L
p
i
Communication overhead is measured by counting the number of
CPs and CPRs generated while applying the RTNSM process.
Fig. 8 , describes how LITAR RTNSM-1 and LITAR RTNSM-2 con-
tributed significantly to the reduction of measurement process
communication overhead. Although RTNSM-1 does not implement
a CP reply mechanism, it generates 1435, 1983 and 2112 CPs in
high, average and low vehicular density scenarios, respectively.
However, generating CPRs is important in order to guarantee the
availability of results at both road’s ends. Accordingly, RTNSM-2
employs the RCPR which generates CPRs in certain cases and sup-
presses CPs generation. Obviously, RTNSM-2 reduces the number
of CPs to 1356, 1846 and 1724 while generating 326, 386 and 464
CPRs in high, average and low density scenarios respectively.
For the purpose of benchmarking, RTNSM-1 is compared to
EGyTAR MP as both processes do not employ a reply mechanism.
Based on Fig. 8 , it can be observed that RTNSM-1 has significant
reduction in communication overhead in comparison with EGyTAR
MP, which reaches 36.7% and 41.45% in high and average density
scenarios. However, the reduction in communication overhead is
less (12.97%) in case of sparse scenario. This is because RTNSM-1
generates more CPs in sparse scenarios than in dense scenarios, in
order to reduce MVD average error ratio.
On the other hand, RTNSM-2 is compared to iCAR MP, in or-
der to evaluate the communication overhead while utilizing re-
ply mechanisms. Fig. 8 shows the number of original CPs and
CPRs, generated by RTNSM-2 and iCAR MP, in the three consid-
ered scenarios. RTNSM-2 generates 51.3%, 35.65% less original CPs
and 88.3%, 86.54% less CPRs in high and average density sce-
nario, which contributes to 69.8% and 61.10% reduction in the to-
tal communication overhead. For the sparse scenario, RTNSM-2 re-
duces the communication overhead by 58.84%, which is a result
Lf 35.51% and 82.54% reduction in original CPs and CPRs, respec-
ively. Obviously, the RCPR algorithm implemented in RTNSM-2 has
tremendous effect on reducing measurement process communi-
ation overhead.
.2. LITAR data packet routing performance evaluation
LITAR data packet routing process is evaluated in this section
n terms of Packet Delivery Delay (PDD) and Packet Delivery Ra-
io (PDR). The evaluation is carried out in the simulation environ-
ent described previously. In this evaluation, LITAR RTNSM pro-
ess employs both EVPC and RCPR algorithms. The impact of in-
reasing the number of Constant Bit Rate (CBR) connections on the
erformance of LITAR, EGYTAR and iCAR is studied in the follow-
ng sub-sections, whereas high, average and low vehicular density
cenarios are considered. A CBR connection is established when a
ource vehicle starts sending data packets (in constant bit rate) to
destination vehicle through multi-hop communication.
.2.1. Packet delivery ratio
Fig. 9 , illustrates the packet delivery ratio of the three proto-
ols, where various number of CBR connections (i.e., 2–16 CBR con-
ections) in average vehicular density scenario are considered. It
an be observed that LITAR has the highest packet delivery ratio
ompared to iCAR and EGyTAR. More precisely, for 2 CBR connec-
ions LITAR delivered 99.3% percent of sent packets, while iCAR and
GyTAR achieved 98.2% and 97% packet delivery ratio, respectively.
owever, when the number of CBR connections increased to 16,
ITAR packet delivery ratio decreased slightly to 96.8%. In contrast,
acket delivery ratio of 16 CBR connections dropped sharply for
CAR and EGyTAR to reach 86.7% and 83.52%, respectively. Thus,
ITAR has achieved 11.6% and 15.9% higher packet delivery ratio,

T. Darwish, K. Abu Bakar / Computer Communications 87 (2016) 60–75 71
60
65
70
75
80
85
90
95
100
2 4 6 8 10 12 14 16
Pack
et d
eliv
ery
ra�
o (%
)
CBR Connec�ons
LITAR
ICAR
EGyTAR
Fig. 10. PDR for different number of CBR connections in high vehicular density.
75
80
85
90
95
100
2 4 6 8 10 12 14 16
Pack
et d
eliv
ery
ra�
o (%
)
CBR Connec�ons
LITAR
ICAR
EGyTAR
Fig. 11. PDR for different number of CBR connections in low vehicular density.
c
t
d
i
C
c
c
h
T
p
a
i
r
C
6
3
i
n
a
p
i
p
e
s
R
f
o
p
p
w
c
w
d
a
f
C
b
c
4
e
p
d
F
h
c
f
ompared to iCAR and EGyTAR, in the case of 16 CBR connec-
ions in average vehicular density scenario. This is due to the re-
uction of LITAR’s RTNSM process communication overhead, which
s achieved by eliminating the generation of unnecessary CPs and
PRs.
Fig. 10 , depicts the packet delivery ratio of the three proto-
ols, while varying number of CBR connections (i.e., 2 to 16 CBR
onnections) in high vehicular density scenario. Obviously, LITAR
as the highest packet delivery ratio compared to iCAR and EGy-
AR. More precisely, for 2 CBR connections LITAR delivered 97.0%
ercent of sent packets, while iCAR and EGyTAR achieved 94.6%
nd 90.5% packet delivery ratio, respectively. However, by increas-
ng the number of CBR connections to 16, LITAR packet delivery
atio decreased to 86.8%. In contrast, packet delivery ratio of 16
BR connections dropped sharply for iCAR and EGyTAR to reach
9.6% and 65.3%, respectively. Thus, LITAR has achieved 24.7% and
2.9% higher packet delivery ratio, compared to iCAR and EGyTAR,
n the case of 16 CBR connections in high vehicular density sce-
ario. It is clear that eliminating the generation of unnecessary CPs
nd CPRs, contributed to significant reductions of LITAR’s RTNSM
rocess communication overhead. Due to the effect of high signal
nterference that results in collisions and packet losses, the three
rotocols have lower performance in high density compared to av-
rage density scenario. However, LITAR was less affected by the
ignal interference and contention on transmission channels, as its
TNSM process reduces the routing overhead.
sFor the low vehicular density scenario, Fig. 11 describes the per-
ormance of LITAR, iCAR and EGyTAR while increasing the number
f CBR connections from 2 to 16. Obviously, LITAR has the highest
acket delivery ratio in all cases compared to iCAR and EGyTAR. In
articular, LITAR achieved 95.6% in the case of 2 CBR connections,
hereas a PDR of 92.3% is achieved when 16 CBR connections are
onsidered. On the other hand, the graphs of iCAR and EGyTAR,
hich started at 90.0% and 91.9% of PDR for 2 CBR connections,
ropped incrementally to reach a PDR of 80.7% and 79.1% for iCAR
nd EGyTAR, respectively. From Fig, 11 , it is clear that LITAR per-
orms better than iCAR and EGyTAR specially in high number of
BR connections. Precisely, LITAR achieved a PDR which is higher
y 14.37% compared to iCAR and 20.8% compared to EGyTAR, while
onsidering 16 CBR connections.
.2.2. Packet delivery delay
Packet delivery delay is an evaluation metric which shows the
ffect of LITAR on the average end-to-end delay for delivering a
acket from source to destination. The values of packet delivery
elay for LITAR, iCAR and EGyTAR are presented in the graphs of
igs. 12–14 , as a function of CBR connections number.
For the average vehicular density scenario, LITAR PDD is slightly
igher than iCAR and EGyTAR specially for low number of CBR
onnections, as depicted in Fig. 12 . More precisely, PDD of LITAR
or 2 CBR connections is 0.028 seconds, while iCAR and EGyTAR
tarted with 0.035 and 0.025, respectively. Afterwards, LITAR PDD

72 T. Darwish, K. Abu Bakar / Computer Communications 87 (2016) 60–75
0.02
0.03
0.04
0.05
0.06
0.07
0.08
0.09
0.1
2 4 6 8 10 12 14 16
Pack
et d
eliv
ery
dela
y (s
ec)
CBR connec�ons
LITAR
ICAR
EGyTAR
Fig. 12. PDD for different number of CBR connections in average vehicular density.
0
0.1
0.2
0.3
0.4
0.5
0.6
2 4 6 8 10 12 14 16
Pack
et d
eliv
ery
dela
y (s
ec)
CBR Connec�ons
LITAR
ICAR
EGyTAR
Fig. 13. PDD for different number of CBR connections in high vehicular density.
0
0.02
0.04
0.06
0.08
0.1
0.12
0.14
2 4 6 8 10 12 14 16
Pack
et d
eliv
ery
dela
y (s
ec)
CBR Connec�ons
LITAR
ICAR
EGyTAR
Fig. 14. PDD for different number of CBR connections in low vehicular density.
f
a
s
d
n
increases to 0.056 seconds for 8 CBR connections, where iCAR and
EGyTAR has a higher PDD equals to 0.069 and 0.065 seconds, con-
secutively. However, for higher number of CBR (i.e., 14 and 16 CBR
connections), the effect of the high network overhead generated
by iCAR and EGyTAR becomes more clear and results in high PDD
with low PDR. On the other hand, LITAR PDD does not grow fast
or high number of CBR connections as its RTNSM process gener-
tes less network overhead. In particular, LITAR PDD reached 0.077
econds for 16 CBR. In contrast, iCAR and EGyTAR PDD increased
ramatically to reach 0.089 and 0.095 seconds.
In the high vehicular density scenario, LITAR PDD achieved sig-
ificant decrements compared to iCAR and EGyTAR specially for
T. Darwish, K. Abu Bakar / Computer Communications 87 (2016) 60–75 73
h
c
i
e
t
E
w
n
p
r
i
t
d
i
T
c
s
c
w
t
s
u
R
h
p
n
R
a
p
5
i
s
e
n
r
w
t
e
e
s
l
o
n
t
p
c
t
e
m
L
fi
A
t
w
c
o
R
[
[
[
[
[
[
[
[
igh number of CBR connections, as depicted in Fig. 13 . More pre-
isely, PDD of LITAR for 2 CBR connections is 0.04 seconds, while
CAR and EGyTAR started with 0.012 and 0.10, respectively. How-
ver, for higher number of CBR (i.e., 14 and 16 CBR connections),
he effect of the high network overhead generated by iCAR and
GyTAR becomes more clear and increases the PDD dramatically
hile providing low PDR. On the other hand, LITAR PDD does
ot grow fast for high number of CBR connections as its RTNSM
rocess generates less network overhead. In particular, LITAR PDD
eached 0.12 seconds for 16 CBR. In contrast, iCAR and EGyTAR PDD
ncreased dramatically to reach 0.39 and 0.48 seconds. This is due
o the high contention on transmission channels that causes high
elays while sending packets.
As can be observed from Fig. 14 , LITAR has slightly higher PDD,
n the low vehicular density scenario, compared to ICAR and EGy-
AR. In more details, LITAR PDD reached 0.12 seconds for 16 CBR
onnections, while ICAR and EGyTAR PDD values are below 0.0.067
econds. This is because LITAR tends to choose roads with higher
onnectivity to deliver data packets, even though the distance to-
ards destination might be longer and consumes a longer delivery
ime. Accordingly, the slightly higher delivery delay of LITAR re-
ults in higher packet delivery ratio as show in Fig. 11 .
Obviously, employing the EVPC algorithm, which eliminates the
nnecessary generation of CPs while maintaining the accuracy of
TNSM results, has contributed to the reduction of network over-
ead. In addition, reducing the number of unnecessary CPRs by ap-
lying the RCPR algorithm, leads to magnificent reduction in the
etwork traffic generated through CPRs. Accordingly, the enhanced
TNSM process of LITAR, which combined both EVPC and RCPR has
significant impact on improving the routing performance of TAR
rotocols.
. Conclusions
Intersection-based Traffic aware routing protocols have the abil-
ty to adapt to VANETs dynamic environment, as routing deci-
ions are made based on traffic and network conditions. However,
mploying a real-time measurement process for the traffic and
etwork status generates high network overhead, which degrades
outing protocol performance.
LITAR protocol introduced two algorithms for reducing the net-
ork overhead generated by the real-time traffic and network sta-
us measurement process. The first algorithm (EVPC algorithm)
liminated the number of unnecessary generated collector pack-
ts, which are used by the real-time measurement process. The
econd algorithm (RCPR algorithm) restricted the number of col-
ector packet replies. In addition, LITAR route data packets based
n three metrics; directional vehicular density, road network con-
ectivity and distance towards destination. Simulation results show
hat LITAR performs better than iCAR and EGyTAR in terms of
acket delivery ratio, end-to-end delay, real-time measurement ac-
uracy and routing overhead. Accordingly, LITAR should be able
o provide stable and efficient V2V communication in urban
nvironment.
For future work LITAR will be tested on more complicated city
aps. In addition, a research will be carried out to investigate how
ITAR can be utilized to provide V2I communication based on traf-
c conditions.
cknowledgement
This research was financially supported by Malaysian Interna-
ional Scholarship (MIS), Ministry of Education (MOE). In addition,
e gratefully acknowledge the technical support and research fa-
ilities provided by the Universiti Teknologi Malaysia (UTM), with-
ut which this work could not have been completed.
eferences
[1] G. Yan , S. Olariu , A probabilistic analysis of link duration in vehicular ad hoc
networks, IEEE Trans. Intell. Trans. Syst. . 12 (4) (2011) 1227–1236 .
[2] Y. Zhang, C. Tan, F. Xu, H. Han, Q. Li, Vproof: lightweight privacy-preservingvehicle location proofs, IEEE Trans. Veh. Tech. 64 (1) (2015) 378–385, doi: 10.
1109/TVT.2014.2321666 . [3] R. Du, C. Chen, B. Yang, N. Lu, X. Guan, X. Shen, Effective urban traffic monitor-
ing by vehicular sensor networks, IEEE Trans. Veh. Techn. 64 (1) (2015) 273–286, doi: 10.1109/TVT.2014.2321010 .
[4] S. Zeadally , R. Hunt , Y.-S. Chen , A. Irwin , A. Hassan , Vehicular ad hoc net-
works (vanets): status, results, and challenges, Telecommun. Syst. 50 (4) (2012)217–241 .
[5] F. Malandrino, C. Casetti, C.-F. Chiasserini, C. Sommer, F. Dressler, The role ofparked cars in content downloading for vehicular networks, IEEE Trans. Veh.
Tech. 63 (9) (2014) 4606–4617, doi: 10.1109/TVT.2014.2316645 . [6] Y.-A. Daraghmi , C.-W. Yi , I. Stojmenovic , Forwarding methods in data dissemi-
nation and routing protocols for vehicular ad hoc networks, IEEE Netw. 27 (6)(2013) 74–79 .
[7] S.M. Bilal , C.J. Bernardos , C. Guerrero , Position-based routing in vehicular net-
works: a survey, J. Netw. Comput. Appl. 36 (2) (2013) 685–697 . [8] B. Karp , H.-T. Kung , Gpsr: greedy perimeter stateless routing for wireless net-
works, in: Proceedings of the 6th annual international conference on Mobilecomputing and networking, ACM, 20 0 0, pp. 243–254 .
[9] K. Shafiee, V.C.M. Leung, Connectivity-aware minimum-delay geographic rout-ing with vehicle tracking in vanets, Ad Hoc Netw. 9 (2) (2011) 131–141,
doi: 10.1016/j.adhoc.2010.06.003 .
[10] T. Darwish , K.A. Bakar , Traffic aware routing in vehicular ad hoc networks:characteristics and challenges, Telecommun. Syst. (2015) 1–25 .
[11] T. Darwish , K.A. Bakar , Traffic density estimation in vehicular ad hoc networks:a review, Ad Hoc Netw. 24 (2015) 337–351 .
[12] A. Fonseca , T. Vazão , Applicability of position-based routing for vanet in high-ways and urban environment, J. Netw. Comput. Appl. 36 (3) (2013) 961–973 .
[13] F. Malandrino, C. Casetti, C. Chiasserini, M. Fiore, Optimal content downloading
in vehicular networks, Mobile Computing, IEEE Transactions on 12 (7) (2013)1377–1391, doi: 10.1109/TMC.2012.115 .
[14] A. Benslimane , S. Barghi , C. Assi , An efficient routing protocol for connectingvehicular networks to the internet, Pervasive Mob Comput 7 (1) (2011) 98–113 .
[15] J. Zheng , Y. Wu , Z. Xu , X. Lin , A reliable routing protocol based on QoS forvanet, in: Advanced Infocomm Technology (ICAIT), 2014 IEEE 7th International
Conference on, IEEE, 2014, pp. 21–28 .
[16] Z. Amjad , W.-C. Song , Road aware QoS routing in vanets, in: Network Oper-ations and Management Symposium (APNOMS), 2015 17th Asia-Pacific, IEEE,
2015, pp. 133–138 . [17] R. Oliveira , M. Luísa , A. Furtadoa , L. Bernardoa , R. Dinisa , P. Pintoa , Improving
path duration in high mobility vehicular ad hoc networks, Ad Hoc Netw. 11 (1)(2013) 89–103 .
[18] H. Hashemi, S. Khorsandi, Load balanced vanet routing in city environments,
in: Vehicular Technology Conference (VTC Spring), 2012 IEEE 75th, 2012, pp. 1–6, doi: 10.1109/VETECS.2012.6240114 .
[19] T. Cao, X. Zhang, L. Kong, X.-Y. Liu, W. Shu, M.-Y. Wu, Traffic aware routingin Urban vehicular networks, in: Wireless Communications and Networking
Conference (WCNC), 2013 IEEE, 2013, pp. 20 04–20 09, doi: 10.1109/WCNC.2013.6554872 .
20] Y. Xiang, Z. Liu, R. Liu, W. Sun, W. Wang, Geosvr: a map-based stateless vanet
routing, Ad Hoc Networks 11 (7) (2013) 2125–2135, doi: 10.1016/j.adhoc.2012.02.015 . http://www.sciencedirect.com/science/article/pii/S15708705120 0 0455 .
[21] R. Stanica , E. Chaput , A.-L. Beylot , Local density estimation for contention win-dow adaptation in vehicular networks, in: Personal Indoor and Mobile Radio
Communications (PIMRC), 2011 IEEE 22nd International Symposium on, IEEE,2011, pp. 730–734 .
22] M. Jerbi, S.-M. Senouci, T. Rasheed, Y. Ghamri-Doudane, Towards efficient ge-ographic routing in Urban vehicular networks, IEEE Trans. Veh. Tech. 58 (9)
(2009) 5048–5059, doi: 10.1109/TVT.2009.2024341 .
23] S. Bilal , S.A. Madani , I.A. Khan , Enhanced junction selection mechanism forrouting protocol in vanets., Int. Arab J. Inf. Technol. 8 (4) (2011) 422–429 .
24] I.A. Abbasi , B. Nazir , A. Abbasi , S.M. Bilal , S.A. Madani , A traffic flow-orientedrouting protocol for vanets, EURASIP J. Wireless Commun. Netw. 2014 (1)
(2014) 1–14 . 25] N. Alsharif, S. Cespedes, X. Shen, ICAR: intersection-based connectivity aware
routing in vehicular ad hoc networks, in: Communications (ICC), 2013 IEEE In-
ternational Conference on, 2013, pp. 1736–1741, doi: 10.1109/ICC.2013.6654769 . 26] N. Alsharif, X. Shen, ICARII: intersection-based connectivity aware routing in
vehicular networks, in: Communications (ICC), 2014 IEEE International Confer-ence on, 2014, pp. 2731–2735, doi: 10.1109/ICC.2014.6883737 .
[27] C. Zhao, C. Li, L. Zhu, H. Lin, J. Li, A vehicle density and load aware routingprotocol for vanets in city scenarios, in: Wireless Communications Signal Pro-
cessing (WCSP), 2012 International Conference on, 2012, pp. 1–6, doi: 10.1109/
WCSP.2012.6542825 . 28] Y. He , C. Li , X. Han , Q. Lin , A link state aware hierarchical road routing proto-
col for 3d scenario in vanets, in: R.-H. Hsu, S. Wang (Eds.), Internet of Vehi-cles—Technologies and Services, Lecture Notes in Computer Science, vol. 8662,
Springer International Publishing, 2014, pp. 11–20 . 29] T. Acarman, C. Yaman, Y. Peksen, A. Peker, Intersection based routing in Urban
vanets, in: Intelligent Transportation Systems (ITSC), 2015 IEEE 18th Interna-
tional Conference on, 2015, pp. 1087–1092, doi: 10.1109/ITSC.2015.180 .

74 T. Darwish, K. Abu Bakar / Computer Communications 87 (2016) 60–75
[
[
[
[30] J.-W. Lee , C.-C. Lo , S.-P. Tang , M.-F. Horng , Y.-H. Kuo , A hybrid traffic geographicrouting with cooperative traffic information collection scheme in vanet, in:
Advanced Communication Technology (ICACT), 2011 13th International Confer-ence on, IEEE, 2011, pp. 1496–1501 .
[31] C.-C. Lo , Y.-H. Kuo , Junction-based traffic-aware routing scheme for vehic-ular ad hoc networks, in: Personal Indoor and Mobile Radio Communi-
cations (PIMRC), 2013 IEEE 24th International Symposium on, IEEE, 2013,pp. 30 01–30 05 .
[32] H. Qin , C. Yu , L. Guo , Y. Zhou , Adaptive state aware routing protocol for vehicle
ad hoc network in Urban scenarios, in: Control and Automation (ICCA), 201310th IEEE International Conference on, IEEE, 2013, pp. 1376–1381 .
[33] C.-C. Lo, Y.-H. Kuo, Traffic-aware data delivery strategy for vehicular ad hocnetworks, in: Advanced Communication Technology (ICACT), 2015 17th Inter-
national Conference on, 2015, pp. 18–22, doi: 10.1109/ICACT.2015.7224750 . [34] H. Saleet, O. Basir, R. Langar, R. Boutaba, Region-based location-service-
management protocol for vanets, IEEE Trans. Veh. Technol. 59 (2) (2010) 917–
931, doi: 10.1109/TVT.2009.2033079 .
[35] M. Hadded , P. Muhlethaler , R. Zagrouba , A. Laouiti , L.A. Saidane , Using road IDSto enhance clustering in vehicular ad hoc networks, in: Wireless Communi-
cations and Mobile Computing Conference (IWCMC), 2015 International, IEEE,2015, pp. 285–290 .
36] T. Taleb , E. Sakhaee , A. Jamalipour , K. Hashimoto , N. Kato , Y. Nemoto , A stablerouting protocol to support its services in vanet networks, IEEE Trans. Veh.
Tech. 56 (6) (2007) 3337–3347 . [37] K. Katsaros, M. Dianati, R. Tafazolli, R. Kernchen, Clwpr a novel cross-layer op-
timized position based routing protocol for vanets, in: Vehicular Networking
Conference (VNC), 2011 IEEE, 2011, pp. 139–146, doi: 10.1109/VNC.2011.6117135 .38] M. Ayaida, H. Fouchal, L. Afilal, Y. Ghamri-Doudane, A comparison of reactive,
grid and hierarchical location-based services for vanets, in: Vehicular Technol-ogy Conference (VTC Fall), 2012 IEEE, 2012, pp. 1–5, doi: 10.1109/VTCFall.2012.
6398920 . 39] A. Varga, Omnet++, 2009, URL: http://www.omnetpp.org/
[40] D. Krajzewicz, J. Erdmann, M. Behrisch, L. Bieker, Recent development and ap-
plications of SUMO - Simulation of Urban MObility, Inter. J. Adv. Syst. Measure.5 (3&4) (2012) 128–138 . URL: http://elib.dlr.de/80483/ .

T. Darwish, K. Abu Bakar / Computer Communications 87 (2016) 60–75 75
Computing, Universiti Teknologi Malaysia, Malaysia. She is a member of the Pervasive
in computer engineering from Islamic University of Gazah in 2005 and M.Sc. degree in of Glasgow, United Kingdom, in 2007. From 2008 to 2013 she was working as a research
ing, University of Palestine. Her current research focuses on vehicular communications,
cience at Universiti Teknologi Malaysia (UTM), Malaysia, and member of the Pervasive
computer science from the University of Technology Malaysia, Malaysia, in 1996, M.Sc. eeds Metropolitan University, United Kingdom, in 1998, and his Ph.D. degree in computer
is research interest includes mobile and wireless computing, ad hoc and sensor networks, er of ACM and International Association of Engineering. He involves in many research
conferences.
Tasneem Darwish is a Ph.D. student at the Faculty of
Computing research group. She received her B.Sc. degreeelectronics and electrical engineering from the University
and lecturer assistant at the Faculty of applied engineer
wireless ad hoc networks, and mobile computing.
Kamalrulnizam Abu Bakar is a professor in Computer S
Computing research group. He received his B.Sc. degree indegree in computer communications and Networks, from L
science from Aston University, United Kingdom, in 2004. Hinformation security and grid computing. He is a memb
projects and is a referee for several scientific journals and