lights out in 2009? - us department of energy out in 2009? ... the major barriers to keeping the...
TRANSCRIPT

Lights Out In 2009?
A Critical Analysis of
� The Threat of Major Blackouts Facing the U.S.
� What Is Needed To Maintain Grid Reliability Through 2016
� The Major Barriers To Keeping The Lights On
Conducted by The NextGen Energy Council
Management Information Services, Inc. September 2008
Northeast U.S. Blackout2003
60 Million Citizensin the dark, $6B-$10B in economic losses, multiple deaths.

2
Preface 3 Executive Summary 4 Introduction 6 The Grid is in Trouble 7 Generation Barriers 17 Transmission Barriers 21 Political Barriers 24 Cost of Blackouts 26 Findings 29 Conclusions 30 End Notes 32 Appendix 34
Study conducted by: Management Information Services, Inc. NextGen Energy Council Available On the Web: www.nextgenenergy.org
Contents
Lights Out In 2009?

3
A September 2008 story by Mark Williams of the Associated Press,
entitled, "U.S. on Verge of Grand-Scale Blackout," did not get a great deal of attention from policymakers, the news media or the public.1 It should have. It began this way:
“Five years after the worst blackout in North American history, the country’s largest utilities say the U.S. power system faces the prospect of even bigger and more damaging outages. The specific flaws that led to 50 million people losing power in 2003 have largely been addressed, they say, but even bigger problems loom.”
The experts interviewed by Williams all agreed that, if left unchecked, the “bigger problems” looming could well compromise the fundamental integrity of the nation’s electricity grids.
“I’m really not a ‘Chicken Little’ player, but I worry that no one seems to be focusing in on [the threat of another major blackout],” said Michael Morris, Chairman, President and Chief Executive of American Electric Power, which runs the nation’s largest electricity transmission system. “The level of excess capacity has shrunk … to a level barely within
the planning toleration of the industry,” said Marc Chupka, with the Brattle Group, an energy consultant. Rick Sergel, President of the North American Electric Reliability Corp., the agency that oversees the nation’s power grid, said, “We’re to the point where we need every possible resource: renewables, demand response and energy efficiency, nuclear, clean coal — you name it, we need it. And we especially need the transmission lines that will bring the power generated by these new resources to consumers.”
The threat to the U.S. electricity grid — a threat that goes to the heart of social stability, economic security and national security — is real and imminent. Yet few national and state elected officials seem aware of it. We hope this report will begin to change that.
Bob Hanfling Chair
NextGen Energy Council September 2008
Preface
Lights Out In 2009?

4
��The U.S. faces potentially crippling electricity brownouts and blackouts beginning in the summer of 2009, which may cost tens of billions of dollars and threaten lives. Unless major investments are made immediately in both electricity generation (power plants) and transmission (power lines), the threat of service interruptions will increase.
��If vulnerable regions, such as the Western U.S., experience unusually hot temperatures for prolonged periods of time in 2009, the potential for local brownouts or blackouts is high, with significant risk that local disruptions could cascade into regional outages that could cost the economy tens of billions of dollars.
��U.S. baseload generation capacity reserve margins have declined precipitously to 17 percent in 2007,
from 30-40 percent in the early 1990s. A 12-15 percent capacity reserve margin is the minimum required to ensure reliability and stability of the nation’s electricity system.
��Compounding this capacity deficiency, the projected U.S. demand in the next ten years is forecast to grow by 18 percent, far exceeding the projected eight percent growth in baseload generation capacity between now and 2016.
��In total, the U.S. will require about 120 gigawatts (GW) of new generation just to maintain a 15 percent reserve margin.
��Using data from the North American Electric Reliability Corporation (NERC), we estimate that the U.S. will require more than 14,500 miles of new electricity transmission lines by 2016.
Executive Summary
T his report draws from the latest available information compiled by the nation’s leading experts on the status of the U.S. electricity grid. It is designed to present a factual, dispassionate and unbiased view of the
current health and viability of the grid. It seeks to separate facts from opinion and wishful thinking. It analyzes the barriers to increased investment in America’s electricity infrastructure. And it presents estimates on what inaction may cost. The findings of this analysis are sobering, to say the least. This Executive Summary highlights just a few of this report’s findings. It is the NextGen Energy Council’s hope that every policymaker with responsibility over aspects of our nation’s electricity grid reads this report fully.
Major Findings
Lights Out In 2009?

5
Regions represented by the Florida Reliability Coordination Council (FRCC) and the Northeast Power Coordinating Council (NPCC) may require less than 400 miles of new transmission lines, while the Southeast Reliability Council (SERC) may require nearly 2,300 miles. The Western Electricity Coordinating Council (WECC) may require nearly 7,000 miles.
��Investments in new generation and transmission required by 2016 will be a minimum of $300 billion dollars. This may be a conservative estimate, and actual costs could be much higher.
��With growing nationwide reliance on natural gas for new baseload electricity generation, disruptions in the supply or delivery of natural gas could have a significant impact on the reliability and cost of electricity in a number of regions.
��While renewable energy proponents, and some elected officials, are saying that the U.S. needs to only add renewable power facilities such as wind farms, the annual capacity factor of wind generators is typically about 25 - 35 percent. However, the probability that wind generators are available at their rated value during annual peak periods is only between 5 - 20 percent and varies greatly from year to year and region to region. Wind cannot be considered a reliable baseload capacity resource.
��In the West, activist groups are pressuring government regulators to limit access to the region’s high-voltage transmission grid to large baseload technologies such as coal. They propose favoring non-baseload,
intermittent power facilities such as wind and solar, which will decrease the stability and reliability of the entire Western grid.
��The major impediments to strengthening the nation’s electricity infrastructure and maintaining grid reliability are:
1. Lawsuits by environmental groups against power plants, transmission lines and natural gas production;
2. Regulatory uncertainty tied to federal and state climate change policies;
3. Challenges associated with integrating more intermittent power sources on the transmission grid;
4. Reluctance by state regulators to approve rate increases related to the imposition of new environmental or climate-related regulation; and
5. The relatively shorter-term approach to resource planning and acquisition that industry has been forced to adopt because of all of the above factors.
��Of these impediments, the single biggest threat to system reliability is opposition from well-funded environmental groups that oppose and file lawsuits against virtually every new electricity project proposed.
Lights Out In 2009?

6
A ffordable and readily available electricity plays a critically important role in the U.S. economy.
Economic growth and electricity usage are closely related, and electricity has enabled virtually every technological achievement of the past 100 years, transforming industry, commerce, agriculture, transportation, medicine and communications. The National Academy of Engineering has designated electrification as “the engineering feat with the greatest impact on quality of life in the 20th century.”1 Numerous studies have found that a nation’s wealth and well being are closely related with per capita energy use and electricity consumption – as illustrated in Figure 1. Certainly, many of the technological advances that appear possible in the 21st century are in areas such as nanotechnology, communications and the biosciences that will depend on a reliable supply of affordable electricity. However, unless immediate and substantial investments are made in baseload generation and transmission systems, the reliability of the country’s electricity system will be in jeopardy. The West is particularly vulnerable,
with California, the Rocky Mountains and Southwest facing supply uncertainty and potential brownouts and blackouts as early as the Summer of 2009. Should these areas experience unusually hot temperatures for prolonged periods of time in 2009, the chance of brownouts or blackouts is high, with significant risk that local disruptions could cascade into major regional outages. The North American Electricity Reliability Corporation (NERC) has urged officials to encourage substantial investment in long-term bulk power system projects over the next eight years to avoid serious interruptions in the supply of electricity, with potentially devastating consequences to the nation’s economic health.
Introduction
Figure 1: Electricity Usage Per Capita Source: United Nations’ Human Development Report, 2005.
IndiaChina
Mexico
RussiaSouth Korea
Australia
USA
UKItaly
Malaysia
0
3,000
6,000
9,000
12,000
15,000
0 10,000 20,000 30,000 40,000
GDP per Capita (in US$)
Kilo
wat
t-hou
rs p
er C
apita
Lights Out In 2009?

7
The Grid Is In Trouble A dequate supply and a robust
transmission system are essential both for the day-to-day functioning
of the U.S. economy and to gain maximum benefits from potential future economic growth. However, supply and transmission systems in the U.S. are quickly dipping toward minimum reliability thresholds. In short, the U.S. faces serious capacity and transmission problems. In particular, the West’s regional electricity grid, known as the Western Interconnection, is in trouble.
U.S. Capacity Requirements In its October 2007 study, “2007 Long-Term Reliability Assessment,” NERC came to some disturbing conclusions. It found that:
�� Long-term capacity margins on the nation’s transmission systems are inadequate to protect these systems from interruptions such as brownouts or blackouts. Absent immediate investments, this condition will worsen over the next decade;
�� Projected increases in peak demand for electricity exceed projected additions of generation capacity; and
�� The areas of greatest concern are California, the Rocky Mountain states, New England, Texas, the Southwest, and the Midwest.2
NERC found that U.S. baseload generation reserve margins have declined precipitously to 17 percent in 2007 from 30-40 percent in the early 1990s. A 12-15
��
Figure 2: NERC Forecasts of U.S. Electricity Capacity Margins Sources: NERC 2007 Long-Term Reliability Assessment, October 2007, and Management Information Services, Inc.
8%
10%
12%
14%
16%
2007 2008 2009 2010 2011 2012 2013 2014 2015 2016
Cap
acity
Mar
gin Minimal Acceptable
Capacity Margins (12% - 15%)
Available Capacity Margin -- NERC Forecast
Lights Out In 2009?

8
percent reserve margin is the minimum required to maintain the stability of the nation’s electricity system. Further, NERC forecasts that capacity margins will fall below minimum acceptable levels by 2010. As illustrated in Figure 2 (on proceeding page), U.S. capacity margins will begin to decline to unacceptable levels in 2009 and the situation may become critical by 2013.3 While the national situation provides ample cause for concern, NERC found that the situation is even more critical in certain regions. As Figure 3 shows4, supply margins become critical in:
�� WECC (Rocky Mountains) in 2009; �� ERCOT (Texas) in 2009; �� California in 2009; �� NPCC (New England) in 2009;
�� Arizona, New Mexico, and Nevada in 2009; and
�� MRO (Midwest) in 2010.5 Approaching the minimum capacity margins makes the systems vulnerable to blackouts and brownouts. Compounding this situation, demand in the next eight years across the nation is forecast to grow by 18 percent, far exceeding the eight percent projected growth in baseload generation capacity between now and 2016. NERC concluded that officials and regulators must encourage substantial investment in long-term bulk power system projects over the next eight years to avoid serious interruptions in the supply of electricity.
�
Figure 3: NERC Forecasts of U.S. Electricity Capacity MarginsSource: NERC 2007 Long-Term Reliability Assessment, October 2007
Lights Out In 2009?
9
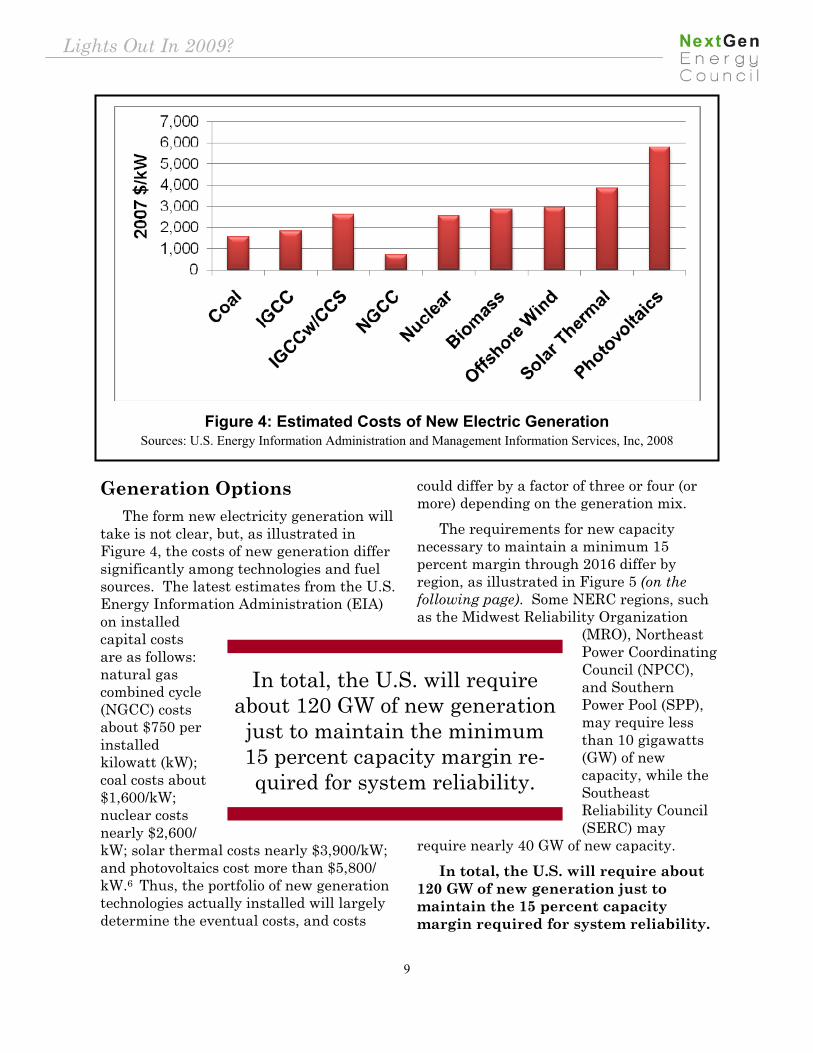
Generation Options The form new electricity generation will take is not clear, but, as illustrated in Figure 4, the costs of new generation differ significantly among technologies and fuel sources. The latest estimates from the U.S. Energy Information Administration (EIA) on installed capital costs are as follows: natural gas combined cycle (NGCC) costs about $750 per installed kilowatt (kW); coal costs about $1,600/kW; nuclear costs nearly $2,600/kW; solar thermal costs nearly $3,900/kW; and photovoltaics cost more than $5,800/kW.6 Thus, the portfolio of new generation technologies actually installed will largely determine the eventual costs, and costs
could differ by a factor of three or four (or more) depending on the generation mix. The requirements for new capacity necessary to maintain a minimum 15 percent margin through 2016 differ by region, as illustrated in Figure 5 (on the following page). Some NERC regions, such as the Midwest Reliability Organization
(MRO), Northeast Power Coordinating Council (NPCC), and Southern Power Pool (SPP), may require less than 10 gigawatts (GW) of new capacity, while the Southeast Reliability Council (SERC) may
require nearly 40 GW of new capacity. In total, the U.S. will require about 120 GW of new generation just to maintain the 15 percent capacity margin required for system reliability.
Figure 4: Estimated Costs of New Electric Generation Sources: U.S. Energy Information Administration and Management Information Services, Inc, 2008
In total, the U.S. will require about 120 GW of new generation just to maintain the minimum 15 percent capacity margin re-quired for system reliability.
Lights Out In 2009?

10
Transmission Constraints Significant transmission constraints exist across the U.S. Such congestion occurs when actual or scheduled flows of electricity across a line or piece of equipment are restricted below desired levels, either by the physical or electrical capacity of the line, or by operational restrictions created and enforced to protect the security and reliability of the grid. Transmission congestion has direct impacts on reliability and the price of energy. When grid operators are limited by transmission constraints in transferring energy from a more desired source to a load center, they must find an alternative — and often more expensive — source of generation that can be delivered where and when they need it.
Grid operators then re-instruct generation owners on how they should schedule electricity production at specific power plants. When much of the grid is tightly constrained, operators may have to curtail service to consumers in some areas to protect the reliability of the grid as a whole. All of these actions can raise the price of energy to consumers. In its major 2006 study, “National Electric Transmission Congestion Study” (NETC Study), DOE found that many areas of the U.S. suffer from transmission constraints. DOE identified three levels of congestion: critical congestion areas; congestion areas of concern; and conditional congestion areas.7 As shown in Figure 6, the NETC Study found a number of critical congestion areas in both the Western and Eastern Interconnections.
Figure 5: Estimated Required Regional Electric Capacity Additions Through 2016
Sources: NERC 2007 Long Term Reliability Assessment, Oct. 2007 and Management Information Services, Inc.
Lights Out In 2009?

11
Source: U.S. DOE, National Electric Transmission Congestion Study, 2006
Figure 6: Critical TransmissionCongestion Areas
In Figure 7 (on the following page), the NETC study identified the most congested paths shown by its modeling to exist in the Eastern Interconnection. In this analysis, DOE concluded the following:
�� Many of the most congested paths are located within regional markets while others cross the boundaries between two markets.
�� A significant number of the most congested paths appear on the tie lines between two control areas.
�� Given load growth patterns and the size of transmission utility footprints, some of the most congested paths are located within individual control areas,
particularly in the Southeast. Figure 8 (on the following page) shows the conditional constraint areas that exist nationally. These congestion areas are defined as those areas “where there is some transmission congestion at present, but significant congestion would result if large amounts of new generation resources were to be developed, without simultaneous development of associated transmission capacity.”8 This illustrates that the conditional congestion areas identified by DOE are also potential locations for large-scale development of wind, coal and nuclear generation capacity to serve remotely located load centers.
Lights Out In 2009?

12
Figure 8: Conditional Constraint Areas in the Eastern Interconnection Source: U.S. DOE, National Electric Transmission Congestion Study, 2006
Figure 7: Most Congested Paths In Eastern Interconnection, 2008 Simulation Source: U.S. DOE, National Electric Transmission Congestion Study, 2006
Lights Out In 2009?

13
Figure 9: Transmission Congestion Areas in Western Interconnection Source: U.S. DOE, National Electric Transmission Congestion Study, 2006
Lights Out In 2009?

14
The map in Figure 9 (on the proceeding page) illustrates how congestion areas in the Western Interconnection can limit the most efficient and desired direction of electricity flow.
How Much New Transmission? NERC found that: 1. Projected transmission additions lag far
behind projected demand growth; 2. Significant investment in transmission
is required; 3. Each peak load season puts more strain
on the transmission system; and 4. The areas of greatest concern are the
Northeast, California, and the Southwest.9
Similarly, the U.S. Government Accountability Office found that growth in electricity demand has strained the nation’s transmission system, resulting in less flexibility to respond to system problems and an increased risk of potential blackouts.10 Using NERC data, we estimate that the U.S. will require more than 14,500 miles of new electric transmission infrastructure through 2016, with transmission requirements differing greatly by region. As illustrated in Figure 10, regions represented by the Florida Reliability Coordination Council (FRCC) and the Northeast Power Coordinating Council (NPCC) may require less than 400 miles of new transmission lines, Southeast Reliability Council (SERC) may require
Figure 10: Estimated Required Regional Transmission Additions Through 2016 Sources: NERC 2007 Long Term Reliability Assessment, October 2007 and Management Information Services, Inc.
Lights Out In 2009?

15
nearly 2,300 miles, and Western Electricity Coordinating Council (WECC) may require nearly 7,000 miles.11 Estimating the cost of new transmission lines is difficult, since costs differ greatly depending on factors such as regulation, regional factors, location factors (e.g., urban, suburban, rural), size of line, type of line, access and so on. To estimate representative costs, we relied primarily on two sources. First, we analyzed recent estimates provided by utilities and public utility commissions, and available in the literature.12
Second, we utilized an Edison Electric Institute (EEI) report that summarized a variety of transmission investment projects that are presently being planned and undertaken by EEI's members.13 This report identified representative projects covering several key categories of transmission that are representative of new transmission investments in the electric
industry.14 Our analysis indicated that the per-mile costs of new transmission lines can vary by a factor of 30 or more (as shown in Figure 11). For example, the FLP Bunnell-St. Johns project has an estimated cost of $1 million/mile, the Ameren LaSalle County project has an estimated cost of $2 million/mile, and the Oncor (formerly TXU) West Levee project has an estimated cost of $3 million/mile. On the other hand, the Con Ed M29 project has an estimated cost of nearly $32 million/mile and the Exelon West Loop project has an estimated cost of nearly $35 million/mile.15
Examples From Other Nations Generation and transmission constraints, and the resulting crippling electric power shortages, are already occurring in many countries. These
Figure 11: Representative Transmission Line Costs Source: Edison Electric Institute and Management Information Services, Inc., 2008
Lights Out In 2009?
16
experiences should provide a cautionary note for the U.S. For example:
�� In South Africa, a years-long electric power crisis is escalating, as rolling brownouts and blackouts harm the economy (mining production has decreased 10 percent), and no solution is seen for five years.16
�� The United Kingdom faces massive near-term power shortages and electricity rationing, with predictions of widespread energy poverty and “social disorder.”17
�� In Indonesia, power shortages have caused the government to require industries to work on weekends, and
new business investment has been curtailed.18
�� In India, some regions are experiencing 20 percent power deficits with power available only 12 hours a day.19
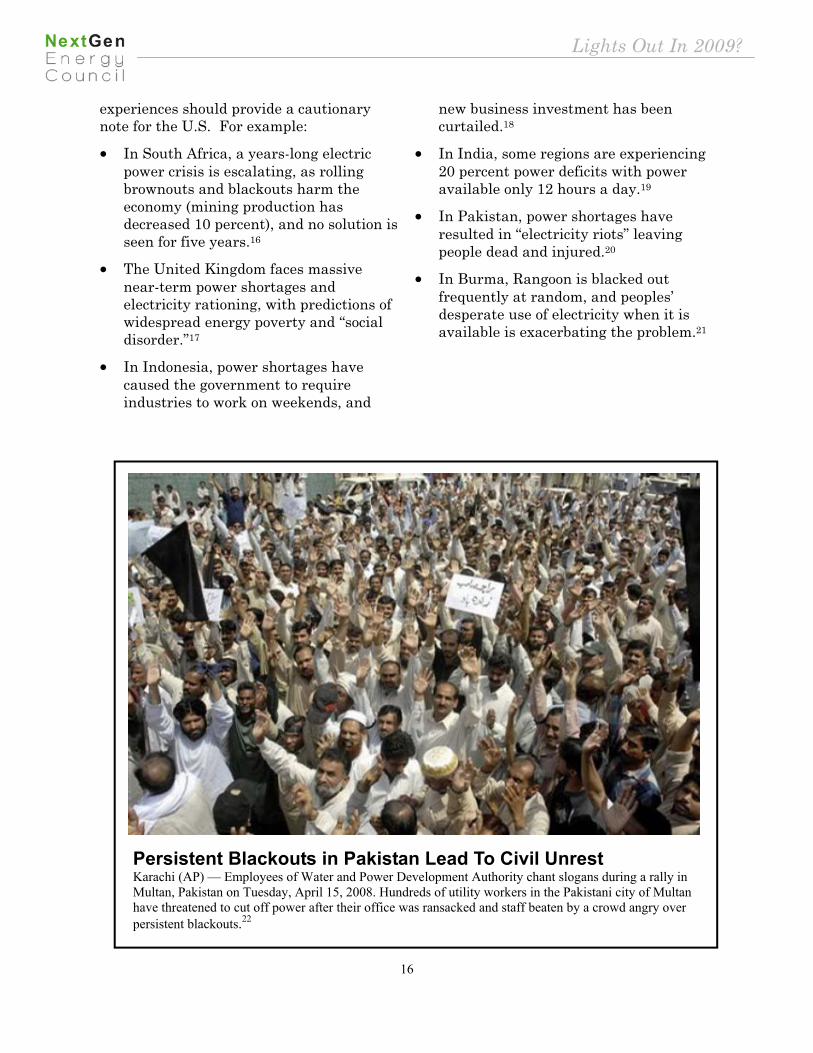
�� In Pakistan, power shortages have resulted in “electricity riots” leaving people dead and injured.20
�� In Burma, Rangoon is blacked out frequently at random, and peoples’ desperate use of electricity when it is available is exacerbating the problem.21
Persistent Blackouts in Pakistan Lead To Civil Unrest Karachi (AP) — Employees of Water and Power Development Authority chant slogans during a rally in Multan, Pakistan on Tuesday, April 15, 2008. Hundreds of utility workers in the Pakistani city of Multan have threatened to cut off power after their office was ransacked and staff beaten by a crowd angry over persistent blackouts.22
Lights Out In 2009?
17
T here is no question that the U.S. needs significant new baseload electricity generation in order to
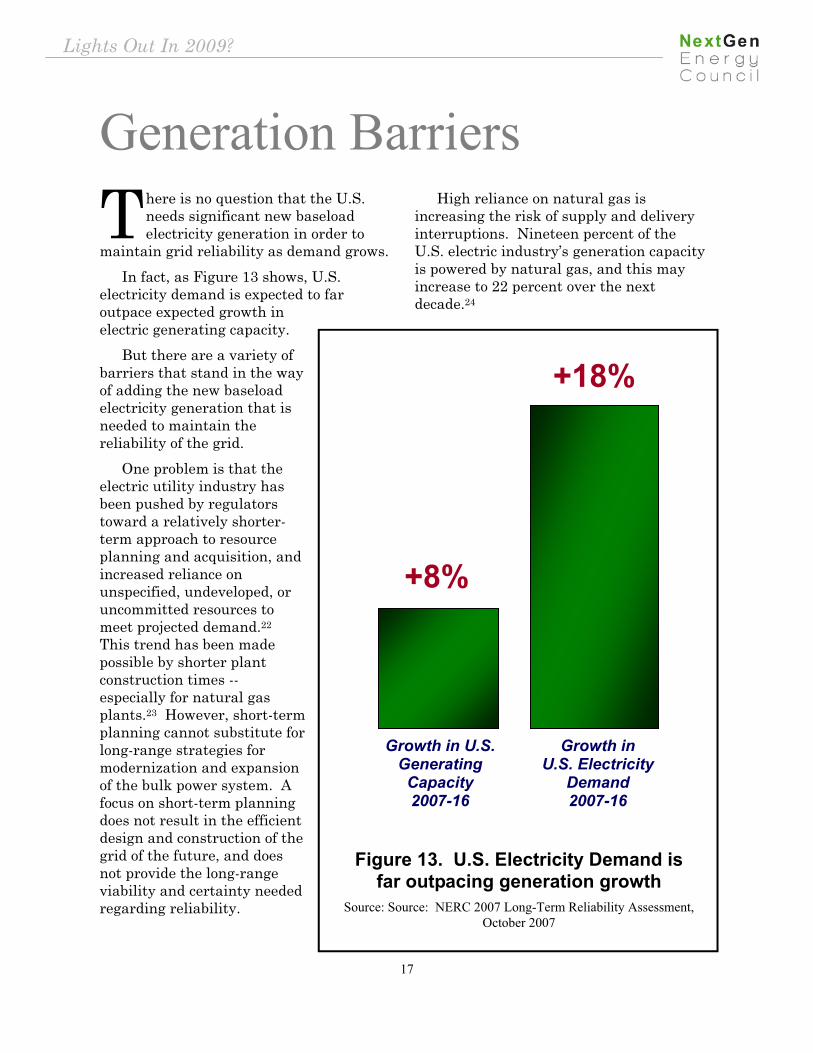
maintain grid reliability as demand grows. In fact, as Figure 13 shows, U.S. electricity demand is expected to far outpace expected growth in electric generating capacity. But there are a variety of barriers that stand in the way of adding the new baseload electricity generation that is needed to maintain the reliability of the grid. One problem is that the electric utility industry has been pushed by regulators toward a relatively shorter-term approach to resource planning and acquisition, and increased reliance on unspecified, undeveloped, or uncommitted resources to meet projected demand.22 This trend has been made possible by shorter plant construction times -- especially for natural gas plants.23 However, short-term planning cannot substitute for long-range strategies for modernization and expansion of the bulk power system. A focus on short-term planning does not result in the efficient design and construction of the grid of the future, and does not provide the long-range viability and certainty needed regarding reliability.
High reliance on natural gas is increasing the risk of supply and delivery interruptions. Nineteen percent of the U.S. electric industry’s generation capacity is powered by natural gas, and this may increase to 22 percent over the next decade.24
Generation Barriers
Growth in U.S. Electricity
Demand2007-16
Growth in U.S. GeneratingCapacity2007-16
+8%
+18%
Figure 13. U.S. Electricity Demand is far outpacing generation growth
Source: Source: NERC 2007 Long-Term Reliability Assessment, October 2007
Lights Out In 2009?

18
In Texas, this dependency is much higher, projected to grow close to 58 percent by 2016.25 Florida, California-Arizona-Southern Nevada, and the Northeast are also highly dependent on natural gas for electricity generation. With growing reliance in the Southeast, disruptions in the delivery of natural gas could have a significant impact on the availability of electricity in a number of regions. Natural gas has become the “fuel of choice” for new generation, and some states have placed a moratorium on building new coal plants.26 These trends are expected to continue over the next several years, further increasing the number of new natural gas plants in areas with an already high dependence. Resource planners in areas with high dependence on natural gas for electricity generation are being forced to take into account the potential for gas delivery interruptions in their overall assessments of supply adequacy and to anticipate the potential impacts of gas supply or delivery interruptions during periods of high gas demand for other uses. High dependence on natural gas presents risks to the adequacy of electricity supply. If fuel options become limited, energy security and fuel supply vulnerability risks are increased, and a balanced fuel-mix must be available to withstand supply disruptions.
Canadian natural gas imports into the U.S. are forecast to begin declining by 2010, and this will leave a gap in available supply amid growing demand from space heating and new agricultural and industrial processes.27 This gap can only be filled by new supplies of imported LNG, which will require the siting and construction of LNG terminals. However, this terminal infrastructure is facing
delays in most locations where it has been proposed.28 Further, importing LNG opens the U.S. fuel supply to the global market and to all of the economic and political risks associated with it, such as those that have faced global oil markets.29 It also presents risks to the supply chain, such as weather events that could delay
shipments for weeks. Another development that could adversely affect future capacity margins is the EPA’s July 2007 suspension30 of its Phase II, Section 316(b) of the Clean Water Act31 rules regarding cooling water intake structures and thermal discharges of once-through cooled power plants. Retrofitting existing power plants with cooling towers could reduce the capacity of those plants, which would exacerbate electric supply concerns. In some cases, retrofits may prove so costly that plants will be retired earlier than projected, with the consequent loss of the plant’s entire capacity. At a time when large additional electricity generating resources are needed, the loss of existing generating capacity would undermine U.S. efforts to meet the growing electricity demand.
With growing reliance on natural gas across the nation
for baseload electricity generation, disruptions in the supply or delivery of natural gas could have a significant impact on the availability of
electricity in many areas.
Lights Out In 2009?
19
Greenhouse gas (GHG) emissions regulations are being promulgated by many states, and 25 states have mandated that renewable energy, such as wind, solar, and biomass, must comprise up to 30 percent of a utility's energy portfolio in five to 15 years.32 In addition, numerous GHG control bills have been introduced in the U.S. Congress.33 These GHG initiatives can negatively impact the bulk power system in various ways; for example:
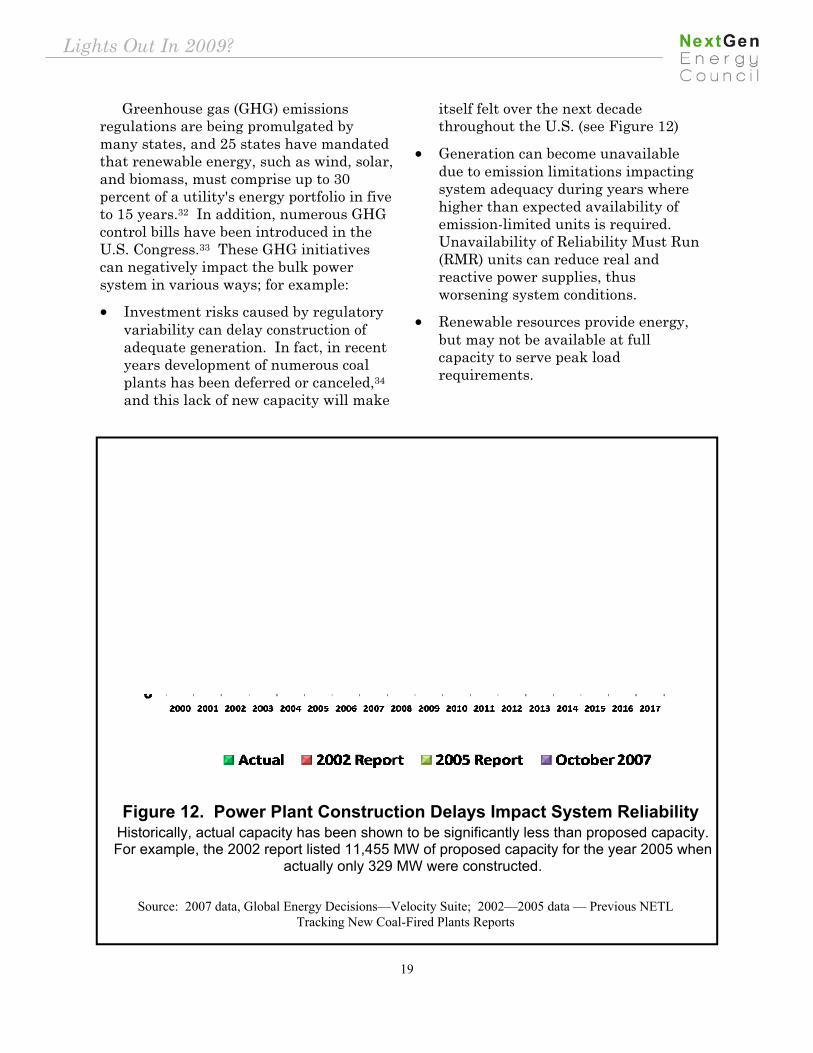
�� Investment risks caused by regulatory variability can delay construction of adequate generation. In fact, in recent years development of numerous coal plants has been deferred or canceled,34 and this lack of new capacity will make
itself felt over the next decade throughout the U.S. (see Figure 12)
�� Generation can become unavailable due to emission limitations impacting system adequacy during years where higher than expected availability of emission-limited units is required. Unavailability of Reliability Must Run (RMR) units can reduce real and reactive power supplies, thus worsening system conditions.
�� Renewable resources provide energy, but may not be available at full capacity to serve peak load requirements.
Source: 2007 data, Global Energy Decisions—Velocity Suite; 2002—2005 data — Previous NETL Tracking New Coal-Fired Plants Reports
Figure 12. Power Plant Construction Delays Impact System Reliability Historically, actual capacity has been shown to be significantly less than proposed capacity. For example, the 2002 report listed 11,455 MW of proposed capacity for the year 2005 when
actually only 329 MW were constructed.
Lights Out In 2009?

20
Recent state commitments to renewable portfolio standards (RPS) have resulted in substantial increases in wind turbine orders, and new wind capacity has been slowed by a worldwide turbine shortage and local opposition to wind projects. Since wind generation is expected to grow substantially throughout the U.S. (in some locations it is targeted to provide over 30 percent of overall capacity), the integration of intermittent resources into the bulk power system and assessing their impact on reliability and adequacy is becoming increasingly complex and difficult.35 Traditional analytical tools focused solely on capacity and simplified dynamic models are not sufficient to estimate that impact. The annual capacity factor of wind generators is typically about 25-35 percent. However, the probability that wind generators are available at their rated value during the annual peak period is only between 5 - 20 percent36 and varies greatly from year to year and region to region. Therefore, wind generation must be considered an energy resource rather than a capacity resource.37 Increasing domestic and global demand for key system electrical components, such as transformers, combustion turbines, and wind turbines, is resulting in longer lead times for procuring these components. For example, lead times to acquire large power
transformers have increased by 6-12 months over the past year. Longer lead times or, even worse, the inability to obtain infrastructure components when needed, influences bulk power system reliability and adequacy. Electric utilities are being required to plan further ahead to ensure that they can acquire needed components to maintain reliability, but this planning must balance the need for equipment with the uncertainties and risks associated with forecasts of system requirements. Rapidly increasing demand for steel
and copper has caused spot scarcity of the resources required to manufacture key electrical components, and this commodity demand has increased the theft of critical system components. Manufacturers have attempted to eliminate excess inventories and capacity to increase productivity of their assets, but they are reluctant to add more capacity until they can be certain about future industry investments. Planned generation reserve levels are generally used by system
planners to account for extreme weather and other uncertainties affecting internal demand. However, long-term reliability analysis continues to show decreasing capacity margins along with increasing demand.
The annual capacity factor of wind generators is typically about 25- 35 percent. However, the probability that wind
generators are available at their rated value during the annual peak period is only
between 5 - 20 percent . Wind cannot be considered a
reliable baseload capacity resource.
Lights Out In 2009?
21
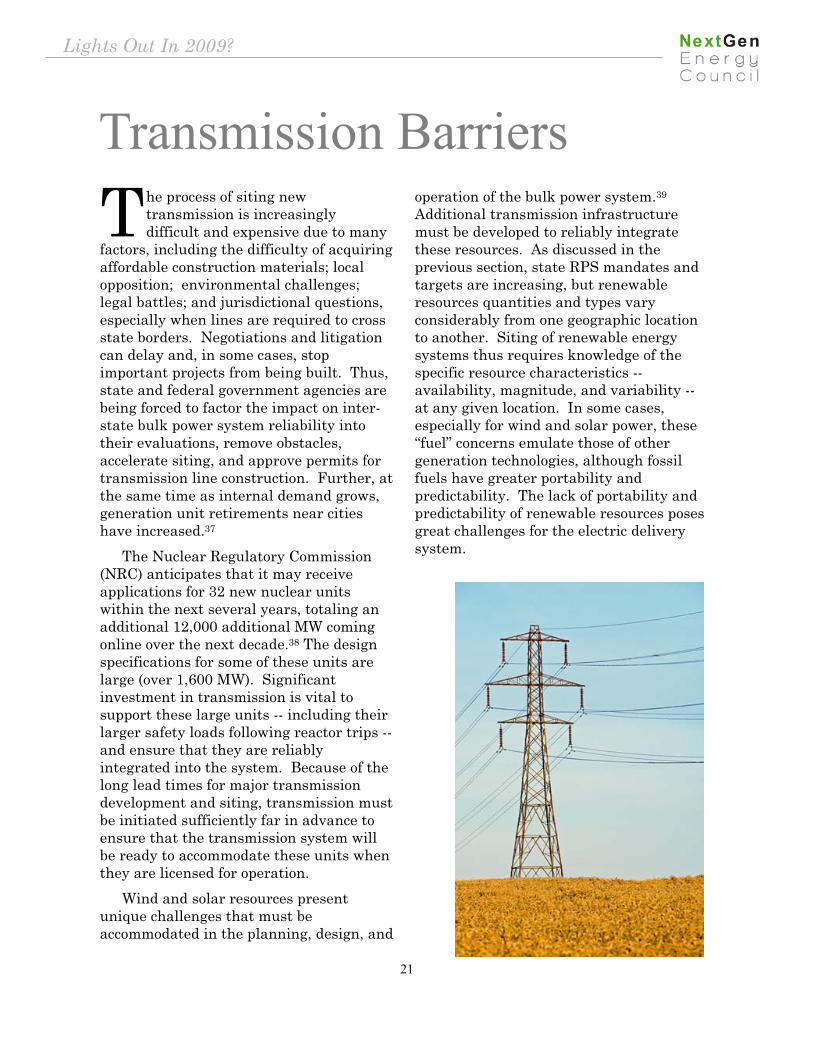
T he process of siting new transmission is increasingly difficult and expensive due to many
factors, including the difficulty of acquiring affordable construction materials; local opposition; environmental challenges; legal battles; and jurisdictional questions, especially when lines are required to cross state borders. Negotiations and litigation can delay and, in some cases, stop important projects from being built. Thus, state and federal government agencies are being forced to factor the impact on inter-state bulk power system reliability into their evaluations, remove obstacles, accelerate siting, and approve permits for transmission line construction. Further, at the same time as internal demand grows, generation unit retirements near cities have increased.37 The Nuclear Regulatory Commission (NRC) anticipates that it may receive applications for 32 new nuclear units within the next several years, totaling an additional 12,000 additional MW coming online over the next decade.38 The design specifications for some of these units are large (over 1,600 MW). Significant investment in transmission is vital to support these large units -- including their larger safety loads following reactor trips -- and ensure that they are reliably integrated into the system. Because of the long lead times for major transmission development and siting, transmission must be initiated sufficiently far in advance to ensure that the transmission system will be ready to accommodate these units when they are licensed for operation. Wind and solar resources present unique challenges that must be accommodated in the planning, design, and
operation of the bulk power system.39 Additional transmission infrastructure must be developed to reliably integrate these resources. As discussed in the previous section, state RPS mandates and targets are increasing, but renewable resources quantities and types vary considerably from one geographic location to another. Siting of renewable energy systems thus requires knowledge of the specific resource characteristics -- availability, magnitude, and variability -- at any given location. In some cases, especially for wind and solar power, these “fuel” concerns emulate those of other generation technologies, although fossil fuels have greater portability and predictability. The lack of portability and predictability of renewable resources poses great challenges for the electric delivery system.
Transmission Barriers
Lights Out In 2009?

22
Nevertheless, regulatory trends have resulted in greater planned use of renewable resources. Much new emphasis is being placed on wind and solar resources in long-term resource planning, especially in ERCOT, SPP, WECC, and MRO, where some states have mandated RPS.40 This proposed level of commitment to renewables presents significant transmission challenges. For example, renewables are often remotely located, requiring significant transmission links often over challenging terrain. Wind and solar resource variability requires ancillary services such as voltage support, frequency control, increased base-load unit dispatch flexibility, and spinning reserves. In addition, their available generating capacity at times of peak demand is often significantly less than their nameplate capacity. Entities responsible for bulk power system reliability and transmission must take these factors into account to ensure that wind and solar are reliably integrated into the system. Due to the unpredictability and volatility of power flows and the need for broader coordination in planning and operations, the transmission system is becoming more complex, and advanced tools that focus on the boundary of stability, rather than single point analysis, are needed to provide better planning and operating tools. Transmission systems using significant amounts of wind generation must be designed for economical delivery of wind energy and to support a multitude of wind generation patterns. Traditional peak period analysis of transmission requirements does not represent the variable generation patterns modeling all hours of the year. Full year, hourly simulations of generation variations with the transmission systems modeled is required to ensure that transmission system designs will deliver the renewable resources when they are available.41
Additional transmission ties to neighboring areas or throughout the region may be required to accommodate wind resources, and increased operating reserve margins may be needed in areas where significant wind resources are located. In addition, market structures can also impact the amount of operating reserves required to mitigate wind output uncertainty. Adequate transmission is required to provide the import and export capability delivering the system regulation and other transfer schedules required. Geographic diversity greatly reduces the influence of wind resource variability as short-term wind energy variability (less than five minutes) is greater than for longer-term (one hour). Additional transmission capacity is thus required to manage generation variability over a large area. Further, wind technologies do not follow load variations well. Dealing with these variations can be challenging, especially if units fueled by different sources are close to their minimum loading. Solar energy resources are also being deployed on the grid. Their variability relates to energy availability when its major fuel supply, the sun, is covered either by dense cloud cover or is unavailable at night. Solar power’s scalability from distributed generation and larger power station applications presents serious infrastructure challenges, especially for bi-directional feeds of the distributed generation alternatives. Integrating newly sited, renewable generation, including small distributed energy projects which serve local loads as well as power the grid, will require major construction, upgrading, and rejuvenation of the grid. As learned from problems in Europe, harmonized operations during emergencies is critical to ensure that renewable sources can be dispatched to support system reliability goals.42
Lights Out In 2009?
23
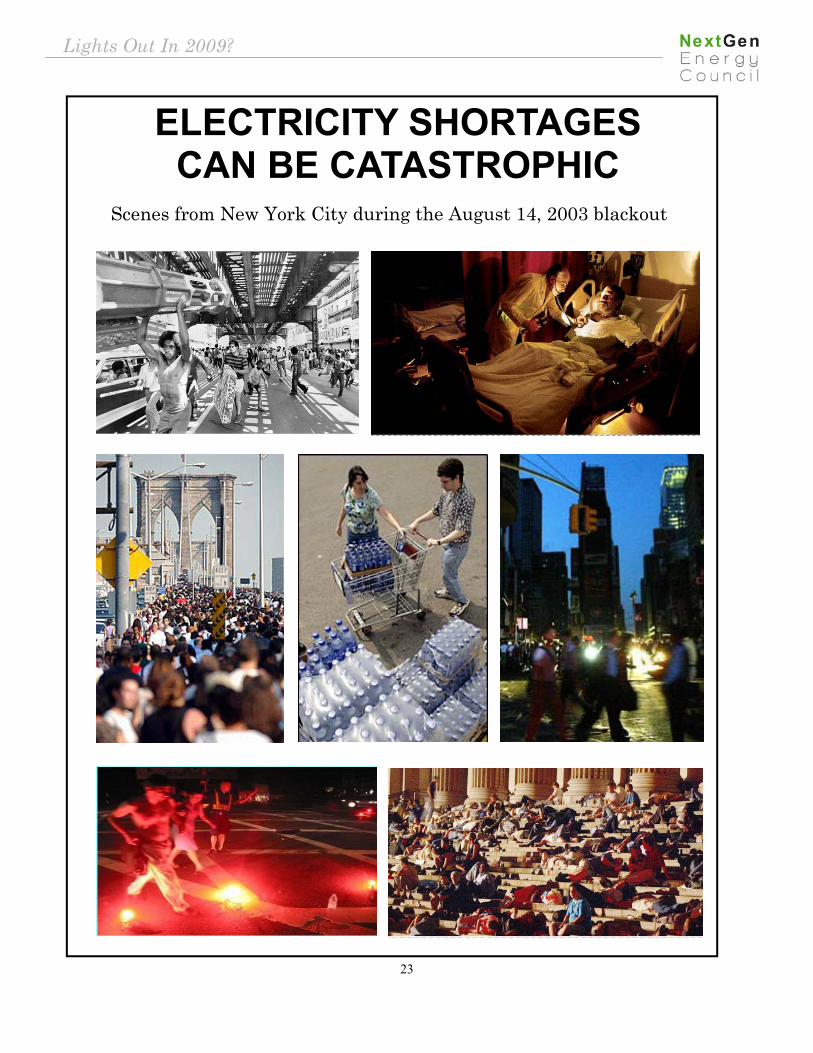
ELECTRICITY SHORTAGES CAN BE CATASTROPHIC
Scenes from New York City during the August 14, 2003 blackout
Lights Out In 2009?

24
I n addition to the many substantial economic, financing, insurance and other hurdles that generation and
transmission projects face, there are also political constraints. Political opposition to energy infrastructure expansion has grown substantially in recent years. Infrastructure additions always involve multiple layers of government and regulatory approvals. Political opposition can grind the gears of government to a halt, preventing even those projects favored by the public — like large wind farms — from becoming a reality. This opposition is almost always organized and led by self-styled “environmental” organizations. A favorite tactic used by these deep-pocketed groups is to file lawsuit upon lawsuit to slow or stop power plants, transmission projects and fuel development. The factors that drive these groups to block needed improvements to the grid are many. But one general observation can be made about most of these environmental activist groups: there doesn’t seem to be a fossil-fueled plant or a nuclear plant or a hydropower plant or a major transmission line project that they don’t find a way of opposing.
For example, here’s how one prominent environmental activist characterized his organization’s approach to this issue in an interview with the Associated Press this in January 2008:
"Our goal is to oppose these [baseload coal] projects at each and every stage, from zoning and air and water permits, to their mining permits and new coal railroads," said Bruce Nilles, a Sierra Club attorney who directs the group's national coal campaign. Nilles said the Sierra Club spent about $1 million on such efforts in 2007 and hopes to ratchet that figure up to $10 million this year.”46
Of the several impediments to grid and reliability improvements identified in this analysis, we find that opposition to generation and transmission projects by well-funded environmental groups is the single biggest
threat to maintaining the reliability of the North American electrical grid — e.g., keeping the lights on and fueling future economic growth in the U.S. Obstacles related to project finance, regulatory jurisdiction, cost allocation and environmental performance and other economic issues are almost always surmounted as a project moves forward. Political opposition can stop a project cold with virtually no recourse, given that most activist groups are rarely willing to
Political Barriers
Opposition to infrastructure projects by environmental groups is the single biggest threat to maintaining the
reliability of the North American electrical grid and ‘keeping the
lights on.’
Lights Out In 2009?

25
compromise in a manner that allows a project to proceed to completion.
Recent Trends A survey of political developments and trends across Western U.S., conducted by the NextGen Energy Council, shows a number of structural political barriers being erected to system reliability. Environmental activists groups are: �� Suing to block the construction of
virtually every single baseload coal-fired power plant, in spite of advanced environmental technologies these plants would deploy.
�� Threatening to begin suing to block the construction of natural gas-fired power plants.
�� Continue to block expansion of new baseload hydropower facilities in the West.
�� Gearing up to block construction of any baseload nuclear power plants across the West.
�� Pushing for additional endangered species designations, which will make siting and construction of both power plants and transmission lines extraordinarily difficult.
�� Working to slow or stop the completion of the two main multi-year, stakeholder-based transmission corridor processes that both Democrats and Republicans in Congress approved as part of the Energy Policy Act of 2005.
�� Pressuring government leaders to limit access to the region's high-voltage transmission grid by larger, baseload technologies and, instead, to artificially favor non-baseload, intermittent power facilities (such as wind and solar that will, at some
point, further stress the reliability of the entire Western grid.
�� Pushing for a massive expansion of federal wilderness and other restrictive public land designations that would severely limit the ability to plan and implement the large-scale transmission necessary to support the Western grid.
�� Seeking to reinstate the Clinton-era roadless rule, which will further limit access to public lands for key energy infrastructure development.
Natural Gas Drilling Lawsuits As political opposition has grown to the construction of baseload power plants fueled by coal and nuclear power, utilities have focused on building natural gas-fired plants to meet both peaking and baseload needs. However, opposition by activist environmental groups continues to grow against production of the natural gas needed to fuel these plants. A recent survey conducted by the office of U.S. Rep. John Shadegg (R-AZ), shown in the Appendix, lists those legal actions taken by activist environmental groups against projects in several major oil and gas production areas.
Lights Out In 2009?
26
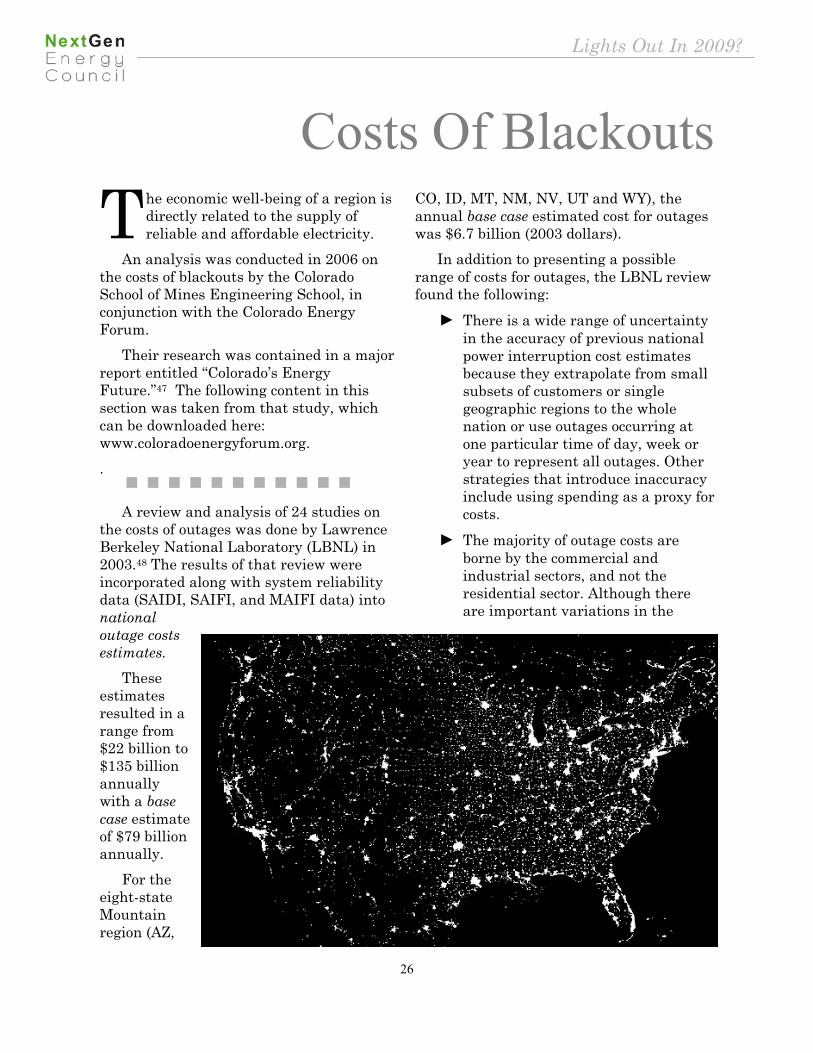
T he economic well-being of a region is directly related to the supply of reliable and affordable electricity.
An analysis was conducted in 2006 on the costs of blackouts by the Colorado School of Mines Engineering School, in conjunction with the Colorado Energy Forum. Their research was contained in a major report entitled “Colorado’s Energy Future.”47 The following content in this section was taken from that study, which can be downloaded here: www.coloradoenergyforum.org. . A review and analysis of 24 studies on the costs of outages was done by Lawrence Berkeley National Laboratory (LBNL) in 2003.48 The results of that review were incorporated along with system reliability data (SAIDI, SAIFI, and MAIFI data) into national outage costs estimates. These estimates resulted in a range from $22 billion to $135 billion annually with a base case estimate of $79 billion annually. For the eight-state Mountain region (AZ,
CO, ID, MT, NM, NV, UT and WY), the annual base case estimated cost for outages was $6.7 billion (2003 dollars). In addition to presenting a possible range of costs for outages, the LBNL review found the following:
� There is a wide range of uncertainty in the accuracy of previous national power interruption cost estimates because they extrapolate from small subsets of customers or single geographic regions to the whole nation or use outages occurring at one particular time of day, week or year to represent all outages. Other strategies that introduce inaccuracy include using spending as a proxy for costs.
� The majority of outage costs are borne by the commercial and industrial sectors, and not the residential sector. Although there are important variations in the
Costs Of Blackouts
Lights Out In 2009?

27
composition of customer types within each region, the total cost of reliability events by region tends to correlate roughly with the number of commercial and industrial customers in each region.
� Costs tend to be driven by the frequency rather than the duration of reliability events. Momentary power interruptions, which are more frequent, have a stronger impact on the total cost of interruptions than sustained interruptions, which are less frequent.
� As noted, costs could be as low as $22 billion or as high as $135 billion when considered a reasonable range in the annual duration and frequency of power interruptions, which addresses both gaps in the data for certain regions and possible year-to-year variations in reliability.
� Costs could be as low as $23 billion considering that larger commercial and industrial customers typically
experience fewer and shorter interruptions than do residential and smaller C&I customers (this difference results from the design of many utility distribution systems).
� Costs might be calculated to be as high as $119 billion if all reliability events are assumed, as is typical in many studies, to occur during summer weekday afternoons when power usage and costs are high.
� The choice of per-outage-per-customer cost data used as a basis for estimating power interruption costs has a very significant impact on the estimate. Using unadjusted PRS meta-analysis survey cost data with biases toward large industrial customers resulted in an estimate of $378 billion, over five times the initial estimate. This assumption severely overestimates costs because it does not correct for the influence of large industrial customers in the original surveys (compared to the
Table 1 : Estimated State Breakdown of Outage Costs for the Mountain Region
State Commercial Consumers
Industrial Consumers
C&I Region % Outage Cost Est. ($Billion/year)
AZ Total 258,882 7,419 21.0 1.4
CO Total 343,245 11,875 28.0 1.9
ID Total 88,118 24,659 8.9 0.6
MT Total 93,116 4,634 7.7 0.5
NM Total 126,511 4,010 10.3 0.7
NV Total 130,761 2,889 10.5 0.7
UT Total 102,866 8,865 8.8 0.6
WY Total 55,433 4,278 4.7 0.3
Mountain Region Total
1,198,932 68,629 100 6.7
Source: Colorado Energy Forum, “Colorado’s Electricity Future,” 2006
Lights Out In 2009?

28
actual distribution of industrial customers), yet provides a sense of the degree of variability that can result when simple assumptions like this are used to evaluate the cost of power interruptions.
The uncertainties found were attributed to a lack of systematic reliable collection of data on customer reliability experiences and the costs of power interruptions to individual customers. This review did not incorporate any analysis of power-quality events (because they are not tracked) or information on customer efforts to reduce their vulnerability to reliability events. Three improvements were suggested to more accurately develop outage cost data: �� Coordinated, nationwide collection of
updated information on the cost of reliability events to customers;
�� Consistent definition and tracking of the frequency, duration, timing, and number and type of customers affected by reliability events, including power-quality events by customer class; and
�� Collection of information on efforts by customers to reduce their vulnerability to reliability events through investments in technology and other measures.
A study of power interruption costs by the Pacific Northwest National Laboratory (PNNL) also concluded that additional surveys of energy consumers were needed to more accurately quantify the cost of outages.49 In addition to similar conclusions to the LBNL survey regarding available data, PNNL also recommended a more in depth analysis to consider the effects of privatization and deregulation of electrical utilities, price instability in certain regions, the continued evolution of alternative auxiliary power systems.50 Subject to the above limitations, the LBNL survey found that "Although there are important variations in the composition of customer types within each region, the total cost of reliability events tends to correlate roughly with the number of commercial and industrial customers in each region."51
Lights Out In 2009?

29
O ur findings are sobering. The West faces a serious and quantifiable threat of blackouts, brownouts and
other reliability vulnerabilities: � The costs of new generation differ
significantly by energy source and the costs of renewable generation options may be five or six times the cost of some fossil fuel options.
� Transmission line costs per-mile are very difficult to estimate and can differ by a factor of 30 or more, depending on a host of technical and geographic factors.
� On the basis of NERC data and forecasts, we estimate that the U.S. will require nearly 120 GW of new capacity by 2016. Using EIA generation cost estimates, we estimate that this new capacity will cost about $250 billion to install.
� On the basis of NERC data and forecasts, we estimate that the U.S. will require more than 14,500 miles of new transmission lines by 2016, with nearly half being required in the WECC region (Western U.S.).
� On the basis of transmission cost estimates available in the literature and data from EEI, we estimate that the cost of this transmission will total approximately $80 billion.
� We estimate that total U.S. new generation and transmission (G&T) costs through 2016 will total about 1/3 trillion dollars.
However, this estimate of future costs may be low because:
�� The costs of all energy projects, including generation and transmission, have been rising and may exceed current estimates.
�� Our estimates only provide for a 15 percent capacity margin in 2016 – the minimum required. If a higher margin is desired, the costs will be significantly greater.
�� The estimates do not include generation and transmission costs beyond 2016, since this is the last year of the current NERC forecast. It is already apparent that substantial generation and transmission costs will be necessary after 2016.
�� State renewable portfolio standard (RPS) mandates may significantly increase generation and transmission costs, since renewables are more expensive than alternatives and require extensive transmission.29 California is currently considering mandating an RPS of 33 percent by 2020, and a number of other states are also pursuing aggressive RPS initiatives.
�� The next annual NERC report is scheduled for release in October 2008, and the estimates derived here can be revised on the basis of more recent data.
Findings
Lights Out In 2009?

30
��The U.S. faces potentially crippling electricity brownouts and blackouts beginning in the summer of 2009, which may cost tens of billions of dollars and threaten lives. Unless major investments are made imme-diately in both electricity generation (power plants) and transmission (power lines), the threat of service interruptions will increase.
��If vulnerable regions, such as the Western U.S., experience unusually hot temperatures for prolonged peri-ods of time in 2009, the potential for local brownouts or blackouts is high, with significant risk that local dis-ruptions could cascade into regional outages that could cost the economy tens of billions of dollars.
��U.S. baseload generation capacity reserve margins have declined pre-cipitously to 17 percent in 2007, from 30-40 percent in the early 1990s. A 12-15 percent capacity reserve mar-gin is the minimum required to en-sure reliability and stability of the nation’s electricity system.
��Compounding this capacity defi-ciency, the projected U.S. demand in the next ten years is forecast to grow by 18 percent, far exceeding the pro-jected eight percent growth in baseload generation capacity be-tween now and 2016.
��In total, the U.S. will require about 120 gigawatts (GW) of new genera-
tion just to maintain a 15 percent reserve margin.
��Using data from the North American Electric Reliability Corporation (NERC), we estimate that the U.S. will require more than 14,500 miles of new electricity transmission lines by 2016. Regions represented by the Florida Reliability Coordination Council (FRCC) and the Northeast Power Coordinating Council (NPCC) may require less than 400 miles of new transmission lines, while the Southeast Reliability Council (SERC) may require nearly 2,300 miles. The Western Electricity Coor-dinating Council (WECC) may re-quire nearly 7,000 miles.
��Investments in new generation and transmission required by 2016 will be a minimum of $300 billion dol-lars. This may be a conservative esti-mate, and actual costs could be much higher.
��With growing nationwide reliance on natural gas for new baseload elec-tricity generation, disruptions in the supply or delivery of natural gas could have a significant impact on the reliability and cost of electricity in a number of regions.
��While renewable energy proponents, and some elected officials, are saying that the U.S. needs to only add re-newable power facilities such as wind farms, the annual capacity fac-tor of wind generators is typically
Conclusions
Lights Out In 2009?

31
about 25 - 35 percent. However, the probability that wind generators are available at their rated value during annual peak periods is only between 5 - 20 percent and varies greatly from year to year and region to re-gion. Wind cannot be considered a reliable baseload capacity resource.
��In the West, activist groups are pres-suring government regulators to limit access to the region’s high-voltage transmission grid to large baseload technologies such as coal. They propose favoring non-baseload, intermittent power facilities such as wind and solar, which will decrease the stability and reliability of the en-tire Western grid.
��The major impediments to strength-ening the nation’s electricity infra-structure and maintaining grid reli-ability are:
1. Lawsuits by environmental groups against power plants, transmission lines and natural gas production;
2. Regulatory uncertainty tied to federal and state climate change policies;
3. Challenges associated with inte-grating more intermittent power sources on the transmission grid;
4. Reluctance by state regulators to approve rate increases related to the imposition of new envi-ronmental or climate-related regulation; and
5. The relatively shorter-term ap-proach to resource planning and
acquisition that industry has been forced to adopt because of all of the above factors.
��Of these impediments, the single biggest threat to system reliability is opposition from well-funded environ-mental groups that oppose and file lawsuits against virtually every new electricity project proposed.
Lights Out In 2009?
32
1. U.S. National Academy of Engineering, 1999.
2. North American Electric Reliability Corpo-ration, 2007 Long-Term Reliability Assess-ment, October 2007.
3. Ibid. 4. Ibid. Note that map identifies the years
when a region/subregion drops below target capacity margin levels required to meet summer peak (unless noted as winter) in-cluding both committed and uncommitted resources. Those region/subregions not iden-tified are not projected in the next ten years to drop below their target margin levels. Note: The highlighted area between SPP and SERC denotes overlapping regional boundaries.
5. Ibid. 6. U.S. Energy Information Administration,
Annual Energy Outlook 2008, 2008. These EIA estimates are ‘overnight’ costs and ex-clude financing and related costs.
7. U.S. Department of Energy, National Elec-tric Transmission Congestion Study, 2006.
8. Ibid. 9. North American Electric Reliability Corpo-
ration, 2007 Long-Term Reliability Assess-ment, October 2007.
10. U.S. Government Accountability Office, Transmission Lines: Issues Associated With High-Voltage Direct-Current Transmission Lines Along Transportation Rights of Way, February 1, 2008.
11. North American Electric Reliability Corpo-ration, 2007 Long-Term Reliability Assess-ment, October 2007.
12. For example, “New Transmission Lines Benefit Customers,” Energy Insights, Pacific Power, July 2007; “PHI’s Proposed Inter-state Transmission Line Backed Key Sup-port for Building 500-kV Line to Improve
Reliability, Keep Costs Down,” Pepco Hold-ings, August 22, 2007; “Line to be Built by Allegheny Energy and American Electric Power, Business Wire, June 22, 2007.
13. Edison Electric Institute, Transmission Pro-jects: At a Glance, January 2008.
14. The report includes member company pro-jects representative of various project in-vestment category types, such as long line, reliability, economic, resource access (conventional and renewable), multi-state, multi-entity (e.g., projects involving IOU and Public Power as collaborative efforts), and non-transmission line projects. In al-most all cases, a minimum project invest-ment threshold of $20 million was applied to prospective projects and only projects pro-posed to begin from 2007 going through 2022 were included (this represents a one year back looking and 15 years forward look-ing window).
15. Ibid. 16. Shona Kohler, “National Electricity Supply
Shortage Sets In,” Engineering News, May 16, 2008.
17. Jason Groves, “Power Cuts ‘Could Spark Disorder,’” Daily Express, September 7, 2008.
18. Lisa Murray, “Business Anger Over Indone-sia’s Power Crisis,” Financial Times, July 18, 2008.
19. “Power Crisis Hits Indian Cities,” BBC Word News America, July 25, 2008.
20. “Pakistan Electricity Riots Leave 40 Wounded,” Khalegi Times, April 14, 2008.
21. Maung Too, “Electricity Shortages in Ran-goon and Magwe,” Democratic Voice of Burma, April 10, 2008.
22. Associated Press photo and dispatch by Khalid Tanveer, 2008.
Endnotes
Lights Out In 2009?
33
23. North American Electric Reliability Corpo-ration, 2007 Long-Term Reliability Assess-ment, October 2007.
24. For example, natural gas plants can some-times be constructed is as little as 18 months.
25. U.S. Energy Information Administration, Annual Energy Outlook 2008, 2008.
26. North American Electric Reliability Corpo-ration, op. cit.
27. U.S. Energy Information Administration, Annual Energy Outlook 2008, Op. cit.
28. American Gas Foundation, “The Energy Pol-icy Act of 2005 and its Impact on the U.S. Natural Gas Supply/Demand Imbalance,” January 2007
29. Roger H. Bezdek and Robert M. Wendling, “The Case Against Natural Gas Preferences,” Public Utilities Fortnightly, April 2004, pp. 43-47.
30. Lester R. Brown, “U.S. Moving Toward a Ban on New Coal-fired Power Plants,” Earth Policy Institute, February 14, 2008.
31. North American Electric Reliability Corpo-ration, op cit.
32. http://www.epa.gov/waterscience. 33. U.S. Clean Water Act, page 169, http://
www.epa.gov/region5/water/pdf/ecwa. 34. Amy Royden-Bloom, “State Greenhouse Gas
(GHG) Actions,” National Association of Clean Air Agencies, January 16, 2008.
35. “GHG Emission Limits Proposals From the 110th Congress,” Pew Center on Global Cli-mate Change, www.pewclimate.org
36. “$45.3 Billion In U.S. Coal-Fired Power Plants Cancelled In 2007,“ Resource Media, January 8, 2008.
37. Edison Electric Institute, Transmission Pro-jects: At a Glance, January 2008.
38. North American Electric Reliability Corpo-ration, op cit.
39. Ibid. 40. Ibid.
41. U.S. Energy Information Administration, 2007 Annual Energy Outlook, 2007.
42. North American Electric Reliability Corpo-ration, op cit, and Edison Electric Institute, op. cit.
43. North American Electric Reliability Corpo-ration, op cit.
44. Ibid. 45. Ibid. 46. Associated Press story, “Coal Power Goes On
Trial Across U.S.,” January 14, 2008. 47. Colorado Energy Forum, “Colorado’s Elec-
tricity Future,” 2006. 48. J. Eto, L. Lawton, M. Sullivan, K. Van Liere,
and A. Katz., “A Framework and Review of Customer Outage Costs: Integration and Analysis of electric Utility Outage Cost Sur-veys”. Lawrence Berkley National Labora-tory, Report No. LBNL-54365, Berkeley CA, Nov. 2003.
49. P. Balducci, J. Roop, L. Schienbein, J. DeSteese, and M. Weimar,” Electrical Power Interruption Cost Estimates for Individual Industries, Sectors, and U.S. Economy.” Pa-cific Northwest National Laboratory, PNNL-13797, February 2002.
50. Ibid. 51. Ibid. 52. EEI notes that connecting location-
constrained renewable resources to the transmission network in the most cost-effective manner can present “special chal-lenges.” Edison Electric Institute, op. cit.
Lights Out In 2009?

34
A recent survey conducted by U.S. Representative John Shadegg (R-AZ) produced the following summary of
environmental group challenges to key oil and gas developments: Environmental groups have challenged every oil and gas lease in the Chukchi Sea:
�� The Bush Administration issued 487 leases in the Chukchi Sea Sale 193 in February 2008.
�� The Center for Biological Diversity, the Natural Resources Defense Council, the Sierra Club, and other environ-mental organizations, in January 2008, filed a pre-emptive suit challeng-ing all 487 leases under the National Environmental Policy Act of the En-dangered Species Act.
�� Status: Currently Pending.
Environmental groups have challenged the entire 2007-2015 national OCS leas-ing program:
�� The Bush Administration, in July 2007, proposed a national schedule to issue oil leases over a 5-year period (2007-2012) in the outer continental shelf, including Alaska.
�� The Center for Biological Diversity and other environmental organizations im-mediately filed suit challenging all ex-isting leases and all future leases un-der the Endangered Species Act, and various other laws.
�� Status: Currently Pending.
Environmental groups have challenged exploration activities of every lease in the Chukchi and Beaufort Seas:
�� There are 748 leases which lie in the Chukchi and Beaufort Seas.
�� The Center for Biological Diversity, the Natural Resources Defense Council, and other environmental organiza-tions, in May 2008, sued, challenging all seismic activity at all 748 leases in the Chukchi and Beaufort Seas under the National Environmental Policy Act and the Marine Mammals Protection Act.
�� Status: Currently Pending.
Environmental groups have challenged proposed drilling plans:
�� On February 15, 2007, the Minerals Management Service approved the pro-posed exploration plan for 12 leases in the Beaufort Sea.
�� The Center for Biological Diversity, the Natural Resources Defense Council, the Sierra Club, and other environ-mental organizations sued in April 2007 and obtained a court order halt-ing drilling on all 12 leases. This order has already stopped activity for two years.
�� Status: Currently Pending. Environmental groups sue under FOIA seeking evidence for use in future liti-gation to block all oil and gas leases:
�� The administration issued 487 leases in the Chukchi Sea Sale 193 in Febru-ary 2008.
Appendix
Lights Out In 2009?
35
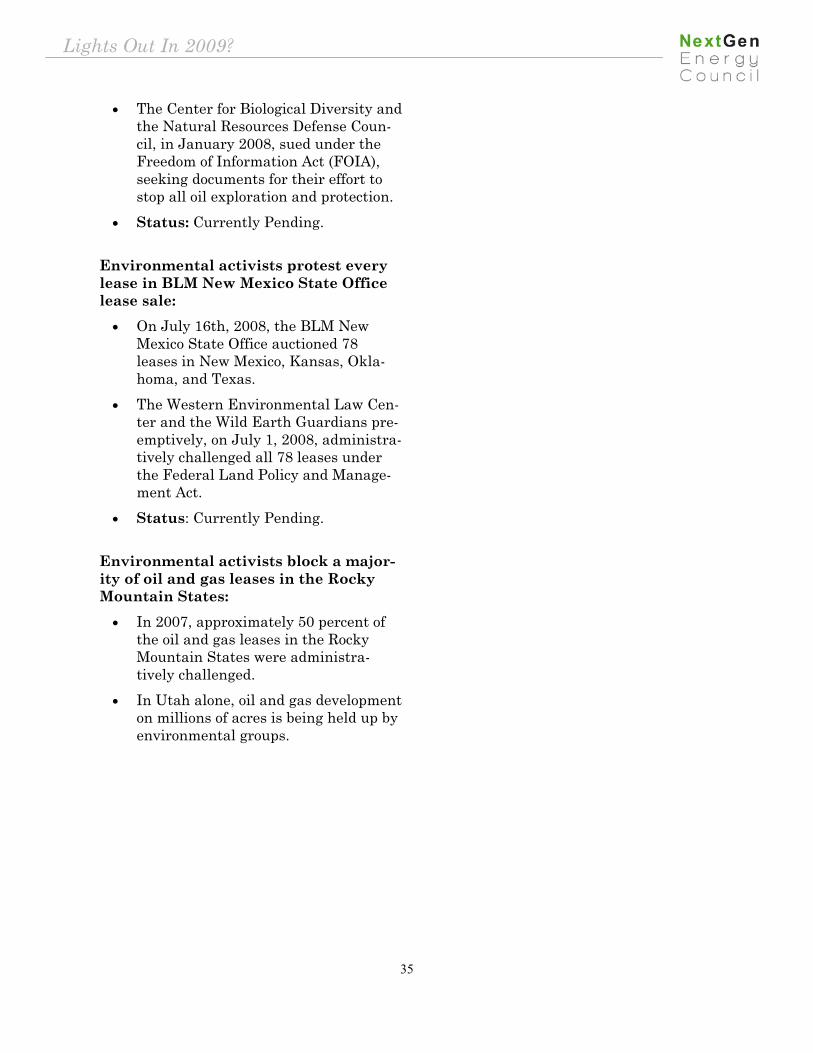
�� The Center for Biological Diversity and the Natural Resources Defense Coun-cil, in January 2008, sued under the Freedom of Information Act (FOIA), seeking documents for their effort to stop all oil exploration and protection.
�� Status: Currently Pending.
Environmental activists protest every lease in BLM New Mexico State Office lease sale:
�� On July 16th, 2008, the BLM New Mexico State Office auctioned 78 leases in New Mexico, Kansas, Okla-homa, and Texas.
�� The Western Environmental Law Cen-ter and the Wild Earth Guardians pre-emptively, on July 1, 2008, administra-tively challenged all 78 leases under the Federal Land Policy and Manage-ment Act.
�� Status: Currently Pending.
Environmental activists block a major-ity of oil and gas leases in the Rocky Mountain States:
�� In 2007, approximately 50 percent of the oil and gas leases in the Rocky Mountain States were administra-tively challenged.
�� In Utah alone, oil and gas development on millions of acres is being held up by environmental groups.
Lights Out In 2009?
36
Lights Out In 2009?
Available on the web at www.nextgenenergy.org
Conducted by The NextGen Energy Council
Management Information Systems, Inc. September 2008