lighten everyone's load: lidar applications to support engineers, planners, scientists and more
TRANSCRIPT
Lighten Everyone’s Load: Lidar Applications to Support engineers,
planners, scientists, and more
Michael J. Olsen Assistant Professor, Geomatics
School of Civil and Construction Engineering Oregon State University
Portland State University TREC Seminar May 8, 2015
1

Michael J. Olsen, PhD, E.I.T.
Assistant Professor of Geomatics School of Civil and Construction Engineering Oregon State University
PhD. University of California, San Diego Research: Lidar to model and analyze seacliff erosion
MS and BS, University of Utah, liquefaction hazard mapping
Primary Research Interests: Lidar, 3D modeling, scientific visualization, computer programming, Coastal geomorphology, geohazard engineering, Geographic Information Systems
2

Civil & Construction Engineering Geomatics Faculty at OSU
Mike Olsen Assistant Professor, 2009
Robert Schultz Professor, 1962
Tracy Arras Senior Instructor, 2003
Many additional geospatial faculty in other departments
Dan Gillins Assistant Professor,
2013
Christopher Parrish Associate Professor
2014
Jihye Park, Assistant Professor,
2015

Industry Partnership
•Recruit top students •Expand course work and research to reflect industry advances •Keep surveying as an integral part of our Civil Engineering program •Provide the latest equipment, software, and workflows •Prepare students to become licensed surveyors •Produce work-ready graduates
4

Courses and Graduate Research!

GIS - Municipal Utility System
Water Lines
Water valves
Sewer lines
Hydrants
Wells
Manholes
Easements
LIDAR, SFM, & 3D, Virtual Reality
3D information modeling
Property Surveying
Courses and Graduate Research!

Outline
• What is LIDAR?
• How does it work?
• How is it used?
• What is in store in the future?

Lidar (Laser Scanning)
Light Detection and Ranging
Active System
Laser Range
Single/Multiple Returns
Angle Determination
3D Point Cloud
Intensity
RGB Color

What is Lidar? LiDAR = Light Detection and Ranging
Original Slide by: Evon Silvia - Oregon State University
D= 0.5cDt • c = speed of light • Dt = travel time
D
Dt

LiDAR Rap v1.0 by M$lice
LiDAR relies on Line of Sight Using pulses of light, But not too bright, It calculates the Time of Flight And can be done in da nite Works from the ground or during da flight, Gives you da heightz, Requires lots of bytes, Objects in the way give you a blight, Don’t have fright We’ll learn you how to avoid plight, So it gits da job done right! With data dat can fit your control nice n tight! Magic School Bus LIDAR

11
Point Cloud

Measurements

Static Scanning Products
Photo Scan Vector Solid Objects

3D surface modeling
5/11/2015
Page 14

Figure by Keith Williams, Oregon State University
Multiple Returns

DATA COURTESY OF WATERSHED SCIENCES AND DOGAMI
5/11/2015
Page 16

5/11/2015
Page 17

5/11/2015
Page 18

19
Sugarbaker, L.J., Constance, E.W., Heidemann, H.K., Jason, A.L., Lukas, Vicki, Saghy, D.L., and
Stoker, J.M., 2014, The 3D Elevation Program initiative—A call for action: U.S. Geological Survey
Circular 1399, 35 p., http://dx.doi.org/10.3133/cir1399
http://nationalmap.gov/3DEP/
3DEP highlights
• >$690 million annually in new benefits to private sector
• Estimated 5:1 return on investment
• Save lives
• Help economy
• Improve environment
• Collaboration within government
• Prepared for natural disasters (floods, landslides,
earthquakes, etc.)
• Multiple agencies\disciplines benefit
20

21
Source: USGS, 3DEP

22

Results of 3DEP inventory
• Lidar data have been collected over 28 percent of the
conterminous United States and Hawaii.
• Enhanced elevation data (primarily ifsar data) have been
collected over approximately 15 percent of Alaska.
• Elevation data was collected at an average annual rate of 4
to 5 percent from 2009-2011.
• The level of overlapping coverage is less than 10 percent.
• The quality of the data varies from project to project.
23

Oregon LIDAR Consortium
\\lidar.engr.oregonstate.edu\lds
Slide by Michael Denis, OSU CCE Geomatics

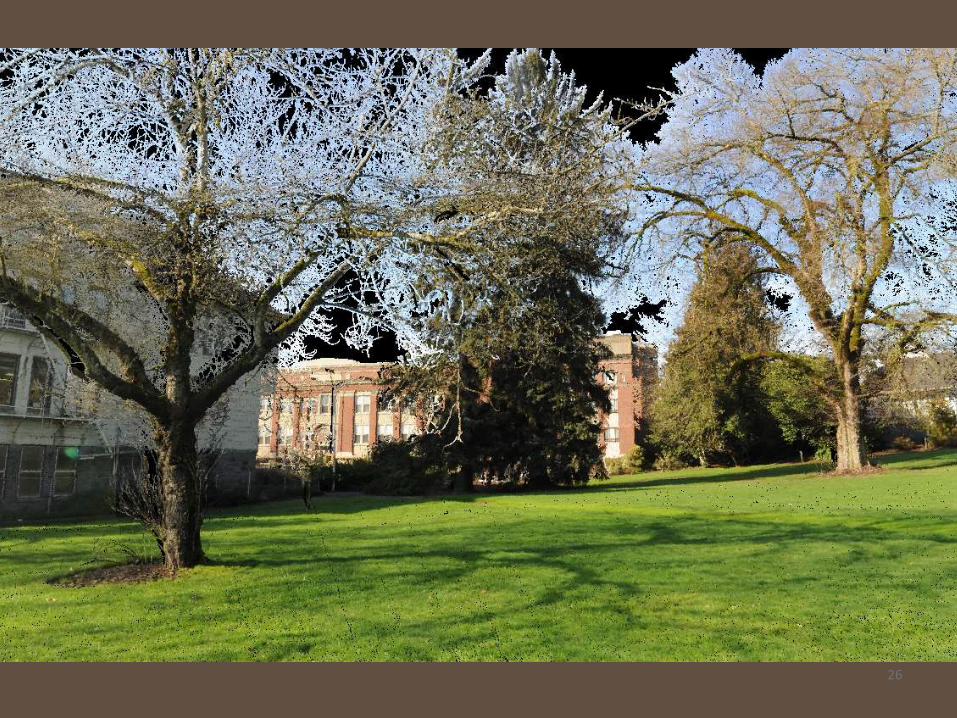
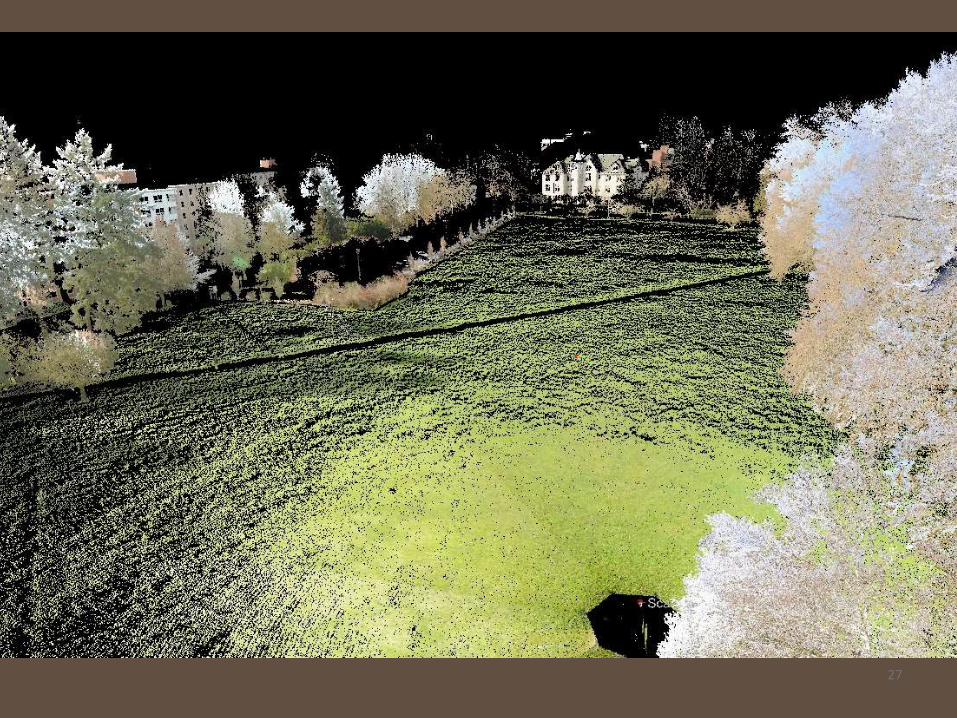
3D laser scanner w/ integrated camera
Power Cord
Laptop for control and data preview
Tripod Network Cord
26
27

28
RTK GPS Controller
3D Laser Scanner
Cell Phone
RTK GPS Receiver
Laptop Controller

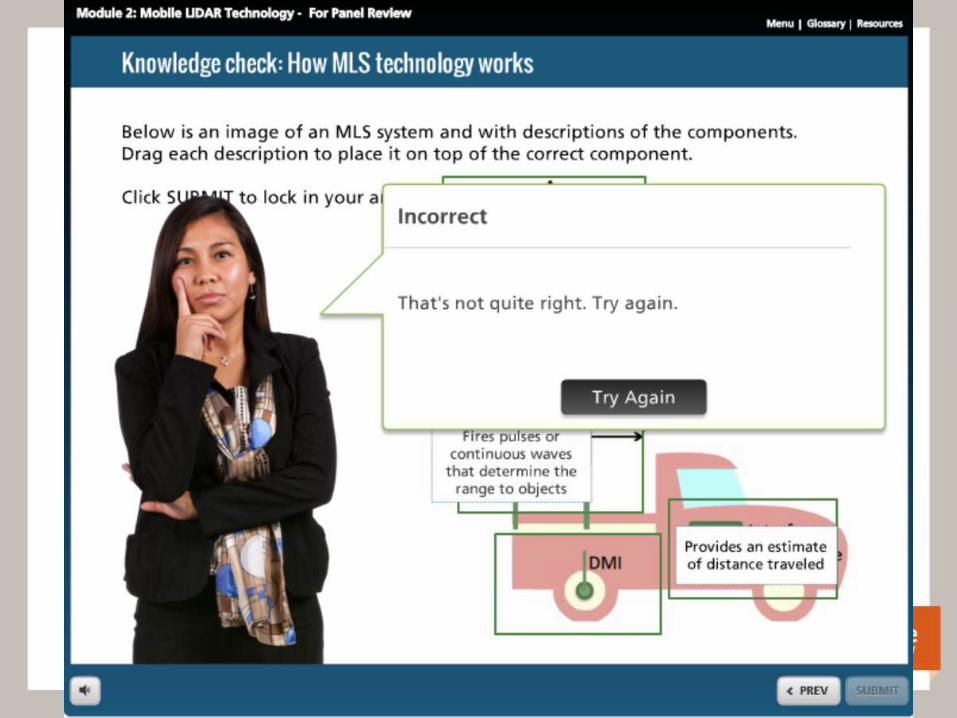
Mobile Laser scan system
GPS receiver
Camera
Laser scanner
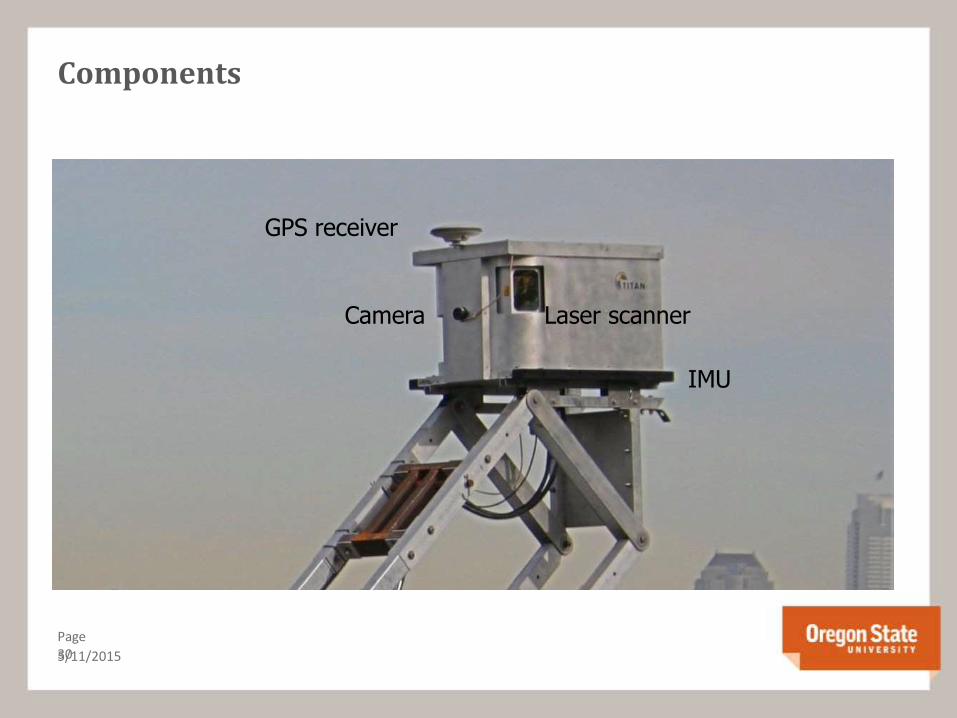
Components
5/11/2015
Page 30
GPS receiver
Camera Laser scanner
IMU


5/11/2015
Page 32
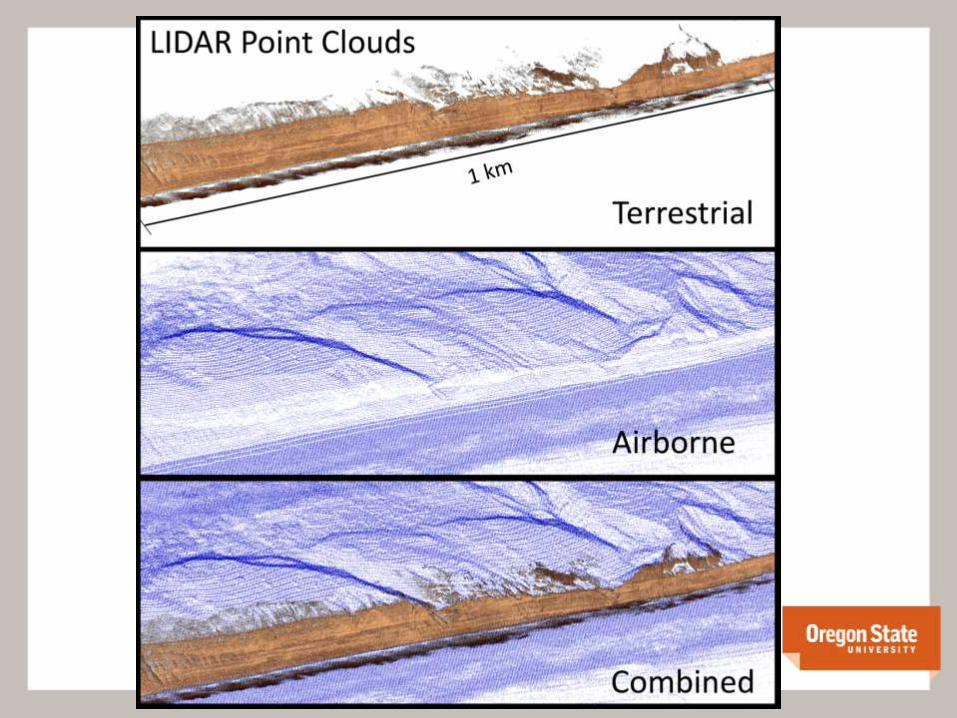
Airborne LIDAR
• Direct view of pavement & cliff tops• Poor (oblique) view of vertical faces and
cannot capture overhangs• Faster coverage• Larger footprint (>0.5m)• Laser travels much farther• Not limited to area visible from roadway• Lower point density (1-80 points/m2)
• Good view of pavement• Direct view of vertical faces• Cannot capture cliff tops• Slower coverage• Smaller footprint (1-3 cm, typical)• Closer to ground\objects• Limited to objects close and visible
from the roadway (<100m, typical)• Higher point density (100’s to 1,000’s
points/m2) but more variable
Mobile LIDAR
A
M

5/11/2015
Page 34
•Quality Management Plan•Determine sections of interest•Coordinate with divisions\ agencies•Weather\ Environment Conditions•Determine which sensors are needed•GNSS PDOP prediction•Topography\land cover\water•Develop drive path
MLS Workflow
Preliminary Site Surveys•Determine obstructions•Traffic peaks•Determine what can be covered by MLS
Data Acquisition
•Verify system calibration•Set and acquire control and validation points•Drive and monitor the mission•Scan Data•GNSS\IMU•Imagery•Other sensors
Geo referencing
•Combine LIDAR, GNSS, and IMU •Geometric Correction•Local Transformation•Validate accuracy\resolution\completeness•Tile Data
Computations\Analysis
•Create DEM derivatives•Derive point density map•Detect change\deformation•Cut\Fill estimation•QC analysis results
Planning
•Clean and filter data•Classify data•Surface (model) data•Extract Features\line work•QC models and features
Fails QC
Post Processing
Raw
Reg
ClasMod
Calcs
Packaging and Delivery
•Develop reports•Zip Data•Evaluate strategy efficiencyfor future missions•Archive and backup data
Docs
Img
Fails QC
Level of LIDAR ExpertiseExpertModerate experienceSome experienceNovice
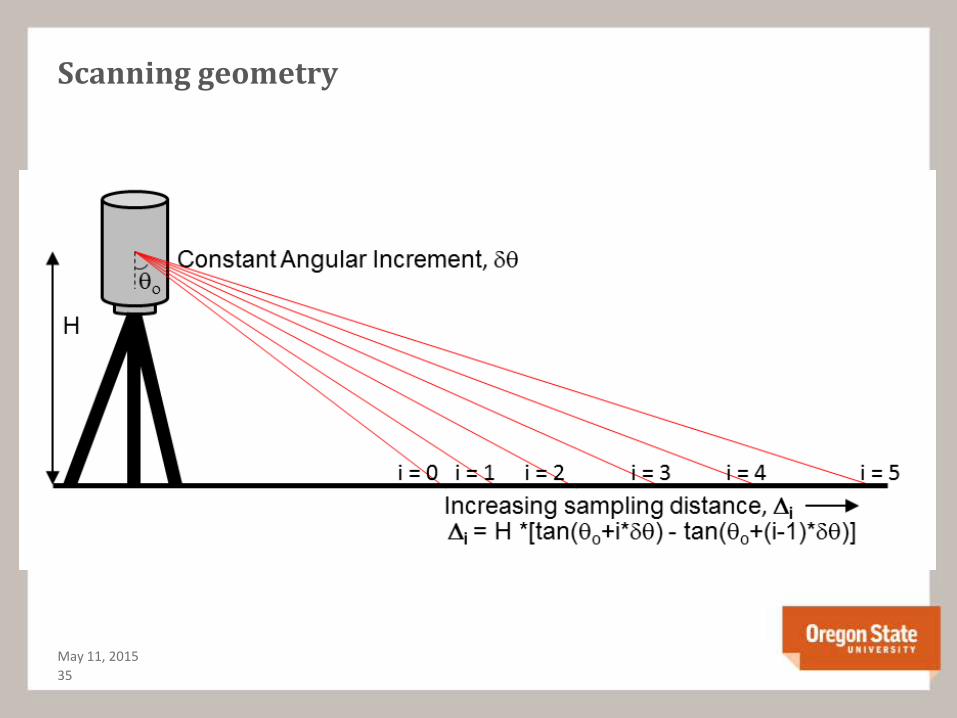
Scanning geometry
May 11, 2015
35

Scan A
B
C
A+B+C 36

Integration of Geomatics Technologies

Mathematically defined, Geometric Primitives
points lines and line segments planes circles and ellipses triangles and other polygons spline curves spheres cubes or boxes toroids cylinders pyramids teapot
38

By: Logan Allendar Torger Torgerson
Modeling in Leica Cyclone
School of Civil and Construction Engineering

Example Applications
• Transportation
• Coastal Erosion
• Landslide Assessment
• Earthquake and Tsunami damage assessment
• Wireless signal mapping
• Cultural Heritage
• Laboratory Testing
5/11/2015
Page 40

MPN Components
Persi Consulting
Martha Hales Design
Alisa Bolander Consulting
NCHRP 15-44 (Report #748) Guidelines for the use of mobile lidar in transportation applications
Graduate Students: Keith Williams, Matt O’Banion
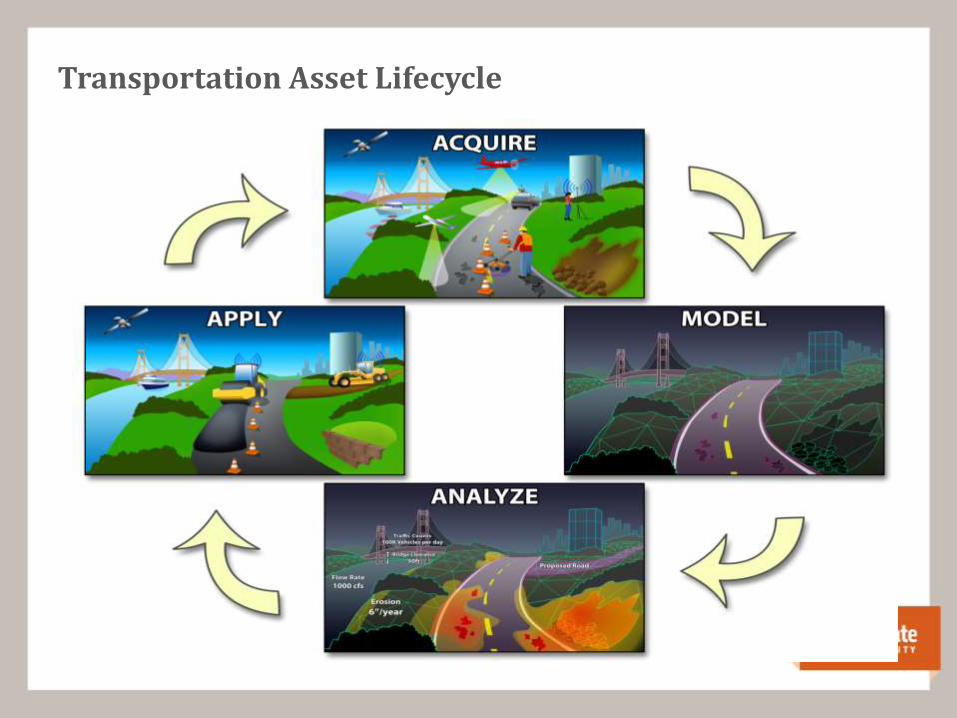
Transportation Asset Lifecycle


What do you need? What does it cost?
Data Collection Categories
May 11, 2015
56
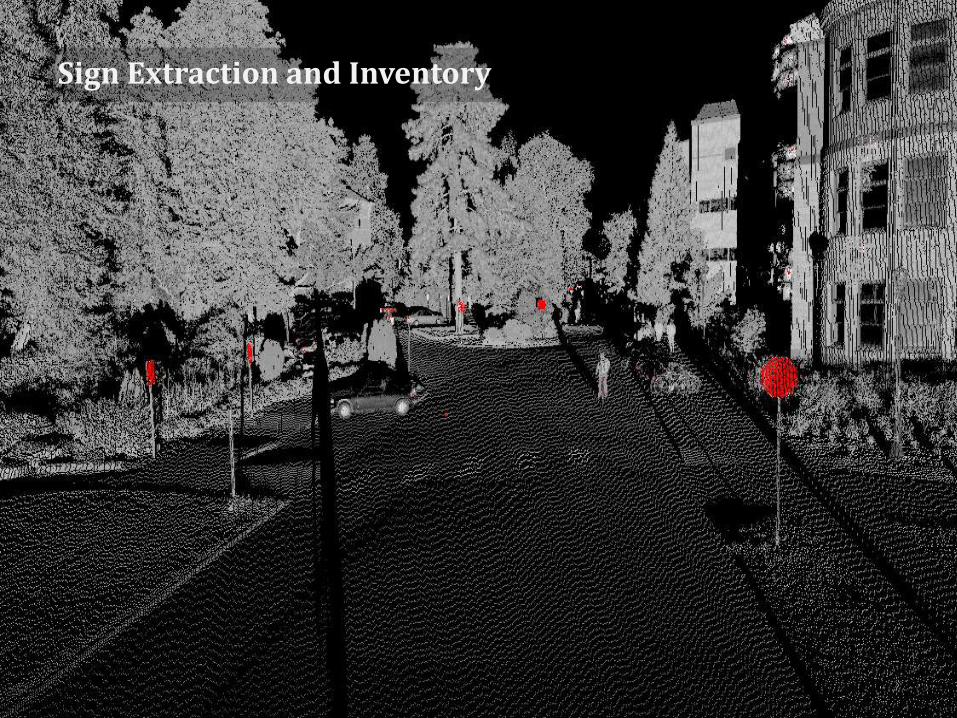
Sign Extraction and Inventory

Bridge Clearances

Conflict Analysis - Endeavour
https://www.youtube.com/watch?v=i-aOpGvqMPc

Pavement Cracking and deterioration
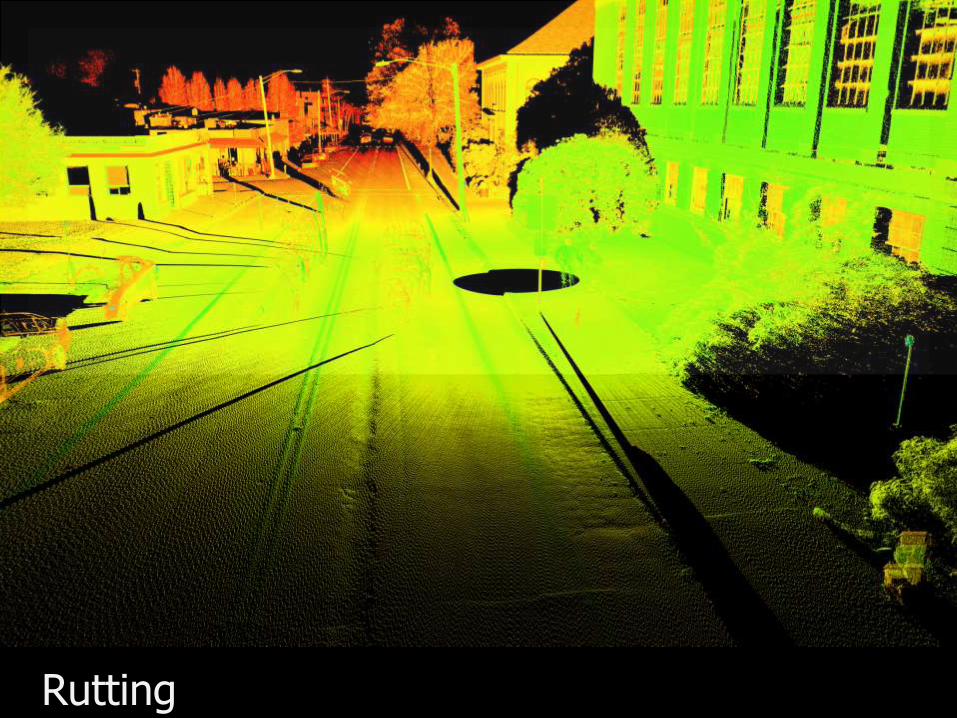
Rutting

A Platform for Proactive Risk-based Slope Asset Management
LIDAR acquisition
and processing
Michael Olsen
Oregon State Univ.
Slope Assessment
Joe Wartman
Lisa Dunham
Univ. of Washington
Risk Assessment
Keith Cunningham
Univ. of Alaska, Fairbanks

Develop a model that identifies and relates high resolution lidar morphological indices to slope hazard categories which can then be related to risk
Proactive Risk-based Asset Management
LiDAR scanning Slope Characterization Determining Risk
Use emerging technologies to create an automated risk classification
system
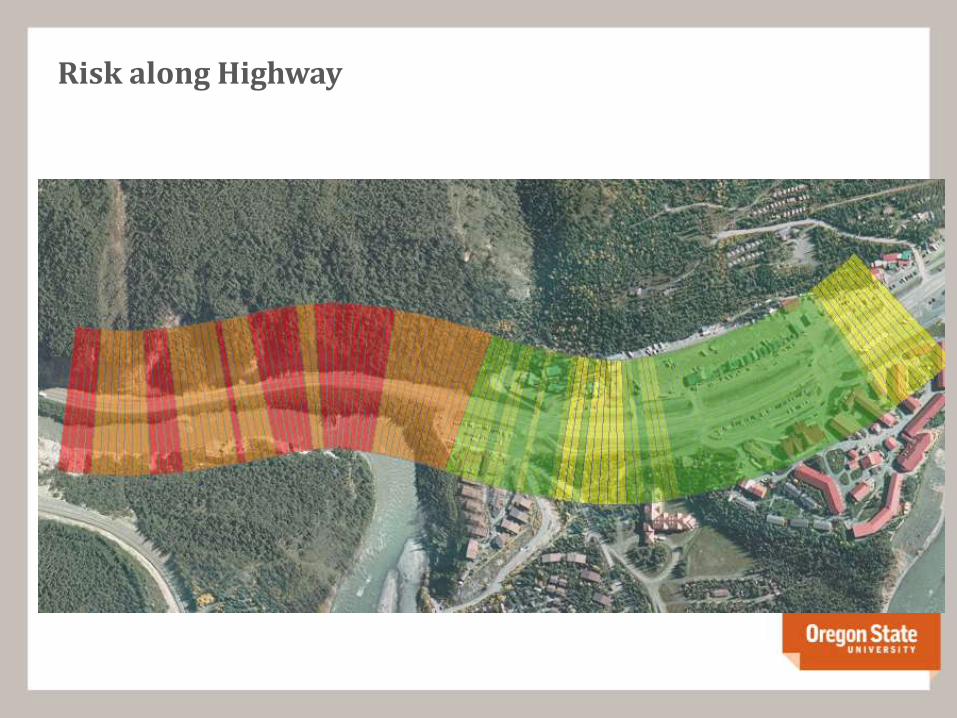
Risk along Highway

Understanding coastal change through terrestrial laser
scanning
64
Co-authors: Elizabeth Johnstone, Scott A. Ashford, Neal Driscoll, Falko Kuester
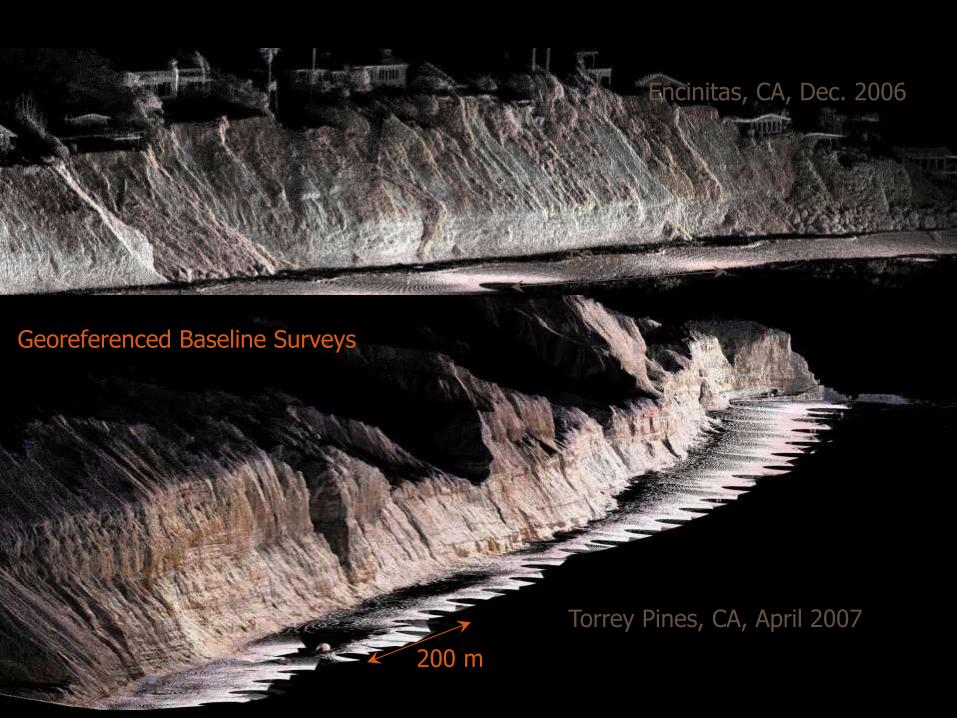
200 m
50 m
Georeferenced Baseline Surveys
Encinitas, CA, Dec. 2006
Torrey Pines, CA, April 2007

Feb 2006 Aug 2007
Feb 2008 Sep 2008
79 m3
50 m3
450 m3
*Change referenced to the November 2006 survey 66

Johnson Creek Landslide, OR
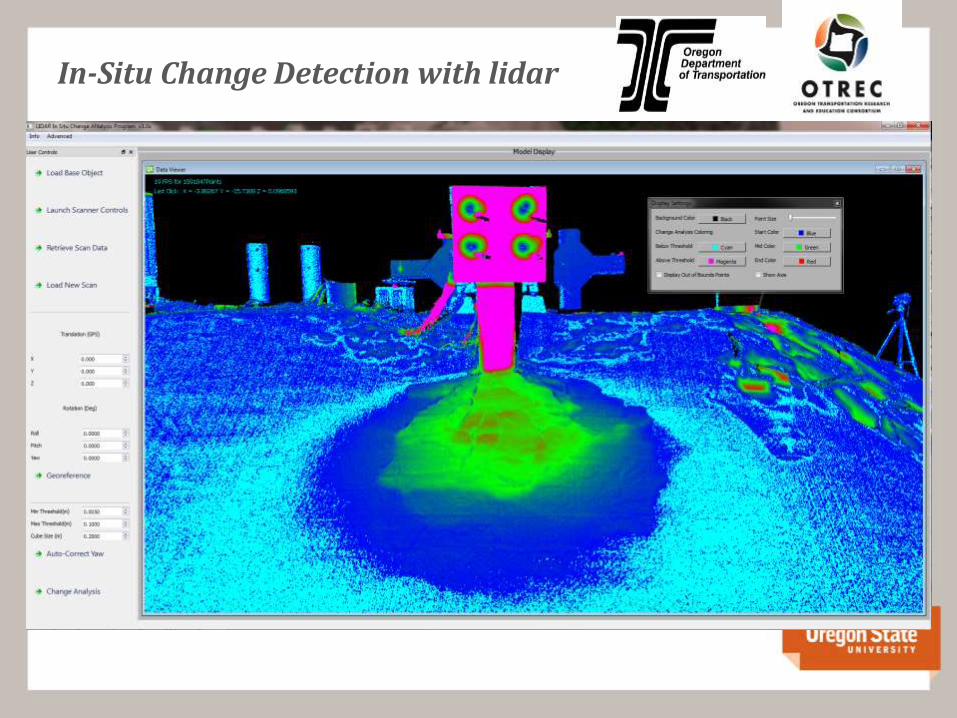
In-Situ Change Detection with lidar

LISCAN (In-Situ Change)

Landslide Inventory- DOGAMI
5/11/2015
Page 70
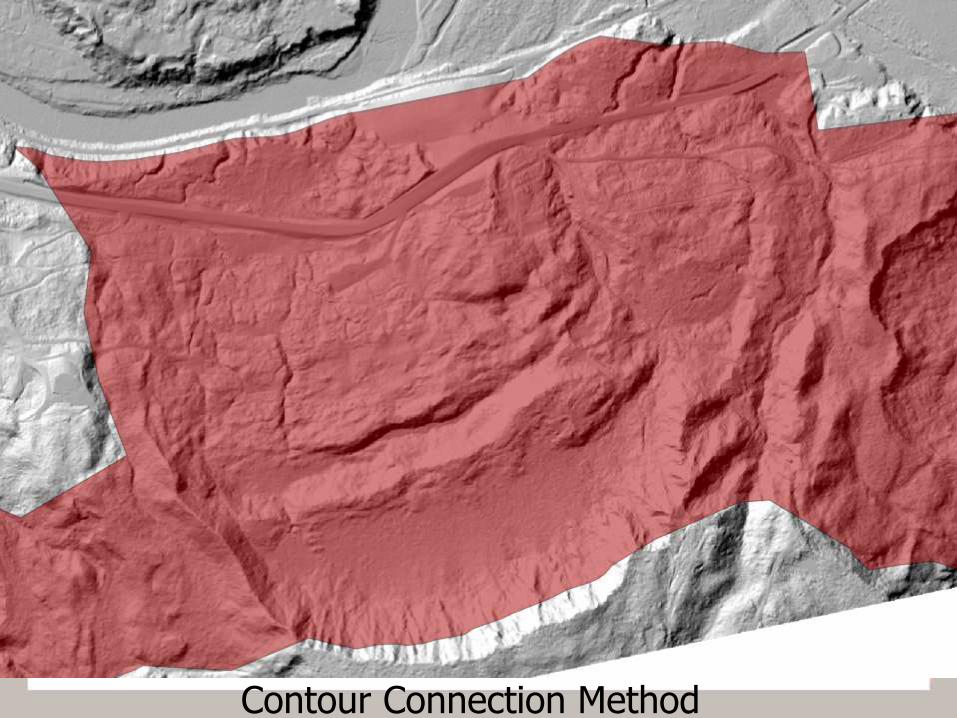
Contour Connection Method
71
Contour Connection Method
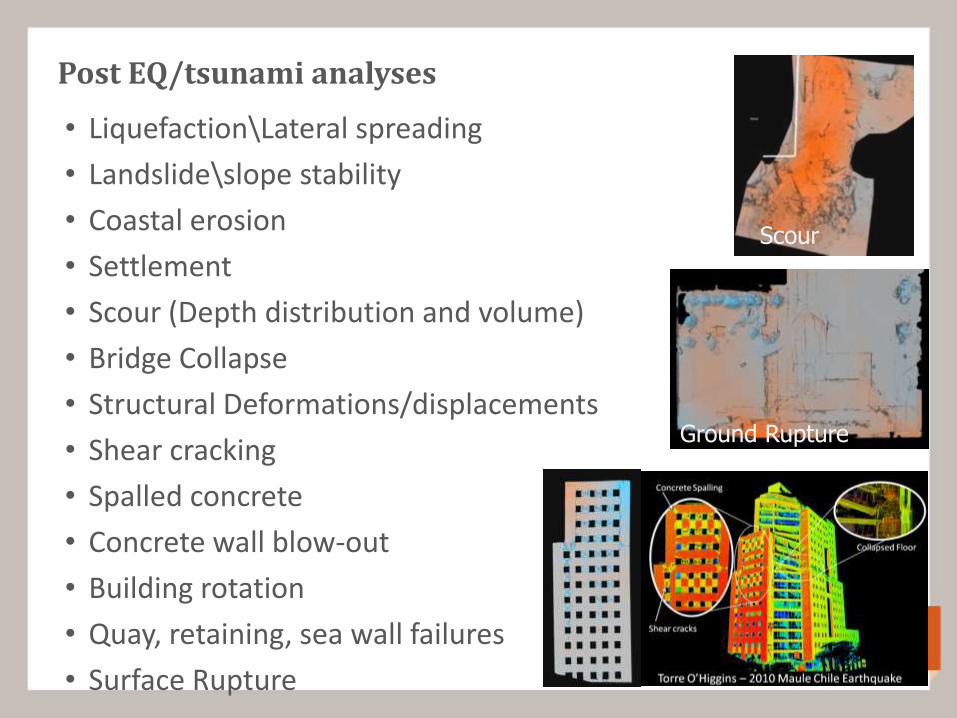
Post EQ/tsunami analyses
• Liquefaction\Lateral spreading
• Landslide\slope stability
• Coastal erosion
• Settlement
• Scour (Depth distribution and volume)
• Bridge Collapse
• Structural Deformations/displacements
• Shear cracking
• Spalled concrete
• Concrete wall blow-out
• Building rotation
• Quay, retaining, sea wall failures
• Surface Rupture
Scour
Ground Rupture

Capturing the Impacts: 3D Scanning after the
2011 Tohoku Earthquake & Tsunami
Michael J. Olsen
Ian N. Robertson
Gary Chock
Lyle P. Carden
Solomon Yim

Onagawa Buildings

Floor Lateral Displacement
(m)
4 (roof) 0.505
3 0.444
2 0.224
1 ground) 0.000
5/11/2015
Page 75
Point Cloud
Cross Section Measurements Photograph
Flow 8 m/s
67% blockage

Concrete Warehouse, Onagawa

Wall blow-outs: LIDAR versus FEM.
5/11/2015
Page 77
0.00 0.04 (m) 0.08 0.12 0.16 0.20 0.24 0.28 0.32 0.36 0.40 0.44 0.48 0.52

NSF- RAPID/Collaborative Research: Investigation of the Effects of Rockfall Impacts on Structures During the Christchurch Earthquake Series
78
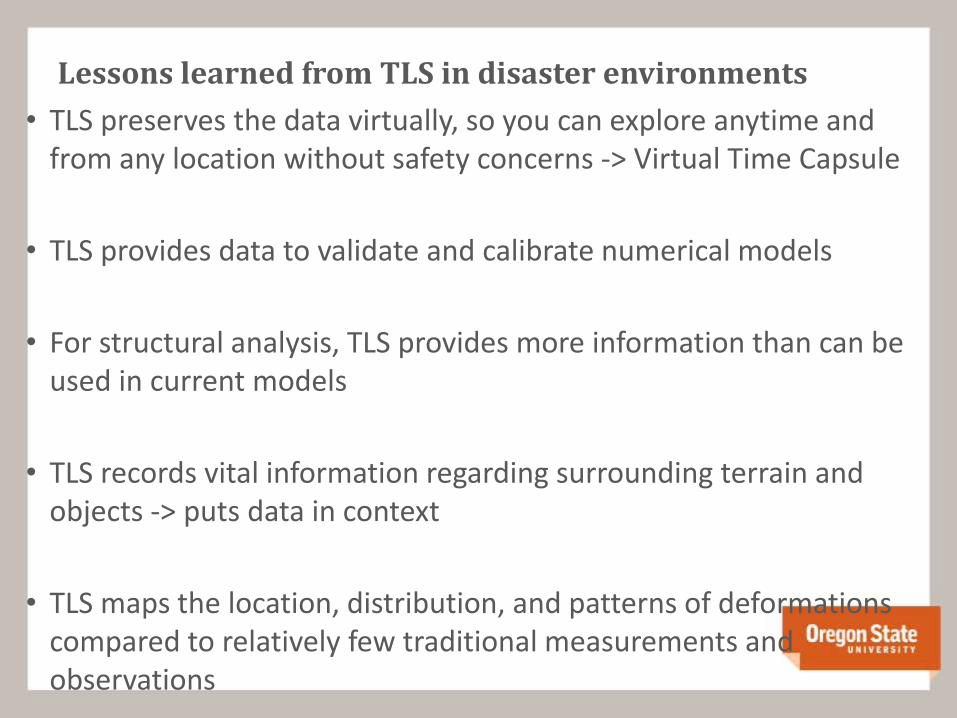
Lessons learned from TLS in disaster environments
• TLS preserves the data virtually, so you can explore anytime and from any location without safety concerns -> Virtual Time Capsule
• TLS provides data to validate and calibrate numerical models
• For structural analysis, TLS provides more information than can be used in current models
• TLS records vital information regarding surrounding terrain and objects -> puts data in context
• TLS maps the location, distribution, and patterns of deformations compared to relatively few traditional measurements and observations

Balboa Park
80
Balboa Park, San Diego, CA March 26, 2009

“Hall of the 500” Palazzo Vecchio Florence, Italy November 2007

5/11/2015
Page 82
Photograph by David Yoder, National Geographic

“Hall of the 500” Palazzo Vecchio Florence, Italy

84

Composite Materials
85
Composite Material Modeling

Value of lidar data
•Fast, accurate, safe way to survey
•Allows us to rapidly record time-constrained data
•Can see processes at scales that they occur
•Provides for more accurate quantification of damage
•Useful for input to develop and verify scientific models
•Captures information that can be continually queried without being present on site (New observations that can be missed in the field)
86

The Future •Hardware advancements
•Software advancements
•Full 3D planning, design and construction
•New, advanced 3D analysis techniques
•Structural monitoring and control
•Simultaneous Location and Mapping (SLAM)
•LIDAR data across the country
•(1-2m resolution vs 30 m)
•Handheld scanning/UAS
87

Acknowledgements
88
Irwin and Joan Jacobs UCSD Chancellor’s Interdisciplinary Fund
Neal Driscoll’s SIO Lab Falko Kuester’s GRAVITY lab

Questions for discussion?
Is that the Mars Rover?
How much did that wagon cost?
Are you communicating with the mothership?
Is that a submarine?
That looks suspiciously like a robot….is it?
I don’t need a computa, I can use my hand as a laser, right?
You know what you guys should get? An ATV!!!!
Well, now I’ll go to bed less stupid, right?
Can you beam me up, Scotty?
When will the aliens arrive?
Are you sending a satellite around the moon?
Do you have a concession stand in there? I’ll take a taco!!
Wanna see my geiods?
I was wondering if you were going to travel around the world in that thing, are you?
Do you keep your dollies in there? Can I play with them?
Hi Wall-E!
90

References • Olsen, M.J., Roe, G.V., Glennie, C., Persi, F., Reedy, M., Hurwitz, D., Williams, K.*, Tuss, H.,
Squellati, A., and Knodler, M. (2013). “Guidelines for the use of mobile lidar in transportation applications,” TRB NCHRP Final Report 748, 194 pp.
• Leshchinsky, B., Olsen, M.J., & Tanyu, B. (2015). “Contour Connection Method for Automated Identification and Classification of Landslide Deposits,” Computers and Geosciences, 74, 27-38.
• Chin, A.*, & Olsen, M.J. (2015). “Evaluation of technologies for road profile capture, analysis, and evaluation,” Journal of Surveying Engineering, 141(1), 04014011-(1-13), ASCE.
• Yim, S.C., Olsen, M.J., Cheung, K.F., & Azadbakht, M. (2014). “Tsunami modeling, fluid load simulation and validation using geospatial field data,” Journal of Structural Engineering, ASCE, Special Issue on Computational Simulation in Structural Engineering. 140(8), A4014012-(1-14).
• Olsen, M.J., (In Press). “In-Situ change analysis and monitoring through terrestrial laser scanning,” Journal of Computing in Civil Engineering, ASCE, 04014040.
• Conner, J.*, & Olsen, M.J., (2014). “Automated quantification of distributed landslide movement using circular tree trunks extracted from terrestrial laser scan data,” Computers and Geosciences, 67, 31-39.
• Williams, K.*, Olsen, M.J., Roe, G.V., & Glennie, C., (2013). “Synthesis of Transportation Applications of Mobile lidar,” Remote Sensing, Special Issue on Advances in Mobile Laser Scanning and Mobile Mapping, 5(9), 4652-4692.
• Olsen, M.J., Johnstone E., & Kuester F. (2013). “Hinged, pseudo-grid triangulation method for long, near linear cliff analysis,” Journal of Surveying Engineering, ASCE, 139(2), 105-109.

References - 2 • Chock, G., Carden, L., Robertson, I., Olsen, M.J., & Yu, G., (2013). Tohoku tsunami-induced
building failure analysis with implications for U.S. tsunami and seismic design codes, Earthquake Spectra, EERI, Special Issue on Tohoku Earthquake and Tsunami 29(S1), S99-125.
• Olsen M.J., Chen, Z., Hutchinson T.C., & Kuester, F., (2013). “Optical techniques for multi-scale damage assessment in natural hazard analysis,” Geomatics, Natural Hazards and Risk, 4(1), 49-70.
• Olsen M.J., Cheung, K.F., Yamazaki, Y., Butcher, S.M., Garlock, M., Yim, S.C., McGarity, S., Robertson, I., Burgos L., and Young Y.L. (2012). “Damage Assessment of the 2010 Chile Earthquake and Tsunami using ground-based lidar,” Earthquake Spectra, EERI, 28(S1), S179-197.
• Olsen, M.J., Johnstone, E., Kuester, F., Ashford, S.A., & Driscoll, N. (2011). “New automated point-cloud alignment for ground based lidar data of long coastal sections,” Journal of Surveying Engineering, ASCE, 137(1), 14-25.
• Olsen, M.J., Kuester, F., Chang, B., & Hutchinson, T. (2010). “Terrestrial laser scanning based structural damage assessment,” Journal of Computing in Civil Engineering, ASCE, 24(3), 264-272.
• Young, A.P., Olsen, M.J., Driscoll, N., Gutierrez, R., Guza, R.T., Flick, R.E., Johnstone, E., & Kuester, F., (2010). “Comparison of airborne and terrestrial lidar estimates of seacliff erosion in Southern California,” Journal of Photogrammetric Engineering and Remote Sensing, ASPRS, 76(4), 421-427.
• Olsen, M.J., Johnstone, E., Driscoll, N., Ashford, S.A., & Kuester, F., (2009). “Terrestrial laser scanning of extended cliff sections in dynamic environments: a parameter analysis,” Journal of Surveying Engineering, ASCE, 135(4), 161-169.