light vehicle dynamic rollover propensity phases … vehicle dynamic rollover propensity phases iv,...
TRANSCRIPT

1
Vehicle Researchand Test Center
14 Mar 02, page 1
Light Vehicle Dynamic Rollover Propensity Phases IV, V, and VI
Research Activities
Garrick J. Forkenbrock
W. Riley Garrott
NHTSA / VRTC

Vehicle Research and Test Center
Overview of NHTSA Rollover Research Phases
2
� Phase I-A – Spring 1997
– Exploratory in nature
– Emphasized maneuver selection and procedure development
� Phase I-B – Fall 1997
– Evaluation of test driver variability
– Introduction of the programmable steering machine
� Phase II – Spring 1998
– Evaluation of 12 vehicles using maneuvers researched in Phase I
� Phase IV
– Spring 2001
– Response to TREAD Act
– Consideration of many maneuvers
� Phase V
– Spring 2002
– Research factors that may affect dynamic rollover propensity tests
– Rollover and handling rating development
� Phase VI
– Evaluation of 25 vehicles using Phase IV recommendations
� Phase III-A – Spring 2000
– Introduction of “Roll Rate Feedback”
� Phase III-B – Summer 2000
– Pulse brake automation
Discussed in this presentation
14 Mar 02, page 2

Vehicle Research and Test Center
Phase IV Background
TREAD Act / Congressional Requirements:
– Develop dynamic rollover propensity tests to facilitate a consumer information program
– Consumer Information methodology released by November 2002
– National Academy of Sciences Report
314 Mar 02, page 3

Vehicle Research and Test Center
Additional Background
In their assessment of NHTSA’s existing rollover resistance rating system (January, 2002) the National Academy of Sciences recently recommended:
“NHTSA should vigorously pursue the development of dynamic testing to supplement the information provided by SSF.”
414 Mar 02, page 4

Vehicle Research and Test Center
Additional Background
� NHTSA is presently providing Rollover Resistance Rating
� Based on vehicle measurements and real world crash data
� Vehicle measurement is Static Stability Factor
� 5 Star ratings are similar to NCAP Crash Ratings
514 Mar 02, page 5

Vehicle Research and Test Center
6
T/2
Hcg
Weight W
Pull
Impending Rollover W(T/2)=P(Hcg) Pull/W = (T/2)/ Hcg
Pull/W=SSFWeight W
No Force
14 Mar 02, page 6

7
Vehicle Researchand Test Center
14 Mar 02, page 7
0%
10%
20%
30%
40%
50%
1 1.05 1.1 1.15 1.2 1.25 1.3 1.35 1.4 1.45 1.5 1.55 1.6
Static Stability Factor
Pro
babi
lity
of R
ollo
ver
per
Sin
gle
Veh
icle
Cra
sh

Vehicle Research and Test Center
Maneuver Recommendations
� Alliance of Automobile � MTS Systems Manufacturers Corporation
� Consumers Union � Nissan Motors
� Ford Motor Company � Toyota Motor Company
� Heitz Automotive, Inc. � UMTRI
� ISO 3888 Part 2 Consortium– VW, BMW, Daimler Chrysler
– Porsche, Mitsubishi
814 Mar 02, page 8

9
Vehicle Researchand Test Center
14 Mar 02, page 9
Phase IV Test Conditions

Vehicle Research and Test Center
Test Vehicles
� 2001 Chevrolet Blazer 4x2 � 2001 Ford Escape 4x4
– One star static rollover rating – Three star static rollover rating
– High sales volume – Smaller, car-like SUV
� 1999 Mercedes ML320 4x4 � 2001 Toyota 4Runner 4x4
– “Less aggressive” stability – “Aggressive” stability control control intervention intervention
– Two star static rollover rating – Two star static rollover rating
– First SUV with available – Relatively high sales volume stability control (ESP)
1014 Mar 02, page 10

Vehicle Research and Test Center
Vehicle Configurations
� Instrumented
� Fully fueled
� Front and rear mounted aluminum outriggers
� Performed with and without stability control
� Multiple configurations
– Nominal vehicle
– Reduced rollover resistance
1114 Mar 02, page 11

Vehicle Research and Test Center
Reduced Rollover Resistance
� Roof-mounted ballast
� Designed to reduce SSF by 0.05
� Increased roll inertia from Nominal condition
– Escape = 8.0 %
– Blazer = 11.5%
� Longitudinal C.G. preserved
� Maneuver sensitivity check Up to 180 lbs
1214 Mar 02, page 12

��
��
��
�
�� ��
���
���
��
Vehicle Research and Test Center
Reduced Rollover Resistance(measurements taken without instrumentation)
� 4Runner � Escape
– 180 lbs ballast – 120 lbs ballast
– C.G. raised 1.3” – C.G. raised 1.0”
– SSFNOMINAL = 1.11 (��) – SSFNOMINAL = 1.26 (�� ��)
– SSFRRR = 1.06 (��) – SSFRRR = 1.21 (���)
� Blazer � ML320
– 180 lbs ballast – 180 lbs ballast
– C.G. raised 1.3” – C.G. raised 1.2”
– SSFNOMINAL = 1.04 (��) – SSFNOMINAL = 1.14 (���)
– SSFRRR = 0.99 (�) – SSFRRR = 1.09 (��)
Note: Nominal SSF differ from those measured without outriggers. 1314 Mar 02, page 13

Vehicle Research and Test Center
Test Vehicle SSF Summary
0.90
1.00
1.10
1.20
1.30
Blazer 4Runner ML320 Escape
Sta
tic S
tab
ility F
acto
r (S
SF
)
Baseline
Nominal (no instrumentation)
Nominal (with instrumentation) RRR (no instrumentation)
SSFnom,i = 1.05
SSFnom,i = 1.12
SSFnom,i = 1.18
SSFnom,i = 1.27
1414 Mar 02, page 14

Vehicle Research and Test Center
Tires
� OEM specification (as installed on vehicle when delivered) – Make
– Model
– DOT Code
– Inflation pressure
� Frequent tire changes
� Innertubes used during some maneuvers to prevent debeading
Test surface damage due to debeading
� Maneuver speed iterations selected to minimize tire wear within a given test series
15 14 Mar 02, page 15

Vehicle Research and Test Center
Test Surface
� All tests performed on TRC’s VDA (a dry, high-mu asphalt surface)
� Tests performed 05/01 to 11/01, 02/02
� Stable friction coefficients
– Peak mu: 0.94 to 0.98
– Slide mu: 0.81 to 0.88
1614 Mar 02, page 16

17
Vehicle Researchand Test Center
14 Mar 02, page 17
Phase IV Maneuver Review

Vehicle Research and Test Center
Characterization Maneuvers
� Used to define NHTSA’s dynamic rollover propensity maneuvers
– Constant Speed, Slowly Increasing Steer
� Used to characterize transient response
– Pulse Steer
– Sinusoidal Sweep
– J-Turn Response Time Tests
1814 Mar 02, page 18

Vehicle Research and Test Center
Dynamic Rollover Propensity Maneuvers
� Driver-based Steering
– ISO 3888 Part 2
– CU Short Course
� Automated Steering – J-Turns
– Fixed Timing Fishhook
– Roll Rate Feedback Fishhook
– Nissan Fishhook
– Open-Loop Pseudo-Double Lane Change
� Driver-based Steering, Computer Corrected – Ford PCL LC
1914 Mar 02, page 19
20
Vehicle Researchand Test Center
14 Mar 02, page 20
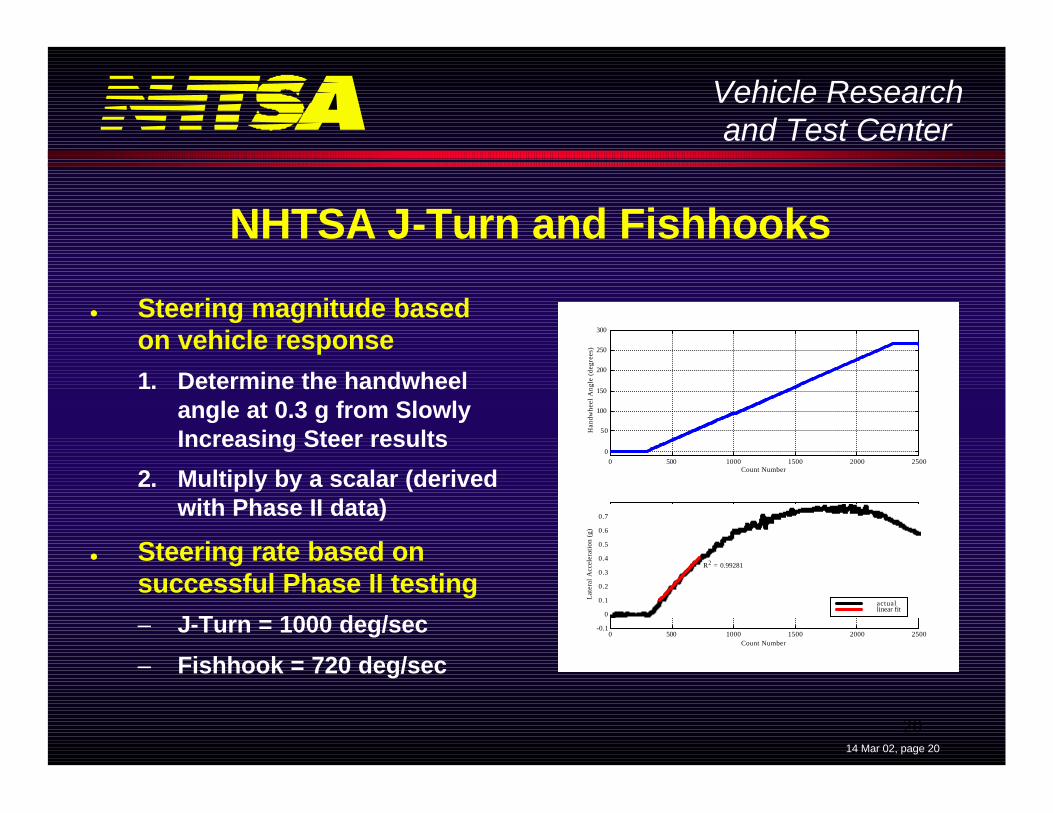
NHTSA J-Turn and Fishhooks
� Steering magnitude based on vehicle response
1. Determine the handwheel angle at 0.3 g from Slowly Increasing Steer results
2. Multiply by a scalar (derived with Phase II data)
� Steering rate based on successful Phase II testing
– J-Turn = 1000 deg/sec
– Fishhook = 720 deg/sec
0 500 1000 1500 2000 2500
0
50
100
150
200
250
300
Han
dwhe
el A
ngle
(de
gree
s)
Count Number
0 500 1000 1500 2000 2500-0.1
0
0.1
0.2
0.3
0.4
0.5
0.6
0.7
Lat
eral
Acc
eler
atio
n (g
)
Count Number
R2 = 0.99281
actuallinear fit

Vehicle Research and Test Center
NHTSA J-Turn
310ML320
3544Runner
287Escape
401Blazer
Handwheel Input
(degrees) Vehicle
2114 Mar 02, page 21

Vehicle Research and Test Center
NHTSA Fixed Timing Fishhook(Symmetric)
252ML320
2874Runner
233Escape
326Blazer
Handwheel Input
(degrees) Vehicle
2214 Mar 02, page 22

Vehicle Research and Test Center
NHTSA Roll Rate Feedback Fishhook(Symmetric)
23
252ML320
2874Runner
233Escape
326Blazer
Handwheel Input
(degrees) Vehicle
14 Mar 02, page 23

24
Vehicle Researchand Test Center
14 Mar 02, page 24
Nissan Fishhook
� Adjusts timing to maximize roll motion
� 270 degree initial steer
� Vehicle-dependent reversal magnitude (for fishhooks)– Blazer = 570 degrees
– Escape = 505 degrees
� All rates = 1080 deg/sec
� Response-dependent dwell times– Iterative determination
0 1 2 3 4 5 6 7 8-300
-200
-100
0
Han
dw
hee
l (d
eg)
Time
0 1 2 3 4 5 6 7 8-20
0
20
40
Ro
ll R
ate
(deg
/sec
)
Time
0 1 2 3 4 5 6 7 8
-200
0
200
400
600
Han
dw
hee
l (d
eg)
Time
0 1 2 3 4 5 6 7 8-1
-0.5
0
0.5
1A
Y (
g)
Time

Vehicle Research and Test Center
Closed-loop, Path-Following Lane Changes
Consumers Union Short Course
ISO 3888 Part 2
25 14 Mar 02, page 25

Vehicle Research and Test Center
Ford PCL LC
� Comprised of a suite of closed-loop paths (double lane changes)
� Data is processed to remove driver effects and facilitate comparison at a constant severity – All vehicles taken to follow the same path
– All vehicles subject to the same lateral acceleration demands
� Test output is an overall dynamic weight transfer metric
2614 Mar 02, page 26

27
Vehicle Researchand Test Center
14 Mar 02, page 27
Ford PCL LC
Full Lane Lane and a HalfHalf Lane

28
Vehicle Researchand Test Center
14 Mar 02, page 28
Comments Based on Phase IV Rollover
Resistance Maneuvers

Vehicle Research and Test Center
NHTSA J-Turn
� Lowest speed of two-wheel lift is metric
� Uses Programmable Steering Controller
� Simple step-steer (one cycle)
� Handwheel magnitude dependent on vehicle response
2914 Mar 02, page 29

Vehicle Research and Test Center
J-Turn with Pulse Braking
� Lowest speed of two-wheel lift is metric
� Uses Programmable Braking and Steering Controller
� Addition of Braking Controller makes maneuver substantially harder to perform
� Timing of brake pulse dependent on vehicle response (Roll Rate Feedback)
� Results significantly influenced by whether vehicle has working ABS
3014 Mar 02, page 30

Vehicle Research and Test Center
Fixed Timing Fishhook
� Lowest speed of two-wheel lift is metric
� Dwell time independent of vehicle response
� Handwheel magnitudes dependent on vehicle response
� Handwheel inputs within ranges established during ISO and CU double lane change testing
� Timing may be better for one vehicle than another
3114 Mar 02, page 31

Vehicle Research and Test Center
Roll Rate Feedback Fishhook
� Lowest speed of two-wheel lift is metric
� Handwheel magnitudes dependent on vehicle response
� Handwheel inputs within ranges established during ISO and CU double lane change testing
� Dwell time also dependent on vehicle response
� Timing should no longer favor one vehicle over another
3214 Mar 02, page 32

Vehicle Research and Test Center
Nissan Fishhook
� Lowest speed of two-wheel lift is metric
� Iterative procedure requires additional testing time
� Large number of tests required many tire changes (to reduce tire wear concerns)
� Reversals are harsh; increases steering machine wear
3314 Mar 02, page 33

Vehicle Research and Test Center
Ford Path Corrected Limit Lane Change (PCL LC)
3414 Mar 02, page 34

Vehicle Research and Test Center
Ford PCL LC� Metric Dynamic Weight Transfer at 0.7 g based
on one of four standard paths (DWTM)
� Method removes driver dependence by normalizing data
� Extra instrumentation needed to run
� Extra tire testing required (tire measurements)
� Concerns about 0.40 second window used for metric calculation (mitigates dynamic weight transfer observed)
� Metric now measured during tests performed with a driving robot
3514 Mar 02, page 35

�
Vehicle Research and Test Center
ISO 3888 Part 2 Double Lane Change
� Suggested rating metric is maximum achievable “clean” run speed
– “Clean” run � no cones struck/bypassed
� Test driver generated steering inputs
� Not as repeatable as programmable steering controller inputs
� Tests are straightforward to perform
� Course adapts to vehicle width
3614 Mar 02, page 36

�
Vehicle Research and Test Center
Consumers Union Short CourseDouble Lane Change
� Suggested rating metric is maximum achievable “clean” run speed – “Clean” run � no cones struck/bypassed
� Test driver generated steering inputs
� Not as repeatable as programmable steering controller inputs
� Tests are straightforward to perform
� Course does not adapt to vehicle size
3714 Mar 02, page 37

Vehicle Research and Test Center
Open-Loop Pseudo-Double Lane Change
� Uses programmable steering controller
� Having three major steering moves slightlydegrades repeatability
� Straight-forward to perform
� Uses programmable steering controller
� Additional development required
3814 Mar 02, page 38

Vehicle Research and Test Center
Reporting of Phase IV Findings
Draft of Phase IV NHTSA Technical Report has been written
– Reviews in progress
– Anticipated release late Spring ‘02
3914 Mar 02, page 39

40
Vehicle Researchand Test Center
14 Mar 02, page 40
Phase V Research

Vehicle Research and Test Center
Phase V Overview
� Investigate potential use of a centrifuge
� Improved test equipment– Alternative outrigger development
– Quantification of two-wheel lift
� Resolution of existing matters– Cold and hot weather testing
– Surface effects testing
� Finalize methodology for Phase VI– Loading
4114 Mar 02, page 41

Vehicle Research and Test Center
Centrifuge
� Metric could be lateral acceleration at wheel lift or weight transfer
� Quasi-static test
� May be demonstrated by NHTSA using a NASA Facility
4214 Mar 02, page 42

Vehicle Research and Test Center
Outrigger Development
� Reduce effects of � Compare three designs
outrigger installation – Existing VRTC Design
without compromising � Aluminum driver safety � 78 lbs per outrigger
� Use wheel load – New VTRC Design
transducers to evaluate � Titanium
dynamic load transfer and � 68 lbs per outrigger
cornering forces – Carr Engineering
� Carbon fiber
� 58 lbs per outrigger
� Testing complete
4314 Mar 02, page 43

Vehicle Research and Test Center
Carbon Fiber
� Manufactured by Carr Engineering
� Light weight (58 lbs)
� Strong
� Expensive ($25k / set)
4414 Mar 02, page 44

Vehicle Research and Test Center
Titanium
� Designed at VRTC using finite element analysis
� Light weight (68 lbs)
� Less roll inertia than aluminum or carbon fiber
� Strong
� 1/3 cost of carbon fiber
� 6Al-4V a common Ti alloy
� Low-mu hemispherical skid pads replace heavier casters
4514 Mar 02, page 45

Vehicle Research and Test Center
Quantification of Two-Wheel Lift
� Objective methodology required
� Laser-based height sensors on each wheel– Eliminates video data analysis subjectivity
4614 Mar 02, page 46
Vehicle Research and Test Center
Cold and Hot Weather Testing
� Will research the effects of temperature extremes on dynamic rollover propensity
� All testing to be performed at TRC
� Cold weather tests performed during January ‘02
� Hot weather tests to be performed Summer ‘02
4714 Mar 02, page 47

Vehicle Research and Test Center
Surface Effects Testing
� Intended to research the effects of different test surfaces on dynamic rollover propensity
� Testing presently underway in Arizona
– DaimlerChrysler Arizona Proving Grounds (APG)
– GM Desert Proving Grounds
– Performed with the Blazer and 4Runner
� Results from Arizona will be compared with those produced at TRC
4814 Mar 02, page 48

49
Vehicle Researchand Test Center
14 Mar 02, page 49
Phase VI

Vehicle Research and Test Center
Phase VI Overview
� Maneuvers based on Phase IV findings
� Two load conditions are anticipated
� Titanium outriggers
� 25 Vehicles
� Will include a wide range of make/models for which state rollover rate data is available
5014 Mar 02, page 50