light-induced expression of a blue coral protein in an
TRANSCRIPT

Union CollegeUnion | Digital Works
Honors Theses Student Work
6-2018
Light-Induced Expression of a Blue Coral Protein inan Industrial FungusLindsay Tomczak
Follow this and additional works at: https://digitalworks.union.edu/theses
Part of the Biology Commons, Genetics and Genomics Commons, and the Laboratory and BasicScience Research Commons
This Open Access is brought to you for free and open access by the Student Work at Union | Digital Works. It has been accepted for inclusion in HonorsTheses by an authorized administrator of Union | Digital Works. For more information, please contact [email protected].
Recommended CitationTomczak, Lindsay, "Light-Induced Expression of a Blue Coral Protein in an Industrial Fungus" (2018). Honors Theses. 1586.https://digitalworks.union.edu/theses/1586

Light-Induced Expression of a Blue Coral Protein in an Industrial Fungus
Lindsay Tomczak Professor J. Stephen Horton
Biology Department, Union College June 2018

2
Abstract Tomczak, L. (2018, June). Light Induced Expression of a Blue Coral Protein in an Industrial Fungus. Department of Biological Sciences. Advisor: Prof. J. Stephen Horton
The ultimate goal of this research project is to improve the growth and structural
characteristics of an Ecovative Design LLC (Green Island, NY) production strain to produce
commercial biomaterials for packaging. These biomaterials are produced from renewable
resources and can be easily broken down after they fulfill their purpose, unlike the commonly
used materials today (such as Styrofoam). In an effort to quantify the light-reactivity of the
fungus, a codon-optimized DNA sequence coding a blue chromoprotein was introduced and
utilized as a visual reporter gene. Transcriptional controlling sequences were identified from
orthologs to specific light-regulated genes and were combined with a codon-optimized version
of the coral Amil-CP Blue chromoprotein gene. This resulted in recombinant DNA constructs
suitable for Agrobacterium-mediated transformation of the fungus. PCR and restriction
enzyme digestion was used to verify the correct organization of the fragments making up each
recombinant DNA molecule. Unfortunately, no evidence of the chromoprotein gene product
could be detected by SDS-Polyacrylamide gel electrophoresis of total cell lysates from PCR-
verified transformants. This research was supported by a grant to Ecovative Design from
DARPA (BAA-16-50).

3
Acknowledgments
I would like to thank:
My advisor, Dr. Stephen Horton, for his endless patience, thoughtful guidence and dedicated instruction. I cannot express just how greatful I am for this experience. Our colleagues at Ecovative, for giving me the opportunity to work with them on their amazing and innovative process, as well as the funding from DARPA, without which this project would not have been possible. Union College Biology Department, for providing four years of an enriching learning environment and laboratory experience as well as preparing me for my future. Fall 2017 BIO 384 Students, for helping me with this project by exploring additional light-reactive genes and gathering information that I could use in my analysis. My Friends and Family, for their constant support and interest in my project. Their love and encouragement gave me the strength to finish this yearlong thesis research project and my four years at Union.

4
Table of contents
Abstract……………………………………….……………………………………………....2
Acknowledgements ……………………………………………………………………….…3
Introduction…………………………………………………………………………….…….5
Ecovative and Mycelium Background …………...…………………………...………………5
Ecovative Design Process……………………………………......…………………………....6
Benefits of Creating a Light-Responsive Reporter Gene System……………………..............7
Overview of the Molecular Biology of Light Perception and Response…………..……...…..7
Light Regulated Genes in Neurospora crassa…………………….…..……………................8
Amil-CP Blue Chromoprotein as Visual Reporter ……………………………...…………..10
Methods and Materials……………………………………………………………………..12
Gibson Assembly of Light-Regulated Recombinant DNA Constructs……………………...12
Transformation of Recombinant DNAs into Bacteria, and Verification of Constructs……...15
Agrobacterium tumefaciens Mediated Transformation (ATMT) of Basidiomycete Fungi….15
Fungal DNA Isolation…………………………………….……………………….................17
Fungal Protein Isolation………………………...…………………………………................18
Results and Discussion……………………………………………………………………...19
Recombinant DNA Constructs…………………………...…………………………………..19
Construction and Verification of Light-Responsive Recombinant DNA Plasmids………….21
Diagnostic PCR Analysis of Selected Recombinant DNA Clones……..……………..……..25
Basidiomycete ATMT Co-Transformation with Amil-CP Blue
and Carboxin-Resistance Constructs....................................................................................................27
Protein and SDS-PAGE Results………………………………………………………...…...31

5
Final Thoughts……………………………………………………………………………….33
References…………………………………………………………………………………...34
Introduction
Ecovative and Mycelium Background
Ecovative Design, LLC is a leading biomaterials company located in Green Island,
NY. The company’s goal is to ultimately reduce or eliminate the use of toxic and
unsustainable materials, such as Styrofoam, commonly found in packaging materials today.
As an alternative, Ecovative has engineered products that are high performing, cost
competitive, compostable, and fire-resistant by using agricultural waste and biological
material. The agricultural waste is inoculated with live fungal mycelia, which in turn creates
an innovative “Mushroom material” (1). Unlike plants, mushrooms do not use photosynthesis
as a means to produce energy or use seeds to reproduce. Instead, they reproduce by spores
(sexual and asexual), which can germinate under appropriate conditions to produce a mass of
“interwoven, single-cell wide structures known as hyphae” (2). Masses of hyphae are known
as mycelium (2). In other words, as this agro-fungal mixture continues to incubate, the
mycelium is the essential hydrophobic glue that holds the material together. Throughout the
growth process, the fungus secretes a variety of enzymes that break down the organic
material present within the substrate acting as the host, to use as nutrition. Genetically
engineering the fungal component of the bio-polymer is a priority for Ecovative: my task was
to utilize a DNA transformation method which would potentially allow for the expression of
a coral chromoprotein for use as a reporter for future gene expression studies of the fungus.

6
Ecovative's main production strain for the manufacture of engineered wood will be
referred to in this thesis as simply the production strain used by Ecovative, for proprietary
reasons. Ecovative’s exact processes and technology are patentable trade secrets. They have a
large library of fungal strains and the specific industrial uses of the strain of fungus being
studied (and the identity of the strain itself) are patent-protected. While certain details will be
omitted from this thesis, the overall goals and results will be discussed at length.
Ecovative Design Process
After Ecovative purchases agricultural waste material at a low cost from farmers in
the local area, it goes through a pasteurization process. This pasteurization greatly reduces,
but does not eliminate the bioburden of the material, which is then inoculated with the
mycelium. This mixture is then placed in large plastic bags and sealed. The mycelium uses
the agricultural waste as a substrate and consumes some of it. After a certain period of time
(about 5 days usually), a matrix of white fibers is formed, which coats the dead plant
material. This new material gets reground into loose particles (called the “Regrind” stage).
These particles are then put into plastic molds (growth trays), which allow the mycelium to
grow through and around the particles once again. This allows for more points of inoculation
for the established fungus, and eventually forms a solid structure that fills the specific shape
or mold of the growth tray. Once the material is completely solidified, it is removed from the
mold and actively dried out to prevent more fungal growth. The biomaterial can be formed
and dried out in structures of various shapes, depending on the needs of the customers (1).
The research presented in this thesis will focus on helping Ecovative by establishing
protocols needed to perform molecular genetic manipulations of Ecovative’s fungal strain,
which will potentially allow for new and novel growth characteristics of the fungus.

7
Benefits of Creating a Light-Responsive Reporter Gene System
The main goal of this project is to transform the fungal strain used by Ecovative in
order to help optimize their process of making biodegradable materials. One way to achieve
this is to genetically reprogram the fungus in order to enhance or modify its natural
biological properties. One natural property of fungi is that they are able to respond to
different stimuli in the environment, such as light. Similar to most life on the planet, fungi
contain photoreceptors, which are proteins that have the ability to harvest light in order to
generate a signal that stimulates a cellular response (3). This cellular response could be a
variety of things, such as causing the reorientation of the direction in which the fungus is
growing or altering the spectrum of gene transcription, which can cause new structures to
form (3). By isolating the promoter and terminator of characterized light-reactive genes
found in fungi, the expression of potentially any protein-coding sequence inserted in between
can be made to be light-responsive. My specific project is to insert a gene for a blue
chromoprotein from coral in between the promoter and terminator of these light-responsive
genes to act as a visual reporter. By altering the DNA of their production strain, Ecovative
will potentially be able to use this new genetically transformed fungus, hopefully improving
their overall process.
Overview of the Molecular Biology of Light Perception and Response
The molecular analysis of the transcriptional response to light has been best studied in
the ascomycete fungus, Neurospora crassa. White Collar-1 (WC-1), both a transcriptional
activator and a blue light receptor, and White Collar-2 (WC-2), a transcriptional coactivator,
form a complex, called the White Collar Complex (WCC). Once light reaches this complex,
it transcriptionally activates a wide number of light-responsive genes by binding as a

8
heterodimer to specific elements within their promoters. This light response is eventually
turned off by the action of one of these target genes for the WCC. When transcribed and
translated, Vivid (vvd) interacts directly with the WCC in order to negatively regulate the
light response that WCC initiated (4). This process is depicted in Figure 1 with the
comparison of the gene present in the dark to the gene present in the light. When the fungus
is placed in the dark, there is no transcription of the genes vvd or gene x, however, once the
fungus is brought into the light, the WCC complex activates transcription of the gene which
can then produce proteins.
Figure 1. Figure taken from Hurley et al., (2012). Outcomes of expression conditions from vvd promoter in Neurospora. A) In dark conditions all genes driven by vvd promoter are not induced. B) In light conditions in the wild type strain, the light activated WCC turns on expression at the vvd promoter. This activation leads to the production of WD that inhibits the activation at the vvd promoter by acting back on the WCC.
Light Regulated Genes in Neurospora crassa
In order to transform the Ecovative production strain, we utilized the promoter and
terminator sequences of light-regulated genes from the well-studied model organism
Neurospora crassa and inserted a codon-optimized coding sequence for a blue coral
chromoprotein. The study done by Wu et al. (2014) gave some insight as to the specific light
regulated genes identified in the bread mold, Neurospora crassa. We selected three light-
regulated genes, con-6 (conidiation-6), bli-4 (bli-4 protein), and bli-3 (blue light-induced-3).
All of these genes are both light-responsive and expressed relatively strongly after exposed to

9
light for a period of time (5). The conidiation (con)-related genes especially, have been
shown to be light responsive with rapid, high-level, sustained light responses (5). Although
originally identified by Wu et al. (2014) in Neurospora crassa but the Ecovative production
strain also has what appear to be likely orthologues. Figure 2 depicts (indicated by green
arrows) these three light-responsive genes that I decided to focus on. The red arrows indicate
some other genes in Neurospora that were highly expressed in the light but have no obvious
orthologue in the Ecovative production strain. By isolating the promoter and terminator of
these genes from our fungus and combining them with a visual reporter, the blue
chromoprotein, I could then transform the Ecovative production strain with this new
construct. The genes I focused on were bli-4 and con-6, the Fall 2017 Bio 384 class worked
with the genes, bli-3 and bli-4.
Figure 2. Information taken from the study done by Wu et al., (2014). The genes listed are all light
regulated and found in the bread mold, Neurospora crassa. The values represent the log2 change in expression compared to the dark at that specific time point. The green arrows point to the selected genes with high expression and are also present in the Ecovative production strain. The red arrows point to other genes that are highly expressed but are not found in the production strain.
10
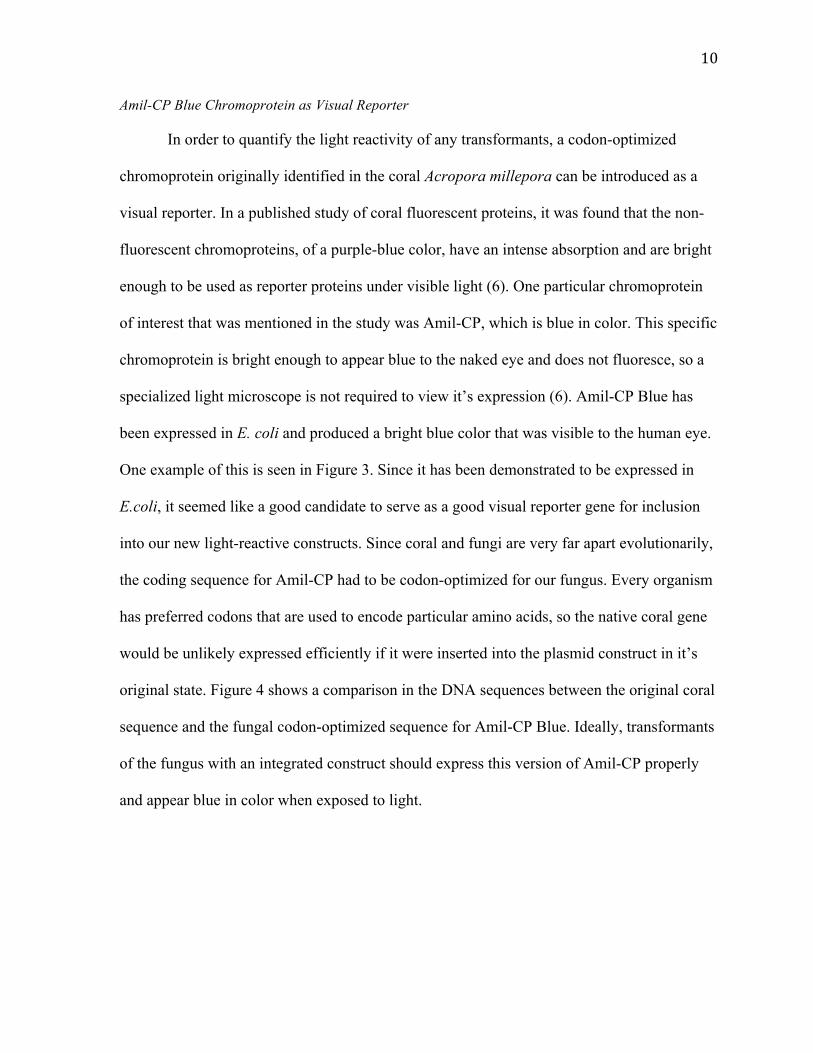
Amil-CP Blue Chromoprotein as Visual Reporter
In order to quantify the light reactivity of any transformants, a codon-optimized
chromoprotein originally identified in the coral Acropora millepora can be introduced as a
visual reporter. In a published study of coral fluorescent proteins, it was found that the non-
fluorescent chromoproteins, of a purple-blue color, have an intense absorption and are bright
enough to be used as reporter proteins under visible light (6). One particular chromoprotein
of interest that was mentioned in the study was Amil-CP, which is blue in color. This specific
chromoprotein is bright enough to appear blue to the naked eye and does not fluoresce, so a
specialized light microscope is not required to view it’s expression (6). Amil-CP Blue has
been expressed in E. coli and produced a bright blue color that was visible to the human eye.
One example of this is seen in Figure 3. Since it has been demonstrated to be expressed in
E.coli, it seemed like a good candidate to serve as a good visual reporter gene for inclusion
into our new light-reactive constructs. Since coral and fungi are very far apart evolutionarily,
the coding sequence for Amil-CP had to be codon-optimized for our fungus. Every organism
has preferred codons that are used to encode particular amino acids, so the native coral gene
would be unlikely expressed efficiently if it were inserted into the plasmid construct in it’s
original state. Figure 4 shows a comparison in the DNA sequences between the original coral
sequence and the fungal codon-optimized sequence for Amil-CP Blue. Ideally, transformants
of the fungus with an integrated construct should express this version of Amil-CP properly
and appear blue in color when exposed to light.

11
Figure 3. Photo of Amil-CP expressed in E. coli, visibly blue to the naked eye in E. coli colonies. (7)
Figure 4. DNA sequence of the coding region for the Amil-CP Blue chromoprotein from the coral, Acropora millepora (bottom sequence “Original”) aligned using BLAST to the fungal codon-optimized version (top sequence “Optimized”). Differences in the DNA sequences appear in red in the top optimized sequence.

12
Methods and Materials
Gibson Assembly of Light-Regulated Recombinant DNA Constructs
In order to transform the fungus, I had to create and use a plasmid, which is a strand
of circular bacterial DNA that we use as a cloning vector. Once I insert the promoter,
terminator and gene of our choosing into the backbone plasmid (pOSCAR), it is transformed
into E. coli where multiple copies are made by the cells’ replication machinery (8). These
plasmids can then be used to transform the fungal cells by inserting our desired gene
constructs. The vector that will be used in this case is pOSCAR, a plasmid developed for use
in fungal transformation by ATMT (8). This vector, with the addition of the promoter, Amil-
CP Blue gene and terminator will form our plasmid. In order to form the new constructs I
used a technique called Gibson Assembly. This technique was developed by Dr. Daniel
Gibson in 2009 in order to easily assemble multiple linear DNA fragments (9). This process
is relatively simple and quick, requiring DNA fragments (either preexisting or created by
PCR) to be incubated with a mix of enzymes containing an exonuclease, a polymerase, and a
DNA ligase (9). Before assembling the plasmid, I first amplified the individual components
of each construct that would be inserted into the pOSCAR plasmid vector.
Once the plasmid construct pieces have been confirmed by PCR to be of the correct
size, a larger PCR reaction of 30µl instead of the usual 15µl is done and then separated by
size via agarose gel electrophoresis. After the gels have finished running and are stained by
ethidium bromide, the bands corresponding to each of the plasmid construct fragments are
visualized, using a handheld UV light and then cut out from the gel using a sterile razor
blade. DNA fragments were then purified and eluted from the gel slices via the use of the
Illustra GFX DNA purification kit (GE Healthcare). This gel purification step helps to
13
separate the DNA that is to be used in Gibson Assembly from other DNA that may be
present such as DNA that was accidentally amplified in the PCR reaction, or ‘primer dimer’
fragments that are often a result of PCR (11). Qubit Assays (ThermoFisher Scientific) were
then used to quantify these gel-purified PCR samples in order to determine the concentration
of each sample prior to Gibson Assembly.
For the Gibson Assembly reactions, four fragments of DNA need to be inserted
together for each of the desired gene constructs. For my two constructs utilizing bli-4 and
con-6 gene controlling sequences, the fragments consisted of the promoter, the Amil-CP Blue
gene, the terminator (all produced by PCR) and the pOSCAR vector backbone, digested with
the restriction enzymes, Hind III and Kpn I. These fragments are then incubated at 50ºC with
the Gibson Assembly enzyme mix (New England Biolabs) for 120 to 180 minutes.
14
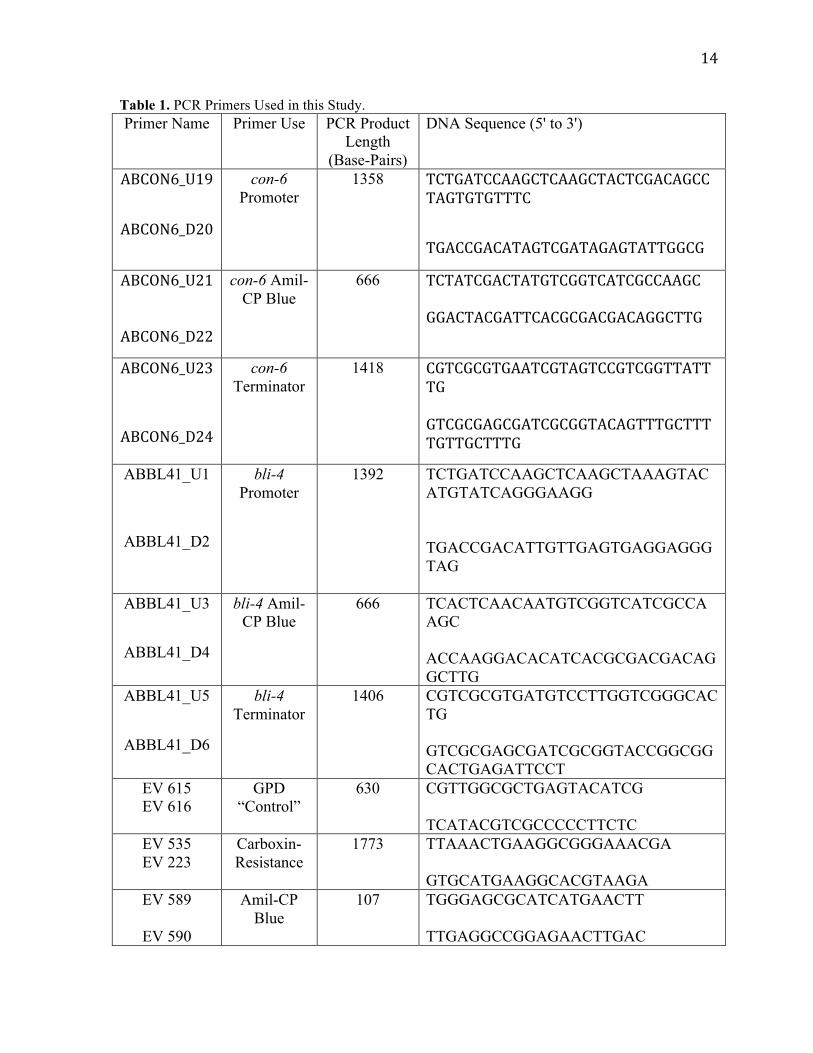
Table 1. PCR Primers Used in this Study. Primer Name Primer Use PCR Product
Length (Base-Pairs)
DNA Sequence (5' to 3')
ABCON6_U19
ABCON6_D20
con-6 Promoter
1358 TCTGATCCAAGCTCAAGCTACTCGACAGCCTAGTGTGTTTCTGACCGACATAGTCGATAGAGTATTGGCG
ABCON6_U21
ABCON6_D22
con-6 Amil-CP Blue
666 TCTATCGACTATGTCGGTCATCGCCAAGC GGACTACGATTCACGCGACGACAGGCTTG
ABCON6_U23
ABCON6_D24
con-6 Terminator
1418 CGTCGCGTGAATCGTAGTCCGTCGGTTATTTG GTCGCGAGCGATCGCGGTACAGTTTGCTTTTGTTGCTTTG
ABBL41_U1
ABBL41_D2
bli-4 Promoter
1392 TCTGATCCAAGCTCAAGCTAAAGTACATGTATCAGGGAAGG TGACCGACATTGTTGAGTGAGGAGGGTAG
ABBL41_U3
ABBL41_D4
bli-4 Amil-CP Blue
666 TCACTCAACAATGTCGGTCATCGCCAAGC ACCAAGGACACATCACGCGACGACAGGCTTG
ABBL41_U5
ABBL41_D6
bli-4 Terminator
1406 CGTCGCGTGATGTCCTTGGTCGGGCACTG GTCGCGAGCGATCGCGGTACCGGCGGCACTGAGATTCCT
EV 615 EV 616
GPD “Control”
630 CGTTGGCGCTGAGTACATCG TCATACGTCGCCCCCTTCTC
EV 535 EV 223
Carboxin-Resistance
1773 TTAAACTGAAGGCGGGAAACGA GTGCATGAAGGCACGTAAGA
EV 589
EV 590
Amil-CP Blue
107 TGGGAGCGCATCATGAACTT TTGAGGCCGGAGAACTTGAC

15
Transformation of Recombinant DNAs into Bacteria, and Verification of Constructs
After the Gibson Assembly was completed, the resulting plasmid constructs are then
transformed into E. coli by electroporation. Transformants were selected by plating on the
antibiotic, spectinomycin. Plasmid DNA from E. coli was isolated by the alkaline lysis
miniprep method using a Wizard EV kit (Promega). Correct conformation of plasmid DNA
constructs were determined by both PCR by performing restriction endonuclease digestions. I
used the online program, NEBcutter, http://nc2.neb.com/NEBcutter2 , to determine the
appropriate restriction enzymes to use for diagnostic digests of the plasmid DNA. The
enzymes chosen would cut the sequence 2 or 3 times, depending on the enzyme, and have
resulting fragments of different sizes that could easily be distinguished on an agarose gel.
The three enzymes used for the con-6 construct were Eco RI (HF), Nde I (HF) and Xba I. For
the bli-4 construct, the enzymes Xba I, Xho I and Hind III, and Sph I and Eco RI were used.
Each reaction consisted of a mix, containing water, 10X CutSmart Buffer and the desired
enzyme or pair of enzymes, with the plasmid DNA. The reactions run overnight in a water
bath heated to 37ºC, and then analyzed by agarose gel electrophoresis.
Agrobacterium tumefaciens Mediated Transformation (ATMT) of Basidiomycete Fungi
The ATMT (Agrobacterium tumefaciens- Mediated Transformation) transformation
process is a multi-week procedure. Agrobacterium strain AGL-1 was transformed with the
recombinant DNA previously transformed into E. coli by standard procedures. Transformants
were selected on LB + Ampicillin (100 µg/ml) + Spectinomycin (100 µg/ml) plates and
grown for 3 days at 27-28ºC (8). Selected antibiotic-resistant colonies of transformed
Agrobacterium were independently isolated, reselected, and then verified via PCR for the
presence of the recombinant DNA plasmid. For use in ATMT, fresh colonies were

16
innoculated into 10 ml of low-salt LB medium + 100 µg/ml Spectinomycin. Cultures were
grown at 27ºC, shaking at 225 RPM until their optical density (O.D. 600) reached the range
of 0.4 to 0.9 (usually 15-17 hours). Cells were harvested in sterile 15 ml conical tubes, and
centrifuged at 3,500 X g in an Eppendorf Clinical Centrifuge (Model 5702 R) for 7 minutes.
The supernatant was removed and the cells resuspended in 1 ml of Induction Medium and
transferred to a sterile microfuge tube. The tubes were centrifuged (using an Eppendorf
Microfuge) at 7000 rpm for 5 minutes. The supernatant was removed, and the pellet
resuspended in 500 µl of Induction Medium. The centrifuge process was repeated one more
time until the cells were resuspended in 150 µl of Induction Medium. The concentrated
Agrobacterium culture was diluted to an O.D. 600 of 0.15 in a volume of 10 ml Induction
Medium + 200µM Acetosyringone in a 50 ml sterile conical tube. This is called the pre-
induction step. The entire tube was covered with foil (Acetosyringone is light-sensitive) and
grown at 27ºC shaking at 250 RPM until cells reach an optical density (O.D. 600) of 0.3
(anywhere from 10 to 17 hours). Next, Agrobacterium cells were concentrated to an optical
density (O.D. 600) of 0.8 by centrifugation, achieved by the removal of the appropriate
volume of supernatant.
The next step was preparing fungal mycelium. Ecovative’s production strain was
grown on fresh Malt Extract agar plates (pH 7.5) for 3 days at 28ºC. Using sterile forceps,
sterile Hybond-N filters were placed onto each ME agar plate. Prior to autoclaving, each of
the membrane filters was dyed to a dark purple color with Nigrosin in order to be able to see
the fungal growth better. The process was repeated for each plate used in a transformation
experiment. The inoculated (fungal) plates were grown upside down in a 27ºC incubator for
12 - 24 hours until the fungal mycelia were visibly growing on the filter. Harvested

17
Agrobacterium tumefaciens from the previous Induction step was incubated with the fungal
recipient colonies that had been transferred with their filters onto Induction Media agar plates
containing 200µM Acetosyringone. 200µl of resuspended Agrobacterium cells transformed
with a selectable marker plasmid (conferring resistance to the antibiotic Carboxin) was mixed
with 150 µl of Agrobacterium transformed with our light-responsive Amil-CP Blue
construct. This co-transformation mixture was pipetted onto the membrane and a sterile glass
L spreader was used to gently disperse the cell suspension evenly over the entire membrane.
The plates were briefly dried in a sterile hood and incubated upside down in an incubator set
at 24ºC. This infection temperature was previously determined to be optimal for ATMT
infection. The plates incubated for 4 days. Finally, after infection I selected against
Agrobacterium by transferring the fungal membranes onto Malt Extract agar plates
containing 200µM Cefotaxime + 5µg/ml Carboxin. These plates were typically incubated for
a week at 28ºC, and then subcultured from the membranes (4-5 subcultures per colony) onto
new plates with Cefotaxime + Carboxin for a second round of selection.
Fungal DNA Isolation
To confirm the integration of the plasmid into Ecovative’s production strain, genomic
DNA was isolated and PCR was performed using plasmid-specific primer sequences. Using a
sterile toothpick, a roughly 1cm x 1cm square of fungal mycelia was scraped from the ME
selection plates. The harvested cells were transferred into labeled microfuge tubes containing
400 µl of DNA extraction buffer. The extraction buffer contains 200mM Tris-HCl (pH 8.5),
250mM NaCl, 25mM EDTA and 0.5% SDS. The tubes containing the mycelia and buffer
were vortexed for 2 minutes in order to fully mix the mycelial material with the extraction
buffer, which improves the DNA yield. 200µl of 3M Sodium Acetate (pH 5.2) was then

18
added to each tube containing the mycelia and extraction buffer. Each tube was then vortexed
again for 1 minute. The tubes were placed in a -20ºC freezer for a minimum of 15 minutes.
The tubes were then centrifuged in a microfuge at room temperature at maximum speed for
15 minutes. After the spin, 300-400µl of the supernatant was pipetted into new, labeled
microfuge tubes (avoiding the loose pellet). An equal amount of ice-cold isopropanol was
added to the supernatant and the tubes were mixed by inversion 20 times. The tubes were
then incubated in the freezer overnight to precipitate the genomic DNA (gDNA). gDNA was
recovered the next day by centrifuging the tubes at top speed for 20 minutes in a cold room
(4ºC), yielding a small white pellet. The supernatant was removed, and 300µl of cold 70%
ethanol was added to each tube to wash the pellet. Once the tubes were mixed by inversion to
dislodge the pellet, the tubes were centrifuged at top speed in the cold room for 15 minutes
again. The supernatant was once again removed and one final spin of 15 seconds at room
temperature allowed for collection of residual supernatant, which was removed by careful
pipetting. The DNA pellets were dried in the fume hood for about 3 minutes to evaporate any
remaining ethanol from the tubes. Dried DNA pellets were resuspended into 30µl of TE
buffer (pH 8.0). gDNA samples were diluted between 1:2 and 1:4 in 10mM Tris (pH 8.0)
prior for use as a template in PCR.
Fungal Protein Isolation
In order to check for the proper expression of the gene product of Amil-CP Blue in
our transformed fungi, total cell lysates containing fungal proteins were isolated and
analyzed using SDS-PAGE gel (13). Cellular protein lysates were isolated in the following
manner. Once the fungal transformants are fully grown on selection plates (after 4 days), one
entire colony was scraped using a sterile toothpick and inserted into a microfuge tube

19
containing 200µl Urea sample buffer. The Urea sample buffer contains 9M Urea, 1% SDS,
25mM Tris-HCl, 1mM EDTA, and 0.7M Mercaptoethanol. The Mercaptoethanol needs to be
added freshly to the Urea buffer before cells are introduced so 10µl of concentrated Beta-
Mercaptoethanol was added to 190µl of Urea sample buffer. The tube containing the cells
and buffer was then vortexed for 45 seconds before being boiled (with a clamp) at 100ºC for
4 minutes. The tubes are then vortexed for 1 minute and re-boiled for 2 minutes. In order to
pellet the lysate, the tubes are centrifuged in a microfuge at maximum speed for 5 minutes.
50µl of the lysate supernatant is removed and added to a newly labeled microfuge tube. 10µl
of SDS sample buffer is then added to this new tube but the Beta-Mercaptoethanol has to be
freshly added, therefore 0.5µl Beta-Mercaptoethanol is added to 9.5µl of sample buffer and
added to the new tube. A pre-cast 4-15% TGX SDS-PAGE gel was used and 25µl of each
sample was loaded into the wells of a pre-cast 4-15% TGX SDS-PAGE gel (Bio-Rad). For
the protein marker, 15µl of NEB Prestained Broad Range Marker was added to 5µl of SDS
sample buffer and loaded into the gel. The gel ran at 110 Volts for about 70 minutes before
being stained overnight in Aqua-Stain (Bulldog Bio). Gels were imaged on a G-Box
(SyGene).
Results/Discussion
Recombinant DNA Constructs
By using various online programs such as BLAST, NCBI and ORF finder, I was able
to create recombinant DNA constructs consisting of the promoter and terminator sequences
for the genes, bli-4 and con-6 with the Amil-CP Blue gene. Figure 5 shows the construct
created for bli-4 and Figure 6 shows the construct for con-6. These DNA fragments, once

20
inserted into the plasmid by Gibson Assembly, are then inserted into E. coli cells where it
makes multiple copies of itself. While the construct is in the E. coli we can run tests such as
PCR and restriction digests to see whether the plasmid has been correctly inserted into the
DNA of the E. coli and if the plasmid contains all of our desired fragments. Once it is
confirmed that all of the pieces are present in the plasmid, it can be used to infect the fungal
cells and transform the DNA of the fungus.
Figure 5. pGABLI4-3 plasmid construct including the plasmid in gray, bli-4-3 promoter in dark blue,
terminator in blue-gray and the Amil-CP Blue gene in yellow. Shows the sizes of each of the plasmid pieces in base pairs as well as the size of the whole plasmid.
Figure 6. pGACON6 plasmid construct including the plasmid in gray, con-6 promoter in dark blue,
terminator in blue-gray and the Amil-CP blue gene in yellow. Shows the sizes of each of the plasmid pieces in base pairs as well as the size of the whole plasmid.

21
Construction and Verification of Light-Responsive Recombinant DNA Plasmids
PCR reactions utilizing the appropriate primers for the promoters and terminators of
bli-3, bli-4 and con-6 yielded the desired products for the latter two constructs (Figure 7), but
not for all of the necessary products for bli-3. I therefore decided to continue with the Gibson
Assembly for the bli-4 gene (done by the Fall 2017 Bio 384 class) and the con-6 gene. The
bli-3 construct was missing the promoter fragments so I chose not to continue with the
Gibson Assembly for that construct. After Gibson Assembly, the resultant recombinant DNA
plasmids containing the codon-optimized Amil-CP Blue gene were transformed into E. coli.
Verification of the correct plasmid constructs was done by a combination of PCR and
diagnostic restriction enzyme digests.
Figure 7. Individual plasmid constructs pieces amplified by PCR. Left gel picture shows the PCR
products for pGABLI4-1 and right gel picture shows the PCR products for pGACON6. All bands that are present are of the expected sizes, green labels correspond to promoter sequences, blue labels correspond to the Amil-CP Blue gene and red labels correspond to terminator sequences.
Amil-CPBlue Amil-CPBlue

22
As an example, for the con-6 construct, I used, in separate digests, Eco RI (HF), Nde I, and
Xba I. Eco RI and Xba I were predicted to cut the plasmid twice and Nde I cut it 3 times.
Figure 8 shows the gel electrophoresis results of restriction digests of eight different plasmid
DNA samples isolated from transformed E. coli. For Eco RI digests, two cuts were expected,
resulting in expected plasmid fragments of 2.75kb and 7.58kb. The three Nde I sites cut
should have resulted in fragments of 2.36kb, 2.49kb and 5.47kb. Xba I digests were expected
to yield fragments of 3.0kb and 7.3kb. Not one plasmid DNA sample yielded the predicted
sized fragments in every circumstance. Instead, two main ‘sub-categories’ of samples
occurred where the sizes were as predicted for one or two enzymes but not for all three. One
category was that the samples 1, 2, and 7 had clear bands for Eco RI at lengths ~7.5kb and
~2.5kb, which was expected, but faint or nonexistent bands for Nde I and only 1 single band
at ~10.0kb for Xba I.
23
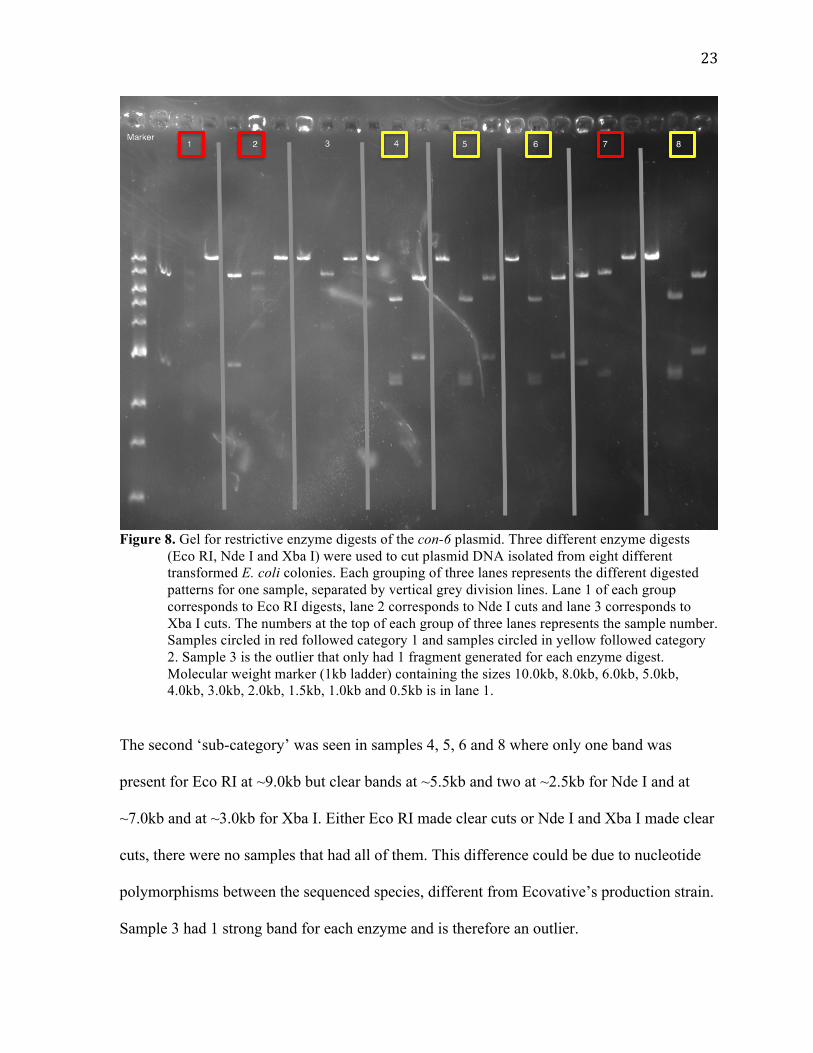
Figure 8. Gel for restrictive enzyme digests of the con-6 plasmid. Three different enzyme digests
(Eco RI, Nde I and Xba I) were used to cut plasmid DNA isolated from eight different transformed E. coli colonies. Each grouping of three lanes represents the different digested patterns for one sample, separated by vertical grey division lines. Lane 1 of each group corresponds to Eco RI digests, lane 2 corresponds to Nde I cuts and lane 3 corresponds to Xba I cuts. The numbers at the top of each group of three lanes represents the sample number. Samples circled in red followed category 1 and samples circled in yellow followed category 2. Sample 3 is the outlier that only had 1 fragment generated for each enzyme digest. Molecular weight marker (1kb ladder) containing the sizes 10.0kb, 8.0kb, 6.0kb, 5.0kb, 4.0kb, 3.0kb, 2.0kb, 1.5kb, 1.0kb and 0.5kb is in lane 1.
The second ‘sub-category’ was seen in samples 4, 5, 6 and 8 where only one band was
present for Eco RI at ~9.0kb but clear bands at ~5.5kb and two at ~2.5kb for Nde I and at
~7.0kb and at ~3.0kb for Xba I. Either Eco RI made clear cuts or Nde I and Xba I made clear
cuts, there were no samples that had all of them. This difference could be due to nucleotide
polymorphisms between the sequenced species, different from Ecovative’s production strain.
Sample 3 had 1 strong band for each enzyme and is therefore an outlier.

24
Figure 9. Gel illustrating restrictive enzyme digests of the bli-4 plasmid. Three regimes of enzyme
digests (Xba I, Xho I + Hind III, and Eco RI + Sph I) were used to cut plasmid DNA isolated from eleven different transformed E. coli colonies. Molecular weight marker (1kb ladder) containing the sizes 10.0kb, 8.0kb, 6.0kb, 5.0kb, 4.0kb, 3.0kb, 2.0kb, 1.5kb, 1.0kb and 0.5kb is in lane 12. Xba I cut samples are in the first section, Xho I + Hind III in the second section, after the marker and Eco RI + Sph I are in the third section.
The Fall 2017 Bio 384 class created the plasmid with the bli-4 promoter and
terminator controlling the expression of the Amil-CP Blue gene. They also performed
restrictive enzyme digests on plasmid DNA isolated from their transformed E. coli colonies.
after isolating DNA. The enzymes they decided to use were Xba I, Xho I + Hind III, and Eco
RI + Sph I. Xba I was expected to cut twice and have two plasmid pieces at 7.36kb and
3.0kb. Xho I and Hind III in a double digestion were expected to make three cuts and
Xba I 7.36kb and 3.0kb
Xho I + Hind III 7.35kb, 1.64kb, 1.38kb Eco RI + Sph I
6.53kb, 2.01kb, 0.76kb

25
generate fragments of lengths 7.35kb, 1.64kb, and 1.38kb. Eco RI and Sph I used in another
double digestion were expected to cut three times and generate three plasmid fragments of
lengths 6.53kb, 2.01kb, and 0.76kb. The results of this restrictive enzyme digest (Figure 9)
show that of the eleven isolated DNA samples digested with these enzymes, only one sample
did not have all of the correct lengths for the pieces of plasmid after being cut by the
enzymes. For the samples cut by Xba I, almost all of the samples, apart from three samples,
had the correct plasmid restriction fragment lengths at ~7.0kb and ~3.0kb which was
expected. For the double digestions using the enzymes Xho I and Hind III, a majority of the
samples had three bands, which was expected, but none of these fragments matched the
expected size. There was a band at ~6.0kb for each sample and a band at ~1.6kb both of
which were expected but the third band was ~1.5kb instead of the 1.3kb band we were
expecting. For the second double digest using Eco RI and Sph I, we were expecting three
bands but instead we observed four bands. For most of the samples there were bands
observed at ~6.5kb, ~2.0kb and ~0.7kb, all of which were expected. The fourth band of
~1.3kb and was not what we were expecting, so we were unsure as to why it appeared, and in
a majority of the samples as well.
Diagnostic PCR Analysis of Selected Recombinant DNA Clones
After the restriction enzyme digests were performed for the con-6 plasmid constructs,
two samples from each of the two sub-categories of clones were subjected to PCR with the
primers used to create the original fragments used in Gibson Assembly. This is another way
to confirm that all of the correct fragments of our recombinant DNA plasmid were in fact
inserted into the plasmid and cloned in E. coli. Two samples with the highest yield (brightest
bands) from each of the two subcategories were selected, the latter determined from the
26
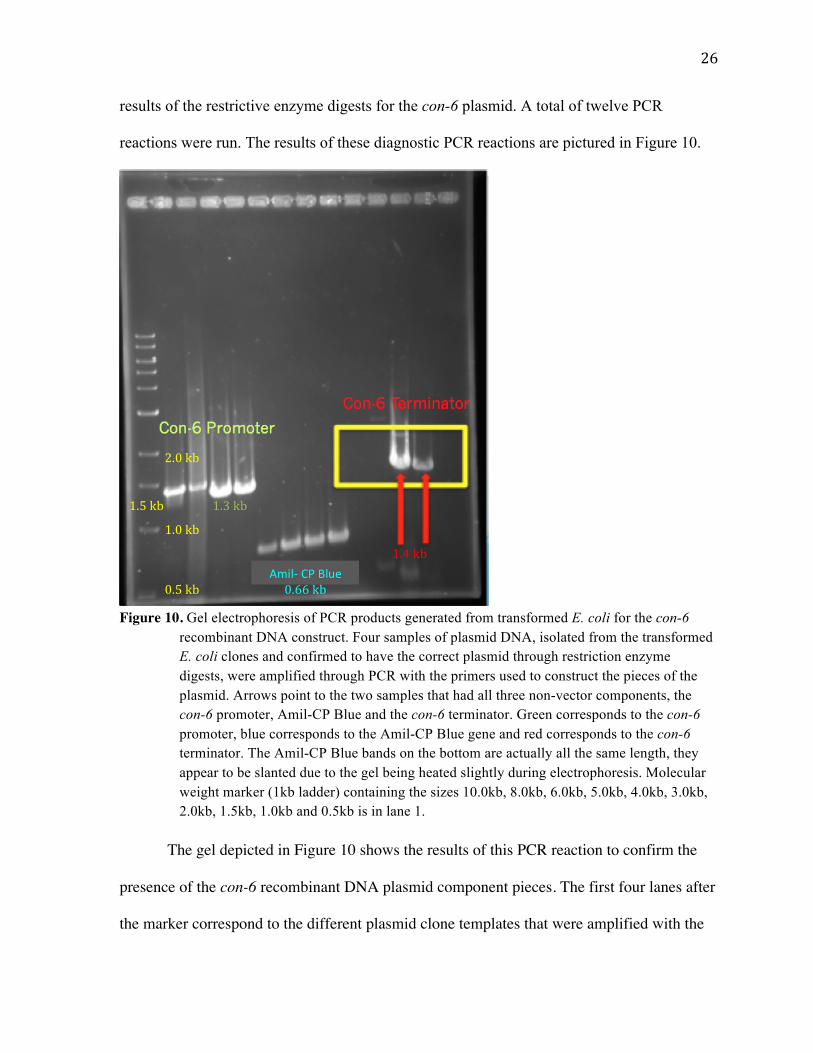
results of the restrictive enzyme digests for the con-6 plasmid. A total of twelve PCR
reactions were run. The results of these diagnostic PCR reactions are pictured in Figure 10.
Figure 10. Gel electrophoresis of PCR products generated from transformed E. coli for the con-6
recombinant DNA construct. Four samples of plasmid DNA, isolated from the transformed E. coli clones and confirmed to have the correct plasmid through restriction enzyme digests, were amplified through PCR with the primers used to construct the pieces of the plasmid. Arrows point to the two samples that had all three non-vector components, the con-6 promoter, Amil-CP Blue and the con-6 terminator. Green corresponds to the con-6 promoter, blue corresponds to the Amil-CP Blue gene and red corresponds to the con-6 terminator. The Amil-CP Blue bands on the bottom are actually all the same length, they appear to be slanted due to the gel being heated slightly during electrophoresis. Molecular weight marker (1kb ladder) containing the sizes 10.0kb, 8.0kb, 6.0kb, 5.0kb, 4.0kb, 3.0kb, 2.0kb, 1.5kb, 1.0kb and 0.5kb is in lane 1.
The gel depicted in Figure 10 shows the results of this PCR reaction to confirm the
presence of the con-6 recombinant DNA plasmid component pieces. The first four lanes after
the marker correspond to the different plasmid clone templates that were amplified with the
2.0kb
1.0kb
0.5kb
1.5kb
0.66kb
1.4kb
1.3kb
Amil-CPBlue

27
upstream and downstream Gibson primers for the con-6 promoter. All four of these clones
have the con-6 promoter part of the construct since they all yielded a PCR product of the
expected size of ~1.4kb. The next four lanes (in the same order of clones) were PCR products
amplified with the Amil-CP Blue Gibson primers and corresponded to the expected size of
~0.6kb. The last set of four lanes corresponded to PCR products amplified with the con-6
terminator Gibson primers: only the plasmid templates in the last two lanes yielded the
correct terminator sequence at an expected size of ~1.4kb. Since those two clones were the
only ones of the four tested to have all of the correct plasmid pieces, I decided to continue
with the transformation of Agrobacterium with those two con-6 constructs, as well as Amil-
CP Blue constructs with controlling sequences derived from bli-4 (Bio 384, Fall 2017) and
GPD (Ecovative Design).
Basidiomycete ATMT Co-Transformation with Amil-CP Blue and Carboxin-Resistance Constructs
Given that two of my con-6 Amil-CP Blue have been confirmed by both restriction
digests and PCR, these clones were deemed suitable for Agrobacterium tumefaciens-
Mediated Transformation (ATMT) of the Ecovative production strain. Agrobacterium
tumefaciens strain AGL-1 was transformed with my two con-6 /Amil-CP Blue clones in
order to be able to utilize Agrobacterium’s ability to infect filamentous fungi (8). This
culmination of the ATMT process is pictured in Figure 11, showing both the fungus and
Agrobacterium growing together on the dyed selection membrane.

28
Figure 11. Selection plate containing transformation of Ecovative’s production strain of fungus by
Agrobacterium.
In our case, we decided to perform a co-transformation, where two different
sequences would be inserted into the fungus at the same time. We decided to insert a plasmid
containing a Carboxin-resistance cassette along with our bli-4 and con-6 constructs in order
to successfully transform the fungus. Carboxin is commonly used as a fungicide, this way,
when the colonies were plated onto plates containing Carboxin, only the colonies that have
been transformed with Carboxin-resistance would be able to grow (14). If these colonies
were transformed successfully with the Carboxin-resistance, then they may have also been
successfully transformed by the recombinant DNA as well. The antibiotic Cefotaxime selects
against the Agrobacterium, whereas Carboxin-resistant fungal colonies have likely integrated
the plasmid containing the Carboxin-resistance cassette. Since this was a co-transformation, a
smaller subset of the Carboxin-resistant colonies should also have an integrated Amil-CP
Blue cassette (usually no more than 50%, usually less). Colonies of mycelia were subcultured
from the selective membrane and grown up on secondary selection plates containing
Carboxin and Cefotaxime to further select for transformants (and against Agrobacterium).
Genomic DNA was isolated from colonies that grew on these new plates and were tested
29
using PCR with primers specific for (1) a control DNA sequence already present in the
fungus (GPD); (2) the Carboxin-resistance DNA sequence, and (3) our Amil-CP Blue
recombinant DNA sequences.
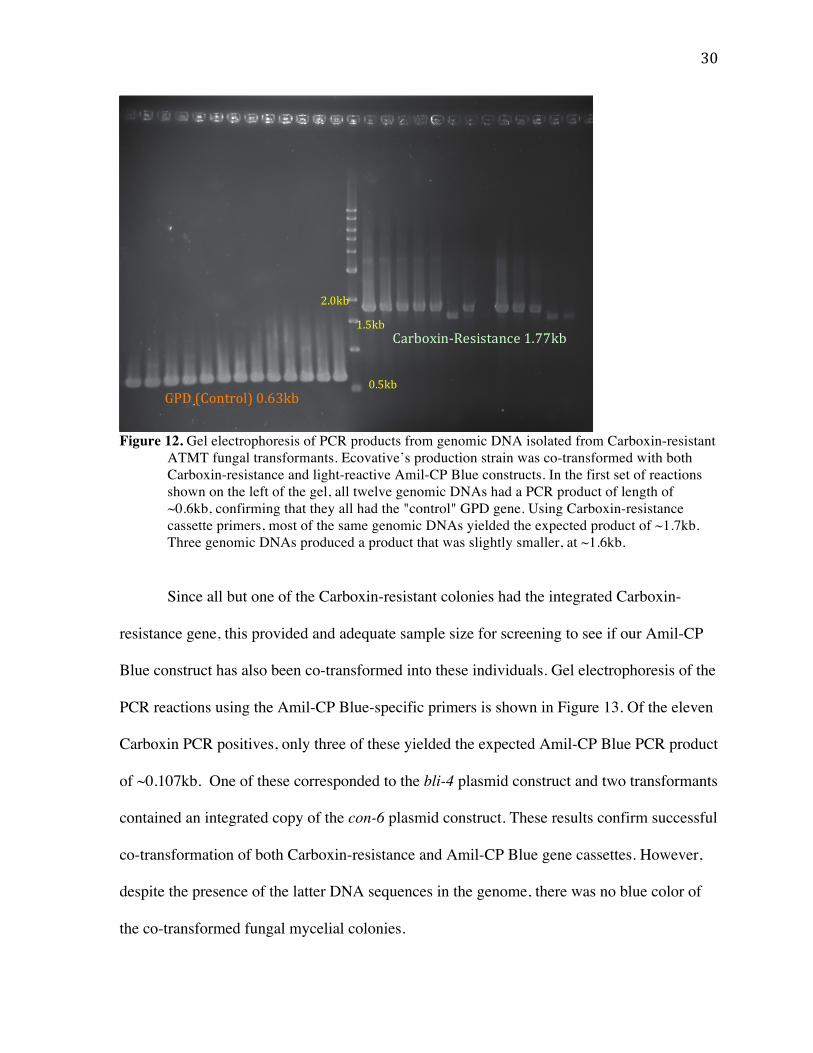
The gel depicted in Figure 12 shows the PCR products amplified from Carboxin-
resistant transformants using the control GPD primers and the Carboxin-resistance primers.
The control primers were for a gene native to the production strain of fungus, GPD, used to
make sure that the isolated DNA samples used are good DNA templates. As seen from the
gel, each of the genomic DNAs yielded a GPD PCR product, indicated by a strong band at
~0.6kb. As a result, I can conclude that the genomic DNA samples are suitable templates for
use in other PCR reactions. The results of this gel also indicate that all of the genomic DNAs,
apart from one, yielded a PCR product using the Carboxin-resistance specific primers. Most
of the PCR products were of the expected size of ~1.7kb but three gDNAs produced bands
that were slightly smaller, at ~1.6kb. Unless this is an artifact, this difference in size may be
due to a deletion somewhere between the two primers used. Overall, I can conclude that a
majority of the samples did have the full-length Carboxin-resistance gene, showing that it
was successfully integrated into the genomic DNA of the fungus.
30
Figure 12. Gel electrophoresis of PCR products from genomic DNA isolated from Carboxin-resistant
ATMT fungal transformants. Ecovative’s production strain was co-transformed with both Carboxin-resistance and light-reactive Amil-CP Blue constructs. In the first set of reactions shown on the left of the gel, all twelve genomic DNAs had a PCR product of length of ~0.6kb, confirming that they all had the "control" GPD gene. Using Carboxin-resistance cassette primers, most of the same genomic DNAs yielded the expected product of ~1.7kb. Three genomic DNAs produced a product that was slightly smaller, at ~1.6kb.
Since all but one of the Carboxin-resistant colonies had the integrated Carboxin-
resistance gene, this provided and adequate sample size for screening to see if our Amil-CP
Blue construct has also been co-transformed into these individuals. Gel electrophoresis of the
PCR reactions using the Amil-CP Blue-specific primers is shown in Figure 13. Of the eleven
Carboxin PCR positives, only three of these yielded the expected Amil-CP Blue PCR product
of ~0.107kb. One of these corresponded to the bli-4 plasmid construct and two transformants
contained an integrated copy of the con-6 plasmid construct. These results confirm successful
co-transformation of both Carboxin-resistance and Amil-CP Blue gene cassettes. However,
despite the presence of the latter DNA sequences in the genome, there was no blue color of
the co-transformed fungal mycelial colonies.
GPD(Control)0.63kb
Carboxin-Resistance1.77kb
0.5kb
2.0kb
1.5kb

31
Figure 13. Gel electrophoresis of Amil-CP Blue PCR products from ATMT Carboxin-resistant
transformants. Primers specific to an internal portion of the Amil-CP Blue gene were used in the PCR. Arrows point to Amil-CP Blue PCR products of length 0.107kb, one of which was derived from the bli-4 construct and the others from the con-6 construct.
Protein Isolation and SDS-PAGE Results
Given the lack of blue color in the three verified Amil-CP Blue transformants, I
decided to check for expression of the protein product. Cellular proteins were isolated from
the native Ecovative production strain and Amil-CP Blue transformants were analyzed by
SDS-PAGE. If the expected Amil-CP Blue translation product of 25kD is expressed in the
transformants, we would expect to see a band of this size superimposed on the spectrum of
cellular proteins found in the production strain. Figure 14 shows the results of this protein
extraction and comparison. Lanes 3 and 4 have the NEB protein marker and its overflow.
The expected area surrounding the 25kDa region is highlighted in the Figure. Lanes 1 and 2
contain only proteins from Carboxin-only transformants. Lane 5 contains proteins from the
transformant with the integrated bli-4/Amil-CP Blue construct. Lanes 6 and 7 correspond to
Bli-4construct Con-6constructs~0.107kb

32
protein samples from the two verified con-6/Amil-CP Blue transformants. Lane 8 contains
the cellular proteins from the untransformed Ecovative production strain, as a control for
comparison.
Figure 14. SDS-PAGE protein gel of total cellular lysates from control and Amil-CP Blue
transformed fungal mycelia colonies. Lanes 1 and 2 correspond to lysates from Carboxin-only transformants. Lane 5 corresponds to a verified bli-4/Amil-CP Blue transformant. , Lanes 3 and 4 is the Broad Range protein marker (NEB) containing the sizes 80kDa, 46kDa, 30kDa, 25kDa, 17kDa, and 7kDa.Lanes 6 and 7 correspond to lysates from verified con-6/Amil-CP Blue transformants. Lane 8 corresponds to a lysate from the native, untransformed Ecovative production strain. We were expecting a significant Amil-CP Blue protein product at ~25kDa (blue box), but such product was seen.
The blue box in Figure 14 highlights the area surrounding the band at 25kDa where I
expected to see a difference between the control and transformant lanes. There is no clear
1 432 5 6 7 8
25kDa

33
difference in the protein spectrum between the Amil-CP Blue transformant and the controls,
despite my finding that the gene is indeed present in the transformants.
Final Thoughts
Despite the PCR analysis demonstrating the presence of the codon-optimized Amil-
CP Blue gene in three independent transformants, there was no clear change in the phenotype
of the fungus. The lack of any distinct translation product corresponding to the expected size
of 25 kDa suggests that the "block" may be at either the transcriptional and/or translational
level. In order to test the former possibility, one could isolate RNA from both control and
Amil-CP Blue transformed fungus samples and perform semi-quantitative PCR to verify (or
not verify) the presence of the appropriately sized cDNAs. Another approach to integrate the
Amil-CP Blue construct would be to utilize CRISPR technology, perhaps generating a larger
sample size. The Genetics team at Ecovative has also attempted experiment similar to those
described here, but they too were not able to see any phenotypic change in their
transformants. However, they have demonstrated the presence of significant amounts of
Amil-CP Blue mRNA, so it appears the block on expression is post-transcriptional. More
work still needs to be done in order to see the change in the phenotype, but this project has
been a good start. I hope my work during this thesis project will help future students and
Ecovative to optimize their process in the future. I am excited to pass this project down to
future thesis students and for the relationship between Ecovative and Union College to
continue.
34
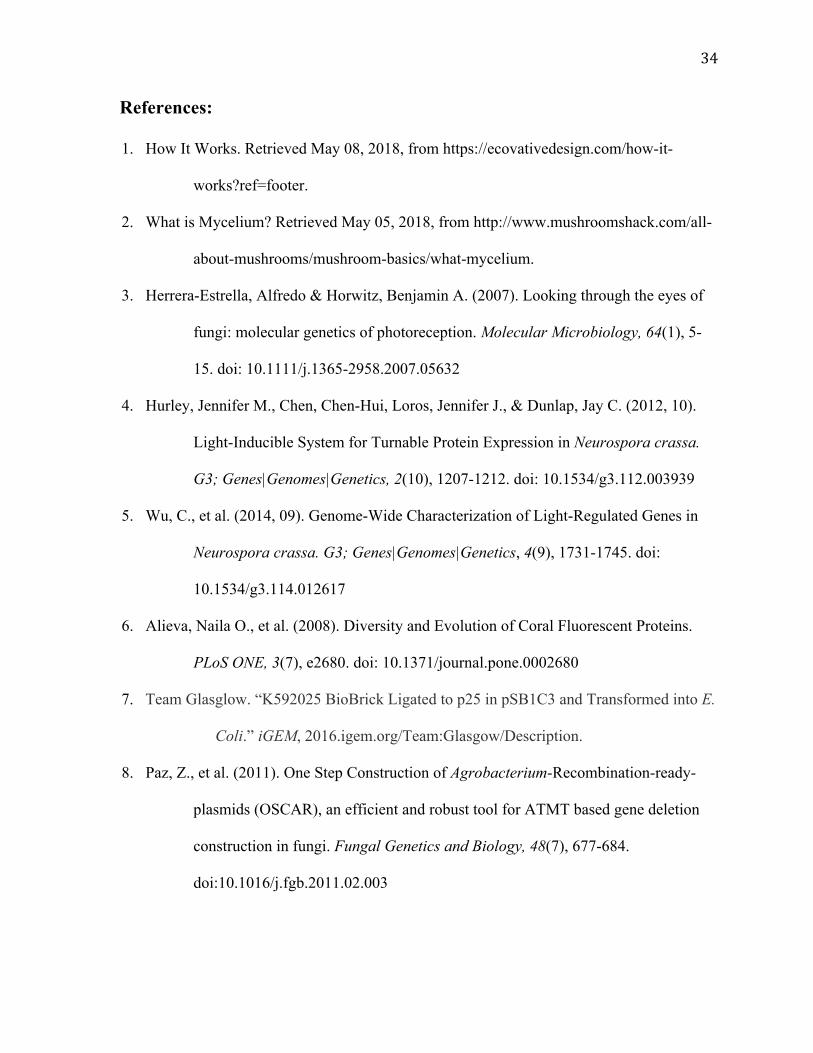
References:
1. How It Works. Retrieved May 08, 2018, from https://ecovativedesign.com/how-it-
works?ref=footer.
2. What is Mycelium? Retrieved May 05, 2018, from http://www.mushroomshack.com/all-
about-mushrooms/mushroom-basics/what-mycelium.
3. Herrera-Estrella, Alfredo & Horwitz, Benjamin A. (2007). Looking through the eyes of
fungi: molecular genetics of photoreception. Molecular Microbiology, 64(1), 5-
15. doi: 10.1111/j.1365-2958.2007.05632
4. Hurley, Jennifer M., Chen, Chen-Hui, Loros, Jennifer J., & Dunlap, Jay C. (2012, 10).
Light-Inducible System for Turnable Protein Expression in Neurospora crassa.
G3; Genes|Genomes|Genetics, 2(10), 1207-1212. doi: 10.1534/g3.112.003939
5. Wu, C., et al. (2014, 09). Genome-Wide Characterization of Light-Regulated Genes in
Neurospora crassa. G3; Genes|Genomes|Genetics, 4(9), 1731-1745. doi:
10.1534/g3.114.012617
6. Alieva, Naila O., et al. (2008). Diversity and Evolution of Coral Fluorescent Proteins.
PLoS ONE, 3(7), e2680. doi: 10.1371/journal.pone.0002680
7. Team Glasglow. “K592025 BioBrick Ligated to p25 in pSB1C3 and Transformed into E.
Coli.” iGEM, 2016.igem.org/Team:Glasgow/Description.
8. Paz, Z., et al. (2011). One Step Construction of Agrobacterium-Recombination-ready-
plasmids (OSCAR), an efficient and robust tool for ATMT based gene deletion
construction in fungi. Fungal Genetics and Biology, 48(7), 677-684.
doi:10.1016/j.fgb.2011.02.003

35
9. Gibson, D. G., Young, L., Chuang, R., Venter, J. C., Hutchison, C. A., & Smith, H. O.
(2009, 04). Enzymatic assembly of DNA molecules up to several hundred
kilobases. Nature Methods, 6(5), 343-345. doi:10.1038/nmeth.1318
10. Horton, J. S. (2017). Isolation of plasmid DNA from pOSCAR/Amil-CP Blue
recombinant DNA constructs and verification via restriction endonuclease
digestion. Genetics & Molecular Biology (384), 1-7.
11. Horton, J. S. (2017). Gel Purification and Gibson Assembly of Putative Light-Regulated
Amil-CP-Blue Recombinant DNA Construct. Genetics & Molecular Biology
(384), 1-6.
12. Horton, J. S. (2016). Isolation of genomic DNA, gel electrophoresis, and quantitation by
Nanodrop and Qubit. Genetics & Molecular Biology (384), 1-6.
13. Osherov, Nir, and Gregory S May. “Protein Extraction from Aspergillus nidulans for Gel
Electrophoresis.” Fundamentals of Growth, Storage, Genetics and Microscopy of
Aspergillus Nidulans, Department of Cell Biology, Baylor College of Medicine,
www.fgsc.net/fgn45/45osherov.html.
14. National Center for Biotechnology Information. Retrieved June 10, 2018. PubChem
Compound Database; CID=21307,
https://pubchem.ncbi.nlm.nih.gov/compound/21307.