life’s bottleneck- sustaining theworld’s phosphorus for a food secure future
DESCRIPTION
Phosphorus depletionTRANSCRIPT

EG39CH06-CordellWhite ARI 9 October 2014 1:29
Life’s Bottleneck: Sustainingthe World’s Phosphorus for aFood Secure FutureDana Cordell and Stuart WhiteInstitute for Sustainable Futures, University of Technology Sydney, NSW 2007, Australia;email: [email protected], [email protected]
Annu. Rev. Environ. Resour. 2014. 39:161–88
The Annual Review of Environment and Resources isonline at environ.annualreviews.org
This article’s doi:10.1146/annurev-environ-010213-113300
Copyright c© 2014 by Annual Reviews.All rights reserved
Keywords
phosphorus scarcity, phosphorus security, global food security, sustainablefood system
Abstract
Phosphorus security is emerging as one of the twenty-first century’s greatestglobal sustainability challenges. Phosphorus has no substitute in food pro-duction, and the use of phosphate fertilizers in the past 50 years has boostedcrop yields and helped feed billions of people. However, these advantageshave come at a serious cost. Mobilizing phosphate rock into the environ-ment at rates vastly faster than the natural cycle has not only polluted manyof the world’s freshwater bodies and oceans, but has also created a humandependence on a single nonrenewable resource. The 2008 phosphate pricespike attracted unprecedented attention to this global situation. This re-view provides an updated and integrated synthesis of the biophysical, social,geopolitical, and institutional challenges and opportunities for food security.Remaining phosphorus resources are becoming increasingly scarce, expen-sive, and inequitably distributed. All farmers require fertilizers, yet a sixth ofthe world’s farmers and their families are too poor to access fertilizer mar-kets. Inefficient use of this fossil resource from mine to field to fork calls forsubstantial reduction in demand through efficiency and recycling. Phospho-rus governance at global, regional, and local scales is required to stimulateand support context-specific sustainable strategies to ensure all the world’sfarmers have sufficient access to phosphorus to feed the world and ensureecosystem integrity and farmer livelihoods.
161
Ann
u. R
ev. E
nvir
on. R
esou
rc. 2
014.
39:1
61-1
88. D
ownl
oade
d fr
om w
ww
.ann
ualr
evie
ws.
org
Acc
ess
prov
ided
by
Vir
gini
a C
omm
onw
ealth
Uni
vers
ity o
n 06
/25/
15. F
or p
erso
nal u
se o
nly.

EG39CH06-CordellWhite ARI 9 October 2014 1:29
Contents
1. INTRODUCTION: THE SIGNIFICANCE OF PHOSPHORUSFOR HUMANITY. . . . . . . . . . . . . . . . . . . . . . . . . . . . . . . . . . . . . . . . . . . . . . . . . . . . . . . . . . . . . 162
2. DIMENSIONS OF PHOSPHORUS SCARCITY . . . . . . . . . . . . . . . . . . . . . . . . . . . . . . . 1662.1. Physical Scarcity. . . . . . . . . . . . . . . . . . . . . . . . . . . . . . . . . . . . . . . . . . . . . . . . . . . . . . . . . . . . 1672.2. Managerial Scarcity . . . . . . . . . . . . . . . . . . . . . . . . . . . . . . . . . . . . . . . . . . . . . . . . . . . . . . . . . 1692.3. Economic Scarcity . . . . . . . . . . . . . . . . . . . . . . . . . . . . . . . . . . . . . . . . . . . . . . . . . . . . . . . . . . 1712.4. Geopolitical Scarcity. . . . . . . . . . . . . . . . . . . . . . . . . . . . . . . . . . . . . . . . . . . . . . . . . . . . . . . . 1722.5. Institutional Scarcity . . . . . . . . . . . . . . . . . . . . . . . . . . . . . . . . . . . . . . . . . . . . . . . . . . . . . . . . 173
3. IMPLICATIONS OF THE CURRENT PHOSPHORUS USE TRAJECTORY . 1733.1. Future Global Phosphorus Trends . . . . . . . . . . . . . . . . . . . . . . . . . . . . . . . . . . . . . . . . . . 1733.2. Phosphorus Paradox: Regional Dichotomies in the Phosphorus Challenge. . . . . 175
4. SUSTAINABLE STRATEGIES FOR FOOD SECURITYAND ECOSYSTEM INTEGRITY . . . . . . . . . . . . . . . . . . . . . . . . . . . . . . . . . . . . . . . . . . . . . 177
5. CONCLUSION . . . . . . . . . . . . . . . . . . . . . . . . . . . . . . . . . . . . . . . . . . . . . . . . . . . . . . . . . . . . . . . . 181
1. INTRODUCTION: THE SIGNIFICANCE OF PHOSPHORUSFOR HUMANITY
Achieving global food security means ensuring that food is available, accessible, and nutritious to allpeople at all times (1). However, this is likely to be one of the greatest challenges of the twenty-firstcentury. While food demand is expected to double to feed a projected 9 billion mouths by 2050,many of the essential resources that underpin food production are becoming increasingly scarce(2–4). Food cannot be produced without access to water, energy, land, and nutrients. Yet unlikethat of water scarcity, energy scarcity, and nitrogen management, the challenge of phosphorusscarcity is relatively understudied (5). This review critically discusses and synthesizes the latestresearch and developments around this emerging global challenge.
Phosphorus, like nitrogen and potassium, is a plant nutrient essential to all life that thereforecannot be substituted in food production (6). The importance of phosphorus in crop growth is
PHOSPHORUS: “LIFE’S BOTTLENECK”
The element phosphorus, like carbon, hydrogen, and oxygen, is an essential element and building block for all life,including plants, animals, and bacteria. Phosphorus is a vital component of cell walls, DNA, RNA, and ATP totransport energy to the brain. In plants, phosphorus is essential for cell growth and the formation of fruit and seeddevelopment. It therefore has no substitute in food production (6, 145).
Humans acquire phosphorus by consuming plant- and animal-based food. Livestock obtain phosphorus fromfeed, fodder, grazing, and supplements. Plants in turn obtain phosphorus from soil—their roots draw dissolvedphosphorus from soil solution (6). Soil phosphorus is either naturally derived from weathered bedrock or is addedthrough fertilizers, manures, and organic residues. The phosphorus in bedrock has taken millions of years to form,starting as remains of aquatic life on the seafloor that was transferred to the lithosphere over millions of yearsthrough mineralization and tectonic uplift (24).
162 Cordell ·White
Ann
u. R
ev. E
nvir
on. R
esou
rc. 2
014.
39:1
61-1
88. D
ownl
oade
d fr
om w
ww
.ann
ualr
evie
ws.
org
Acc
ess
prov
ided
by
Vir
gini
a C
omm
onw
ealth
Uni
vers
ity o
n 06
/25/
15. F
or p
erso
nal u
se o
nly.

EG39CH06-CordellWhite ARI 9 October 2014 1:29
26
24
22
20
18
16
14
12
Ph
osp
ho
rus
(Mt/
a o
f P
)
Year
10
8
6
4
2
01800 1820 1840 1860 1880 1900 1920 1940
Phosphaterock
Manure Human excretaGuano
1960 1980 2000
Figure 1Historical sources of phosphorus for global fertilizer use, including guano, excreta, manure, and phosphaterock (1800–2010). Revised and updated with permission from Cordell et al. (5).
well established: Liebig (7) discovered in 1840 that phosphorus was indeed the limiting nutrient inplant growth. Bones were subsequently collected and ground for their high-phosphate value, andguano (bird and bat droppings deposited over thousands of years), another phosphate source, wassoon discovered off the coast of Peru and the South Pacific islands (8). Large phosphate-rich rockdeposits were also discovered in the United States that could be easily mined for their fertilizer value(9, 10). Historically, crop production had relied on natural levels of soil phosphorus supplementedwith organic sources such as manures, crop residues, and human excreta (11, 12). After WorldWar II, population growth, famine, and urbanization fueled the green revolution to increase cropproductivity through new crop varieties and synthetic fertilizers. Phosphate rock mining rapidlyincreased to keep up with nitrogen production via the Haber-Bosch process (9) (Figure 1).
The subsequent use of chemical fertilizers (including phosphorus, nitrogen, and potassium)contributed to feeding billions of people over the second half of the twentieth century by boost-ing crop yields (13, 14). However, these advantages have come at a serious cost. Humans havealtered the global phosphorus cycle by mobilizing four times the natural level of phosphorus fromphosphate rock into the environment (15). This has simultaneously contributed to widespreadnutrient pollution of many of the world’s lakes, rivers, and oceans (16) and to the depletion of afinite resource that had taken tens of millions of years to form. Chemist and science writer IsaacAsimov described phosphorus as “life’s bottleneck” and warned 30 years ago, “[W]e may be ableto substitute nuclear power for coal, and plastics for wood, and yeast for meat, and friendlinessfor isolation—but for phosphorus there is neither substitute nor replacement” (17). However,these concerns were largely ignored as phosphate rock was seen as a cheap and limitless source ofphosphorus (11). Today the world’s food systems are dependent on inputs from mined phosphaterock to maintain high agricultural productivity (5).
Approximately 90% of phosphate rock is used for food production: 82% for fertilizers, 5% foranimal feed, and 2–3% for food additives (18). However, phosphorus resources are inequitablydistributed: geographically (with Morocco alone controlling 74% of the world’s estimated re-maining reserves) (Figure 7, see discussion below), among users (mainly farmers), and temporally(between current and future generations) (19).
Humans have disrupted a once closed-looped global phosphorus biogeochemical cycle, withmultiple biophysical, economic, social, and technical implications, as summarized in Figure 2 and
www.annualreviews.org • Life’s Bottleneck: Phosphorus 163
Ann
u. R
ev. E
nvir
on. R
esou
rc. 2
014.
39:1
61-1
88. D
ownl
oade
d fr
om w
ww
.ann
ualr
evie
ws.
org
Acc
ess
prov
ided
by
Vir
gini
a C
omm
onw
ealth
Uni
vers
ity o
n 06
/25/
15. F
or p
erso
nal u
se o
nly.

EG39CH06-CordellWhite ARI 9 October 2014 1:29
Fo
od
pro
cess
ing
Glo
ba
l fo
od
syst
em
5±
3
44444444444444444444
No
n-a
gri
c.so
il a
nd
lan
dfi
ll
3±
0.6
* In
clu
de
s g
rass
/pa
stu
re
Un
its:
Mt/
a o
f P
= m
illio
n m
etr
ic t
on
ne
s o
f P
pe
r ye
ar
Ph
osp
ha
te r
ock
re
serv
es
are
un
eve
nly
d
istr
ibu
ted
acr
oss
th
e g
lob
e—
85
% is
co
ntr
olle
d b
y M
oro
cco
, Ch
ina
, So
uth
A
fric
a, a
nd
Un
ite
d S
tate
s (S
2.4
)
Ph
osp
ha
te r
ock
is a
fin
ite
, n
on
ren
ew
ab
le r
eso
urc
e t
ha
t to
ok
10
–1
5 m
illio
n y
ea
rs t
o f
orm
(S
2.1
)
Re
ma
inin
g r
ese
rve
s co
nta
in le
ss
ph
op
ho
rus
an
d m
ore
imp
uri
tie
s a
nd
a
re m
ore
diffi
cult
to
acc
ess
(S
2.1
)
So
me
sci
en
tist
s e
stim
ate
pe
ak
ph
osp
ho
rus
will
occ
ur
this
ce
ntu
ry,
wh
ile o
the
rs b
elie
ve t
he
ma
rke
t w
ill
en
sure
su
pp
ly m
ee
ts d
em
an
d f
or
seve
ral c
en
turi
es
(S2
.1)
Th
e p
rice
of
ph
osp
ha
te r
ock
sp
ike
d
80
0%
in 2
00
8 d
ue
to
ris
ing
de
ma
nd
fo
r m
ea
t/d
air
y p
rod
uct
s, o
il p
rice
sp
ike
s, e
tha
no
l pro
du
ctio
n, a
nd
ca
pa
city
co
nst
rain
ts (
S2
)
Ma
ny
po
or
farm
ers
ca
nn
ot
acc
ess
fe
rtili
zer
ma
rke
ts. F
ert
ilize
rs c
an
co
st
lan
dlo
cke
d A
fric
an
fa
rme
rs 2
–6
tim
es
mo
re t
ha
n w
ha
t it
co
sts
the
ir
Eu
rop
ea
n c
ou
nte
rpa
rts
(S2
.3)
Wh
ile s
om
e s
oils
in N
ort
h A
me
rica
a
nd
Eu
rop
e h
ave
be
en
ove
rfe
rtili
zed
(w
ith
ma
nu
re a
nd
min
era
l fe
rtili
zers
) a
nd
hav
e a
ccu
mu
late
d la
rge
sto
cks
of
P, m
an
y so
ils in
su
b-S
ah
ara
n A
fric
a
are
sti
ll P
-de
fici
en
t d
ue
to
low
a
pp
lica
tio
n r
ate
s (S
3.2
)
90
% o
f p
ho
sph
ate
ro
ck e
xtra
cte
d
glo
ba
lly is
fo
r fo
od
pro
du
ctio
n—
fe
rtili
zers
, fe
ed
, an
d f
oo
d a
dd
itiv
es
(S1
)
Ph
osp
ho
rus
is e
sse
nti
al f
or
all
livin
g
ma
tte
r, in
clu
din
g p
lan
ts, a
nim
als
, an
d
ba
cte
ria
. Ph
osp
ho
rus
ha
s n
o
sub
stit
ute
in f
oo
d p
rod
uct
ion
(S
1)
Glo
ba
l de
ma
nd
fo
r p
ho
sph
oru
s m
ay
incr
ea
se b
y 5
0–
10
0%
by
20
50
to
fe
ed
9
bill
ion
pe
op
le a
nd
me
et
curr
en
tly
pro
ject
ed
de
ma
nd
fo
r m
ea
t a
nd
b
iofu
el p
rod
uct
ion
(S
3.1
)
Ph
osp
ha
te r
ock
min
ing
, pro
cess
ing
, a
nd
tra
nsp
ort
cu
rre
ntl
y re
ly o
n c
he
ap
fo
ssil
fue
l. A
s o
il re
serv
es
be
com
e
mo
re s
carc
e a
nd
exp
en
sive
, pri
ce o
f p
ho
sph
ate
ro
ck w
ill a
lso
incr
ea
se
furt
he
r (S
2.1
)
P c
an
be
re
cove
red
fro
m h
um
an
e
xcre
ta, w
ast
ew
ate
r, f
oo
d, a
nd
oth
er
urb
an
wa
ste
s a
nd
re
use
d a
s a
re
ne
wa
ble
fe
rtili
zer
(S4
)
So
il e
rosi
on
fro
m a
gri
cult
ure
an
d
effl
ue
nt
fro
m o
ut-
of-
da
te s
ew
era
ge
sy
ste
ms
can
lea
d t
o p
ho
sph
oru
s p
ollu
tio
n o
f w
ate
r a
nd
to
xic
alg
al
blo
om
s (S
1)
On
ly o
ne
-fift
h o
f P
in m
ine
d p
ho
sph
ate
ro
ck c
urr
en
tly
rea
che
s th
e f
oo
d w
e
con
sum
e—
the
re
st is
wa
ste
d a
t a
ll st
ag
es
fro
m m
ine
to
fie
ld t
o f
ork
(S
2.2
)
We
pro
du
ce 3
.5 M
t o
f P
in o
ur
exc
reta
g
lob
ally
ea
ch y
ea
r— a
lmo
st h
alf
of
this
in u
rba
n a
rea
s (S
1)
16
.5±
3
12
±0
.2
9.5
±2
.5
0.9
±0
.93.5
±0
.5
3.5
±0
.5
1.5
±0
.5
4.8
±1
.34
.8±
1.3
1.3
±0
.21
.3±
0.2
1.3
±0
.21
.3±
0.2
?
1±
0.2
18
±3
.5
Fe
rtil
ize
r
Ag
ricu
ltu
re a
nd
liv
est
ock
Man
ure
16±1
Crop
s*11
So
il12
Hu
ma
ne
xcr
eta
Hu
ma
ns
Ph
osp
ha
tero
ckP
ho
sph
ate
rock
Inla
nd
co
ast
al
wa
ters
Inla
nd
co
ast
al
wa
ters
Ind
ust
ria
lu
ses
Ind
ust
ria
lu
ses
Na
tura
lv
eg
eta
tio
nN
atu
ral
ve
ge
tati
on
Figu
re2
Hum
anin
terv
entio
nin
the
phos
phor
uscy
cle
and
the
glob
alfo
odsy
stem
,inc
ludi
ngm
ajor
phos
phor
us(P
)flow
s.T
hefig
ure
illus
trat
esth
eex
tent
and
inte
rcon
nect
edne
ssof
the
glob
alph
osph
orus
chal
leng
ebe
yond
phys
ical
scar
city
ofph
osph
ate
rock
.Cor
resp
ondi
ngse
ctio
nnu
mbe
rsin
this
revi
ewar
ein
dica
ted
(S).
Dat
aas
indi
cate
din
text
and
Supp
lem
enta
lTab
le1.
164 Cordell ·White
Ann
u. R
ev. E
nvir
on. R
esou
rc. 2
014.
39:1
61-1
88. D
ownl
oade
d fr
om w
ww
.ann
ualr
evie
ws.
org
Acc
ess
prov
ided
by
Vir
gini
a C
omm
onw
ealth
Uni
vers
ity o
n 06
/25/
15. F
or p
erso
nal u
se o
nly.

EG39CH06-CordellWhite ARI 9 October 2014 1:29
the remainder of this review. Only when these impacts are assessed in relation to one another canthe full extent of the global phosphorus challenge be comprehended and hence addressed in anintegrated way. Figure 2 also indicates the major flows of phosphorus through the global foodsystem (see Supplemental Table 1 for data sources; follow the Supplemental Material link fromthe Annual Reviews home page at http://www.annualreviews.org). Several global phosphorusflow analyses have been undertaken in recent years, with some focusing more on phosphorus fluxeswithin the food system (5, 20, 21) and others having a greater emphasis on phosphorus fluxes fromthe food or agricultural system to the world’s oceans and fresh water bodies (10, 15, 22, 23).
The natural phosphorus biogeochemical cycle is balanced and recirculates phosphorus betweenthe lithosphere and hydrosphere at rates of millions of years. Bedrock gradually weathers to formsoil, which is then transported to rivers and oceans via wind/water erosion, which eventuallysinks to the seabed together with remains of aquatic life and forms sedimentary rock, ultimatelysurfacing due to tectonic uplift (24).
Today, on a human timescale, phosphorus predominantly flows in a one-way direction throughthe global food system from mines to the oceans via agriculture at rates over three times naturalflow (15, 22). Each year, approximately 21 ± 4 megatonnes per year of phosphorus (Mt/a of P)in phosphate rock is mined and cleaned, of which 18 ± 3.5 Mt/a of P is then reacted with sulfuricacid to produce phosphoric acid, a more concentrated and plant-available form of phosphate forfertilizers (5, 18, 23, 25). Some 15–30% of phosphorus is lost during mining and processing, 3 ±0.6 Mt/a of P is used for industrial purposes, and a further 1.5 ± 0.5 Mt/a of P ends up stockpiledonsite in the fertilizer by-product phosphogypsum or lost due to spillages (18, 26, 27).
Phosphate fertilizer products, including di-ammonium phosphate, mono-ammonium phos-phate, nitrogen-phosphorus-potassium (NPK), triple super phosphate, and single super phosphate(amounting to some 16.5 ± 3 Mt/a of P), are traded globally and applied to the world’s agricul-tural fields and grasslands (23, 28, 29). Plant roots take up only 15–30% of the phosphorus appliedannually in fertilizers (in addition to residual soil phosphorus) that is subsequently dissolved insoil solution (30). Approximately 11 Mt of P is taken up by crops and grassland each year, while12 Mt of P is estimated to be added to the soil stock each year. Some 5 ± 3 Mt/a of P in soil isexported via wind and water erosion from fields to water bodies and nonagricultural soils. Phos-phorus enters into the livestock sector in the form of feed, fodder, supplements, fertilized pastures,or natural grasslands. Phosphorus leaves the world’s feedlots, pastures, and grasslands in animalproducts, and the remainder ends up in manures and eroded soils. Manure alone is estimated tocontain some 16 ± 1 Mt/a of P from the world’s 63 billion head of livestock (11). Half of this isproductively reused in agricultural or grassland soils, while the other half is estimated to be lostto nonagricultural soils or water.
Some 9.5 ± 2.5 Mt/a of P in crops and animal products (such as meat, milk, eggs, and fish) arethen processed into food products, of which 3.5 ± 0.5 Mt/a of P is physically consumed by thehuman population, with the remaining 4.8 ± 1.3 Mt/a of P either processed as nonfood products(e.g., nonfood oils), wasted (e.g., spoiled food), or lost as inedible components (e.g., banana peelsand egg shells) and predominantly destined for landfills or compost heaps. Of the phosphorus infood consumed by humans, almost all (98%) leaves the body in urine and feces (31). A fraction ofthis (0.9 ± 0.9 Mt/a of P) is reused in agriculture via application of treated or untreated wastewaterand biosolids. The ultimate fate of this phosphorus therefore is to enter freshwater or oceans (6.3 ±3.2 Mt/a of P) or, to a lesser extent, nonagricultural soils and landfills.
Bennett et al. (22) estimate that the human intervention in the global phosphorus cycle hasmobilized an additional 22 Mt/a of P to enter the ocean, beyond natural cycling. Excess nutrientsin freshwater and oceans leads to eutrophication, which can lead to excessive growth of toxic algalblooms, with adverse consequences for aquatic ecosystems, water quality, and recreation (15). In
www.annualreviews.org • Life’s Bottleneck: Phosphorus 165
Supplemental Material
Ann
u. R
ev. E
nvir
on. R
esou
rc. 2
014.
39:1
61-1
88. D
ownl
oade
d fr
om w
ww
.ann
ualr
evie
ws.
org
Acc
ess
prov
ided
by
Vir
gini
a C
omm
onw
ealth
Uni
vers
ity o
n 06
/25/
15. F
or p
erso
nal u
se o
nly.

EG39CH06-CordellWhite ARI 9 October 2014 1:29
2008, the World Resources Institute (32) reported more than 400 dead zones around the world asa result of eutrophication, from the Baltic Sea, to the US’s Chesapeake Bay, to Australia’s GreatBarrier Reef (33, 34). In the United States alone, eutrophication is estimated to cost US$2.2 billionannually (35). Concentrated phosphorus in urban wastewater effluent discharged to lakes and riverscoupled with diffuse nutrient pollution leaking from agricultural fields are the main pathwaysleading to eutrophication (36). The most effective ways to manage eutrophication are thereforeto remove phosphorus from wastewaters discharged into water (37) and to improve land-basedpractices to reduce soil erosion to water (38).
Although the influential “planetary boundaries” assessment (39) suggested that current globalphosphorus use is within a “safe operating space,” Carpenter & Bennett (40) revised this analysis,noting that the safe threshold has already been crossed when freshwater (in addition to oceanic) eu-trophication is also included in the assessment. Furthermore, the planetary boundaries frameworkdoes not include depletion of phosphate reserves or phosphate stocks relative to use (41).
2. DIMENSIONS OF PHOSPHORUS SCARCITY
Over the past few decades, awareness of and research on phosphorus as a pollutant contributingto eutrophication and the world’s dead zones has increased and reached the global agenda, suchas when phosphorus flux was identified as one of the world’s nine planetary boundaries (39).Concerns around phosphorus scarcity were limited to discussions within specific groups (e.g., 42)and the occasional forewarning by scientific and social commentators (11). A future scarcity ofphosphorus and the implications for food security were largely ignored in the dominant discourseson global food security (e.g., 14, 43, 44), global environmental change (e.g., 39, 45), and resourcescarcity (41, 46).
However, this discourse underwent abrupt changes in 2008 when the price of phosphate rockspiked 800% from US$50/tonne to US$430/tonne (Figure 3). This occurred against a backdrop offood and other commodity price spikes and shortages the same year. Food and fertilizer riots ensuedamong the poor from Haiti to India as consumers and farmers could not access sufficient resources(41, 47). However, this short-term crisis triggered substantial and sudden interest in the longer-term issue of global phosphorus scarcity. A flurry of science media reports (e.g., 48), scientificarticles (e.g., 5, 49), and new multistakeholder platforms (e.g., the Global Phosphorus ResearchInitiative, the Dutch Nutrient Platform, the US Sustainable Phosphorus Initiative, and GlobalTraPs) emerged directly addressing the issue and raising awareness at the international level (50,51). Having been ignored in the past, the scarcity of phosphorus began to appear in authoritativereports by key international documents on global food security (23, 52, 53). Nevertheless, manyof these discussions have been limited to physical scarcity of phosphate rock (e.g., timeline fordepletion and longevity of reserves) rather than addressing the wider, complex issues associatedwith scarcity.
PHOSPHORUS SCARCITY: NOT JUST PHYSICAL
Although often perceived narrowly as the size and longevity of geological phosphate reserves, phosphorus scarcityhas at least five dimensions beyond physical scarcity: economic, managerial, geopolitical, and institutional scarcityall contribute to hindering the accessibility and availability of phosphorus for food security (41). Often resourcescarcity is more about ineffective management and governance than simply physical scarcity (101).
166 Cordell ·White
Ann
u. R
ev. E
nvir
on. R
esou
rc. 2
014.
39:1
61-1
88. D
ownl
oade
d fr
om w
ww
.ann
ualr
evie
ws.
org
Acc
ess
prov
ided
by
Vir
gini
a C
omm
onw
ealth
Uni
vers
ity o
n 06
/25/
15. F
or p
erso
nal u
se o
nly.

EG39CH06-CordellWhite ARI 9 October 2014 1:29
0
50
100
150
200
250
300
350
400
450
Jan-06 Jan-07 Jan-08 Jan-09 Jan-10 Jan-11 Jan-12 Jan-13
US
$/t
on
ne
Date
Figure 3Phosphate rock commodity price 2006–2013, indicating 2008 price spike at US$431/tonne. Data sources:World Bank Commodity Price Data (53a); Minemakers Limited (53b). http://econ.worldbank.org/WBSITE/EXTERNAL/EXTDEC/EXTDECPROSPECTS/0,,contentMDK:21574907∼menuPK:7859231∼pagePK:64165401∼piPK:64165026∼theSitePK:476883,00.html.
2.1. Physical Scarcity
Phosphate rock is a finite resource that has taken tens of millions of years to form from the miner-alization of shells and dead aquatic life followed by tectonic uplift (24). Like other nonrenewableresources, the cheaper and easier-to-reach deposits are typically mined first (54, 55). Scientistsand industry agree that although the element phosphorus will never run out per se, high-gradereserves will one day be depleted, meaning that remaining phosphate rock reserves will have alower phosphorus concentration, will contain more impurities (such as clay), will become physi-cally harder to access, will lead to more waste being generated per tonne of phosphorus extracted,and will subsequently result in increased input and extraction costs (18, 55–61, 62). For this reason,scientists and industry caution that this precious resource upon which life depends should be usedefficiently (5, 52, 55, 63).
Where the debate and scientific uncertainty lie is in the size and longevity of remaining phos-phate rock reserves. Figure 4 compares six recent studies on the longevity of global phosphatereserves (5, 55, 63–68) (the different assumptions for each study are outlined in Table 1). Theunderlying reasons for such a vast range of estimates include assumptions about demand, supply,and the depletion model employed.
First, regarding future demand, some estimates, such as Van Kauwenbergh (55) and Fixen(63), assume phosphate demand is fixed. They make these estimates despite future projecteddemand increases associated with population growth, dietary changes, and nonfood demands suchas biofuels (21, 23, 69).
Second, estimates differ due to assumptions regarding future supply of global phosphate rock.Estimates for phosphate rock reserves and resources are dynamic figures (55, 70) because theyare based on what is considered technically and economically feasible at a given point in time, inaddition to any new reported discoveries. Reported reserve estimates collated by the US Geological
www.annualreviews.org • Life’s Bottleneck: Phosphorus 167
Ann
u. R
ev. E
nvir
on. R
esou
rc. 2
014.
39:1
61-1
88. D
ownl
oade
d fr
om w
ww
.ann
ualr
evie
ws.
org
Acc
ess
prov
ided
by
Vir
gini
a C
omm
onw
ealth
Uni
vers
ity o
n 06
/25/
15. F
or p
erso
nal u
se o
nly.

EG39CH06-CordellWhite ARI 9 October 2014 1:29
Pro
du
ctio
n (
Mt/
a o
f P
)
Year
C
F
2011 2070 2311–2411
E
2102
B
A Mohr & Evans (2013)
B Cordell et al. (2009), Cordell & White (2011)
C GPRI (2010), Cordell et al. (2011)
D Walan (2013)
E Fixen (2009)
F Van Kauwenbergh (2010) AA
2025 2033
D
2084
Figure 4Global phosphate depletion scenarios by different authors, indicating different depletion or peak years basedon different assumptions outlined in Table 1. [Studies depicted are A. Mohr & Evans (64); B. Cordell et al.and Cordell & White (5, 65); C. GPRI (144), Cordell et al. (66); D. Walan (68); E. Fixen (63); F. VanKauwenbergh (55).]
Table 1 No consensus: recent studies on global phosphate depletion and underlying assumptions (see the authors’scenarios depicted graphically in Figure 4)
Author Global phosphate depletion scenario(s) and assumptionsA. Mohr & Evans (64) Peak phosphorus scenarios based on a dynamic, bottom-up demand-production
interaction model aggregating regions, not a Hubbert model; using USGS 2012phosphate reserve data for URR; peak phosphorus scenarios: 2025 (low), 2030 (mostlikely), 2120 (high)
B. Cordell et al. and Cordell& White (5, 65)
Simplistic peak phosphorus modeling based on Hubbert curve and least-squaresoptimization fixing USGS 2008 phosphate reserve data as URR
C. GPRI (144), Cordell et al. (66) Simplistic peak phosphorus modeling based on Van Kauwenberg (55) phosphatereserve data as URR, using Bayesian statistical analysis; peak phosphorus scenarios:2051 (low), 2070 (most likely), 2092 (high).
D. Walan (68) Peak phosphorus scenarios based on logistic and Gompertz curves aggregating topcountry production; peak phosphorus scenarios: 2030 (low), 2084 (most likely), 2131(high)
E. Fixen (63) R/P fixed ratio model, assuming no-growth production rate (fixed at 2007/2008), andphosphate reserves based on USGS 2009 estimates
F. Van Kauwenbergh (55) R/P fixed ratio model, assuming no-growth production rate (fixed at 2009) based onauthor’s revised phosphate reserve estimates for Morocco
Van Vurren et al. (67) Depletion scenarios based on systems dynamic modeling of four MillenniumEcosystem Assessment scenarios for phosphorus consumption in 2050; best-casescenario: 20–35% depletion by 2100; worst-case, 40–60% depletion by 2100
Abbreviations: IFDC, International Fertilizer Development Center; R/P, reserves/production; URR, ultimately recoverable resources; USGS, USGeological Survey.
168 Cordell ·White
Ann
u. R
ev. E
nvir
on. R
esou
rc. 2
014.
39:1
61-1
88. D
ownl
oade
d fr
om w
ww
.ann
ualr
evie
ws.
org
Acc
ess
prov
ided
by
Vir
gini
a C
omm
onw
ealth
Uni
vers
ity o
n 06
/25/
15. F
or p
erso
nal u
se o
nly.

EG39CH06-CordellWhite ARI 9 October 2014 1:29
Survey (USGS) (see Figure 7 and the related discussion below) vary year to year (most notablya quadrupling of estimates of Morocco’s share between 2009 and 2010), thus affecting the resultsof authors’ depletion studies. For example, the Cordell et al. (5) peak phosphorus study relied on2009 USGS reserve data (best available at the time of publishing), resulting in a peak year of 2033(B in Figure 4). When the same model is updated with the 2010 reserve data range from the Inter-national Fertilizer Development Center (IFDC) (see Reference 55), the peak curve shifts severaldecades to 2051–2092 (C in Figure 4; see References 66, 144). IFDC estimates (see Reference55) reestimated global phosphate rock reserves at 60,000 Mt, up from 16,000 Mt the previousyear (58). This quadrupling of estimated reserves was largely due to revising Morocco’s sharefrom 5,600 to 51,000 Mt of phosphate rock. However, these revisions were based on literaturefrom 1989 and 1998, not on new geological studies. The revised data have been largely adoptedby industry and scientists alike (including USGS), due to a lack of other reliable public data. Ascautioned by Edixhoven et al. (71), the IFDC’s revised global reserve estimates are largely incon-clusive and hypothetical, and the IFDC definitions contravene the global development towardmore common criteria in resource reporting, leading to “pervasive confusion” and a high degreeof error (71, p. 1005).
Third, estimates vary depending on the type of depletion model used and the assumptions theyentail. The reserves/production (R/P) fixed ratio model employed by Van Kauwenbergh of IFDC(55) and Fixen (63) optimistically assumes that all the reserve can and will be used, and thus esti-mates based on this model lead to a later depletion date (72) [300–400 years as suggested by IFDC(55)]. Bell-shaped curve models, such as the peak phosphorus model, assume—less optimisticallyand based on empirical evidence with phosphate and other nonrenewable resources—that thecritical point in time occurs not when 100% of the reserve is depleted but rather far sooner owingto economic and energy constraints (65, 72, 73). Reserve figures give an indication of “tonnes ofphosphate rock,” without indicating the quality (e.g.,%P2O5) and ease of extraction. Recent peakphosphorus studies by Mohr & Evans (64) and Walan (68) using country-level USGS reservedata for ultimately recoverable resources (URR) indicate a likely production peak this century.Other studies skeptical of peak phosphorus modeling suggest that Hubbert-style curve fitting isnot robust in the situation when URR is not already known (74) or that such bell-curve modelingdoes not adequately deal with dynamic factors such as changes in cost, demand, and technologicaladvances and that perhaps Hubbert-style modeling better serves as “early warning indicators”(70).
2.2. Managerial Scarcity
Phosphorus is also scarce because of mismanagement of the resource. That is, inefficient use ofphosphorus hinders its availability and accessibility in food production. Ultimately, only one-fifthof the phosphorus mined globally for food production finds its way into the food consumed bythe global population (Figure 2 and Reference 5). This is due to inefficiencies and losses at allstages of the food system: mining, fertilizer production, fertilizer use in agriculture, livestockproduction, food production and processing, food retailing, and consumption. Some of theselosses are avoidable, such as spillages, but others are unavoidable, such as losses in the form ofcrop residues, bones, and banana peels (75).
The situation is similar at the national level. An increasing number of national and regionalphosphorus flow analyses indicate substantial phosphorus leakage/mismanagement (76–79). Weillustrate four such national phosphorus flow analyses for Japan and Australia (Figure 5) and forTurkey and Zimbabwe (Supplemental Figure 1). These highlight the similarities and differenceswith respect to implications for phosphorus management. The largest reported phosphorus losses
www.annualreviews.org • Life’s Bottleneck: Phosphorus 169
Supplemental Material
Ann
u. R
ev. E
nvir
on. R
esou
rc. 2
014.
39:1
61-1
88. D
ownl
oade
d fr
om w
ww
.ann
ualr
evie
ws.
org
Acc
ess
prov
ided
by
Vir
gini
a C
omm
onw
ealth
Uni
vers
ity o
n 06
/25/
15. F
or p
erso
nal u
se o
nly.

EG39CH06-CordellWhite ARI 9 October 2014 1:29
Fertilizer
Chemicalsubstance
Phosphateore
Domesticproducts
Othermineral
resources
Iron and steelindustry
Otherindustry
Chemicalindustry
Fertilizerindustry
Food and feed
Livestock
Farm/ranch
Human
Miscellaneous drainage
River/coastalarea
Sludge
Landfill
Soilaccumulation
Slag
Steel
Products/byproducts
Fertilizer405
Phosphaterock353
Food/fiberproduction
182
Consumedfood
12
Humanexcreta
Organicwaste
Non-agrisoil
Landfill
Water
Domesticmines
Importedfood/fiber
Industrial uses(e.g., detergents)
Nonfood
Wastewater
113
1
67
24
23
157
110
155
151 151
155
110
219
24
89
5
93
173
401
376
15
43
17
103
54
145 9243 40
16
1
X
1125
0.02
256
X
Fisheries
Wildanimals
Vegetation
64Phosphate
rock imports
Fertilizerimports
14920
68 (H1)
203
7
6
6
10
100
4
12
10
0.2
9
2
180
102
28
1288
Phosphogypsumstockpiles
Other losses
Mining waste
Agriculture(soil, crops)
241Livestock
Pastures,feedlots
257
15
27
27
53
12
12
Fertilizerexports
Exportedfood/fiber
34
Japan
AustraliaAustralia
a
b
77
12
170 Cordell ·White
Ann
u. R
ev. E
nvir
on. R
esou
rc. 2
014.
39:1
61-1
88. D
ownl
oade
d fr
om w
ww
.ann
ualr
evie
ws.
org
Acc
ess
prov
ided
by
Vir
gini
a C
omm
onw
ealth
Uni
vers
ity o
n 06
/25/
15. F
or p
erso
nal u
se o
nly.
EG39CH06-CordellWhite ARI 9 October 2014 1:29
$145
$228
$226
$25
$95
$8
$98
$2
$0
$48
$60
$32
$15
$18
$8
$220
$63
$14
$126
$0 $100 $200 $300 $400 $500 $600 $700 $800
Malawi$321
Thailand$282
Angola$828
US$/tonne
Product cost
Shipping
Port handling
Duties
Inland transport costs
Dealer cost margin
Other costs
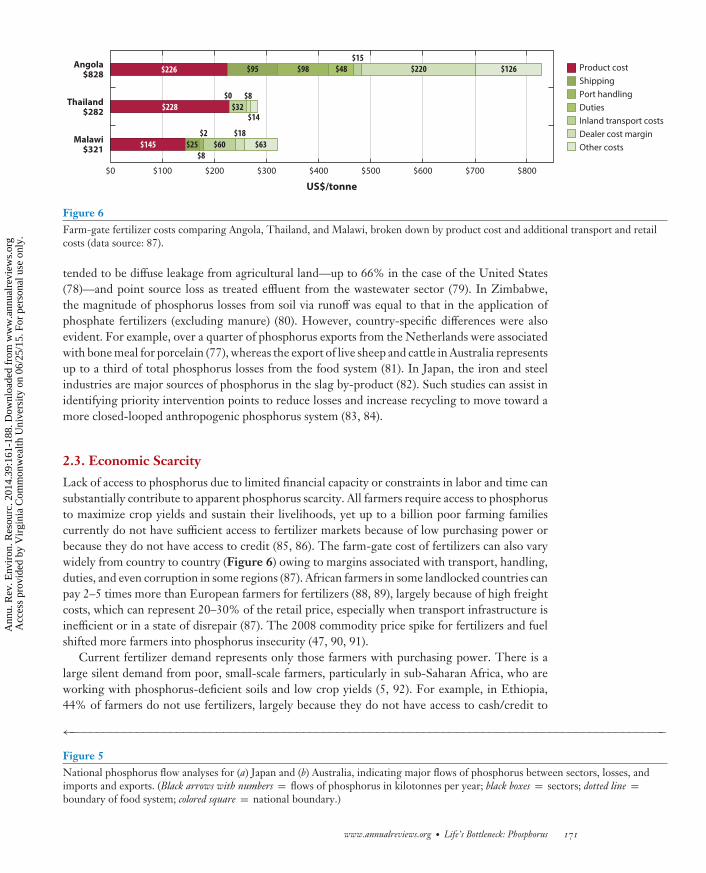
Figure 6Farm-gate fertilizer costs comparing Angola, Thailand, and Malawi, broken down by product cost and additional transport and retailcosts (data source: 87).
tended to be diffuse leakage from agricultural land—up to 66% in the case of the United States(78)—and point source loss as treated effluent from the wastewater sector (79). In Zimbabwe,the magnitude of phosphorus losses from soil via runoff was equal to that in the application ofphosphate fertilizers (excluding manure) (80). However, country-specific differences were alsoevident. For example, over a quarter of phosphorus exports from the Netherlands were associatedwith bone meal for porcelain (77), whereas the export of live sheep and cattle in Australia representsup to a third of total phosphorus losses from the food system (81). In Japan, the iron and steelindustries are major sources of phosphorus in the slag by-product (82). Such studies can assist inidentifying priority intervention points to reduce losses and increase recycling to move toward amore closed-looped anthropogenic phosphorus system (83, 84).
2.3. Economic Scarcity
Lack of access to phosphorus due to limited financial capacity or constraints in labor and time cansubstantially contribute to apparent phosphorus scarcity. All farmers require access to phosphorusto maximize crop yields and sustain their livelihoods, yet up to a billion poor farming familiescurrently do not have sufficient access to fertilizer markets because of low purchasing power orbecause they do not have access to credit (85, 86). The farm-gate cost of fertilizers can also varywidely from country to country (Figure 6) owing to margins associated with transport, handling,duties, and even corruption in some regions (87). African farmers in some landlocked countries canpay 2–5 times more than European farmers for fertilizers (88, 89), largely because of high freightcosts, which can represent 20–30% of the retail price, especially when transport infrastructure isinefficient or in a state of disrepair (87). The 2008 commodity price spike for fertilizers and fuelshifted more farmers into phosphorus insecurity (47, 90, 91).
Current fertilizer demand represents only those farmers with purchasing power. There is alarge silent demand from poor, small-scale farmers, particularly in sub-Saharan Africa, who areworking with phosphorus-deficient soils and low crop yields (5, 92). For example, in Ethiopia,44% of farmers do not use fertilizers, largely because they do not have access to cash/credit to
←−−−−−−−−−−−−−−−−−−−−−−−−−−−−−−−−−−−−−−−−−−−−−−−−−−−−−−−−−−−−−−−−−−−−−−−−−−−−−−−−−−−−−−−−−−Figure 5National phosphorus flow analyses for (a) Japan and (b) Australia, indicating major flows of phosphorus between sectors, losses, andimports and exports. (Black arrows with numbers = flows of phosphorus in kilotonnes per year; black boxes = sectors; dotted line =boundary of food system; colored square = national boundary.)
www.annualreviews.org • Life’s Bottleneck: Phosphorus 171
Ann
u. R
ev. E
nvir
on. R
esou
rc. 2
014.
39:1
61-1
88. D
ownl
oade
d fr
om w
ww
.ann
ualr
evie
ws.
org
Acc
ess
prov
ided
by
Vir
gini
a C
omm
onw
ealth
Uni
vers
ity o
n 06
/25/
15. F
or p
erso
nal u
se o
nly.

EG39CH06-CordellWhite ARI 9 October 2014 1:29
0
10,000
20,000
30,000
40,000
50,000
60,000
70,000
80,000
1996 1997 1998 1999 2000 2001 2002 2003 2004 2005 2006 2007 2008 2009 2010 2011 2012
Ph
osp
ha
te r
ock
(M
t)
Year
Rest of world
Iraq
Algeria
Syria
Russia
Jordan
United States
South Africa
China
Morocco and Western Sahara
Figure 7Breakdown of reported phosphate rock reserves by country, indicating both market concentration and howreported estimates have changed over time. In 2013, most reported reserves were controlled by Morocco,China, Algeria, Syria, Jordan, and South Africa. Data source: USGS Phosphate Rock Mineral CommoditySummaries 1996–2013 (http://minerals.usgs.gov/minerals/pubs/commodity/phosphate_rock).
purchase them or they do not perceive them to be profitable given current input prices, soil,and rainfall patterns (85). According to a 2007 report published by the IFDC (87), in additionto limited access to finance and inefficient transport infrastructure (road and rail), economic andinstitutional barriers restricting the availability of fertilizers in Africa include nonconducive policyenvironments, ineffective regulation, inadequate human capital, restricted multicountry trade,inadequate market transparency and linkages, and inefficient port-handling facilities.
2.4. Geopolitical Scarcity
The uneven geological distribution of phosphate rock and significant geopolitical risks associatedwith such market concentration may restrict future availability of phosphate resources. Althoughover 35 countries have reported reserves (93), just six countries control 90% of the world’s re-maining high-grade phosphate rock reserves (Figure 7; 61). Morocco alone controls a reported74%, all of which is run by state-owned Office Cherifien des Phosphates (OCP). A concern is thiscould encourage monopolistic behavior such as price-setting (47). Furthermore, the recent ArabSpring highlighted the potential risks of a supply or export disruption due to political unrest inmajor producing countries (47, 94, 95).
Some of these large reserves are in Western Sahara, a territory currently occupied by Morocco.Some sources estimate 10% of Morocco’s production comes from Western Sahara (96); however,there are no official public statistics on reserves. Morocco’s control and ownership of the territoryand its phosphate deposits are contrary to UN resolutions (97), are contested by the independencemovement (Polisario Front), and are not recognized by any African nation (98). This geopolitical
172 Cordell ·White
Ann
u. R
ev. E
nvir
on. R
esou
rc. 2
014.
39:1
61-1
88. D
ownl
oade
d fr
om w
ww
.ann
ualr
evie
ws.
org
Acc
ess
prov
ided
by
Vir
gini
a C
omm
onw
ealth
Uni
vers
ity o
n 06
/25/
15. F
or p
erso
nal u
se o
nly.
EG39CH06-CordellWhite ARI 9 October 2014 1:29
situation presents both a risk to supply disruption and concerns over ongoing human rights abusesthat importing companies, countries, farmers, and food consumers are knowingly or unknowinglysupporting (47). Many Scandinavian companies have now divested from companies importingphosphate from the occupied region of Western Sahara (99).
In terms of annual production, China, the United States, Morocco, and Russia together produce75% of the world’s annual phosphate rock (61). This market concentration of major producingcountries creates short-term risks and means all importing countries are vulnerable to the decisionsof a few. For example, China shocked the world in 2008 by suddenly imposing a 135% exporttariff on phosphate rock. This effectively halted exports from this major producer overnight andis thought to have contributed to the 2008 price spike (100).
2.5. Institutional Scarcity
Given that phosphorus underpins the world’s food systems, there is a stark lack of effective globalgovernance of the crucial resource. That is, there are no explicit international or national poli-cies, guidelines, strategies, or organizations to ensure long-term availability and accessibility tophosphorus for food security (19, 41). Furthermore, no independent monitoring or accountabilitymechanisms address legitimacy and transparency. For example, despite the importance for farmersand policy makers, data and knowledge of the world’s remaining phosphate rock reserves are notindependently produced or managed; they are typically generated by mining and fertilizer compa-nies and market analysts and are not sufficiently transparent, reliable, or publically available (41).
The management of phosphorus is currently fragmented among many disparate sectors in thefood system with no overall coordination. For example, although phosphorus physically flows fromthe food we eat to our urine and feces, there is a huge disconnect between the food and sanitationsectors. Phosphate resources by default are governed by the market system. This may be sufficientto govern a narrow component of the system, such as efficiency of trade, triggering new explorationand technical advances (55). However, the market alone is ill-equipped to manage such an unevenlydistributed yet critical resource in an equitable, timely, and sustainable manner. The market priceof phosphate reflects its economic value (as a fertilizer) and does not reflect the true sustainabilitycosts of mining and using phosphorus (19). The ecological and social costs are not valued, such asthe increasing carbon cost of mining lower-grade phosphate, the ecological cost of eutrophicationand pollution, its finiteness, and the social cost of the exploitation of Western Sahara.
Indeed, phosphorus scarcity can perhaps be attributed more to governance failures than tophysical scarcity of the resource base (19, 101). The roles and responsibilities are currently un-clear, including the role of the United Nations (particularly the Food and Agriculture Organi-zation) and the social responsibility of the fertilizer industry (102). However, the first evidenceof international phosphorus governance can be seen in the formation of the European Sustain-able Phosphorus Platform (http://www.phosphorusplatform.eu) and European Commissionconsultation on Sustainable Phosphorus Use (95).
3. IMPLICATIONS OF THE CURRENT PHOSPHORUSUSE TRAJECTORY
3.1. Future Global Phosphorus Trends
If no significant changes are made to the way phosphorus is currently used, the one-way flow offossil phosphate from mines to oceans is likely to continue, exacerbating the current phosphoruschallenges and vulnerabilities outlined in Section 2. Other emerging global sustainability
www.annualreviews.org • Life’s Bottleneck: Phosphorus 173
Ann
u. R
ev. E
nvir
on. R
esou
rc. 2
014.
39:1
61-1
88. D
ownl
oade
d fr
om w
ww
.ann
ualr
evie
ws.
org
Acc
ess
prov
ided
by
Vir
gini
a C
omm
onw
ealth
Uni
vers
ity o
n 06
/25/
15. F
or p
erso
nal u
se o
nly.

EG39CH06-CordellWhite ARI 9 October 2014 1:29
0
10
20
30
40
50
60
70
80
90
1970 1990 2010 2030 2050
kg
/pe
rso
n/y
ea
r
kg
/pe
rso
n/y
ea
r
a Meat consumption
Sub-Saharan Africa
Middle East and North Africa
Latin America/Caribbean
South Asia
East Asia
0
20
40
60
80
100
120
140
160
1970 1990 2010 2030 2050
b Milk and dairy consumption
Figure 8Per capita dietary changes in meat and dairy by region, 1970–2050 (data source: 108).
challenges and drivers are also likely to influence and be influenced by the world’s phosphorus-usepatterns (103), including pressures on the global food system and limits on arable land; populationgrowth; changing diets; climate change, including increased climate variability; water scarcity;and the impacts of climate change on soil functioning and fertility (104).
For example, demand for phosphate is expected to increase due to changing population, chang-ing diets, climate change policies, and the silent demand in Africa. An expected population of9–10 billion by 2050 (105) means more mouths to feed and hence more fertilizers to grow crops,largely expected through intensification rather than extensification (106, 107). It is well under-stood that dietary preferences are shifting toward more meat and dairy products associated withincreased affluence in emerging economies (Figure 8). If this continues, per capita meat anddairy consumption will continue to increase the per capita demand for phosphate. In addition,the nonfood demand for phosphorus is also likely to increase, due for example to climate changepolicies such as growth in first-generation biofuel crops that require fertilizers or to lithium-iron-phosphate batteries for electric vehicles that require 60 kg of phosphate per battery.
In a business-as-usual scenario, fertilizer prices are expected to increase as physical scarcityincreases—that is, as input costs increase and phosphate grade declines (55). Higher phosphateprices in turn will continue to trigger new exploration and development of phosphate rock mines.Since the 2008 price spike, new mines have been developed or are proposed in Morocco (55), offthe coast of Namibia (http://www.namphos.com), in the Georgina Basin of Australia (109), andin Saudi Arabia (47). These developments have increased the reported phosphate rock reserves(61). However, mining these future reserves will be constrained by thermodynamic realities (asnoted in Section 2.1), and these new reserves contain less phosphorus (P2O5) and more impurities,such as cadmium and radionuclides. In some cases, they are also physically harder and more costlyto access, such as the off-shore Namibian development that involves sea bed mining (55, 75, 110).
Furthermore, future long-term fertilizer price increases coupled with potential short-term pricespike shocks are likely to affect the world’s most vulnerable poor farmers first. A lack of institutionaldiversity governing phosphorus increases the potential for oligopolistic behavior and repeats ofthe 2008 price spike. The market system and power of key producing nations will continue tobe the default governance system of phosphorus, leading to higher prices and potential disrup-tions to supply, further increasing the vulnerability of importing countries and of poor farmers(111).
174 Cordell ·White
Ann
u. R
ev. E
nvir
on. R
esou
rc. 2
014.
39:1
61-1
88. D
ownl
oade
d fr
om w
ww
.ann
ualr
evie
ws.
org
Acc
ess
prov
ided
by
Vir
gini
a C
omm
onw
ealth
Uni
vers
ity o
n 06
/25/
15. F
or p
erso
nal u
se o
nly.

EG39CH06-CordellWhite ARI 9 October 2014 1:29
P deficits (kg P per ha per year) P surpluses (kg P per ha per year)
Lowest quartile (0 to –0.8)
Lower-middle quartile (–0.8 to –1.9)
Upper-middle quartile (–1.9 to –3.2)
Top quartile (–3.2 to –39.0)
Lowest quartile (0 to 2.5)
Lower-middle quartile (2.5 to 6.2)
Upper-middle quartile (6.2 to 13.0)
Top quartile (13.0 to 840.0)
Figure 9Uneven distribution: phosphorus use deficits and surplus around the globe, including fertilizer and manure application to agriculturalsoils (reproduced with permission from Reference 112).
If no action is taken to address phosphorus scarcity, a hard-landing situation is likely to re-sult in increased energy costs for mining and processing phosphate, increased production andtransport costs, increased generation of pollution and waste, long-term fertilizer price increases,further short-term price spikes, increased geopolitical tensions and risks, reduced farmer accessto fertilizers, reduced global crop yields, and increased global hunger.
3.2. Phosphorus Paradox: Regional Dichotomies in the Phosphorus Challenge
Phosphorus is now understood as simultaneously scarce and polluting; both global problemsare worsening (e.g., 52). Huge regional phosphorus disparities exist that are also likely to beexacerbated in the future without changes to the way phosphorus is used and governed bystakeholders throughout the food system. The distribution of phosphate rock is highly unevengeographically, and market share of production is likely to become even more concentratedin northern Africa in the long term (64, 68, 94), thereby exacerbating inequalities and thevulnerability of importing countries.
Some of the world’s soils have a surplus of phosphorus, while others are phosphorus deficientdue to both biogeochemical and anthropogenic causes (Figure 9; 112). This is evident on a globalscale; for example, in Asia application rates can be as high as 196 kg/ha of fertilizer, whereas in sub-Saharan Africa typical rates average 5 kg/ha (52). Such uneven distribution is also evident withina single country. For example, in Australia, which has naturally phosphorus-deficient ancientweathered soils, many southern cropping systems now have a phosphorus surplus, whereas thevast northern grazing systems are over 90% phosphorus deficient (81). Even within a single farm,phosphorus can be unevenly distributed if, for example, animals defecate under a tree while seekingshade or while waiting in crowds during herding/milking (113).
Partly as a consequence of these disparities, coupled with the degree of fertilizer access, forsome farmers the biggest phosphorus issue is managing excess, whereas for others it is securing
www.annualreviews.org • Life’s Bottleneck: Phosphorus 175
Ann
u. R
ev. E
nvir
on. R
esou
rc. 2
014.
39:1
61-1
88. D
ownl
oade
d fr
om w
ww
.ann
ualr
evie
ws.
org
Acc
ess
prov
ided
by
Vir
gini
a C
omm
onw
ealth
Uni
vers
ity o
n 06
/25/
15. F
or p
erso
nal u
se o
nly.
EG39CH06-CordellWhite ARI 9 October 2014 1:29
2
0
4
6
8
10
12
14
16
18
20
201720122007200219971992198719821977197219671962
Ph
osp
ho
rus
(Mt/
a P
)
Year
Developing countries
Developed countries
Forecast
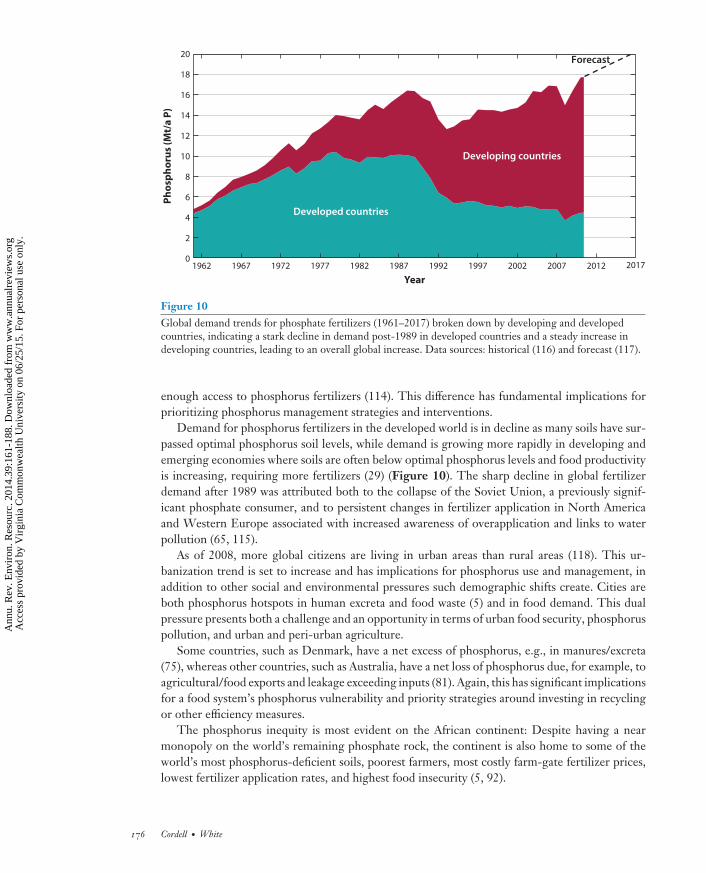
Figure 10Global demand trends for phosphate fertilizers (1961–2017) broken down by developing and developedcountries, indicating a stark decline in demand post-1989 in developed countries and a steady increase indeveloping countries, leading to an overall global increase. Data sources: historical (116) and forecast (117).
enough access to phosphorus fertilizers (114). This difference has fundamental implications forprioritizing phosphorus management strategies and interventions.
Demand for phosphorus fertilizers in the developed world is in decline as many soils have sur-passed optimal phosphorus soil levels, while demand is growing more rapidly in developing andemerging economies where soils are often below optimal phosphorus levels and food productivityis increasing, requiring more fertilizers (29) (Figure 10). The sharp decline in global fertilizerdemand after 1989 was attributed both to the collapse of the Soviet Union, a previously signif-icant phosphate consumer, and to persistent changes in fertilizer application in North Americaand Western Europe associated with increased awareness of overapplication and links to waterpollution (65, 115).
As of 2008, more global citizens are living in urban areas than rural areas (118). This ur-banization trend is set to increase and has implications for phosphorus use and management, inaddition to other social and environmental pressures such demographic shifts create. Cities areboth phosphorus hotspots in human excreta and food waste (5) and in food demand. This dualpressure presents both a challenge and an opportunity in terms of urban food security, phosphoruspollution, and urban and peri-urban agriculture.
Some countries, such as Denmark, have a net excess of phosphorus, e.g., in manures/excreta(75), whereas other countries, such as Australia, have a net loss of phosphorus due, for example, toagricultural/food exports and leakage exceeding inputs (81). Again, this has significant implicationsfor a food system’s phosphorus vulnerability and priority strategies around investing in recyclingor other efficiency measures.
The phosphorus inequity is most evident on the African continent: Despite having a nearmonopoly on the world’s remaining phosphate rock, the continent is also home to some of theworld’s most phosphorus-deficient soils, poorest farmers, most costly farm-gate fertilizer prices,lowest fertilizer application rates, and highest food insecurity (5, 92).
176 Cordell ·White
Ann
u. R
ev. E
nvir
on. R
esou
rc. 2
014.
39:1
61-1
88. D
ownl
oade
d fr
om w
ww
.ann
ualr
evie
ws.
org
Acc
ess
prov
ided
by
Vir
gini
a C
omm
onw
ealth
Uni
vers
ity o
n 06
/25/
15. F
or p
erso
nal u
se o
nly.

EG39CH06-CordellWhite ARI 9 October 2014 1:29
4. SUSTAINABLE STRATEGIES FOR FOOD SECURITYAND ECOSYSTEM INTEGRITY
In an era of unprecedented global environmental change (119), flexibility, diversity, and long-termtime frames will be essential for understanding, managing, and adapting our currently unsustain-able and complex systems in a timely manner. To respond to the complex, paradoxical, and multipledimensions of phosphorus scarcity and pollution, coexisting goals of national phosphorus securitycan be defined as (27, 41)
� Agricultural productivity: Increase overall phosphorus use efficiency of the food system(beyond the farm) by increasing the number of people fed per tonne of phosphorus input,or reduce total phosphorus demand while maintaining food/agricultural output;
� National security: Reduce dependence on phosphorus imports through diversification ofsources, to buffer against price fluctuations and geopolitical risks in producing countries;
� Soil fertility: Ensure soils are fertile in terms of total bioavailable phosphorus, the car-bon:nitrogen:phosporus ratio, organic matter, and moisture (92, 120);
� Farmer livelihoods: Ensure farmers’ needs are met by ensuring access to sufficient phospho-rus fertilizers in a bioavailable and manageable form (121);
� Environmental integrity and productivity: Reduce losses and wastage of phosphorusthroughout the food system, from mine to field to fork (75); and
� Ecological integrity: Reduce eutrophication and pollution of rivers, lakes, and oceans (40).
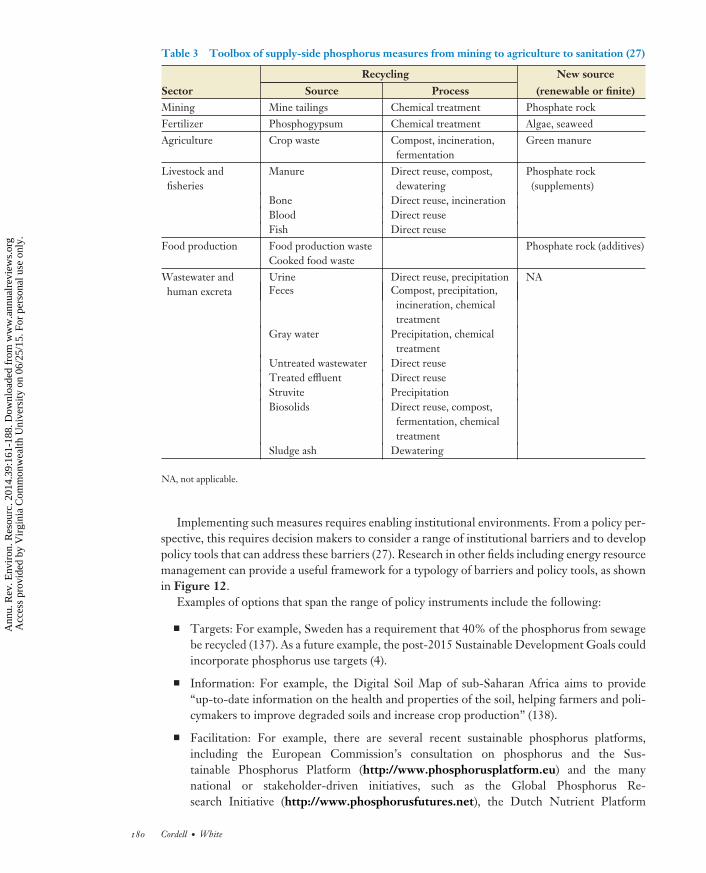
These multiple goals can be achieved through several measures. Sustainable management ofphosphorus has historically focused on phosphorus use efficiency in agriculture (driven largely byleakage/pollution or farm economics) (113) and phosphorus removal from wastewater (driven bypollution or wastewater management effectiveness) (27, 122). However, it is likely that meetinglong-term global food demand through sustainable means will require an integrated approach thatemploys a suite of measures, as conceptualized in Figure 11 (27, 69). Figure 11 and Tables 2 and3 systematically identify a range of 35 demand-side measures (efficiency and changing diets) and36 supply-side measures (reuse and new sources of phosphate rock) that can be implemented at allstages and sectors from mine to field to fork. For example, phosphorus can be potentially recoveredfrom almost any waste stream—ranging from human excreta to crop residues to phosphogypsum(a fertilizer by-product)—and by any process—ranging from direct use to precipitation toincineration. Similarly, phosphorus losses and wastage can be reduced in all sectors, ranging fromimproving mining efficiency to improved fertilizer placement to reducing food waste. Overall,phosphorus demand can also be reduced through reducing overconsumption of meat and dairyproducts.
A systematic overview of potential supply- and demand-side measures in different sectors canbe found in Cordell & White (27), Cordell et al. (69), and Childers et al. (123, 124). A range ofphosphorus use efficiency measures in agriculture are summarized in different European, African,
PHOSPHORUS SECURITY
A sustainable phosphorus system ensures that phosphorus is not only available in the long-term, but also accessible.Phosphorus security is therefore defined as ensuring that all farmers have short- and long-term access to sufficientphosphorus to produce food to feed the global population, while ensuring ecosystem integrity and sustainablelivelihoods (41).
www.annualreviews.org • Life’s Bottleneck: Phosphorus 177
Ann
u. R
ev. E
nvir
on. R
esou
rc. 2
014.
39:1
61-1
88. D
ownl
oade
d fr
om w
ww
.ann
ualr
evie
ws.
org
Acc
ess
prov
ided
by
Vir
gini
a C
omm
onw
ealth
Uni
vers
ity o
n 06
/25/
15. F
or p
erso
nal u
se o
nly.

EG39CH06-CordellWhite ARI 9 October 2014 1:29
0
10
20
30
40
50
60
70
1950 1960 1970 1980 1990 2000 2010 2020 2030 2040 2050 2060
Efficiency: agriculture
Efficiency: food chain
Changing diets
Reuse: crop residuesReuse: human excreta
Reuse: manure
Phosphate rock
Reuse: food/other waste
Business as usual
Ph
osp
ho
rus
(Mt/
a P
)
Year
Efficiency: mining and fertilizers
Demandmeasures Demand
measures
Supply measures
Supply measures
2070
Sustainable P measures
Figure 11Possible long-term integrated supply-side and demand-side measures for meeting future food security of 9 billion people (data sources:27, 69).
and Australian contexts in Schroder et al. (113), Smaling et al. (125), and Simpson et al. (126),respectively. Sartorius et al. (127), Rittmann et al. (128), and Cordell et al. (122) review phosphorusrecovery measures.
However, what works in one country or region might be inappropriate or ineffective in another.A phosphorus vulnerability assessment (111) can assess the nature and pathways by which a givenfood system is susceptible to harm owing to the different dimensions of phosphorus scarcity andpollution, including the degree of sensitivity and capacity to cope or adapt. This in turn caninform priority adaptive strategies to increase the resilience of that particular country or foodsystem (129). For example, Europe is a region dependent on imported phosphate, yet also hasexcess phosphorus in manure, limited land on which to spread the manure, and stringent waterquality regulations that limit phosphorus discharges [such as the Water Framework Directive(130)]. This means recovering phosphorus for reuse is a priority (95). India, by contrast, is 100%dependent on phosphate imports and yet is the largest phosphorus fertilizer consumer in theworld (26), with relatively low farmer livelihood security and with increasing fertilizer demand.This means India may need to prioritize fertilizer access and diversify sources of phosphorus.Australia, a net food producer, has naturally phosphorus-deficient soils yet has invested heavily inphosphate-intensive agricultural export industries such as beef, wheat, and live exports, resultingin a net export of phosphorus (81). This means even recycling 100% of phosphorus in humanexcreta in Australia would at most meet 5% of the country’s total phosphorus fertilizer demand,and hence sustainable phosphorus measures such as efficiency in agriculture must be a priority.
Finally, in addition to identifying sustainable strategies to address both phosphorus scarcityand pollution, there is a need to consider broader interactions, synergies, and trade-offs withother sustainability challenges, such as climate change, energy scarcity, water scarcity, and theirassociated initiatives, such as climate change mitigation and adaption policies (103). Consideringthese in isolation may indeed result in unintended consequences or inefficient outcomes (122).For example, Hein & Leemans (131) found that the negative impact of first-generation biofuels (apromising climate change–mitigation measure) on the depletion of phosphate was compromising
178 Cordell ·White
Ann
u. R
ev. E
nvir
on. R
esou
rc. 2
014.
39:1
61-1
88. D
ownl
oade
d fr
om w
ww
.ann
ualr
evie
ws.
org
Acc
ess
prov
ided
by
Vir
gini
a C
omm
onw
ealth
Uni
vers
ity o
n 06
/25/
15. F
or p
erso
nal u
se o
nly.

EG39CH06-CordellWhite ARI 9 October 2014 1:29
Table 2 Toolbox of demand-side phosphorus measures from mining to agriculture to sanitation(27)
Demand-side sustainable phosphorus measures
Sector Efficiency Reduce demandMining Reduce avoidable losses NAFertilizer Reduce avoidable losses NAAgriculture Fertilizer placement
Application timeApplication rateSoil testingErosion reductionMicrobial inoculants
Plant selectionImproved soil characteristics
Livestock andfisheries
Fertilizer placementApplication timeApplication rateSoil testingErosion reductionMicrobial inoculantsPhytase enrichmentManure phosphorus reductionWastewater management
Plant selectionImproved soil characteristicsAnimal selectionChanging diets
Food production Reducing avoidable lossesProducing food closer to demandConsumer food planning/preparation
Reducing phosphorus-intensive dietsReducing per capita overconsumptionHealthy bodiesMinimizing use of phosphorus additives
Wastewater &human excreta
Repairing cracked pipes minimizingsewer overflows
Soil managementAvoiding dumping of biosolids inOceans/rivers
Reducing spreading of biosolids onnonagricultural land
NA
NA, not applicable.
future food production. This stressed the need for an integrated approach, seeking positivesynergies identifying trade-offs.
Examples of synergistic measures might include community-scale biogas generation from hu-man and animal excreta that not only provides sanitation services but also generates biogas forcooking and sludge for local fertilizer use (122). Other examples of initiatives that provide cobene-fits include the production of algae using nutrient-rich effluent (132) and a shift toward plant-baseddiets to reduce greenhouse gas emissions and water and fertilizer demand (133, 134). However,it is important that these measures be implemented without imposing high additional costs onsociety (taking account of social and environmental costs and benefits) compared with the currentpractice. Linderholm et al. (135) compared the life cycle energy use, greenhouse gas emissions,and eutrophication impacts of mineral fertilizers to three different phosphorus recovery systemssourcing phosphorus from the wastewater sector: sewage sludge, struvite, and sewage inciner-ator ash. The authors found that the most energy-efficient and low greenhouse gas–producingphosphorus reuse option for the Swedish context was sewage sludge.
www.annualreviews.org • Life’s Bottleneck: Phosphorus 179
Ann
u. R
ev. E
nvir
on. R
esou
rc. 2
014.
39:1
61-1
88. D
ownl
oade
d fr
om w
ww
.ann
ualr
evie
ws.
org
Acc
ess
prov
ided
by
Vir
gini
a C
omm
onw
ealth
Uni
vers
ity o
n 06
/25/
15. F
or p
erso
nal u
se o
nly.
EG39CH06-CordellWhite ARI 9 October 2014 1:29
Table 3 Toolbox of supply-side phosphorus measures from mining to agriculture to sanitation (27)
Recycling New source
Sector Source Process (renewable or finite)Mining Mine tailings Chemical treatment Phosphate rockFertilizer Phosphogypsum Chemical treatment Algae, seaweedAgriculture Crop waste Compost, incineration,
fermentationGreen manure
Livestock andfisheries
Manure Direct reuse, compost,dewatering
Phosphate rock(supplements)
Bone Direct reuse, incinerationBlood Direct reuseFish Direct reuse
Food production Food production wasteCooked food waste
Phosphate rock (additives)
Wastewater andhuman excreta
Urine Direct reuse, precipitation NAFeces Compost, precipitation,
incineration, chemicaltreatment
Gray water Precipitation, chemicaltreatment
Untreated wastewater Direct reuseTreated effluent Direct reuseStruvite PrecipitationBiosolids Direct reuse, compost,
fermentation, chemicaltreatment
Sludge ash Dewatering
NA, not applicable.
Implementing such measures requires enabling institutional environments. From a policy per-spective, this requires decision makers to consider a range of institutional barriers and to developpolicy tools that can address these barriers (27). Research in other fields including energy resourcemanagement can provide a useful framework for a typology of barriers and policy tools, as shownin Figure 12.
Examples of options that span the range of policy instruments include the following:
� Targets: For example, Sweden has a requirement that 40% of the phosphorus from sewagebe recycled (137). As a future example, the post-2015 Sustainable Development Goals couldincorporate phosphorus use targets (4).
� Information: For example, the Digital Soil Map of sub-Saharan Africa aims to provide“up-to-date information on the health and properties of the soil, helping farmers and poli-cymakers to improve degraded soils and increase crop production” (138).
� Facilitation: For example, there are several recent sustainable phosphorus platforms,including the European Commission’s consultation on phosphorus and the Sus-tainable Phosphorus Platform (http://www.phosphorusplatform.eu) and the manynational or stakeholder-driven initiatives, such as the Global Phosphorus Re-search Initiative (http://www.phosphorusfutures.net), the Dutch Nutrient Platform
180 Cordell ·White
Ann
u. R
ev. E
nvir
on. R
esou
rc. 2
014.
39:1
61-1
88. D
ownl
oade
d fr
om w
ww
.ann
ualr
evie
ws.
org
Acc
ess
prov
ided
by
Vir
gini
a C
omm
onw
ealth
Uni
vers
ity o
n 06
/25/
15. F
or p
erso
nal u
se o
nly.

EG39CH06-CordellWhite ARI 9 October 2014 1:29
Culture
Enticement
Pricing
Regulation
Targets
Information
Facilitation
Coordination
E.g., awareness-raisingthrough web material,media, popular science
E.g., International Fertilizer Industry Association’s “4Rs” Nutrient Stewardship Framework
E.g., financial incentivefor soil testing
E.g., phosphorus levy
E.g., phosphorus cap
E.g., Sweden’s target of 60% recycled phosphorus from sewage
Figure 12Policy palette indicating potential policy instruments and examples for phosphorus (data sources: 27 after136).
(http://www.nutrientplatform.org), Global TraPs (http://www.globaltraps.ch), and thededicated Sustainable Phosphorus Summits (http://sps2014.cirad.fr).
� Regulation: For example, the EU Water Framework Directive (130) sets limits on phos-phorus discharge to waterways. Future examples could include cap-and-trade provisions forphosphorus use, similar to those for carbon, incorporating the principles of contraction andconvergence (19).
� Pricing and economic incentives (enticement): For example, policy makers and industry mustensure that the market price reflects the true cost of phosphorus mining, production, anduse, including its nonrenewable nature, through pricing in the externalities, or a Hotellingtax (139). This may require economic incentives and taxes to stimulate more sustainablephosphorus sources (e.g., 140).
Developing a priority phosphorus strategy requires substantial engagement of stakeholdersand citizens, as well as of experts in the field, not only to ensure scientific credibility but alsoto increase the public policy saliency and legitimacy of the process and outcomes (141). Futuresmethods, including foresighting (142) and systems thinking (143), are potentially useful tools fordetermining the appropriate mix of policy tools to implement.
5. CONCLUSION
The accelerated flow of phosphate rock from Earth’s crust for fertilizer use has been both a bless-ing and a curse for food security and the environment, by boosting crop yields yet simultaneouslyleading to widespread water pollution and creating a precarious dependence of the world’s foodsystems on a single source of phosphorus. The consequences of phosphorus scarcity will occur longbefore the last megatonne of phosphate rock is mined. The current phosphorus demand trajectoryimposes a range of types of scarcity, not limited to its physical scarcity. If this current trajectory is
www.annualreviews.org • Life’s Bottleneck: Phosphorus 181
Ann
u. R
ev. E
nvir
on. R
esou
rc. 2
014.
39:1
61-1
88. D
ownl
oade
d fr
om w
ww
.ann
ualr
evie
ws.
org
Acc
ess
prov
ided
by
Vir
gini
a C
omm
onw
ealth
Uni
vers
ity o
n 06
/25/
15. F
or p
erso
nal u
se o
nly.

EG39CH06-CordellWhite ARI 9 October 2014 1:29
not altered, phosphorus scarcity is likely to have serious consequences for food security, reducedagricultural productivity, and smallholder farmer access to fertilizers and food, particularly in de-veloping countries. Future-oriented and systems frameworks can guide identification of prioritiesto increase resilience of food systems. Conversely, not doing so can result in perverse outcomesand investment in ineffective or insufficiently sustainable phosphorus strategies.
DISCLOSURE STATEMENT
The authors are not aware of any affiliations, memberships, funding, or financial holdings thatmight be perceived as affecting the objectivity of this review.
LITERATURE CITED
1. FAO. 2002. The State of Food Insecurity in the World. Rome: Food Agric. Org.2. IAASTD. 2008. Global report. Agriculture at a crossroads. Int. Assess. Agric. Knowl., Sci. Technol.
Dev., Johannesburg, South Africa, April. http://www.unep.org/dewa/agassessment/reports/IAASTD/EN/Agriculture%20at%20a%20Crossroads_Global%20Report%20(English).pdf
3. IFPRI. 2002. Reaching Sustainable Food Security for All by 2020: Getting the Priorities and ResponsibilitiesRight. Washington, DC: Int. Food Policy Res. Inst.
4. Griggs D, Stafford-Smith M, Gaffney O, Rockstrom J, Ohman MC, et al. 2013. Policy: sustainabledevelopment goals for people and planet. Nature 495:305–7
5. Cordell D, Drangert J-O, White S. 2009. The story of phosphorus: global food security and food forthought. Glob. Environ. Change 19(2):292–305
6. Johnston AE. 2000. Soil and Plant Phosphate. Paris: Int. Fertil. Ind. Assoc.7. Liebig J. 1840. Die organische Chemie in ihrer Anwendung auf Agricultur und Physiologie [Organic chemistry
in its applications to agriculture and physiology]. Braunschweig, Ger.: Friedrich Vieweg8. Stewart W, Hammond L, Van Kauwenbergh SJ. 2005. Phosphorus as a natural resource. In Phosphorus:
Agriculture and the Environment, Agronomy Monograph No. 46, pp. 3–21. Madison: Am. Soc. Agron., CropSci. Soc. Am., Soil Sci. Soc. Am.
9. Brink JW. 1978. World resources of phosphorus. In Phosphorus in the Environment: Its Chemistry andBiochemistry: Ciba Foundation Symposium 57 (New Series), pp. 23–48. Amsterdam: Excerpta Medica
10. Smil V. 2000. Phosphorus in the environment: natural flows and human interferences. Annu. Rev. EnergyEnviron. 25:53–88
11. Ashley K, Cordell D, Mavinic D. 2011. A brief history of phosphorus: from the philosopher’s stone tonutrient recovery and re-use. Chemosphere 84(6):737–46
12. Marald E. 1998. I motet mellan jordbruk och kemi: agrikulturkemins framvaxt pa lantbruksakademiens exper-imentalfalt 1850–1907. Umea, Swed.: Inst. Idehist., Univ. Umea
13. IFPRI. 2002. Green Revolution: Curse or Blessing? Washington, DC: Int. Food Policy Res. Inst.14. Roy RN, Finck A, Blair GJ, Tandon HLS. 2006. Plant nutrition for food security: a guide for integrated
nutrient management. FAO Fertil. Plant Nutr. Bull. 16, Food Agric. Org., Rome15. Lavelle P, Dugdale R, Scholes R, Berhe AA, Carpenter E, et al. 2005. Nutrient cycling. In Ecosystems
and Human Well-being: Current State and Trends, Vol. 1, ed. R Hassan, R Scholes, N Ash, pp. 331–53. Millenn. Ecosyst. Assess. Ser. Washington, DC: Island. http://www.millenniumassessment.org/documents/document.281.aspx.pdf
16. World Resources Institute. 2008. Eutrophication & hypoxia map data set. Added September 2013.http://www.wri.org/resources/data-sets/eutrophication-hypoxia-map-data-set
17. Asimov I. 1974. Asimov on Chemistry. New York: Doubleday18. Prud’homme M. 2010. World phosphate rock flows, losses and uses. Presented at Int. Fertil. Ind. Assoc.
Phosphates Int. Conf., March 22–24, Brussels19. Cordell D, White S. 2014. Phosphorus security: global non-governance of a critical resource for food
security. In Edward Elgar Encyclopedia of Global Environmental Politics and Governance. Cheltenham, UK:Edward Elgar. In press
182 Cordell ·White
Ann
u. R
ev. E
nvir
on. R
esou
rc. 2
014.
39:1
61-1
88. D
ownl
oade
d fr
om w
ww
.ann
ualr
evie
ws.
org
Acc
ess
prov
ided
by
Vir
gini
a C
omm
onw
ealth
Uni
vers
ity o
n 06
/25/
15. F
or p
erso
nal u
se o
nly.

EG39CH06-CordellWhite ARI 9 October 2014 1:29
20. Liu Y, Villalba G, Ayres RU, Schroder H. 2008. Global phosphorus flows and environmental impactsfrom a consumption perspective. J. Ind. Ecol. 12(2):229–47
21. Smit AL, Bindraban PS, Schroder JJ, Conijn JG, van der Meer HG. 2009. Phosphorus in agriculture: globalresources, trends and developments. Rep. Steer. Comm. Technol. Assess., Minist. Agric. Nat. Food Qualit.,Plant Res. Int., Wageningen Univ., Wageningen, Neth.
22. Bennett E, Carpenter S, Caraco N. 2001. Human impact on erodable phosphorus and eutrophication:a global perspective. Bioscience 51:227–34
23. Sutton MA, Bleeker A, Howard CM, Bekunda M., Grizzetti B, et al. 2012. Our Nutrient World: TheChallenge to Produce More Food and Energy with Less Pollution. Edinburgh: Cent. Ecol. Hydrol.
24. Filippelli GM. 2011. Phosphate rock formation and marine phosphorus geochemistry: the deep timeperspective. Chemosphere 84(6):759–66
25. Villalba G, Liu Y, Schroder H, Ayres RU. 2008. Global phosphorus flows in the industrial economyfrom a production perspective. J. Ind. Ecol. 12(4):557–69
26. PotashCorp. 2011. Nutrients: phosphate. In 2011 Online Overview, pp. 39–44. Saskatoon, Can.: Potash-Corp. http://www.potashcorp.com/industry_overview/2011
27. Cordell D, White S. 2013. Sustainable phosphorus measures: strategies and technologies for achievingphosphorus security. Agronomy 3(1):86–116
28. Heffer P, 2011. Medium-term outlook for global fertilizer demand 2010/11 – 2015/16. Presented at 79thIFA Annu. Conf., Montreal, Can., May 23–25
29. Bouwman AF, Beusen AHW, Billen G. 2009. Human alteration of the global nitrogen and phosphorussoil balances for the period 1970–2050. Glob. Biogeochem. Cycles 23:GB0A04
30. Syers K, Johnston AE, Curtin D. 2008. Efficiency of soil and fertilizer phosphorus use: reconciling changingconcepts of soils phosphorus behaviour with agronomic information. FAO Fertil. Plant Nutr. Bull. 18, FoodAgric. Org, Rome
31. Jonsson H, Stintzing AR, Vinneras B, Salomon E. 2004. Guidelines on the Use of Urine and Faeces in CropProduction. Stockholm: EcoSanRes, Stockholm Environ. Inst.
32. Diaz R, Rosenberg R. 2008. Spreading dead zones and consequences for marine ecosystems. Science321(5891):926–29
33. HELCOM. 2005. Nutrient pollution to the Baltic Sea in 2000. Baltic Sea Environ. Proc. (BSEP) No. 100,Helsinki Comm., Baltic Marine Environ. Prot. Comm. Helsinki: HELCOM. http://www.helcom.fi/lists/publications/bsep100.pdf
34. Chudleigh P, Simpson S. 2000. The National Eutrophication Management Program—A Review. Canberra,Aust.: Land Water Resour. Res. Dev. Corp.
35. Dodds W, Bouska W, Eitzmann J, Pilger T, Pitts K, et al. 2009. Eutrophication of U.S. freshwaters:analysis of potential economic damages. Environ. Sci. Technol. 43(1):12–19
36. Neset TSS, Andersson L. 2008. Environmental impact of food production and consumption—fromphosphorus leakage and resource depletion to recycling. In Water for Food, ed. J Forare, pp. 99–108.Stockholm: Swed. Res. Counc. Formas. http://www.formas.se/PageFiles/5492/WaterforFood.pdf
37. Larsen T, Maurer M, Udert KM, Lienert J. 2007. Nutrient cycles and resource management: implicationsfor the choice of wastewater treatment technology. Water Sci. Technol. 56(5):229–37
38. Sharpley A, Withers PJA, Abdalla CW, Dodd AR. 2005. Strategies for the sustainable management ofphosphorus. In Phosphorus: Agriculture and the Environment, Agronomy Monograph No. 46. Madison, WI:Am. Soc. Agron., Crop Sci. Soc. Am., Soil Sci. Soc. Am.
39. Rockstrom J, Steffen W, Noone K, Persson A, Chapin FS III, et al. 2009. A safe operating space forhumanity. Nature 461:472–75
40. Carpenter S, Bennett E. 2011. Reconsideration of the planetary boundary for phosphorus. Environ. Res.Lett. 6(1):014009
41. Cordell D. 2010. The story of phosphorus: sustainability implications of global phosphorus scarcity for food security.PhD Thesis, Dep. Water Environ. Stud., Tema Inst., Linkoping Univ., Sweden. http://urn.kb.se/resolve?urn=urn:nbn:se:liu:diva-53430
42. Esrey S, Andersson I, Hillers A, Sawyer R. 2001. Closing the Loop: Ecological Sanitation for Food Security.Mexico: UNDP & SIDA
www.annualreviews.org • Life’s Bottleneck: Phosphorus 183
Ann
u. R
ev. E
nvir
on. R
esou
rc. 2
014.
39:1
61-1
88. D
ownl
oade
d fr
om w
ww
.ann
ualr
evie
ws.
org
Acc
ess
prov
ided
by
Vir
gini
a C
omm
onw
ealth
Uni
vers
ity o
n 06
/25/
15. F
or p
erso
nal u
se o
nly.

EG39CH06-CordellWhite ARI 9 October 2014 1:29
43. UN Gen. Assem. Resolut. 2000. United Nations Millennium Declaration, UN Doc. A/RES/55/2. http://undocs.org/A/RES/55/2
44. FAO. 2005. FAO Reform: A Vision for the Twenty-First Century. Rome: Food Agric. Org.45. Millenn. Ecosyst. Assess. 2005. Ecosystems and Human Well-Being: Synthesis. Washington, DC: Island46. UNEP. 2007. The International Panel on the Sustainable Use of Natural Resources. Paris: Div. Technol. Ind.
Econ., Sustain. Consum. Prod. Branch47. HCSS. 2012. Risks and opportunities in the global phosphate rock market: robust strategies in times of uncertainty.
Rep. No. 17/12/12, Hague Cent. Strateg. Stud., The Hague. http://www.hcss.nl/reports/download/116/2053
48. Gilbert N. 2009. The disappearing nutrient. Nature 461:716–1849. Vaccari DA. 2009. Phosphorus: a looming crisis. Sci. Am. 300(6):54–5950. Ulrich A, Schnug E. 2013. The modern phosphorus sustainability movement: a profiling experiment.
Sustainability 5(11):4523–4551. Pellerin S, Neset TSS, van Dijk K. 2013. Trends in phosphorus research over the last four decades: a bibliometric
analysis. Presented at Eur. Sustain. Phosphorus Conf., March 6–7, Brussels52. Bekunda M, Cordell D, Corman J, Rosemarin A, Salcedo I, et al. 2011. Phosphorus and food production.
In UNEP Yearbook 2011: Emerging Issues in Our Global Environment, pp. 35–46. Nairobi, Kenya: UNEnviron. Programme. http://www.unep.org/yearbook/2011
53. Pretty J, Sutherland WJ, Ashby J, Auburn J, Baulcombe D, et al. 2010. The top 100 questions ofimportance to the future of global agriculture. Int. J. Agric. Sustain. 8(4):219–36
54. Cooper C, Giurco D. 2009. The mineral resources landscape—an expanded conceptualisation of mineralssustainability. Proc. Sustain. Dev. Indic. Miner. Ind. (SDIMI) Conf., Gold Coast, Aust., July 6–8, ed. DBrereton, P Bangerter, G Corder, K Gollogly, S Green, et al., pp. 115–22. Carlton, Aust.: Australas.Inst. Min. Metall.
55. Van Kauwenbergh SJ. 2010. World phosphate rock reserves and resources. Tech. Bull. T-75, Int. Fertil. Dev.Cent. (IFDC), Muscle Shoals, AL
56. Jasinski SM. 2008. Phosphate rock. Miner. Commod. Summ., US Geol. Surv., Reston, VA. http://minerals.usgs.gov/minerals/pubs/commodity/phosphate_rock/mcs-2008-phosp.pdf
57. Jasinski SM. 2009. Phosphate rock. Miner. Commod. Summ., US Geol. Surv., Reston, VA. http://minerals.usgs.gov/minerals/pubs/commodity/phosphate_rock/mcs-2009-phosp.pdf
58. Jasinski SM. 2010. Phosphate rock. Miner. Commod. Summ., US Geol. Surv., Reston, VA. http://minerals.usgs.gov/minerals/pubs/commodity/phosphate_rock/mcs-2010-phosp.pdf
59. Jasinski SM. 2011. Phosphate rock. Miner. Commod. Summ., US Geol. Surv., Reston, VA. http://minerals.usgs.gov/minerals/pubs/commodity/phosphate_rock/mcs-2011-phosp.pdf
60. Jasinski SM. 2012. Phosphate rock. Miner. Commod. Summ., US Geol. Surv., Reston, VA. http://minerals.usgs.gov/minerals/pubs/commodity/phosphate_rock/mcs-2012-phosp.pdf
61. Jasinski SM. 2013. Phosphate rock. Miner. Commod. Summ., US Geol. Surv., Reston, VA. http://minerals.usgs.gov/minerals/pubs/commodity/phosphate_rock/mcs-2013-phosp.pdf
62. Hilton J, Johnston AE, Dawson CJ. 2010. The phosphate life cycle: rethinking the options for a finiteresource. Proc. Int. Fertil. Soc. No. 668, pp. 1–44. Strensall, UK: IFS
63. Fixen P. 2009. Phosphorus: world wide supplies and efficiency. Presented at Manitoba Agron. Conf.,Winnipeg, Manitoba, Dec. 16
64. Mohr S, Evans G. 2013. Projections of future phosphorus production. PHILICA.COM, July 9, article380. http://philica.com/display_article.php?article_id=380
65. Cordell D, White S. 2011. Peak phosphorus: clarifying the key issues of a vigorous debate about long-term phosphorus security. Sustainability 3(10):2027–49
66. Cordell D, White S, Lindstrom T. 2011. Peak phosphorus: the crunch time for humanity? Sustain. Rev.2(2):1
67. Van Vuuren DPP, Bouwman AF, Beusen AHW. 2010. Phosphorus demand for the 1970–2100 period:a scenario analysis of resource depletion. Glob. Environ. Change 20(3):428–39
68. Walan P. 2013. Modeling of peak phosphorus a study of bottlenecks and implications. Master’s Thesis, Dep.Earth Sci., Uppsala Univ., Sweden. http://urn.kb.se/resolve?urn=urn:nbn:se:uu:diva-205108
184 Cordell ·White
Ann
u. R
ev. E
nvir
on. R
esou
rc. 2
014.
39:1
61-1
88. D
ownl
oade
d fr
om w
ww
.ann
ualr
evie
ws.
org
Acc
ess
prov
ided
by
Vir
gini
a C
omm
onw
ealth
Uni
vers
ity o
n 06
/25/
15. F
or p
erso
nal u
se o
nly.

EG39CH06-CordellWhite ARI 9 October 2014 1:29
69. Cordell D, Neset TSS, White S, Drangert J-O. 2009. Preferred future phosphorus scenarios: a frame-work for meeting long-term phosphorus needs for global food demand. Proc. Int. Conf. Nutr. RecoveryWastewater Streams, Vancouver, Can., May 10–13, ed. K Ashley, D Mavinic, F Koch, pp. 23–43. London:IWA
70. Scholz R, Wellmer F-W. 2013. Approaching a dynamic view on the availability of mineral resources:what we may learn from the case of phosphorus? Glob. Environ. Change 23(1):11–27
71. Edixhoven JD, Gupta J, Savenije HHG. 2013. Recent revisions of phosphate rock reserves and resources:reassuring or misleading? An in-depth literature review of global estimates of phosphate rock reservesand resources. Earth Syst. Dyn. Discuss. 4(2):1005–34
72. May D, Prior T, Cordell D, Giurco D. 2011. Peak minerals: theoretical foundations and practicalapplication. Nat. Resour. Res. 21(1):43–60
73. Hook M, Aleklett K. 2010. Trends in U.S. recoverable coal supply estimates and future productionoutlooks. Nat. Resour. Res. 19(3):189–208
74. Vaccari D, Strigul N. 2011. Extrapolating phosphorus production to estimate resource reserves.Chemosphere 84(6):792–97
75. Schroder JJ, Cordell D, Smit AL, Rosemarin A. 2010. Sustainable use of phosphorus. Rep. 357, EU TenderENV.B.1/ETU/2009/0025, Plant Res. Int., Wageningen, Neth.
76. Senthilkumar K, Nesme T, Mollier A, Pellerin S. 2011. Regional-scale phosphorus flows and budgetswithin France: the importance of agricultural production systems. Nutr. Cycl. Agroecosyst. 92(2):1–15
77. Smit AL, van Middelkoop JC, van Dijk W, van Reuler H, de Buck AJ, van de Sanden PACM. 2010. Aquantification of phosphorus flows in the Netherlands through agricultural production, industrial processing andhouseholds. Rep. 364, Plant Res. Int., Wageningen, Neth.
78. Suh S, Yee S. 2011. Phosphorus use-efficiency of agriculture and food system in the US. Chemosphere84(6):806–13
79. Cordell D, Neset TSS, Prior T. 2012. The phosphorus mass balance: identifying “hotspots” in the foodsystem as a roadmap to phosphorus security. Curr. Opin. Biotech. 23:839–45
80. Gumbo B. 2005. Short-cutting the phosphorus cycle in urban ecosystems. PhD Thesis, Delft Univ. Technol.,UNESCO-IHE Inst. Water Educ., Delft, Neth.
81. Cordell D, Jackson M, White S. 2013. Phosphorus flows through the Australian food system: identifyingintervention points as a roadmap to phosphorus security. Environ. Sci. Policy 29:87–102
82. Matsubae-Yokoyama K, Kubo H, Nakajima K, Nagasaka T. 2009. A material flow analysis of phosphorusin Japan: the iron and steel industry as a major phosphorus source. J. Ind. Ecol. 13(5):687–705
83. Baccini P, Brunner PH. 1991. Metabolism of the Anthroposphere. Berlin/New: Springer84. Pellerin S, Nesme T. 2011. Studies on P cycle at the country scale: system approach, justification,
scope and importance. Eur. Sci. Workshop., INRA-ENITA, Bordeaux, France, July 5. http://www.bordeaux–aquitaine.inra.fr/tcem_eng/sem
85. IFPRI. 2003. Ending Hunger by 2050: Crucial Investments and Policies. Washington, DC: Int. Food PolicyRes. Inst.
86. IATP. 2005. Ten ways to fix agricultural trade: benchmarking for the Hong Kong Ministerial, excerpted from“Sailing Close To The Wind: Navigating The Hong Kong WTO Ministerial.” IATP Fact Sheet, Nov.17, Inst. Agric. Trade Policy, Geneva
87. Chemon Int., Int. Cent. Soil Fertil. Agric. Dev. 2007. Fertilizer Supply and Costs in Africa. Muscle Shoals,AL: Int. Fertil. Dev. Cent.
88. Runge-Metzger A. 1995. Closing the cycle: obstacles to efficient P management for improved globalfood security. In Phosphorus in the Global Environment: Transfers, Cycles and Management, ed. H Tiessen,pp. 27–42. SCOPE 54. Chichester, UK: Wiley.
89. Fresco L. 2003. Plant nutrients: what we know, guess and do not know. Presented at IFA/FAO Agric. Conf.,“Global Food Security and the Role of Sustainability Fertilization,” Rome, March 26–28
90. IANS. 2008. Farmer killed in stampede during fertiliser sale. Indo-Asian News Serv. July 3091. von Horn J, Sartorius C. 2009. Impact of supply and demand on the price development of phosphate
(fertilizer). In International Conference on Nutrient Recovery from Wastewater Streams Vancouver, ed. DMavinic, K Ashley, F Koch, pp. 45–54. London: IWA
www.annualreviews.org • Life’s Bottleneck: Phosphorus 185
Ann
u. R
ev. E
nvir
on. R
esou
rc. 2
014.
39:1
61-1
88. D
ownl
oade
d fr
om w
ww
.ann
ualr
evie
ws.
org
Acc
ess
prov
ided
by
Vir
gini
a C
omm
onw
ealth
Uni
vers
ity o
n 06
/25/
15. F
or p
erso
nal u
se o
nly.

EG39CH06-CordellWhite ARI 9 October 2014 1:29
92. Smaling EMA, Nandwa SM, Janssen BH. 1997. Soil fertility in Africa is at stake. In Replenishing SoilFertility in Africa, ed. RJ Buresh, PA Sanchez, F Calhoun, pp. 47–62. SSSA Spec. Publ. No. 51. Madison,WI: Soil Sci. Soc. Am., Am. Soc. Agron.
93. IFA. 2012. Debunking ten myths about phosphate rock production: trends from 1992 to 2011. Issue Brief, Feb.14, Int. Fertil. Ind. Assoc., Paris. http://www.fertilizer.org/en/images/Library_Downloads/2011_ifa_10myths_pr.pdf
94. Cooper J, Lombardi R, Boardman D, Carlielle-Marquet C. 2011. The future distribution and productionof global phosphate rock reserves. Resour. Conserv. Recycl. 57:78–86
95. Eur. Comm. 2013. Consultative communication on the sustainable use of phosphorus. Rep. COM(2013) 517final, Eur. Comm., Brussels. http://ec.europa.eu/environment/consultations/phosphorus_en.htm
96. Lewis A. 2011. Morocco’s fish fight: high stakes over Western Sahara. BBC News, December 1597. Corell H. 2002. Letter dated 29 January 2002 from the Under-Secretary-General for Legal Affairs, the
Legal Counsel, addressed to the President of the Security Council. UN Secur. Counc., S/2002/161. http://www.un.org/en/peacekeeping/missions/minurso/documents.shtml
98. Smith JJP. 2011. The taking of the Sahara: the role of natural resources in the continuing occupation of WesternSahara. Work. Pap., in preparation, Ottawa
99. Hagen E. 2008. One more shipping company quits Western Sahara assignments. Norwatch, June 5.http://www.framtiden.no/english/weapon/one-more-shipping-company-quits-western-sahara-assignments.html
100. Fertil. Week. 2008. Industry ponders the impact of China’s trade policy. Thurs. Mark. Rep., April 24101. Pahl-Wostl C. 2009. A conceptual framework for analysing adaptive capacity and multi-level learning
processes in resource governance regimes. Glob. Environ. Change 19:354–65102. GPRI. 2013. Blueprint for global phosphorus security. 3rd Sustain. Phosphorus Summit, Feb. 29–March
2, Univ. Technol., Sydney. http://sustainablepsummit.net/content/blueprint-global-phosphorus-security
103. Neset TSS, Cordell D. 2012. Global phosphorus scarcity: identifying synergies for a sustainable future.J. Sci. Food Agric. 92(1):2–6
104. Delgado-Baquerizo M, Maestre FT, Antonio Gallardo, Bowker MA, Wallenstein MD, et al. 2013.Decoupling of soil nutrient cycles as a function of aridity in global drylands. Nature 502:672–76
105. UN. 2007. World population prospects, the 2006 revision—highlights. Work. Pap. No. ESA/P/WP.202,UN Dep. Econ. Soc. Aff., Popul. Div., New York. http://www.un.org/esa/population/publications/wpp2006/WPP2006_Highlights_rev.pdf
106. Foley JA, Ramankutty N, Brauman KA, Cassidy ES, Gerber JS, et al. 2011. Solutions for a cultivatedplanet. Nature 478(7369):337–42
107. Tilman D, Balzer C, Hill J, Befort BL. 2011. Global food demand and the sustainable intensification ofagriculture. Proc. Natl. Acad. Sci. USA 108(50):20260–64
108. Alexandratos N, Bruinsma J. 2012. World agriculture towards 2030/2050 the 2012 revision. ESA Work.Pap. No. 12-03, Agric. Dev. Econ. Div., Food Agric. Organ. http://www.fao.org/3/a-ap106e.pdf
109. McKay AD, Miezitis Y, Porritt K, Britt AF, Champion DC, et al. 2014. Australia’s Identified MineralResources 2013. Canberra, Aust.: Geosci. Aust. http://www.ga.gov.au/metadata-gateway/metadata/record/gcat_78988
110. UNEP. 2001. Environmental Aspects of Phosphate and Potash Mining. Paris: UN Environ. Programme, Int.Fertil. Ind. Assoc.
111. Cordell D, Neset T-SS. 2014. Phosphorus vulnerability: a qualitative framework for assessing the vulner-ability of national and regional food systems to the multi-dimensional stressors of phosphorus scarcity.Glob. Environ. Change 24:108–22
112. MacDonald GK, Bennett EM, Potter PA, Ramankutty N. 2011. Agronomic phosphorus imbalancesacross the world’s croplands. Proc. Natl. Acad. Sci. USA 108(7):3086–91
113. Schroder JJ, Smit AL, Cordell D, Rosemarin A. 2011. Improved phosphorus use efficiency in agriculture:a key requirement for its sustainable use. Chemosphere 84(6):822–31
114. Townsend AR, Porder S. 2012. Agricultural legacies, food production and its environmental conse-quences. Proc. Natl. Acad. Sci. USA 109(16):5917–18
186 Cordell ·White
Ann
u. R
ev. E
nvir
on. R
esou
rc. 2
014.
39:1
61-1
88. D
ownl
oade
d fr
om w
ww
.ann
ualr
evie
ws.
org
Acc
ess
prov
ided
by
Vir
gini
a C
omm
onw
ealth
Uni
vers
ity o
n 06
/25/
15. F
or p
erso
nal u
se o
nly.

EG39CH06-CordellWhite ARI 9 October 2014 1:29
115. Eur. Fertil. Manuf. Assoc. 2000. Phosphorus: Essential Element for Food Production. Brussels: Eur. Fertil.Manuf. Assoc.
116. IFA 2013. IFADATA. Int. Feril. Ind. Assoc., Paris, updated July. http://ifadata.fertilizer.org/ucSearch.aspx
117. Heffer P, Prud’homme M. 2013. Fertilizer outlook 2013–2017. Presented at 81st IFA Annu. Conf.,Chicago, May 20–22
118. FAO. 2007. Introduction. In Food For the Cities. Rome: Food Agric. Organ. U.N. ftp://ftp.fao.org/docrep/fao/011/ak003e/ak003e00.pdf
119. Biermann F. 2007. “Earth system governance” as a crosscutting theme of global change research. Glob.Environ. Change 17(3–4):326–37
120. Koch A, McBratney A, Lal R. 2012. Put soil security on the global agenda. Nature 492:186121. Nelson R, Kokic P, Crimp S, Martin P, Meinke H, et al. 2010. The vulnerability of Australian rural
communities to climate variability and change: Part II—integrating impacts with adaptive capacity.Environ. Sci. Policy 13(1):18–27
122. Cordell D, Rosemarin A, Schroder JJ, Smit AL. 2011. Towards global phosphorus security: a systemsframework for phosphorus recovery and reuse options. Chemosphere 84(6):747–58
123. Childers DL, Caple Z, Carlielle-Marquet C, Cordell D, Gerhart V, et al. 2013. Future scenarios for thesustainable use of global phosphorus resources. In Phosphorus, Food, and Our Future, ed. KA Wyant, JRCorman, JJ Elser, pp. 183–98. New York: Oxford Univ. Press
124. Childers D, Corman J, Edwards M, Elser J. 2011. Sustainability challenges of phosphorus and food:solutions from closing the human phosphorus cycle. Bioscience 61(2):117–24
125. Smaling E, Fresco L, de Jager A. 1996. Classifying, monitoring and improving soil nutrient stocks andflows in African agriculture. AMBIO: J. Hum. Environ. 25(8):492–96
126. Simpson R, Oberson A, Culvenor RA, Ryan M, Veneklaas E, et al. 2011. Strategies and agronomicinterventions to improve the phosphorus-use efficiency of farming systems. Plant Soil 349:89–120
127. Sartorius C, Von Horn J, Tettenborn F. 2011. Phosphorus recovery from wastewater—state-of-the-art andfuture potential. Presented at Int. Conf. “Nutrient Recovery and Management 2011: Inside and Outsidethe Fence,” Miami, FL, Jan. 9–12
128. Rittmann BE, Mayer B, Westerhoff P, Edwards M. 2011. Capturing the lost phosphorus. Chemosphere84(6):846–53
129. Cordell D, Mikhailovich N, Mohr S, Jacobs B, White S. 2013. Australian sustainable phosphorus futures—Phase II: Adapting to future phosphorus scarcity. Inst. Sustain. Futur., Univ. Technol., Sydney, for the RuralInd. Res. Dev. Corp., Aust. Gov., Canberra. https://rirdc.infoservices.com.au/items/14-039
130. Eur. Comm. 2000. Directive 2000/60/EC of the European Parliament and of the Council establishing aframework for the Community action in the field of water policy. O.J (L 327) 22/12/2000 P. 0001-0073
131. Hein L, Leemans R. 2012. The impact of first-generation biofuels on the depletion of the global phos-phorus reserve. Ambio 41(4):341–49
132. Edwards M. 2008. Green Algae Strategy: End Oil Imports and Engineer Sustainable Food and Fuel. Tempe,AZ: Green Indep.
133. Metson G, Bennett E, Elser J. 2012. The role of diet in phosphorus demand. Environ. Res. Lett.7(4):044043
134. Smil V. 2007. Policy for improved efficiency in the food chain. Presented at World Water Week, SIWISeminar: “Water for Food, Bio-fuels or Ecosystems?” Aug. 12–18, Stockholm
135. Linderholm K, Tillman A-M, Mattsson JE. 2012. Life cycle assessment of phosphorus alternatives forSwedish agriculture. Resour. Conserv. Recycl. 66:27–39
136. Dunstan C, Langham E, Ison N. 2009. 20 policy tools for developing distributed energy. Work. Pap. 4.2,Intell. Grid Res. Program Proj. 4, Inst. Sustain. Futur., Sydney
137. Naturvardsverkets. 2013. Hallbar aterforing av fosfor: Naturvardsverkets redovisning av ett upp-drag fran regeringen. Rapp. 6580, Naturvardsverket, Stockholm. http://www.naturvardsverket.se/Documents/publikationer6400/978-91-620-6580-5.pdf
138. Gilbert N. 2009. Digital soil map for Africa launched. Nature News, Jan. 13, doi: 10.1038/news.2009.17139. Devarajan S, Fisher AC. 1981. Hotelling’s “economics of exhaustible resources”: fifty years later. J. Econ.
Lit. 19(1):65–73
www.annualreviews.org • Life’s Bottleneck: Phosphorus 187
Ann
u. R
ev. E
nvir
on. R
esou
rc. 2
014.
39:1
61-1
88. D
ownl
oade
d fr
om w
ww
.ann
ualr
evie
ws.
org
Acc
ess
prov
ided
by
Vir
gini
a C
omm
onw
ealth
Uni
vers
ity o
n 06
/25/
15. F
or p
erso
nal u
se o
nly.

EG39CH06-CordellWhite ARI 9 October 2014 1:29
140. Seyhan D, Weikard H-P, Ierland E van. 2012. An economic model of long-term phosphorus extractionand recycling. Resour. Conserv. Recycl. 61:103–8
141. Mitchell RB, Clark W, Cash DW, Dickson NM. 2006. Global Environmental Assessments: Information andInfluence. Cambridge, MA: MIT Press
142. Robinson J. 1990. Futures under glass: a recipe for people who hate to predict. Futures 22:820–42143. Ison R, Maiteny PT, Carr S. 1997. Systems methodologies for sustainable natural resources research
and development. Agric. Syst. 55(2):257–72144. GPRI. 2010. GPRI statement on global phosphorus scarcity. Sept. 26. http://phosphorusfutures.net/
files/GPRI_Statement_responseIFDC_final.pdf145. Emsley J. 2000. The 13th Element: The Sordid Tale of Murder, Fire, and Phosphorus. New York: Wiley
188 Cordell ·White
Ann
u. R
ev. E
nvir
on. R
esou
rc. 2
014.
39:1
61-1
88. D
ownl
oade
d fr
om w
ww
.ann
ualr
evie
ws.
org
Acc
ess
prov
ided
by
Vir
gini
a C
omm
onw
ealth
Uni
vers
ity o
n 06
/25/
15. F
or p
erso
nal u
se o
nly.

EG39-FrontMatter ARI 8 October 2014 23:26
Annual Review ofEnvironmentand Resources
Volume 39, 2014
ContentsIntroduction � � � � � � � � � � � � � � � � � � � � � � � � � � � � � � � � � � � � � � � � � � � � � � � � � � � � � � � � � � � � � � � � � � � � � � � � � � � � � � � � � � � � � �v
Who Should Read This Journal? � � � � � � � � � � � � � � � � � � � � � � � � � � � � � � � � � � � � � � � � � � � � � � � � � � � � � � � � � � � � �vii
I. Integrative Themes and Emerging Concerns
Environmental Issues in AustraliaAlistair J. Hobday and Jan McDonald � � � � � � � � � � � � � � � � � � � � � � � � � � � � � � � � � � � � � � � � � � � � � � � � � � � � � � � � 1
Gender and SustainabilityRuth Meinzen-Dick, Chiara Kovarik, and Agnes R. Quisumbing � � � � � � � � � � � � � � � � � � � � � � � � �29
II. Earth’s Life Support Systems
Implications of Arctic Sea Ice Decline for the Earth SystemUma S. Bhatt, Donald A. Walker, John E. Walsh, Eddy C. Carmack, Karen E. Frey,
Walter N. Meier, Sue E. Moore, Frans-Jan W. Parmentier, Eric Post,Vladimir E. Romanovsky, and William R. Simpson � � � � � � � � � � � � � � � � � � � � � � � � � � � � � � � � � � � � � �57
Modeling the Terrestrial BiosphereJoshua B. Fisher, Deborah N. Huntzinger, Christopher R. Schwalm,
and Stephen Sitch � � � � � � � � � � � � � � � � � � � � � � � � � � � � � � � � � � � � � � � � � � � � � � � � � � � � � � � � � � � � � � � � � � � � � � � � � � �91
Tropical Forests in the AnthropoceneYadvinder Malhi, Toby A. Gardner, Gregory R. Goldsmith, Miles R. Silman,
and Przemyslaw Zelazowski � � � � � � � � � � � � � � � � � � � � � � � � � � � � � � � � � � � � � � � � � � � � � � � � � � � � � � � � � � � � � 125
Life’s Bottleneck: Sustaining the World’s Phosphorus for a FoodSecure FutureDana Cordell and Stuart White � � � � � � � � � � � � � � � � � � � � � � � � � � � � � � � � � � � � � � � � � � � � � � � � � � � � � � � � � � � � 161
Tropical Intraseasonal Modes of the AtmosphereYolande L. Serra, Xianan Jiang, Baijun Tian, Jorge Amador-Astua,
Eric D. Maloney, and George N. Kiladis � � � � � � � � � � � � � � � � � � � � � � � � � � � � � � � � � � � � � � � � � � � � � � � � 189
III. Human Use of the Environment and Resources
Dynamics and Resilience of Rangelands and Pastoral Peoples Aroundthe GlobeRobin S. Reid, Marıa E. Fernandez-Gimenez, and Kathleen A. Galvin � � � � � � � � � � � � � � � � 217
Carbon Dioxide Capture and Storage: Issues and ProspectsHeleen de Coninck and Sally M. Benson � � � � � � � � � � � � � � � � � � � � � � � � � � � � � � � � � � � � � � � � � � � � � � � � � � � 243
viii
Ann
u. R
ev. E
nvir
on. R
esou
rc. 2
014.
39:1
61-1
88. D
ownl
oade
d fr
om w
ww
.ann
ualr
evie
ws.
org
Acc
ess
prov
ided
by
Vir
gini
a C
omm
onw
ealth
Uni
vers
ity o
n 06
/25/
15. F
or p
erso
nal u
se o
nly.

EG39-FrontMatter ARI 8 October 2014 23:26
Consensus and Contention in the Food-Versus-Fuel DebateMark W. Rosegrant and Siwa Msangi � � � � � � � � � � � � � � � � � � � � � � � � � � � � � � � � � � � � � � � � � � � � � � � � � � � � � 271
Energy for TransportMaria Figueroa, Oliver Lah, Lewis M. Fulton, Alan McKinnon,
and Geetam Tiwari � � � � � � � � � � � � � � � � � � � � � � � � � � � � � � � � � � � � � � � � � � � � � � � � � � � � � � � � � � � � � � � � � � � � � � 295
The Environmental Costs and Benefits of FrackingRobert B. Jackson, Avner Vengosh, J. William Carey, Richard J. Davies,
Thomas H. Darrah, Francis O’Sullivan, and Gabrielle Petron � � � � � � � � � � � � � � � � � � � � � � � 327
Human Appropriation of Net Primary Production: Patterns, Trends,and Planetary BoundariesHelmut Haberl, Karl-Heinz Erb, and Fridolin Krausmann � � � � � � � � � � � � � � � � � � � � � � � � � � � � � 363
Consumer End-Use Energy Efficiency and Rebound EffectsInes M.L. Azevedo � � � � � � � � � � � � � � � � � � � � � � � � � � � � � � � � � � � � � � � � � � � � � � � � � � � � � � � � � � � � � � � � � � � � � � � � � � � 393
IV. Management and Governance of Resources and Environment
Environmental EthicsClare Palmer, Katie McShane, and Ronald Sandler � � � � � � � � � � � � � � � � � � � � � � � � � � � � � � � � � � � � � � 419
The Psychology of Environmental DecisionsBen R. Newell, Rachel I. McDonald, Marilynn Brewer, and Brett K. Hayes � � � � � � � � � � � � 443
The Business of Water: Market Environmentalism in the Water SectorKaren Bakker � � � � � � � � � � � � � � � � � � � � � � � � � � � � � � � � � � � � � � � � � � � � � � � � � � � � � � � � � � � � � � � � � � � � � � � � � � � � � � � � 469
V. Methods and Indicators
Advances in Measuring the Environmental and Social Impacts ofEnvironmental ProgramsPaul J. Ferraro and Merlin M. Hanauer � � � � � � � � � � � � � � � � � � � � � � � � � � � � � � � � � � � � � � � � � � � � � � � � � � 495
Concepts and Methodologies for Measuring the Sustainability of CitiesMarıa Yetano Roche, Stefan Lechtenbohmer, Manfred Fischedick,
Marie-Christine Grone, Chun Xia, and Carmen Dienst � � � � � � � � � � � � � � � � � � � � � � � � � � � � � � 519
Measuring the Co-Benefits of Climate Change MitigationDiana Urge-Vorsatz, Sergio Tirado Herrero, Navroz K. Dubash,
and Franck Lecocq � � � � � � � � � � � � � � � � � � � � � � � � � � � � � � � � � � � � � � � � � � � � � � � � � � � � � � � � � � � � � � � � � � � � � � � � 549
Networks and the Challenge of Sustainable DevelopmentAdam Douglas Henry and Bjorn Vollan � � � � � � � � � � � � � � � � � � � � � � � � � � � � � � � � � � � � � � � � � � � � � � � � � � � 583
Water Security and Society: Risks, Metrics, and PathwaysDustin Garrick and Jim W. Hall � � � � � � � � � � � � � � � � � � � � � � � � � � � � � � � � � � � � � � � � � � � � � � � � � � � � � � � � � � 611
Contents ix
Ann
u. R
ev. E
nvir
on. R
esou
rc. 2
014.
39:1
61-1
88. D
ownl
oade
d fr
om w
ww
.ann
ualr
evie
ws.
org
Acc
ess
prov
ided
by
Vir
gini
a C
omm
onw
ealth
Uni
vers
ity o
n 06
/25/
15. F
or p
erso
nal u
se o
nly.
EG39-FrontMatter ARI 8 October 2014 23:26
Citizen Science: A Tool for Integrating Studies of Human and NaturalSystemsRhiannon Crain, Caren Cooper, and Janis L. Dickinson � � � � � � � � � � � � � � � � � � � � � � � � � � � � � � � � � 641
IndexesCumulative Index of Contributing Authors, Volumes 30–39 � � � � � � � � � � � � � � � � � � � � � � � � � � � 667
Cumulative Index of Article Titles, Volumes 30–39 � � � � � � � � � � � � � � � � � � � � � � � � � � � � � � � � � � � � � 672
Errata
An online log of corrections to Annual Review of Environment and Resources articles maybe found at http://www.annualreviews.org/errata/environ
x Contents
Ann
u. R
ev. E
nvir
on. R
esou
rc. 2
014.
39:1
61-1
88. D
ownl
oade
d fr
om w
ww
.ann
ualr
evie
ws.
org
Acc
ess
prov
ided
by
Vir
gini
a C
omm
onw
ealth
Uni
vers
ity o
n 06
/25/
15. F
or p
erso
nal u
se o
nly.