lifemode group: upscale avenues 2a urban...
TRANSCRIPT
TAPESTRYSEGMENTATION
TM
esri.com/tapestry
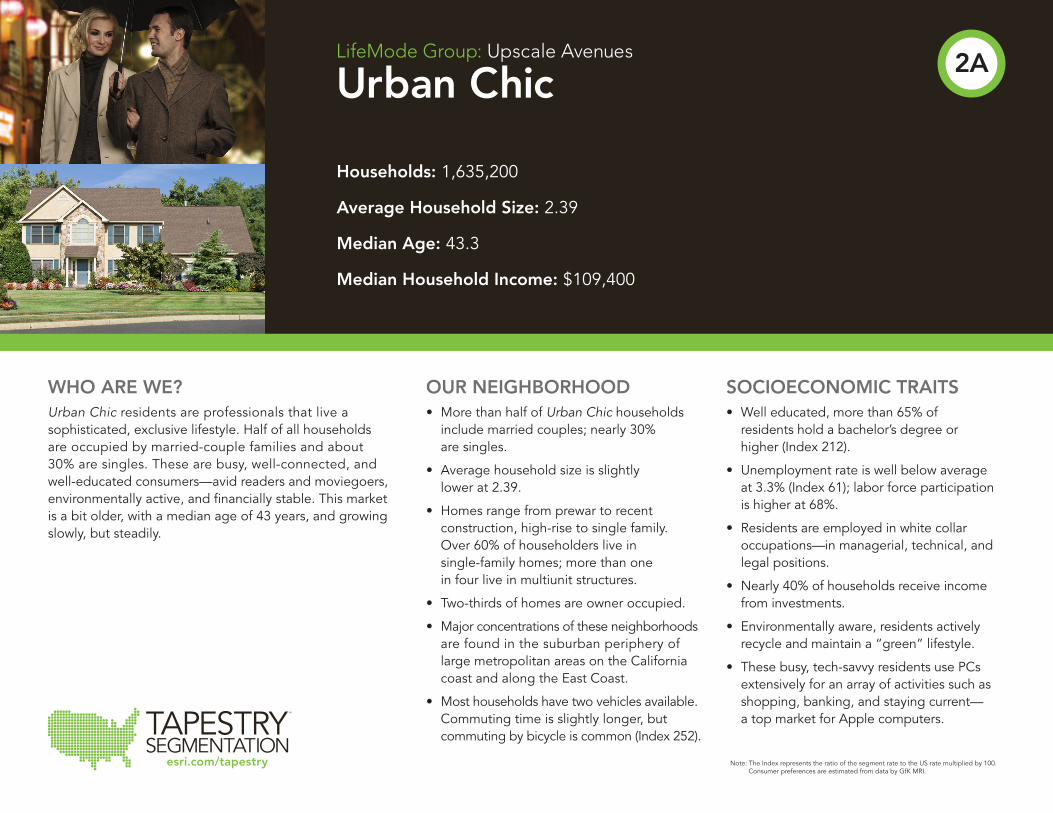
Households: 1,635,200
Average Household Size: 2.39
Median Age: 43.3
Median Household Income: $109,400
LifeMode Group: Upscale Avenues
Urban Chic
WHO ARE WE?Urban Chic residents are professionals that live a sophisticated, exclusive lifestyle. Half of all households are occupied by married-couple families and about 30% are singles. These are busy, well-connected, and well-educated consumers—avid readers and moviegoers, environmentally active, and financially stable. This market is a bit older, with a median age of 43 years, and growing slowly, but steadily.
OUR NEIGHBORHOOD• More than half of Urban Chic households include married couples; nearly 30% are singles.
• Average household size is slightly lower at 2.39.
• Homes range from prewar to recent construction, high-rise to single family. Over 60% of householders live in single-family homes; more than one in four live in multiunit structures.
• Two-thirds of homes are owner occupied.
• Major concentrations of these neighborhoods are found in the suburban periphery of large metropolitan areas on the California coast and along the East Coast.
• Most households have two vehicles available. Commuting time is slightly longer, but commuting by bicycle is common (Index 252).
SOCIOECONOMIC TRAITS• Well educated, more than 65% of residents hold a bachelor’s degree or higher (Index 212).
• Unemployment rate is well below average at 3.3% (Index 61); labor force participation is higher at 68%.
• Residents are employed in white collar occupations—in managerial, technical, and legal positions.
• Nearly 40% of households receive income from investments.
• Environmentally aware, residents actively recycle and maintain a “green” lifestyle.
• These busy, tech-savvy residents use PCs extensively for an array of activities such as shopping, banking, and staying current— a top market for Apple computers.
Note: The Index represents the ratio of the segment rate to the US rate multiplied by 100. Consumer preferences are estimated from data by GfK MRI.
2A
85+80–8475–7970–7465–6960–6455–5950–5445–4940–4435–3930–3425–2920–2415–1910–14
5–9<5
8% 4% 0 4% 8%
Male Female
Median Household Income
Median Net Worth
$56,100
$93,300
$109,400
$303,000
$0 $100,000 $200,000 $300,000 $400,000 $500,000 $600,000
EsriMedianHHIncome
EsriMedianNetWorth
Series2 Series1
$56,100
$93,300
$109,400
$303,000
$0 $100,000 $200,000 $300,000 $400,000 $500,000 $600,000
EsriMedianHHIncome
EsriMedianNetWorth
Series2 Series1
Housing
Food
Apparel & Services
Transportation
Health Care
Entertainment & Recreation
Education
Pensions & Social Security
Other
!"!# $!"%# $&"!# $&"%#$'"!# $'"%# $("!# $("%# $)"!# $)"%# $
!"#$%&'$%()*
!"#$%&'$%+),
!"#$%&'$%-()-*
!"#$%&'$%-+)-, $
!"#$%&'$%.().*
!"#$%&'$%.+)., $
!"#$%&'$%/()/*$
!"#$%&'$%/+)/, $
!"#$%&'$%*()**$
!"#$%&'$%*+)*, $
!"#$%&'$%+()+*$
!"#$%&'$%++)+, $
!"#$%&'$%0()0*$
!"#$%&'$%0+)0, $
!"#$%&'$%1()1*$
!"#$%&'$%1+)1, $
!"#$%&'$%2()2*$
!"#$%&'$%2+3
&'$%45%6$7%) !"#$
6$89$:. 6$89$:-
0.0% 0.5% 1.0% 1.5% 2.0% 2.5% 3.0% 3.5% 4.0% 4.5%
FemaleAge0-4
FemaleAge5-9
FemaleAge10-14
FemaleAge15-19
FemaleAge20-24
FemaleAge25-29
FemaleAge30-34
FemaleAge35-39
FemaleAge40-44
FemaleAge45-49
FemaleAge50-54
FemaleAge55-59
FemaleAge60-64
FemaleAge65-69
FemaleAge70-74
FemaleAge75-79
FemaleAge80-84
FemaleAge85+
ChartTitle
Series2 Series1
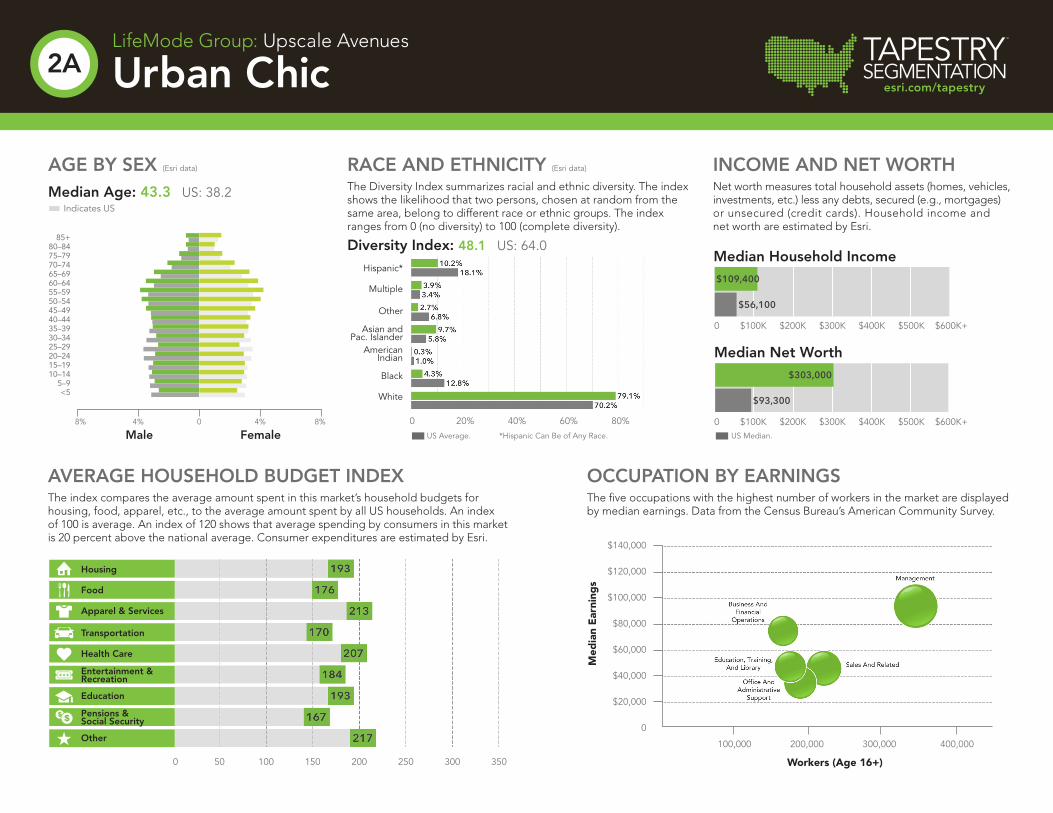
INCOME AND NET WORTHNet worth measures total household assets (homes, vehicles, investments, etc.) less any debts, secured (e.g., mortgages) or unsecured (credit cards). Household income and net worth are estimated by Esri.
OCCUPATION BY EARNINGSThe five occupations with the highest number of workers in the market are displayed by median earnings. Data from the Census Bureau’s American Community Survey.
AVERAGE HOUSEHOLD BUDGET INDEXThe index compares the average amount spent in this market’s household budgets for housing, food, apparel, etc., to the average amount spent by all US households. An index of 100 is average. An index of 120 shows that average spending by consumers in this market is 20 percent above the national average. Consumer expenditures are estimated by Esri.
AGE BY SEX (Esri data)
Median Age: 43.3 US: 38.2 Indicates US
RACE AND ETHNICITY (Esri data)
The Diversity Index summarizes racial and ethnic diversity. The index shows the likelihood that two persons, chosen at random from the same area, belong to different race or ethnic groups. The index ranges from 0 (no diversity) to 100 (complete diversity).
Diversity Index: 48.1 US: 64.0
Hispanic*
Multiple
Other
Asian and Pac. Islander
American Indian
Black
White
$140,000
$120,000
$100,000
$80,000
$60,000
$40,000
$20,000
0
100,000 20 200,000 40 300,000 60 400,000 0
*Hispanic Can Be of Any Race.
0 20% 40% 60% 80%
0 50 100 150 200 250 300 350
0 $100K $200K $300K $400K $500K $600K+
0 $100K $200K $300K $400K $500K $600K+US Average. US Median.
Med
ian
Ear
ning
s
Workers (Age 16+)
TAPESTRYSEGMENTATION
TM
esri.com/tapestry
LifeMode Group: Upscale Avenues
Urban Chic2A
Own66.2%
Rent33.8%
ChartTitle
Own Rent
HomeOwnershipUS Percentage:
62.7% Own 37.3% Rent
Population
Population Growth (Annual %)
Population Density (Persons per sq. mile)
350
350
350
0
0
0
900,000
-0.5%
0
11,000,000
3.0%
25,000
3,992,500
0.9%
514
1000
Wealth Index
Socioeconomic Status Index
Housing Affordability Index
192
170
84
TAPESTRYSEGMENTATION
TM
esri.com/tapestry
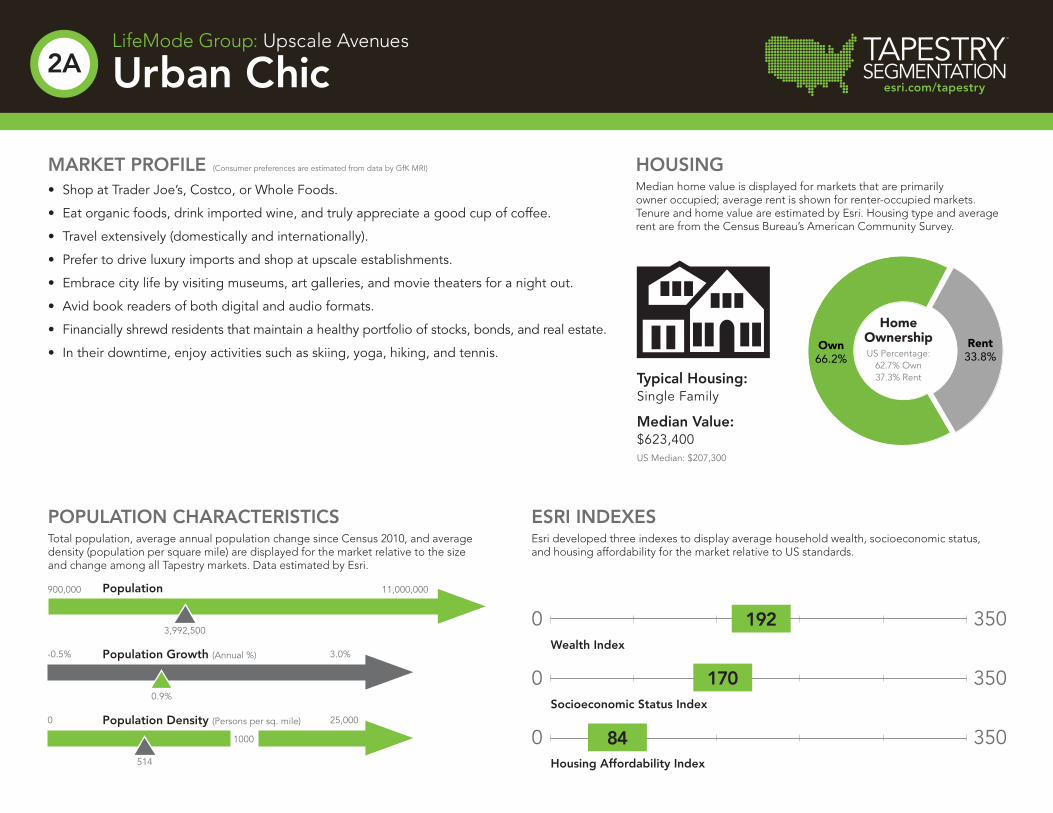
MARKET PROFILE (Consumer preferences are estimated from data by GfK MRI)
• Shop at Trader Joe’s, Costco, or Whole Foods.
• Eat organic foods, drink imported wine, and truly appreciate a good cup of coffee.
• Travel extensively (domestically and internationally).
• Prefer to drive luxury imports and shop at upscale establishments.
• Embrace city life by visiting museums, art galleries, and movie theaters for a night out.
• Avid book readers of both digital and audio formats.
• Financially shrewd residents that maintain a healthy portfolio of stocks, bonds, and real estate.
• In their downtime, enjoy activities such as skiing, yoga, hiking, and tennis.
ESRI INDEXESEsri developed three indexes to display average household wealth, socioeconomic status, and housing affordability for the market relative to US standards.
POPULATION CHARACTERISTICSTotal population, average annual population change since Census 2010, and average density (population per square mile) are displayed for the market relative to the size and change among all Tapestry markets. Data estimated by Esri.
LifeMode Group: Upscale Avenues
Urban Chic2A
HOUSINGMedian home value is displayed for markets that are primarily owner occupied; average rent is shown for renter-occupied markets. Tenure and home value are estimated by Esri. Housing type and average rent are from the Census Bureau’s American Community Survey.
Typical Housing:Single Family
Median Value:$623,400US Median: $207,300
High
Low
TAPESTRYSEGMENTATION
TM
esri.com/tapestry
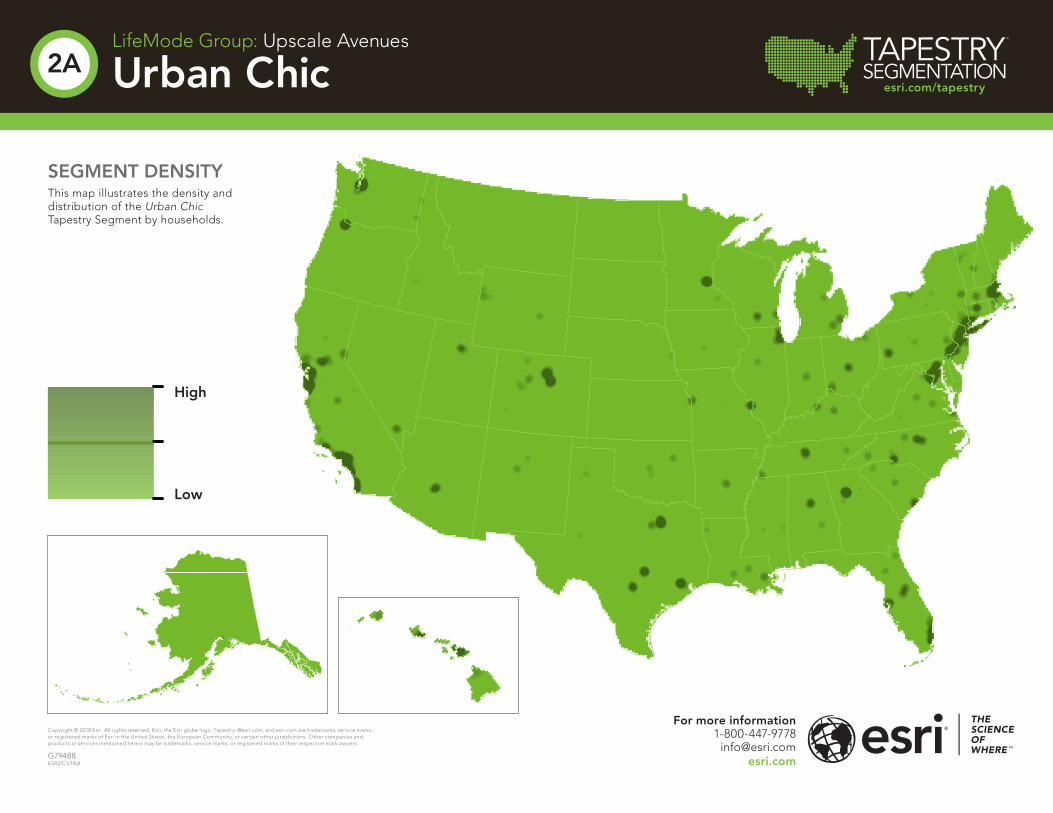
SEGMENT DENSITYThis map illustrates the density and distribution of the Urban Chic Tapestry Segment by households.
LifeMode Group: Upscale Avenues
Urban Chic2A
For more information1-800-447-9778
Copyright © 2018 Esri. All rights reserved. Esri, the Esri globe logo, Tapestry, @esri.com, and esri.com are trademarks, service marks, or registered marks of Esri in the United States, the European Community, or certain other jurisdictions. Other companies and products or services mentioned herein may be trademarks, service marks, or registered marks of their respective mark owners.
G79488ESRI2C1/18dl